UNITED STATES
SECURITIES AND EXCHANGE COMMISSION
Washington, D.C. 20549
FORM 10-K
ANNUAL REPORT PURSUANT TO SECTION 13 OR 15(d) OF THE SECURITIES EXCHANGE ACT OF 1934 | ||
For the Fiscal Year Ended September 30, 2019
or
TRANSITION REPORT PURSUANT TO SECTION 13 OR 15(d) OF THE SECURITIES EXCHANGE ACT OF 1934 | ||
For the transition period from to
Commission File No. 0-19424

(State or other jurisdiction of incorporation or organization) | (I.R.S. Employer Identification No.) | ||||
(Address of principal executive offices) | (Zip Code) | ||||
Registrant’s telephone number, including area code: (512 ) 314-3400
Securities Registered Pursuant to Section 12(b) of the Act:
Securities Registered Pursuant to Section 12(g) of the Act: None
Title of Each Class | Trading Symbol(s) | Name of Each Exchange on Which Registered | ||
(NASDAQ Global Select Market) | ||||
Indicate by check mark if the registrant is a well-known seasoned issuer, as defined in Rule 405 of the Securities Act. Yes ☐ No ☑
Indicate by check mark if the registrant is not required to file reports pursuant to Section 13 or Section 15(d) of the Act. Yes ☐ No ☑
Indicate by check mark whether the registrant (1) has filed all reports required to be filed by Section 13 or 15(d) of the Securities Exchange Act of 1934 during the preceding 12 months (or for such shorter period that the registrant was required to file such reports), and (2) has been subject to such filing requirements for the past 90 days. Yes ☑ No ☐
Indicate by check mark whether the registrant has submitted electronically every Interactive Data File required to be submitted pursuant to Rule 405 of Regulation S-T (§ 232.405 of this chapter) during the preceding 12 months (or for such shorter period that the registrant was required to submit such files). Yes ☑ No ☐
Indicate by check mark whether the registrant is a large accelerated filer, an accelerated filer, a non-accelerated filer, or a smaller reporting company. See definition of “large accelerated filer,” “accelerated filer,” “smaller reporting company” and “emerging growth company” in Rule 12b-2 of the Exchange Act.
Large accelerated filer | ☐ | ☑ | |
Non-accelerated filer | ☐ | Smaller reporting company | |
Emerging growth company | |||
If an emerging growth company, indicate by check mark if the registrant has elected not to use the extended transition period for complying with any new or revised financial accounting standards provided pursuant to Section 13(a) of the Exchange Act. ☐
Indicate by check mark whether the registrant is a shell company (as defined in Rule 12b-2 of the Exchange Act). Yes ☐ No ☑
The only class of voting securities of the registrant issued and outstanding is the Class B Voting Common Stock, par value $.01 per share, all of which is owned by a single stockholder. There is no trading market for the Class B Voting Common Stock. The aggregate market value of the Class A Non-Voting Common Stock held by non-affiliates of the registrant was $472 million, based on the closing price on the NASDAQ Stock Market on March 31, 2019.
As of November 25, 2019, 52,565,064 shares of the registrant’s Class A Non-Voting Common Stock, par value $.01 per share, and 2,970,171 shares of the registrant’s Class B Voting Common Stock, par value $.01 per share, were outstanding.
Documents incorporated by reference: None
EZCORP, INC.
YEAR ENDED SEPTEMBER 30, 2019
INDEX TO FORM 10-K
Item | Page |
No. | No. |
PART I
This report contains forward-looking statements that reflect our future plans, estimates, beliefs and expected performance. Our actual results may differ materially from those currently anticipated and expressed or implied by those forward-looking statements because of a number of risks and uncertainties, including those discussed under “Part I, Item 1A — Risk Factors.” We caution that assumptions, expectations, projections, intentions or beliefs about future events may, and often do, vary from actual results, and the differences can be material. See also “Part II, Item 7 — Management's Discussion and Analysis of Financial Condition and Results of Operations — Cautionary Statement Regarding Risks and Uncertainties That May Affect Future Results.”
Unless otherwise specified, references to the “company,” “we,” “our,” “us” and “EZCORP” refer to EZCORP, Inc. and its consolidated subsidiaries, collectively. References to a “fiscal” year refer to our fiscal year ended September 30 of the specified year. For example, “fiscal 2019” refers to the fiscal year ended September 30, 2019. All currency amounts preceded with “$” are stated in U.S. dollars, except as otherwise indicated.
ITEM 1 — BUSINESS
Overview
EZCORP, Inc. is a Delaware corporation headquartered in Austin, Texas. We are a leading provider of pawn loans in the United States and Latin America with approximately 6,800 team members.
Our vision is to be the market leader in responsibly and respectfully meeting our customers’ desire for access to cash when they want it. That vision is supported by four key imperatives:
• | Market Leading Customer Satisfaction; |
• | Exceptional Staff Engagement; |
• | Most Efficient Provider of Cash; and |
• | Attractive Shareholder Returns. |
As of September 30, 2019, we operated a total of 1,014 locations, consisting of:
• | 512 United States pawn stores (operating primarily as EZPAWN or Value Pawn & Jewelry); |
• | 357 Mexico pawn stores (operating primarily as Empeño Fácil); |
• | 123 pawn stores in Guatemala, El Salvador, Honduras and Peru (operating as GuatePrenda and MaxiEfectivo); and |
• | 22 financial services stores in Canada (operating as CASHMAX). |
At our pawn stores, we offer pawn loans, which are non-recourse loans collateralized by tangible personal property, and sell merchandise to customers looking for good value. The merchandise we sell consists of second-hand collateral forfeited from our pawn lending activities or purchased from customers. By store count, we are the second largest pawn store owner and operator in the U.S. and one of the largest in Latin America. During fiscal 2019, we opened 22 de novo stores in Latin America, acquired twelve pawn stores in Mexico and Nevada and completed rollout of our POS2 system across all stores in the U.S. and Mexico through October 2019. We began development of a mobile application providing banking and pawn related services on a differentiated digital customer-centric engagement platform (“Lana,” previously described as “Evergreen”). We believe this platform will allow us to leverage our existing store and pawn customer base footprint to expand customer acquisition and retention and enable rapid deployment of new products.
In addition to our core pawn business in the U.S. and Latin America, we operate CASHMAX financial services locations in Canada. We also own 34.75% of Cash Converters International Limited (“Cash Converters International”), a publicly traded company (ASX: CCV) headquartered in Perth, Western Australia. Cash Converters International and its controlled companies comprise a diverse group generating revenues from franchising, store operations, personal finance and vehicle finance, with operations in Australia and the United Kingdom, a 25% equity interest in Cash Converters New Zealand and a franchise presence in a 15 other countries around the world.
3
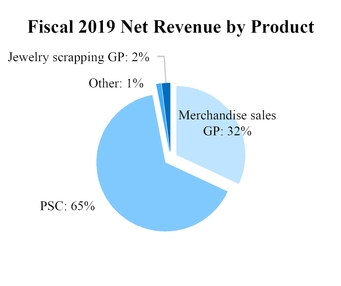
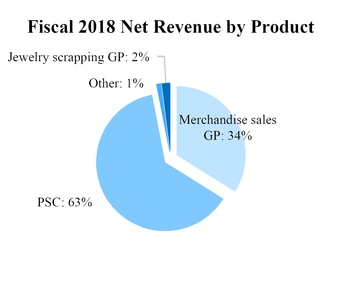
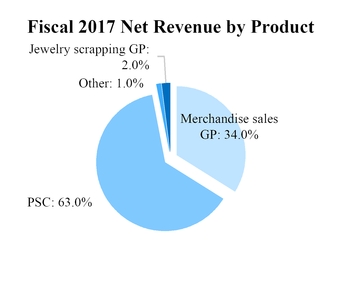
We remain focused on growing our balance of pawn loans outstanding (“PLO”) and the resulting higher pawn service charges (“PSC”). The following charts present sources of net revenues, including PSC, merchandise sales gross profit (“Merchandise sales GP”) and jewelry scrapping gross profit (“Jewelry scrapping GP”):
4
Segment and Geographic Information
Our business consists of the following three reportable segments:
• | “U.S. Pawn” — Includes our EZPAWN, Value Pawn & Jewelry and other branded pawn operations in the United States; |
• | “Latin America Pawn” — Includes our Empeño Fácil and other branded pawn operations in Mexico, as well as our GuatePrenda and MaxiEfectivo pawn operations in Guatemala, El Salvador, Honduras and Peru; and |
• | “Other International” — Includes primarily our CASHMAX financial services operations in Canada and our equity interest in the net income of Cash Converters International. |
The following table presents store data by segments included in our continuing operations:
U.S. Pawn | Latin America Pawn | Other International | Consolidated | ||||||||
As of September 30, 2016 | 520 | 239 | 27 | 786 | |||||||
New locations opened | — | 10 | — | 10 | |||||||
Locations acquired | 2 | — | — | 2 | |||||||
Locations sold, combined or closed | (9 | ) | (3 | ) | — | (12 | ) | ||||
As of September 30, 2017 | 513 | 246 | 27 | 786 | |||||||
New locations opened | — | 12 | — | 12 | |||||||
Locations acquired | — | 196 | — | 196 | |||||||
Locations sold, combined or closed | (5 | ) | (1 | ) | — | (6 | ) | ||||
As of September 30, 2018 | 508 | 453 | 27 | 988 | |||||||
New locations opened | — | 22 | — | 22 | |||||||
Locations acquired | 7 | 5 | — | 12 | |||||||
Locations sold, combined or closed | (3 | ) | — | (5 | ) | (8 | ) | ||||
As of September 30, 2019 | 512 | 480 | 22 | 1,014 | |||||||
For additional information about our segments and geographic areas, see Note 15 of Notes to Consolidated Financial Statements included in “Part II, Item 8 — Financial Statements and Supplementary Data.”
Pawn Activities
At our pawn stores, we offer pawn loans, which are typically small, non-recourse loans collateralized by tangible personal property. As of September 30, 2019, we had a closing pawn loan principal balance of $199.1 million, from which we earn pawn service charges. In fiscal 2019, pawn service charges accounted for approximately 39% of our total revenues and 65% of our net revenues.
While allowable pawn service charges vary by state and loan size, our U.S. pawn loans primarily earn 13% to 25% per month as permitted by applicable law, excluding forfeitures. The total U.S. pawn loan term generally ranges between 30 and 90 days. Individual loans vary depending on the valuation of each item pawned, but our U.S. pawn loans typically average between $100 and $120.
In Mexico, pawn loans earn 15% to 21% per month as permitted by applicable law, excluding forfeitures. The Mexico pawn loan primary term is 30 days. Individual loans are made in Mexican pesos and vary depending on the valuation of each item pawned, but our Mexico pawn loans typically average between 1,100 and 1,300 Mexican pesos, or approximately $60 on average using the average exchange rate for fiscal 2019.
In Guatemala, El Salvador, Honduras and Peru, pawn loans earn 12% to 18% per month as permitted by applicable law, excluding forfeitures. The pawn loan primary term in these countries is 30 days. Individual loans are made in the local currency of the country and vary depending on the valuation of each item pawned, but our pawn loans in these countries typically average between $100 and $120 using the average exchange rates for fiscal 2019. The average loan amounts tend to be higher in these countries than in Mexico due to the higher concentration of jewelry loans in these countries.
5
Collateral for our pawn loans consists of tangible personal property, generally jewelry, consumer electronics, power tools, sporting goods and musical instruments. We generally lend from 40% to 70% of the collateral’s estimated resale value depending on a subjective evaluation of a variety of factors, including the estimated probability of the loan’s redemption, and we may additionally offer to purchase the product outright. We consider general merchandise more susceptible to obsolescence while jewelry generally retains commodity value.
If a customer chooses not to repay, renew or extend a pawn loan, the collateral is forfeited and becomes inventory available for sale. We do not record loan losses or charge-offs of pawn loans because the principal amount of an unpaid loan becomes the inventory carrying cost of the forfeited collateral. If the subsequent sale of the forfeited collateral is less than the loan value, this is reflected in gross margin.
The redemption rate represents the percentage of loans made that are repaid, renewed or extended, including loans that may extend multiple times in a given time period. The following table presents our pawn loan redemption rates by segment:
Fiscal Year Ended September 30, | |||||||||
Redemption Rate | 2019 | 2018 | 2017 | ||||||
U.S. Pawn | 84 | % | 84 | % | 84 | % | |||
Empeño Fácil | 78 | % | 79 | % | 78 | % | |||
Our ability to offer quality second-hand goods at prices significantly lower than original retail prices attracts value-conscious customers. The gross profit on sales of inventory depends primarily on our assessment of the loan or purchase value at the time the property is either accepted as loan collateral or purchased. As our inventory and sales involve gold and jewelry, our results can be heavily influenced by the market price of gold.
Customers in the United States and the majority of our Latin America stores may purchase a product protection plan that allows them to exchange certain general merchandise (non-jewelry) sold through our retail pawn operations within six months of purchase. We also offer a jewelry VIP package, which guarantees customers a minimum future pawn loan amount on the item sold, allows them full credit if they trade in the item to purchase a more expensive piece of jewelry, and provides minor repair service on the item sold. Customers may also purchase an item on layaway by paying a minimum layaway deposit of typically 10% of the item’s sale price, in addition to an upfront fee. We hold items on layaway for a 90 to 180-day period, during which the customer is required to pay the balance of the sales price through a series of installment payments. If a payment is missed, we hold the item for a maximum of 30 days, after which it is returned to active inventory for sale.
CASHMAX Financial Services
We operate 22 financial services stores in Canada under the CASHMAX brand. All of the stores are located in the Ontario province, in and around Toronto. These small footprint locations have historically offered primarily short-term, single-payment loans with due dates corresponding to the customer’s next payday (known as “payday loans”). In response to regulatory changes effective January 1, 2018, which reduced the economic returns of the payday lending model, we introduced installment loan products to meet the broader needs of our customers. In addition to payday loans, all CASHMAX stores are now offering installment loans with terms ranging from six to 18 months and average yields of 47% per annum. In November 2018, we entered into a financing arrangement with a third-party lender to provide up to CAD $25 million to fund originations of installment loans through November 2019. As of September 30, 2019, our obligation under the financing facility was CAD $0.8 million (USD $0.6 million).
Operations
Our pawn operations are designed to provide the optimum level of support to the store teams, supplying coaching, mentoring and problem solving to identify opportunities to better serve our customers and position us to be the leader in customer service and satisfaction.
Our risk management structure consists of asset protection and compliance departments, which monitor the inventory system, lending practices, regulatory compliance and compliance with our policies and procedures. We perform full physical audits of inventory at each store at least annually, and more often in higher risk stores or those recently experiencing higher shrinkage. Inventory counts are completed daily for jewelry and firearms, and other inventory categories more susceptible to theft are cycle counted multiple times annually. We record shrink adjustments for known losses at the conclusion of each inventory count; as estimates during interim periods and as discovered during cycle counts.
Our success is dependent upon our team members’ ability to provide prompt and courteous customer service and to execute our operating procedures and standards. To achieve our long-range people goals, we offer management and technical skills training
6
utilizing computer-based training modules that can be accessed at the store and district levels. It is mandatory that all field and corporate team members complete specific compliance training annually. We offer formalized management development training to specific executives to enhance their management capabilities and effectiveness and to enhance their career progression. We maintain field trainers who travel to stores to provide hands-on training in high skill areas, such as jewelry evaluation, firearms handling and information technology. Generally, we expect that store team members, including managers, will meet certain competency criteria prior to hire or promotion and participate in on-going training classes and formal instructional programs. Our store level and management training programs are designed to develop and advance our team members and provides training for the efficient integration of experienced managers and team members from outside the company.
Growth and Expansion
We plan to expand the number of locations we operate through opening new (“de novo”) locations and through acquisitions in both Latin America and the United States and potential new markets. Our ability to add new stores is dependent on several variables, such as projected achievement of internal investment hurdles, the availability of acceptable sites or acquisition candidates, the alignment of acquirer/seller price expectations, the regulatory environment, local zoning ordinances, access to capital and availability of qualified personnel.
During fiscal 2019, we grew our store count and began development of new products as follows:
• | We opened 22 de novo stores in Latin America (12 in Mexico, 6 in Guatemala, 3 in Honduras and 1 in Peru). |
• | In December 2018, we acquired five pawn stores in Mexico. |
• | In June 2019, we acquired seven pawn stores operating under the name "Metro Pawn" in Nevada, entering the Reno market and expanding our presence in the Las Vegas metropolitan area. |
• | We began development of a mobile application providing banking and pawn related services on a differentiated digital customer-centric engagement platform (“Lana”). This platform will allow us to leverage our existing store and pawn customer base footprint to expand customer acquisition and retention and enable rapid deployment of new products. |
• | In October 2019, we completed rollout of our POS2 system (upgraded point of sale system which will allow us to make better pricing decisions and drive higher returns on earning assets) across all stores in the U.S. and Mexico. |
We now own a total of 480 stores in Latin America, representing 48% of our total pawn stores. In fiscal 2019, these stores represented 21% of our consolidated net revenues as the average scale of Latin America pawn stores is smaller than in the United States. We see opportunity for further expansion in Latin America through both acquisitions and de novo openings.
For further information about our acquisitions, see Note 2 of Notes to Consolidated Financial Statements included in “Part II, Item 8 — Financial Statements and Supplementary Data.”
Seasonality and Quarterly Results
Historically, pawn service charges are highest in our fourth fiscal quarter (July through September) due to a higher average loan balance during the summer lending season in the United States and lowest in our third fiscal quarter (April through June) following the tax refund season in the United States. Merchandise sales are highest in our first and second fiscal quarters (October through March) due to the holiday season, jewelry sales in the United States surrounding Valentine’s Day and the availability of tax refunds in the United States. Most of our Latin America customers receive additional compensation from their employers in December, and many also receive additional compensation in June or July, applying downward pressure on loan balances and fueling some merchandise sales in those periods. As a net effect of these and other factors and excluding discrete charges, our consolidated profit before tax is generally highest in our first fiscal quarter (October through December) and lowest in our third fiscal quarter (April through June).
Competition
We encounter significant competition in connection with all of our activities. These competitive conditions may have an impact on our revenues, profitability and ability to expand. We compete with other pawn stores, credit service organizations, banks, credit unions and other financial institutions, such as consumer finance companies. We believe that the primary elements of competition are the quality of customer service and relationship management, including understanding our customers’ needs better than anyone else, convenience, store location and a customer friendly environment. In addition, we believe the ability to compete effectively will be based increasingly on strong general management, regional focus, automated management information systems, access to capital and superior customer service.
7
Our competitors for merchandise sales include numerous retail and wholesale stores such as jewelry stores, discount retail stores, consumer electronics stores, other pawn stores, other resale stores, electronic commerce retailers and auction sites. Competitive factors in our retail operations include the ability to provide the customer with a variety of merchandise at an exceptional value coupled with exceptional customer service and convenient locations.
The pawn industry in the United States is large and highly fragmented. The industry consists of pawn stores owned primarily by independent operators who own one to three locations, and the industry is relatively mature. We are the second largest operator of pawn stores in the United States.
The pawn industry in Latin America is also fragmented, but less so than in the United States. The industry consists of pawn stores owned by independent operators and chains, including some not-for-profit organizations. We are the second largest for-profit operator in Mexico. The pawn industry, particularly full-line stores offering general merchandise and jewelry loans and resale, remains in an expansion stage in Latin America.
Trademarks and Trade Names
We operate our U.S. pawn stores principally under the names “EZPAWN” or “Value Pawn & Jewelry,” our Mexico pawn stores principally under the name “EMPEÑO FÁCIL,” our Guatemala pawn stores under the name “GuatePrenda,” and our El Salvador, Honduras and Peru pawn stores under the name “MaxiEfectivo.” Our financial services stores in Canada operate under the name “CASHMAX.” We have registered with the United States Patent and Trademark Office the names EZPAWN and EZCORP, among others. In Mexico, we have registered with the Instituto Mexicano de la Propiedad Industrial the names “EMPEÑO FÁCIL,” “Bazareño,” “Presta Dinero” and “Montepio San Patricio.” We have registered the name “GuatePrenda” in Guatemala and the name “MaxiEfectivo” in Guatemala, El Salvador, Honduras and Peru.
Regulation
Compliance with federal, state and local laws and regulations is an integral part of how we manage our business, and we conduct our business in material compliance with all of these rules. The following is a general description of significant regulations affecting our business. For a geographic breakdown of our operating locations, see “Part I, Item 2 — Properties.”
U.S. Regulations
Pawn Regulations — Our pawn stores are regulated by the states in which they are located and, in some cases, by individual municipalities or other local authorities. The applicable statutes, ordinances and regulations vary from location to location and typically impose licensing requirements for pawn stores or individual pawn store team members. Licensing requirements typically relate to financial responsibility and character and may establish restrictions on where pawn stores can operate. Additional rules regulate various aspects of the day-to-day pawn operations including the pawn service charges that a pawn store may charge, the maximum amount of a pawn loan, the minimum or maximum term of a pawn loan, the content and format of the pawn ticket, and the length of time after a loan default that a pawn store must hold a pawned item before it can be offered for sale. Failure to observe applicable regulations could result in a revocation or suspension of pawn licenses, the imposition of fines or requirements to refund service charges and fees, and other civil or criminal penalties. We must also comply with various federal requirements regarding the disclosure of the annual percentage rate, finance charge, amount financed, total of payments and payment schedule related to each pawn loan transaction. Additional federal regulations applicable to our pawn lending business are described in “Other Regulations” below.
The majority of our pawn stores, voluntarily or pursuant to applicable laws, provide periodic (generally daily) reports to local law enforcement agencies. These reports provide local law enforcement with information about the items received from customers (whether through pawn or purchase), including a detailed description of the goods involved and the name and address of the customer. If we accept as collateral or purchase merchandise from a customer and it is determined that our customer was not the rightful owner, the merchandise is subject to recovery by the rightful owner and those losses are included in our shrinkage. Historically, we have not experienced a material number of claims of this nature.
Some of our pawn stores in the U.S. handle firearms and each of those stores maintains a federal firearms license as required by federal law. The federal Gun Control Act of 1968 and regulations issued by the Bureau of Alcohol, Tobacco, and Firearms also require each pawn store dealing in firearms to maintain a permanent written record of all receipts and dispositions of firearms. In addition, we must comply with the Brady Handgun Violence Prevention Act, which requires us to conduct a background check before releasing, selling or otherwise disposing of firearms.
8
Other Regulations — Our pawn lending activities are subject to other state and federal statutes and regulations, including the following:
• | We are subject to the federal Gramm-Leach-Bliley Act and its underlying regulations, as well as various state laws and regulations relating to privacy and data security. Under these regulations, we are required to disclose to our customers our policies and practices relating to the protection and sharing of customers’ nonpublic personal information. These regulations also require us to ensure that our systems are designed to protect the confidentiality of customers’ nonpublic personal information, and many of these regulations dictate certain actions that we must take to notify customers if their personal information is disclosed in an unauthorized manner. We are subject to the Fair Credit Reporting Act which was enacted, in part, to address privacy concerns associated with the sharing of consumers’ financial information and credit history contained in consumer credit reports and limits our ability to share certain consumer report information. We are subject to the Federal Fair and Accurate Credit Transactions Act, which amended the Fair Credit Reporting Act, and requires us to adopt written guidance and procedures for detecting, preventing and mitigating identity theft, and to adopt various policies and procedures (including team member training) that address and aid in detecting and responding to suspicious activity or identify theft “red flags.” |
• | Under the USA PATRIOT Act, we must maintain an anti-money laundering compliance program that includes the development of internal policies, procedures and controls; the designation of a compliance officer; an ongoing team member training program; and an independent audit function to test the program. |
• | We are subject to the Bank Secrecy Act and its underlying regulations, which require us to report and maintain records of certain high-dollar transactions. In addition, federal laws and regulations prohibit us from doing business with terrorists and require us to report certain suspicious transactions to the Financial Crimes Enforcement Network of the Treasury Department (“FinCen”). Generally, a transaction is considered to be suspicious if we know, suspect or have reason to suspect that the transaction (a) involves funds derived from illegal activity or is intended to hide or disguise such funds, (b) is designed to evade the requirements of the Bank Secrecy Act or (c) appears to serve no legitimate business or lawful purpose. |
• | The Foreign Corrupt Practices Act ("FCPA") was enacted for the purpose of making it unlawful for certain classes of persons and entities to make payments to foreign government officials to assist in obtaining or retaining business. Specifically, the anti-bribery provisions of the FCPA prohibit the willful use of mail or any means of instrumentality of interstate commerce corruptly in furtherance of any offer, payment, promise to pay, or authorization of the payment of money or anything of value to any person, while knowing that all or a portion of such money or thing of value will be offered, given or promised, directly or indirectly, to a foreign official to influence the foreign official in his or her official capacity, induce the foreign official to do or omit to do an act in violation of his or her lawful duty, or to secure any improper advantage in order to assist in obtaining or retaining business for or with, or directing business to, any person. |
• | Effective October 2016, Department of Defense regulations promulgated under the Military Lending Act (the “MLA”), formerly applicable to payday loans and auto title loans, were expanded to include various additional forms of consumer credit, including pawn loans. The MLA regulations limit the annual percentage rate charged on consumer loans made to active military personnel or their dependents to 36%. |
Under certain circumstances, the federal Consumer Financial Protection Bureau (“CFPB”) may be able to exercise regulatory authority over the U.S. pawn industry through its rule making authority. To date, the CFPB has not taken any steps to exercise such authority or indicated any intention to do so.
Mexico Regulations
Pawn Regulations — Federal law in Mexico provides for administrative regulation of the pawnshop industry by Procuraduría Federal del Consumidor (PROFECO), Mexico’s primary federal consumer protection agency. PROFECO regulates the form and terms of pawn loan contracts (but not interest or service charge rates) and defines certain operating standards and procedures for pawnshops, including retail operations, and establishes registration, disclosure, bonding and reporting requirements. There are significant fines and sanctions, including operating suspensions, for failure to comply with PROFECO’s rules and regulations.
PROFECO requires that we report certain transactions (or series of transactions) that exceed certain monetary limits. Anti-money laundering regulations restrict the use of cash in certain transactions. Relevant aspects of the law specifically affecting the pawn industry include monthly reporting on “vulnerable activities,” which includes certain high-value pawn and precious metal transactions.
9
The Federal Personal Information Protection Law requires us to protect our customers’ personal information. Specifically, the law requires us to inform customers if we share customer personal information with third parties and to post (both online and in-store) our privacy policy.
Our pawn business in Mexico is also subject to regulation at the state and local level through state laws and local zoning and permitting ordinances. For example, some states require permits for pawn stores to operate, certification of team members as trained in the valuation of merchandise, and strict customer identification controls. State and local agencies often have authority to suspend store operations pending resolution of actual or alleged regulatory, licensing and permitting issues.
Other Regulations — Our pawn business in Mexico is subject to the General Law of Administrative Responsibility (“GLAR”), effective July 2017. GLAR establishes administrative penalties for improper payments to government officials, influence peddling (including the hiring of public officials and the use of undue influence) and other corrupt acts in public procurement processes.
We are also subject to The Federal Law for the Prevention and Identification of Transactions with Funds from Illegal Sources, which requires reporting of certain transactions exceeding certain monetary limits, maintenance of customer identification records and controls, and reporting of all non-Mexican customer transactions. This law affects all industries in Mexico and is intended to detect commercial activities arising from illicit or ill-gotten means through bilateral cooperation between Mexico’s Ministry of Finance and Public Credit and Mexico’s Attorney General’s Office. The law also restricts the use of cash in certain transactions associated with high-value assets and limits, and to the extent possible, money laundering activities protected by the anonymity that such cash transactions provide. Relevant aspects of the law specifically affecting the pawn industry include monthly reporting on “vulnerable activities,” which include pawn transactions exceeding 135,606 Mexican pesos and retail transactions of precious metals exceeding 135,606 Mexican pesos. Retail transactions of precious metals exceeding 271,213 Mexican pesos are prohibited. There are significant fines and sanctions for failure to comply with these rules.
In addition to the above, our pawn business in Mexico is subject to various general business regulations in the areas of tax compliance, customs, consumer protections, money laundering, civil protection regulations, municipal regulations, trade code (federal), public safety and employment matters, among others, by various federal, state and local governmental agencies.
Other Latin American Regulations
Local governmental entities in Guatemala, El Salvador, Honduras and Peru also regulate lending and retail businesses. Certain laws and local zoning and permitting ordinances require basic commercial business licenses and signage permits. Operating in these countries also subjects us to other types of regulations, including regulations related to financial reporting, data protection and privacy, tax compliance, labor and employment practices, real estate transactions, anti-money laundering, commercial and electronic banking restrictions, credit card transactions, usury law, consumer protection, marketing, advertising and other general business activities. As the scope of our international operations increases, we may face additional administrative and regulatory costs in managing our business. In addition, unexpected changes in laws and regulations, administrative interpretations of local requirements or legislation, or public remarks by elected officials could negatively affect our operations and profitability.
Available Information
We maintain an Internet website at www.ezcorp.com. All of our reports filed with the Securities and Exchange Commission (the “SEC”), including annual reports on Form 10-K, quarterly reports on Form 10-Q, current reports on Form 8-K and Section 16 filings are accessible, free of charge, through the Investor Relations section of our website as soon as reasonably practicable after electronic filing. The SEC maintains an Internet site that contains reports, proxy and information statements and other information regarding issuers that file electronically with the SEC at www.sec.gov. Information on our website is not incorporated by reference into this report.
ITEM 1A — RISK FACTORS
There are many risks and uncertainties that may affect our operations, performance, development and results. Many of these risks are beyond our control. The following is a description of the important risk factors that may affect our business. If any of these risks were to actually occur, our business, financial condition or results of operations could be materially adversely affected. Additional risks and uncertainties not currently known to us or that we currently consider to be immaterial may also materially adversely affect our business, financial condition or results of operations.
10
We have identified a material weakness in our internal control over financial reporting that, if not effectively remediated, could result in material misstatements in our financial statements.
As described in "Part II, Item 9A — Controls and Procedures," we identified and evaluated certain deficiencies in our IT general controls in the second quarter of fiscal 2019, and have concluded that those deficiencies, collectively, represent a material weakness in our internal control over financial reporting. A material weakness is a deficiency, or a combination of deficiencies, in internal control over financial reporting, such that there is a reasonable possibility that a material misstatement of our annual or interim financial statements will not be prevented or detected on a timely basis. As a result of this material weakness, management has concluded that our disclosure controls and procedures were not effective as of September 30, 2019.
As described in "Part II, Item 9A - Controls and Procedures," management believes it is taking the appropriate steps to remediate the underlying ITGC deficiencies, including allowing the controls to operate for a time period to produce sufficient testing sample sizes. If our remediation efforts are insufficient, our consolidated financial statements may contain material misstatements and we could be required to restate our financial results, which could materially and adversely affect our business, results of operations and financial condition, restrict our ability to access the capital markets, require us to expend significant resources to correct the deficiencies, subject us to fines, penalties or judgments, harm our reputation or otherwise cause a decline in investor confidence and the market value of our publicly traded Class A Non-Voting Common Stock (“Class A Common Stock”).
Changes in, or failure to comply with, laws and regulations affecting our products and services could have a material adverse effect on our operations and financial performance.
Our products and services are subject to regulation under various laws and regulations in each country and jurisdiction in which we operate (see “Part I, Item 1 — Business — Regulation”), and adverse legislation or regulations could be adopted in any such country or jurisdiction. If such legislation or regulation is adopted in any particular jurisdiction, we generally evaluate our business in the context of the new rules and determine whether we can continue to operate in that jurisdiction with new or modified products or whether it is feasible to enhance our business with additional product offerings. In any case, if we are unable to continue to operate profitably under the new rules, we may decide to close or consolidate stores, resulting in decreased revenues, earnings and assets. Further, our failure to comply with applicable laws and regulations could result in fines, penalties or orders to cease or suspend operations, which could have a material adverse effect on our results of operations.
Negative characterizations of the pawn industry by consumer advocates, media or others could result in increased legislative or regulatory activity, could adversely affect the market value of our publicly traded stock, or could make it harder to operate our business successfully.
Many of the legislative and regulatory efforts that are adverse to the pawn industry are the result of negative characterization of the pawn industry by consumer advocacy groups, members of the media or others that focus on the cost of pawn loans or instances of pawn operators purchasing stolen property or accepting it as pawn collateral. We can give no assurance that there will not be further negative characterizations of our industry or that legislative or regulatory efforts to restrict the availability of pawn loans or otherwise regulate pawn operations will not be successful despite significant customer demand for such services. Such efforts, if successful, could have a material adverse effect on our operations or financial performance.
Furthermore, negative characterizations of our industry could limit the number of investors who are willing to hold our Class A Common Stock, which may adversely affect its market value; limit sources of the debt or equity financing that we need in order to conduct our operations and achieve our strategic growth objectives; or make it harder for us to attract, hire and retain talented executives and other key team members.
A significant portion of our U.S. business is concentrated in Texas and Florida.
As of September 30, 2019, more than 60% of our U.S. pawn stores were located in Texas (42%) and Florida (19%), and those stores account for a significant portion of our revenues and profitability. The legislative, regulatory and general business environment in Texas and Florida has been relatively favorable for our pawn business activities, but a negative legislative or regulatory change in either of those states could have a material adverse effect on our overall operations and financial performance. Further, as discussed below, areas in Texas and Florida where we have significant operations are particularly susceptible to hurricane and tropical storm activity.
11
We have significant operations in Latin America, and changes in the business, regulatory, political or social climate could impact our operations there, which could adversely affect our results of operations and growth plans.
We own and operate a significant number of pawn stores in Latin America (primarily Mexico, but also Guatemala, El Salvador, Honduras and Peru). Further, our growth plans include potential expansion in those countries as well as potentially other countries in Latin America. Doing business in those countries exposes us to risks related to political instability, corruption, economic volatility, drug cartel and gang-related violence, social unrest including riots and looting, tax and foreign investment policies, public safety and security concerns, and uncertain application of laws and regulations. Consequently, actions or events in any of those countries that are beyond our control could restrict our ability to operate there or otherwise adversely affect the profitability of those operations. Furthermore, changes in the business, regulatory or political climate in any of those countries, or significant fluctuations in currency exchange rates, could affect our ability to expand or continue our operations there, which could have a material adverse impact on our prospects, results of operations and cash flows. For a description of the current regulatory environment in the Latin American countries in which we operate, see “Mexico Regulations” and “Other Latin America Regulations” under “Part I, Item 1 — Business — Regulation.”
A significant or sudden decrease in gold values or the volume of gold transactions may have a material impact on our earnings and financial position.
Gold jewelry comprises a large portion of the collateral security for our pawn loans and our inventory. Pawn service charges, sales proceeds and our ability to liquidate excess jewelry inventory at an acceptable margin are dependent upon gold values and the volume of gold transactions. A decline in the availability of gold or our customers’ willingness or ability to sell us gold or use gold as collateral for pawn loans could impact our business. The impact on our financial position and results of operations of decreases in gold values or volumes or a change in customer behavior cannot be reasonably estimated because the market and customer response to changes in gold values is not known; however, a significant decline in gold values or gold volumes could result in decreases in sales, sales margins, pawn loan balances and pawn service charges.
A significant change in foreign currency exchange rates could have a material adverse impact on our earnings and financial position.
We have foreign operations in Latin America (Mexico, Guatemala, Honduras and Peru) and Canada, and an equity investment in Australia. Our assets and investments in, and earnings and dividends from each of these countries must be translated to U.S. dollars from their respective functional currencies. A significant weakening of any of these foreign currencies could result in lower assets and earnings in U.S. dollars, resulting in a potentially material adverse impact on our financial position, results of operations and cash flows.
Fluctuations in our sales, pawn loan balances, sales margins and pawn redemption rates could have a material adverse impact on our operating results.
We regularly experience fluctuations in a variety of operating metrics. Changes in any of these metrics, as might be caused by changes in the economic environment, competitive pressures, changes in customers’ tastes and preferences or a significant decrease in gold prices could materially and adversely affect our profitability and ability to achieve our planned results of operations.
Achievement of our growth objectives is dependent upon our ability to open and acquire new stores.
Our expansion strategy includes acquiring existing stores and opening de novo store locations. Our acquisition strategy is dependent upon the availability of attractive acquisition candidates, while the success of our de novo store strategy is contingent upon numerous factors that cannot be predicted or controlled, such as the availability of acceptable locations with a desirable customer base, the negotiation of acceptable lease terms, the ability to obtain required government permits and licenses and the existence of a suitable competitive environment. The achievement of our growth objectives is also subject to our ability to attract, train and retain qualified team members. Failure to achieve our expansion goals could adversely affect our prospects, future results of operations and future cash flows.
Our development of a digital platform to provide transaction and lending services, and the commercialization of that platform, may not be successful.
We are investing in the design and development of a digital platform to enhance our relationships with customers and provide them access to a broader range of financial products and services. There can be no assurance that our efforts to develop and launch such a digital platform will be successful or, if launched, that the platform will be accepted by existing customers or attract new customers. Consequently, we may not realize the expected return on our investment.
12
Our continued success is dependent on our ability to recruit, hire, retain and motivate talented executives and other key team members.
To remain competitive, sustain our success over the long-term and realize our strategic goals, we need to attract, hire, retain and motivate talented executives and other key team members to fill existing positions and reduce our succession risks. If our recruitment and retention programs (including compensation programs) are not viewed as competitive, or we fail to develop and implement appropriate succession plans for key executive positions, our results of operations, as well as our ability to achieve our long-term strategic goals, will be adversely affected.
Our ability to collect the remaining amounts owed under the Grupo Finmart promissory notes is dependent on the success and performance of Grupo Finmart and its parent company, AlphaCredit, and we continue to have limited indemnity obligations to AlphaCredit for pre-closing taxes.
In connection with the completion of the sale of our 94%-owned subsidiary, Prestaciones Finmart, S.A.P.I. de C.V., SOFOM, E.N.R. ("Grupo Finmart") to Alpha Holding, S.A. de C.V. (“AlphaCredit”) in September 2016, we received two “Parent Loan Notes” in the original principal amount of $60.2 million. As of September 30, 2019, the outstanding principal balance on the Parent Loan Notes had been fully repaid by Grupo Finmart. As of that date, Grupo Finmart remained obligated to pay approximately $8.0 million of deferred compensation fee due to us in fiscal 2020. Our ability to recover the remaining amounts due under the Parent Loan Notes is dependent on the success and performance of the business of Grupo Finmart (as primary obligor) and its parent AlphaCredit (as guarantor). To the extent that Grupo Finmart and AlphaCredit are unable to repay these amounts, our assets, financial performance and cash flows would be adversely affected.
Under the terms of the Purchase Agreement relating to the sale of Grupo Finmart, we remain obligated to indemnify AlphaCredit for any “pre-closing taxes” (i.e., tax obligations arising from the Grupo Finmart business that are attributable to periods prior to the completion of the sale in September 2016). Those obligations continue until the expiration of the statute of limitations applicable to the pre-closing periods. In August 2019, AlphaCredit notified us of a potential indemnity claim for certain pre-closing taxes, but the nature, extent and validity of such claim has yet to be determined.
Litigation and regulatory proceedings could have a material adverse impact on our business.
We are currently subject to various litigation and regulatory actions, and additional actions could arise in the future. Potential actions range from claims and assertions arising in the ordinary course of business (such as contract, customer or employment disputes) to more significant corporate-level matters or shareholder litigation. All of these matters are subject to inherent uncertainties, and unfavorable rulings could occur, which could include monetary damages, fines and penalties or other relief. Any unfavorable ruling or outcome could have a material adverse effect on our results of operations or could negatively affect our reputation. See Note 14 of Notes to Consolidated Financial Statements included in “Part II, Item 8 — Financial Statements and Supplementary Data” for a description of shareholder litigation that is in the final stages of resolution.
Under our certificate of incorporation, we are generally obligated to indemnify our directors and officers for costs and liabilities they incur in their capacity as directors or officers of the Company. Consequently, if a proceeding names or involves any of our directors or officers, then (subject to certain exceptions) we are generally obligated to pay or reimburse the cost or liability such director or officer incurs as a result of such proceeding (including defense costs, judgments and amounts paid in settlement). We maintain management liability insurance that protects us from much of this potential indemnification exposure, as well as potential costs or liabilities that may be directly incurred by the Company in some cases. However, our insurance coverage is subject to deductibles and there may be elements of the costs or liabilities that are not covered under the insurance policies. In addition, to the extent that our ultimate liability in any such proceeding (or any combination of proceedings that are included in the same policy year) exceeds the management liability policy limits, our results of operations and financial condition could be adversely affected.
One person beneficially owns all of our voting stock and generally controls the outcome of all matters requiring a vote of stockholders, which may influence the value of our publicly traded non-voting stock.
Phillip E. Cohen is the beneficial owner of all our Class B Voting Common Stock, and all our publicly traded stock is non-voting stock. Consequently, stockholders other than Mr. Cohen have no vote with respect to the election of directors or any other matter requiring a vote of stockholders except in limited circumstances as required by law. Further, our Bylaws currently provide that the voting stockholder may appoint or remove officers or take any other action that the Board of Directors may take with respect to officers under the Bylaws. The lack of voting rights may adversely affect the market value of our publicly traded Class A Common Stock.
In September 2019, Mr. Cohen joined the Board of Directors and was appointed Executive Chairman. As a member of the Board, Mr. Cohen is entitled to vote on all matters requiring approval of the Board. Our Bylaws currently provide that the
13
presence of all directors shall constitute a quorum for the transaction of business, and that any act of the Board of Directors requires a unanimous approval of all directors. Consequently, Mr. Cohen, as is the case with each of the other directors, has the ability to block actions of the Board. Mr. Cohen has agreed that, as a member of the Board of Directors, he will not participate in any Board vote regarding his position as Executive Chairman.
Our acquisitions, investments and other transactions could disrupt our ongoing business and harm our results of operations.
In pursuing our business strategy, we routinely conduct discussions, evaluate opportunities and enter into agreements regarding possible acquisitions, investments and other transactions. These transactions may involve significant challenges and risks, including risks that we may not realize the expected return on an acquisition or investment, that we may not be able to retain key personnel of an acquired business, or that we may experience difficulty in integrating acquired businesses into our business systems and processes. If we do enter into agreements with respect to acquisitions, investments or other transactions, we may fail to complete them due to inability to obtain required regulatory or other approvals or other factors. Furthermore, acquisitions, investments and other transactions require substantial management resources and have the potential to divert our attention from our existing business, and there are inherent risks in integrating and operating any acquired business. These factors could harm our business and results of operations.
We have a significant firearms business in the U.S., which exposes us to increased risks of regulatory fines and penalties, lawsuits and related liabilities.
As discussed under “Part I, Item 1 — Business — Regulation — U.S. Regulations — Pawn Regulations,” some of our stores in the U.S. conduct pawn and retail transactions involving firearms, which may be associated with an increased risk of injury and related lawsuits. We may be subject to lawsuits relating to the improper use of firearms that we sell, including actions by persons attempting to recover damages from firearms retailers relating to misuse of firearms. We may also incur fines, penalties or liabilities, or have our federal firearms licenses revoked or suspended, if we fail to properly perform required background checks for, and otherwise record and report, firearms transactions. Any such actions could have a material adverse effect on our business, prospects, results of operations, financial condition and reputation.
Our business is subject to team member and third-party robberies, burglaries and other crimes at the store level.
The nature of our business requires us to maintain significant cash on hand, loan collateral and inventories in our stores. Consequently, we are subject to loss of cash or merchandise as a result of robberies, burglaries, thefts, riots, looting and other criminal activity in our stores. Further, we could be subject to liability to customers or other third parties as a result of such activities. While we maintain asset protection and monitoring programs to mitigate these risks, as well as insurance programs to protect against catastrophic loss or exposure, there can be no assurance that these crimes will not occur or that such losses will not have an adverse effect on our business or results of operations.
We may be exposed to liabilities under applicable anti-bribery, anti-corruption, anti-money laundering and other general business laws and regulations, and any determination that we violated these laws or regulations could have a material adverse effect on our business.
We are subject to various anti-bribery and anti-corruption laws that prohibit improper payments or offers of payments to foreign governments and their officials for the purpose of obtaining or retaining business, including the Foreign Corrupt Practices Act in the U.S. and the General Law of Administrative Responsibility in Mexico. We are also subject to various laws and regulations designed to prevent money laundering or the financial support of terrorism or other illegal activity, including the USA PATRIOT Act and the Bank Secrecy Act in the U.S. and The Federal Law for the Prevention and Identification of Transactions with Funds From Illegal Sources in Mexico. See “Part I, Item 1 — Business — Regulation.” Further, our business is expanding in countries and regions that are less developed and are generally recognized as potentially more corrupt business and political environments.
While we maintain controls and policies to ensure compliance with applicable laws and regulations, these controls and policies may prove to be less than effective. If team members, agents or other persons for whose conduct we are held responsible violate our policies, we may be subject to severe criminal or civil sanctions and penalties, and we may be subject to other liabilities that could have a material adverse effect on our business, results of operations and financial condition.
Changes in our liquidity and capital requirements or in access to capital markets or other financing and transactional banking sources could limit our ability to achieve our plans.
A significant reduction in cash flows from operations or the availability of debt or equity financing could materially and adversely affect our ability to achieve our planned growth and operating results. Our ability to obtain debt or equity financing,
14
including the possible refinancing of existing indebtedness, will depend upon market conditions, our financial condition and the willingness of financing sources to make capital available to us at acceptable rates and terms. The inability to access capital at acceptable rates and terms could restrict or limit our ability to achieve our growth objectives, which could adversely affect our financial condition and results of operations.
Our access to transactional banking services, as well as international wire services between certain countries, is an ongoing business requirement. Inability in accessing or maintaining transactional banking or wire services could lead to increased costs or the inability to efficiently manage our cash as we would be required to seek alternative banking services or obtain services from several regional or local retail banks.
Changes in competition from various sources could have a material adverse impact on our ability to achieve our plans.
We encounter significant competition from other pawn stores, consumer lending companies, other retailers, online retailers and auction sites, many of which have significantly greater financial resources than we do. Increases in the number or size of competitors or other changes in competitive influences, such as aggressive marketing and pricing practices, could adversely affect our operations. In Mexico, we compete directly with certain pawn stores owned and operated by government affiliated or sponsored non-profit foundations, and the government could take actions that would harm our ability to compete in that market.
Our continued profitability and growth plans are dependent on our ability to successfully design or acquire, deploy and maintain information technology and other business systems to support our current business and our planned growth and expansion.
The success of our business depends on the efficiency and reliability of our information technology and business systems and related controls, including the point-of-sale system utilized in our store locations. If access to our technology infrastructure is impaired (as may occur with a computer virus, a cyber-attack or other intentional disruption by a third party, natural disaster, telecommunications system failure, electrical system failure or lost connectivity), or if there are flaws in the design or roll-out of new or refreshed technology systems (such as our point-of-sale system), we may be unable to process transactions or otherwise carry on our business in a timely and efficient manner. An infrastructure disruption could damage our reputation and cause us to lose customers and revenue. We consider security risks from multiple viewpoints, including physical security as well as security of infrastructure and databases. As our technology infrastructure continues to evolve from on premise to cloud service providers, we continue to assess the security of such infrastructure, including third party service providers.
We collect and store a variety of sensitive customer information, and breaches in data security or other cyber-attacks could harm our business operations and lead to reputational damage.
In the course of conducting our business, we collect and store on our information technology systems a variety of information about our customers, including sensitive personal identifying and financial information. We may not have the resources or technical expertise to anticipate or prevent rapidly evolving types of cyber-attacks. Attacks may be targeted at us, our service providers, our customers or others who have entrusted us with information. Actual or anticipated attacks may cause us to incur increased costs, including costs to hire additional personnel, purchase additional protection technologies, train team members and engage third-party experts and consultants. Advances in computer capabilities, new technological discoveries or other developments may result in the technology we use to protect data being breached or compromised. In addition, data and security breaches can occur as a result of non-technical issues, including breach by us or by persons with whom we have commercial relationships that result in the unauthorized release of personal or confidential information. We could be subject to fines, penalties and liabilities if any such information is misappropriated from our systems or we otherwise fail to maintain the security and confidentiality of such information. Further, any such data security breach could cause damage to our reputation and a loss of confidence in our data security measures, which could adversely affect our business and prospects.
We invested in Cash Converters International Limited for strategic reasons. We may be required in future periods to impair our investment and recognize related investment losses, as we have done in the past, and we may not realize a positive return on the investment.
We currently have a significant investment in Cash Converters International, which is a publicly traded company based in Australia. We made the initial investment in November 2009 and have made incremental investments periodically since then, including a $14.0 million investment in June 2018 to increase our ownership percentage to 34.75%. The success of this strategic investment is dependent on a variety of factors, including Cash Converters International’s business performance and the market’s assessment of that performance. Cash Converters International’s business has been under significant pressure for the past several years, principally as a result of regulatory changes in Australia and the United Kingdom and related class action litigation. After an analysis of Cash Converters International’s stock price performance and other factors, we determined that the fair value of our investment in Cash Converters International at September 30, 2019 was less than its carrying value but that the impairment was not “other than temporary” primarily due to Cash Converters’ October 2019 agreement to settle a class
15
action lawsuit and the resulting rebound in Cash Converters’ stock price above its recorded value. Accordingly, we did not record an impairment at that date. See Note 4 of Notes to Consolidated Financial Statements included in “Part II, Item 8 - Financial Statements and Supplemental Data.” If the fair value of our investment declines and we determine that such decline is other-than-temporary, we may be required to further impair our investment and recognize the related investment loss, which would adversely affect our results of operations and financial position in the period of impairment. Furthermore, there can be no assurance that we will be able to dispose of some or all of our investment in Cash Converters International on favorable terms, should we decide to do so in the future.
Our ability to recover our investment in RDC is heavily dependent on RDC's success and performance, including its ability to obtain further debt or equity financing.
We have an investment in Rich Data Corporation (“RDC”), a previously consolidated variable interest entity. See Note 5 of Notes to Consolidated Financial Statements included in “Part II, Item 8 — Financial Statements and Supplemental Data.” Our ability to recover our investment in RDC is heavily dependent on RDC's success and performance, potentially including its ability to obtain further debt or equity financing. To the extent that RDC is not successful, we may be required in future periods to impair our investment and recognize related investment losses.
We may incur property, casualty or other losses, including losses related to natural disasters such as hurricanes, earthquakes and volcanoes. Not all such losses will be covered by insurance.
We maintain a program of insurance coverage for various types of property, casualty and other risks. The types and amounts of insurance that we obtain vary from time to time, depending on availability, cost and our decisions with respect to risk retention. The policies are subject to deductibles and exclusions that result in our retention of a level of risk on a self-insurance basis. Losses not covered by insurance could be substantial and may increase our expenses, which could harm our results of operations and financial condition.
We have significant operations located in areas that are susceptible to hurricanes (notably the Atlantic and Gulf Coast regions of Florida, the Gulf Coast regions of Texas including Houston, as well as Mexico and Central America). Certain areas of our operations are also susceptible to other types of natural disasters such as earthquakes, volcanoes and tornadoes. As noted above, not all physical damage that we incur as a result of any such natural disaster will be covered by insurance due to policy deductibles and risk retentions. In addition, natural disasters could have a significant negative impact on our business beyond physical damage to property, including a reduction of our loan portfolio, inventory, pawn service charges and merchandise sales. Only limited portions, if any, of those negative impacts will be covered by applicable business interruption insurance policies. As a result, geographically isolated natural disasters could have a material adverse effect on our overall operations and financial performance.
We may face business interruptions or other adverse effects on our operations and growth.
Our business and operations could be subject to interruption or damage due to inclement weather, natural disaster, power loss, acts of violence, terrorist attacks, war, civil unrest or similar events. Further, we may experience information technology or other business systems disruptions. Such events could impair our customers' access to our business, impact our ability to expand or continue our operations or otherwise have an adverse effect on our financial condition.
We could be subject to changes in tax rates, the adoption of new tax laws in the U.S. or other countries, or exposure to additional tax liabilities.
We are subject to taxes in the U.S. and several foreign jurisdictions. Current economic and political conditions make tax rates in any of these jurisdictions subject to significant change. Our future effective tax rates could be affected by changes in the mix of earnings in countries with differing statutory tax rates, changes in the valuation of deferred tax assets and liabilities, changes in tax rates or changes in tax laws or their interpretation.
Goodwill comprises a significant portion of our total assets. We assess goodwill for impairment at least annually, which could result in a material, non-cash write-down and could have a material adverse effect on our results of operations and financial conditions.
The carrying value of our goodwill was $300.5 million, or approximately 28% of our total assets as of September 30, 2019. In accordance with Financial Accounting Standards Board Accounting Standards Codification 350-20-35, we test goodwill and intangible assets with an indefinite useful life for potential impairment annually, or more frequently if an event occurs or circumstances change that would more likely than not reduce the fair value of a reporting unit below its carrying value. These events or circumstances could include a significant change in the business climate, a change in strategic direction, legal factors, operating performance indicators, a change in the competitive environment, the sale or disposition of a significant portion of a
16
reporting unit, or future economic factors such as unfavorable changes in the estimated future discounted cash flows of our reporting units. Our annual goodwill impairment test is performed in the fourth quarter utilizing the income approach. This approach uses future cash flows and estimated terminal values for each reporting unit (discounted using a market participant perspective) to determine the fair value of each reporting unit, which is then compared to the carrying value of the reporting unit to determine if an impairment exists. The income approach includes assumptions about revenue growth rates, operating margins and terminal growth rates discounted by an estimated weighted-average cost of capital derived from other publicly traded companies that are similar but not identical from an operational and economic standpoint. See Note 1 and Note 7 of Notes to Consolidated Financial Statements included in “Part II, Item 8 — Financial Statements and Supplementary Data” for a discussion of our annual impairment tests performed for goodwill and indefinite-lived intangible assets during fiscal 2019. Changes in the economic conditions or regulatory environment could negatively affect our key assumptions. Future negative developments including a decline in merchandise sales or demand for our products, a decline in precious metal commodity values, or inflation in costs relative to revenues in our Latin American operations in Guatemala, Honduras, El Salvador or Peru could lead to potential impairment of the $34.5 million in goodwill recorded in our “GPMX” reporting unit within our Latin America reporting segment. There were no impairments of goodwill during fiscal 2019, but there may be impairments in the future should events or circumstances as noted above change.
We also perform periodic reviews for potential impairment of other intangible assets. At September 30, 2019, we determined an impairment had occurred in the fair value of an acquired trade name of a previously acquired entity and recorded a related impairment of $0.6 million. If future and expected performance of acquired entities drops below current expectations, we may recognize further impairments of recorded trade names in future periods, which could negatively affect our results of operations and financial condition. At September 30, 2019, the net book value of recorded trade names, most of which were acquired after fiscal 2017, was $19.9 million.
The conversion feature of our convertible notes, if triggered, may adversely affect our financial condition and operating results.
We have outstanding a total of $316.3 million of convertible notes. See Note 8 of Note to Consolidated Financial Statements included in “Part II, Item 8 — Financial Statements and Supplementary Data.” If the conversion feature of any of those convertible notes is triggered, holders will be entitled to convert the notes at their option at any time during specified periods. If one or more holders elect to convert their notes, we may be required, or may choose, to settle the obligation through the payment of cash, which could adversely affect our liquidity. In addition, even if holders do not elect to convert their notes, we could be required under applicable accounting rules to reclassify all or a portion of the outstanding principal of the convertible notes as a current rather than long-term liability, which would result in a material reduction of our net working capital.
Conversion of our convertible notes into stock may dilute the ownership interests of existing stockholders or may otherwise depress the price of our Class A Common Stock.
If it were to occur, the conversion of convertible notes would dilute the ownership interests of existing stockholders to the extent we deliver shares of Class A Common Stock upon conversion. Any sales in the public market of such shares could adversely affect prevailing market prices of our Class A Common Stock. In addition, the existence of the convertible notes may encourage short selling by market participants because the conversion of such notes could be used to satisfy short positions, or anticipated conversion of the notes into shares of our Class A Common Stock could depress the price of our Class A Common Stock.
We have a limited number of unreserved shares available for future issuance, which may limit our ability to conduct future financings and other transactions and our ability to offer equity awards to management.
Our certificate of incorporation currently authorizes us to issue up to 100 million shares of Class A Common Stock. Taking into consideration the shares that are issued and outstanding, as well as the shares that have been reserved for issuance pursuant to convertible notes, warrants and outstanding equity incentive compensation awards and the conversion of the Class B Common Stock, we had approximately 1,000,000 shares of authorized Class A Common Stock available for other uses as of September 30, 2019. Therefore, our ability to issue shares of Class A Common Stock (other than pursuant to the existing reserved-for commitments), or securities or instruments that are convertible into or exchangeable for shares of Class A Common Stock, may be limited until such time that additional authorized, unissued and unreserved shares become available or unless we determine that we are unlikely to issue all of the shares that are currently reserved. During this time, for example, our ability to complete equity or equity-linked financings or other transactions (including strategic acquisitions) that involve the issuance or potential issuance of Class A Common Stock may be limited. Further, our ability to offer equity-based compensation to our management team may also be limited, which could adversely affect our ability to align management’s incentives with stockholders or attract and retain key management personnel.
We face other risks discussed under "Part II, Item 7A — Quantitative and Qualitative Disclosures about Market Risk."
17
ITEM 1B — UNRESOLVED STAFF COMMENTS
None.
ITEM 2 — PROPERTIES
Our pawn stores are typically located in a freestanding building or occupy all or part of a retail strip center with contiguous parking. A portion of the store interior is designed for retail operations, with merchandise displayed for sale by category. Distinctive exterior design and attractive in-store signage provide an appealing atmosphere to customers. We maintain or reimburse our landlords for maintaining property and general liability insurance for each of our stores. Our stores are open six or seven days a week.
We generally lease our United States locations with terms of three to ten years with one or more renewal options. Our locations in Latin America are generally leased on three to five year terms. Our existing leases expire on dates ranging between November 2019 and fiscal 2031, with a small number of leases on month-to-month terms. All leases provide for specified periodic rental payments at market rates. Most leases require us to maintain the property and pay the cost of insurance and taxes. We believe the termination of any one of our leases would not have a material adverse effect on our operations. Our strategy generally is to lease rather than own space for our stores. On an ongoing basis, we may close or consolidate under-performing store locations.
The following table presents the number of stores by location as of September 30, 2019:
United States: | ||
Texas | 215 | |
Florida | 96 | |
Colorado | 34 | |
Nevada | 24 | |
Illinois | 21 | |
Oklahoma | 21 | |
Arizona | 20 | |
Indiana | 15 | |
Tennessee | 13 | |
Iowa | 11 | |
Utah | 9 | |
Georgia | 8 | |
Minnesota | 7 | |
Alabama | 5 | |
Oregon | 5 | |
Wisconsin | 3 | |
Virginia | 2 | |
Pennsylvania | 1 | |
Mississippi | 1 | |
Arkansas | 1 | |
Total United States locations | 512 | |
Mexico: | ||
Estado de México | 70 | |
Ciudad de México | 59 | |
Veracruz | 38 | |
Sinaloa | 24 | |
Guanajuato | 23 | |
Jalisco | 17 | |
Hidalgo | 16 | |
Puebla | 12 | |
Tabasco | 11 | |
Michoacán | 9 | |
Tamaulipas | 9 | |
Querétaro | 8 | |
18
Chiapas | 8 | |
Morelos | 9 | |
Nuevo León | 7 | |
Campeche | 7 | |
Guerrero | 6 | |
Quintana Roo | 6 | |
Coahuila | 5 | |
Oaxaca | 4 | |
Aguascalientes | 4 | |
Tlaxcala | 3 | |
San Luis Potosí | 2 | |
Total Mexico locations | 357 | |
Guatemala | 80 | |
El Salvador | 17 | |
Honduras | 15 | |
Peru | 11 | |
Canada: | ||
Ontario | 22 | |
Total Canada locations | 22 | |
Total Company locations | 1,014 | |
In addition to our store locations, we lease corporate office space primarily in Austin, Texas (137,100 square feet, of which 82,700 square feet has been subleased to other tenants), Querétaro, Mexico (9,500 square feet), Guatemala City, Guatemala (7,700 square feet), and Miami, Florida (14,200 square feet).
For additional information about store locations during fiscal 2019, 2018 and 2017, see “Segment and Geographic Information” included in “Part I, Item 1 — Business.”
ITEM 3 — LEGAL PROCEEDINGS
For a discussion of legal proceedings, see Note 14 of Notes to Consolidated Financial Statements included in “Part II, Item 8 — Financial Statements and Supplementary Data.”
ITEM 4 — MINE SAFETY DISCLOSURES
Not applicable.
19
PART II
ITEM 5 — MARKET FOR REGISTRANT'S COMMON EQUITY, RELATED STOCKHOLDER MATTERS AND ISSUER PURCHASES OF EQUITY SECURITIES
Market Information
Our Class A Non-Voting Common Stock (“Class A Common Stock”) is traded on the NASDAQ Stock Market under the symbol “EZPW.” As of November 25, 2019, there were approximately 270 stockholders of record of our Class A Common Stock. There is no trading market for our Class B Voting Common Stock (“Class B Common Stock”), which was held by one stockholder as of November 25, 2019. As of September 30, 2019, the closing sales price of our Class A Common Stock, as reported by the NASDAQ Stock Market, was $6.46 per share.
Stock Performance Graph
The following Stock Performance Graph and related information shall not be deemed to be “filed” with the Securities and Exchange Commission, nor shall such information be incorporated by reference into any future filing under the Securities Act of 1933 or the Securities Exchange Act of 1934.
The following table compares cumulative total stockholder returns for our Class A Common Stock for the last five fiscal years, with the cumulative total return on the NASDAQ Composite Index (ticker symbol: IXIC) and the NASDAQ Other Financial Index (ticker symbol: IXFN) over the same period. The graph shows the value, at the end of each of the last five fiscal years, of $100 invested in our Class A Common Stock or the indices on September 30, 2014. The graph depicts the change in the value of our Class A Common Stock relative to the indices at the end of each fiscal year and not for any interim period. Historical stock price performance is not necessarily indicative of future stock price performance.
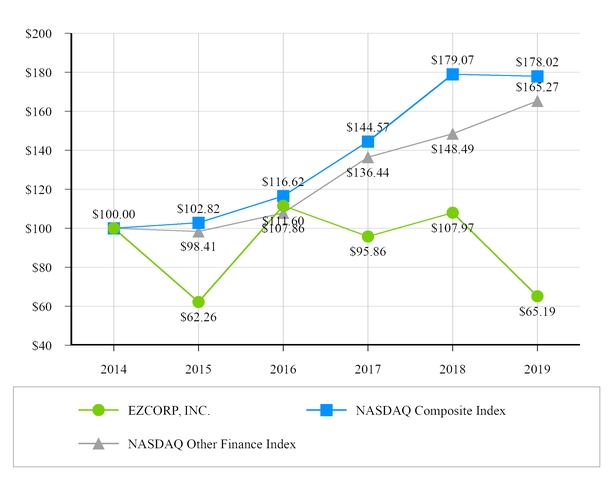
20
ITEM 6 — SELECTED FINANCIAL DATA
The following selected financial information should be read in conjunction with, and is qualified in its entirety by, the accompanying consolidated financial statements and related notes. We revised certain historical amounts as further described in Note 1 of Notes to Consolidated Financial Statements included in “Part II, Item 8 — Financial Statements and Supplementary Data.”
Operating Data
Fiscal Year Ended September 30, | |||||||||||||||||||
2019 | 2018 (a) | 2017 | 2016 | 2015 | |||||||||||||||
(in thousands, except per share and store figures) | |||||||||||||||||||
Total revenues | $ | 847,229 | $ | 812,156 | $ | 747,951 | $ | 730,319 | $ | 720,726 | |||||||||
Net revenues | 494,448 | 481,551 | 435,507 | 428,044 | 403,746 | ||||||||||||||
Restructuring | — | — | — | 1,921 | 17,080 | ||||||||||||||
Impairment of investments | 19,725 | 11,712 | — | 10,957 | 26,837 | ||||||||||||||
Income (loss) from continuing operations, net of tax | 1,768 | 37,150 | 31,585 | (9,322 | ) | (51,817 | ) | ||||||||||||
Basic earnings (loss) per share attributable to EZCORP, Inc. — continuing operations | $ | 0.05 | $ | 0.70 | $ | 0.61 | $ | (0.15 | ) | $ | (0.93 | ) | |||||||
Diluted earnings (loss) per share attributable to EZCORP, Inc. — continuing operations | $ | 0.05 | $ | 0.66 | $ | 0.61 | $ | (0.15 | ) | $ | (0.93 | ) | |||||||
Weighted average shares outstanding: | |||||||||||||||||||
Basic | 55,341 | 54,456 | 54,260 | 54,427 | 54,369 | ||||||||||||||
Diluted | 55,984 | 57,896 | 54,368 | 54,427 | 54,369 | ||||||||||||||
Stores attributable to continuing operations at end of period | 1,014 | 988 | 786 | 786 | 786 | ||||||||||||||
(a) | In fiscal 2018 we acquired 112 GuatePrenda-MaxiEfectivo (“GPMX”) pawn stores as further described in Note 2 of Notes to Consolidated Financial Statements included in “Part II, Item 8 — Financial Statements and Supplementary Data.” |
September 30, | |||||||||||||||||||
2019 (c) | 2018 | 2017 | 2016 | 2015 | |||||||||||||||
(in thousands) | |||||||||||||||||||
Pawn loans | $ | 199,058 | $ | 198,463 | $ | 169,242 | $ | 167,329 | $ | 159,964 | |||||||||
Inventory, net | 179,355 | 166,997 | 154,411 | 140,224 | 124,084 | ||||||||||||||
Working capital (a) (b) | 514,674 | 489,422 | 503,918 | 382,908 | 314,127 | ||||||||||||||
Total assets (a) | 1,083,702 | 1,241,780 | 1,021,144 | 980,182 | 896,087 | ||||||||||||||
Long-term debt, less current maturities (a) | 238,380 | 226,702 | 284,807 | 283,611 | 197,976 | ||||||||||||||
EZCORP, Inc. stockholders’ equity | 744,949 | 742,739 | 658,803 | 591,921 | 653,210 | ||||||||||||||
(a) | Amounts exclude assets and liabilities held for sale in conjunction with the disposal of Prestaciones Finmart, S.A.P.I. de C.V., SOFOM, E.N.R. ("Grupo Finmart") in September 2016. |
(b) | In fiscal 2019, we repaid $195.0 million in aggregate principal amount outstanding 2.125% Cash Convertible Senior Notes Due 2019 using cash on hand. |
(c) | Working capital and total asset amounts are inclusive of $0.9 million in gross installment loan balances which are securitized under the CASHMAX securitization facility as further described in Note 8 of Notes to Consolidated Financial Statements included in “Part II, Item 8 — Financial Statements and Supplementary Data.” |
21
ITEM 7 — MANAGEMENT'S DISCUSSION AND ANALYSIS OF FINANCIAL CONDITION AND RESULTS OF OPERATIONS
The discussion in this section contains forward-looking statements that are based on our current expectations. Actual results could differ materially from those expressed or implied by the forward-looking statements due to a number of risks, uncertainties and other factors, including those identified in “Part I, Item 1A — Risk Factors.” See also “Cautionary Statement Regarding Risks and Uncertainties That May Affect Future Results” below.
This discussion and analysis should be read in conjunction with the consolidated financial statements and the accompanying notes included in “Part II, Item 8 — Financial Statements and Supplementary Data.”
Results of Operations
Fiscal 2019 vs. Fiscal 2018
Summary Financial Data
The following table presents selected summary consolidated financial data for fiscal 2019 and fiscal 2018.
Fiscal Year Ended September 30, | Change | ||||||||
2019 | 2018 | ||||||||
(in thousands) | |||||||||
Net revenues: | |||||||||
Pawn service charges | $ | 327,366 | $ | 304,577 | 7% | ||||
Merchandise sales | 453,375 | 438,372 | 3% | ||||||
Merchandise sales gross profit | 155,867 | 161,754 | (4)% | ||||||
Gross margin on merchandise sales | 34 | % | 37 | % | (300) bps | ||||
Jewelry scrapping sales | 60,445 | 60,752 | (1)% | ||||||
Jewelry scrapping gross profit | 7,510 | 8,462 | (11)% | ||||||
Gross margin on jewelry scrapping sales | 12 | % | 14 | % | (200) bps | ||||
Other revenues, net | 3,705 | 6,758 | (45)% | ||||||
Net revenues | 494,448 | 481,551 | 3% | ||||||
Operating expenses | 447,439 | 414,427 | 8% | ||||||
Non-operating expenses | 42,835 | 11,585 | 270% | ||||||
Income from continuing operations before income taxes | 4,174 | 55,539 | (92)% | ||||||
Income tax expense | 2,406 | 18,389 | (87)% | ||||||
Income from continuing operations, net of tax | 1,768 | 37,150 | (95)% | ||||||
Loss from discontinued operations, net of tax | (457 | ) | (856 | ) | (47)% | ||||
Net income | 1,311 | 36,294 | (96)% | ||||||
Net loss attributable to noncontrolling interest | (1,230 | ) | (988 | ) | 24% | ||||
Net income attributable to EZCORP, Inc. | $ | 2,541 | $ | 37,282 | (93)% | ||||
Net pawn earning assets: | |||||||||
Pawn loans | $ | 199,058 | $ | 198,463 | —% | ||||
Inventory, net | 179,355 | 166,997 | 7% | ||||||
Total net pawn earning assets | $ | 378,413 | $ | 365,460 | 4% | ||||
Net revenues for fiscal 2019 were $494.4 million compared to $481.6 million in the prior year. Pawn service charges (“PSC”) increased 7% on a higher average pawn loans outstanding (“PLO”) balance throughout the year resulting from acquisitions, newly opened stores and same store growth. Average ending monthly PLO balances during the current year increased by 7%.
22
Merchandise sales increased 3%, but gross margin on merchandise sales declined 300 basis points to 34%, resulting in a 4% decline in merchandise sales gross profit. Excluding a discrete $4.6 million transaction tax adjustment in our Latin America segment, gross margin on merchandise sales was 35%, falling within our target range of 35-38%.
Total operating expenses increased $33.0 million, or 8%, primarily as a result of the acquisition of 84 pawn stores in Latin America in fiscal 2018 that were not in operation for the full fiscal 2018, another 12 pawn stores acquired in the U.S. and Latin America in fiscal 2019 and the opening of 34 de novo stores in Latin America during fiscal 2018 and 2019, as well as other investments to support the growth of the business. Total non-operating expenses increased $31.3 million, or 270%, primarily due to:
• | Impairment of our investment in Cash Converters International in the amount of $19.7 million ($15.3 million, net of taxes) as compared to an impairment of $11.7 million ($9.2 million, net of taxes) in the prior year; |
• | A $5.7 million decrease in income from our unconsolidated affiliates, primarily Cash Converters International; |
• | A $5.2 million decrease in other income from a favorable legal settlement in the prior year; |
• | A $4.8 million increase in interest expense, primarily due to an increase in average debt outstanding during the current year compared to the prior year, offset by the reduction of interest expense on $195.0 million of our 2019 Cash Convertible Notes which were repaid on June 17, 2019; and |
• | A $6.0 million decrease in interest income, primarily due to the declining principal balance on the Grupo Finmart notes as they are repaid in accordance with their agreed amortization schedule, in addition to the reduction of interest earned on outstanding cash balances after our 2019 Convertible Notes were repaid in June 2019. |
Income taxes decreased $16.0 million due primarily to:
• | A decrease in income from continuing operations before income taxes; |
• | A discrete transaction tax adjustment with an income tax benefit of $1.8 million in the current year; and |
• | A lower maximum U.S. corporate tax rate of 21% in the current year compared to a higher blended rate in the prior year; partially offset by |
• | A first quarter fiscal 2018 charge related to the impacts of the U.S. Tax Cuts and Jobs Act of 2017; and |
• | A $3.1 million reduction in benefits associated with the expiration of a statute of limitations on uncertain tax positions. |
Income tax expense includes other items that do not necessarily correspond to pre-tax earnings and create volatility in our effective tax rate. These items include the impact of earnings and foreign tax credits from our equity investment in Cash Converters International, the net effect of state taxes, non-deductible items and changes in valuation allowances, the lapse of the statute of limitations of uncertain tax positions, as well as impacts from the new federal tax in the United States. See Note 10 of Notes to Consolidated Financial Statements included in “Part II, Item 8 — Financial Statements and Supplemental Data” for quantification of these items.
23
U.S. Pawn
The following table presents selected summary financial data from the U.S. Pawn segment:
Fiscal Year Ended September 30, | Change | ||||||||
2019 | 2018 | ||||||||
(in thousands) | |||||||||
Net revenues: | |||||||||
Pawn service charges | $ | 248,369 | $ | 237,086 | 5% | ||||
Merchandise sales | 355,996 | 350,699 | 2% | ||||||
Merchandise sales gross profit | 130,860 | 134,291 | (3)% | ||||||
Gross margin on merchandise sales | 37 | % | 38 | % | (100) bps | ||||
Jewelry scrapping sales | 45,815 | 47,745 | (4)% | ||||||
Jewelry scrapping sales gross profit | 6,497 | 7,328 | (11)% | ||||||
Gross margin on jewelry scrapping sales | 14 | % | 15 | % | (100) bps | ||||
Other revenues | 233 | 250 | (7)% | ||||||
Net revenues | 385,959 | 378,955 | 2% | ||||||
Segment operating expenses: | |||||||||
Operations | 269,003 | 263,094 | 2% | ||||||
Depreciation and amortization | 11,879 | 12,869 | (8)% | ||||||
Segment operating contribution | 105,077 | 102,992 | 2% | ||||||
Other segment expenses | 3,402 | 271 | 1,155% | ||||||
Segment contribution | $ | 101,675 | $ | 102,721 | (1)% | ||||
Other data: | |||||||||
Net earning assets — continuing operations (a) | $ | 299,674 | $ | 290,140 | 3% | ||||
Inventory turnover | 1.9 | 1.9 | 0.0x | ||||||
Average monthly ending pawn loan balance per store (b) | $ | 292 | $ | 279 | 5% | ||||
Monthly average yield on pawn loans outstanding | 14 | % | 14 | % | — | ||||
Pawn loan redemption rate | 84 | % | 84 | % | — | ||||
(a) | Balance includes pawn loans and inventory. |
(b) | Balance is calculated based on the average of the monthly ending balance averages during the applicable period. |
24
Net revenue increased $7.0 million, or 2%, primarily due to a 5%, or $11.3 million increase in PSC, partially offset by a 3%, or $3.4 million, decrease in merchandise sales gross profit. These results include a slight margin decline and an 11%, or $0.8 million, decrease in jewelry scrapping sales gross profit on less scrap volume. The increase in net revenue attributable to same stores and new stores added/closed during the year is summarized as follows:
Change in Net Revenue | |||||||||||
Pawn Service Charges | Merchandise Sales Gross Profit | Total | |||||||||
(in millions) | |||||||||||
Same stores | $ | 10.8 | $ | (3.0 | ) | $ | 7.8 | ||||
Closed stores and other | 0.5 | (0.4 | ) | 0.1 | |||||||
Total | $ | 11.3 | $ | (3.4 | ) | $ | 7.9 | ||||
Change in jewelry scrapping sales gross profit and other revenues | (0.8 | ) | |||||||||
Total change in net revenue | $ | 7.1 | |||||||||
PSC increased 5% primarily due to a 5% increase in average ending monthly PLO balances during the current year. The higher average loan balance was driven by disciplined lending practices and a focus on meeting customers' need for cash, as well as acquired stores. Same store pawn service charges increased 5%.
Merchandise sales increased 2%, with gross margin on merchandise sales of 37%, a 100 basis point decline over the prior year, but within our target range. As a result, merchandise sales gross profit decreased 3% to $130.9 million.
Jewelry scrapping sales gross profit remained relatively flat at 2% of net revenues, but down 11% from the prior year, in-line with our strategy to sell rather than scrap jewelry in prime sales periods, with a 100 basis point decrease in gross margin to 14%.
Operations expenses increased 2%, including increased team member compensation at same stores. Depreciation and amortization improved 8% primarily as a result of a discrete charge of $0.5 million for the retirement of certain assets in the prior year.
A 2% increase in net revenue resulted in a 1% decrease in segment contribution primarily as a result of a $2.9 million reserve against a receivable balance from a gold refiner deemed uncollectible due to the refiner's Chapter 11 bankruptcy included in other segment expenses. As a net effect of these factors, segment contribution decreased 1% to $101.7 million.
25
Non-GAAP Financial Information
In addition to the financial information prepared in conformity with accounting principles generally accepted in the United States ("GAAP"), we provide certain other non-GAAP financial information on a constant currency basis ("constant currency"). We use constant currency results to evaluate our Latin America Pawn operations, which are denominated primarily in Mexican pesos and other Latin American currencies. We believe that presentation of constant currency results is meaningful and useful in understanding the activities and business metrics of our Latin America Pawn operations and reflect an additional way of viewing aspects of our business that, when viewed with GAAP results, provide a more complete understanding of factors and trends affecting our business. We provide non-GAAP financial information for informational purposes and to enhance understanding of our GAAP consolidated financial statements. We use this non-GAAP financial information to evaluate and compare operating results across accounting periods. Readers should consider the information in addition to, but not instead of or superior to, our financial statements prepared in accordance with GAAP. This non-GAAP financial information may be determined or calculated differently by other companies, limiting the usefulness of those measures for comparative purposes.
Constant currency results reported herein are calculated by translating consolidated balance sheet and consolidated statement of operations items denominated in local currency to U.S. dollars using the exchange rate from the prior-year comparable period, as opposed to the current period, in order to exclude the effects of foreign currency rate fluctuations. We used the end-of-period rate for balance sheet items and the average closing daily exchange rate on a monthly basis during the appropriate period for statement of operations items. The end-of-period and approximate average exchange rates for each applicable currency as compared to U.S. dollars as of and for the three and twelve months ended September 30, 2019 and 2018 were as follows:
September 30, | Three Months Ended September 30, | Twelve Months Ended September 30, | ||||||||||||||||
2019 | 2018 | 2019 | 2018 | 2019 | 2018 | |||||||||||||
Mexican peso | 19.7 | 18.7 | 19.4 | 18.9 | 19.4 | 19.0 | ||||||||||||
Guatemalan quetzal | 7.6 | 7.6 | 7.5 | 7.5 | 7.6 | 7.3 | ||||||||||||
Honduran lempira | 24.2 | 24.0 | 24.1 | 23.8 | 24.1 | 23.5 | ||||||||||||
Peruvian sol | 3.4 | 3.3 | 3.3 | 3.3 | 3.3 | 3.2 | ||||||||||||
Our statement of operations constant currency results reflect the monthly exchange rate fluctuations and so are not directly calculable from the above rates. Constant currency results, where presented, also exclude the foreign currency gain or loss.
26
Latin America Pawn
The following table presents selected summary financial data from continuing operations for the Latin America Pawn segment, including constant currency results, after translation to U.S. dollars from its functional currencies of the Mexican peso, Guatemalan quetzal, Honduran lempira and Peruvian sol. See “Results of Operations — Non-GAAP Financial Information” above.
Fiscal Year Ended September 30, | |||||||||||||||
2019 (GAAP) | 2018 (GAAP) | Change (GAAP) | 2019 (Constant Currency) | Change (Constant Currency) | |||||||||||
(in thousands) | (in thousands) | ||||||||||||||
Net revenues: | |||||||||||||||
Pawn service charges | $ | 78,997 | $ | 67,491 | 17% | $ | 80,821 | 20% | |||||||
Merchandise sales | 97,379 | 87,673 | 11% | 99,886 | 14% | ||||||||||
Merchandise sales gross profit | 25,007 | 27,463 | (9)% | 25,907 | (6)% | ||||||||||
Gross margin on merchandise sales | 26 | % | 31 | % | (500) bps | 26 | % | (500) bps | |||||||
Jewelry scrapping sales | 14,630 | 13,007 | 12% | 14,956 | 15% | ||||||||||
Jewelry scrapping sales gross profit | 1,013 | 1,134 | (11)% | 1,033 | (9)% | ||||||||||
Gross margin on jewelry scrapping sales | 7 | % | 9 | % | (200) bps | 7 | % | (200) bps | |||||||
Other revenues | 179 | 85 | 111% | 184 | 116% | ||||||||||
Net revenues | 105,196 | 96,173 | 9% | 107,945 | 12% | ||||||||||
Segment operating expenses: | |||||||||||||||
Operations | 74,199 | 61,553 | 21% | 75,898 | 23% | ||||||||||
Depreciation and amortization | 6,267 | 4,068 | 54% | 6,400 | 57% | ||||||||||
Segment operating contribution | 24,730 | 30,552 | (19)% | 25,647 | (16)% | ||||||||||
Other segment expense (income) (a) | 606 | (2,609 | ) | * | 589 | * | |||||||||
Segment contribution | $ | 24,124 | $ | 33,161 | (27)% | $ | 25,058 | (24)% | |||||||
Other data: | |||||||||||||||
Net earning assets — continuing operations (b) | $ | 78,739 | $ | 75,320 | 5% | $ | 81,731 | 9% | |||||||
Inventory turnover | 2.4 | 2.7 | (0.3)x | 2.4 | (0.3)x | ||||||||||
Average monthly ending pawn loan balance per store (c) | $ | 89 | $ | 90 | (1)% | $ | 92 | 2% | |||||||
Monthly average yield on pawn loans outstanding | 16 | % | 15 | % | 100 bps | 16 | % | 100 bps | |||||||
Pawn loan redemption rate (d) | 78 | % | 79 | % | (100) bps | 78 | % | (100) bps | |||||||
* | Represents a percentage computation that is not mathematically meaningful. | |||
(a) | Fiscal 2019 constant currency amount excludes nominal net GAAP basis foreign currency transaction gains resulting from movement in exchange rates. The net foreign currency transaction gains for fiscal 2018 were $0.2 million and are included in the above results. | |||
(b) | Balance includes pawn loans and inventory. | |||
(c) | Balance is calculated based on the average of the monthly ending balance averages during the applicable period. | |||
(d) | Rate is solely inclusive of results from Empeño Fácil. | |||
27
In the current year, our Latin America pawn segment acquired five pawn stores and opened 22 de novo stores. At new stores, net revenue growth typically trails the growth in expenses until new stores begin to mature and until acquired stores are fully integrated and migrated to our operating metrics. Net revenue increased $9.0 million, or 9%, ($11.8 million, or 12%, on a constant currency basis), primarily due to a 17% increase (20% on a constant currency basis) in PSC, offset by a 9% decrease (6% on a constant currency basis) in merchandise sales gross profit, inclusive of a discrete tax adjustment of $4.6 million relating to prior periods. Excluding the discrete transaction tax adjustment, net revenues increased 14% (17% on a constant currency basis). The change in net revenue attributable to same stores and new stores added since the prior year is summarized as follows:
Change in Net Revenue (GAAP) | |||||||||||
Pawn Service Charges | Merchandise Sales Gross Profit | Total | |||||||||
(in millions) | |||||||||||
Same stores (a) | $ | 4.0 | $ | (5.2 | ) | $ | (1.2 | ) | |||
New stores and other | 7.5 | 2.7 | 10.2 | ||||||||
Total | $ | 11.5 | $ | (2.5 | ) | $ | 9.0 | ||||
Change in jewelry scrapping sales gross profit and other revenues | — | ||||||||||
Total change in net revenue | $ | 9.0 | |||||||||
Change in Net Revenue (Constant Currency) | |||||||||||
Pawn Service Charges | Merchandise Sales Gross Profit | Total | |||||||||
(in millions) | |||||||||||
Same stores (a) | $ | 5.6 | $ | (4.4 | ) | $ | 1.2 | ||||
New stores and other | 7.7 | 2.9 | 10.6 | ||||||||
Total | $ | 13.3 | $ | (1.5 | ) | $ | 11.8 | ||||
Change in jewelry scrapping sales gross profit and other revenues | — | ||||||||||
Total change in net revenue | $ | 11.8 | |||||||||
(a) | Amount includes discrete tax adjustment in merchandise sales gross profit of $4.6 million ($4.4 million on a constant currency basis). | |||
PSC increased 17% (20% on a constant currency basis). The average ending monthly PLO balance per store during the current year increased 1% (2% on a constant currency basis). PSC includes a $1.1 million increase in revenue attributable to the receipt of previously escrowed seller funds as a result of settling certain indemnification claims with the sellers of GPMX. In the current year, we loaned the $1.1 million back to the seller of GPMX in exchange for a promissory note. The note bears interest at the rate of 2.89% per annum and is secured by certain marketable securities owned by the seller and held in a U.S. brokerage account. All principal and accrued interest is due and payable in April 2024.
Merchandise sales increased 11% (14% on a constant currency basis) primarily from newly acquired stores, reduced by a $4.6 million discrete transaction tax adjustment relating to prior periods. Excluding the discrete transaction tax adjustment, gross margin on merchandise sales was 29%, or 200 basis points, below the prior year. The lower merchandise sales margin was influenced by efforts to liquidate aged general merchandise as well as slightly more lenient underwriting to optimize the balance between PSC and sales gross profit. As a result of these factors, merchandise sales gross profit was down 9% to $25.0 million (6% to $25.9 million on a constant currency basis). Excluding the discrete transaction tax adjustment, merchandise sales gross profit increased 8% to $29.6 million (up 10% to $30.3 million on a constant currency basis).
Jewelry scrapping sales increased 12% (15% on a constant currency basis), with a 200 basis point decrease in margin to 7%. The slightly lower scrap margin reflects higher processing fees from a new refiner following the bankruptcy of our prior refiner, as well as our stores’ efforts to merchandise higher value jewelry in store rather than scrapping to obtain a higher overall gross profit.
Other segment expense included interest of $1.5 million related to the previously discussed discrete transaction tax adjustment.
28
Net revenue increased 9% (12% on a constant currency basis) in the current year. Excluding the discrete transaction tax adjustment, net revenues increased 14% (17% on a constant currency basis). Operations expense increased at a faster pace of 21% (23% on a constant currency basis). Of this increase, 11% was attributable to same stores and the remaining 10% was attributable to newly acquired or opened stores. At new stores, net revenue growth typically trails the growth in expenses until new stores begin to mature and until acquired stores are fully integrated and migrated to our operating metrics. Contributing to the overall increase in operating expenses was higher labor, energy and robbery/security costs, as well as increases in operating supplies at same stores and the cost of new licensing requirements in Mexico. We are investing in improved security features at higher risk stores to deter, thwart and limit the losses from future robbery attempts, not only to decrease direct robbery losses but to enhance the safety and comfort of our team members and customers.
Depreciation and amortization increased 54% (57% on a constant currency basis) from new and acquired stores and additional capital investment in existing and acquired operations following acquisition. Additionally, we recorded a $0.7 million reserve against a receivable deemed uncollectible from a refiner, consisting of a $1.5 million reserve recorded in the first quarter ended December 31, 2018 and a subsequent $0.8 million recovery in the second quarter of fiscal 2019 included in other segment expenses. These factors resulted in a decrease in segment contribution of $9.0 million or 27% ($8.1 million or 24% on a constant currency basis), including the impact of a $6.1 million discrete transaction tax adjustment.
Other International
The following table presents selected summary financial data from continuing operations for the Other International segment after translation to U.S. dollars from its reporting units’ functional currencies of primarily Canadian and Australian dollars:
Fiscal Year Ended September 30, | Percentage Change | ||||||||
2019 | 2018 | ||||||||
(in thousands) | |||||||||
Net revenues: | |||||||||
Consumer loan fees and interest | $ | 5,631 | $ | 8,120 | (31)% | ||||
Consumer loan bad debt | (2,338 | ) | (1,697 | ) | 38% | ||||
Net revenues | 3,293 | 6,423 | (49)% | ||||||
Segment operating expenses (income): | |||||||||
Operating expenses | 7,595 | 10,378 | (27)% | ||||||
Equity in net loss (income) of unconsolidated affiliates | 135 | (5,529 | ) | * | |||||
Segment operating (loss) income | (4,437 | ) | 1,574 | * | |||||
Impairment of investment | 19,725 | 11,712 | 68% | ||||||
Other segment expense (income) | 2,668 | (132 | ) | * | |||||
Segment loss | $ | (26,830 | ) | $ | (10,006 | ) | 168% | ||
* | Represents a percentage computation that is not mathematically meaningful. |
Segment loss of $26.8 million was $16.8 million greater than the prior year loss primarily due to:
• | Impairment of our investment in Cash Converters International in the amount of $19.7 million ($15.3 million, net of taxes); and |
• | A $5.7 million decrease in income from our unconsolidated affiliates including recognition of several discrete charges recognized by Cash Converters International; |
• | A $3.1 million decrease in net revenue as we continue to manage the product mix between installment loans and single-pay loans in Canada; and |
• | A $1.9 million charge from the expiration of a call option as a result of a third-party investment in Rich Data Corporation (“RDC”), our unconsolidated affiliate; partially offset by |
• | A $2.3 million decrease in costs to develop technology to drive future revenue enhancement as a result of the deconsolidation of RDC. |
29
Due partly to regulatory changes that became effective January 1, 2018, we added installment loan products in our Canada CASHMAX business to meet the needs of our customers. In addition to single-pay loans, all CASHMAX stores now offer installment loans with terms ranging from six to 18 months and average yields of 47% per annum. We recently decreased efforts to grow the installment loan balance and refocused on serving customers’ greater demand for single-pay loans and, as a result, have seen improved operating results in the latter half of fiscal 2019. We entered into a secured borrowing arrangement in November 2018 to provide up to CAD $25.0 million to fund originations of installment loans through November 2019 and have obtained $1.5 million in proceeds from the facility through September 30, 2019. See Note 8 of Notes to Consolidated Financial Statements included in “Part II, Item 8 — Financial Statements and Supplemental Data.”
Subsequent to September 30, 2019 (on October 21, 2019), Cash Converters International agreed to settle the sole remaining class action lawsuit previously lodged on behalf of borrowers residing in Queensland, Australia who took out personal loans from Cash Converters International between July 30, 2009 and June 30, 2013. Cash Converters International agreed to pay AUD $42.5 million, subject to court approval. We estimate recording a charge of approximately $10.0 million for our share of the settlement from Cash Converters International in fiscal 2020 related to this event, in addition to our regularly included share of their earnings. Cash Converters International has announced that it intends to fund the settlement with cash on hand and cash flow from operations. Though such increase in value does not affect the carrying value of our investment, shares in Cash Converters International increased from AUD $0.14 as of September 30, 2019 to AUD $0.245 as of October 30, 2019, representing an increase in value of our investment of $15.8 million during that period.
30
Other Items
The following table reconciles our consolidated segment contribution discussed above to net income attributable to EZCORP, Inc., including items that affect our consolidated financial results but are not allocated among segments:
Fiscal Year Ended September 30, | Percentage Change | ||||||||
2019 | 2018 | ||||||||
(in thousands) | |||||||||
Segment contribution | $ | 98,969 | $ | 125,876 | (21)% | ||||
Corporate expenses (income): | |||||||||
Administrative | 63,665 | 53,639 | 19% | ||||||
Depreciation and amortization | 10,432 | 8,363 | 25% | ||||||
Loss on sale or disposal of assets and other | 24 | 233 | (90)% | ||||||
Interest expense | 30,537 | 27,738 | 10% | ||||||
Interest income | (9,485 | ) | (14,422 | ) | (34)% | ||||
Other income | (378 | ) | (5,214 | ) | (93)% | ||||
Income from continuing operations before income taxes | 4,174 | 55,539 | (92)% | ||||||
Income tax expense | 2,406 | 18,389 | (87)% | ||||||
Income from continuing operations, net of tax | 1,768 | 37,150 | (95)% | ||||||
Loss from discontinued operations, net of tax | (457 | ) | (856 | ) | (47)% | ||||
Net income | 1,311 | 36,294 | (96)% | ||||||
Net loss attributable to noncontrolling interest | (1,230 | ) | (988 | ) | 24% | ||||
Net income attributable to EZCORP, Inc. | $ | 2,541 | $ | 37,282 | (97)% | ||||
Segment contribution decreased primarily due to a $19.7 million impairment of our investment in Cash Converters International, a $2.9 million charge included in our ordinary share of earnings from Cash Converters International, several discrete charges recorded by Cash Converters International and the impact of a $6.1 million discrete transaction tax adjustment in our Latin America Pawn segment.
Administrative expenses increased $10.0 million, or 19%, in the current year primarily due to $6.7 million of strategic investments in the Lana digital platform, due diligence expenses on acquisition opportunities ultimately abandoned, other professional fees and costs related to recruitment and compensation of additional members of our board of directors.
Depreciation and amortization expense increased $2.1 million, or 25%, primarily due to additional capitalized software costs, including the costs to develop our new point of sale system.
Interest expense increased $2.8 million, or 10%, primarily due to an increase in average debt outstanding during the current year compared to the prior year, offset by the reduction of interest expense on our 2019 Convertible Notes which were repaid on June 17, 2019. Effective interest rates on our outstanding convertible debt were approximately 8% to 9%. We expect interest expense to decrease in future periods due to the repayment of the 2019 Cash Convertible Notes. For additional information about our financing transactions, see “Note 8 of Notes to Consolidated Financial Statements included in “Part II, Item 8 — Financial Statements and Supplementary Data.”
Interest income decreased $4.9 million, or 34%, primarily due to the declining principal balance on the Grupo Finmart notes as they are repaid in accordance with their agreed amortization schedule and the reduction of interest earned on outstanding cash balances after repayment of our 2019 Convertible Notes in June 2019. The remainder of principal outstanding on the Grupo Finmart notes and the first installment ($6.0 million) of the deferred compensation fee were received by September 2019, reducing the amount of interest income recognized going forward. As of September 30, 2019, remaining amounts receivable under the Grupo Finmart notes receivable are $4.0 million in March 2020 and $4.0 million in September 2020, plus interest.
Other income in the prior year was comprised primarily of $5.2 million in net recoveries pertaining to a legal settlement.
31
Income taxes decreased $16.0 million due primarily to:
• | A $51.4 million decrease in income from continuing operations before income taxes; |
• | A discrete transaction tax adjustment with a tax benefit of $1.8 million in the current year; and |
• | A lower maximum U.S. corporate tax rate of 21% in the current year compared to a higher blended rate in the prior year; partially offset by |
• | A first quarter of fiscal 2018 charge related to the impacts of the U.S. Tax Cuts and Jobs Act of 2017; and |
• | A $3.1 million reduction in benefits associated with the expiration of a statute of limitations on uncertain tax positions. |
Income tax expense includes other items that do not necessarily correspond to pre-tax earnings and create volatility in our effective tax rate. These items include the impact of earnings and foreign tax credits from our equity investment in Cash Converters International, the net effect of state taxes, non-deductible items and changes in valuation allowances, the lapse of the statute of limitations of uncertain tax positions in the current year, as well as impacts from the new federal tax regime in the United States. See Note 10 of Notes to Consolidated Financial Statements included in “Part II, Item 8 — Financial Statements and Supplemental Data” for quantification of these items.
32
Fiscal 2018 vs. Fiscal 2017
Summary Financial Data
The following table presents selected summary consolidated financial data for fiscal 2018 and 2017.
Fiscal Year Ended September 30, | Change | ||||||||
2018 | 2017 | ||||||||
(in thousands) | |||||||||
Net revenues: | |||||||||
Pawn service charges | $ | 304,577 | $ | 273,077 | 12% | ||||
Merchandise sales | 438,372 | 414,838 | 6% | ||||||
Merchandise sales gross profit | 161,754 | 148,313 | 9% | ||||||
Gross margin on merchandise sales | 37 | % | 36 | % | 100 bps | ||||
Jewelry scrapping sales | 60,752 | 51,189 | 19% | ||||||
Jewelry scrapping sales gross profit | 8,462 | 7,258 | 17% | ||||||
Gross margin on jewelry scrapping sales | 14 | % | 14 | % | — | ||||
Other revenues, net | 6,758 | 6,859 | (1)% | ||||||
Net revenues | 481,551 | 435,507 | 11% | ||||||
Operating expenses | 414,427 | 382,468 | 8% | ||||||
Non-operating expenses | 11,585 | 10,361 | 12% | ||||||
Income from continuing operations before income taxes | 55,539 | 42,678 | 30% | ||||||
Income tax expense | 18,389 | 11,093 | 66% | ||||||
Income from continuing operations, net of tax | 37,150 | 31,585 | 18% | ||||||
Loss from discontinued operations, net of tax | (856 | ) | (1,825 | ) | (53)% | ||||
Net income | 36,294 | 29,760 | 22% | ||||||
Net loss attributable to noncontrolling interest | (988 | ) | (1,650 | ) | (40)% | ||||
Net income attributable to EZCORP, Inc. | $ | 37,282 | $ | 31,410 | 19% | ||||
Net pawn earning assets: | |||||||||
Pawn loans | $ | 198,463 | $ | 169,242 | 17% | ||||
Inventory, net | 166,997 | 154,411 | 8% | ||||||
Total net pawn earning assets | $ | 365,460 | $ | 323,653 | 13% | ||||
Net revenues for fiscal 2018 were $481.6 million compared to $435.5 million in the prior year, driven primarily by acquired stores. PSC increased 12% on a higher average PLO balance resulting from acquisitions and same store growth. Merchandise sales increased 6% with gross margin on merchandise sales improving 100 basis points to 37%, falling within our target range of 35-38%.
Total operating expenses increased $32.0 million, or 8%, primarily as a result of the acquisition of 196 pawn stores in Latin America during fiscal 2018. Total non-operating expenses increased $1.2 million, or 12%, primarily due to:
• | Impairment of our investment in Cash Converters International in the amount of $11.7 million ($9.2 million, net of taxes); partially offset by |
• | A $4.9 million increase in interest income on the Grupo Finmart notes receivable, in addition to ordinary accruals of interest and accretion of associated debt discounts; and |
• | A $5.0 million increase in other income primarily due to net recoveries from a legal settlement. |
33
Income taxes increased $7.3 million, or 66%, from $11.1 million in fiscal 2017 to $18.4 million in fiscal 2018. The overall increase in our tax expense was driven primarily by a 30% increase in our pre-tax earnings. Income tax expense in both periods includes other items that do not necessarily correspond to pre-tax earnings and create volatility in our effective tax rate. These items include the impact of earnings and foreign tax credits from our equity investment in Cash Converters International, the net effect of state taxes, non-deductible items and changes in valuation allowances. In addition, we were impacted by the Tax Cuts and Jobs Act of 2017 (the "Act") as well as the lapse of statutes of limitations on uncertain tax positions in the current year. That tax law change caused us to revalue our net deferred tax assets to reflect the lower U.S. federal tax rate at which deferred tax items are expected to reverse, partially offset by the expiration of statutes of limitations on some previously uncertain tax positions. See Note 10 of Notes to Consolidated Financial Statements included in “Part II, Item 8 — Financial Statements and Supplemental Data” for quantification of these items.
34
U.S. Pawn
The following table presents selected summary financial data from continuing operations for the U.S. Pawn segment:
Fiscal Year Ended September 30, | Change | ||||||||
2018 | 2017 | ||||||||
(in thousands) | |||||||||
Net revenues: | |||||||||
Pawn service charges | $ | 237,086 | $ | 238,645 | (1)% | ||||
Merchandise sales | 350,699 | 351,878 | —% | ||||||
Merchandise sales gross profit | 134,291 | 128,403 | 5% | ||||||
Gross margin on merchandise sales | 38 | % | 36 | % | 200 bps | ||||
Jewelry scrapping sales | 47,745 | 48,203 | (1)% | ||||||
Jewelry scrapping sales gross profit | 7,328 | 6,769 | 8% | ||||||
Gross margin on jewelry scrapping sales | 15 | % | 14 | % | 100 bps | ||||
Other revenues, net | 250 | 219 | 14% | ||||||
Net revenues | 378,955 | 374,036 | 1% | ||||||
Segment operating expenses: | |||||||||
Operations | 263,094 | 260,089 | 1% | ||||||
Depreciation and amortization | 12,869 | 10,171 | 27% | ||||||
Segment operating contribution | 102,992 | 103,776 | (1)% | ||||||
Other segment expenses | 271 | 179 | 51% | ||||||
Segment contribution | $ | 102,721 | $ | 103,597 | (1)% | ||||
Other data: | |||||||||
Net earning assets — continuing operations (a) | $ | 290,140 | $ | 280,673 | 3% | ||||
Inventory turnover | 1.9 | 2.1 | (0.2)x | ||||||
Average monthly ending pawn loan balance per store (b) | $ | 279 | $ | 280 | —% | ||||
Monthly average yield on pawn loans outstanding | 14 | % | 14 | % | — | ||||
Pawn loan redemption rate | 84 | % | 84 | % | — | ||||
(a) | Balance includes pawn loans and inventory. |
(b) | Balance is calculated based on the average of the monthly ending balance averages during the applicable period. |
35
Net revenue increased $4.9 million, or 1%, due to higher gross margins from our merchandise and jewelry scrapping sales. The increase in net revenue in fiscal 2018 attributable to same stores and new stores added/closed during the year is summarized as follows:
Change in Net Revenue | |||||||||||
Pawn Service Charges | Merchandise Sales Gross Profit | Total | |||||||||
(in millions) | |||||||||||
Same stores | $ | (1.9 | ) | $ | 5.2 | $ | 3.3 | ||||
Closed stores and other | 0.3 | 0.7 | 1.0 | ||||||||
Total | $ | (1.6 | ) | $ | 5.9 | $ | 4.3 | ||||
Change in jewelry scrapping sales gross profit and other revenues | 0.6 | ||||||||||
Total change in net revenue | $ | 4.9 | |||||||||
PSC decreased 1% due to a similar decrease in average PLO balances during fiscal 2018, with yield unchanged. PLO balances were negatively affected by Hurricanes Harvey and Irma near the end of fiscal 2017 and the relief funds provided by FEMA and others in the months following the storms, which partially mitigated our customers’ loan demand. Recovery of the loan balance continued throughout fiscal 2018.
Merchandise sales were flat, but gross margin on merchandise sales increased 200 basis points to 38%, resulting in a 5% improvement in merchandise sales gross profit to $134.3 million. The increase in gross margin was due to enhanced discipline in pricing and discounting.
Jewelry scrapping sales gross profit remained at 2% of current year net revenues, in-line with our strategy to sell rather than scrap merchandise, with a 100 basis point increase in gross margin to 15% due primarily to improvements in lending practices.
Operations expenses increased 1%, primarily due to the cost of labor, and depreciation and amortization increased 27% primarily as a result of additional capital expenditures associated with our store refresh initiatives and a discrete charge of $0.5 million for the retirement of certain assets.
As a result of these factors, segment contribution was down 1% to $102.7 million.
36
Latin America Pawn
The following table presents selected summary financial data from continuing operations for the Latin America Pawn segment, including constant currency results, after translation to U.S. dollars from its functional currency of the Mexican peso. See “Results of Operations — Non-GAAP Financial Information” above.
Fiscal Year Ended September 30, | |||||||||||||||
2018 (GAAP) | 2017 (GAAP) | Change (GAAP) | 2018 (Constant Currency) | Change (Constant Currency) | |||||||||||
(in thousands) | (in thousands) | ||||||||||||||
Net revenues: | |||||||||||||||
Pawn service charges | $ | 67,491 | $ | 34,432 | 96% | $ | 68,631 | 99% | |||||||
Merchandise sales | 87,673 | 62,957 | 39% | 87,485 | 39% | ||||||||||
Merchandise sales gross profit | 27,463 | 19,907 | 38% | 27,381 | 38% | ||||||||||
Gross margin on merchandise sales | 31 | % | 32 | % | (100) bps | 31 | % | (100) bps | |||||||
Jewelry scrapping sales | 13,007 | 2,986 | 336% | 13,011 | 336% | ||||||||||
Jewelry scrapping sales gross profit | 1,134 | 489 | 132% | 1,134 | 132% | ||||||||||
Gross margin on jewelry scrapping sales | 9 | % | 16 | % | (700) bps | 9 | % | (700) bps | |||||||
Other revenues | 85 | 645 | (87)% | 41 | (94)% | ||||||||||
Net revenues | 96,173 | 55,473 | 73% | 97,187 | 75% | ||||||||||
Segment operating expenses: | |||||||||||||||
Operations | 61,553 | 36,419 | 69% | 61,297 | 68% | ||||||||||
Depreciation and amortization | 4,068 | 2,675 | 52% | 4,085 | 53% | ||||||||||
Segment operating contribution | 30,552 | 16,379 | 87% | 31,805 | 94% | ||||||||||
Other segment income (a) | (2,609 | ) | (1,856 | ) | 41% | (2,400 | ) | 29% | |||||||
Segment contribution (loss) | $ | 33,161 | $ | 18,235 | 82% | $ | 34,205 | 88% | |||||||
Other data: | |||||||||||||||
Net earning assets — continuing operations (b) | $ | 75,320 | $ | 42,952 | 75% | $ | 76,804 | 79% | |||||||
Inventory turnover | 2.7 | 2.4 | 0.3x | 2.7 | 0.3x | ||||||||||
Average monthly ending total pawn loan balances per store (c) | $ | 90 | $ | 74 | 22% | $ | 91 | 23% | |||||||
Monthly average yield on pawn loans outstanding | 15 | % | 16 | % | (100) | 16 | % | — | |||||||
Pawn loan redemption rate (d) | 79 | % | 78 | % | 100 bps | 79 | % | 100 bps | |||||||
(a) | Fiscal 2018 constant currency amount excludes $0.2 million of net GAAP basis foreign currency transaction gains resulting from movement in exchange rates. The net foreign currency transaction gains for fiscal 2017 were $0.1 million and are included in the above results. | |||
(b) | Balance includes pawn loans and inventory. | |||
(c) | Balance is calculated based on the average of the monthly ending balance averages during the applicable period. | |||
(d) | Rate is solely inclusive of results from Empeño Fácil. | |||
During fiscal 2018, we increased our store count in Latin America by 84% through the acquisition of a total of 196 stores and the opening of 12 de novo stores. The acquisitions strengthened our position in Mexico and provided our first entry into Guatemala, El Salvador, Honduras and Peru. See “Part I, Item 1 — Business — Growth and Expansion.” As a result of these initiatives, combined with strong same store results, net revenue increased $40.7 million, or 73% (up $41.7 million, or 75%, on
37
a constant currency basis). The increase in net revenue attributable to same stores and new stores added/closed during the year is summarized as follows:
Change in Net Revenue (GAAP) | |||||||||||
Pawn Service Charges | Merchandise Sales Gross Profit | Total | |||||||||
(in millions) | |||||||||||
Same stores | $ | 2.9 | $ | 1.8 | $ | 4.7 | |||||
New stores and other | 30.1 | 5.8 | 35.9 | ||||||||
Total | $ | 33.0 | $ | 7.6 | $ | 40.6 | |||||
Change in jewelry scrapping sales gross profit and other revenues | 0.1 | ||||||||||
Total change in net revenue | $ | 40.7 | |||||||||
Change in Net Revenue (Constant Currency) | |||||||||||
Pawn Service Charges | Merchandise Sales Gross Profit | Total | |||||||||
(in millions) | |||||||||||
Same stores | $ | 4.3 | $ | 1.7 | $ | 6.0 | |||||
New stores and other | 29.9 | 5.8 | 35.7 | ||||||||
Total | $ | 34.2 | $ | 7.5 | $ | 41.7 | |||||
Change in jewelry scrapping sales gross profit and other revenues | — | ||||||||||
Total change in net revenue | $ | 41.7 | |||||||||
PSC was up 96% (99% on a constant currency basis) primarily due to the addition of acquired stores discussed above and same store growth. Including the impact of new and acquired stores and foreign currency movements, the average PLO balance per store during fiscal 2018 increased 22%. Same store PSC grew 11% on a 9% growth in average same store PLO.
Merchandise sales were up 39% on both a GAAP and a constant currency basis, with gross margin on merchandise sales of 31%, 100 basis points below the prior year. As a result of the combination of these effects, offset by foreign currency impacts, merchandise sales gross profit was up 38% to $27.5 million (38% to $27.4 million on a constant currency basis).
Jewelry scrapping sales increased 336% (GAAP and constant currency) with a 700 basis point decline in margin, primarily due to the results of the acquired stores discussed above.
Though we have steadily increased their general merchandise business since acquisition, the 112 GPMX stores acquired in Guatemala, El Salvador, Honduras and Peru in October 2017 have a higher concentration of pawn loans collateralized by gold jewelry than our stores in Mexico, and they scrap a greater portion of any jewelry loan defaults than our other stores. This relationship drove the larger increase in total Latin America PSC and jewelry scrapping sales in relation to the smaller increase in in-store merchandise sales.
We leveraged a 73% increase in net revenue (75% on a constant currency basis) into an 87% increase in segment operating contribution (94% increase on a constant currency basis) due to greater operational leverage from the addition of the acquired stores, resulting in only a 69% increase (68% on a constant currency basis) in operations expenses. After a $0.8 million improvement in other segment income, primarily interest income from our peso-denominated note receivable, segment contribution increased 82% to $33.2 million (up 89% to $34.4 million on a constant currency basis).
See Note 2 of Notes to Consolidated Financial Statements included in “Part II, Item 8 — Financial Statements and Supplemental Data” for quantification of revenue and net income attributable to the fiscal 2018 acquisitions.
38
Other International
The following table presents selected summary financial data from continuing operations for the Other International segment after translation to U.S. dollars from its reporting units’ functional currencies of primarily Canadian and Australian dollars:
Fiscal Year Ended September 30, | Percentage Change | ||||||||
2018 | 2017 | ||||||||
(in thousands) | |||||||||
Net revenues: | |||||||||
Consumer loan fees and interest | $ | 8,120 | $ | 7,986 | 2% | ||||
Consumer loan bad debt | (1,697 | ) | (1,988 | ) | (15)% | ||||
Net revenues | 6,423 | 5,998 | 7% | ||||||
Segment operating expenses: | |||||||||
Operating expenses | 10,378 | 8,639 | 20% | ||||||
Equity in net income of unconsolidated affiliate | (5,529 | ) | (4,916 | ) | 12% | ||||
Segment operating income | 1,574 | 2,275 | (31)% | ||||||
Impairment of investment | 11,712 | — | * | ||||||
Other segment income | (132 | ) | (96 | ) | 38% | ||||
Segment (loss) income | $ | (10,006 | ) | $ | 2,371 | * | |||
* | Represents a percentage computation that is not mathematically meaningful. |
Segment loss was $10.0 million, a decrease of $12.4 million from the prior year primarily due to:
• | Impairment of our investment in Cash Converters International in the amount of $11.7 million ($9.2 million, net of taxes) related to shares acquired prior to fiscal 2018; and |
• | A $1.7 million increase in operating expenses, including further investment in the development of technology to drive future revenue enhancement. |
39
Other Items
The following table reconciles our consolidated segment contribution discussed above to net income attributable to EZCORP, Inc., including items that affect our consolidated financial results but are not allocated among segments:
Fiscal Year Ended September 30, | Percentage Change | ||||||||
2018 | 2017 | ||||||||
(in thousands) | |||||||||
Segment contribution | $ | 125,876 | $ | 124,203 | 1% | ||||
Corporate expenses (income): | |||||||||
Administrative | 53,639 | 53,492 | —% | ||||||
Depreciation and amortization | 8,363 | 10,624 | (21)% | ||||||
Loss on sale or disposal of assets and other | 233 | 27 | 763% | ||||||
Interest expense | 27,738 | 27,794 | —% | ||||||
Interest income | (14,422 | ) | (10,173 | ) | 42% | ||||
Other income | (5,214 | ) | (239 | ) | 2,082% | ||||
Income from continuing operations before income taxes | 55,539 | 42,678 | 30% | ||||||
Income tax expense | 18,389 | 11,093 | 66% | ||||||
Income from continuing operations, net of tax | 37,150 | 31,585 | 18% | ||||||
Loss from discontinued operations, net of tax | (856 | ) | (1,825 | ) | (53)% | ||||
Net income | 36,294 | 29,760 | 22% | ||||||
Net loss attributable to noncontrolling interest | (988 | ) | (1,650 | ) | (40)% | ||||
Net income attributable to EZCORP, Inc. | $ | 37,282 | $ | 31,410 | 19% | ||||
Administrative expenses increased $0.1 million, as we focused on controlling administrative expenditures despite the growth of the business.
Depreciation and amortization expense decreased $2.3 million, or 21%, primarily due to acceleration of depreciation in the prior year for certain assets resulting from a decrease in useful life estimates.
Interest expense was flat due to the net effect of the following financing transactions:
• | The May 2018 issuance of $172.5 million aggregate principal amount of 2.375% Senior Convertible Notes Due 2025, including accruals of interest and amortization of associated discounts and deferred financings costs; |
• | Extinguishment of debt and other costs of $5.3 million in fiscal 2017 as a result of retiring $35 million principal amount of our 2.125% Senior Cash Convertible Notes Due 2019 and the entirety of our $100 million Term Loan Facility in July 2017; and |
• | The July 2017 issuance of $143.8 million aggregate principal amount of 2.875% Senior Convertible Notes Due 2024, including accruals of interest and amortization of associated discounts and deferred financings costs. |
For additional information about our financing transactions, see “Note 8 of Notes to Consolidated Financial Statements included in “Part II, Item 8 — Financial Statements and Supplementary Data.”
Interest income increased $4.2 million, or 42%, primarily as a result of our notes receivable from the sale of Grupo Finmart, which were restructured in September 2017, including ordinary accruals of interest in addition to accretion of associated deferred compensation amounts. Throughout the year, Grupo Finmart made timely monthly principal and interest payments on the notes in accordance with the amortization schedule. Excess cash on hand has generated incremental interest income.
Other income included primarily $5.2 million in net recoveries received in connection with the settlement of a derivative lawsuit that was initiated in fiscal 2014 and settled in the third quarter of fiscal 2018.
Income taxes increased $7.3 million, or 66%, from $11.1 million in fiscal 2017 to $18.4 million in fiscal 2018. The overall increase in our tax expense was driven primarily by an increase in our pre-tax earnings from $42.7 million to $55.5 million. Income tax expense includes other items that do not necessarily correspond to pre-tax earnings and create volatility in our effective tax rate. These items include the impact of earnings and foreign tax credits from our equity investment in Cash
40
Converters International, the net effect of state taxes, non-deductible items and changes in valuation allowances, the lapse of the statutes of limitations of uncertain tax positions in the current year, as well as impacts from the new federal tax in the United States.
On December 22, 2017, the Act was signed into law. Among other things, the Act reduced the U.S. federal corporate tax rate from 35% to 21%, required companies to pay a one-time transition tax on earnings of certain foreign subsidiaries that were previously tax deferred and created new taxes on certain foreign sourced earnings. The corporate tax rate reduction was effective January 1, 2018 and, accordingly, reduced our fiscal 2018 federal statutory rate to a blended rate of 24.5%, with a further reduction to 21% beginning in fiscal 2019 as a result of our fiscal year ending September 30. As of September 30, 2018, we finalized amounts previously estimated related to the impact of the Act. We recognized a $2.1 million charge for the revaluation of our deferred tax assets and liabilities to the reduced tax rate upon enactment of the Act. In addition, we recorded a charge of approximately $2.6 million to record a valuation allowance against foreign tax credit carryforwards which fail to meet the “more likely than not” threshold to be utilized as a result of changes in tax law enacted as part of the Act. Both items are included as components of "Income tax expense" in our consolidated statements of operations in fiscal 2018. We believe we have adequate foreign tax credits to fully offset any transition tax on the total post-1986 foreign earnings and profit of our foreign subsidiaries as required under the Act.
See Note 10 of Notes to Consolidated Financial Statements included in “Part II, Item 8 — Financial Statements and Supplemental Data” for quantification of these items.
Loss from discontinued operations was primarily comprised of the write-off of balances from a discontinued business which we previously anticipated to collect.
Liquidity and Capital Resources
Cash Flows
The table and discussion below present a summary of the sources and uses of our cash:
Fiscal Year Ended September 30, | Percentage Change | ||||||||
2019 | 2018 | ||||||||
(in thousands) | |||||||||
Cash flows from operating activities | $ | 103,517 | $ | 88,981 | 16% | ||||
Cash flows from investing activities | (27,829 | ) | (134,206 | ) | 79% | ||||
Cash flows from financing activities | (198,317 | ) | 167,588 | * | |||||
Effect of exchange rate changes on cash and cash equivalents | (507 | ) | (654 | ) | 22% | ||||
Net (decrease) increase in cash and cash equivalents | $ | (123,136 | ) | $ | 121,709 | * | |||
* | Represents a percentage computation that is not mathematically meaningful. | |||
Change in Cash and Cash Equivalents for Fiscal 2019 vs. Fiscal 2018
The increase in cash flows from operating activities was due to a $26.3 million change in operating assets and liabilities as we enhanced efforts to efficiently manage working capital, offset by an $11.7 million decrease in net income plus several non-cash items. We expect some reduction in cash flow in the first quarter of fiscal 2020 compared to the comparable prior-year quarter, as we repaid certain accounts payable shortly after September 30, 2019.
The increase in cash flows from investing activities was due to an $85.0 million decrease in net cash paid for acquisitions, $14.0 million paid for the purchase of additional shares in Cash Converters International in the prior year, a $1.6 million decrease in net additions to property and equipment as well as capitalized labor, a $4.0 million decrease in net investments related to loan activities and a $1.7 million increase in principal collections from our Grupo Finmart notes receivable.
The decrease in cash flows from financing activities was due primarily to repayment of $195.0 million of our 2.125% Cash Convertible Senior Notes Due 2019 in June 2019, the May 2018 issuance of our $172.5 million aggregate principal amount of 2.375% Convertible Senior Notes Due 2025 and a $3.0 million increase in cash paid for employee net share settlement of individual tax liabilities on vested share-based awards.
The net effect of these and other smaller items was a $123.1 million decrease in cash on hand at September 30, 2019, providing a $157.6 million ending cash balance, exclusive of restricted cash. As of September 30, 2019, our primary source of liquidity was $157.6 million in cash and cash equivalents and cash flows from operations. Of this amount, approximately 20%, or $30.8 million, was held by foreign subsidiaries and is not available to fund domestic operations, portions of which we may be unable
41
to repatriate without incurring foreign withholding taxes. Cash flows from discontinued operations are aggregated with cash flows from continuing operations in the statements of cash flows.
Sources and Uses of Cash
In December 2019, our Board of Directors authorized the repurchase of up to $60.0 million of our Class A Non-voting Common Stock over the three years following plan adoption. We anticipate that cash flow from operations and cash on hand will be adequate to fund any fiscal 2020 portion of such repurchases, our contractual obligations, planned de novo store growth, capital expenditures and working capital requirements through fiscal 2020. We continue to explore accretive acquisition opportunities, both large and small, and may choose to pursue additional debt, equity or equity-linked financings in the future should the need arise.
Acquisitions
For a description of acquisitions completed, see Note 2 of Notes to Consolidated Financial Statements included in “Part II, Item 8 — Financial Statements and Supplementary Data.”
Capital Expenditures
Capital expenditures during fiscal 2019 included a) expenditures related to the development of Lana and strategic initiatives to leverage customer data into improved underwriting and pricing decisions, b) our point of sale system upgrade to improve employee and customer experience for processing pawn transactions and c) other store expenditures. Capital expenditures during fiscal 2018 included expenditures related to store refreshes in the United States to modernize the layout of certain stores and improve customer experience.
Convertible Notes
In June 2019, we repaid $195.0 million of 2.125% Cash Convertible Senior Notes Due 2019 at maturity using cash on hand.
In May 2018, we issued $172.5 million aggregate principal amount of 2.375% Convertible Senior Notes Due 2025 (the “2025 Convertible Notes”). Net proceeds from the offering, after deducting discounts and expenses, were approximately $167 million, which were added to our cash balances and were available for general corporate purposes, including potentially funding acquisitions and repaying existing indebtedness.
For a description of the terms of our convertible notes, including the associated conversion and other related features and transactions, see Note 8 of Notes to Consolidated Financial Statements included in “Part II, Item 8 — Financial Statements and Supplementary Data.”
Depending on the level of acquisition activity and other factors, our ability to repay our longer term debt obligations, including the convertible debt maturing in 2024 and 2025, may require us to refinance these obligations through the issuance of new debt securities, equity securities, convertible securities or through new credit facilities.
Investments in Unconsolidated Affiliates
In June 2018, we acquired 57,631,230 additional shares of Cash Converters International for $14.0 million, increasing our ownership from 31.75% to 34.75%. We acquired these shares in connection with an underwritten placement of approximately 123.3 million shares for AUD $39.5 million, excluding transaction costs. Cash Converters International used the proceeds from the offering to reduce outstanding indebtedness and provide additional capital to pursue growth opportunities while maintaining working capital.
Prior to its third-party capital raise in fiscal 2019, we consolidated the results of Rich Data Corporation (“RDC”). Upon its 2019 capital raise, our ownership was reduced to 13.14% of its outstanding stock and we retained one board seat. Following the equity method of accounting upon that capital raise, we recorded $8.3 million of previous investments in RDC as a portion of “Investments in Unconsolidated Affiliates.” Although this increased the recorded balance of unconsolidated affiliates at that date, we incurred no cash flows at that point beyond amounts previously funded to RDC while it was consolidated.
Grupo Finmart Notes
In connection with the sale of Grupo Finmart to Alpha Holding, S.A. de C.V. (“AlphaCredit”) in September 2016, Grupo Finmart issued two promissory notes (the “Parent Loan Notes”) to us in the aggregate principal amount of $60.2 million. The repayment terms of the Parent Loan Notes were amended in September 2017, and since that time, we have received all scheduled payments when due. As of September 30, 2019, $8.0 million of deferred compensation fees remains outstanding on
42
the Parent Loan Notes, $4.0 million of which is due on March 27, 2020 and the remaining $4.0 million of which is due on September 27, 2020.
We remain obligated to indemnify AlphaCredit for any tax obligations arising from the Grupo Finmart business that are attributable to periods prior to the completion of the sale in September 2016, referred to as “pre-closing taxes.” Those obligations continue until the expiration of the statute of limitations applicable to the pre-closing periods. In August 2019, AlphaCredit notified us of a potential indemnity claim for pre-closing taxes, but the nature, extent and validity of such claim has yet to be determined.
Contractual Obligations
Below is a summary of our cash needs to meet future aggregate contractual obligations as of September 30, 2019:
Payments due by Period | |||||||||||||||||||
Contractual Obligations | Total | Less than 1 year | 1-3 years | 3-5 years | More than 5 years | ||||||||||||||
(in thousands) | |||||||||||||||||||
Debt obligations (a) | $ | 317,976 | $ | 214 | $ | 1,064 | $ | 144,198 | $ | 172,500 | |||||||||
Interest on long-term debt obligations | 45,834 | 8,481 | 16,756 | 16,500 | 4,097 | ||||||||||||||
Operating and other lease obligations (b) | 267,886 | 69,291 | 107,308 | 52,031 | 39,256 | ||||||||||||||
Total (c) (d) | $ | 631,696 | $ | 77,986 | $ | 125,128 | $ | 212,729 | $ | 215,853 | |||||||||
(a) | Excludes debt discount and deferred financing costs as well as convertible features. |
(b) | Excludes $12.6 million in sublease payments expected to be received. |
(c) | No provision for uncertain tax benefits has been included as the timing of any such payment is uncertain. See Note 10 of Notes to Consolidated Financial Statements included in “Part II, Item 8 — Financial Statements and Supplemental Data.” Additionally, no provision for insurance reserves, deferred compensation arrangements, or other liabilities totaling $4.7 million has been included as the timing of such payments are uncertain. |
(d) | Total excludes contractual obligations already recorded on our consolidated balance sheets as current liabilities, except for the accrued portions of interest and lease obligations which are included in interest on long-term debt obligations and operating and other lease obligations captions above. |
In addition to the operating lease obligations in the table above, we are responsible for the maintenance, property taxes and insurance at most of our locations. During the fiscal year ended September 30, 2019, these collectively amounted to $22.5 million.
Critical Accounting Policies and Estimates
The preparation of financial statements in accordance with accounting principles generally accepted in the United States (“GAAP”) requires us to make estimates and assumptions that affect the reported amounts of assets, liabilities, revenues and expenses, and related disclosure of contingent assets and liabilities. On an on-going basis, we evaluate our estimates and judgments, including those related to revenue recognition, inventory, long-lived and intangible assets, income taxes, contingencies and litigation. We base our estimates on historical experience, observable trends and various other assumptions that we believe to be reasonable under the circumstances. We use this information to make judgments about the carrying values of assets and liabilities that are not readily apparent from other sources. Actual results may differ from the estimates under different assumptions or conditions.
The critical accounting policies and estimates that could have a significant impact on our results of operations, as well as relevant recent accounting pronouncements, are described in Note 1 of Notes to Consolidated Financial Statements included in “Part II, Item 8 — Financial Statements and Supplemental Data.” Certain accounting policies regarding the quantification of the sensitivity of certain critical estimates are discussed further below.
Pawn Loan Revenue Recognition
We record PSC using the effective interest method over the life of the loan for all pawn loans we believe to be collectible. We base our estimate of collectible loans on several inputs, including recent redemption rates, historical trends in redemption rates and the amount of loans due in the following months. Unexpected variations in any of these factors could change our estimate of collectible loans, affecting our earnings and financial condition. As of September 30, 2019, the balance of our PSC receivable was $31.8 million. Assuming the average forfeiture rate increased or decreased by 10%, our pawn service charges receivable balance as of September 30, 2019 would have increased or decreased by approximately $1.9 million.
43
Inventory and Cost of Goods Sold
We consider our estimates of obsolete or slow-moving inventory and shrinkage estimates in determining the appropriate overall valuation allowance for inventory. We monitor our sales margins for each type of inventory on an ongoing basis and compare to historical margins. Significant variances in those margins may require a revision to future inventory reserve estimates. We have historically revised our reserve estimates pertaining to jewelry inventory depending on the current price of gold and resulting trends in margins. Future declines in gold prices may cause an increase in reserve rates pertaining to jewelry inventory. As of September 30, 2019, the gross balance of our inventory was $189.1 million for which we have included reserves of $9.7 million. Assuming the reserve rates were increased or decreased by 1%, our inventory reserve balance as of September 30, 2019 would have increased or decreased by approximately $0.3 million.
Notes Receivable
In September 2017, we restructured our remaining outstanding notes receivable from the sale of Grupo Finmart and accounted for such restructuring as new notes for which the modification was more than minor, recognizing $3.0 million of remaining discount as a gain, included under “Interest income” in our consolidated statements of operations. As part of the restructuring of the notes receivable, we negotiated a deferred compensation amount of up to $14.0 million which we are accounting for as “Interest income” under the effective interest method by adjusting the underlying basis of the notes accordingly, accreting to its ultimate estimated settlement amount through September 2020. We review the payment history, creditworthiness, projected cash flows and related assumptions of Grupo Finmart and AlphaCredit (the parent guarantor), as applicable, in determining whether the remainder of the deferred compensation amounts are collectible. Through the date of this report, we have received all monthly principal, interest and deferred compensation payments on these restructured notes receivable as contractually obligated. We regularly monitor and evaluate the timeliness of payments and other inputs to the valuation of the notes.
Goodwill and Other Intangible Assets
We perform our impairment analyses utilizing the income approach. This approach uses future cash flows and estimated terminal values for each of our reporting units (discounted using a market participant perspective) to determine the fair value of each reporting unit, which is then compared to the carrying value of the reporting unit to determine if there is an impairment. We have determined that our reporting units are equivalent to our operating segments for fiscal 2019. The income approach includes assumptions about revenue growth rates, operating margins and terminal growth rates discounted by an estimated weighted-average cost of capital derived from other publicly traded companies that are similar but not identical from an operational and economic standpoint. We use discount rates that are commensurate with the risks and uncertainties inherent in the respective businesses and in our internally developed forecasts. Discount rates used in fiscal 2019 goodwill valuations ranged from 10% to 15% similar to rates used in fiscal 2018. In testing other intangible assets for potential impairment, we apply key assumptions that are consistent with those utilized in our goodwill impairment test.
The excess of the estimated fair value over carrying value for each of our reporting units as of the annual testing date ranged from 7% to 45%. In order to evaluate the sensitivity of the fair value calculations used in the goodwill impairment test, the Company applied a hypothetical 10% decrease to the fair values of each reporting unit and compared those hypothetical values to the reporting unit carrying values. Based on this hypothetical 10% decrease, the excess of the estimated fair value over carrying value for each of our reporting units ranged from negative 4% to positive 31%. Assuming the hypothetical 10% decrease, the negative 4% could result in a potential impairment of the $34.5 million in goodwill recorded in our “GPMX” reporting unit within our Latin America reporting segment. Changes in the economic conditions or the regulatory environment could negatively affect our key assumptions. Future negative developments could include a decline in loan portfolio performance, merchandise sales or demand for our products, a decline in precious metal commodity values, or inflation in costs relative to revenues.
We may perform a qualitative assessment in making our determination of whether it is more likely than not that goodwill and other intangible assets are impaired under appropriate accounting guidance on an annual basis in future reporting periods. In addition to the assumptions discussed above pertaining to the income approach, we consider the assessment of potential triggering events to be a critical estimate.
Income Taxes
Management believes that it is more likely than not that forecasted income, including income that may be generated as a result of certain tax planning strategies, together with future reversals of existing taxable temporary differences, will be sufficient to fully recover the net recorded deferred tax assets. In the event that we determine all or part of the net deferred tax assets are not realizable in the future, we will make an adjustment to the valuation allowance that would be charged to earnings in the period such determination is made. We have included valuation allowances against deferred tax assets for net operating losses and tax credits not expected to be utilized based on specific facts and estimates for each jurisdiction.
44
We consider the earnings of certain non-U.S. subsidiaries to be indefinitely invested outside the United States on the basis of estimates that future domestic cash generation will be sufficient to meet future domestic cash needs and our specific plans for reinvestment of those subsidiary earnings. We have not recorded a deferred tax liability related to foreign withholding taxes of our undistributed earnings of foreign subsidiaries indefinitely invested outside the U.S.
We may be subject to income tax audits by the respective tax authorities in any or all of the jurisdictions in which we operate or have operated within a relevant period. Significant judgment is required in determining uncertain tax positions. We utilize the required two-step approach to recognize and measure uncertain tax positions. The first step is to evaluate the tax position for recognition by determining if the weight of available evidence indicates it is more likely than not that the position will be sustained on audit, including resolution of related appeals or litigation processes. The second step is to measure the tax benefit as the largest amount that is more than 50% likely to be realized upon ultimate settlement. We consider many factors when evaluating and estimating our tax positions and tax benefits, which may require periodic adjustments and which may not accurately forecast actual outcomes. We adjust these reserves in light of changing facts and circumstances, such as the closing of an audit or the refinement of an estimate. Changes in recognition or measurement are reflected in the period in which the change in judgment occurs. We believe adequate provisions for income taxes have been made for all periods.
Cautionary Statement Regarding Risks and Uncertainties That May Affect Future Results
This Annual Report on Form 10-K, including Management’s Discussion and Analysis of Financial Condition and Results of Operations, includes “forward-looking statements” within the meaning of Section 27A of the Securities Act of 1933 and Section 21E of the Securities Exchange Act of 1934. We intend that all forward-looking statements be subject to the safe harbors created by these laws. All statements, other than statements of historical facts, regarding our strategy, future operations, financial position, future revenues, projected costs, prospects, plans and objectives are forward-looking statements. The words “may,” "can," “should,” “could,” “will,” "would," “predict,” “anticipate,” “believe,” “estimate,” “expect,” “intend,” “plan,” “project” and similar expressions are intended to identify forward-looking statements, although not all forward-looking statements contain these identifying words. Such statements are only predictions of the outcome and timing of future events based on our current expectations and currently available information. Actual results could differ materially from those expressed in the forward-looking statements due to a number of risks and uncertainties, many of which are beyond our control. Accordingly, you should not regard any forward-looking statement as a representation that the expected results will be achieved. When considering forward-looking statements, you should keep in mind the risk factors and other cautionary statements in this report. Such risks and uncertainties include, among other things:
• | The identified material weakness in our internal control over financial reporting; |
• | Changes in laws and regulations; |
• | Negative characterizations of our industry; |
• | Concentration of business in Texas and Florida; |
• | Changes in the business, regulatory, political or social climate in Latin America; |
• | Changes in gold prices or volumes; |
• | Changes in foreign currency exchange rates; |
• | Changes in pawn redemption rates, loan default and collection rates or other important operating metrics; |
• | Our ability to continue growing our store count through acquisitions and de novo openings; |
• | Our ability to successfully develop and commercialize a digital transaction and lending services platform; |
• | Our ability to recruit, hire, retain and motivate talented executives and key employees; |
• | Ability to collect the remaining balance of Grupo Finmart notes and exposure to Grupo Finmart for continuing indemnification obligations for pre-closing taxes; |
• | The outcome of current or future litigation and regulatory proceedings; |
• | Our controlled ownership structure; |
• | Potential disruptive effect of acquisitions, investments and new businesses; |
45
• | Potential regulatory fines and penalties, lawsuits and related liabilities related to firearms business; |
• | Potential robberies, burglaries and other crimes at our stores; |
• | Potential exposure under anti-corruption, anti-bribery, anti-money laundering and other general business laws and regulations; |
• | Changes in liquidity, capital requirements or access to debt and capital markets; |
• | Changes in the competitive landscape; |
• | Our ability to design or acquire, deploy and maintain adequate information technology and other business systems; |
• | Potential data security breaches or other cyber-attacks; |
• | Failure to achieve adequate return on investments; |
• | Potential uninsured property, casualty or other losses; |
• | Potential natural disasters; |
• | Potential civil unrest or government overthrow; |
• | Events beyond our control; |
• | Changes in U.S. or international tax laws; |
• | Financial statement impact of potential impairment of goodwill or other intangible assets such as trade names; |
• | Potential conversion of Convertible Notes into cash (which could adversely affect liquidity) or stock (which will cause dilution of existing stockholders); and |
• | Limited number of unreserved shares available for future issuance. |
For a discussion of these important risk factors, see "Part I, Item 1A — Risk Factors."
In addition, we cannot predict all of the risks and uncertainties that could cause our actual results to differ from those expressed in the forward-looking statements. You should not place undue reliance on our forward-looking statements. Although forward-looking statements reflect our good faith beliefs, forward-looking statements involve known and unknown risks, uncertainties and other factors, which may cause our actual results, performance or achievements to differ materially from anticipated future results, performance or achievements expressed or implied by such forward-looking statements. Accordingly, you should not regard any forward-looking statements as a representation that the expected results will be achieved.
We specifically disclaim any responsibility to publicly update any information contained in a forward-looking statement except as required by law. All forward-looking statements attributable to us are expressly qualified in their entirety by this cautionary statement.
ITEM 7A — QUANTITATIVE AND QUALITATIVE DISCLOSURES ABOUT MARKET RISK
Market Risk Disclosures
We are exposed to market risk related primarily to gold values and changes in foreign currency exchange rates.
Our earnings and financial position are affected by changes in gold values, and to a lesser extent silver and precious stone values, and the resulting impact on pawn lending, jewelry sales and jewelry cost of goods sold. The proceeds of scrap sales and our ability to sell jewelry inventory at an acceptable margin depend on gold values. The impact on our financial position and results of operations of a hypothetical change in gold values cannot be reasonably estimated due to the timing of scrap sales, among other operational considerations.
Our earnings and financial position are affected by foreign exchange rate fluctuations related to our equity investments and our operations outside the U.S. While we generally do not seek to hedge amounts in foreign currencies, we consider hedging strategies from time to time to mitigate certain discrete risks of exposure via short term arrangements.
The translation adjustment from Cash Converters International through June 30, 2019 (included in our September 30, 2019 results on a three-month lag) was a $3.4 million decrease to stockholders’ equity, excluding income tax impacts. During the
46
fiscal year ended September 30, 2019, the Australian dollar weakened approximately 6.5% to $1.00 Australian to $0.6754 U.S. from $0.7225 U.S. as of September 30, 2018.
The translation adjustment from Latin America primarily representing the change of the Mexican peso during the year ended September 30, 2019 was a $7.4 million decrease to stockholders’ equity. During the fiscal year ended September 30, 2019, the Mexican peso weakened approximately 5.2% to $1.00 Mexican to $0.0507 U.S. from $0.0535 U.S. as of September 30, 2018. During the fiscal year ended September 30, 2019, the Guatemalan quetzal strengthened approximately 0.1% to Q1.00 Guatemalan to $0.1324 U.S. from $0.1323 U.S. as of September 30, 2018. We have currently assumed indefinite reinvestment of earnings and capital in Latin America. Accumulated translation gains or losses related to any future repatriation of earnings or capital would impact our earnings in the period of repatriation.
To a lesser degree, our operations are affected by fluctuations in the exchange rate of the Honduran lempira and the Peruvian sol.
The translation adjustment from our Canadian operations representing the weakening of the Canadian dollar during the year ended September 30, 2019 was a $0.3 million decrease to stockholders’ equity. During the fiscal year ended September 30, 2019, the Canadian dollar weakened approximately 2.6% to $1.00 Canadian to $0.7553 U.S. from $0.7755 U.S. as of September 30, 2018.
We cannot predict the future valuation of foreign currencies or how further movements in exchange rates could affect our future earnings or financial position due to the interrelationship of operating results and exchange rates.
47
ITEM 8 — FINANCIAL STATEMENTS AND SUPPLEMENTARY DATA
Index to Consolidated Financial Statements
Page | |
48
Report of Independent Registered Public Accounting Firm
Stockholders and Board of Directors
EZCORP, Inc.
Rollingwood, Texas
Opinion on the Consolidated Financial Statements
We have audited the accompanying consolidated balance sheets of EZCORP, Inc. (the “Company”) and subsidiaries as of September 30, 2019 and 2018, and the related consolidated statements of operations and comprehensive (loss) income, stockholders’ equity, and cash flows for each of the three years in the period ended September 30, 2019, and the related notes (collectively referred to as the “consolidated financial statements”). In our opinion, the consolidated financial statements present fairly, in all material respects, the financial position of the Company at September 30, 2019 and 2018, and the results of its operations and its cash flows for each of the three years in the period ended September 30, 2019, in conformity with accounting principles generally accepted in the United States of America.
We also have audited, in accordance with the standards of the Public Company Accounting Oversight Board (United States) (“PCAOB”), the Company’s internal control over financial reporting as of September 30, 2019, based on criteria established in Internal Control - Integrated Framework (2013) issued by the Committee of Sponsoring Organizations of the Treadway Commission (“COSO”) and our report dated December 5, 2019 expressed an adverse opinion thereon.
Basis for Opinion
These consolidated financial statements are the responsibility of the Company’s management. Our responsibility is to express an opinion on the Company’s consolidated financial statements based on our audits. We are a public accounting firm registered with the PCAOB and are required to be independent with respect to the Company in accordance with the U.S. federal securities laws and the applicable rules and regulations of the Securities and Exchange Commission and the PCAOB.
We conducted our audits in accordance with the standards of the PCAOB. Those standards require that we plan and perform the audit to obtain reasonable assurance about whether the consolidated financial statements are free of material misstatement, whether due to error or fraud.
Our audits included performing procedures to assess the risks of material misstatement of the consolidated financial statements, whether due to error or fraud, and performing procedures that respond to those risks. Such procedures included examining, on a test basis, evidence regarding the amounts and disclosures in the consolidated financial statements. Our audits also included evaluating the accounting principles used and significant estimates made by management, as well as evaluating the overall presentation of the consolidated financial statements. We believe that our audits provide a reasonable basis for our opinion.
/s/ BDO USA, LLP
We have served as the Company’s auditor since 2015.
Dallas, Texas
December 5, 2019
49
EZCORP, Inc. CONSOLIDATED BALANCE SHEETS (in thousands, except share and per share amounts) | |||||||
September 30, | |||||||
2019 | 2018 | ||||||
Assets: | |||||||
Current assets: | |||||||
Cash and cash equivalents | $ | $ | |||||
Pawn loans | |||||||
Pawn service charges receivable, net | |||||||
Inventory, net | |||||||
Notes receivable, net | |||||||
Prepaid expenses and other current assets | |||||||
Total current assets | |||||||
Investments in unconsolidated affiliates | |||||||
Property and equipment, net | |||||||
Goodwill | |||||||
Intangible assets, net | |||||||
Notes receivable, net | |||||||
Deferred tax asset, net | |||||||
Other assets | |||||||
Total assets | $ | $ | |||||
Liabilities and equity: | |||||||
Current liabilities: | |||||||
Current maturities of long-term debt, net | $ | $ | |||||
Accounts payable, accrued expenses and other current liabilities | |||||||
Customer layaway deposits | |||||||
Total current liabilities | |||||||
Long-term debt, net | |||||||
Deferred tax liability, net | |||||||
Other long-term liabilities | |||||||
Total liabilities | |||||||
Commitments and contingencies (Note 14) | |||||||
Stockholders’ equity: | |||||||
Class A Non-Voting Common Stock, par value $.01 per share; shares authorized: 100 million; issued and outstanding: 52,565,064 as of September 30, 2019 and 51,614,746 as of September 30, 2018 | |||||||
Class B Voting Common Stock, convertible, par value $.01 per share; shares authorized: 3 million; issued and outstanding: 2,970,171 | |||||||
Additional paid-in capital | |||||||
Retained earnings | |||||||
Accumulated other comprehensive loss | ( | ) | ( | ) | |||
EZCORP, Inc. stockholders’ equity | |||||||
Noncontrolling interest | ( | ) | |||||
Total equity | |||||||
Total liabilities and equity | $ | $ | |||||
See accompanying notes to consolidated financial statements.
50
EZCORP, Inc. CONSOLIDATED STATEMENTS OF OPERATIONS | |||||||||||
Fiscal Year Ended September 30, | |||||||||||
2019 | 2018 | 2017 | |||||||||
(in thousands, except per share amounts) | |||||||||||
Revenues: | |||||||||||
Merchandise sales | $ | $ | $ | ||||||||
Jewelry scrapping sales | |||||||||||
Pawn service charges | |||||||||||
Other revenues | |||||||||||
Total revenues | |||||||||||
Merchandise cost of goods sold | |||||||||||
Jewelry scrapping cost of goods sold | |||||||||||
Other cost of revenues | |||||||||||
Net revenues | |||||||||||
Operating expenses: | |||||||||||
Operations | |||||||||||
Administrative | |||||||||||
Depreciation and amortization | |||||||||||
Loss on sale or disposal of assets and other | |||||||||||
Total operating expenses | |||||||||||
Operating income | |||||||||||
Interest expense | |||||||||||
Interest income | ( | ) | ( | ) | ( | ) | |||||
Equity in net loss (income) of unconsolidated affiliates | ( | ) | ( | ) | |||||||
Impairment of investment in unconsolidated affiliates | |||||||||||
Other expense (income) | ( | ) | ( | ) | |||||||
Income from continuing operations before income taxes | |||||||||||
Income tax expense | |||||||||||
Income from continuing operations, net of tax | |||||||||||
Loss from discontinued operations, net of tax | ( | ) | ( | ) | ( | ) | |||||
Net income | |||||||||||
Net loss attributable to noncontrolling interest | ( | ) | ( | ) | ( | ) | |||||
Net income attributable to EZCORP, Inc. | $ | $ | $ | ||||||||
Basic earnings per share attributable to EZCORP, Inc. — continuing operations | $ | $ | $ | ||||||||
Diluted earnings per share attributable to EZCORP, Inc. — continuing operations | $ | $ | $ | ||||||||
Weighted-average basic shares outstanding | |||||||||||
Weighted-average diluted shares outstanding | |||||||||||
See accompanying notes to consolidated financial statements.
51
EZCORP, Inc. CONSOLIDATED STATEMENTS OF COMPREHENSIVE (LOSS) INCOME | |||||||||||
Fiscal Year Ended September 30, | |||||||||||
2019 | 2018 | 2017 | |||||||||
(in thousands) | |||||||||||
Net income | $ | $ | $ | ||||||||
Other comprehensive (loss) income: | |||||||||||
Foreign currency translation (loss) gain, net of income tax benefit (expense) for our investment in unconsolidated affiliate of $708, $353 and ($446) for the years ended September 30, 2019, 2018 and 2017, respectively | ( | ) | ( | ) | |||||||
Comprehensive (loss) income | ( | ) | |||||||||
Comprehensive loss attributable to noncontrolling interest | ( | ) | ( | ) | ( | ) | |||||
Comprehensive (loss) income attributable to EZCORP, Inc. | $ | ( | ) | $ | $ | ||||||
See accompanying notes to consolidated financial statements.
52
EZCORP, Inc. CONSOLIDATED STATEMENTS OF STOCKHOLDERS' EQUITY | ||||||||||||||||||||||||||
Common Stock | Additional Paid-in Capital | Accumulated Other Comprehensive (Loss) Income | Noncontrolling Interest | Total Equity | ||||||||||||||||||||||
Shares | Par Value | Retained Earnings | ||||||||||||||||||||||||
(in thousands) | ||||||||||||||||||||||||||
Balances as of October 1, 2016* | $ | $ | $ | $ | ( | ) | $ | ( | ) | $ | ||||||||||||||||
Stock compensation | — | — | — | — | — | |||||||||||||||||||||
Release of restricted stock | — | — | — | — | ||||||||||||||||||||||
Taxes paid related to net share settlement of equity awards | — | — | ( | ) | — | — | — | ( | ) | |||||||||||||||||
Reclassification of 2019 Convertible Note Warrants to liabilities | — | — | ( | ) | — | — | — | ( | ) | |||||||||||||||||
Foreign currency translation gain | — | — | — | — | ( | ) | ||||||||||||||||||||
Foreign currency translation reclassification upon disposition of Grupo Finmart | — | — | — | — | — | |||||||||||||||||||||
Net income (loss) | — | — | — | — | ( | ) | ||||||||||||||||||||
Balances as of September 30, 2017 | $ | $ | $ | $ | ( | ) | $ | ( | ) | $ | ||||||||||||||||
Stock compensation | — | — | — | — | — | |||||||||||||||||||||
Release of restricted stock | — | — | — | — | ||||||||||||||||||||||
Taxes paid related to net share settlement of equity awards | — | — | ( | ) | — | — | — | ( | ) | |||||||||||||||||
Reclassification of stranded tax effects resulting from the Tax Cuts and Jobs Act | — | — | — | ( | ) | — | — | |||||||||||||||||||
Foreign currency translation (loss) gain | — | — | — | — | ( | ) | ( | ) | ||||||||||||||||||
Equity classified conversion feature of 2024 Convertible Notes, net of tax | — | — | — | — | — | |||||||||||||||||||||
Net income (loss) | — | — | — | — | ( | ) | ||||||||||||||||||||
Balances as of September 30, 2018 | $ | $ | $ | $ | ( | ) | $ | ( | ) | $ | ||||||||||||||||
Stock compensation | — | — | — | — | — | |||||||||||||||||||||
Transfer of subsidiary shares to noncontrolling interest | — | — | — | — | ( | ) | — | |||||||||||||||||||
Release of restricted stock | — | — | — | — | ||||||||||||||||||||||
Deconsolidation of subsidiary | — | — | — | — | — | |||||||||||||||||||||
Taxes paid related to net share settlement of equity awards | — | — | ( | ) | — | — | — | ( | ) | |||||||||||||||||
Foreign currency translation loss | — | — | — | — | ( | ) | — | ( | ) | |||||||||||||||||
Net income (loss) | — | — | — | — | ( | ) | ||||||||||||||||||||
Balances as of September 30, 2019 | $ | $ | $ | $ | ( | ) | $ | $ | ||||||||||||||||||
* | See Note 1 of Notes to Consolidated Financial Statements for discussion of opening balance impact as a result of corrections to prior period financial statements. |
See accompanying notes to consolidated financial statements.
53
EZCORP, Inc. CONSOLIDATED STATEMENTS OF CASH FLOWS | |||||||||||
Fiscal Year Ended September 30, | |||||||||||
2019 | 2018 | 2017 | |||||||||
(in thousands) | |||||||||||
Operating activities: | |||||||||||
Net income | $ | $ | $ | ||||||||
Adjustments to reconcile net income to net cash provided by operating activities: | |||||||||||
Depreciation and amortization | |||||||||||
Amortization of debt discount and deferred financing costs | |||||||||||
Accretion of notes receivable discount and deferred compensation fee | ( | ) | ( | ) | ( | ) | |||||
Deferred income taxes | |||||||||||
Other adjustments | |||||||||||
Reserve on jewelry scrap receivable | |||||||||||
Stock compensation expense | |||||||||||
Loss (income) from investments in unconsolidated affiliates | ( | ) | ( | ) | |||||||
Impairment of investment in unconsolidated affiliates | |||||||||||
Changes in operating assets and liabilities, net of business acquisitions: | |||||||||||
Service charges and fees receivable | ( | ) | ( | ) | ( | ) | |||||
Inventory | ( | ) | ( | ) | |||||||
Prepaid expenses, other current assets and other assets | |||||||||||
Accounts payable, accrued expenses and other liabilities | ( | ) | ( | ) | |||||||
Customer layaway deposits | |||||||||||
Income taxes, net of excess tax benefit from stock compensation | ( | ) | ( | ) | |||||||
Net cash provided by operating activities | |||||||||||
Investing activities: | |||||||||||
Loans made | ( | ) | ( | ) | ( | ) | |||||
Loans repaid | |||||||||||
Recovery of pawn loan principal through sale of forfeited collateral | |||||||||||
Capital expenditures, net | ( | ) | ( | ) | ( | ) | |||||
Acquisitions, net of cash acquired | ( | ) | ( | ) | ( | ) | |||||
Investment in unconsolidated affiliate | ( | ) | |||||||||
Principal collections on notes receivable | |||||||||||
Net cash used in investing activities | ( | ) | ( | ) | ( | ) | |||||
Financing activities: | |||||||||||
Taxes paid related to net share settlement of equity awards | ( | ) | ( | ) | ( | ) | |||||
Proceeds from borrowings, net of issuance costs | |||||||||||
Payments on borrowings | ( | ) | ( | ) | ( | ) | |||||
Net cash (used in) provided by financing activities | ( | ) | |||||||||
Effect of exchange rate changes on cash and cash equivalents and restricted cash | ( | ) | ( | ) | |||||||
Net (decrease) increase in cash and cash equivalents and restricted cash | ( | ) | |||||||||
Cash and cash equivalents and restricted cash at beginning of period | |||||||||||
Cash and cash equivalents and restricted cash at end of period | $ | $ | $ | ||||||||
Cash paid during the period for: | |||||||||||
Interest | $ | $ | $ | ||||||||
Income taxes, net | |||||||||||
Non-cash investing and financing activities: | |||||||||||
Pawn loans forfeited and transferred to inventory | $ | $ | $ | ||||||||
Dividend reinvestment acquisition of additional ownership in unconsolidated affiliate | |||||||||||
See accompanying notes to consolidated financial statements.
54
EZCORP, Inc.
Notes to Consolidated Financial Statements
NOTE 1: SUMMARY OF SIGNIFICANT ACCOUNTING POLICIES
Description of Business
Formed in 1989, we have grown into a leading provider of pawn loans in the United States and Latin America. Pawn loans are non-recourse loans collateralized by tangible property. We also sell merchandise, primarily collateral forfeited from pawn lending operations and used merchandise purchased from customers, and operate a small number of financial services stores in Canada. We are dedicated to satisfying the short-term cash needs of consumers who are cash or credit constrained, focusing on delivering an industry-leading customer experience.
As of September 30, 2019, we operated a total of 1,014 locations, consisting of:
• |
• |
• |
• |
We also own 34.75 % of Cash Converters International Limited (“Cash Converters International”), a publicly traded company (ASX:CCV) headquartered in Perth, Western Australia. Cash Converters International and its controlled companies comprise a diverse group generating revenues from franchising, store operations, personal finance and vehicle finance, with operations in Australia and the United Kingdom, a 25 % equity interest in Cash Converters New Zealand and a franchise presence in 15 other countries around the world.
Basis of Presentation and Principles of Consolidation
The consolidated financial statements include the accounts of EZCORP, Inc. and its consolidated subsidiaries. All inter-company accounts and transactions have been eliminated in consolidation.
Management has the responsibility to evaluate whether there is substantial doubt about our ability to continue as a going concern for a period of one year after the date that the financial statements are issued (or available to be issued) or to provide related footnote disclosures. We do not believe there is substantial doubt about our ability to continue as a going concern.
To determine if we hold a controlling financial interest in an entity, we first evaluate if we are required to apply the variable interest entity (“VIE”) model to the entity; otherwise, the entity is evaluated under the voting interest model. Where we hold current or potential rights that give us the power to direct the activities of a VIE that most significantly impact the VIE’s economic performance, combined with a variable interest that gives us the right to receive potentially significant benefits or the obligation to absorb potentially significant losses, we have a controlling financial interest in that VIE. Rights held by others to remove the party with power over the VIE are not considered unless one party can exercise those rights unilaterally.
In evaluating whether we have the power to direct the activities of a VIE that most significantly impact its economic performance, we consider the purpose for which the VIE was created, the importance of each of the activities in which it is engaged and our decision-making role, if any, in those activities that significantly determine the entity’s economic performance as compared to other economic interest holders. This evaluation requires consideration of all facts and circumstances relevant to decision-making that affects the entity’s future performance and the exercise of professional judgment in deciding which decision-making rights are most important.
In determining whether we have the right to receive benefits or the obligation to absorb losses that could potentially be significant to a VIE, we evaluate all of our economic interests in the entity, regardless of form (debt, equity, management and servicing fees and other contractual arrangements). This evaluation considers all relevant factors of the entity’s design including the entity’s capital structure, contractual rights to earnings or losses, subordination of our interests relative to those of other investors, as well as any other contractual arrangements that might exist that could have the potential to be economically significant. The evaluation of each of these factors in reaching a conclusion about the potential significance of our economic interests is a matter that requires the exercise of professional judgment.
55
Corrections and Reclassifications to Prior Period Financial Statements
In the second quarter of fiscal 2019, we identified errors in our previously reported financial statements during the ordinary course of account reviews and subsequent investigation of related accounts. None of the identified errors was material to any previously reported period. These have now been corrected in all periods presented. The errors related to the overstatement of historical balances of pawn service charges receivable resulting from errors in the configuration of information technology reports, as well as other minor items identified in our reconciliation process. These errors resulted in an overstatement of October 1, 2016 beginning retained earnings of $3.4 million. The impact of these corrections on the consolidated financial statements, exclusive of quarterly impacts presented in previous fiscal 2019 filings, is as provided below (in thousands except per share amounts).
Consolidated Balance Sheets
December 31, 2018 | |||||||||||
As Previously Reported | Corrections | As Corrected | |||||||||
Pawn service charges receivable, net | $ | $ | ( | ) | $ | ||||||
Prepaid expenses and other current assets | |||||||||||
Goodwill | |||||||||||
Deferred tax asset, net | ( | ) | |||||||||
Accounts payable, accrued expenses and other current liabilities | ( | ) | |||||||||
Retained earnings | ( | ) | |||||||||
Accumulated other comprehensive loss | ( | ) | ( | ) | |||||||
December 31, 2017 | |||||||||||
As Previously Reported | Corrections | As Corrected | |||||||||
Cash and cash equivalents | $ | $ | ( | ) | $ | ||||||
Pawn service charges receivable, net | ( | ) | |||||||||
Prepaid expenses and other current assets | |||||||||||
Goodwill | |||||||||||
Deferred tax asset, net | |||||||||||
Accounts payable, accrued expenses and other current liabilities | ( | ) | |||||||||
Retained earnings | ( | ) | |||||||||
Accumulated other comprehensive loss | ( | ) | ( | ) | |||||||
Consolidated Statements of Operations
Fiscal Year Ended September 30, 2018 | |||||||||||
As Previously Reported | Corrections | As Corrected | |||||||||
Pawn service charges | $ | $ | ( | ) | $ | ||||||
Operations expense | |||||||||||
Administrative expense | ( | ) | |||||||||
Income from continuing operations before income taxes | ( | ) | |||||||||
Income tax expense | |||||||||||
Income from continuing operations, net of tax | ( | ) | |||||||||
Basic earnings per share attributable to EZCORP, Inc. — continuing operations | $ | $ | ( | ) | $ | ||||||
Diluted earnings per share attributable to EZCORP, Inc. — continuing operations | $ | $ | ( | ) | $ | ||||||
56
Fiscal Year Ended September 30, 2017 | |||||||||||
As Previously Reported | Corrections | As Corrected | |||||||||
Pawn service charges | $ | $ | ( | ) | $ | ||||||
Operations expense | |||||||||||
Administrative expense | |||||||||||
Income from continuing operations before income taxes | ( | ) | |||||||||
Income tax expense | ( | ) | |||||||||
Income from continuing operations, net of tax | ( | ) | |||||||||
Basic earnings per share attributable to EZCORP, Inc. — continuing operations | $ | $ | ( | ) | $ | ||||||
Diluted earnings per share attributable to EZCORP, Inc. — continuing operations | $ | $ | ( | ) | $ | ||||||
Three Months Ended December 31, 2018 | |||||||||||
As Previously Reported | Corrections | As Corrected | |||||||||
Pawn service charges | $ | $ | ( | ) | $ | ||||||
Operations expense | ( | ) | |||||||||
Administrative expense | ( | ) | |||||||||
Loss from continuing operations before income taxes | ( | ) | ( | ) | |||||||
Income tax benefit | ( | ) | ( | ) | ( | ) | |||||
Loss from continuing operations, net of tax | ( | ) | ( | ) | |||||||
Basic earnings per share attributable to EZCORP, Inc. — continuing operations | $ | ( | ) | $ | $ | ( | ) | ||||
Diluted earnings per share attributable to EZCORP, Inc. — continuing operations | $ | ( | ) | $ | $ | ( | ) | ||||
Three Months Ended December 31, 2017 | |||||||||||
As Previously Reported | Corrections | As Corrected | |||||||||
Pawn service charges | $ | $ | ( | ) | $ | ||||||
Operations expense | ( | ) | |||||||||
Administrative expense | ( | ) | |||||||||
Income from continuing operations before income taxes | ( | ) | |||||||||
Income tax expense | ( | ) | |||||||||
Income from continuing operations, net of tax | ( | ) | |||||||||
Basic earnings per share attributable to EZCORP, Inc. — continuing operations | $ | $ | $ | ||||||||
Diluted earnings per share attributable to EZCORP, Inc. — continuing operations | $ | $ | $ | ||||||||
Consolidated Statements of Cash Flows
Fiscal Year Ended September 30, 2018 | |||||||||||
As Previously Reported | Corrections | As Corrected | |||||||||
Net income | $ | $ | ( | ) | $ | ||||||
Deferred income taxes | ( | ) | |||||||||
Service charges and fees receivable | ( | ) | ( | ) | |||||||
Accounts payable, accrued expenses and other liabilities | ( | ) | ( | ) | |||||||
Income taxes, net of excess tax benefit from stock compensation | ( | ) | ( | ) | ( | ) | |||||
Net cash provided by operating activities* | ( | ) | |||||||||
Effect of exchange rate changes on cash and cash equivalents and restricted cash | ( | ) | ( | ) | ( | ) | |||||
57
Fiscal Year Ended September 30, 2017 | |||||||||||
As Previously Reported | Corrections | As Corrected | |||||||||
Net income | $ | $ | ( | ) | $ | ||||||
Deferred income taxes | |||||||||||
Service charges and fees receivable | ( | ) | ( | ) | ( | ) | |||||
Accounts payable, accrued expenses and other liabilities | ( | ) | ( | ) | |||||||
Income taxes, net of excess tax benefit from stock compensation | |||||||||||
Net cash provided by operating activities* | ( | ) | |||||||||
Three Months Ended December 31, 2018 | |||||||||||
As Previously Reported | Corrections | As Corrected | |||||||||
Net loss | $ | ( | ) | $ | $ | ( | ) | ||||
Service charges and fees receivable | ( | ) | ( | ) | |||||||
Accounts payable, accrued expenses and other liabilities | ( | ) | ( | ) | ( | ) | |||||
Income taxes, net of excess tax benefit from stock compensation | ( | ) | ( | ) | ( | ) | |||||
Net cash provided by operating activities* | |||||||||||
Effect of exchange rate changes on cash and cash equivalents and restricted cash | ( | ) | ( | ) | |||||||
Three Months Ended December 31, 2017 | |||||||||||
As Previously Reported | Corrections | As Corrected | |||||||||
Net income | $ | $ | ( | ) | $ | ||||||
Service charges and fees receivable | ( | ) | |||||||||
Accounts payable, accrued expenses and other liabilities | ( | ) | ( | ) | ( | ) | |||||
Net cash provided by operating activities* | |||||||||||
Effect of exchange rate changes on cash and cash equivalents and restricted cash | ( | ) | ( | ) | ( | ) | |||||
* | As previously reported amount includes the impact of adoption of accounting policies described below. |
Pawn Loans and Revenue Recognition
The carrying value of our pawn loans is based on the initial amounts lent to customers and are fully collateralized. We record pawn service charges using the effective interest method over the life of the loan for all pawn loans we believe to be collectible. We base our estimate of collectible loans on several inputs, including recent redemption rates, historical trends in redemption rates and the amount of loans due in the following months. Unexpected variations in any of these factors could change our estimate of collectible loans, affecting our earnings and financial condition. If a pawn loan is not repaid, we value the forfeited collateral (inventory) at the lower of cost (pawn loan principal) or net realizable value of the item. Of our consolidated pawn loans outstanding as of September 30, 2019, $92.8 million is attributable to Texas and Florida stores.
Merchandise Sales Revenue Recognition
Our performance obligations for merchandise sales primarily relate to point in time retail sales in our stores. We recognize the satisfaction of the performance obligation and record merchandise sales revenue and the related cost when merchandise inventory is sold and delivered to the customer or, in the case of a layaway sale, when we receive the final payment. Customers have a limited period of time to return merchandise for a refund or exchange, and actual returns for refunds are insignificant. Sales tax collected on the sale of inventory is excluded from the amount recognized as sales and instead recorded as a liability in “Accounts payable, accrued expenses and other current liabilities” in our consolidated balance sheets until remitted to the appropriate governmental authorities.
We recognize the satisfaction of the performance obligation and record scrapping (precious metals and stones) sales revenue and the related cost when scrap inventory is legally transferred to the refiner and the refiner obtains control of the inventory. The receivables outstanding at the end of a given reporting period are not material. Payment of the receivable from the customer is generally received within a short period of time after the legal transfer of the scrap materials to the refiner.
58
Inventory and Cost of Goods Sold
If a pawn loan is not redeemed, we record the forfeited collateral at cost (the principal amount of the pawn loan) in "Inventory, net" in our consolidated balance sheets. We do not record loan loss allowances or charge-offs on the principal portion of pawn loans, as they are fully collateralized. We record our inventory using the specific identification method of accounting.
In order to state inventory at the lower of cost or net realizable value, we record an allowance for excess, obsolete or slow-moving inventory based on the type and age of merchandise. Our inventory consists primarily of general merchandise and jewelry. Our "Merchandise cost of goods sold" includes the historical cost of inventory sold, inventory shrinkage and any change in the allowance for inventory shrinkage and valuation. We include the cost of operating our central jewelry processing unit under “Jewelry scrapping cost of goods sold,” as it relates directly to sales of precious metals to refiners.
We consider our estimates of obsolete or slow-moving inventory and shrinkage critical estimates in determining the appropriate overall valuation allowance for inventory. We monitor our sales margins for each type of inventory on an ongoing basis and compare to historical margins. Significant variances in those margins may require a revision to future inventory reserve estimates. We monitor our reserve estimates pertaining to jewelry inventory depending on the current and projected prices of gold. Future declines in the value of gold prices may cause an increase in reserve rates pertaining to jewelry inventory.
With respect to our Mexico pawn operations, we do not own the forfeited collateral; however, we assume the risk of loss on such collateral and are solely responsible for its care and disposition and as such, record such collateral under “Inventory, net” in our consolidated balance sheets. The amount of inventory from our Mexico pawn operations classified as “Inventory, net” in our consolidated balance sheets was $26.9 million and $25.1 million as of September 30, 2019 and 2018, respectively.
Cash and Cash Equivalents and Cash Concentrations
Cash and cash equivalents consist primarily of cash on deposit or highly liquid investments with original contractual maturities of three months or less, or money market mutual funds. We hold cash at major financial institutions that often exceed FDIC insured limits. We manage our credit risk associated with cash and cash equivalents and cash concentrations by concentrating our cash deposits in high quality financial institutions and by periodically evaluating the credit quality of the primary financial institutions issuing investments or holding such deposits. Historically, we have not experienced any losses due to such cash concentrations.
Notes Receivable
Equity Method Investments
We account for our investment in Cash Converters International and RDC using the equity method. Since Cash Converters International’s fiscal year ends three months prior to ours, we report the income from this investment on a three-month lag. Thus, income reported for fiscal years ended September 30, 2019, 2018 and 2017 represents our percentage interest in the results of Cash Converters International’s operations for the twelve-month periods ended June 30, 2019, 2018 and 2017, respectively. Because Cash Converters International publicly files semi-annual financial reports with the Australian Securities & Investments Commission as of and for the periods ended June 30 and December 31, we make estimates for our equity in Cash Converters International’s net income (loss) for Cash Converters International three-month periods ended March 31 (our
59
reporting period ended June 30) and September 30 (our reporting period ended December 31). Those estimates may vary from actual results. We adjust our estimates as necessary in our reporting periods ended March 31 and September 30 to conform to Cash Converters International actual results as shown in their published semi-annual reports. We measure and record all other-than-temporary impairments as of the date of our reporting period.
We accounted for the negative basis in our investment in Cash Converters International generated as a result of impairments and other items as a reduction in our portion of Cash Converters International goodwill. To the extent Cash Converters International recognizes future impairments in its goodwill, we will not record our share of such impairments until the negative basis is restored.
Goodwill and Other Intangible Assets
Goodwill and other intangible assets having indefinite lives are not subject to amortization. We test goodwill and intangible assets with indefinite useful lives for potential impairment annually as of September 30, or more frequently if an event occurs or circumstances change that would more likely than not reduce the fair value of a reporting unit below its carrying amount. We compare the fair value of our reporting units with their carrying amount and recognize an impairment charge for the amount by which the carrying amount exceeds the reporting unit’s fair value, without exceeding the total amount of goodwill allocated to that reporting unit.
We perform our impairment analyses utilizing the income approach. This approach uses future cash flows and estimated terminal values for each of our reporting units (discounted using a market participant perspective) to determine the fair value of each reporting unit, which is then compared to the carrying value of the reporting unit to determine if there is an impairment. We have determined that our reporting units are equivalent to our operating segments for fiscal 2019. The income approach includes assumptions about revenue growth rates, operating margins and terminal growth rates discounted by an estimated weighted-average cost of capital derived from other publicly traded companies that are similar but not identical from an operational and economic standpoint. We use discount rates that are commensurate with the risks and uncertainties inherent in the respective businesses and in our internally developed forecasts. Discount rates used in fiscal 2019 goodwill valuations ranged from 10 % to 15 % similar to rates used in fiscal 2018. In testing other intangible assets for potential impairment, we apply key assumptions that are consistent with those utilized in our goodwill impairment test.
In performing our goodwill impairment analysis as of September 30, 2019, we acknowledge the existence of a control premium relative to our market capitalization representing the incremental amount a buyer would pay to acquire a controlling stake. Our control premium was assessed on the evaluation of our average market capitalization during the fourth quarter of fiscal 2019 rather than only at the end of the period. If all equity interests in EZCORP were to be sold, we expect that a further premium would be paid for the Class B Voting Common Stock, none of which is publicly traded. We will continue to monitor our market capitalization in future periods relative to our underlying business performance to determine an appropriate control premium for purposes of our goodwill impairment analysis.
Changes in the economic conditions or regulatory environment could negatively affect our key assumptions. Future negative developments including a decline in loan portfolio performance, merchandise sales or demand for our products, a decline in precious metal commodity values, or inflation in costs relative to revenues in our Latin American operations in Guatemala, Honduras, El Salvador or Peru could lead to potential impairment of the $34.5 million in goodwill recorded in our “GPMX” reporting unit within our Latin America reporting segment. At September 30, 2019, the estimated fair value of GPMX exceeded its carrying value by 7 %.
We may perform a qualitative assessment in making our determination of whether it is more likely than not goodwill and other intangible assets are impaired under appropriate accounting guidance on an annual basis in future reporting periods. In addition to the assumptions discussed above pertaining to the income approach, we consider the assessment of potential triggering events to be a critical estimate.
Property and Equipment
We record property and equipment at cost. We depreciate these assets on a straight-line basis using estimated useful lives of 30 years for buildings and two to seven years for furniture, equipment and software development costs. We depreciate leasehold improvements over the shorter of their estimated useful life (typically 10 years) or the reasonably assured lease term at the inception of the lease.
Valuation of Tangible Long-Lived Assets
We assess the impairment of tangible long-lived assets whenever events or changes in circumstances indicate that the net recorded amount may not be recoverable. The following factors could trigger an impairment review: significant
60
underperformance relative to historical or projected future cash flows, significant changes in the manner of use of the assets or the strategy for the overall business, or significant negative industry trends or legislative changes prohibiting us from offering our loan products. An impairment loss is recognized if the future undiscounted cash flows associated with the asset and the estimated fair value of the asset are less than the asset's carrying value.
In addition to the assumptions associated with the determination of projected future cash flows, we consider the assessment of potential triggering events to be a critical estimate.
Software Development Costs and Cloud Computing Arrangements
We capitalize certain costs incurred in connection with developing or obtaining software for internal use and amortize the costs on a straight-line basis over the estimated useful lives of each system, typically five years. Net capitalized development costs are included in “Capital expenditures, net” in our consolidated statements of cash flows.
We consider whether cloud computing arrangements include a software license. In evaluating whether our arrangements include a software license, we consider whether we have the contractual right to take possession of the software at any time during the hosting period without significant penalty and whether it is feasible for us to either run the software on our own hardware or contract with another party unrelated to the vendor to host the software. If a cloud computing arrangement includes a software license, then we account for the software license element of the arrangement consistent with the acquisition of other software licenses. If a cloud computing arrangement does not include a software license, we account for the arrangement as a service contract.
Insurance Recoveries
Business Combinations
We allocate the total acquisition price to the fair value of assets and liabilities acquired under the acquisition method with goodwill representing the excess of purchase price over the fair value of net assets acquired. We immediately expense transaction costs. We recognize any adjustments to provisional amounts and goodwill that are identified during the measurement period in the reporting period in which the adjustment amounts are determined, with the effect on current period earnings of changes in depreciation, amortization, or other income effects, if any, as a result of the change to the provisional amounts, calculated as if the accounting had been completed at the acquisition date.
Convertible Debt Securities
We account for the conversion premium of the 2025 Convertible Notes and the 2024 Convertible Notes under the treasury method in accordance with our accounting policy, which assumes settlement of the conversion premium (equal to the as-converted value over the face principal amount) in shares of our Class A Common Stock.
Foreign Currency
Empeño Fácil’s functional currency is the Mexican peso, and the functional currencies of our other operations included in our Latin America Pawn segment include the Guatemalan quetzal (Guatemala), United States dollar (El Salvador), Honduran lempira (Honduras) and Peruvian sol (Peru). The functional currency of our wholly owned foreign subsidiary in Canada is the Canadian dollar. Our foreign subsidiaries' balance sheet accounts are translated from their respective functional currencies into United States dollars at the exchange rate at the end of each quarter, and their earnings are translated into United States dollars
61
at the average exchange rate each quarter. We present resulting translation adjustments as a separate component of stockholders’ equity.
Our equity investment in Cash Converters International is translated from Australian dollars into United States dollars at the exchange rates as of Cash Converters International’s balance sheet date each reporting period. The related interest in Cash Converters International’s net income is translated at the average exchange rate for each six-month period reported by Cash Converters International.
Operations Expense
Administrative Expense
Included in “Administrative” expense are costs related to our executive and administrative offices. This includes executive and administrative salaries, wages, stock and incentive compensation, professional fees, license fees, costs related to the operation of our administrative offices such as rent, property taxes, insurance, information technology and other corporate costs.
Advertising
Stock Compensation
We measure share-based compensation expense at the grant date based on the price of underlying shares at that date and recognize it as expense, net of estimated forfeitures, ratably over the vesting or service period, as applicable, of the stock award. Our policy is to recognize expense on performance-based awards, where satisfaction of the performance condition is probable, ratably over the awards’ vesting period and recognize expense on awards that only have service requirements on a straight-line basis.
Income Taxes
Tax Cuts and Jobs Act of 2017
On December 22, 2017, the Tax Cuts and Jobs Act of 2017 (the "Act") was signed into law. Among other things, the Act reduced the U.S. federal corporate tax rate from 35% to 21%, requires companies to pay a one-time transition tax on earnings of certain foreign subsidiaries that were previously tax deferred and creates new taxes on certain foreign sourced earnings. The corporate tax rate reduction was effective as of January 1, 2018 and, accordingly, reduced our federal statutory rate for fiscal 2018 to a blended rate of 24.5 %, and further reduced our federal statutory rate to 21% in fiscal 2019. We recognized a $2.1 million charge for the revaluation of our deferred tax assets and liabilities to the reduced tax rate upon enactment of the Act in fiscal 2018. In addition, we recorded a charge of approximately $2.6 million to record a valuation allowance against foreign tax credit carryforwards which are not more likely than not to be utilized as a result of changes in tax law enacted as part of the Act in fiscal 2018. Both items are included as components of "Income tax expense" in our consolidated statements of operations.
In February 2018, the FASB issued ASU 2018-02, Income Statement — Reporting Comprehensive Income (Topic 220): Reclassification of Certain Tax Effects from Accumulated Other Comprehensive Income. This ASU allows entities to reclassify from accumulated other comprehensive income to retained earnings the stranded tax effects resulting from the Act. The provisions of this ASU are effective for fiscal years, and interim periods within those fiscal years, beginning after December 15, 2018. As allowed, we early adopted ASU 2018-02 on a prospective basis as of January 1, 2018 and reclassified $1.5 million of accumulated foreign currency translation associated with our unconsolidated affiliate Cash Converters International, resulting from the stranded tax effects from the reduction of our effective tax rate, from accumulated other comprehensive loss to retained earnings. Our policy is to release income tax effects from accumulated other comprehensive income on a segregated unit of account basis.
62
Other
We account for income taxes using the asset and liability method. Deferred tax assets and liabilities are recognized for the future tax consequences attributable to differences between the financial statement carrying value of assets and liabilities and their tax basis and for operating loss and tax credit carryforwards. Deferred tax assets and liabilities are measured using enacted tax rates expected to apply to taxable income in the years in which the related temporary differences are expected to be recovered or settled. The effect on deferred tax assets and liabilities of a change in tax rates is recognized when the rate change is enacted.
We consider the earnings of certain non-U.S. subsidiaries to be indefinitely invested outside the United States on the basis of estimates that future domestic cash generation will be sufficient to meet future domestic cash needs and our specific plans for reinvestment of those subsidiary earnings. We have not recorded a deferred tax liability related to the U.S. federal and state income taxes and foreign withholding taxes of our undistributed earnings of foreign subsidiaries indefinitely invested outside the U.S.
We may be subject to income tax audits by the respective tax authorities in any or all of the jurisdictions in which we operate or have operated within a relevant period. Significant judgment is required in determining uncertain tax positions. We utilize the required two-step approach to recognize and measure uncertain tax positions. The first step is to evaluate the tax position for recognition by determining if the weight of available evidence indicates it is more likely than not that the position will be sustained on audit, including resolution of related appeals or litigation processes. The second step is to measure the tax benefit as the largest amount that is more than 50% likely to be realized upon ultimate settlement. We consider many factors when evaluating and estimating our tax positions and tax benefits, which may require periodic adjustments, and which may not accurately forecast actual outcomes. We adjust these reserves in light of changing facts and circumstances, such as the closing of an audit or the refinement of an estimate. Changes in recognition or measurement are reflected in the period in which the change in judgment occurs. We believe adequate provisions for income taxes have been made for all periods. We recognize interest and penalties related to unrecognized tax benefits as “Income tax expense” in our consolidated statements of operations, which were $0.2 million in each of 2019, 2018 and 2017.
We consider our assessment of the recognition of deferred tax assets as well as estimates of uncertain tax positions to be critical estimates.
Earnings per Share and Common Stock
We compute basic earnings per share based on the weighted average number of shares of common stock outstanding during the period. We compute diluted earnings per share based on the weighted average number of shares of common stock plus the effect of dilutive potential common shares outstanding, including conversion features embedded in our outstanding convertible debt, during the period using the treasury stock method. Dilutive potential common shares include outstanding restricted stock awards as well as shares issuable on conversion of our outstanding convertible debt securities and exercise of outstanding warrants. Potential common shares are required to be excluded from the computation of diluted earnings per share if the assumed proceeds upon exercise or vest are greater than the cost to re-acquire the same number of shares at the average market price, and therefore the effect would be anti-dilutive. There were no participating securities outstanding during fiscal 2019, 2018 and 2017 requiring the application of the two-class method.
Our capital stock consists of two classes of common stock designated as Class A Non-Voting Common Stock (“Class A Common Stock”) and Class B Voting Common Stock (“Class B Common Stock”). The rights, preferences and privileges of the Class A and Class B Common Stock are similar except that each share of Class B Common Stock has one vote and each share of Class A Common Stock has no voting privileges, except as required by law. All Class A Common Stock is publicly held. Holders of Class B Common Stock may, individually or as a class, convert some or all of their shares into Class A Common Stock on a one-to-one basis. Class A Common Stock becomes voting common stock upon the conversion of all Class B Common Stock to Class A Common Stock. We are required to reserve the number of authorized but unissued shares of Class A Common Stock that would be issuable upon conversion of all outstanding shares of Class B Common Stock.
Use of Estimates and Assumptions
The preparation of these financial statements requires us to make estimates and assumptions that affect the reported amounts of assets, liabilities, revenues and expenses and related disclosure of contingent assets and liabilities. On an ongoing basis, we evaluate our estimates and judgments, including those related to revenue recognition, inventory, collectability of notes receivable, loan loss allowances, long-lived and intangible assets, income taxes, potential impairments of investments, contingencies and litigation. We base our estimates on historical experience, observable trends and various other assumptions that we believe are reasonable under the circumstances. We use this information to make judgments about the carrying values
63
of assets and liabilities that are not readily apparent from other sources. Actual results may differ materially from the estimates under different assumptions or conditions.
Recently Adopted Accounting Policies
• | In August 2018, the Financial Accounting Standards Board ("FASB") issued Accounting Standards Update ("ASU") 2018-15, Intangibles — Goodwill and Other — Internal-Use Software (Subtopic 350-40): Customer’s Accounting for Implementation Costs Incurred in a Cloud Computing Arrangement That is a Service Contract, which requires a customer in a cloud computing arrangement that is a service contract to follow the internal-use software guidance in Accounting Standards Codification ("ASC") 350-40 to determine which implementation costs to defer and recognize as an asset. This ASU generally aligns the guidance on recognizing implementation costs incurred in a cloud computing arrangement that is a service contract with that for implementation costs incurred to develop or obtain internal-use software, including hosting arrangements that include an internal-use software license. Our hosting arrangements that are service contracts include various third-party software applications. We adopted this ASU during the first quarter of fiscal 2019 on a prospective basis for all service contracts entered into after adoption, with no material impact upon adoption. |
• | In November 2016, the FASB issued ASU 2016-18 Statement of Cash Flows (Topic 230): Restricted Cash. This ASU requires the inclusion of restricted cash with cash and cash equivalents when reconciling the beginning-of-period and end-of-period total amounts shown on the statement of cash flows. We adopted this ASU during the first quarter of fiscal 2019 with no impact on our financial position or results of operations. However, we have recast our statements of cash flows on a retrospective basis to include restricted cash when reconciling the beginning-of-period and end-of-period total amounts. |
• | In August 2016, the FASB issued ASU 2016-15 Statement of Cash Flows (Topic 230): Classification of Certain Cash Receipts and Cash Payments. This ASU provides guidance on eight specific cash flow issues. We adopted this ASU during the first quarter of fiscal 2019 on a prospective basis with no impact on our financial position, results of operations or cash flows. |
• | In May 2016, the FASB issued ASU 2016-01, Financial Instruments (Subtopic 825-10). The amendments in this ASU make targeted improvements to GAAP primarily as it pertains to equity investments (not including equity method of accounting), fair value disclosures, balance sheet presentation, and other items pertaining to financial instruments. We adopted this ASU during the first quarter of fiscal 2019 on a prospective basis, as applicable, with no impact on our financial position, results of operations or cash flows upon adoption. |
• | In May 2014, the FASB issued ASU 2014-09, Revenue from Contracts with Customers (Topic 606). In August 2015, the FASB issued ASU 2015-14, Revenue from Contracts with Customers (Topic 606) to defer the effective date to December 15, 2017 for annual reporting periods beginning after that date, with early adoption permitted, but not before the original effective date of December 15, 2016. The core principle of this ASU, and the subsequently issued ASUs modifying or clarifying this ASU, is that an entity should recognize revenue to depict the transfer of goods or services to customers in an amount that reflects the consideration to which the entity expects to be entitled in exchange for those goods or services. To achieve this core principle, the guidance provides that an entity should apply the following steps: (1) identify the contract(s) with a customer; (2) identify the performance obligations in the contract; (3) determine the transaction price; (4) allocate the transaction price to the performance obligations in the contract; and (5) recognize revenue when, or as, the entity satisfies a performance obligation. The new standard allows for two methods of adoption: (a) full retrospective adoption, meaning the standard is applied to all periods presented, or (b) modified retrospective adoption, meaning the cumulative effect of applying the new standard is recognized as an adjustment to the opening retained earnings balance. |
We adopted this ASU and related guidance as of October 1, 2018 using the modified retrospective method. We evaluated the impact of ASC 606 on our consolidated financial position, results of operations, cash flows and disclosure requirements noting no material impact to our consolidated financial statements or disclosures. See Note 15 for disaggregated information about our sources of revenue and accounting policies above for enhanced disclosures. Additionally, we have concluded that ASC 606 does not impact our revenue recognition for pawn service charges or consumer loan fees as we believe neither of those revenue streams are within the scope of ASC 606.
64
• | In August 2018, the FASB issued ASU 2018-13, Fair Value Measurement (Topic 820): Disclosure Framework. This ASU modifies the disclosure requirements for fair value measurements in Accounting Standards Codification (“ASC”) 820. The provisions of this ASU are effective for fiscal years, and interim periods within those fiscal years, beginning after December 15, 2019. Early adoption is permitted based upon guidance issued within the ASU. A reporting entity should apply the amendment either retrospectively or prospectively based on the specific guidance within the ASU. We do not anticipate that the adoption of the ASU will have a material effect on our disclosures. |
• | In June 2016, the FASB issued ASU 2016-13, Financial Instruments — Credit Losses (Topic 326): Measurement of Credit Losses on Financial Instruments. This ASU, along with subsequently issued related ASUs, requires financial assets (or groups of financial assets) measured at amortized cost basis to be presented at the net amount expected to be collected, among other provisions. The provisions of this ASU are effective for fiscal years, and interim periods within those fiscal years, beginning after December 15, 2019. Early adoption is permitted for fiscal years beginning after December 15, 2018, including interim periods within those fiscal years. A reporting entity should generally apply the amendment on a modified retrospective basis through a cumulative-effect adjustment to retained earnings as of the beginning of the first reporting periods in which the amendment is effective. We have not identified any impacts to our financial statements that we believe will be material as a result of the adoption of the ASU, although we continue to evaluate the impact of adoption. We believe we are following an appropriate timeline to allow for proper recognition, presentation and disclosure upon adoption of this ASU which is effective for fiscal 2021. |
• | In February 2016, the FASB issued ASU 2016-02, Leases (Topic 842). This ASU requires companies to generally recognize on the balance sheet operating and financing lease liabilities and corresponding right-of-use assets. The provisions of this ASU are effective for fiscal years beginning after December 15, 2018, and interim periods within those fiscal years. We are in the process of evaluating the impact of adopting ASU 2016-02 on our consolidated financial position, results of operations and cash flows, and anticipate a material impact on our consolidated financial position. We are currently assessing the potential impact this ASU and related ASUs on our consolidated financial statements, though the adoption will result in a material increase in the assets and liabilities reflected on our consolidated balance sheets. We will complete our implementation to allow for proper recognition, presentation and disclosure upon adoption of the ASU which is effective for fiscal 2020. We plan to adopt this ASU using the optional prospective transition method provided under ASU 2018-11, Leases, (Topic 842): Targeted Improvement which was issued in July 2018, allowing for application of ASU 2016-02 at the adoption date. |
NOTE 2: ACQUISITIONS
Fiscal 2019 Acquisitions
In June 2019, we acquired assets related to seven pawn stores operating under the name "Metro Pawn" in Nevada, entering the Reno market and expanding our presence in the Las Vegas metropolitan area, for an aggregate purchase price of $7.0 million in cash, of which $3.9 million was recorded as goodwill. In December 2018, we acquired assets related to five pawn stores in Mexico for an aggregate purchase price of $0.3 million in cash, of which $0.1 million was recorded as goodwill. We expect substantially all goodwill attributable to the fiscal 2019 acquisitions to be deductible for tax purposes. We have concluded that these acquisitions were immaterial to our overall consolidated financial results and, therefore, have omitted information that would otherwise be required.
Camira Administration Corp. and Subsidiaries (“GPMX”) in Fiscal 2018
On October 6, 2017, we completed the acquisition of 100 % of the outstanding stock of Camira Administration Corp. and subsidiaries (“GPMX”), a business that, at the time, owned and operated 112 stores located in Guatemala, El Salvador, Honduras and Peru. The GPMX acquisition significantly expanded our store base into Latin American countries outside of Mexico and provided us with a platform for further growth in the region. Under the terms of the stock purchase agreement (“SPA”), we paid $53.4 million in cash upon closing and, subsequent to the closing, paid $6.7 million to satisfy the acquired company's indebtedness to members of the seller’s affiliated group. The SPA specified a further $2.25 million to be paid contingent upon performance of GPMX’s business during a period up to 24 months following the closing date, and the business achieved the specified performance goal during the first quarter of fiscal 2018. Consequently, we made a final payment of $1.6 million in January 2018 in satisfaction of the contingent purchase price obligation, after reduction for certain adjustments under the SPA, yielding a total purchase price of $61.7 million.
65
All Other Fiscal 2018 Acquisitions
On June 25, 2018, we acquired 40 pawn stores operating under the name “Montepio San Patricio” in and around Mexico City, the largest market in Mexico. The acquisition of these stores was our largest acquisition in Mexico to date and significantly strengthened our competitive position in the strategically important Mexico City metropolitan area. The physical space in these stores is substantially larger than our average store in Mexico, giving us the capacity to increase their focus on general merchandise pawn loan and retail activities.
On June 11, 2018, we acquired 23 pawn stores operating under the name “Presta Dinero,” giving us a presence in a number of cities within seven central-Mexico states in which we already had stores. These stores complemented our existing stores, allowing us to achieve synergies in management and administration while giving us a presence in new cities and neighborhoods.
On December 4, 2017, we acquired 21 pawn stores located in the Mexican state of Sinaloa operating under the name “Bazareño.” The Bazareño stores made up the largest chain of pawn stores in Culiacan, the capital city of Sinaloa, giving us the number one position in that market and an important strategic presence in the northwest region of Mexico.
The purchase prices of the above acquisitions were paid in cash. During the first quarter of fiscal 2019, we finalized accounting for the Montepio San Patricio and Presta Dinero acquisitions, and increased associated deferred tax assets by $1.8 million with an offsetting reduction in goodwill.
These acquisitions, collectively referred to as "All Other" below, were individually immaterial and we have therefore omitted or aggregated certain disclosures.
Other Information for Fiscal 2018 Acquisitions
The acquisitions described above were all attributable to our Latin America Pawn segment. Including the revision of values and finalization of accounting for certain assets associated with the acquisition of Montepio San Patricio and Presta Dinero, the allocation of the consideration for the net acquired assets from our fiscal 2018 business combinations was as follows:
GPMX | All Other | |||||||
(in thousands) | ||||||||
Cash and cash equivalents | $ | $ | ||||||
Earning assets | ||||||||
Other assets** | ||||||||
Property and equipment, intangible assets, deferred taxes and other assets, net* | ||||||||
Goodwill** | ||||||||
Accounts payable, deferred taxes and other liabilities | ( | ) | ||||||
Total consideration | $ | $ | ||||||
* | Intangible assets consist primarily of $ |
** | As discussed in Note 1, certain adjustments were made to pawn service charges receivable and associated goodwill balances. |
The factors contributing to the recognition of goodwill, which is recorded in our Latin America Pawn segment, were based on several strategic and synergistic benefits we expect to realize from the acquisitions, including expansion of our store base as well as the ability to further leverage our pawn expertise, investments in information technology and other back office and support functions of our existing Mexico pawn business. We expect none of the goodwill resulting from these business combinations will be deductible for tax purposes.
The results of the acquired businesses have been included in our consolidated financial statements beginning after the acquisition dates as indicated above in our Latin America Pawn segment with revenue and net income amounts as presented below. Such net income does not include acquisition-related costs of approximately $0.6 million for fiscal 2018, which were expensed as incurred and primarily included under “Administrative” expense in our consolidated statements of operations. It is impracticable to provide historical supplemental pro forma financial information for GPMX and All Other acquisitions due to a variety of factors, including complexity of restructured entities acquired and access to historical information, such as
66
information necessary to eliminate intercompany transactions.
Fiscal Year Ended September 30, 2018 | |||||||
Revenue | Net Income | ||||||
GPMX | $ | $ | |||||
All Other | |||||||
Fiscal 2017 Acquisitions
In August 2017, we acquired certain assets related to two pawn stores in Central Texas and one pawn store in Las Vegas, Nevada. The aggregate purchase price for these transactions in total was $2.3 million in cash, of which $0.4 million was recorded as goodwill. For additional discussion of the Central Texas acquisition, see Note 11. We expect substantially all goodwill attributable to the fiscal 2017 acquisitions will be deductible for tax purposes. We have concluded that these acquisitions were immaterial to our overall consolidated financial results and, therefore, have omitted information that would otherwise be required.
NOTE 3: EARNINGS PER SHARE
Components of basic and diluted earnings per share and excluded antidilutive potential common shares are as follows:
Fiscal Year Ended September 30, | |||||||||||
2019 | 2018 | 2017 | |||||||||
(in thousands, except per share amounts) | |||||||||||
Net income from continuing operations attributable to EZCORP (A) | $ | $ | $ | ||||||||
Loss from discontinued operations, net of tax (B) | ( | ) | ( | ) | ( | ) | |||||
Net income attributable to EZCORP (C) | $ | $ | $ | ||||||||
Weighted average outstanding shares of common stock (D) | |||||||||||
Dilutive effect of restricted stock and 2024 Convertible Notes* | |||||||||||
Weighted average common stock and common stock equivalents (E) | |||||||||||
Basic earnings per share attributable to EZCORP: | |||||||||||
Continuing operations (A / D) | $ | $ | $ | ||||||||
Discontinued operations (B / D) | ( | ) | ( | ) | ( | ) | |||||
Basic earnings per share (C / D) | $ | $ | $ | ||||||||
Diluted earnings per share attributable to EZCORP: | |||||||||||
Continuing operations (A / E) | $ | $ | $ | ||||||||
Discontinued operations (B / E) | ( | ) | ( | ) | ( | ) | |||||
Diluted earnings per share (C / E) | $ | $ | $ | ||||||||
Potential common shares excluded from the calculation of diluted earnings per share above*: | |||||||||||
Restricted stock** | |||||||||||
* | See Note 8 for discussion of the terms and conditions of the potential impact of the 2019 Convertible Notes Warrants, 2024 Convertible Notes and 2025 Convertible Notes. As required by ASC 260-10-45-19, amount excludes all potential common shares for periods when there is a loss from continuing operations. |
** | Includes antidilutive share-based awards as well as performance-based and market conditioned share-based awards that are contingently issuable, but for which the condition for issuance has not been met as of the end of the reporting period. |
67
NOTE 4: STRATEGIC INVESTMENTS
As of September 30, 2019, we owned 214,183,714 shares, or approximately 34.75 %, of Cash Converters International, which is, as a result, our unconsolidated affiliate. Our total investment in Cash Converters International was acquired between November 2009 and June 2018 for approximately $96.1 million, including the acquisition of 57,631,230 shares in June 2018 for $14.0 million (increasing our ownership by three percentage points) in connection with an underwritten placement of 123.3 million shares by Cash Converters International for AUD $39.5 million, excluding related costs.
Our equity in Cash Converters International’s net income was $0.1 million, $5.5 million and $4.9 million in fiscal 2019, 2018 and 2017, respectively. Cash Converters International did not declare or pay a dividend in fiscal 2019. We recorded dividends from Cash Converters International of $1.2 million in fiscal 2017, which were reinvested. Cash Converters International’s accumulated undistributed after-tax earnings included in our consolidated retained earnings were $15.9 million as of September 30, 2019.
The following tables present summary financial information for Cash Converters International’s most recently reported results as of September 30, 2019, 2018 and 2017 as applicable after translation to U.S. dollars:
June 30, | |||||||
2019 | 2018 | ||||||
(in thousands) | |||||||
Current assets | $ | $ | |||||
Non-current assets | |||||||
Total assets | $ | $ | |||||
Current liabilities | $ | $ | |||||
Non-current liabilities | |||||||
Shareholders’ equity | |||||||
Total liabilities and shareholders’ equity | $ | $ | |||||
Fiscal Year Ended June 30, | |||||||||||
2019 | 2018 | 2017 | |||||||||
(in thousands) | |||||||||||
Gross revenues | $ | $ | $ | ||||||||
Gross profit | |||||||||||
Net (loss) profit | ( | ) | |||||||||
During fiscal 2018, the fair value of our investment in Cash Converters International, as estimated by reference to its quoted market price per share, declined from September 30, 2017 and ended below its carrying value as of September 30, 2018. As of September 30, 2018, we determined that our investment was impaired and that such impairment was other-than-temporary. In reaching this conclusion, we considered all available evidence, including the following: (i) positive earnings reported for the previous two years; (ii) resolution of Australian Securities and Investment Commission Enforceable Undertaking in May 2018;
68
(iii) executive turnover including announcement of its chief executive officer’s departure in August 2018; (iv) outstanding Queensland class action litigation; (v) ongoing uncertainty around Australian legislative action; (vi) continued cessation of dividend payments; (vii) available analyst reports including associated future earnings and cash flow forecasts; and (viii) the prolonged drop in Cash Converters International’s stock price. As a result, we recognized an other-than-temporary impairment in Cash Converters International of $11.7 million ($9.2 million, net of taxes) in fiscal 2018.
The above impairments increased the difference between the amount at which our investment was carried and the amount of underlying equity in net assets of Cash Converters International as discussed in Note 1 and were recorded under “Impairment of investment” in our consolidated statements of operations in the “Other International” segment. We will continue to monitor the fair value of our investment in Cash Converters International for other-than-temporary impairments in future reporting periods and may record additional impairment charges should the fair value of our investment in Cash Converters International further decline below its carrying value for an extended period of time. See Note 5 for the fair value and carrying value of our investment in Cash Converters International.
NOTE 5: FAIR VALUE MEASUREMENTS
Our assets and liabilities discussed below are classified in one of the following three categories based on the inputs used to develop their fair values: Level 1 — Quoted market prices in active markets for identical assets or liabilities; Level 2 — Other observable market-based inputs or unobservable inputs that are corroborated by market data; and Level 3 — Unobservable inputs that are not corroborated by market data. We have elected not to measure at fair value any eligible items for which fair value measurement is optional.
Recurring Fair Value Measurements
The table below presents our financial assets (liabilities) that were carried and measured at fair value on a recurring basis:
September 30, 2019 | September 30, 2018 | |||||||||
Financial Assets (Liabilities): | Balance Sheet Location | |||||||||
(in thousands) | ||||||||||
2019 Convertible Notes Hedges — Level 2 | Prepaid expenses and other current assets | $ | $ | |||||||
2019 Convertible Notes Embedded Derivative — Level 2 | Current maturities of long-term debt, net | ( | ) | |||||||
There were no transfers in or out of Level 1, Level 2 or Level 3 for financial assets or liabilities measured at fair value on a recurring basis during the periods presented.
69
Financial Assets and Liabilities Not Measured at Fair Value
The tables below present our financial assets and liabilities that were not measured at fair value (including those discussed below the following tables) on a recurring basis:
Carrying Value | Estimated Fair Value | |||||||||||||||||||
September 30, 2019 | September 30, 2019 | Fair Value Measurement Using | ||||||||||||||||||
Level 1 | Level 2 | Level 3 | ||||||||||||||||||
(in thousands) | ||||||||||||||||||||
Financial assets: | ||||||||||||||||||||
Notes receivable from Grupo Finmart, net | $ | $ | $ | $ | $ | |||||||||||||||
2.89% promissory note receivable due April 2024 | ||||||||||||||||||||
Investments in unconsolidated affiliates | ||||||||||||||||||||
Financial liabilities: | ||||||||||||||||||||
2024 Convertible Notes | $ | $ | $ | $ | $ | |||||||||||||||
2025 Convertible Notes | ||||||||||||||||||||
8.5% unsecured debt due 2024 | ||||||||||||||||||||
CASHMAX secured borrowing facility | ||||||||||||||||||||
Carrying Value | Estimated Fair Value | |||||||||||||||||||
September 30, 2018 | September 30, 2018 | Fair Value Measurement Using | ||||||||||||||||||
Level 1 | Level 2 | Level 3 | ||||||||||||||||||
(in thousands) | ||||||||||||||||||||
Financial assets: | ||||||||||||||||||||
Notes receivable from Grupo Finmart, net | $ | $ | $ | $ | $ | |||||||||||||||
Investments in unconsolidated affiliates | ||||||||||||||||||||
Financial liabilities: | ||||||||||||||||||||
2019 Convertible Notes | $ | $ | $ | $ | $ | |||||||||||||||
2024 Convertible Notes | ||||||||||||||||||||
2025 Convertible Notes | ||||||||||||||||||||
8.5% unsecured debt due 2024 | ||||||||||||||||||||
Based primarily on the short-term nature of cash and cash equivalents, pawn loans, pawn service charges receivable, current consumer loans, fees and interest receivable and other debt, we estimate that their carrying value approximates fair value. We consider our cash and cash equivalents to be measured using Level 1 inputs and our pawn loans, pawn service charges receivable, consumer loans, fees and interest receivable and other debt to be measured using Level 3 inputs. Significant increases or decreases in the underlying assumptions used to value pawn loans, pawn service charges receivable, consumer loans, fees and interest receivable and other debt could significantly increase or decrease these fair value estimates.
For background information regarding the notes receivable, see “Notes Receivable from Grupo Finmart Divestiture” below. We measured the fair value of the notes receivable under a discounted cash flow approach considering the estimated credit ratings for Grupo Finmart and AlphaCredit and as determined with external consultation, with discount rates of primarily 7 % as of September 30, 2019. Certain of the significant inputs used for the valuation were not observable in the market. Significant increases or decreases in the underlying assumptions used to value the notes receivable could significantly increase or decrease these fair value estimates.
In March 2019, we deconsolidated a previously consolidated variable interest entity ("RDC") over which we no longer have the power to direct the activities that most significantly affect its economic performance. After the deconsolidation and prior to RDC’s third-party capital raise in August 2019, we held the following interests in RDC:
• | A |
70
• | A $ |
In conjunction with the deconsolidation and recording of the above amounts, we recognized a loss of $0.3 million, included in "Other income" in our consolidated statements of operations included in our "Other International" segment and in "Other adjustments" in our consolidated statements of cash flows for fiscal 2019. In August 2019, RDC received a qualified third party investment causing recognition of a loss of $1.9 million on expiration of the call option, included in "Other expense (income)" in our consolidated statements of operations included in our "Other International" segment and in "Other adjustments" in our consolidated statements of cash flows. Additionally, the carrying value of the convertible promissory note due January 2021 of $7.4 million was converted into a 10 % equity interest which together with the previous 5 % equity interest is accounted for under the equity method and yielding a resulting interest of 13 % after dilution. The RDC equity interest approximated its carrying value as of September 30, 2019. The equity method of accounting is followed based on our 13 % ownership, combined with board representation. The net investment value is included in “Investment in unconsolidated affiliates” on our balance sheet at September 30, 2019.
In March 2019, we received $1.1 million in previously escrowed seller funds as a result of settling certain indemnification claims with the seller of GPMX. In April 2019, we loaned the $1.1 million back to the seller of GPMX in exchange for a promissory note. The note bears interest at the rate of 2.89 % per annum and is secured by certain marketable securities owned by the seller and held in a U.S. brokerage account. All principal and accrued interest is due and payable in April 2024. The note approximated its carrying value as of September 30, 2019.
The inputs used to generate the fair value of the investment in unconsolidated affiliate (Cash Converters International) were considered Level 1 inputs. These inputs are comprised of (a) the quoted stock price on the Australian Stock Exchange multiplied by (b) the number of shares we owned multiplied by (c) the applicable foreign currency exchange rate as of the end of our reporting period. We included no control premium for owning a large percentage of outstanding shares.
We measured the fair value of the 2024 and 2025 Convertible Notes using quoted price inputs. The 2024 and 2025 Convertible Notes are not actively traded, and thus the price inputs represent a Level 2 measurement. As the quoted price inputs are highly variable from day to day, the fair value estimates disclosed above could significantly increase or decrease.
Notes Receivable from Grupo Finmart Divestiture in Fiscal 2016
Subsequent to the sale of Grupo Finmart in September 2016, we determined that we retained a variable interest in Grupo Finmart, including notes receivable and a guarantee liability of the future cash outflows of certain Grupo Finmart foreign exchange forward contracts with a backup guarantee provided by AlphaCredit for any payments we make under the guarantee. We determined that we are not the primary beneficiary of Grupo Finmart subsequent to its disposition as we lack a controlling financial interest in Grupo Finmart.
During fiscal 2019 and 2018, we collected $34.1 million and $32.4 million, respectively, in principal and deferred compensation on these notes receivable. As of September 30, 2017, all of the notes receivable (other than the Parent Loan Notes discussed below) had been repaid and the guarantee liability had been extinguished.
As of September 30, 2017, only two promissory notes (referred to as the “Parent Loan Notes”), one of which was denominated in Mexican pesos, remained outstanding from the Grupo Finmart sale, with a total aggregate principal amount of $60.9 million. In September 2017, we and AlphaCredit amended the Parent Loan Notes as follows:
• | The outstanding principal amount (including the $ |
• | The per annum interest rate was increased from |
• | An additional deferred compensation fee totaling $ |
• | The Parent Loan Notes could be prepaid in full voluntarily at any time and are subject to mandatory prepayment in certain circumstances. Upon any prepayment, whether voluntary or mandatory, Grupo Finmart must pay all outstanding principal, all accrued but unpaid interest and an amount equal to the sum of (1) all remaining interest payments that would otherwise be due through the end of the term and (2) the remaining unpaid balance of the |
71
deferred compensation fee. If a prepayment had occurred on or before June 30, 2019, the deferred compensation fee would have been reduced to $10.0 million.
• | The Parent Loan Notes, as amended, are fully guaranteed by AlphaCredit. |
As further consideration for these amendments, AlphaCredit agreed to terminate our indemnification obligations with respect to representations and warranties and certain other matters under the Purchase Agreement, dated as of July 1, 2016, that the parties entered into in connection with the sale of Grupo Finmart (the “Purchase Agreement”). Those representations and warranties were originally scheduled to survive until March 27, 2018. AlphaCredit also agreed to terminate all indemnity claims existing at the time of the amendment and to release to us the outstanding balance ($4.1 million) held in escrow pending resolution of indemnification claims. We accounted for this amendment as an extinguishment of the original Parent Loan Notes, recognizing $3.0 million of remaining discount as a gain included in “Interest income” in our consolidated statements of operations.
We remain obligated to indemnify AlphaCredit for any tax obligations arising from the Grupo Finmart business that are attributable to periods prior to the completion of the sale in September 2016, referred to as “pre-closing taxes.” Those obligations continue until the expiration of the statute of limitations applicable to the pre-closing periods. In August 2019, AlphaCredit notified us of a potential indemnity claim for certain pre-closing taxes, but the nature, extent and validity of such claim has yet to be determined.
We review the financial statements of Grupo Finmart and AlphaCredit including the calculation of synthetic credit spreads as described above in making our determination that the Parent Loan Notes are collectible on an ongoing basis. As of September 30, 2019, Grupo Finmart had repaid all amounts due to date in accordance with the amortization schedule, including all principal amounts and the initial $6.0 million installment of the deferred compensation fee, along with interest through September 27, 2019. The only amount remaining due is the final $8.0 million of the deferred compensation fee due in fiscal 2020 and interest that will continue to accrue on that amount.
NOTE 6: PROPERTY AND EQUIPMENT
Major classifications of property and equipment were as follows:
September 30, | |||||||||||||||||||||||
2019 | 2018 | ||||||||||||||||||||||
Carrying Amount | Accumulated Depreciation | Net Book Value | Carrying Amount | Accumulated Depreciation | Net Book Value | ||||||||||||||||||
(in thousands) | |||||||||||||||||||||||
Land | $ | $ | $ | $ | $ | $ | |||||||||||||||||
Buildings and improvements | ( | ) | ( | ) | |||||||||||||||||||
Furniture and equipment | ( | ) | ( | ) | |||||||||||||||||||
Software | ( | ) | ( | ) | |||||||||||||||||||
In progress | |||||||||||||||||||||||
$ | $ | ( | ) | $ | $ | $ | ( | ) | $ | ||||||||||||||
72
NOTE 7: GOODWILL AND OTHER INTANGIBLE ASSETS
Goodwill and Intangible Asset Balances
The following table presents the balance of each major class of indefinite-lived intangible asset:
September 30, | |||||||
2019 | 2018 | ||||||
(in thousands) | |||||||
Pawn licenses | $ | $ | |||||
Trade names | |||||||
$ | $ | ||||||
The following table presents the changes in the carrying value of goodwill by segment:
U.S. Pawn | Latin America Pawn | Consolidated | |||||||||
(in thousands) | |||||||||||
Balances as of September 30, 2017 | $ | $ | $ | ||||||||
Acquisitions* | |||||||||||
Effect of foreign currency translation changes | |||||||||||
Balances as of September 30, 2018 | $ | $ | $ | ||||||||
Acquisitions* | ( | ) | |||||||||
Effect of foreign currency translation changes | ( | ) | ( | ) | |||||||
Balances as of September 30, 2019 | $ | $ | $ | ||||||||
* | As discussed in Note 1 and Note 2, certain adjustments were made to pawn service charges receivable, deferred taxes and associated goodwill balances. |
The following table presents the gross carrying amount and accumulated amortization for each major class of definite-lived intangible asset:
September 30, | |||||||||||||||||||||||
2019 | 2018 | ||||||||||||||||||||||
Carrying Amount | Accumulated Amortization | Net Book Value | Carrying Amount | Accumulated Amortization | Net Book Value | ||||||||||||||||||
(in thousands) | |||||||||||||||||||||||
Non-compete agreements | $ | $ | ( | ) | $ | $ | $ | ( | ) | $ | |||||||||||||
Internally developed software | ( | ) | ( | ) | |||||||||||||||||||
Other | ( | ) | ( | ) | |||||||||||||||||||
$ | $ | ( | ) | $ | $ | $ | ( | ) | $ | ||||||||||||||
The amortization of most definite-lived intangible assets is recorded as amortization expense and included under “Depreciation and amortization” expense in our consolidated statements of operations. These amounts were $7.8 million, $5.8 million and $4.2 million for fiscal 2019, 2018 and 2017, respectively.
The following table presents our estimate of future amortization expense for definite-lived intangible assets:
Fiscal Year Ended September 30, | Amortization expense | |||
(in thousands) | ||||
2020 | $ | |||
2021 | ||||
2022 | ||||
2023 | ||||
2024 | ||||
As acquisitions and dispositions occur in the future, amortization expense may vary from these estimates.
73
NOTE 8: DEBT
The following tables present our debt instruments outstanding, contractual maturities and interest expense:
September 30, 2019 | September 30, 2018 | ||||||||||||||||||||||
Gross Amount | Debt Discount and Issuance Costs | Carrying Amount | Gross Amount | Debt Discount and Issuance Costs | Carrying Amount | ||||||||||||||||||
(in thousands) | |||||||||||||||||||||||
2019 Convertible Notes | $ | $ | $ | $ | $ | ( | ) | $ | |||||||||||||||
2019 Convertible Notes Embedded Derivative | |||||||||||||||||||||||
2024 Convertible Notes | ( | ) | ( | ) | |||||||||||||||||||
2025 Convertible Notes | ( | ) | ( | ) | |||||||||||||||||||
8.5% unsecured debt due 2024* | |||||||||||||||||||||||
CASHMAX secured borrowing facility* | ( | ) | ( | ) | |||||||||||||||||||
Total | $ | $ | ( | ) | $ | $ | $ | ( | ) | $ | |||||||||||||
Less current portion | ( | ) | |||||||||||||||||||||
Total long-term debt | $ | $ | ( | ) | $ | $ | $ | ( | ) | $ | |||||||||||||
* | Amounts translated from Guatemalan quetzals and Canadian dollars as of the applicable period end. Certain disclosures omitted due to materiality considerations. |
Schedule of Contractual Maturities | |||||||||||||||||||
Total | Less Than 1 Year | 1 - 3 Years | 3 - 5 Years | More Than 5 Years | |||||||||||||||
(in thousands) | |||||||||||||||||||
2024 Convertible Notes* | |||||||||||||||||||
2025 Convertible Notes* | |||||||||||||||||||
8.5% unsecured debt due 2024 | |||||||||||||||||||
CASHMAX secured borrowing facility | $ | $ | $ | $ | $ | ||||||||||||||
$ | $ | $ | $ | $ | |||||||||||||||
* | Excludes the potential impact of embedded derivatives. |
74
Fiscal Year Ended September 30, | |||||||||||
2019 | 2018 | 2017 | |||||||||
(in thousands) | |||||||||||
Term Loan Facility: | |||||||||||
Contractual interest expense | $ | $ | $ | ||||||||
Amortization of debt discount and deferred financing costs | |||||||||||
Total interest expense | $ | $ | $ | ||||||||
2019 Convertible Notes: | |||||||||||
Contractual interest expense | $ | $ | $ | ||||||||
Amortization of debt discount and deferred financing costs | |||||||||||
Total interest expense | $ | $ | $ | ||||||||
2024 Convertible Notes: | |||||||||||
Contractual interest expense | $ | $ | $ | ||||||||
Amortization of debt discount and deferred financing costs | |||||||||||
Total interest expense | $ | $ | $ | ||||||||
2025 Convertible Notes: | |||||||||||
Contractual interest expense | $ | $ | $ | ||||||||
Amortization of debt discount and deferred financing costs | |||||||||||
Total interest expense | $ | $ | $ | ||||||||
In May 2018, we issued $172.5 million aggregate principal amount of 2.375 % Convertible Senior Notes Due 2025 (the “2025 Convertible Notes”). All of the 2025 Convertible Notes were issued pursuant to an indenture dated May 14, 2018 (the "2018 Indenture") by and between us and Wells Fargo Bank, National Association, as the trustee. Effective October 1, 2019, Branch Banking and Trust Company (“BB&T”), a North Carolina Bank, has assumed the duties and responsibilities as trustee under the 2018 Indenture.
The 2025 Convertible Notes were issued in a private offering and resold under Rule 144A under the Securities Act of 1933. The 2025 Convertible Notes pay interest semi-annually in arrears at a rate of 2.375 % per annum on May 1 and November 1 of each year, commencing November 1, 2018, and will mature on May 1, 2025 (the "2025 Maturity Date"), unless converted, redeemed or repurchased in accordance with their terms prior to such date. At maturity, the holders of the 2025 Convertible Notes will be entitled to receive cash equal to the principal amount of the 2025 Convertible Notes plus unpaid accrued interest.
The 2025 Convertible Notes are convertible based on an initial conversion rate of 62.8931 shares of Class A Non-Voting Common Stock (“Class A Common Stock”) per $1,000 principal amount (equivalent to an initial conversion price of $15.90 per share). The conversion rate will not be adjusted for any accrued and unpaid interest. The 2025 Convertible Notes contain certain make-whole fundamental change premiums and customary anti-dilution adjustments. Upon conversion, we may settle in cash, shares of Class A Common Stock or any combination thereof, at our election. We account for the Class A Common Stock issuable upon conversion under the treasury stock method. If our average share price is over $15.90 per share for any fiscal quarter, we are required to recognize incremental dilution of our earnings per share.
Prior to November 1, 2024, the 2025 Convertible Notes are convertible only under the following circumstances: (1) during any fiscal quarter commencing after the fiscal quarter ended on June 30, 2018 (and only during such fiscal quarter), if the last reported sale price of our Class A Common Stock for at least 20 trading days (whether or not consecutive) during a period of 30 consecutive trading days ending on the last trading day of the immediately preceding fiscal quarter is greater than or equal to 130 % of the conversion price on each applicable trading day; (2) during the five business day period after any five consecutive trading day period (the “measurement period”) in which the trading price, as defined in the 2018 Indenture, per $1,000 principal amount of notes for each trading day of the measurement period was less than 98 % of the product of the last reported sale price of our Class A Common Stock and the conversion rate on such trading day; (3) if we call any or all of the 2025 Convertible Notes for redemption, at any time prior to the close of business on the business day immediately preceding the redemption date; or (4) upon the occurrence of specified corporate events, as defined in the 2018 Indenture. On or after November 1, 2024 until the close of business on the business day immediately preceding the 2025
75
Maturity Date, holders of 2025 Convertible Notes may, at their option, convert their 2025 Convertible Notes at any time, regardless of the foregoing circumstances.
We may not redeem the 2025 Convertible Notes prior to May 1, 2022. At our option, we may redeem for cash all or any portion of the 2025 Convertible Notes on or after May 1, 2022, if the last reported sale price of the Class A Common Stock has been at least 130 % of the conversion price then in effect for at least 20 trading days (whether or not consecutive), including the trading day immediately preceding the date on which we provide notice of redemption, during any 30 consecutive trading day period ending on, and including, the trading day immediately preceding the date on which the Company provides notice of redemption. The redemption price will be equal to 100 % of the principal amount of the 2025 Convertible Notes to be redeemed, plus accrued and unpaid interest to, but excluding, the redemption date.
We measured the fair value of the liability component of the 2025 Convertible Notes under a discounted cash flow approach considering our synthetic credit rating, as determined with external consultation, including inputs that are not observable in the market. The fair value of the liability component was estimated by calculating the present value of the cash flows using a discount rate of 8 % for a similarly structured liability with no conversion feature, maturing in seven years. Our estimate resulted in an initial carrying value of the liability component of the 2025 Convertible Notes of $121.3 million with an associated original issue discount of $51.2 million, exclusive of deferred financing costs, accreted to the face value of the 2025 Convertible Notes based on the effective interest method through the 2025 Maturity Date. The carrying amount of the 2025 Convertible Notes conversion feature (the “2025 Convertible Notes Embedded Derivative”) is currently included under “Additional paid-in capital” in our consolidated balance sheets of September 30, 2019 and was initially calculated as $49.6 million ($39.1 million, net of tax). The 2025 Convertible Notes Embedded Derivative is expected to remain recorded in equity in our consolidated balance sheets as long as it continues to meet the criteria as an equity-classified instrument in subsequent reporting periods.
We incurred transaction costs of $5.5 million related to the issuance of the 2025 Convertible Notes, which we recorded as deferred financing costs and are included under “Long-term debt, net” and “Additional paid-in capital” in our consolidated balance sheets.
The effective interest rate for fiscal 2019 was approximately 9 %. As of September 30, 2019, the remaining unamortized debt discount and issuance costs will be amortized through the 2025 Maturity Date assuming no early conversion.
As of September 30, 2019, the 2025 Convertible Notes were not convertible as no conditions of conversion had been met. Accordingly, the net balance of the 2025 Convertible Notes was classified as a non-current liability in our consolidated balance sheets as of September 30, 2019. The classification of the 2025 Convertible Notes as current or non-current in the consolidated balance sheets is evaluated at each balance sheet date and may change from time to time depending on whether any of the conversion conditions has been met.
If one of the conversion conditions is met in any future fiscal quarter, we will classify our net liability under the 2025 Convertible Notes as a current liability in the consolidated balance sheets as of the end of that fiscal quarter. If none of the conversion conditions have been met in a future fiscal quarter prior to the one-year period immediately preceding the 2025 Maturity Date, we will classify our net liability under the 2025 Convertible Notes as a non-current liability in the consolidated balance sheets as of the end of that fiscal quarter. If the note holders elect to convert their 2025 Convertible Notes prior to maturity, any unamortized discount and transaction costs will be recognized as expense at the time of conversion. If the entire outstanding principal amount had been converted on September 30, 2019, we would have recorded an expense associated with the conversion, comprised of $46.3 million of unamortized debt discount and issuance costs. As of September 30, 2019, none of the note holders had elected to convert their 2025 Convertible Notes. As of September 30, 2019, the if-converted value of the 2025 Convertible Notes did not exceed the principal amount.
In July 2017, we issued $143.75 million aggregate principal amount of 2.875 % Convertible Senior Notes Due 2024 (the “2024 Convertible Notes”). All of the 2024 Convertible Notes were issued pursuant to an indenture dated July 5, 2017 (the “2017 Indenture”) by and between us and Wells Fargo Bank, National Association, as the trustee. Effective October 1, 2019, BB&T has assumed the duties and responsibilities as trustee under the 2017 Indenture.
The 2024 Convertible Notes were issued in a private offering and resold under Rule 144A under the Securities Act of 1933. The 2024 Convertible Notes pay interest semi-annually in arrears at a rate of 2.875 % per annum on January 1 and July 1 of each year, commencing January 1, 2018, and will mature on July 1, 2024 (the “2024 Maturity Date”), unless converted, redeemed or repurchased in accordance with their terms prior to such date. At maturity, the holders of the 2024 Convertible Notes will be entitled to receive cash equal to the principal amount of the 2024 Convertible Notes plus unpaid accrued interest.
76
The 2024 Convertible Notes are convertible based on an initial conversion rate of 100 shares of Class A Common Stock per $1,000 principal amount (equivalent to an initial conversion price of $10.00 per share). The conversion rate will not be adjusted for any accrued and unpaid interest. The 2024 Convertible Notes contain certain make-whole fundamental change premiums and customary anti-dilution adjustments. Upon conversion, we may settle in cash, shares of Class A Common Stock or any combination thereof, at our election. We account for the Class A Common Stock issuable upon conversion under the treasury stock method. If our share priced increases over $10.00 per share, we are required to recognize incremental dilution of our earnings per share.
Prior to January 1, 2024, the 2024 Convertible Notes will be convertible only under the following circumstances: (1) during any fiscal quarter commencing after the fiscal quarter ending on September 30, 2017 (and only during such fiscal quarter), if the last reported sale price of our Class A Common Stock for at least 20 trading days (whether or not consecutive) during a period of 30 consecutive trading days ending on the last trading day of the immediately preceding fiscal quarter is greater than or equal to 130 % of the conversion price on each applicable trading day; (2) during the five business day period after any five consecutive trading day period (the “measurement period”) in which the trading price, as defined in the 2017 Indenture, per $1,000 principal amount of notes for each trading day of the measurement period was less than 98 % of the product of the last reported sale price of our Class A Common Stock and the conversion rate on such trading day; (3) if we call any or all of the 2024 Convertible Notes for redemption, at any time prior to the close of business on the business day immediately preceding the redemption date; or (4) upon the occurrence of specified corporate events, as defined in the 2017 Indenture. On or after January 1, 2024 until the close of business on the business day immediately preceding the 2024 Maturity Date, holders of 2024 Convertible Notes may, at their option, convert their 2024 Convertible Notes at any time, regardless of the foregoing circumstances.
We may not redeem the 2024 Convertible Notes prior to July 6, 2021. At our option, we may redeem for cash all or any portion of the 2024 Convertible Notes on or after July 6, 2021, if the last reported sale price of the Class A Common Stock has been at least 130 % of the conversion price then in effect for at least 20 trading days (whether or not consecutive), including the trading day immediately preceding the date on which we provide notice of redemption, during any 30 consecutive trading day period ending on, and including, the trading day immediately preceding the date on which the Company provides notice of redemption. The redemption price will be equal to 100 % of the principal amount of the 2024 Convertible Notes to be redeemed, plus accrued and unpaid interest to, but excluding, the redemption date.
We measured the fair value of the liability component of the 2024 Convertible Notes under a discounted cash flow approach considering our synthetic credit rating, as determined with external consultation, including inputs that are not observable in the market. The fair value of the liability component was estimated by calculating the present value of the cash flows using discount rates slightly above 8 % for a similarly structured liability with no conversion feature, maturing in seven years. Our estimate resulted in an initial carrying value of the liability component of the 2024 Convertible Notes of $102.7 million with an associated original issue discount of $41.0 million, exclusive of deferred financing costs, accreted to the face value of the 2024 Convertible Notes based on the effective interest method through the 2024 Maturity Date.
We accounted for the conversion feature of the 2024 Convertible Notes as a separate equity-classified instrument (the “2024 Convertible Notes Embedded Derivative”), initially recorded as $39.8 million ($25.3 million, net of tax), inclusive of deferred financing costs, on the issuance date and included under “Additional paid-in capital” in our consolidated balance sheet, including an allocated portion of the deferred financing costs. The 2024 Convertible Notes Embedded Derivative is expected to remain recorded in equity in our consolidated balance sheets as long as it continues to meet the criteria as an equity-classified instrument in subsequent reporting periods. The carrying amount of the 2024 Convertible Notes Embedded Derivative included under “Additional paid-in capital” in our consolidated balance sheet of September 30, 2019 was $25.3 million.
We incurred transaction costs of $4.2 million related to the issuance of the 2024 Convertible Notes, which we recorded as deferred financing costs and are included under “Long-term debt, net” and “Additional paid-in capital” in our consolidated balance sheets. Deferred financing costs recorded under “Long-term debt, net” are being amortized to interest expense over the expected term of the 2024 Convertible Notes.
The effective interest rate for fiscal 2019 was approximately 9 %. As of September 30, 2019, the remaining unamortized debt discount and issuance costs will be amortized through the 2024 Maturity Date assuming no early conversion.
As of September 30, 2019, the 2024 Convertible Notes were not convertible as no conditions of conversion had been met. Accordingly, the net balance of the 2024 Convertible Notes was classified as a non-current liability in our consolidated balance sheets as of September 30, 2019. The classification of the 2024 Convertible Notes as current or non-current in the consolidated balance sheets is evaluated at each balance sheet date and may change from time to time depending on whether any of the conversion conditions has been met.
77
If one of the conversion conditions is met in any future fiscal quarter, we will classify our net liability under the 2024 Convertible Notes as a current liability in the consolidated balance sheets as of the end of that fiscal quarter. If none of the conversion conditions have been met in a future fiscal quarter prior to the one-year period immediately preceding the 2024 Maturity Date, we will classify our net liability under the 2024 Convertible Notes as a non-current liability in the consolidated balance sheets as of the end of that fiscal quarter. If the note holders elect to convert their 2024 Convertible Notes prior to maturity, any unamortized discount and transaction costs will be recognized as expense at the time of conversion. If the entire outstanding principal amount had been converted on September 30, 2019, we would have recorded an expense associated with the conversion, comprised of $32.4 million of unamortized debt discount and issuance costs. As of September 30, 2019, none of the note holders had elected to convert their 2024 Convertible Notes. As of September 30, 2019, the if-converted value of the 2024 Convertible Notes did not exceed the principal amount.
In June 2014, we issued $200 million aggregate principal amount of 2.125 % Cash Convertible Senior Notes Due 2019 (the “2019 Convertible Notes”), with an additional $30 million principal amount being issued in July 2014. In July 2017, we used $34.4 million of net proceeds from the 2024 Convertible Notes offering to repurchase and retire $35.0 million aggregate principal amount of 2019 Convertible Notes. The 2019 Convertible Notes were issued pursuant to an indenture dated June 23, 2014 (the “2014 Indenture”) by and between EZCORP and Wells Fargo Bank, National Association, as the trustee. The 2019 Convertible Notes were issued in a private offering and resold under Rule 144A under the Securities Act of 1933. The 2019 Convertible Notes paid interest semi-annually in arrears at a rate of 2.125 % per annum on June 15 and December 15 of each year. The 2019 Convertible Notes matured on June 15, 2019 (the "2019 Maturity Date"), and the remaining $195.0 million aggregate principal amount outstanding plus accrued interest was repaid using cash on hand. The effective interest rate for fiscal 2019 was approximately 8 %. The cash-settled call options (the “2019 Convertible Notes Hedges”) purchased in conjunction with the issuance of the 2019 Convertible Notes expired worthless.
2019 Convertible Notes Warrants
In connection with the issuance of the 2019 Convertible Notes, we also sold net-share-settled warrants (the “2019 Convertible Notes Warrants”) in privately negotiated transactions with the option counterparties for the purchase of up to approximately 14.3 million shares of our Class A Common Stock at a strike price of $20.83 per share, for total proceeds of $25.1 million, net of issuance costs, which was recorded as an increase in stockholders' equity. The 2019 Convertible Notes Warrants have customary anti-dilution provisions similar to those in the 2019 Convertible Notes. As a result of the 2019 Convertible Notes Warrants, we will experience dilution to our diluted earnings per share if our average closing stock price exceeds $20.83 for any fiscal quarter before expiration of the warrants. The 2019 Convertible Notes Warrants expire on various dates from September 2019 through May 2020 and, if exercised, must be settled in net shares of our Class A Common Stock. Therefore, upon expiration of the 2019 Convertible Notes Warrants, we would issue shares of Class A Common Stock to the purchasers of the 2019 Convertible Notes Warrants that represent the value by which the price of the Class A Common Stock exceeds the strike price stipulated within the particular warrant agreement, if any. As of September 30, 2019, there were a maximum of 8.8 million shares of Class A Common Stock issuable under the 2019 Convertible Notes Warrants outstanding.
Extinguishment of Debt
On September 12, 2016, we and certain of our subsidiaries (as guarantors) entered into a financing agreement with certain lenders and Fortress Credit Co LLC (as collateral and administrative agent) that provided us with a senior secured credit facility in an aggregate principal amount of $100 million, subject to various terms and conditions contained in the financing agreement. The credit facility (the “Term Loan Facility”) consisted of an initial term loan of $50 million that was drawn on September 12, 2016 and a delayed draw term loan of up to $50 million. Borrowings under the facility bore interest at an annual rate initially equal to the London Interbank Offered Rate (“LIBOR”) plus 7.5 %, and we paid a monthly fee of 2.75 % per annum on the average daily unused portion of the delayed draw term loan facility and a quarterly loan servicing fee of $15,000 .
In July 2017, we used $51.6 million of net proceeds from the 2024 Convertible Notes offering to repay all outstanding borrowings under the Term Loan Facility and terminated that facility, including the undrawn delayed draw term loan commitment. The lenders have released all related security interests in our assets.
Also in July 2017, we used $34.4 million of net proceeds from the 2024 Convertible Notes offering to repurchase and retire $35.0 million aggregate principal amount of 2019 Convertible Notes. We unwound a portion of the 2019 Convertible Notes Hedges and 2019 Convertible Notes Warrants corresponding to the repurchased and retired 2019 Convertible Notes. We received $0.6 million in connection with the partial settlement of the 2019 Convertible Notes Hedges and paid $0.5 million in connection with the partial settlement of 2.2 million of the outstanding 2019 Convertible Notes Warrants.
78
We recorded a one-time charge of $5.3 million in the fourth quarter of fiscal 2017 related to these transactions included under “Interest expense” in our consolidated statements of operations, including write-off of unamortized debt discount and issuance costs.
CASHMAX Secured Borrowing Facility
In November 2018, we entered into a receivables securitization facility with a third-party lender (the "lender") to provide funding for installment loan originations in our Canadian CASHMAX business. Under the facility, a variable interest entity (the "trust") has the right, subject to various conditions, to borrow up to CAD $25 million from the lender (the "third-party loan") and use the proceeds to purchase interests in installment loan receivables generated by CASHMAX. The trust uses collections on the transferred receivables to pay various amounts in accordance with an agreed priority arrangement, including expenses, its obligations under the third-party loan and, to the extent available, amounts owed to CASHMAX with respect to the purchase price of the transferred receivables and CASHMAX's retained interest in the receivables. CASHMAX has no obligation with respect to the third-party loan or the transferred receivables except to (a) service the underlying installment loans on behalf of the trust and (b) pay amounts owing under or repurchase the underlying installment loans in the event of a breach by CASHMAX or in certain other limited circumstances. The facility is nonrecourse to EZCORP, allowed borrowing through November 2019, and fully matures in November 2021. Our obligation under the facility as of September 30, 2019 was $0.6 million.
NOTE 9: STOCK COMPENSATION
On May 1, 2010 our Board of Directors approved the adoption of the EZCORP, Inc. 2010 Long-Term Incentive Plan (the “2010 Plan”). The 2010 Plan permits grants of options, restricted stock awards and stock appreciation rights covering up to 5,485,649 shares of our Class A Common Stock plus any shares that become available for issuance under either the 2010 Plan or prior plans as a result of forfeitures or cancellations of awards without delivery of shares or as a result of withholding shares to satisfy tax withholding obligations. In February 2015, March 2015, March 2016, December 2016, December 2017 and November 2018, the Board of Directors and the voting stockholder approved the addition of 643,673 , 1,081,200 , 185,026 , 500,000 , 1,100,000 and 400,000 shares, respectively, to the 2010 Plan.
In April and May 2019, we granted our seven new non-employee directors a total of 60,088 restricted stock awards with a grant date fair value of primarily $10.64 per share. In November 2018, we granted 59,812 restricted stock awards to non-employee directors with a grant date fair value of $9.18 per share. The awards granted to non-employee directors vested on September 30, 2019 and were subject only to service conditions. In July 2019 and November 2018, we granted 61,138 and 971,615 , respectively, restricted stock unit awards to employees with a grant date fair value of primarily $10.04 and $9.18 per share, respectively. The awards granted to employees vest on September 30, 2021, subject to the achievement of certain adjusted net income and adjusted diluted earnings per share performance targets. As of September 30, 2019, we considered the achievement of these performance targets probable. The number of long-term incentive award shares and units granted are generally determined based on our share price as of the close on the last trade day immediately preceding October 1 each year, which was $10.70 for these fiscal 2019 awards.
In December 2017, we granted 1,308,533 restricted stock unit awards to team members and 84,250 restricted stock awards to non-employee directors with a grant date fair value of primarily $9.75 per share. Our long-term incentive awards are generally granted based on our share price as of the close on the last trade day immediately preceding October 1 each year, which was $9.50 for these fiscal 2018 awards. For the awards granted to team members, 190,725 vested on September 30, 2018 as later approved by the compensation committee of the board of directors in November 2018 with regard to achievement of earnings before interest, taxes, depreciation and amortization ("EBITDA") performance targets, and 1,117,808 will vest on September 30, 2020, subject to the achievement of certain EBITDA performance targets. As of September 30, 2019, we considered the achievement of these performance targets probable. The awards granted to non-employee directors vested on September 30, 2018 and were subject only to service conditions.
In November and December 2016 and April 2017, we granted 931,260 restricted stock unit awards to team members and 72,500 restricted stock awards to non-employee directors, each with a grant date fair value of approximately $9.60 per share. Our long-term incentive awards are generally granted based on our share price as of the close on the last trade day immediately preceding October 1 each year, which was $11.06 for these fiscal 2017 awards. The awards granted to team members vest on September 30, 2019, subject to the achievement of certain EBITDA performance targets. As of September 30, 2019, we considered the achievement of these performance targets to be probable. The awards granted to non-employee directors vested over two years, 50 % on September 30, 2017 and 50 % on September 30, 2018 and were subject only to service conditions.
As of September 30, 2019, the unamortized fair value, exclusive of forfeitures, of share awards to be amortized over their remaining vesting periods was approximately $9.1 million. The weighted-average period over which these costs will be amortized is approximately two years.
79
The following table presents amounts related to our stock compensation arrangements:
Fiscal Year Ended September 30, | |||||||||||
2019 | 2018 | 2017 | |||||||||
(in thousands) | |||||||||||
Share-based compensation costs | $ | $ | $ | ||||||||
Income tax benefits on share-based compensation | ( | ) | ( | ) | ( | ) | |||||
The following table presents a summary of stock compensation activity:
Shares | Weighted Average Grant Date Fair Value | |||||
Outstanding as of September 30, 2018 | $ | |||||
Granted | ||||||
Vested and released (a) | ( | ) | ||||
Forfeited | ( | ) | ||||
Outstanding as of September 30, 2019 | $ | |||||
(a) |
The following table presents a summary of the fair value of shares granted:
Fiscal Year Ended September 30, | |||||||||||
2019 | 2018 | 2017 | |||||||||
(in millions except per share amounts) | |||||||||||
Weighted average grant-date fair value per share granted (a) | $ | $ | $ | ||||||||
Total grant date fair value of shares vested | $ | $ | $ | ||||||||
(a) | Awards with performance and time-based vesting provisions are generally valued based upon the underlying share price as of the issuance date. |
Other
We have not declared or paid any dividends and currently do not anticipate paying any dividends in the immediate future. As described in Note 8, payment of a dividend requires an adjustment to the conversion rate of our Convertible Notes. Should we pay dividends in the future, our certificate of incorporation provides that cash dividends on common stock, when declared, must be declared and paid at the same per share amounts on both classes of stock. Any future determination to pay cash dividends will be at the discretion of our Board of Directors.
NOTE 10: INCOME TAXES
The following table presents the components of our income from continuing operations before income taxes, including inter-segment amounts:
Fiscal Year Ended September 30, | |||||||||||
2019 | 2018 | 2017 | |||||||||
(in thousands) | |||||||||||
Domestic* | $ | ( | ) | $ | $ | ||||||
Foreign | |||||||||||
$ | $ | $ | |||||||||
* | Includes the majority of our corporate administrative costs. See Note 15 for information pertaining to segment contribution. |
80
The following table presents the significant components of the income tax provision from continuing operations:
Fiscal Year Ended September 30, | |||||||||||
2019 | 2018 | 2017 | |||||||||
(in thousands) | |||||||||||
Current: | |||||||||||
Federal | $ | $ | ( | ) | $ | ||||||
State and foreign | |||||||||||
Deferred: | |||||||||||
Federal* | ( | ) | |||||||||
State and foreign | ( | ) | ( | ) | |||||||
Total income tax expense | $ | $ | $ | ||||||||
* | The year ended September 30, 2018 includes a $ |
81
The following table presents a reconciliation of income taxes calculated at the statutory rate and the provision for income taxes attributable to continuing operations:
Fiscal Year Ended September 30, | |||||||||||
2019 | 2018 | 2017 | |||||||||
(in thousands) | |||||||||||
Income tax expense at the federal statutory rate | $ | $ | $ | ||||||||
State taxes, net of federal benefit | ( | ) | |||||||||
Mexico inflation adjustment | ( | ) | ( | ) | ( | ) | |||||
Non-deductible items | |||||||||||
Tax credits | ( | ) | ( | ) | ( | ) | |||||
Foreign rate differential | ( | ) | |||||||||
Change in valuation allowance | ( | ) | |||||||||
Stock compensation | ( | ) | ( | ) | |||||||
Uncertain tax positions | ( | ) | ( | ) | |||||||
Change in tax rate resulting from enactment of the Act | |||||||||||
Other | ( | ) | ( | ) | |||||||
Total income tax expense | $ | $ | $ | ||||||||
Effective tax rate | % | % | % | ||||||||
The following table shows significant components of our deferred tax assets and liabilities:
September 30, | |||||||
2019 | 2018 | ||||||
(in thousands) | |||||||
Deferred tax assets: | |||||||
Cash Converters International | $ | $ | |||||
Tax over book inventory | |||||||
Accrued liabilities | |||||||
Pawn service charges receivable | |||||||
Stock compensation | |||||||
Foreign tax credit | |||||||
Capital loss carryforward | |||||||
State and foreign net operating loss carryforwards | |||||||
Book over tax depreciation | |||||||
Other | |||||||
Total deferred tax assets before valuation allowance | |||||||
Valuation allowance | ( | ) | ( | ) | |||
Net deferred tax assets | |||||||
Deferred tax liabilities: | |||||||
Tax over book amortization | |||||||
Note receivable discount | |||||||
Prepaid expenses | |||||||
Total deferred tax liabilities | |||||||
Net deferred tax asset (liability) | $ | $ | ( | ) | |||
As of September 30, 2019, we had state net operating loss carryforwards of approximately $120.0 million, which begin to expire in 2020 if not utilized. We also had foreign net operating loss carryforwards of $50.2 million, which will expire between 2030 and 2038 if not utilized. Additionally, we have a $2.6 million foreign tax credit that will expire between 2024 to 2027 if not utilized.
82
Deferred tax assets and liabilities are recorded for the estimated tax impact of temporary differences between the tax basis and book basis of assets and liabilities. A valuation allowance is established against a deferred tax asset when it is more likely than not that the deferred tax asset will not be realized. Our valuation allowance has been established to offset certain state and foreign net operating loss carryforwards, capital loss carryforwards, and foreign tax credit carryforwards that are not more likely than not to be utilized prior to expiration. The valuation allowance increased by $3.3 million in fiscal 2019, primarily due to the recording of a valuation allowance against the foreign tax credit carryforwards generated during the year which we believe are not more likely than not to be utilized, offset by a decrease of $3.0 million due to the expiration of a capital loss carryforward that expired unused for which a valuation allowance had been recorded. We believe our results from future operations will generate sufficient taxable income in the appropriate jurisdictions such that it is more likely than not that the remaining deferred tax assets will be realized.
Deferred taxes are not provided for undistributed earnings of foreign subsidiaries of approximately $61.0 million which are intended to be reinvested outside of the U.S. Accordingly, no provision for foreign withholding taxes associated with a distribution of those earnings has been made. We estimate that, upon distribution of our share of these earnings, we would be subject to withholding taxes of approximately $3.4 million as of September 30, 2019. We provided deferred income taxes on all undistributed earnings from Cash Converters International.
The following table presents a rollforward of unrecognized tax benefits:
Fiscal Year Ended September 30, | |||||||||||
2019 | 2018 | 2017 | |||||||||
(in thousands) | |||||||||||
Beginning balance | $ | $ | $ | ||||||||
Increase for tax positions taken during a prior period | |||||||||||
Increase for tax positions taken during the current period | |||||||||||
Decrease for tax positions as a result of the lapse of the statute of limitations | ( | ) | ( | ) | |||||||
Ending balance | $ | $ | $ | ||||||||
All of the above unrecognized tax benefits, if recognized, would impact our effective tax rate for the respective period of each ending balance.
We are subject to U.S., Mexico, Canada, Guatemala, Honduras, El Salvador, and Peru income taxes as well as income taxes levied by various state and local jurisdictions. With few exceptions, we are no longer subject to examinations by tax authorities for years before the tax year ended September 30, 2014. We believe that adequate provisions have been made for any adjustments that may result from tax examinations.
83
NOTE 11: RELATED PARTY TRANSACTIONS
Asset Purchase Agreement
The Company entered into an Asset Purchase Agreement, dated June 8, 2017, with Cash Solution Centers, LLC ("CSC"), pursuant to which the Company agreed to acquire, for an aggregate purchase price of $700,329 in cash, certain assets used in the operation of two pawn stores located in Central Texas. Daniel M. Chism, who was appointed Chief Financial Officer of the Company effective May 9, 2017, was the owner of a 28 % interest in CSC. We completed the acquisition on August 14, 2017. Following completion of this transaction, Mr. Chism does not own any interest in any pawn-related businesses outside of his interest in the Company.
The terms of this transaction were reviewed and approved by the Audit Committee of the Board of Directors pursuant to the Company's Policy for Review and Evaluation of Related Party Transactions.
Cash Converters International
The beneficial owner of our Class B Voting Common Stock received AUD $120,000 in annual consulting fees from our 34.75 % owned unconsolidated affiliate Cash Converters International during fiscal 2019, 2018 and 2017.
NOTE 12: LEASES
We lease and sublease various facilities and certain equipment under operating and capital leases. Future minimum rentals due under non-cancelable leases and annual future minimum rentals expected under subleases are as follows:
Fiscal Year Ended September 30, | Operating Lease Payments | Sublease Revenue | |||||
(in thousands) | |||||||
2020 | $ | $ | |||||
2021 | |||||||
2022 | |||||||
2023 | |||||||
2024 | |||||||
Thereafter | |||||||
$ | $ | ||||||
After an initial lease term of generally three to 10 years, our real property lease agreements typically allow renewals in three to five-year increments. Our lease agreements generally include rent escalations throughout the initial lease term. Rent escalations are included in the above amounts, with certain future rental payments contingent on increases in a consumer price index. For financial reporting purposes, the aggregate rentals over the lease term, including lease renewal options that are reasonably assured, are expensed on a straight-line basis.
The following table presents the amount of net rent recognized as expense:
Fiscal Year Ended September 30, | |||||||||||
2019 | 2018 | 2017 | |||||||||
(in thousands) | |||||||||||
Gross rent expense from continuing operations | $ | $ | $ | ||||||||
Sublease rent revenue from continuing operations | ( | ) | ( | ) | ( | ) | |||||
Net rent expense from continuing operations | $ | $ | $ | ||||||||
In December 2014, we entered into a non-cancelable 13-year operating lease for our corporate offices, with rent payments beginning February 2016 and ending March 2029. Annual rent, net of square footage subsequently terminated as a result of negotiations with the landlord, escalated from $2.5 million at lease inception to $3.9 million in the terminal year of the lease.
The lease includes two five-year extension options at the end of the initial lease term. The estimated minimum future rental payments under the lease are approximately $38.1 million. During fiscal 2017 and 2016, we initiated subleases for a portion of our corporate operating office lease for estimated minimum future sublease payments of approximately $12.2 million. In addition to the above subleases, during fiscal 2018 we entered into an amendment to the operating lease surrendering another
84
During the second quarter of fiscal 2015, we entered into cancelable subleases for our Miami office and a non-cancelable Mexico City sublease for an estimated minimum future sublease payment of approximately $4.6 million. Sublease payments are expected to offset substantially all of our original operating lease obligations over the nine-year period beginning March 2015 and ending September 2024 in the case of the Miami lease. The sublease tenant elected to terminate the lease early, effective October 31, 2018 and paid $0.7 million as result of the buyout clause. We entered into a new sublease effective June 2019 to September 2024. Sublease payments are expected to offset substantially all of our original operating lease obligations.
The Mexico City lease and sublease expired in fiscal 2019.
NOTE 13: EMPLOYMENT AGREEMENTS AND RETIREMENT PLANS
Employment Agreements
We provide the following severance benefits to our executive officers:
• | Each of our executive officers will receive salary continuation for one year if his or her employment is terminated without cause. |
• | Generally, restricted stock awards, including those granted to the executive officers, provide for accelerated vesting of some or all of the unvested shares in the event of the holder’s death or disability. |
Retirement Plans
We sponsor a 401(k) retirement savings plan under which eligible team members may contribute a portion of pre-tax earnings. The plan provides for a discretionary match of participants’ elective deferrals in the form of either cash or our Class A Common Stock. The Company discretionary match of the participants’ elective deferrals has been made in the form of cash since 2016, and the ability to invest additional funds into Company stock is prohibited. A participant vests in the Company matching contributions pro rata over their first three years of service. All of a participant’s matching contributions will vest to 100 % in the event of their death, disability or should the plan terminate due to a change in control.
The following table presents matching contribution information for our 401(k) plan, which were made in cash:
Fiscal Year Ended September 30, | |||||||||||
2019 | 2018 | 2017 | |||||||||
(in thousands) | |||||||||||
Matching contributions to EZCORP Inc. 401(k) Plan and Trust | $ | $ | $ | ||||||||
The following table provides contribution and amortized expense amounts related to the Supplemental Executive Retirement Plan:
Fiscal Year Ended September 30, | |||||||||||
2019 | 2018 | 2017 | |||||||||
(in thousands) | |||||||||||
Contributions to the Supplemental Executive Retirement Plan | $ | $ | $ | ||||||||
Amortized expense due to Supplemental Executive Retirement Plan | |||||||||||
NOTE 14: CONTINGENCIES
Currently and from time to time, we are involved in various claims, suits, investigations and legal proceedings, including the lawsuit described below. While we are unable to determine the ultimate outcome of any current litigation or regulatory actions
85
(except as noted below), we believe their resolution will not have a material adverse effect on our financial condition, results of operations or liquidity.
Federal Securities Litigation — In July 2015 and August 2015, two substantially identical lawsuits were filed in the United States District Court for the Western District of Texas. Those lawsuits were subsequently consolidated into a single action under the caption In re EZCORP, Inc. Securities Litigation (Master File No. 1:15-cv-00608-SS). The original complaint related to the Company’s announcement on July 17, 2015 that it will restate its financial statements for fiscal 2014 and the first quarter of fiscal 2015, and alleged generally that the Company issued materially false or misleading statements concerning the Company, its finances, business operations and prospects and that the Company misrepresented the financial performance of the Grupo Finmart business.
In January 2016, the plaintiffs filed an Amended Class Action Complaint (the "Amended Complaint"), which asserted that the Company and Mark E. Kuchenrither, our former Chief Financial Officer, violated Section 10(b) of the Securities Exchange Act and Rule 10b-5, issued materially false or misleading statements concerning the Company and its internal controls, specifically regarding the financial performance of Grupo Finmart. The plaintiffs also allege that Mr. Kuchenrither, as a controlling person of the Company, violated Section 20(a) of the Securities Exchange Act.
In October 2016, the Court granted the defendants’ motion to dismiss and dismissed the Amended Complaint without prejudice. In November 2016, the plaintiffs filed a Second Amended Consolidated Class Action Complaint (“Second Amended Complaint”), raising the same claims previously dismissed by the Court, but reducing the class period (November 7, 2013 to October 20, 2015 instead of November 6, 2012 to October 20, 2015). In May 2017, the Court granted the defendants’ motion to dismiss with regard to claims related to accounting errors relating to Grupo Finmart’s bad debt reserve calculations for “nonperforming” loans, but denied the motion to dismiss with regard to claims relating to accounting errors related to certain sales of loan portfolios to third parties.
Following discovery on the surviving claims, the plaintiff filed a Motion for Leave to File a Third Amended Complaint, seeking to revive the "nonperforming" loan claims that the Court previously dismissed, and on July 26, 2018, the Court granted the plaintiff's motion for leave to amend, thus accepting the Third Amended Consolidated Class Action Complaint. The Court issued an order certifying the class and approving the class representative and class counsel in February 2019, and we appealed that order to the U.S. Fifth Circuit Court of Appeals, which appeal was granted in March 2019.
On May 30, 2019, the parties agreed to a mediated settlement of all remaining claims and entered into a Memorandum of Understanding regarding that settlement. The proposed settlement provides for the payment of $4.9 million by the defendants. On July 18, 2019, the parties entered into a Stipulation and Agreement of Settlement reflecting the terms of the agreed settlement, which was preliminarily approved by the Court on August 5, 2019. The proposed settlement remains subject to several conditions, including final Court approval at a Settlement Hearing scheduled for December 6, 2019.
86
NOTE 15: SEGMENT INFORMATION
We are organized into operating segments based on geographic areas. These operating segments have been aggregated into three reportable business segments as follows: U.S. Pawn — all pawn activities in the United States; Latin America Pawn — all pawn activities in Mexico, Central America and South America; and Other International — primarily our equity interest in the net income of Cash Converters International and consumer finance activities in Canada. Segment information is prepared on the same basis that our chief operating decision maker reviews financial information for operational decision-making purposes. There are no material inter-segment revenues, and the amounts below were determined in accordance with the same accounting principles used in our consolidated financial statements.
Fiscal Year Ended September 30, 2019 | |||||||||||||||||||||||
U.S. Pawn | Latin America Pawn | Other International | Total Segments | Corporate Items | Consolidated | ||||||||||||||||||
(in thousands) | |||||||||||||||||||||||
Revenues: | |||||||||||||||||||||||
Merchandise sales | $ | $ | $ | $ | $ | $ | |||||||||||||||||
Jewelry scrapping sales | |||||||||||||||||||||||
Pawn service charges | |||||||||||||||||||||||
Other revenues | |||||||||||||||||||||||
Total revenues | |||||||||||||||||||||||
Merchandise cost of goods sold | |||||||||||||||||||||||
Jewelry scrapping cost of goods sold | |||||||||||||||||||||||
Other cost of revenues | |||||||||||||||||||||||
Net revenues | |||||||||||||||||||||||
Operating expenses (income): | |||||||||||||||||||||||
Operations | |||||||||||||||||||||||
Administrative | |||||||||||||||||||||||
Depreciation and amortization | |||||||||||||||||||||||
Loss on sale or disposal of assets and other | |||||||||||||||||||||||
Interest expense | |||||||||||||||||||||||
Interest income | ( | ) | ( | ) | ( | ) | ( | ) | |||||||||||||||
Equity in net loss of unconsolidated affiliates | |||||||||||||||||||||||
Impairment of investment in unconsolidated affiliates | |||||||||||||||||||||||
Other expense (income) | ( | ) | ( | ) | |||||||||||||||||||
Segment contribution (loss) | $ | $ | $ | ( | ) | $ | |||||||||||||||||
Income from continuing operations before income taxes | $ | $ | ( | ) | $ | ||||||||||||||||||
87
Fiscal Year Ended September 30, 2018 | |||||||||||||||||||||||
U.S. Pawn | Latin America Pawn | Other International | Total Segments | Corporate Items | Consolidated | ||||||||||||||||||
(in thousands) | |||||||||||||||||||||||
Revenues: | |||||||||||||||||||||||
Merchandise sales | $ | $ | $ | $ | $ | $ | |||||||||||||||||
Jewelry scrapping sales | |||||||||||||||||||||||
Pawn service charges | |||||||||||||||||||||||
Other revenues | |||||||||||||||||||||||
Total revenues | |||||||||||||||||||||||
Merchandise cost of goods sold | |||||||||||||||||||||||
Jewelry scrapping cost of goods sold | |||||||||||||||||||||||
Other cost of revenues | |||||||||||||||||||||||
Net revenues | |||||||||||||||||||||||
Operating expenses (income): | |||||||||||||||||||||||
Operations | |||||||||||||||||||||||
Administrative | |||||||||||||||||||||||
Depreciation and amortization | |||||||||||||||||||||||
Loss on sale or disposal of assets | |||||||||||||||||||||||
Interest expense | |||||||||||||||||||||||
Interest income | ( | ) | ( | ) | ( | ) | ( | ) | |||||||||||||||
Equity in net income of unconsolidated affiliates | ( | ) | ( | ) | ( | ) | |||||||||||||||||
Impairment of investment | |||||||||||||||||||||||
Other income | ( | ) | ( | ) | ( | ) | ( | ) | ( | ) | ( | ) | |||||||||||
Segment contribution (loss) | $ | $ | $ | ( | ) | $ | |||||||||||||||||
Income from continuing operations before income taxes | $ | $ | ( | ) | $ | ||||||||||||||||||
88
Fiscal Year Ended September 30, 2017 | |||||||||||||||||||||||
U.S. Pawn | Latin America Pawn | Other International | Total Segments | Corporate Items | Consolidated | ||||||||||||||||||
(in thousands) | |||||||||||||||||||||||
Revenues: | |||||||||||||||||||||||
Merchandise sales | $ | $ | $ | $ | $ | $ | |||||||||||||||||
Jewelry scrapping sales | |||||||||||||||||||||||
Pawn service charges | |||||||||||||||||||||||
Other revenues | |||||||||||||||||||||||
Total revenues | |||||||||||||||||||||||
Merchandise cost of goods sold | |||||||||||||||||||||||
Jewelry scrapping cost of goods sold | |||||||||||||||||||||||
Other cost of revenues | |||||||||||||||||||||||
Net revenues | |||||||||||||||||||||||
Operating expenses (income): | |||||||||||||||||||||||
Operations | |||||||||||||||||||||||
Administrative | |||||||||||||||||||||||
Depreciation and amortization | |||||||||||||||||||||||
Loss on sale or disposal of assets | |||||||||||||||||||||||
Interest expense | |||||||||||||||||||||||
Interest income | ( | ) | ( | ) | ( | ) | ( | ) | |||||||||||||||
Equity in net income of unconsolidated affiliates | ( | ) | ( | ) | ( | ) | |||||||||||||||||
Other income | ( | ) | ( | ) | ( | ) | ( | ) | ( | ) | ( | ) | |||||||||||
Segment contribution | $ | $ | $ | $ | |||||||||||||||||||
Income from continuing operations before income taxes | $ | $ | ( | ) | $ | ||||||||||||||||||
The following table presents separately identified segment assets:
U.S. Pawn | Latin America Pawn | Other International | Corporate | Total | |||||||||||||||
(in thousands) | |||||||||||||||||||
Assets as of September 30, 2019 | |||||||||||||||||||
Pawn loans | $ | $ | $ | $ | $ | ||||||||||||||
Pawn service charges receivable, net | |||||||||||||||||||
Inventory, net | |||||||||||||||||||
Total assets | |||||||||||||||||||
Assets as of September 30, 2018 | |||||||||||||||||||
Pawn loans | $ | $ | $ | $ | $ | ||||||||||||||
Pawn service charges receivable, net | |||||||||||||||||||
Inventory, net | |||||||||||||||||||
Total assets | |||||||||||||||||||
The net assets of our Latin America Pawn segment, exclusive of intercompany amounts and inclusive of certain other assets not separately identified above, were $205.3 million as of September 30, 2019.
89
Fiscal Year Ended September 30, | |||||||||||
2019 | 2018 | 2017 | |||||||||
(in thousands) | |||||||||||
Revenues: | |||||||||||
United States | $ | $ | $ | ||||||||
Mexico | |||||||||||
Other Latin America | |||||||||||
Canada and other | |||||||||||
Total revenues | $ | $ | $ | ||||||||
September 30, | |||||||
2019 | 2018 | ||||||
(in thousands) | |||||||
Long-lived tangible assets: | |||||||
United States | $ | $ | |||||
Mexico | |||||||
Other Latin America | |||||||
Canada and other | |||||||
Total long-lived assets | $ | $ | |||||
90
NOTE 16: SUPPLEMENTAL CONSOLIDATED FINANCIAL INFORMATION AND DISCONTINUED OPERATIONS
Supplemental Consolidated Financial Information
The following table provides information on net amounts included in our consolidated balance sheets:
September 30, | |||||||
2019 | 2018 | ||||||
(in thousands) | |||||||
Cash and cash equivalents | $ | $ | |||||
Restricted cash | |||||||
Cash and cash equivalents and restricted cash | $ | $ | |||||
Gross pawn service charges receivable | $ | $ | |||||
Allowance for uncollectible pawn service charges receivable | ( | ) | ( | ) | |||
Pawn service charges receivable, net | $ | $ | |||||
Gross inventory | $ | $ | |||||
Inventory reserves | ( | ) | ( | ) | |||
Inventory, net | $ | $ | |||||
Prepaid expenses and other | $ | $ | |||||
Accounts receivable and other | |||||||
Income taxes prepaid and receivable | |||||||
Restricted cash | |||||||
2019 Convertible Notes Hedges | |||||||
Prepaid expenses and other current assets | $ | $ | |||||
Property and equipment, gross | $ | $ | |||||
Accumulated depreciation | ( | ) | ( | ) | |||
Property and equipment, net | $ | $ | |||||
Accounts payable | $ | $ | |||||
Accrued payroll | |||||||
Bonus accrual | |||||||
Other payroll related expenses | |||||||
Accrued interest | |||||||
Accrued rent and property taxes | |||||||
Accrued sales and VAT taxes | |||||||
Deferred revenues | |||||||
Other accrued expenses | |||||||
Income taxes payable | |||||||
Account payable, accrued expenses and other current liabilities | $ | $ | |||||
Unrecognized tax benefits, non-current | $ | $ | |||||
Other long-term liabilities | |||||||
Other long-term liabilities | $ | $ | |||||
Jewelry Scrap Receivable
In November 2018, our principal refiner that processed our scrap jewelry announced Chapter 11 bankruptcy restructuring proceedings in the U.S. As of September 30, 2019 we had $3.6 million of total receivables outstanding which have been fully reserved for and which is included in "Loss on sale or disposal of assets and other" and "Reserve on jewelry scrap receivable" in our consolidated statements of operations and cash flows, respectively. We continue to monitor the bankruptcy process and may record recoveries of such reserved amounts in a future period as we gather more information.
91
Valuation and Qualifying Accounts
The following table provides information on our valuation and qualifying accounts not disclosed elsewhere:
Additions | |||||||||||||||||||
Description | Balance at Beginning of Period | Charged to Expense | Charged to Revenue | Deductions | Balance at End of Period | ||||||||||||||
(in thousands) | |||||||||||||||||||
Allowance for valuation of inventory: | |||||||||||||||||||
Year Ended September 30, 2019 | $ | $ | $ | $ | $ | ||||||||||||||
Year Ended September 30, 2018 | |||||||||||||||||||
Year Ended September 30, 2017 | |||||||||||||||||||
Allowance for uncollectible pawn service charges receivable: | |||||||||||||||||||
Year Ended September 30, 2019 | $ | $ | $ | $ | $ | ||||||||||||||
Year Ended September 30, 2018 | |||||||||||||||||||
Year Ended September 30, 2017 | |||||||||||||||||||
Allowance for uncollectible consumer loan fees and interest receivable: | |||||||||||||||||||
Year Ended September 30, 2019 | $ | $ | $ | $ | $ | ||||||||||||||
Year Ended September 30, 2018 | |||||||||||||||||||
Year Ended September 30, 2017 | |||||||||||||||||||
Allowance for valuation of deferred tax assets: | |||||||||||||||||||
Year Ended September 30, 2019 | $ | $ | $ | $ | $ | ||||||||||||||
Year Ended September 30, 2018 | |||||||||||||||||||
Year Ended September 30, 2017 | |||||||||||||||||||
92
NOTE 17: QUARTERLY INFORMATION (UNAUDITED)
We revised certain historical amounts below as further described in Note 1.
First Quarter | Second Quarter | Third Quarter | Fourth Quarter | ||||||||||||
(in thousands, except per share amounts) | |||||||||||||||
Year Ended September 30, 2019 | |||||||||||||||
Total revenues | $ | $ | $ | $ | |||||||||||
Net revenues | |||||||||||||||
(Loss) income from continuing operations, net of tax | ( | ) | ( | ) | |||||||||||
Loss from discontinued operations, net of tax | ( | ) | ( | ) | ( | ) | ( | ) | |||||||
Net (loss) income | ( | ) | ( | ) | |||||||||||
Net loss attributable to noncontrolling interest | ( | ) | ( | ) | |||||||||||
Net (loss) income attributable to EZCORP, Inc. | $ | ( | ) | $ | $ | $ | ( | ) | |||||||
Basic earnings per share attributable to EZCORP, Inc.: | |||||||||||||||
Continuing operations | $ | ( | ) | $ | $ | $ | ( | ) | |||||||
Discontinued operations | |||||||||||||||
Basic earnings per share | $ | ( | ) | $ | $ | $ | ( | ) | |||||||
Diluted earnings per share attributable to EZCORP, Inc.: | |||||||||||||||
Continuing operations | $ | ( | ) | $ | $ | $ | ( | ) | |||||||
Discontinued operations | |||||||||||||||
Diluted earnings per share | $ | ( | ) | $ | $ | $ | ( | ) | |||||||
First Quarter | Second Quarter | Third Quarter | Fourth Quarter | ||||||||||||
(in thousands, except per share amounts) | |||||||||||||||
Year Ended September 30, 2018 | |||||||||||||||
Total revenues | $ | $ | $ | $ | |||||||||||
Net revenues | |||||||||||||||
(Loss) income from continuing operations, net of tax | ( | ) | |||||||||||||
(Loss) income from discontinued operations, net of tax | ( | ) | ( | ) | ( | ) | |||||||||
Net (loss) income | ( | ) | |||||||||||||
Net income (loss) attributable to noncontrolling interest | ( | ) | ( | ) | ( | ) | |||||||||
Net (loss) income attributable to EZCORP, Inc. | $ | $ | $ | $ | ( | ) | |||||||||
Basic earnings per share attributable to EZCORP, Inc.: | |||||||||||||||
Continuing operations | $ | $ | $ | $ | ( | ) | |||||||||
Discontinued operations | ( | ) | |||||||||||||
Basic earnings per share | $ | $ | $ | $ | ( | ) | |||||||||
Diluted earnings per share attributable to EZCORP, Inc.: | |||||||||||||||
Continuing operations | $ | $ | $ | $ | ( | ) | |||||||||
Discontinued operations | ( | ) | |||||||||||||
Diluted earnings per share | $ | $ | $ | $ | ( | ) | |||||||||
93
Fiscal 2019 Quarterly Impacts
In the fourth quarter of fiscal 2019, RDC received a qualified third-party investment causing recognition of a loss of $1.9 million on expiration of our call option.
In the third quarter of fiscal 2019, we recorded a $6.1 million adjustment in our Latin America segment to correct the calculation of certain transaction tax liabilities in prior periods, comprised of a $4.6 million reduction in merchandise sales and a $1.5 million increase in interest expense.
In the first quarter of fiscal 2019 as a result of our principal scrap jewelry refiner announcing Chapter 11 bankruptcy restructuring proceedings in the U.S., we recorded a reserve of $4.4 million which is included in "Loss on sale or disposal of assets and other" in our consolidated statements, of which $0.8 million was recovered in the second quarter of fiscal 2019 and included in "Loss on sale or disposal of assets and other."
In the first and second quarters of fiscal 2019, we recorded impairments of $13.3 million ($10.3 million, net of taxes) and $6.5 million ($5.0 million, net of taxes), respectively, of our investment in Cash Converters International.
Fiscal 2018 Quarterly Impacts
In the fourth quarter of fiscal 2018, we recorded an $11.7 million impairment ($9.2 million net of tax) of our investment in Cash Converters International.
During the first and third quarters of fiscal 2018, we recorded a $1.6 million and $3.3 million benefit, respectively, associated with the expiration of a statute of limitations on uncertain tax positions included under “Income tax expense” in our consolidated statements of operations. Additionally, in the first and fourth quarters of fiscal 2018 we recorded $2.8 million and $1.9 million, respectively, for the revaluation of our deferred tax assets and liabilities upon enactment of the Tax Cuts and Jobs Act of 2017 included under "Income tax expense" in our consolidated statements of operations.
Interest expense during our third and fourth quarters of fiscal 2018 began trending higher as a result of the issuance of 2025 Convertible Notes as further discussed in Note 8.
In the third quarter of fiscal 2018, we settled a derivative action originally filed July 2014 with a total of $6.5 million paid into a settlement fund. After payment of an approved $1.3 million fee award to the plaintiff's attorneys, the remaining $5.2 million of the settlement fund was paid to the Company because, as a derivative action, the lawsuit was brought on behalf of the Company. We recorded that amount under "Other (income) expense" in our consolidated statements of operations for the third quarter of fiscal 2018.
NOTE 18: SUBSEQUENT EVENTS
Cash Converters International Limited
Subsequent to September 30, 2019 (on October 21, 2019), Cash Converters International agreed to settle the sole remaining class action lawsuit previously filed on behalf of borrowers residing in Queensland, Australia who took out personal loans from Cash Converters between July 30, 2009 and June 30, 2013. Cash Converters International agreed to pay AUD $42.5 million, subject to court approval. We estimate recording a charge of approximately $10.0 million for our share of the settlement from Cash Converters International in fiscal 2020 related to this event, in addition to our regularly included share of their earnings. Cash Converters International has indicated that it expects to pay the settlement amount with cash on hand and cash flow from operations.
ITEM 9 — CHANGES IN AND DISAGREEMENTS WITH ACCOUNTANTS ON ACCOUNTING AND FINANCIAL DISCLOSURE
None.
94
ITEM 9A — CONTROLS AND PROCEDURES
Evaluation of Disclosure Controls and Procedures
Disclosure controls and procedures (as defined in Rules 13a-15(e) and 15d-15(e) under the Exchange Act) are designed to ensure that information required to be disclosed in the reports we file or submit under the Exchange Act is recorded, processed, summarized and reported within the time periods specified in SEC rules and forms and that such information is accumulated and communicated to our management, including our Chief Executive Officer and Chief Financial Officer, to allow timely decisions regarding required disclosures.
In connection with the preparation of this Annual Report on Form 10-K, our management, under the supervision and with the participation of our Chief Executive Officer and Chief Financial Officer, evaluated the effectiveness of the design and operation of our disclosure controls and procedures as of September 30, 2019. Based on that evaluation, our Chief Executive Officer and Chief Financial Officer concluded that our disclosure controls and procedures were not effective as of September 30, 2019 due to a material weakness in internal control over financial reporting as described below (which we view as an integral part of our disclosure controls and procedures). Based on the performance of additional procedures designed to ensure the reliability of our financial reporting, we believe that the consolidated financial statements included in this Annual Report on Form 10-K fairly present, in all material respects, our financial position, results of operations, stockholders’ equity and cash flows as of the dates, and for the periods presented in conformity with GAAP.
Management’s Report on Internal Control Over Financial Reporting
In connection with the preparation of this Annual Report on Form 10-K, our management, under the supervision and with the participation of our Chief Executive Officer and Chief Financial Officer, conducted an assessment of the effectiveness of our internal control over financial reporting as of September 30, 2019 based on the criteria established in Internal Control - Integrated Framework (2013) issued by the Committee of Sponsoring Organizations of the Treadway Commission (COSO). Based on that assessment, our Chief Executive Officer and Chief Financial Officer concluded that our internal control over financial reporting was not effective as of September 30, 2019 due to a material weakness in our information technology general controls (“ITGCs”). A material weakness is a deficiency, or a combination of deficiencies, in internal control over financial reporting, such that there is a reasonable possibility that a material misstatement of our annual or interim financial statements will not be prevented or detected on a timely basis.
During the second quarter of fiscal 2019, we identified deficiencies in our ITGCs that are designed to prevent or detect unauthorized access or changes to certain information technology (“IT”) systems that support our financial reporting processes. Our related IT dependent manual and application controls that are impacted by the affected ITGCs were also deemed ineffective as they rely on reports generated by the IT systems subject to ITGCs, resulting in our inability to place reliance on internal controls over related financial statement accounts and assertions. At that time, we determined that the ITGC deficiencies represent a material weakness in our internal control over financial reporting and reported that material weakness in our Quarterly Report on Form 10-Q for the quarter ended March 31, 2019. Because we have not fully remediated that material weakness as of September 30, 2019, we have concluded that our internal control over financial reporting was not effective as of that date. There were no changes to previously released financial results other than immaterial changes discussed in Note 1 of Notes to Consolidated Financial Statements included in “Part II, Item 8 — Financial Statements and Supplementary Data.”
Our internal control over financial reporting as of September 30, 2019 has been audited by our independent registered public accounting firm, as stated in their report appearing below.
95
Report of Independent Registered Public Accounting Firm
Stockholders and Board of Directors
EZCORP, Inc.
Rollingwood, Texas
Opinion on Internal Control over Financial Reporting
We have audited EZCORP, Inc. (the “Company”) and subsidiaries’ internal control over financial reporting as of September 30, 2019, based on criteria established in Internal Control - Integrated Framework (2013) issued by the Committee of Sponsoring Organizations of the Treadway Commission (the “COSO criteria”). In our opinion, the Company did not maintain, in all material respects, effective internal control over financial reporting as of September 30, 2019, based on the COSO criteria.
We also have audited, in accordance with the standards of the Public Company Accounting Oversight Board (United States) (“PCAOB”), the consolidated balance sheets of the Company and subsidiaries as of September 30, 2019 and 2018, and the related consolidated statements of operations and comprehensive (loss) income, stockholders’ equity, and cash flows for each of the three years in the period ended September 30, 2019, and the related notes (collectively referred to as “the consolidated the financial statements”) and our report dated December 5, 2019, expressed an unqualified opinion thereon.
Basis for Opinion
The Company’s management is responsible for maintaining effective internal control over financial reporting and for its assessment of the effectiveness of internal control over financial reporting, included in the accompanying Item 9A, Management’s Report on Internal Control Over Financial Reporting. Our responsibility is to express an opinion on the Company’s internal control over financial reporting based on our audit. We are a public accounting firm registered with the PCAOB and are required to be independent with respect to the Company in accordance with U.S. federal securities laws and the applicable rules and regulations of the Securities and Exchange Commission and the PCAOB.
We conducted our audit of internal control over financial reporting in accordance with the standards of the PCAOB. Those standards require that we plan and perform the audit to obtain reasonable assurance about whether effective internal control over financial reporting was maintained in all material respects. Our audit included obtaining an understanding of internal control over financial reporting, assessing the risk that a material weakness exists, and testing and evaluating the design and operating effectiveness of internal control based on the assessed risk. Our audit also included performing such other procedures as we considered necessary in the circumstances. We believe that our audit provides a reasonable basis for our opinion.
A material weakness is a deficiency, or a combination of deficiencies, in internal control over financial reporting, such that there is a reasonable possibility that a material misstatement of the company’s annual or interim financial statements will not be prevented or detected on a timely basis. The following material weakness has been identified and included in management’s assessment:
There were ineffective information technology general controls (ITGCs) in the areas of logical access, user administration, program change and database monitoring over certain information technology (IT) systems that support the Company’s financial reporting processes. As a result, certain business process automated and manual controls that were dependent on the affected ITGCs were ineffective because they could have been adversely impacted.
This material weakness was considered in determining the nature, timing, and extent of audit tests applied in our audit of the 2019 financial statements, and this report does not affect our report dated December 5, 2019, on those financial statements.
Definition and Limitations of Internal Control over Financial Reporting
A company’s internal control over financial reporting is a process designed to provide reasonable assurance regarding the reliability of financial reporting and the preparation of financial statements for external purposes in accordance with generally accepted accounting principles. A company’s internal control over financial reporting includes those policies and procedures that (1) pertain to the maintenance of records that, in reasonable detail, accurately and fairly reflect the transactions and dispositions of the assets of the company; (2) provide reasonable assurance that transactions are recorded as necessary to permit preparation of financial statements in accordance with generally accepted accounting principles, and that receipts and expenditures of the company are being made only in accordance with authorizations of management and directors of the company; and (3) provide reasonable assurance regarding prevention or timely detection of unauthorized acquisition, use, or disposition of the company’s assets that could have a material effect on the financial statements.
96
Because of its inherent limitations, internal control over financial reporting may not prevent or detect misstatements. Also, projections of any evaluation of effectiveness to future periods are subject to the risk that controls may become inadequate because of changes in conditions, or that the degree of compliance with the policies or procedures may deteriorate.
/s/ BDO USA, LLP
Dallas, Texas
December 5, 2019
97
Changes in Internal Control Over Financial Reporting
As of March 31, 2019, we had hired a Chief Information Security Officer and subsequently further built-out and developed an IT compliance team whose primary responsibility is to assist us with the design, implementation and maintenance of appropriate controls to safeguard the confidentiality, integrity and availability of our IT operating and reporting systems. We continue to improve our control environment to adequately prevent or detect unauthorized access or changes to our operating systems and databases. As of September 30, 2019, we have implemented a remediation plan focused on (i) completing our IT risk assessment capturing control impacts for changes to our IT environment; (ii) enhancing documentation underlying the ITGCs to promote knowledge transfer upon changes in IT personnel; (iii) IT control enhancements across our logical access and change management processes, including performing manual database logging activities on key systems; and (iv) enhancing our IT Risk and Compliance Governance Committee with members of IT and Finance leadership, with enhanced reporting of remediation activities to the Audit Committee.
As described in "Part II, Item 9A - Controls and Procedures," management believes it is taking the appropriate steps to remediate the underlying ITGC deficiencies, including allowing the controls to operate for a time period to produce sufficient testing sample sizes.
Inherent Limitations on Internal Controls
Notwithstanding the foregoing, management does not expect that our disclosure controls and procedures or our internal control over financial reporting will prevent or detect all errors and all fraud. A control system, no matter how well designed and operated, can provide only reasonable, not absolute, assurance that the objectives of the control system will be met. Limitations inherent in any control system include the following:
• | Judgments in decision-making can be faulty, and control and process breakdowns can occur because of simple errors or mistakes. |
• | Controls can be circumvented by individuals, acting alone or in collusion with others, or by management override. |
• | The design of any system of controls is based in part on certain assumptions about the likelihood of future events, and there can be no assurance that any design will succeed in achieving its stated goals under all potential future conditions. |
• | Over time, controls may become inadequate because of changes in conditions or deterioration in the degree of compliance with associated policies or procedures. |
• | The design of a control system must reflect the fact that resources are constrained, and the benefits of controls must be considered relative to their costs. |
Because of the inherent limitations in all control systems, no evaluation of controls can provide absolute assurance that all control issues and instances of fraud, if any, have been detected.
ITEM 9B — OTHER INFORMATION
None.
98
PART III
ITEM 10 — DIRECTORS, EXECUTIVE OFFICERS AND CORPORATE GOVERNANCE
Board of Directors
Set forth below are the names of the persons who, as of November 1, 2019, constituted our Board of Directors and their ages and committee assignments as of that date:
Name | Age | Committees | ||
Matthew W. Appel | 63 | Audit (Chair), Nominating (Chair), Lead Independent Director | ||
Zena Srivatsa Arnold | 41 | — | ||
Shelaghmichael Brown | 70 | Compensation | ||
Phillip E. Cohen (Executive Chairman) | 72 | — | ||
Stuart I. Grimshaw | 58 | — | ||
Jason A. Kulas | 48 | Audit, Nominating | ||
Pablo Lagos Espinosa | 64 | Compensation (Chair) | ||
Kent V. Stone | 61 | Nominating | ||
Gary L. Tillett | 60 | Audit | ||
Robert W. K. (Robb) Webb | 63 | Compensation | ||
Rosa Zeegers | 59 | Nominating | ||
Director Qualifications — The Board believes that individuals who serve on the Board should have demonstrated notable or significant achievements in business, education or public service; should possess the requisite intelligence, education and experience to make a significant contribution to the Board and bring a range of skills, diverse perspectives and backgrounds to its deliberations; and should have the highest ethical standards, a strong sense of professionalism and intense dedication to serving the interests of our stockholders. The following are qualifications, experience and skills for Board members which are important to our business and its future:
• | Leadership Experience — Our directors should demonstrate extraordinary leadership qualities. Strong leaders bring vision, strategic agility, diverse and global perspectives and broad business insight to the company. They demonstrate practical management experience, skills for managing change and deep knowledge of industries, geographies and risk management strategies relevant to our business. They have experience in identifying and developing the current and future leaders of the company. |
• | Finance Experience — We believe that all directors should possess an understanding of finance and related reporting processes. |
• | Strategically Relevant Experience — Our directors should have business experience that is relevant to our strategic goals and objectives, including geographical and product expansion. We value experience in our high priority growth areas, including new or expanding geographies or customer segments and existing and new technologies; understanding of our business environments; and experience with, exposure to or reputation among a broad subset of our customer base. |
• | Government Experience — Our business is subject to a variety of legislative and regulatory risks. Accordingly, we value experience in the legislative, judicial or regulatory branches of government or government relations. |
Biographical Information — Set forth below is current biographical information about our directors, including the qualifications, experience and skills that make them suitable for service as a director.
• | Matthew W. Appel — Mr. Appel joined EZCORP as a director in January 2015. He serves as Chair of the Audit Committee and is the Lead Independent Director (and, as such, served as Chair of the Nominating Committee). Mr. Appel spent 37 years in finance, administration and operations roles with a variety of companies, most recently Zale Corporation, an NYSE listed jewelry retailer, where he served as Chief Financial Officer from May 2009 to May 2011 and Chief Administrative Officer from May 2011 to July 2014 and co-led the successful turnaround of the company. Prior to joining Zale, Mr. Appel was Chief Financial Officer of EXL Service Holdings, Inc., a NASDAQ listed business process solutions company (February 2007 to May 2009); spent four years (February 2003 to February 2007) at Electronic Data Systems Corporation, serving as Vice President, Finance and Administration BPO and Vice President, BPO Management; and held a variety of finance and operations roles from 1984 to 2003 at Tenneco Inc., Affiliated |
99
Computer Services, Inc. and PricewaterhouseCoopers. Mr. Appel began his professional career with Arthur Andersen & Company, working there from 1977 to 1984. Mr. Appel received an MBA in Accounting from the Rutgers University Graduate School of Business in 1977 and a Business Administration degree from Rutgers College in 1976. Mr. Appel is a Certified Public Accountant and a Certified Management Accountant.
Director qualifications: leadership, chief financial officer and executive management experience; broad business and strategically relevant experience; retail management experience; financial experience, including accounting, tax and financial reporting; experience in developing growth strategies; personnel development.
• | Zena Srivatsa Arnold — Ms. Arnold has been a director since May 2019. She has over 15 years of experience in marketing, brand management, strategy development and business operations. She has spent almost six years with Google, currently serving as Global Head of Growth for Chromebooks. Her previous roles at Google have included General Manager, US Chromebooks (March 2018 to May 2019), Global Head of Marketing, Chromebooks and IoT (November 2016 to March 2018), Head of Americas Marketing, Google Play (April 2015 to October 2016) and Head of NA Marketing, Google Play (October 2013 to April 2015). Prior to joining Google, she spent over nine years in various brand management positions with Kellogg Company (August 2010 to October 2013) and Procter & Gamble (April 2004 to August 2010). Ms. Arnold began her professional career at General Electric Corporation, where she served as Product Manager, Server Solutions for GE Capital IT Solutions (April 2002 to April 2004). Ms. Arnold received a Bachelor of Science degree in Computer Science, with a minor in Business Marketing, from The Ohio State University. She was recognized in 2014 as one of Brand Innovators “40 Under 40,” and has received numerous other professional awards and recognitions. |
Director qualifications: leadership, executive management experience; broad business and strategically relevant experience; experience in developing growth strategies.
• | Shelaghmichael Brown — Ms. Brown joined EZCORP as a director in April 2019. She has more than 35 years of management experience in operations, brand and technology at a variety of financial services institutions and other companies. Ms. Brown retired from BBVA Compass in June 2011 as Senior Executive Vice President and Executive Officer Retail Banking, where she was responsible for a network of over 700 branches; online, mobile and other electronic banking platforms; traditional consumer and small business credit and deposit products; and marketing. Prior to joining BBVA Compass, Ms. Brown was President of RediClinic, Inc.; President and Chief Executive Officer of TeleCheck International, Inc.; and Executive Vice President, Manager-Retail Banking for JP Morgan Chase. Since 2012, Ms. Brown has served on the Board of Trust Managers of Weingarten Realty Investors, an NYSE-listed real estate investment trust, where she has been a member of the Management Development Committee and the Compensation Committee and is currently Chair of the Governance Committee. She also serves on the Board of Directors for BBVA USA Bancshares, Inc., where she is a member of the Risk Committee and the Audit Committee. Ms. Brown received an MBA from the University of Chicago and a Bachelor of Arts degree in American Studies from Wheaton College. She was recognized in 2009, 2010 and 2011 as one of the Top 25 Most Powerful Women in Banking by U.S. Banker. She is engaged in a variety of professional, civic and philanthropic activities, and currently serves as on the Board of Directors, and as Foundation Chairman, of CanCare, Inc. |
Director qualifications: leadership, executive management experience; broad business and strategically relevant experience; retail management experience; financial experience; experience in developing growth strategies; personnel development; deep understanding of conducting business in highly regulated environments.
• | Phillip E. Cohen — Mr. Cohen has been a member of the Board of Directors and the Executive Chairman since September 2019. He has been an owner of, and advisor to, the Company for 30 years. He acquired the Company in 1989 and took it public in 1991 with an initial public offering of Class A Non-Voting Common Stock. Mr. Cohen has over 40 years of investment banking and financial advisory experience with a variety of firms, including Kuhn Loeb & Co. Incorporated (1973-1977), Lehman Brothers Kuhn Loeb Incorporated (1977-1979), The First Boston Corporation (1980), Oppenheimer & Co, Inc. (1980-1984), Morgan Schiff & Co., Inc. (1984-Present) and Madison Park LLC (2004 to Present). Mr. Cohen received a Bachelor of Commerce degree from the University of Melbourne and a Masters of Business Administration from Harvard University. Mr. Cohen is the sole stockholder of MS Pawn Corporation, which is the general partner of MS Pawn Limited Partnership, the owner of 100% of the outstanding shares of our Class B Voting Common Stock. |
Director qualifications: leadership; broad business and strategically relevant experience; retail management experience; financial experience; international experience and global perspective; industry knowledge; experience in developing growth strategies. Further, Mr. Cohen has deep knowledge of the Company and its opportunities and challenges spanning multiple economic cycles.
100
• | Stuart I. Grimshaw — Mr. Grimshaw joined EZCORP in November 2014 as Executive Chairman and a member of the Board of Directors. He became Chief Executive Officer in February 2015. Prior to joining EZCORP, he was Managing Director and Chief Executive Officer of Bank of Queensland Limited (ASX: BOQ), a consumer banking and financial services institution with branches in every Australian state and territory. During his 30-year career in financial services, Mr. Grimshaw held a wide variety of other roles at various banking and finance companies. From 2009 to 2011, he was Chief Executive Officer of Caledonia Investments Pty Ltd. Prior to that, Mr. Grimshaw spent eight years at Commonwealth Bank of Australia, where he served as Group Executive, Premium Business Services (2006 to 2009), Group Executive, Wealth Management (2002 to 2006) and Chief Financial Officer (2001 to 2002). From 1991 to 2001, Mr. Grimshaw held a variety of roles at National Australia Bank (including Chief Executive Officer – Great Britain, and other executive roles in Credit, Institutional Banking, Corporate Financial Services and Global Business Financial Services). Mr. Grimshaw began his career at Australia and New Zealand Banking Group (1983 to 1991). Mr. Grimshaw represented New Zealand in Field Hockey at the 1984 Olympics and has a Bachelor of Commerce and Administration degree from Victoria University in Wellington, New Zealand and an MBA from Melbourne University. He has also completed the Program for Management Development at Harvard Business School. Mr. Grimshaw also serves as non-executive chairman of the board of directors of Cash Converters International Limited. |
Director qualifications: leadership, chief executive officer and executive management experience; broad business and strategically relevant experience; financial experience; international experience and global perspective; industry knowledge; experience in developing growth strategies; personnel development; deep understanding of conducting business in highly regulated environments.
• | Jason A. Kulas — Mr. Kulas has been a director since April 2019. He spent over 25 years in financial analysis, investment banking and executive-level finance and operations roles with a variety of companies, most recently Santander Consumer USA Inc., a NYSE-listed auto finance company, where he served as Chief Executive Officer from 2015 to 2017, a director from 2007 to 2012 and from 2015 to 2017, President from 2013 to 2015 and Chief Financial Officer from 2007 to 2015. Prior to joining Santander Consumer USA, Mr. Kulas was a Managing Director in Investment Banking with J.P. Morgan Chase & Co., where he was employed from 1995 to 2007 and managed JPMorgan’s South Region investment banking office. He has also served as an Adjunct Professor of Marketing at Texas Christian University and as a Financial Analyst at Dun & Bradstreet. Mr. Kulas currently serves on the Board of Directors for Exeter Finance, where he is a member of the Audit Committee, and CityLift Parking. Mr. Kulas received an MBA with a concentration in Finance and Marketing from Texas Christian University and a Bachelor of Arts degree in Chemistry from Southern Methodist University. He is engaged in a variety of civic and philanthropic activities and currently serves on the Board of Directors for Momentous Institute and Baylor Scott & White Dallas Foundation and the Executive Board of Dedman College at Southern Methodist University. |
Director qualifications: leadership, chief executive officer, chief financial officer and executive management experience; broad business and strategically relevant experience; financial experience; experience in developing growth strategies; personnel development.
• | Pablo Lagos Espinosa — Mr. Lagos joined EZCORP as a director in October 2010. He is Chair of the Compensation Committee, a member of the Audit Committee and a member of the Nominating Committee. Mr. Lagos served as President and Chief Executive Officer of Pepsi Bottling Group Mexico from 2006 to 2008 and as its Chief Operating Officer from 2003 to 2006. He previously held various executive management positions with Pepsi Bottling Group, PepsiCo Inc., Unilever Mexico and PepsiCola International, Inc., concentrating exclusively in Latin America. Since his retirement in December 2008, Mr. Lagos has been an investor and consultant in various private business ventures mainly in real estate development and senior living residential services, and has served as a keynote speaker on organizational leadership and management. He currently serves as Chairman of the Board and Executive President for the Mexican subsidiary of Areas, a Spanish global organization dedicated to restaurant and retailing operations in key public transportation hubs, and as Chairman of the board of Casa del Parque, a privately held enterprise focused on developing senior living residences in Mexico. He is also a member of the Mexican Advisory Board for Niagara Waters, a leading manufacturer of bottled water in the U.S. and Mexico. |
Director qualifications: leadership, chief executive officer and executive management experience in significant multi-national environments; deep understanding of strategically important geographies and international markets; risk management experience; financial experience; experience in developing, implementing and managing strategic plans, including international expansion; personnel development; legislative and government relations experience.
• | Kent V. Stone — Mr. Stone joined EZCORP as a director in April 2019. He has 37 years of experience in consumer and small business banking, all with U.S. Bancorp, the fifth largest commercial bank in the U.S. His roles included Vice Chairman, Consumer Banking Sales and Support (2013-2017); Executive Vice President, Consumer Banking Strategic |
101
Support Services (2006-2013); Executive Vice President, Business Banking (2001-2006); and Executive Vice President, Branch Banking (2000-2001). From 1980 to 2000, he held various regional positions with U.S. Bancorp and its predecessor, First Bank System. Mr. Stone’s extensive banking experience includes retail branch management, digital channels, mortgage lending, private banking, product and segment management, and marketing. Mr. Stone received an MBA with a concentration in Finance from the Carlson School of Management at the University of Minnesota in 1985, and a Bachelor of Arts in General Science and Business from Gustavus Alolphus College in 1980. He has been, and continues to be, active in a variety of civic and philanthropic affairs.
Director qualifications: leadership and executive management experience; broad business and strategically relevant experience; retail management experience; financial experience; experience in developing growth strategies; personnel development; deep understanding of conducting business in highly regulated environments.
• | Gary L. Tillett — Mr. Tillett has been a director since April 2019. He has more than 35 years of experience in public accounting and business management. He spent 31 years at PricewaterhouseCoopers, where he progressed from entry-level staff to senior partner serving a variety of businesses in the Insurance Practice, the Transaction Services Practice and the U.S. Financial Services Practice. From 2005 to 2010, he was the Transactions Services Leader of the firm’s U.S. Financial Services Practice, leading a newly assembled team of professionals providing service to clients pursuing transactions in the financial services sector. At the time of his retirement from PwC in 2014, he was the Transaction Services Leader of the firm’s New York Metro Practice, where he led teams advising clients on complex transactions, including structuring, due diligence, valuation and financial reporting. Mr. Tillett left PwC in 2014 to take the role of Executive Vice President and Chief Financial Officer of Walter Investment Management Corp. (now Ditech Holding Corporation), a publicly traded independent originator and servicer of residential mortgage loans. Ditech initiated Chapter 11 bankruptcy proceedings in November 2017. Mr. Tillett retired from his position with Ditech in February 2018 after assisting with the development and execution of the company’s financial restructuring plan. Mr. Tillett received an MBA from the Manchester Business School at the University of Manchester and a Bachelor of Science degree with an emphasis in Accounting from the University of Texas at Dallas. He is a Certified Public Accountant. |
Director qualifications: leadership, chief financial officer and executive management experience; broad business and strategically relevant experience; financial experience, including accounting, tax and financial reporting; personnel development.
• | Robert W. K. (Robb) Webb — Mr. Webb joined EZCORP as a director in April 2019. He has 40 years of experience as a human resources and business leader in complex global business environments, including Chief Human Resources Officer at Tenet Healthcare Corporation (2016-2017); Executive Vice President & Chief Human Resources Officer at Hyatt Hotels Corporation (2007-2016); a variety of human resources and business process management roles with Citigroup and predecessor companies (1999-2007); Vice President, Human Resources & Organizational Effectiveness at Avco Financial Services Inc., a subsidiary of Textron Inc. (1988-1999); and various human resources and organizational development roles with Westinghouse Canada (1979-1988). Mr. Webb received an MBA from the University of Nebraska in 2004 and a Bachelor of Arts degree from McMaster University in Ontario, Canada in 1977. He has participated in advanced management programs at Stanford University and Harvard University. Mr. Webb serves as a director on the Human Rights Campaign Foundation Board, the Global Board of Operation Hope and the Advisory Board at Arena, and has served on the boards of the Dallas Regional Chamber of Commerce and Business for Social Responsibility. |
Director qualifications: leadership and executive management experience; broad business experience; retail management experience; personnel development.
• | Rosa Zeegers — Ms. Zeegers has been a director since April 2019. She has over 30 years of experience in developing and implementing brand, marketing and retail strategies, as well as managing substantial businesses. She most recently served as Executive Vice President of Consumer Products & Experiences with National Geographic Partners, a joint venture of 21st Century Fox and The National Geographic Society (2016-2018). Prior to joining National Geographic Partners, Ms. Zeegers was the Chief Marketing Officer of Tween Brands, Inc. (2015); held a variety of marketing, brand and business development roles at Mattel, Inc. (2001-2014), including most recently, Senior Vice President, Global Business Development; and held a variety of marketing and brand management positions with KLM Royal Dutch Airlines (1995-2000). Ms. Zeegers began her career at Unilever PLC in The Netherlands, where she served in various marketing and sales positions of progressive responsibility. Ms. Zeegers holds a Masters Degree in Marketing from the Dutch Institute of Marketing and a Masters Degree in German Literature from Free University Amsterdam. She serves as a board member of The AHA Foundation, a nonprofit organization dedicated to the defense of women’s rights; a board member of the Full Story Foundation, a nonprofit educational organization; and a member of the advisory board of the Qiddiya Project, part of the Crown Prince of Saudi Arabia’s “Vision 2030.” She is regularly invited by educational and |
102
business organizations to speak on “Doing Business in Foreign Cultures” and was the 2014 recipient of the Most Powerful & Influential Women Award from the National Diversity Council.
Director qualifications: leadership and executive management experience; broad business and strategically relevant experience; financial experience; personnel development.
Executive Officers
Set forth below are the name, age and position of each of the persons serving as our executive officers as of November 1, 2019:
Name | Age | Title | ||
Phillip E. Cohen | 72 | Executive Chairman | ||
Stuart I. Grimshaw | 58 | Chief Executive Officer | ||
Scott Alomes | 60 | Chief Human Resources Officer | ||
Daniel M. Chism | 51 | Chief Financial Officer | ||
Mark DeBenedictus (1) | 58 | Chief Customer Experience Officer | ||
William Eric Fosse | 56 | President, U.S. Pawn | ||
Lachlan P. Given | 42 | Chief M&A and Strategic Funding Officer | ||
Francisco J. Kuthy Saenger | 54 | President, Latin America Pawn | ||
Jacob Wedin | 48 | Chief Business Development Officer | ||
Thomas H. Welch, Jr. | 64 | Chief Legal Officer and Secretary | ||
(1) | Mr. DeBenedictus left the Company effective December 1, 2019. |
Set forth below is current biographical information about our executive officers, except for Mr. Cohen and Mr. Grimshaw, whose biographical information is included under “Board of Directors” above.
Scott Alomes — Mr. Alomes joined EZCORP as Chief Human Resources Officer in March 2015. In October 2016, Mr. Alomes was assigned management oversight responsibility for the Company’s CASHMAX business in Canada, as well as all new ventures, and his title was changed to Chief Human Resources Officer and New Ventures. His title of Chief Human Resources Officer was reinstated in November 2019. He has more than 30 years of experience and has spent his entire career in Human Resources for the financial services industry. He joined EZCORP from Crowe Horwath Australia, where he was HR Leader in the Southern Region for this large provider of accounting, audit, tax business and financial advice to individuals and businesses in Australia. Mr. Alomes has also held HR leadership roles at ClearView Wealth Limited (investments and life insurance products in Australia), Suncorp (banking and wealth management in Australia and New Zealand), Commonwealth Bank and National Australia Bank.
Daniel M. Chism — Mr. Chism rejoined EZCORP as Chief Financial Officer in May 2017. He has over 20 years of accounting, finance and business experience in the pawn industry, with over half of those years at EZCORP. He served as EZCORP’s Controller from August 1999 to October 2009, when he was promoted to Vice President, Finance and Chief Accounting Officer. He served in that position for two years until he left the company in October 2011. Mr. Chism further previously served as interim Chief Financial Officer of EZCORP from May 2010 to November 2010. After leaving the company, Mr. Chism co-founded, and served as Executive Vice President and Chief Financial Officer of, Cash Solutions Centers, LLC, a privately held owner and operator of pawnshops and financial services stores. From May 2015 to July 2016, Mr. Chism also served as Executive Vice President - Chief Financial Officer of the family office Gatsby Investments, LLC, as well as Chief Financial Officer of two consumer products companies in the Gatsby Investments portfolio. Mr. Chism began his professional career at Ernst & Young, where he served as Audit Manager on EZCORP’s account. He holds a Bachelor of Business Administration degree in Accounting and a Master in Professional Accounting degree from the University of Texas at Austin, and is a Certified Public Accountant and a Chartered Global Management Accountant.
Mark DeBenedictus — Mr. DeBenedictus joined EZCORP as Chief Customer Experience Officer in May 2017, after having served as a strategic IT consultant for three months. Mr. DeBenedictus is responsible for executive oversight of the Company’s strategic and operational information technology function and for overseeing the Company’s developing and evolving businesses. Prior to joining EZCORP, Mr. DeBenedictus was founding partner and Chief Operating Officer of Repatriate Advisory Solutions LLC, an IT transformation specialist that assists companies in the evaluation and modification of IT and business process outsourcing arrangements. Prior to forming Repatriate Advisory Solutions in 2016, Mr. DeBenedictus spent five years with American International Group (AIG) as Senior Vice President, Global Infrastructure Services, and over twenty years in a variety of capacities with Electronic Data Services (EDS) and related companies, including Vice President, Global
103
Financial Services; Vice President, U.S. Financial Services; Global Vice President, Service Delivery - Australia and New Zealand; Managing Director - Credit Services; and Client Delivery Executive. Mr. DeBenedictus received a Bachelor of Arts degree in Computer Science from the State University of New York.
William Eric Fosse — Mr. Fosse rejoined EZCORP as Division Vice President of U.S. Pawn in November 2016, was promoted to Senior Vice President of Stores in June 2017 and was promoted to President, U.S. Pawn in July 2018. Mr. Fosse served in various role in two previous periods with EZCORP (September 2004 to December 2012, and September 2014 to May 2015), including Vice President, EZMoney Operations; President, EZMoney; President, Pawn Americas; President, North American Operations; President, U.S. Financial and Online Services; and President Pawn and Cash Converters Americas. From June 2015 to September 2016, Mr. Fosse was CEO of Interstate Automotive Group, a chain of Buy Here/Pay Here auto sales and finance stores operating across 15 states. From December 2012 to September 2014, he was a private investor and consultant concentrating on pawn and financial services businesses. Prior to originally joining EZCORP in 2004, Mr. Fosse spent thirteen years with G&K Services, Inc., a public company providing uniform and facility services to businesses. Mr. Fosse received a Bachelor of Science degree in Business from Indiana University.
Lachlan P. Given — Mr. Given was appointed Chief M&A and Strategic Funding Officer in September 2019. He served as a member of the Board of Directors from July 2014 to September 2019, holding the position of Non-Executive Chairman (July 2014 to August 2014), Executive Vice Chairman (August 2014 to February 2015) and Executive Chairman (February 2015 to September 2019). He also served on the Compensation Committee from July 2014 to April 2019. Mr. Given is the sole beneficial owner of LPG Limited (HK), a business and financial advisory firm, and prior to assuming the role of Executive Vice Chairman of EZCORP, provided international financial and advisory services to a number of companies, including EZCORP from October 2012 to June 2014. Since 2004, Mr. Given has also served as a consultant and advisor to Madison Park LLC, which has, in the past, provided certain advisory services to the Company. Madison Park is wholly owned by Phillip E. Cohen, who is the beneficial owner of all of our Class B Voting Common Stock. Mr. Given is also a director of The Farm Journal Corporation, a 134-year old pre-eminent U.S. agricultural media company; Senetas Corporation Limited (ASX: SEN), a developer and manufacturer of certified, defense-grade encryption solutions; CANSTAR Pty Ltd, an Australian financial services ratings and research firm; and TAB Products Co. LLC, a leading North American records management company. Mr. Given began his career working in the investment banking and equity capital markets divisions of Merrill Lynch in Hong Kong and Sydney, Australia, where he specialized in the origination and execution of a variety of M&A, equity, equity-linked and fixed income transactions. Mr. Given also serves on the board of directors of Cash Converters International Limited.
Francisco J. Kuthy Saenger — Mr. Kuthy joined EZCORP in November 2013 as Senior Vice President of Operations for our Mexico Pawn operations, Empeño Fácil, and was promoted to General Manager of that business in May 2014. Prior to joining EZCORP, Mr. Kuthy spent over three years (May 2010 to November 2013) as General Manager of Farmacias Dermatologicas, S.A. de C.V., Mexico’s leading retailer of dermatology and derma-cosmetic consumer products; and six years with Comercial Mexicana, a large retail chain in Mexico, serving as Chief Operating Officer Bodega Comercial Mexicana (2006 to 2010) and District Manager Comercial Mexicana Bajio (May 2004 to 2006). Mr. Kuthy held previous positions in business development, sales administration, operations and field management with Bachoco, S.A. de C.V. (1997 to 2004), Sabritas, S.A. de C.V. (1997) and Wal-Mart’s Mexican subsidiary (1989 to 1997). Mr. Kuthy received a Bachelor of Arts degree in Economics and an MBA from the Instituto Tecnológico Autónomo de México.
Jacob Wedin — Mr. Wedin joined EZCORP in May 2015 as Chief Product and Process Officer and has served as Chief Business Development Officer since November 2017. Prior to joining us, Mr. Wedin was the CEO of the Mexico Division at Bayport Financial Services, a provider of consumer financial services, including short, medium and long-term loans, where he led Bayport’s expansion into Mexico. Prior to that, he was Bayport’s Business Development Executive in Latin America. Prior to joining Bayport, he served as a representative of the Swedish Trade Commission for several countries in Latin American and the Caribbean, based in Brazil. He is a native of Sweden and received his MBA from the American International University in London.
Thomas H. Welch, Jr. — Mr. Welch joined EZCORP in April 2009 as Senior Vice President, General Counsel and Secretary, with his title changing to Chief Legal Officer and Secretary in May 2017. He joined Dell Inc.’s legal department in 1995, and served as Vice President, Legal and General Corporate Counsel from April 1999 to April 2008. Mr. Welch was principally responsible for legal support of Dell’s corporate securities, corporate finance, mergers and acquisitions, financial services, executive compensation and benefits, facilities, corporate governance and general corporate matters. From 1992 to 1995, Mr. Welch was Vice President - Corporate Development of Parker & Parsley Petroleum Company (predecessor to Pioneer Natural Resources Company), and previously was a shareholder with the law firm of Johnson & Gibbs, P.C., Dallas, Texas. Mr. Welch received a Bachelor of Science degree in Management from Purdue University and a J.D. degree from the University of Texas at Austin.
104
Section 16(a) Beneficial Ownership Reporting Compliance
Based on written representations and a review of the relevant Forms 3, 4 and 5, during fiscal 2019, all persons subject to Section 16 of the Securities Exchange Act of 1934 with respect to EZCORP timely filed all reports required by Section 16(a) of the Securities Exchange Act.
Code of Conduct
We maintain a Code of Conduct that is applicable to all of our team members, including our chief executive officer, chief financial officer and chief accounting officer. That Code of Conduct, which satisfies the requirements of a “code of ethics” under applicable SEC rules, contains written standards that are designed to deter wrongdoing and to promote honest and ethical conduct, including the ethical handling of actual or apparent conflicts of interest; full, fair, accurate, timely and understandable public disclosures and communications, including financial reporting; compliance with applicable laws, rules and regulations; prompt internal reporting of violations of the code, and accountability for adherence to the code. A copy of the Code of Conduct is posted in the Investor Relations section of on our website at www.ezcorp.com
We will post any waivers of the Code of Conduct, or amendments thereto, that are applicable to our chief executive officer, our chief financial officer or chief accounting officer in the Investor Relations section of our website at www.ezcorp.com. To date, there have been no such waivers.
Corporate Governance
Controlled Company Exemptions — The Nasdaq Listing Rules contain several corporate governance requirements for Nasdaq-listed companies. These requirements generally relate to the composition of the board and its committees. For example, the rules require the following:
• | A majority of the directors must be independent (Rule 5605(b)(1)); |
• | The audit committee must have a least three members, each of whom must be independent (Rule 5605(c)(2)); |
• | Executive officer compensation must be determined, or recommended to the board of directors for determination, by either (1) a majority of the independent directors or (2) a compensation committee comprised solely of independent directors (Rule 5605(d)); and |
• | Director nominations must be selected, or recommended for the board’s selection, by either (1) a majority of the independent directors or (2) a nominations committee comprised solely of independent directors (Rule 5605(e)). |
Rule 5615(c)(2), however, provides that a “Controlled Company” is exempt from the requirement to have a majority of independent directors and from the requirements to have independent director oversight over executive compensation and director nominations. The Listing Rules define a “Controlled Company” as a company of which more than 50% of the voting power for the election of directors is held by an individual, a group or another company. EZCORP is a “Controlled Company” within this meaning by virtue of the fact that 100% of the outstanding Class B Voting Common Stock (the only class of voting securities outstanding) is held of record solely by MS Pawn Limited Partnership and beneficially by Phillip E. Cohen.
The Company has relied on the Controlled Company exemptions in the past, but with the reconstitution of the Board of Directors and Board committees in April and May 2019, is not currently relying on such exemptions. The controlling shareholder or the Board may implement changes in the future that would again require the Company to rely on the Controlled Company exemptions under the Nasdaq Listing Rules.
Committees of the Board — The Board of Directors maintains the following committees to assist it in its oversight responsibilities. The current membership of each committee is indicated in the list of directors set forth under “Board of Directors” above.
• | Audit Committee — The Audit Committee assists the Board in fulfilling its responsibility to provide oversight with respect to our financial statements and reports and other disclosures provided to stockholders, the system of internal controls, the audit process and legal and ethical compliance. Its primary duties include reviewing the scope and adequacy of our internal and financial controls and procedures; reviewing the scope and results of the audit plans of our independent and internal auditors; reviewing the objectivity, effectiveness and resources of the internal audit function; appraising our financial reporting activities and the accounting standards and principles followed; and reviewing and approving ethics and compliance policies. The Audit Committee also selects, engages, compensates and oversees our independent auditor and pre-approves all services to be performed by the independent auditing firm. |
105
The Audit Committee is comprised entirely of directors who satisfy the standards of independence described under “Part III, Item 13 — Certain Relationships and Related Transactions, and Director Independence — Director Independence,” as well as additional or supplemental independence standards applicable to audit committee members established under applicable law and Nasdaq listing requirements. The Board has determined that each Audit Committee member meets the Nasdaq “financial literacy” requirement and that Mr. Appel, Chair of the committee, is a “financial expert” within the meaning of the current rules of the SEC.
• | Compensation Committee — The Compensation Committee reviews and approves, on behalf of the Board, the amounts and types of compensation to be paid to our executive officers; reviews and recommends to the full Board the amount and type of compensation to be paid to our non-employee directors; reviews and approves, on behalf of the Board, all bonus and equity compensation to be paid to our other team members; and administers our stock compensation plans. The Compensation Committee is comprised entirely of directors who satisfy the standards of independence described under “Part III, Item 13 — Certain Relationships and Related Transactions, and Director Independence — Director Independence.” |
• | Nominating Committee — In November 2018, the Board of Directors formed and commissioned the Nominating Committee as a standing committee of the Board. The Nominating Committee assists the Board with respect to the selection and nomination of candidates for election or appointment to the Board, including making recommendations to the Board regarding the size and composition of the Board and its committees; recommending to the Board the qualifications needed or required of Board members; identifying and evaluating qualified individuals to become Board members; making recommendations to the full Board regarding the nomination of appropriate candidates; and assessing and monitoring each continuing and prospective director’s independence and qualification to serve on the Board and its committees. The Nominating Committee is comprised entirely of directors who satisfy the standards of independence described under “Part III, Item 13 — Certain Relationships and Related Transactions, and Director Independence — Director Independence.” |
Each of three standing committees is governed by a written charter, a copy of which can be found in the Investor Relations section of our website at www.ezcorp.com.
Meetings and Attendance — The following table sets forth the number of meetings held during fiscal 2019 by the Board of Directors and each committee thereof, as well as the number of times during the year that action was taken by unanimous written consent. The Company’s Bylaws currently require the unanimous attendance of all directors in order for a quorum to be present at a meeting of the Board of Directors. In addition to the number of official Board meetings noted below, the Board of Directors also held six other meetings that were not considered official meetings due to the absence of a quorum. Those meetings were sometimes followed by a unanimous written consent approving the matters that were the subject of the discussions.
All directors attended at least 75% of the meetings of the Board and of the committees on which they served.
Fiscal 2019 | ||
Meetings Held | Action by Unanimous Written Consent | |
Board of Directors | 8 | 8 |
Audit Committee | 8 | — |
Compensation Committee | 10 | 3 |
Nominating Committee | 2 | 2 |
106
ITEM 11 — EXECUTIVE COMPENSATION
COMPENSATION DISCUSSION AND ANALYSIS
This Compensation Discussion and Analysis describes our compensation practices and the executive compensation policies, decisions and actions of the Compensation Committee of our Board of Directors (the “Committee”). It focuses specifically on compensation earned during fiscal 2019 by the following individuals, referred to as our Named Executive Officers.
Name | Position |
Stuart I. Grimshaw | Chief Executive Officer |
Daniel M. Chism | Chief Financial Officer |
Lachlan P. Given (1) | Chief M&A and Strategic Funding Officer |
Joseph L. Rotunda (2) | Chief Operating Officer |
Mark DeBenedictus (3) | Chief Customer Experience Officer |
(1) | Mr. Given served as Executive Chairman until September 12, 2019 but remains an executive officer in the position indicated. |
(2) | Mr. Rotunda served as an executive officer during all of fiscal 2019 but retired effective October 4, 2019. |
(3) | Mr. DeBenedictus served as an executive officer during all of fiscal 2019 but left the Company effective December 1, 2019. |
Executive Compensation Philosophy and Program Design
Philosophy and Goals — Our executive compensation philosophy is grounded on three clearly articulated fundamental principles:
• | Attract and retain high performers — We want to build and maintain an organization that achieves consistently high results. Therefore, we strive to pay at levels that will attract and retain high quality executives capable of sustaining high levels of performance and willing to be accountable for the achievement of results. In line with our philosophy of paying above market for market leading performance, a majority of executive compensation is in the form of incentives that are at risk, but offer significantly higher rewards for the achievement of outstanding results. |
• | Align long-term interests of our shareholders and executives — Executives should be compensated through compensation components (base salaries, short- and long-term incentives) designed to drive sustained business performance, build an internal culture of ownership and create long-term value for our shareholders. |
• | Pay for performance — We expect diligent effort, unwavering commitment and hard work from our executives, and our compensation plans should recognize and reward superior results that generate significant shareholder value. Actual realized compensation should reflect Company and individual performance against specific and quantifiable objectives. Executives should be compensated based on achievement of key operational, financial and strategic results. Compensation earned should align with our sustained performance in terms of profitability and shareholder value. |
These principles are reflected in the following best-practice features of our executive compensation program:
What We Do | What We Don’t Do | ||
þ | Heavy emphasis on performance-based variable pay | ý | Generally no single trigger change-in-control payments |
þ | 100% of equity and equity-linked incentive grants are performance-based | ý | No significant perquisites |
þ | Stock retention requirements for executives and directors | ý | No hedging or pledging of Company stock |
þ | Annual risk assessments | ||
þ | Retain an independent compensation consultant | ||
þ | Incentive clawback policy | ||
107
To further support our fundamental principles, we have designed our executive compensation programs to accomplish the following primary goals:
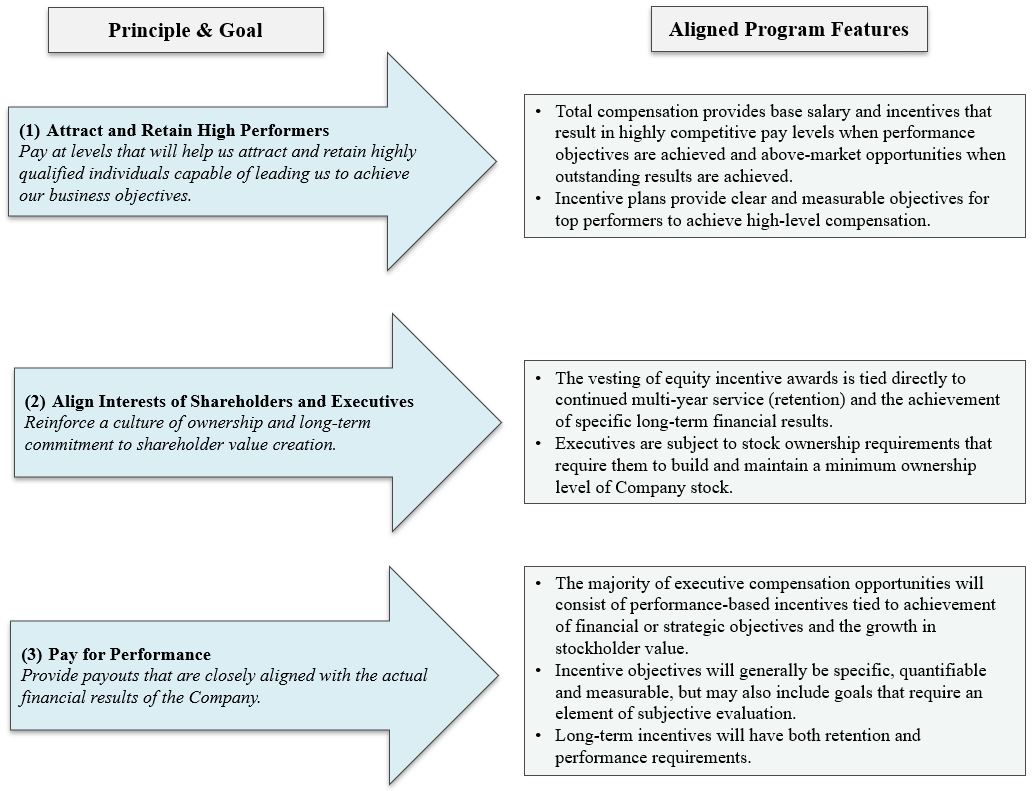
Compensation Components — “Total direct” compensation is composed of three principal components, each one contributing to the accomplishment of our compensation program goals:
Compensation Component | Description | Attract and Retain | Pay for Performance | Shareholder Alignment | Long-term Commitment |
Base Salary | • A market-competitive salary. | ü | |||
Annual Incentives | • Annual cash incentive opportunity that is tied to an assessment of annual corporate and business unit financial performance, as well as individual contribution. | ü | ü | ü | |
Long-term Incentives | • Equity incentive grants, including performance-vested restricted stock grants tied to achievement of consistent multi-year growth in earnings. | ü | ü | ü | ü |
• Annual Supplemental Executive Retirement Plan contributions that vest over the subsequent three years from the date of contribution. | ü | ü | |||
The Committee reviews the executive pay mix of base salary, cash bonus and long-term incentives annually. The Committee does not target a fixed percentage allocation among the compensation elements, but rather aims to provide the majority of executive officer compensation opportunities in the form of incentive compensation.
108
Executive Compensation Governance and Process
Composition of the Compensation Committee
Since April 2019, the Compensation Committee has comprised of three members — Mr. Lagos, Ms. Brown and Mr. Webb — each of whom is an independent director. See Part III, Item 10 — Directors, Executive Officers and Corporate Governance — Board of Directors.” Prior to that time, the Company, relying on the Nasdaq Controlled Company exemptions described in Part III, Item 10 — “Directors, Executive Officers and Corporate Governance — Corporate Governance — Controlled Company Exemptions,” included a non-independent director (Mr. Given) on the Compensation Committee, but the Committee maintained a subcommittee of only independent directors to act on and approve any executive compensation matters that required approval of solely “independent,” “non-employee” or “outside” directors.
Role of the Committee
The Board of Directors has authorized the Committee to establish the compensation programs for all executive officers and to provide oversight for compliance with our compensation philosophy. The Committee delegates the day-to-day administration of the compensation plans to management and retains responsibility for ensuring that the plan administration is consistent with the Company's policies.
Annually, the Committee sets the compensation for our executive officers, including objectives and awards under incentive plans. The Committee also makes recommendations to the Board of Directors on appropriate compensation for the non-employee directors.
In addition to overseeing the compensation of our executive officers, the Committee approves all awards under long-term incentive plans for all other team members. For more information on the Committee's role, see the Committee's charter, which can be found in the Investor Relations section of our website at www.ezcorp.com.
Role of Management
The Committee receives data regarding compensation trends, issues and recommendations from management. Members of management, including our Chief Executive Officer, our Chief Human Resources Officer and our Chief Legal Officer, attend Committee meetings at the invitation of the Committee. In addition, our Chief Executive Officer provides input on individual performance and recommendations regarding compensation adjustments to the Committee for positions other than his own.
Role of the Independent Compensation Consultant
Pursuant to its charter, the Committee has the sole authority to retain, terminate, obtain advice from, oversee and compensate its outside advisors, including its compensation consultant. The Company has provided appropriate funding to the Committee to do so.
For the past several years, the Committee has retained Pearl Meyer & Partners, LLC (“Pearl Meyer”) as its independent executive compensation consultant. None of our management participated in the Committee's decision to retain Pearl Meyer. Pearl Meyer reports directly to the Committee, and the Committee may replace Pearl Meyer or hire additional consultants at any time. Pearl Meyer communicates with, and attends meetings of, the Committee as requested.
The Committee monitors Pearl Meyer’s independence on a regular basis and believes that Pearl Meyer is independent in providing executive compensation consulting services to the Committee.
During fiscal 2019, Pearl Meyer, among other things, advised the Committee on the principal aspects of our executive compensation program, updated the Committee on evolving best practices, and provided market information and analysis regarding the competitiveness of our program design and award values.
Benchmarking and Peer Group Data
In order to attract and retain the best executives for key management positions, we target our compensation plans to approximate the 75th percentile of the competitive marketplace. The Committee believes that this competitive positioning is appropriate in order for us to attract and retain the caliber of executives required to deliver exceptional operational and financial results over time.
It is important to note, however, that the majority of pay opportunities for our top executives are incentive-based and that actual realizable compensation is heavily dependent upon actual Company results. See “Executive Compensation Philosophy and Program Design” above. Failure to achieve targeted results will result in realized compensation being below the 75th percentile, and perhaps below the market median. Conversely, our incentive compensation programs provide opportunities for
109
compensation to exceed the 75th percentile if specified objectives are achieved at targeted levels or higher. The Committee believes that actual realizable compensation for our top executives is well aligned with our performance.
While the Committee does not set compensation levels for our executive officers based solely on survey or peer group benchmarks, the Committee does regularly refer to external benchmarking data in its deliberations in order to ensure that the pay opportunities offered to our executives are appropriate in light of our performance relative to our peers. The Committee regularly asks Pearl Meyer to conduct a competitive compensation review for our executive officers in order to benchmark compensation. Data in the Pearl Meyer study were collected from several sources, including published compensation surveys and peer company proxy statements.
Pearl Meyer delivered its fiscal 2019 executive compensation report to the Committee in November 2018 in connection with the Committee’s review and evaluation of executive compensation programs and levels for fiscal 2019. For that report, Pearl Meyer collected competitive pay data for a peer group of 12 publicly traded companies. This group was revised from the fiscal 2018 peer group of 17 companies to better reflect the Company’s size and overall business mix.
Only one publicly traded, direct business competitor, FirstCash, Inc., exists in the marketplace. As a result, the Committee uses a set of similarly sized companies from relevant industries that serve similar customer bases, operate in the retail or consumer finance industries and typically have similar operating dynamics as the Company. The Committee believes this approach appropriately reflects the diverse labor market for executive talent that the Company competes in and presents a reasonable reference for evaluating the competitiveness of the Company’s executive compensation levels and practices.
The fiscal 2019 peer group consisted of the following companies:
Peer Company | Stock Symbol | Primary Business |
Aaron’s Inc. | AAN | Specialty Retail |
Cardtronics Plc | CATM | Consumer Finance — Fintech |
Conn’s, Inc. | CONN | Specialty Retail |
Enova | ENVA | Consumer Finance |
First Cash, Inc. | FCFS | Consumer Finance — Pawn Operator |
Francesca’s Holdings Corporation | FRAN | Specialty Retail |
goeasy LTD | EHMEF | Consumer Finance |
H&R Block, Inc. | HRB | Consumer Services |
MoneyGram International, Inc. | MGI | Consumer Finance — Fintech |
Regional Management Corp. | RM | Consumer Finance |
World Acceptance Corporation | WRLD | Consumer Finance |
Zumiez Inc. | ZUMZ | Specialty Retail |
When the peer group was approved by the Committee, the Company was within an appropriate range of the peers across the primary scoping metrics used to evaluate the peer group.
To supplement peer group data, Pearl Meyer also provided data from a review of published compensation surveys. Survey data reflected compensation rates across a broad group of general industry companies with revenues of approximately $1 billion. Using a survey sample in combination with peer group data (along with the practice of reviewing market quartiles, as opposed to averages) mitigates the impact of outliers, year-over-year volatility of compensation levels and the risk of selection bias.
Observations from Pearl Meyer’s Fiscal 2019 Benchmarking Report
Pearl Meyer’s fiscal 2019 executive compensation review was substantially consistent with the previous year’s review and generally concluded:
• | The overall total direct compensation at target levels for the Company’s executives falls within range of the market 75th percentile (i.e., +/- 10% of the 75th percentile), with base salaries and total target cash generally above the market 75th percentile and long-term incentive values generally falling between the market median and the 75th percentile. |
• | The Company is well-aligned with peers in terms of balancing reward opportunity and relative risk/difficulty of realization. |
110
• | The average mix of pay for the Company’s executives is more heavily weighted toward incentive-based pay than the market average, with CEO pay in particular being more heavily performance-based than peer company CEO. |
• | The Company’s target short-term incentive opportunities as a percent of salary are generally above the market median, although the upside leverage in the Company’s short-term incentive programs is below typical market practice, resulting in a maximum total cash opportunity for the Company’s executives that falls just above the market 75th percentile. |
• | The Company’s long-term incentive program design is more conservative than market practice due to (a) use of 100% performance-based equity vs. a significant time-vested component at most peer companies and (b) payouts capped at 100% of target vs. typical practice of providing maximum opportunities of 150% to 200% of target. Further, the Company’s equity grants generally cliff-vest at the end of a three-year performance period rather than the more typical pro rata vesting on an annual basis. |
• | The mix of total direct compensation for the Company’s CEO is more heavily performance-based than peers and more heavily weighted toward short-term cash compensation, which places a relatively greater emphasis on producing short-term success. Pearl Meyer observed, however, that the CEO’s overall compensation included a significant long-term component providing balance and longer-term retention value. |
• | The mix of total direct compensation for the Company’s other executives is similar to the market average in terms of balance between short-term and long-term, but the Company’s programs place more emphasis on performance-based pay (short-term and long-term incentive opportunities) relative to the market average. |
Summary of Fiscal 2019 Compensation Actions
Program Design — For fiscal 2019, the Committee approved a limited number of plan design changes for the Company’s executive compensation programs.
Plan | Changed for Fiscal 2019 | Rationale | ||
Short-term incentive compensation plan | No changes to plan design | Company EBITDA performance continues to align with objective in our long-term strategic plan and correlates strongly with Total Shareholder Return. | ||
Long-term incentive plan | Performance metrics changed from 100% EBITDA to 50% adjusted net income and 50% adjusted earnings per share | Diversifies the performance metrics between short- and long-term plans and better aligns management’s long-term incentives with shareholder interests. | ||
Routine Compensation Approvals — The Committee also took the following compensation-related actions for fiscal 2019 (all of which are discussed in more detail below):
• | Base salaries — The Committee determined that base salaries for the executive officers would be held flat for fiscal 2019 compared to fiscal 2018. |
• | Annual incentive bonuses — At the beginning of the year, the Committee approved a short-term incentive (STI) bonus plan that established challenging business performance goals, including consolidated EBITDA (exclusive of the impact of Cash Converters International) of $109.8 million, a 20% increase over the reported EBITDA for fiscal 2018. The approved plan provided for separate performance calculations and payouts of each different business unit, all subject to a “Company Performance Gate,” which was set at $93.3 million of consolidated EBITDA. Recognizing that discrete non-operational items could negatively impact the Company’s reported financial results, the plan gave the Committee the right to make such discretionary EBITDA adjustments in calculating the STI payouts as it deemed appropriate. |
• | At the end of the year, the Committee determined that consolidated EBITDA for fiscal 2019 (taking into account adjustments that it considered appropriate) was $100.6 million. The approved EBITDA adjustments included the impairments and income/loss from operations of Cash Converters International (excluded per plan design); new business development costs; search fees and additional costs for new members of our board of directors; the exclusion of net income from acquisitions not included in the operating plan at the beginning of the year; and other items deemed outside management’s control. Based on the approved adjusted EBITDA, the Committee approved corporate-level STI bonus payout at 70% of target and business unit payouts of 85% for U.S. Pawn, 0% for Empeño Fácil, 58% for GPMX, and 0% for CASHMAX (based on the EBITDA performance of each business unit). |
111
• | Long-term incentives — At the beginning of the year, the Committee approved long-term incentive (LTIP) awards that are 100% subject to performance-based vesting, contingent on the achievement of sustained earnings growth (measured by the annual growth rate in adjusted net income and adjusted diluted earnings per share). Awards vest based on performance measured at the end of a three-year performance period. |
At the end of the year, the Committee approved the vesting of LTIP awards that had been granted at the beginning of fiscal 2017 based on the Company’s adjusted EBITDA performance over the three-year performance period (average annual growth in adjusted EBITDA of 10% or greater), which applied to 80% of the awards, and the reduction in long-term debt over the performance period ($100 million or less of Net Long-Term Debt), which applied to the remaining 20% of the awards.
Executive Chairman — The Committee, after consultation with Pearl Meyer, approved the following compensation arrangements for Phillip E. Cohen in connection with his appointment as Executive Chairman in September 2019:
• | Base salary of $1,500,000 per year. |
• | Incentive compensation opportunity of $1,500,000 per year, awarded in the form of cash-settled phantom stock units (“Units”) tied to the trading price of the Company’s Class A Non-Voting Common Stock, as follows: |
• | Award — At the beginning of a fiscal year (the “Performance Year”), the number of Units awarded will be determined by dividing $1,500,000 by the stock price at the close of the immediately preceding fiscal year. |
• | Vesting — The awarded Units will vest at the end of the Performance Year so long as the “Company Performance Gate” under the Company’s STI plan for the Performance Year has been achieved. The Company Performance Gate is the level of performance (generally measured in terms of adjusted EBITDA) needed to achieve any payout under the STI plan. Even if the Company Performance Gate is achieved, the Committee in its discretion may reduce the number of Units that vest based upon the Committee’s evaluation of Mr. Cohen’s performance during the Performance Year against Key Performance Indicators (KPIs). |
• | Payout — The vested Units will be paid out in two installments. The first installment will be paid as soon as practicable after the end of the Performance Year and will be an amount of cash equal to 50% of the vested Units multiplied by the stock price at the end of the Performance Year. The second installment will be paid out at the end of the next fiscal year and will be an amount of cash equal to 50% of the vested Units multiplied by the stock price at that time. |
In its evaluation of the appropriate compensation arrangement for Mr. Cohen in the position of Executive Chairman, the Committee considered a variety of data, analyses and advice from Pearl Meyer. That data included competitive market data regarding the level and mix of executive chairman pay relative to CEO pay at companies that had both positions. Pearl Meyer collected publicly reported data from similarly-sized financial services companies that reported compensation associated with an executive chairman, as well as survey data for the position of executive chairman from other similarly-sized companies. Based upon its analysis of the market data, Pearl Meyer advised the Committee that total compensation for the Executive Chairman that was at or near 50% of the total compensation for the CEO would yield Executive Chairman total compensation that was below the 75th percentile of the competitive marketplace, which is where the Company generally targets its executive pay.
In addition to the quantum of total compensation for Mr. Cohen in the Executive Chairman role, the Committee also considered the mix of pay (fixed vs. variable, short-term vs. long-term) and the form of payment (cash vs. equity vs. equity-linked). After studying a variety of choices, the Committee concluded that a total compensation package with a higher portion of fixed pay compared to the market data was appropriate given the primarily advisory nature of Mr. Cohen’s expected contributions. The Committee did believe, however, that a significant variable, performance-based component should be an essential element of Mr. Cohen’s compensation package in keeping with our executive program design principles. The Committee ultimately determined that specifically identified, strategic goals are appropriate and structured an incentive opportunity that may pay out at target level (but not in excess of target level) only if the Committee determines at the end of the fiscal year that Mr. Cohen has met or exceeded the performance expectations. The Committee also believed that, generally, Mr. Cohen should not receive an incentive bonus payout if the Company as a whole has not achieved a level of performance that would result in the minimum payout under the management STI bonus plan; however, it reserved the discretion to award long-term incentive in the case of extraordinary accomplishment in furthering achievement of the Company’s strategic plan.
The Committee believed, and Pearl Meyer recommended, that Mr. Cohen’s incentive awards should be tied to stockholder value. Therefore, the Committee structured the incentive opportunity to be awarded in the form of phantom stock units that, if
112
earned, will be paid out in cash over a two-year period, with the amount of each payout being tied to the trading price of the Company’s Class A Non-Voting Common Stock on each payout date.
Mr. Cohen’s base salary for fiscal 2019 was prorated from the date of appointment until September 30, 2019 (approximately $78,000). At the time of appointment, the Committee indicated that it may consider an incentive opportunity of up to $750,000 for fiscal 2019 based on an assessment of Mr. Cohen’s overall contributions (including Company-related activities in which Mr. Cohen has been engaged prior to his appointment as Executive Chairman). Following the end of the year, the Committee reviewed Mr. Cohen’s contributions and approved the payment of a cash bonus of $525,000, or 70% of the incentive opportunity, consistent with the 70% corporate-level performance modifier approved under the STI plan applicable to management.
Chief M&A and Strategic Funding Officer — At the time Mr. Cohen was appointed Executive Chairman, Mr. Given resigned from his position as Executive Chairman and a member of the Board of Directors and assumed the executive officer position of Chief M&A and Strategic Funding Officer. Again with input from Pearl Meyer regarding market compensation for comparable positions, the Committee approved a continuation of Mr. Given’s base salary ($600,000 per year), but approved reductions in Mr. Given’s STI bonus target (from 125% of base salary to 100% of base salary) and LTIP awards (from 150% of base salary to 100% of base salary). The reductions in STI and LTIP target levels reduce Mr. Given’s total target compensation by approximately 20% and place his target levels in-line with the other direct reports to the CEO (prior to the fiscal 2020 reductions noted below).
Components of Compensation
Base Salary
Our primary objective with respect to base salary levels is to provide sufficient fixed cash income to retain and attract experienced leaders in a competitive market for executive talent. The base salaries of our executive officers are reviewed and adjusted (if appropriate) annually to reflect, among other things, individual performance, base salaries for comparable positions from a review of market data discussed previously, experience in role, economic conditions and internal equity.
The following table shows, for each Named Executive Officer, the base salaries that were in effect for fiscal 2019 and 2018:
Named Executive Officer | Fiscal 2019 Base Salary | Fiscal 2018 Base Salary | Increase | |||||||
Mr. Grimshaw | $ | 1,000,000 | $ | 1,000,000 | —% | |||||
Mr. Chism | 450,000 | 450,000 | —% | |||||||
Mr. Given | 600,000 | 600,000 | —% | |||||||
Mr. Rotunda | 675,000 | 675,000 | —% | |||||||
Mr. DeBenedictus (a) | 425,000 | 425,000 | —% | |||||||
(a) | Mr. DeBenedictus’ annual base salary was increased from $350,000 to $425,000 effective November 1, 2017, and therefore, the amount of base salary paid to Mr. DeBenedictus during fiscal 2018 was $418,750. Like the other Named Executive Officers, he received no base salary increase for fiscal 2019. |
In November 2019, the Committee determined that the base salaries for the Named Executive Officers would again be held flat for fiscal 2020. Consequently, the fiscal 2020 base salary for each of the continuing Named Executive Officers will be the same as the base salary for fiscal 2019, as shown in the table above.
Annual Short-Term Incentive
Our executive officers, as well as other key team members, are eligible to participate in our annual Short-Term Incentive Compensation Plan (“STI”). The annual cash bonus opportunities offered to participants in the plan are designed to provide a powerful performance incentive contingent upon participants' contributions toward achievement of annual corporate and business unit financial results, as well as personal objectives that are tied to our strategic goals.
For fiscal 2019, the incentive opportunity for each executive officer was a function of a designated target amount (stated as a percentage of base salary) and a business performance modifier ranging from 0% to 150% based on the achievement of specified EBITDA-based performance goals. For participants in a specific business unit, the performance goal was based on that business unit’s achievement of specified levels of EBITDA. For other corporate-level participants, the performance goal was based on the Company’s achievement of specified levels of consolidated EBITDA ranging from $93.3 million to $126.3 million. The overall plan was subject to a “Company Performance Gate,” such that no STI bonuses would be paid to any participant if the Company did not achieve the minimum level of EBITDA required for a corporate-level payout, regardless of the EBITDA achieved by specific business units. This calculation provided the maximum bonus opportunity for each executive,
113
with the final payout amount being subject to an evaluation of the executive’s individual performance. In calculating EBITDA, the Committee is permitted to make adjustments for special or extraordinary events or circumstances if the Committee, in its discretion, considers it appropriate to do so.
The following table sets forth the fiscal 2019 STI bonus target (stated as a percentage of base salary) for each of the Named Executive Officers, all of whom were subject to the corporate-level performance goal based on consolidated EBITDA:
Named Executive Officer | Fiscal 2019 Target Amount (as a % of base salary) |
Mr. Grimshaw | 250% |
Mr. Chism | 80% |
Mr. Given | 125% |
Mr. Rotunda | 150% |
Mr. DeBenedictus | 100% |
In November 2019, the Committee noted that, based on the Company’s financial results for fiscal 2019, the Company had achieved consolidated EBITDA of $54.5 million. The Committee considered and approved adjustments (both positive and negative) that were designed to exclude the impact of special or extraordinary events that are beyond the control of management. The Committee determined that, with those adjustments, EBITDA for purposes of calculating the fiscal 2019 STI bonus payouts was $100.6 million and, based on that performance, confirmed the consolidated business performance modifier for the fiscal 2019 STI to be 70%. Taking into account the individual performance modifiers, the Committee approved the payouts for the Named Executive Officers as indicated in the “Non-Equity Incentive Plan Compensation” column in the Summary Compensation Table below. Those amounts were calculated as follows:
Named Executive Officer | 2019 Salary | Target Amount | Target Opportunity | Business Performance Modifier (a) | Actual Award Earned | |||||||
Mr. Grimshaw | $ | 1,000,000 | 250% | $ | 2,500,000 | 70% | $ | 1,750,000 | ||||
Mr. Chism | 450,000 | 80% | 360,000 | 70% | 126,000 | |||||||
Mr. Given (b) | 600,000 | 125% | 750,000 | 70% | 519,534 | |||||||
Mr. Rotunda | 675,000 | 150% | 1,012,500 | 70% | 637,875 | |||||||
Mr. DeBenedictus | 425,000 | 100% | 425,000 | 70% | 223,125 | |||||||
(a) | For Mr. Grimshaw and Mr. Given, 100% of their Target Opportunity is subject to the Business Performance Modifier. For each of the other Named Executive Officers, 50% of the Target Opportunity is subject to reduction based on the Individual Performance Modifier and then the Business Performance Modifier is applied to the resulting Target Opportunity. The Individual Performance Modifiers for Mr. Chism, Mr. Rotunda and Mr. DeBenedictus were recommended by the Chief Executive Officer and approved by the Compensation Committee. The Chief Executive Officer’s recommendations were based on his subjective evaluation of each executive's performance during the year relative to the Company's performance as a whole, with the expectation that only extraordinary performance would merit a 100% Individual Performance Modifier. |
(b) | Mr. Given’s participation during fiscal 2019 is prorated at 100% of his Target Opportunity tied to the Business Performance Modifier from October 1, 2018 through September 12, 2019, when he assumed the position of Chief M&A and Strategic Funding Officer. In his new role, 50% of his Target Opportunity is subject to reduction based on the Individual Performance Modifier and then the Business Performance Modifier is applied to the resulting Target Opportunity. |
In November 2019, the Committee approved the STI plan for fiscal 2020. The fiscal 2020 STI plan contains the same design elements as the fiscal 2019 plan. Upon management’s recommendation, however, the Committee approved reductions in the Target Amount percentages for certain executive officers. These reductions are part of management’s overall plan to reduce administrative expenses going forward. For fiscal 2020, the Target Amount percentages for each of the continuing Named Executive Officers will be as follows: Mr. Grimshaw, 225%; Mr. Chism, 60%; and Mr. Given, 75%.
Long-Term Incentives
General — Long-term incentive compensation, in the form of performance-based equity awards, is a key component in our executive compensation program, helping to encourage long-term commitment, shareholder alignment and long-term performance orientation. The value of equity awards over time bears a direct relationship to the price of our shares and the returns experienced by our stockholders. These awards are made under the EZCORP Long-Term Incentive Plan (“LTIP”).
All of our executive officers are eligible to receive equity incentive awards. Since fiscal 2016, we have structured our long-term incentive compensation program to place greater emphasis on long-term performance that enhances stockholder value. Unlike
114
many of our peers who have a significant time-vested component to their long-term awards, 100% of our long-term incentive awards are subject to performance-based vesting. In order to further emphasize the long-term nature of these awards, 100% of the LTIP awards vest at the end of a three-year performance period, rather than a prorated vesting each year during the performance period. The Committee believes this structure incentivizes and rewards longer term vision and strategies and provides a balance to the Company’s short-term programs, which tend to be focused on annual performance.
Grant frequency — The Committee considers new LTIP grants for all executives every year, although we do not necessarily grant new equity to all executives every year. The frequency of LTIP grants and the amount of equity awards granted in a given year are based in part upon an assessment of past equity awards still outstanding at the time new grants are to be made.
LTIP awards may be made at any time as determined by the Committee, and the grant price for accounting purposes is generally the closing trading price on the date the award is approved. The annual LTIP awards, however, are intended to incentivize performance over the full designated performance period. Therefore, the Committee considers it appropriate to use the stock price at the beginning of the performance period in determining the number of shares or units to be granted, even though the awards may be approved by the Committee at a later date. In the Committee’s view, this methodology, consistently applied, neutralizes the stock price as a factor impacting the timing of awards.
Fiscal 2019 LTIP awards — In November 2018, the Committee considered and approved significant changes in the LTIP plan design for fiscal 2019 to better align management’s incentives with measures that shareholders consider to be reflective of long-term value creation. Specifically, the Committee replaced the EBITDA-based performance measure used for several years with two equally-weighted performance measures — one based on net income and the other based on diluted earnings per share (EPS), with both measures subject to adjustments designed to eliminate certain non-cash income and expense items, the impact of foreign currency fluctuations and, at the discretion of the Committee, other items or events beyond management’s control. The approved awards consist of restricted stock units that vest at the end of a three-year performance period (September 30, 2021) based on the following performance metrics: the vesting of 50% of the units is subject to achieving specified adjusted net income growth targets, and the vesting of 50% of the units is subject to achieving specified adjusted diluted EPS growth targets. The specified performance metrics provide for vesting of either 0% (Below Threshold), 50% (Threshold) or 100% (Target) of the units, depending on the level of performance on each respective metric; there is no “kicker” for over-performance, and no more than 100% of the units will vest in any event. There is no interpolation for performance between Threshold and Target; thus, performance between Threshold and Target results in 50% vesting for each metric.
The number of units awarded to each recipient was a function of a multiple of the recipient’s base salary divided by $10.70 (the closing trading price of the Class A Common Stock on September 28, 2018, the last trading day of the preceding fiscal year).
The following table shows the approved fiscal 2019 LTIP awards for the Named Executive Officers:
Named Executive Officer | Percent of Base Salary | Number of Units | |
Mr. Grimshaw | 300% | 280,373 | |
Mr. Chism | 100% | 42,056 | |
Mr. Given | 150% | 84,112 | |
Mr. Rotunda | 100% | 63,084 | |
Mr. DeBenedictus | 100% | 39,719 | |
Fiscal 2020 LTIP Awards — In November 2019, the Committee approved the size of fiscal 2020 LTIP awards (expressed as a percent of base salary) for each participant in the fiscal 2020 LTIP program. Upon management’s recommendation, the Committee approved reductions in the percentage of base salary used to compute the number of units awarded to certain executive officers. These reductions are part of management’s overall plan to reduce administrative expenses going forward. For fiscal 2020, the LTIP award for each of the continuing Named Executive Officers will be based on the following percentages of base salaries: Mr. Grimshaw, 200%; Mr. Chism, 80%; and Mr. Given, 80%. The Committee has not yet finalized the overall structure of the fiscal 2020 LTIP awards, including the specific vesting and performance criteria.
Supplemental Executive Retirement Plan
We provide selected executives, including all of the Named Executive Officers, with a non-qualified Supplemental Executive Retirement Plan (“SERP”) in order to offset some of the negative impacts of the highly paid executive contribution limitations applicable to our 401(k) retirement savings plan. For fiscal 2019, the Committee approved contributions to the SERP for each of the executive officers equal to 10% of base salary. This resulted in the following contributions to the SERP for each of the
115
Named Executive Officers:
Named Executive Officer | Fiscal 2019 SERP Contribution | ||
Mr. Grimshaw | $ | 100,000 | |
Mr. Chism | 45,000 | ||
Mr. Given | 60,000 | ||
Mr. Rotunda | 67,500 | ||
Mr. DeBenedictus | 42,500 | ||
In November 2019, the Committee approved fiscal 2020 contributions to the SERP equal to 10% of base salary for each of the executive officers, including the continuing Named Executive Officers.
Other Benefits and Perquisites
The executive officers participate in other benefit plans on the same terms as other team members. These plans include medical, dental and life insurance benefits, and our 401(k) retirement savings plan. In addition, we provide supplemental healthcare benefits to our executive officers. The amount of that benefit for the Named Executive Officers is included in the “All Other Compensation” column of the Summary Compensation Table below.
Our executives who come to the U.S. from other countries find it difficult to secure automobile leases because of their visa status. To assist with this difficulty, the Company has either purchased or leased automobiles on behalf of certain of our expatriate executive officers and then leased or released the automobiles to the executives. We do not consider these arrangements to be compensatory, as the leases to the executives are designed to reimburse the Company the full costs associated with these arrangements.
Clawback Policy
The Board of Directors retains the right to seek reimbursement (clawback) of incentive compensation (whether cash or equity) from any executive officer who has, in the Board’s determination, violated Company policies or otherwise engaged in intentional misconduct that, in either case, caused a material restatement of financial results
Anti-Hedging Policy
The Company maintains a policy prohibiting the trading of derivatives or “short-selling” Company stock by members of the Board of Directors, executive officers or any other persons associated or affiliated with the Company (through employment, contractual relationship or otherwise) who are designated from time to time by the Board of Directors. The Board believes that this policy, by preventing the shifting of the risks of ownership of Company stock, helps to align the interests of management with the interests of the other Company stockholders.
Executive Share Retention Policy
The Board of Directors has adopted stock ownership requirements applicable to the members of the Board of Directors and the executive officers. Pursuant to those requirements, each non-executive member of the Board of Directors and each executive officer is required to hold a number of shares of Class A Non-Voting Common Stock having a market value equal to the applicable “Required Multiple” of the annual retainer fee (in the case of the non-executive directors) or base salary (in the case of the executive officers). The Required Multiple is equity to 4X for the non-executive directors and the CEO, 2X for the Executive Chairman and 1X for the other executive officers. Each person subject to the stock ownership requirements is required to hold at least 50% (in the case of the non-executive directors) or 30% (in the case of the executive officers) of each vesting of restricted stock or restricted stock units until the required stock ownership amount is satisfied. Thereafter, such person can sell shares (subject to the Company’s trading window policy) so long as the required stock ownership amount is maintained.
Other Executive Compensation Matters
Severance — We provide the following severance benefits to our executive officers:
• | Each of our executive officers will receive salary continuation for one year if his or her employment is terminated by the Company without cause. |
116
• | Generally, restricted stock awards, including those granted to the executive officers, provide for accelerated vesting of some or all of the unvested shares or units in the event of the holder's death or disability. |
More information on severance arrangements can be found under “Other Benefit Plans — Certain Termination Benefits” below. The Committee believes that these benefits provide important protection to the executive officers, are consistent with practice of the peer companies and are appropriate for attraction and retention of executive talent.
Restrictive Covenants — Each of the Company's executive officers (other than Mr. Cohen and Mr. Wedin), along with other key team members, has entered into a Protection of Sensitive Information, Non-competition and Non-solicitation Agreement, under which the executive is subject to confidentiality and non-disclosure obligations with respect to various categories of proprietary, competitively sensitive and confidential information. In addition, each such executive has agreed that, for a period of one year following the termination of employment with the Company, he or she will not compete with the Company (within a defined area) and will not solicit the Company's team members or suppliers.
Compensation Committee Report
The Compensation Committee has reviewed the foregoing Compensation Discussion and Analysis and has discussed it with management. Based on that review and those discussions, the Committee has recommended to the Board of Directors that the Compensation Discussion and Analysis be included in our Annual Report on Form 10-K for the fiscal year ended September 30, 2019.
Pablo Lagos Espinosa (Chair) Shelaghmichael Brown Robert W.K. Webb | |||
Compensation Risk
The Committee continually monitors the Company's general compensation practices, specifically the design, administration and assessment of our incentive plans, to identify any components, measurement factors or potential outcomes that might create an incentive for excessive risk-taking detrimental to the Company. The Committee has determined that our compensation plans and policies do not encourage excessive risk-taking.
Our executive compensation program provides a balance of short-term and long-term incentives that reward achievement of profitable, consistent and sustainable results.
• | Annual incentive compensation tied to achievement of profitable Company or business unit performance (as measured by consolidated and/or business unit EBITDA); and |
• | Meaningful long-term equity incentive opportunities that are 100% performance-based and provide an incentive to deliver long-term growth in stockholder value as a result of sustained earnings growth, prudent balance sheet management or other measures. |
Compensation Committee Interlocks and Insider Participation
Mr. Given (who served as a member of the Compensation Committee until April 11, 2019) is also an executive officer of the Company. The other persons who served as members of the Compensation Committee during fiscal 2019 (Mr. Appel, Ms. Brown, Mr. Lagos and Mr. Webb) are not and have never been an officer of or employed by the Company and do not have any relationship that requires disclosure under Item 404 of Regulation S-K, the SEC’s rules requiring disclosure of certain relationships and related party transactions.
117
Summary Compensation Table
The table below summarizes the total compensation for fiscal 2019, 2018 and 2017 for the Named Executive Officers. See “Part III, Item 11 — Executive Compensation — Compensation Discussion and Analysis” for a description of how we determined the Named Executive Officers.
Name and Principal Position | Fiscal Year | Salary (1) | Bonus | Stock Awards (2) | Non-Equity Incentive Plan Compensation (3) | All Other Compensation (4) | Total | ||||||||||||||||||
Stuart I. Grimshaw (5) Chief Executive Officer | 2019 | $ | 1,000,000 | $ | — | $ | 2,573,824 | $ | 1,750,000 | $ | 381,200 | $ | 5,705,024 | ||||||||||||
2018 | 1,000,000 | — | 3,702,943 | 2,625,000 | 175,811 | 7,503,754 | |||||||||||||||||||
2017 | 1,000,000 | — | 2,603,981 | 1,925,000 | 315,929 | 5,844,910 | |||||||||||||||||||
Daniel M. Chism Chief Financial Officer | 2019 | 450,000 | — | 386,074 | 126,000 | 70,497 | 1,032,571 | ||||||||||||||||||
2018 | 450,000 | — | 461,838 | 302,400 | 80,587 | 1,294,825 | |||||||||||||||||||
2017 | 159,231 | — | — | 85,447 | 8,574 | 253,252 | |||||||||||||||||||
Lachlan P. Given (5)(6) Chief M&A and Strategic Funding Officer | 2019 | 600,000 | — | 772,148 | 519,534 | 81,372 | 1,973,054 | ||||||||||||||||||
2018 | 600,000 | — | 1,110,886 | 787,500 | 153,588 | 2,651,974 | |||||||||||||||||||
2017 | 600,000 | — | 781,190 | 577,500 | 198,213 | 2,156,903 | |||||||||||||||||||
Joseph L. Rotunda (7) Chief Operating Officer | 2019 | 675,000 | — | 579,111 | 637,875 | 83,808 | 1,975,794 | ||||||||||||||||||
2018 | 675,000 | — | 864,367 | 1,063,125 | 90,399 | 2,692,891 | |||||||||||||||||||
2017 | 668,750 | — | 585,898 | 779,625 | 81,924 | 2,116,197 | |||||||||||||||||||
Mark DeBenedictus (8) Chief Customer Experience Officer | 2019 | 425,000 | — | 364,620 | 223,125 | 61,529 | 1,074,274 | ||||||||||||||||||
2018 | 418,750 | — | 359,210 | 395,605 | 57,216 | 1,230,781 | |||||||||||||||||||
2017 | 96,923 | — | — | 138,257 | 86,092 | 321,272 | |||||||||||||||||||
(1) | The amounts shown under “Salary” reflect the gross amounts of base salary paid to each of the Named Executive Officers during the fiscal years so noted. The fiscal 2017 amounts for Mr. Chism and Mr. DeBenedictus reflect the number of days during the fiscal year that he was employed by the Company. For Mr. DeBenedictus, the amount shown under All Other Compensation for fiscal 2017 includes the amounts we paid to him as a consultant prior to the start of his employment. See the table under “Other Benefits and Perquisites — All Other Compensation” below. |
(2) | Amounts represent the aggregate grant date fair value of restricted stock or restricted stock unit awards, computed in accordance with FASB ASC 718-10-25. See Note 9 of Notes to Consolidated Financial Statements included in “Part II, Item 8 — Financial Statements and Supplementary Data.” The actual value realized by the Named Executive Officer with respect to stock awards will depend on whether the award vests and, if it vests, the market value of our stock on the date the stock is sold. |
For a description of these awards, see the “Grant of Plan-Based Awards” table under “Incentive Plan Based Awards” below. See also “Compensation Discussion and Analysis — Components of Compensation — Long-Term Incentives” above.
(3) | Amounts represent the bonuses paid pursuant to the Short-Term Incentive Compensation Plan. See “Compensation Discussion and Analysis — Components of Compensation — Annual Incentive Bonuses” above. |
(4) | Amounts include the cost of providing various perquisites and personal benefits, as well as the value of our contributions to the company-sponsored 401(k) plan and Supplemental Executive Retirement Plan. For detail of the amounts shown for each Named Executive Officer, see the table under “Other Benefits and Perquisites — All Other Compensation” below. |
(5) | Mr. Grimshaw and Mr. Given also serve on the board of directors of Cash Converters International Limited, with Mr. Grimshaw serving as non-executive chairman. The director fees paid to them by Cash Converters International Limited for fiscal 2019, fiscal 2018 and fiscal 2017 were as follows: Mr. Grimshaw, $119,678, $129,329 and $129,538, respectively; Mr. Given, $66,879, $72,272 and $81,009, respectively. These amounts are not included in the Summary Compensation Table, as they were paid by Cash Converters International Limited, which is not controlled by EZCORP. |
(6) | Mr. Given served as Executive Chairman of the Board until September 12, 2019, when he resigned from the Board of Directors and assumed the executive officer position of Chief M&A and Strategic Funding Officer. |
(7) | Mr. Rotunda retired from the Company effective October 4, 2019. |
(8) | Mr. DeBenedictus became an executive officer effective May 2017. The 2017 Salary amount includes the salary we paid to Mr. DeBenedictus during fiscal 2017. The amounts shown under All Other Compensation for fiscal 2017 represent the amounts we paid to Transform Technology Services, a business and advisory firm wholly-owned by Mr. DeBenedictus, pursuant to consulting agreements between the Company and such firm. Mr. DeBenedictus left the Company effective December 1, 2019. |
CEO Pay Ratio
We are providing the following information about the relationship of the annual total compensation of our team members and the annual total compensation of Mr. Grimshaw, our Chief Executive Officer (“CEO”). We selected September 30, 2019 as our determination date, and as of that date, our consolidated subsidiaries employed approximately 6,800 team members, with
118
approximately 3,700 team members based in the U.S., approximately 3,000 team members based in Latin America and the remainder based in other jurisdictions. We selected gross wages for fiscal 2019 as the most appropriate measure of compensation for identifying our median team member and applied this measure consistently across our team member population. Gross wages generally include salary and wages (regular, hourly and overtime), commissions and bonuses. We annualized the compensation of all permanent full-time and part-time team members who were hired during fiscal 2019. We applied an end-of-period exchange rate as of September 30, 2019 to convert all applicable Latin American and other currencies into U.S. dollars. We have not included any cost of living adjustments.
We calculated the median team member’s annual total compensation in accordance with the rules used to calculate the CEO’s compensation included in the Summary Compensation Table above. Using this methodology, we determined that our median team member was a full-time store manager located in Mexico where team member wages are significantly lower than in the U.S. The identified median team member had annual total compensation of $14,416, comprised of gross annual wages, bonuses, retirement contributions and other.
For fiscal 2019, the annual total compensation of our CEO was $5,705,024, comprised of the various components described in the Summary Compensation Table above. Based on our CEO’s annual total compensation compared to the compensation for the median team member, our estimated CEO pay ratio is 396:1. This ratio is influenced by a number of factors, including the geographic distribution of our team members, the mix of hourly vs. salaried team members and compensation trends. As a result of these and other variables, we do not believe comparisons to the CEO pay ratios of other companies are likely to be meaningful.
Incentive Plan Based Awards
The following table sets forth certain information about plan-based awards that we made to the Named Executive Officers during fiscal 2019. For information about the plans under which these awards were granted, see “Compensation Discussion and Analysis — Components of Compensation — Annual Incentive Bonus” and “Compensation Discussion and Analysis — Components of Compensation — Long-Term Incentives” above.
Grants of Plan-Based Awards
Estimated Future Payouts Under Non-Equity Incentive Plan Awards (1) | Estimated Future Payouts Under Equity Incentive Plan Awards (2) | Grant Date Fair Value (3) | ||||||||||||||||||||||||
Name | Grant Date | Threshold | Target | Maximum | Threshold | Target | Maximum | |||||||||||||||||||
Mr. Grimshaw | 11/12/2018 | $ | 1,250,000 | $ | 2,500,000 | $ | 3,750,000 | |||||||||||||||||||
11/12/2018 | 140,187 | 280,373 | 280,373 | $ | 2,573,824 | |||||||||||||||||||||
Mr. Chism | 11/12/2018 | $ | 180,000 | $ | 360,000 | $ | 540,000 | |||||||||||||||||||
11/12/2018 | 21,028 | 42,056 | 42,056 | $ | 386,074 | |||||||||||||||||||||
Mr. Given | 11/12/2018 | $ | 375,000 | $ | 750,000 | $ | 1,125,000 | |||||||||||||||||||
11/12/2018 | 42,056 | 84,112 | 84,112 | $ | 772,148 | |||||||||||||||||||||
Mr. Rotunda (4) | 11/12/2018 | $ | 506,250 | $ | 1,012,500 | $ | 1,518,750 | |||||||||||||||||||
11/12/2018 | 31,542 | 63,084 | 63,084 | $ | 579,111 | |||||||||||||||||||||
Mr. DeBenedictus (5) | 11/12/2018 | $ | 212,500 | $ | 425,000 | $ | 637,500 | |||||||||||||||||||
11/12/2018 | 19,860 | 39,719 | 39,719 | $ | 364,620 | |||||||||||||||||||||
(1) | These amounts represent the potential payouts under the fiscal 2019 Short-Term Incentive Compensation Plan. See “Compensation Discussion and Analysis — Components of Compensation — Annual Incentive Bonuses” above. The “Target” amount is the amount that will be paid if the specified performance goals are achieved at the target level (although the Compensation Committee may reduce any award if it chooses to do so). The “Threshold” amount reflects the amount that would be paid if the minimum performance goals are achieved, while the “Maximum” amount represents the maximum amount that will be paid if the maximum performance goals are achieved or exceeded. See the “Non-Equity Incentive Plan Compensation” column in the Summary Compensation Table above for the amount of the actual payout for each of the Named Executive Officers. |
(2) | These amounts represent the fiscal 2019 awards under the Long-Term Incentive Plan. See “Compensation Discussion and Analysis — Components of Compensation — Long-Term Incentives” above. The “Target” amount is the number of units that will vest if the specified performance goals are achieved at the target level. The “Threshold” amount reflects the number of units that will vest if the minimum performance goals are achieved for both the net income and EPS growth targets. No more than 100% of the Target number of units will vest; therefore, the “Maximum” amount is the same as the Target amount. Each unit represents the right to receive one share of Class A Common Stock upon vesting. |
(3) | Represents the estimated grant date fair value of fiscal 2019 equity awards, assuming payout at “Target” level. This is the estimated amount of aggregate compensation cost we expect to recognize over the performance period, determined as of the grant date. See “Compensation Discussion and Analysis — Components of Compensation — Long-Term Incentives” above. |
119
(4) | Mr. Rotunda retired from the Company effective October 4, 2019. Under the terms of Mr. Rotunda’s LTIP award, Mr. Rotunda will retain these units subject to the applicable vesting provisions. |
(5) | Mr. DeBenedictus left the Company effective December 1, 2019. In connection with his termination of employment, the Company agreed that he will retain a pro rata portion (one-third) of his unvested LTIP award subject to the applicable vesting provisions. |
The following table sets forth certain information about outstanding stock awards held by the Named Executive Officers as of the end of fiscal 2019. None of the Named Executive Officers holds any stock options.
Outstanding Equity Awards at Fiscal Year-End
Stock Awards | ||||||||||
Name | Award Date | Number of Shares or Units of Stock That Have Not Vested | Market Value of Shares or Units of Stock That Have Not Vested (1) | |||||||
Mr. Grimshaw | 11/12/2018 | 280,373 | (2) | $ | 1,811,210 | |||||
11/13/2017 | 315,789 | (3) | $ | 2,039,997 | ||||||
11/8/2016 | 271,248 | (4) | $ | 1,752,262 | ||||||
11/3/2014 | 100,000 | (5) | $ | 646,000 | ||||||
Mr. Chism | 11/12/2018 | 42,056 | (2) | $ | 271,682 | |||||
11/13/2017 | 47,368 | (3) | $ | 305,997 | ||||||
Mr. Given | 11/12/2018 | 84,112 | (2) | $ | 543,364 | |||||
11/13/2017 | 94,737 | (3) | $ | 612,001 | ||||||
11/8/2016 | 81,374 | (4) | $ | 525,676 | ||||||
10/1/2014 | 75,000 | (5) | $ | 484,500 | ||||||
Mr. Rotunda (7) | 11/12/2018 | 63,084 | (2) | $ | 407,523 | |||||
11/13/2017 | 71,053 | (3) | $ | 459,002 | ||||||
11/8/2016 | 61,031 | (4) | $ | 394,260 | ||||||
11/13/2015 | 9,880 | (6) | $ | 63,825 | ||||||
Mr. DeBenedictus (8) | 11/12/2018 | 39,719 | (2) | $ | 256,585 | |||||
11/13/2017 | 36,842 | (3) | $ | 237,999 | ||||||
(1) | Market value is based on the closing price of our Class A Common Stock on September 30, 2019, the last market trading day of fiscal 2019 ($6.46). |
(2) | These awards are scheduled to vest on September 30, 2021 subject to the attainment of specified net income and EPS growth objectives. See “Compensation Discussion and Analysis — Components of Compensation — Long-Term Incentives” above. |
(3) | These awards are scheduled to vest on September 30, 2020 subject to the attainment of specified EBITDA growth objectives. See “Compensation Discussion and Analysis — Components of Compensation — Long-Term Incentives” above. |
(4) | These awards vested on November 21, 2019 when the Compensation Committee certified that the applicable performance objectives (based on EBITDA growth) had been achieved. See “Compensation Discussion and Analysis — Components of Compensation — Long-Term Incentives” above. |
(5) | Vesting of these awards is subject to the attainment of specified EBITDA growth objectives through September 30, 2020. |
(6) | These awards vest through fiscal 2020 in specified amounts if the per-share trading price of our Class A Common Stock achieves specified levels ranging from $15 to $80. |
(7) | Mr. Rotunda’s long-term incentive awards contain a special term providing for the continued vesting (rather than forfeiture) of all unvested awards in accordance with their terms (including corporate-level performance criteria) upon voluntarily retirement from his executive position with the Company, which occurred effective October 4, 2019. |
(8) | Mr. DeBenedictus left the Company effective December 1, 2019, and in connection with his termination of employment, the Company agreed that he will retain a pro rata portion of his unvested LTIP awards (two-thirds in the case of the fiscal 2018 award and one-third in the case of the fiscal 2019 award) with such retained portions being subject to vesting in accordance with their terms (including corporate-level performance criteria). |
120
Stock Vested
The following table sets forth, with respect to each of the Named Executive Officers, certain information about restricted stock vesting during fiscal 2019:
Stock Awards | |||||||
Named Executive Officer | Number of Shares Acquired on Vesting | Value Realized on Vesting (1) | |||||
Mr. Grimshaw | 423,319 | (2) | $ | 3,860,669 | |||
Mr. Given | 171,996 | (2) | 1,568,604 | ||||
Mr. Rotunda | 88,913 | (2) | 810,887 | ||||
(1) | Computed using the fair market value of the stock on the date of vesting. |
(2) | These awards vested on November 13, 2018 (market value, $9.12 per share) and are presented gross, exclusive of net shares withheld to satisfy individual tax withholding obligations. |
Other Benefits and Perquisites
401(k) Retirement Plan — All team members are given an opportunity to participate in our 401(k) retirement savings plan (following a new-hire waiting period). Subject to statutory limits of the IRS, this plan allows participants to have pre-tax amounts withheld from their pay and provides for a discretionary employer matching contribution (historically, 25% up to 6% of salary). Matching contributions are made in the form of cash. Participants may invest their contributions in various fund options, but are prohibited from investing their contributions in our common stock. A participant vests in the matching contributions pro rata over their first three years of service provided their hours worked requirement is met. All of a participant’s matching contributions vest 100% in the event of the participant’s death or disability or the termination of the plan due to a change in control.
Supplemental Executive Retirement Plan — The Internal Revenue Code limits the amount of pre-tax savings that highly paid executives can contribute to the 401(k) plan. To offset some of the negative impact of these limitations on retirement savings and to encourage retention of key executives, we provide selected executives with a non-qualified Supplemental Executive Retirement Plan (“SERP”), with similar investment alternatives as are available under the 401(k) retirement savings plan. Company contributions to the SERP are formula-based, reviewed and recommended by management and approved by the Compensation Committee each year. For fiscal 2019, our annual contributions to the SERP were calculated as a percentage of base salary, with that percentage being 10% for executive officers and 6% for one other employee. For fiscal 2020, the Company contributions to the SERP will continue at the same rates. Under the terms of the SERP, participants are also allowed to voluntarily defer all or a portion of their salary and bonus payments into the SERP. There were ten participants in the SERP during fiscal 2019.
All Company contributed SERP funds have a vesting schedule as an additional retention tool. Generally, the funds vest over three years from the contribution date, with one-third vesting each year. All of a participant’s Company contributed SERP funds vest 100% in the event of the participant’s death or disability or the termination of the plan due to a change in control. In addition, all Company contributed SERP funds are 100% vested when a participant attains normal retirement age (generally 60 years old and five years of active service) while actively employed by us. All Company contributed SERP funds are forfeited, regardless of vesting status, if the participant’s employment is terminated for cause.
A participant may not withdraw any portion of his or her SERP account while still employed by the Company unless, in the sole opinion of management, the participant has an unforeseeable emergency, which is defined as a severe financial hardship resulting from an illness or accident of the participant, the participant’s spouse or a dependent; the loss of the participant’s property due to casualty; or other similar extraordinary and unforeseeable circumstance arising as a result of events beyond the participant’s control.
121
The following table describes the SERP contributions, earnings and balance at the end of fiscal 2019 for each of the Named Executive Officers:
Nonqualified Deferred Compensation
Named Executive Officer | Company Contributions in Fiscal 2019 (1) | Aggregate Earnings in Fiscal 2019 (2) | Aggregate Withdrawals/Distributions in Fiscal 2019 | Aggregate Forfeitures in Fiscal 2019 | Aggregate Balance at September 30, 2019 (3) | ||||||||||||||
Mr. Grimshaw | $ | 100,000 | $ | 12,955 | $ | — | $ | — | $ | 610,705 | |||||||||
Mr. Chism | 45,000 | 5,180 | — | — | 97,057 | ||||||||||||||
Mr. Given | 60,000 | 9,445 | — | — | 371,407 | ||||||||||||||
Mr. Rotunda | 67,500 | 32,405 | — | — | 322,923 | ||||||||||||||
Mr. DeBenedictus | 42,500 | 5,013 | — | — | 92,440 | ||||||||||||||
(1) | These amounts were included in the Summary Compensation Table above in the column labeled “All Other Compensation.” |
(2) | These amounts were not included in the Summary Compensation Table as the earnings were not in excess of market rates. |
(3) | Of the Aggregate Balance at September 30, 2019, the following amounts were previously reported as compensation in the Summary Compensation Tables for prior years: $400,000 for Mr. Grimshaw, $45,000 for Mr. Chism, $43,750 for Mr. DeBenedictus (reported in fiscal 2019 when Mr. DeBenedictus became a Named Executive Officer for the first time for fiscal 2017 and 2018), $240,000 for Mr. Given and $67,500 for Mr. Rotunda. |
All Other Compensation — The following table describes each component of the amounts shown in the “All Other Compensation” column in the Summary Compensation Table above.
Named Executive Officer | Year | Health Care Supplemental Insurance (1) | Value of Supplemental Life Insurance Premiums (2) | Company Contributions to Defined Contribution Plans (3) | Consulting Fees (4) | Housing Allowance | Other Benefits (5) | Total | ||||||||||||||||||||||
Mr. Grimshaw | 2019 | $ | 12,984 | $ | 1,920 | $ | 104,125 | $ | — | $ | — | $ | 262,171 | $ | 381,200 | |||||||||||||||
2018 | 20,128 | 2,088 | 104,750 | — | 31,378 | 17,467 | 175,811 | |||||||||||||||||||||||
2017 | 12,896 | 1,300 | 105,019 | — | 194,665 | 2,049 | 315,929 | |||||||||||||||||||||||
Mr. Chism | 2019 | 19,452 | 1,920 | 49,125 | — | — | — | 70,497 | ||||||||||||||||||||||
2018 | 29,483 | 2,088 | 49,016 | — | — | — | 80,587 | |||||||||||||||||||||||
2017 | 7,425 | 500 | 649 | — | — | — | 8,574 | |||||||||||||||||||||||
Mr. Given | 2019 | 19,452 | 1,920 | 60,000 | — | — | — | 81,372 | ||||||||||||||||||||||
2018 | 29,483 | 2,088 | 60,000 | — | 62,017 | — | 153,588 | |||||||||||||||||||||||
2017 | 19,305 | 1,300 | 60,000 | — | 106,473 | 11,135 | 198,213 | |||||||||||||||||||||||
Mr. Rotunda | 2019 | 12,984 | 1,920 | 68,904 | — | — | — | 83,808 | ||||||||||||||||||||||
2018 | 20,128 | 2,088 | 68,183 | — | — | — | 90,399 | |||||||||||||||||||||||
2017 | 12,896 | 845 | 68,183 | — | — | — | 81,924 | |||||||||||||||||||||||
Mr. DeBenedictus | 2019 | 12,984 | 1,920 | 46,625 | — | — | — | 61,529 | ||||||||||||||||||||||
2018 | 20,128 | 2,088 | 35,000 | — | — | — | 57,216 | |||||||||||||||||||||||
2017 | 3,968 | 480 | 8,952 | 72,692 | — | — | 86,092 | |||||||||||||||||||||||
(1) | We provide a fully insured supplemental executive medical plan to certain executives, including all of the Named Executive Officers, to cover most healthcare costs in excess of amounts covered by our health insurance plans. The amounts shown represent the total premiums paid for the supplemental executive medical plan for each of the Named Executive Officers during each of the years presented. Additionally, in fiscal 2018, from January 1, 2018 through April 30, 2018, the Company carried a fully insured International Medical Plan for certain executives, including all of the Named Executive Officers, and canceled their participation in the group health plan during that time. The amount shown in 2018 includes these additional premiums paid on behalf of the Named Executive Officers. |
(2) | Represents group life insurance premiums paid on behalf of the Named Executive Officers. The benefit provides life and accidental death and dismemberment coverage for the Named Executive Officers at three times annual salary up to a maximum of $1 million. |
(3) | Includes Company contributions to the 401(k) plan and the Supplemental Executive Retirement Plan. |
(4) | During fiscal 2017, we had a consulting agreement with Transform Technology Services, an business and advisory firm entity wholly-owned by Mr. DeBenedictus. The amounts shown represent the amount of consulting fees we paid to such firm pursuant to such consulting agreement prior to Mr. DeBenefictus becoming an executive officer in May 2017. |
122
(5) | The amounts shown as Other Benefits include the following: |
Mr. Grimshaw — The amounts shown represent perquisites and other personal benefits, including relocation benefits and reimbursement of U.S. taxes incurred in connection with the sale of his principal residence in Sydney, Australia, spousal travel for business-related meetings and Company-paid subsidy for health club membership.
Mr. Given — The amount shown represents perquisites and other personal benefits, including spousal and family travel for business-related meetings.
Certain Termination and Change-in-Control Benefits — The following is a summary of various agreements that provide for benefits to the Named Executive Officers upon termination of employment or a change-in-control:
• | Restricted Stock Award Agreements — The standard restricted stock award agreement pursuant to which we grant restricted stock or restricted stock units to our team members generally provides that vesting is accelerated in the event of the holder’s death or disability. |
Mr. Rotunda’s long-term incentive awards contain a special term providing for the continued vesting (rather than forfeiture) of all unvested awards in accordance with their terms (including corporate-level performance criteria) upon Mr. Rotunda’s voluntarily retirement from his executive position with the Company, which occurred effective October 4, 2019.
• | SERP Contributions — For all executives (including the Named Executive Officers), any unvested Company contributions to the SERP will vest in the case of death or disability of the participant or a change-in-control. |
• | General severance benefits — We currently provide each of our executive officers with one-year salary continuation if his or her employment is terminated by the Company without cause. |
The following table sets forth the amounts of severance or termination benefits that would have been payable to each of the Named Executive Officers upon the occurrence of various events, assuming each of the events occurred on September 30, 2019:
Salary | Incentive Bonus | Healthcare Payments | Accelerated Vesting of Restricted Stock (1) | Accelerated Vesting of SERP Balance | Other | ||||||||||||||||||
Resignation for Good Reason: | |||||||||||||||||||||||
Mr. Grimshaw | $ | 1,000,000 | $ | — | $ | — | $ | — | $ | — | $ | — | |||||||||||
Mr. Chism | 450,000 | — | — | — | — | — | |||||||||||||||||
Mr. Given | 600,000 | — | — | — | — | — | |||||||||||||||||
Mr. Rotunda | 675,000 | — | — | — | — | — | |||||||||||||||||
Mr. DeBenedictus | 425,000 | — | — | — | — | — | |||||||||||||||||
Termination Without Cause: | |||||||||||||||||||||||
Mr. Grimshaw | $ | 1,000,000 | $ | — | $ | — | $ | — | $ | — | $ | — | |||||||||||
Mr. Chism | 450,000 | — | — | — | — | — | |||||||||||||||||
Mr. Given | 600,000 | — | — | — | — | — | |||||||||||||||||
Mr. Rotunda | 675,000 | — | — | — | — | — | |||||||||||||||||
Mr. DeBenedictus | 425,000 | — | — | — | — | — | |||||||||||||||||
Death or Disability: | |||||||||||||||||||||||
Mr. Grimshaw | $ | — | $ | — | $ | — | $ | 6,249,469 | $ | 610,705 | $ | — | |||||||||||
Mr. Chism | — | — | — | 577,679 | 97,057 | — | |||||||||||||||||
Mr. Given | — | — | — | 2,165,541 | 371,407 | — | |||||||||||||||||
Mr. Rotunda (2) | — | — | — | 1,324,610 | — | — | |||||||||||||||||
Mr. DeBenedictus | — | — | — | 494,584 | 92,440 | — | |||||||||||||||||
(1) | Represents the number of shares subject to accelerated vesting (as described above), multiplied by the closing sales price of the Class A Common Stock on September 30, 2019 ($6.46). |
(2) | Mr. Rotunda was fully vested in his SERP balance as of September 30, 2019. |
The Compensation Committee has the authority under our stock-based compensation plans to issue awards with provisions that accelerate vesting and exercisability in the event of a change-in-control. To date, the Committee has not included change-in-control acceleration provisions in any awards. Unless such provisions were subsequently included, then the only benefit that
123
would inure to the Named Executive Officers by reason of a change-in-control itself would be the accelerated vesting for SERP contributions (equal to the same benefit as that set forth under “Death or Disability” in the table above). If an executive’s employment was terminated following a change-in-control, then the additional benefits described above would apply, depending on the circumstances of the termination.
Director Compensation
Each non-employee director receives a basic annual retainer fee, with the Lead Independent Director, the chair of the Audit Committee and the chair of the Compensation Committee each receiving an additional amount. During fiscal 2019, the basic annual retainer fee was $80,000, and additional amounts paid to the chair of the Audit Committee, the chair of the Compensation Committee and the chair of the Nominating Committee were $27,500, $15,000 and $7,500, respectively. Effective October 1, 2019, an additional annual fee of $40,000 to the Lead Independent Director (who also serves as Chair of the Nominating Committee) replaced the previous supplemental fee to the chair of the Nominating Committee. Annual retainer fees are paid in cash on a quarterly basis.
The non-employee directors are also eligible for stock option and restricted stock awards. The number of options or shares of restricted stock awarded, as well as the other terms and conditions of the awards (such as vesting and exercisability schedules and termination provisions), are determined by the Board of Directors upon the recommendation of the Compensation Committee.
The following table sets forth the compensation paid to our non-employee directors for fiscal 2019. Mr. Cohen, Mr. Grimshaw, Mr. Given and Mr. Rotunda were executive officers of the Company and did not receive any additional compensation for serving on the Board of Directors during fiscal 2019.
Director | Fees Earned or Paid in Cash | Restricted Stock Awards (1) | Total | |||||||||
Matthew W. Appel | $ | 113,125 | $ | 137,269 | $ | 250,394 | ||||||
Zena Srivatsa Arnold | 40,000 | 77,771 | 117,771 | |||||||||
Shelagmichael Brown | 40,000 | 91,334 | 131,334 | |||||||||
Santiago Creel Miranda (2) | 60,000 | 137,269 | 197,269 | |||||||||
Peter Cumins (2) | 60,000 | 137,269 | 197,269 | |||||||||
Jason A. Kulas | 40,000 | 91,334 | 131,334 | |||||||||
Pablo Lagos Espinosa | 95,000 | 137,269 | 232,269 | |||||||||
Thomas C. Roberts (3) | 20,000 | — | 20,000 | |||||||||
Kent V. Stone | 40,000 | 91,334 | 131,334 | |||||||||
Gary L. Tillett | 40,000 | 91,334 | 131,334 | |||||||||
Robert W. K. (Robb) Webb | 40,000 | 91,334 | 131,334 | |||||||||
Rosa Zeegers | 40,000 | 91,334 | 131,334 | |||||||||
(1) | Amounts represent the aggregate grant date fair value of restricted stock awards, computed in accordance with FASB ASC 718-10-25. See Note 9 of Notes to Consolidated Financial Statements included in “Part II, Item 8 — Financial Statements and Supplementary Data.” The actual value realized by the director with respect to stock awards will depend on the market value of our stock on the date the stock is sold. |
Mr. Appel, Mr. Creel, Mr. Cumins, Mr. Lagos and Mr. Roberts each received a grant of 14,952 shares of restricted stock in November 2018. That amount was determined by dividing $160,000 (200% times the annual director fee) by $10.70, the trading price of the Class A Common Stock at the beginning of fiscal 2019. Each of the other non-employee directors received a grant of 8,584 shares of restricted stock in April 2019 or, in the case of Ms. Arnold, May 2019. That amount was determined by dividing $80,000 (200% times one-half of the annual director fee) by $9.36, the trading price of the Class A Common Stock at the beginning of the second half of fiscal 2019. All of these shares (unless forfeited as indicated) vested on September 30, 2019. The values shown were computed using the closing price of our Class A Common Stock on the date of grant, which differed from the amount used to determine the number of shares awarded.
As of September 30, 2019, none of the non-employee directors held shares of unvested restricted stock.
(2) | Mr. Creel and Mr. Cumins retired from the Board of Directors effective April 9, 2019, and their restricted stock awards were forfeited on that date. |
(3) | Mr. Roberts retired from the Board of Directors effective October 23, 2018, prior to the award of restricted stock for fiscal 2019. |
The non-employee director compensation program for fiscal 2020 will be the same as the fiscal 2019 program described above.
124
ITEM 12 — SECURITY OWNERSHIP OF CERTAIN BENEFICIAL OWNERS AND MANAGEMENT AND RELATED STOCKHOLDER MATTERS
Equity Compensation Plans
Stockholders have approved the 2010 Long-Term Incentive Plan, which we currently use for stock incentive awards. These awards can be in the form of stock options, stock appreciation rights, stock bonuses, restricted stock, restricted stock units, performance units or performance shares. We do not have any equity compensation plans that were not approved by stockholders. The following table summarizes information about our equity compensation plans as of September 30, 2019:
Plan Category | Number of Securities to be Issued Upon Exercise of Outstanding Options (a) (1) | Weighted Average Exercise Price of Outstanding Options (b) | Number of Securities Remaining Available for Future Issuance Under Equity Compensation Plans (Excluding Securities Reflected in Column (a)) (c) | ||||||
Equity compensation plans approved by security holders | — | $ | — | 138,814 | |||||
Equity compensation plans not approved by security holders | — | — | — | ||||||
Total | — | $ | — | 138,814 | |||||
(1) | Excludes 3,025,154 shares of restricted stock that were outstanding as of September 30, 2019. |
125
Stock Ownership
Phillip E. Cohen controls EZCORP through his ownership of all of the issued and outstanding stock of MS Pawn Corporation, the sole general partner of MS Pawn Limited Partnership, which owns 100% of our Class B Voting Common Stock. The following table presents information regarding the beneficial ownership of our Common Stock as of November 1, 2019 (except as noted below) for (i) each person known to us to be the beneficial owner of more than 5% of the total number of shares outstanding, (ii) each of our directors, (iii) each of the Named Executive Officers, and (iv) all directors and executive officers as a group. Unless otherwise indicated, each person named below holds sole voting and investment power over the shares shown, subject to community property laws where applicable.
Class A Non-voting Common Stock | Class B Voting Common Stock | |||||||||||||||||
Beneficial Owner | Number | Percent | Number | Percent | Voting Percent | |||||||||||||
MS Pawn Limited Partnership (a) MS Pawn Corporation Phillip Ean Cohen 2500 Bee Cave Road Bldg One, Suite 200 Rollingwood, Texas 78746 | 2,974,047 | (b) | 5.66 | % | (b) | 2,970,171 | 100 | % | 100 | % | ||||||||
Blackrock, Inc. 55 East 52nd Street New York, New York 10055 | 7,889,504 | (c) | 15.01 | % | — | — | — | |||||||||||
Lafitte Capital Management 707 Brazos Street, Suite 310 Austin, Texas 78701 | 5,400,000 | (c) | 10.27 | % | — | — | — | |||||||||||
Dimensional Fund Advisors 6300 Bee Cave Road, Building One Austin, Texas 78746 | 4,408,602 | (c) | 8.39 | % | — | — | — | |||||||||||
The Vanguard Group, Inc. 100 Vanguard Blvd. Malvern, Pennsylvania 19355 | 4,221,194 | (c) | 8.03 | % | — | — | — | |||||||||||
Matthew W. Appel | 86,303 | * | — | — | — | |||||||||||||
Zena Srivatsa Arnold | 8,584 | * | — | — | — | |||||||||||||
Shelagmichael Brown | 8,584 | * | — | — | — | |||||||||||||
Stuart I. Grimshaw | 629,138 | (d) | 1.20 | % | — | — | — | |||||||||||
Jason A. Kulas | 8,584 | * | — | — | — | |||||||||||||
Pablo Lagos Espinosa | 116,003 | * | — | — | — | |||||||||||||
Kent V. Stone | 8,584 | * | — | — | — | |||||||||||||
Gary L. Tillett | 8,584 | * | — | — | — | |||||||||||||
Robert W. K. (Robb) Webb | 8,584 | * | — | — | — | |||||||||||||
Rosa Zeegers | 8,584 | * | — | — | — | |||||||||||||
Directors and executive officers as a group (19 persons) | 5,274,637 | (e) | 10.03 | % | 2,970,171 | 100 | % | 100 | % | |||||||||
(a) | MS Pawn Corporation is the general partner of MS Pawn Limited Partnership and has the sole right to vote its shares of Class B Common Stock and to direct their disposition. Mr. Cohen is the sole stockholder of MS Pawn Corporation. |
(b) | The number of shares and percentage reflect Class A Common Stock, inclusive of Class B Common Stock, shares of which are convertible to Class A Common Stock on a one-to-one basis. |
(c) | As of September 30, 2019 based on Form 13F. |
(d) | Includes 271,248 unvested restricted stock units expected to vest within 60 days, but excludes 100,000 other shares of unvested restricted stock and 596,162 unvested restricted stock units (each of which represents the right to receive one share upon vesting). |
(e) | Group includes those persons who were serving as directors and executive officers on October 31, 2019. Number shown includes 2,298 shares held through the Company’s 401(k) retirement savings plan and 550,312 unvested restricted stock units expected to vest within 60 days, but excludes 212,880 shares of unvested restricted stock and 1,417,137 unvested restricted stock units (each of which represents the right to receive one share upon vesting). |
* | Shares beneficially owned do not exceed one percent of Class A Common Stock. |
126
ITEM 13 — CERTAIN RELATIONSHIPS AND RELATED TRANSACTIONS, AND DIRECTOR INDEPENDENCE
Related Party Transactions
Review and Approval of Transactions with Related Persons
The Board of Directors has adopted a written comprehensive policy for the review and evaluation of all related party transactions. Under that policy, the Audit Committee is charged with the responsibility of (a) reviewing and evaluating all transactions, or proposed transactions, between the company and a related person and (b) approving, ratifying, rescinding or taking other action with respect to each such transaction. With respect to any specific transaction, the Audit Committee may, in its discretion, transfer its responsibilities to either the full Board of Directors or to any special committee of the Board of Directors designated and created for the purpose of reviewing, evaluating, approving or ratifying such transaction.
Director Independence
The Board of Directors believes that the interests of the stockholders are best served by having a substantial number of objective, independent representatives on the Board. For this purpose, a director is considered to be independent if the Board determines that the director does not have any direct or indirect material relationship with the Company that may impair, or appear to impair, the director’s ability to make independent judgments.
The Board has evaluated all relationships between each the Company and each of the persons who served as a director during any portion of fiscal 2019 and has made the following determinations with respect to each director’s independence:
Director | Status (a) | |
Matthew W. Appel | Independent | |
Zena Srivatsa Arnold | Independent | |
Shelaghmichael Brown | Independent | |
Phillip E. Cohen | Not independent (b) | |
Santiago Creel Miranda (c) | Independent | |
Peter Cumins (c) | Not independent (d) | |
Jason A. Kulas | Independent | |
Pablo Lagos Espinosa | Independent | |
Lachlan P. Given | Not independent (b) | |
Stuart I. Grimshaw | Not independent (b) | |
Thomas C. Roberts (e) | Independent | |
Kent V. Stone | Independent | |
Gary L. Tillett | Independent | |
Robert W. K. (Robb) Webb | Independent | |
Rosa Zeegers | Independent | |
(a) | The Board’s determination that a director is independent was made on the basis of the standards for independence set forth in the Nasdaq Listing Rules. Under those standards, a person generally will not be considered independent if he or she has a relationship that, in the opinion of the Board of Directors, would interfere with the exercise of independent judgment in carrying out the responsibilities of a director. The Nasdaq rules also describe specific relationships that will prevent a person from being considered independent. |
(b) | Mr. Cohen, Mr. Given and Mr. Grimshaw are executive officers of the Company and, therefore, are not independent in accordance with the standards set forth in the Nasdaq Listing Rules. |
(c) | Mr. Creel and Mr. Cumins retired from the Board of Directors effective April 9, 2019. |
(d) | Mr. Cumins is the Executive Vice Chairman and a member of the board of directors of Cash Converters International Limited. Mr. Grimshaw serves as the non-executive chairman of the board of directors of Cash Converters International, and Mr. Given also serves on that board of directors. Because of this relationship, the Board did not treat Mr. Cumins as an independent director, even though he might qualify as such under the Nasdaq Listing Rules. |
(e) | Mr. Roberts retired from the Board of Directors effective October 23, 2018. |
Prior to April 9, 2019, the Company relied on the “Controlled Company” exemption to the Nasdaq requirement that a majority of the directors be considered independent under the standards set forth in the Nasdaq Listing Rules. See “Part III, Item 10 — Directors, Executive Officers and Corporate Governance — Corporate Governance — Controlled Company Exemptions.”
127
ITEM 14 — PRINCIPAL ACCOUNTANT FEES AND SERVICES
The following table presents all fees we incurred in connection with professional services provided by BDO USA, LLP for fiscal 2019 and 2018:
Year Ended September 30, | |||||||
2019 | 2018 | ||||||
Audit of financial statements and audit pursuant to section 404 of the Sarbanes-Oxley Act and quarterly reviews | $ | 1,784,055 | $ | 1,492,623 | |||
Audit related fees | — | — | |||||
Tax fees | — | — | |||||
All other fees | — | — | |||||
$ | 1,784,055 | $ | 1,492,623 | ||||
The amounts shown for fiscal 2019 include our current estimated costs for the fiscal 2019 integrated audit, for which we have not yet received final billings. The amounts shown for fiscal 2018 include an increase of $51,177 in fees that were billed above our initial estimates for fiscal 2018 after we filed our Annual Report on Form 10-K for the year ended September 30, 2018.
The Audit Committee has adopted a policy requiring its pre-approval of all fees to be paid to our independent audit firm, regardless of the type of service. All non-audit services were reviewed with the Audit Committee, which concluded that the provision of such services by BDO USA, LLP was compatible with the maintenance of that firm’s independence in the conduct of its auditing functions.
128
PART IV
ITEM 15 — EXHIBITS AND FINANCIAL STATEMENT SCHEDULES
(a) The following documents are filed as a part of this 10-K:
(1) Financial Statements
The following consolidated financial statements of EZCORP, Inc. are included in “Part II — Item 8 — Financial Statements and Supplementary Data”:
• | Report of Independent Registered Public Accounting Firm (2019 and 2018) — BDO USA, LLP |
• | Consolidated Balance Sheets as of September 30, 2019 and 2018 |
• | Consolidated Statements of Operations for each of the three years in the period ended September 30, 2019 |
• | Consolidated Statements of Comprehensive (Loss) Income for each of the three years in the period ended September 30, 2019 |
• | Consolidated Statements of Cash Flows for each of the three years in the period ended September 30, 2019 |
• | Consolidated Statements of Stockholders’ Equity for each of the three years in the period ended September 30, 2019 |
• | Notes to Consolidated Financial Statements. |
(2) Financial Statement Schedules
Financial statement schedules are omitted because they are not required or are not applicable, or the required information is provided in the consolidated financial statements or notes described in Item 15(a)(1) above.
129
(3) Exhibits
130
101.INS††† | XBRL Instance Document | |
101.SCH††† | XBRL Taxonomy Extension Schema Document | |
101.CAL††† | XBRL Taxonomy Extension Calculation Linkbase Document | |
101.DEF††† | XBRL Taxonomy Extension Definition Linkbase Document | |
131
101.LAB††† | XBRL Taxonomy Label Linkbase Document | |
101.PRE††† | XBRL Taxonomy Extension Presentation Linkbase Document | |
_____________________________
* | Identifies Exhibit that consists of or includes a management contract or compensatory plan or arrangement. | |
† | Filed herewith. | |
†† | Furnished herewith. | |
††† | Filed herewith as Exhibit 101 to this report are the following formatted in XBRL (Extensible Business Reporting Language): (i) Consolidated Balance Sheets at September 30, 2019, and September 30, 2018; (ii) Consolidated Statements of Operations for the years ended September 30, 2019, September 30, 2018 and September 30, 2017; (iii) Consolidated Statements of Comprehensive (Loss) Income for the years ended September 30, 2019, September 30, 2018 and September 30, 2017; Consolidated Statements of Cash Flows for the for the years ended September 30, 2019, September 30, 2018 and September 30, 2017; Consolidated Statements of Shareholders’ Equity for the years ended September 30, 2019, September 30, 2018 and September 30, 2017; and (iv) Notes to Consolidated Financial Statements. | |
132
SIGNATURES
Pursuant to the requirements of Section 13 or 15(d) of the Securities Exchange Act of 1934, the registrant has duly caused this report to be signed on its behalf by the undersigned, thereunto duly authorized:
EZCORP, Inc. | |||
Date: December 5, 2019 | By: | /s/ Daniel M. Chism | |
Daniel M. Chism, Chief Financial Officer | |||
133
Pursuant to the requirements of the Securities Exchange Act of 1934, this report has been signed below by the following persons on behalf of the registrant and in the capacities and on the dates indicated:
Signature | Title | Date | ||
/s/ Stuart I. Grimshaw | Chief Executive Officer and Director (principal executive officer) | December 5, 2019 | ||
Stuart I. Grimshaw | ||||
/s/ Daniel M. Chism | Chief Financial Officer (principal financial officer) | December 5, 2019 | ||
Daniel M. Chism | ||||
/s/ Phillip E. Cohen | Executive Chairman of the Board | December 5, 2019 | ||
Phillip E. Cohen | ||||
/s/ Matthew W. Appel | Director | December 5, 2019 | ||
Matthew W. Appel | ||||
/s/ Zena Srivatsa Arnold | Director | December 5, 2019 | ||
Zena Srivatsa Arnold | ||||
/s/ Shelaghmichael Brown | Director | December 5, 2019 | ||
Shelaghmichael Brown | ||||
/s/ Jason A. Kulas | Director | December 5, 2019 | ||
Jason A. Kulas | ||||
/s/ Pablo Lagos Espinosa | Director | December 5, 2019 | ||
Pablo Lagos Espinosa | ||||
/s/ Kent V. Stone | Director | December 5, 2019 | ||
Kent V. Stone | ||||
/s/ Gary L. Tillett | Director | December 5, 2019 | ||
Gary L. Tillett | ||||
/s/ Robert W. K. Webb | Director | December 5, 2019 | ||
Robert W. K. Webb | ||||
/s/ Rosa Zeegers | Director | December 5, 2019 | ||
Rosa Zeegers | ||||
/s/ David McGuire | Deputy Chief Financial Officer and Chief Accounting Officer (principal accounting officer) | December 5, 2019 | ||
David McGuire | ||||
134