| Label |
Element |
Value |
| Risk/Return: |
rr_RiskReturnAbstract |
|
| Registrant Name |
dei_EntityRegistrantName |
QUAKER INVESTMENT TRUST |
| Prospectus Date |
rr_ProspectusDate |
Oct. 29,
2012 |
|
Quaker Strategic Growth
|
|
|
| Risk/Return: |
rr_RiskReturnAbstract |
|
| Risk/Return [Heading] |
rr_RiskReturnHeading |
Fund Summaries
Quaker Strategic Growth Fund |
| Objective [Heading] |
rr_ObjectiveHeading |
INVESTMENT OBJECTIVES |
| Objective, Primary [Text Block] |
rr_ObjectivePrimaryTextBlock |
The Quaker Strategic Growth Fund (the “Fund”) seeks to provide long-term growth of capital. |
| Expense [Heading] |
rr_ExpenseHeading |
FUND FEES AND EXPENSES |
| Expense Narrative [Text Block] |
rr_ExpenseNarrativeTextBlock |
This table describes the fees and expenses that you may pay if you buy and hold shares of the Fund. You may qualify for sales charge discounts if you and your family invest, or agree to invest in the future, at least $50,000 in the Quaker Funds. More information about these and other discounts is available from your financial professional and in the “Reduction or Waiver of Front-End Sales Charges” section on page 44 of the Fund’s Prospectus and in the “Shareholder Information” section on page 45 of the Trust’s Statement of Additional Information (“SAI”). |
| Shareholder Fees Caption [Text] |
rr_ShareholderFeesCaption |
Shareholder Fees
(fees paid directly
from your investment) |
| Operating Expenses Caption [Text] |
rr_OperatingExpensesCaption |
Annual Fund Operating Expenses (expenses that you pay each year as a percentage of the value of your investment) |
| Portfolio Turnover [Heading] |
rr_PortfolioTurnoverHeading |
PORTFOLIO TURNOVER |
| Portfolio Turnover [Text Block] |
rr_PortfolioTurnoverTextBlock |
The Fund pays transaction costs, such as commissions, when it buys and sells securities (or “turns over” its portfolio). A higher portfolio turnover rate may indicate higher transaction costs and may result in higher taxes when the Fund’s shares are held in a taxable account. These costs, which are not reflected in annual fund operating expenses or in the example, affect the Fund’s performance. During the most recent fiscal year, the Fund’s portfolio turnover rate was 178.23% of the average value of its portfolio. |
| Portfolio Turnover, Rate |
rr_PortfolioTurnoverRate |
178.23% |
| Expense Breakpoint Discounts [Text] |
rr_ExpenseBreakpointDiscounts |
You may qualify for sales charge discounts if you and your family invest, or agree to invest in the future, at least $50,000 in the Quaker Funds. More information about these and other discounts is available from your financial professional and in the “Reduction or Waiver of Front-End Sales Charges” section on page 44 of the Fund’s Prospectus and in the “Shareholder Information” section on page 45 of the Trust’s Statement of Additional Information (“SAI”). |
| Expense Breakpoint, Minimum Investment Required [Amount] |
rr_ExpenseBreakpointMinimumInvestmentRequiredAmount |
50,000 |
| Expense Example [Heading] |
rr_ExpenseExampleHeading |
EXPENSE EXAMPLES |
| Expense Example Narrative [Text Block] |
rr_ExpenseExampleNarrativeTextBlock |
The following examples are intended to help you compare the cost of investing in the Fund with the cost of investing in other mutual funds. The example assumes that you invest $10,000 in the Fund for the time periods indicated and then redeem all of your shares at the end of those periods. The example also assumes that your investment has a 5% return each year and that the Fund’s operating expenses remain the same. Although your actual costs may be higher or lower, based on these assumptions your costs would be: |
| Strategy [Heading] |
rr_StrategyHeading |
PRINCIPAL INVESTMENT STRATEGIES |
| Strategy Narrative [Text Block] |
rr_StrategyNarrativeTextBlock |
To achieve its investment objective, the Fund’s investment sub-adviser, DG Capital Management (the “Sub-adviser”), will, under normal market conditions, employ the following strategies: - Common Stocks. The Fund invests at least 65% of its total assets in common stocks of U.S. companies without regard to market capitalization.
- Growth Stocks. The Fund invests its assets in equity securities of companies which the Fund’s Sub-adviser believes show a high probability for superior growth.
- Special Situations. The Fund invests up to 25% of its total assets in “special situation” securities when the Fund’s Sub-adviser believes such investments will benefit the Fund. A special situation arises when, in the sub-adviser’s opinion, the securities of a company will experience an unusual gain or loss solely by reason of a development particularly or uniquely applicable to that company. Such situations include, but are not limited to: spin-offs, corporate restructurings, liquidations, reorganizations, recapitalizations or mergers, material litigation, technological breakthroughs and new management or management policies. Special situation investments may include illiquid or restricted securities, such as private equity investments.
- Foreign Securities. The Fund may invest up to 25% of its net assets in foreign securities, including American Depositary Receipts (“ADRs”).
- Large- and Mid-Cap Securities. The Fund seeks to achieve a balance between investments in “special situation” investments and investments in large- to mid-capitalization equities (in excess of $3 billion in market capitalization) with high or accelerating profitability.
- Short Sales. The Fund may invest up to 25% of its assets in short sales.
- Portfolio Turnover. The Fund employs an aggressive strategy of portfolio trading to respond to changes in the marketplace.
- Tactical Allocation. Because the Fund is a tactical allocation fund, the assets of the Fund will shift on a short-term basis to take advantage of perceived differences in relative values of the various asset classes. The Fund will tactically allocate capital among a diverse range of trading strategies and markets, wherever the portfolio manager perceives opportunity.
|
| Risk [Heading] |
rr_RiskHeading |
PRINCIPAL INVESTMENT RISKS |
| Risk Narrative [Text Block] |
rr_RiskNarrativeTextBlock |
As with all mutual funds, there is the risk that you could lose money on your investment in the Fund. The following risks could affect the value of your investment: - Common Stock Risk. Common stock risks include the financial risk of selecting individual companies that do not perform as anticipated, the risk that the stock markets in which the Fund invests may experience periods of turbulence and instability, and the general risk that domestic and global economies may go through periods of decline and cyclical change.
- Growth Risk. The Fund invests in companies that appear to be growth-oriented companies. If the Fund’s perceptions of a company’s growth potential are wrong, the securities purchased may not perform as expected, reducing the Fund’s return.
- Special Situation Risk. Special situations often involve much greater risk than is found in the normal course of investing. Liquidations, reorganizations, recapitalizations, material litigation, technological breakthroughs and new management or management policies may not have the effect on a company’s price that the Fund’s sub-adviser expects, which could negatively impact the Fund.
- Foreign Securities Risk. Investments in foreign securities involve greater risks compared to domestic investments for the following reasons: foreign companies may not be subject to the regulatory requirements of U.S. companies, so there may be less publicly available information about foreign issuers than U.S. companies; foreign companies generally are not subject to uniform accounting, auditing and financial reporting standards; dividends and interest on foreign securities may be subject to foreign withholding taxes; such taxes may reduce the net return to Fund shareholders; foreign securities are often denominated in a currency other than the U.S. dollar, which will subject the Fund to the risks associated with fluctuations in currency values.
- Mid-Cap Stock Risk. Because mid-cap companies are relatively small compared to large-capitalization companies, they may be engaged in business mostly within their own geographic region and may be less well known to the investment community. Also, these companies may have less liquidity, less management depth, narrower market penetrations, less diverse product lines and fewer resources than larger companies. As a result of these factors, mid-cap stock prices may have greater volatility than large company securities.
- Short Selling Risk. Positions in shorted securities are speculative and more risky than long positions. Such investments involve the risk of an unlimited increase in the market price of the security sold short, which could result in a theoretically unlimited loss. Short sale strategies are often categorized as a form of leveraging or speculative investment. The use of leverage may multiply small price movements in securities into large changes in value. As a result of using leverage, the Fund’s share price may be more volatile than if no leverage were used.
- Portfolio Turnover Risk. The Fund’s portfolio manager may engage in aggressive portfolio trading. As a result, the Fund could experience higher than average portfolio turnover, resulting in the realization of gains and losses which could have negative tax consequences to Fund shareholders.
- Management Risk. The Fund is subject to management risk because it is an actively managed investment portfolio. The Sub-adviser will apply its investment techniques and risk analyses in making investment decisions for the Fund, but there is no guarantee that its decisions will produce the intended result.
|
| Risk Lose Money [Text] |
rr_RiskLoseMoney |
As with all mutual funds, there is the risk that you could lose money on your investment in the Fund. |
| Bar Chart and Performance Table [Heading] |
rr_BarChartAndPerformanceTableHeading |
PAST PERFORMANCE |
| Performance Narrative [Text Block] |
rr_PerformanceNarrativeTextBlock |
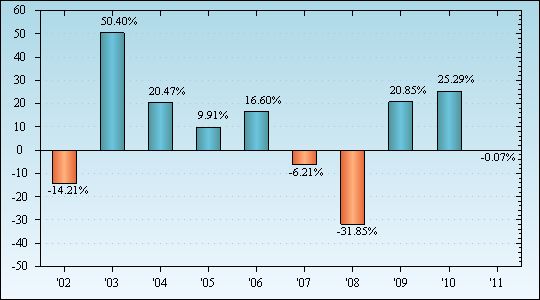
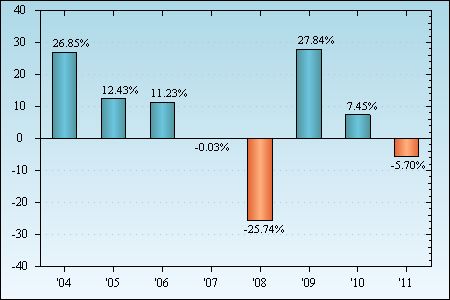
The bar chart below displays the annual return of the Fund over the past ten years. The bar chart also illustrates the variability of the performance from year to year and provides some indication of the risks of investing in the Fund. Fund performance shown does not reflect Class A Shares sales charges. Performance would be lower if sales charges were included. Past performance does not guarantee or predict future results. |
| Performance Information Illustrates Variability of Returns [Text] |
rr_PerformanceInformationIllustratesVariabilityOfReturns |
The bar chart below displays the annual return of the Fund over the past ten years. The bar chart also illustrates the variability of the performance from year to year and provides some indication of the risks of investing in the Fund. |
| Performance Availability Phone [Text] |
rr_PerformanceAvailabilityPhone |
800-220-8888 |
| Performance Availability Website Address [Text] |
rr_PerformanceAvailabilityWebSiteAddress |
www.quakerfunds.com |
| Performance Past Does Not Indicate Future [Text] |
rr_PerformancePastDoesNotIndicateFuture |
Past performance does not guarantee or predict future results. |
| Bar Chart [Heading] |
rr_BarChartHeading |
Annual Total Returns — Class A Shares as of December 31, 2011 |
| Bar Chart Does Not Reflect Sales Loads [Text] |
rr_BarChartDoesNotReflectSalesLoads |
Fund performance shown does not reflect Class A Shares sales charges. Performance would be lower if sales charges were included. |
| Bar Chart Closing [Text Block] |
rr_BarChartClosingTextBlock |
| | | | Highest Performing Quarter: | | 17.48% in 2nd quarter of 2003 | | | | Lowest Performing Quarter: | | –30.69% in 3rd quarter of 2008 |
The Fund’s cumulative year-to-date return through September 30, 2012 was 9.59%. |
| Performance Table Heading |
rr_PerformanceTableHeading |
Average Annual Total Returns as of December 31, 2011 |
| Performance Table Uses Highest Federal Rate |
rr_PerformanceTableUsesHighestFederalRate |
The after-tax returns are calculated using the historical highest individual federal marginal income tax rates and do not reflect the impact of state or local taxes. |
| Performance Table Not Relevant to Tax Deferred |
rr_PerformanceTableNotRelevantToTaxDeferred |
Actual after-tax returns depend on an investor’s tax situation and may differ from those shown in the table. In addition, the after-tax returns shown are not relevant to investors who hold shares of the Fund through tax-deferred arrangements, such as 401(k) plans or individual retirement accounts. |
| Performance Table One Class of after Tax Shown [Text] |
rr_PerformanceTableOneClassOfAfterTaxShown |
After-tax returns for the other classes of shares will vary from the Class A Shares after-tax returns shown. |
| Performance Table Narrative |
rr_PerformanceTableNarrativeTextBlock |
The table shows the risks of investing in the Fund by illustrating how the average annual returns for one-year, five-years and ten-years for each class of the Fund before taxes compare to those of a broad-based securities market index. In addition, after-tax returns are presented for Class A Shares of the Fund. The after-tax returns are calculated using the historical highest individual federal marginal income tax rates and do not reflect the impact of state or local taxes. Actual after-tax returns depend on an investor’s tax situation and may differ from those shown in the table. In addition, the after-tax returns shown are not relevant to investors who hold shares of the Fund through tax-deferred arrangements, such as 401(k) plans or individual retirement accounts. After-tax returns for the other classes of shares will vary from the Class A Shares after-tax returns shown. Past performance (before and after taxes) is not an indication of future results. Updated performance information for the Fund is available on the Trust’s website at www.quakerfunds.com or by calling toll-free 800-220-8888. |
|
Quaker Strategic Growth | Class A
|
|
|
| Risk/Return: |
rr_RiskReturnAbstract |
|
| Maximum Sales Charge (Load) Imposed on Purchases (as a percentage of the offering price) |
rr_MaximumSalesChargeImposedOnPurchasesOverOfferingPrice |
5.50% |
| Management Fees |
rr_ManagementFeesOverAssets |
1.30% |
| Distribution (12b-1) Fees |
rr_DistributionAndService12b1FeesOverAssets |
0.25% |
| Other Expenses |
rr_OtherExpensesOverAssets |
0.75% |
| Total Annual Fund Operating Expenses |
rr_ExpensesOverAssets |
2.30% |
| One Year |
rr_ExpenseExampleYear01 |
770 |
| Three Years |
rr_ExpenseExampleYear03 |
1,229 |
| Five Years |
rr_ExpenseExampleYear05 |
1,713 |
| Ten Years |
rr_ExpenseExampleYear10 |
3,041 |
| 2002 |
rr_AnnualReturn2002 |
(17.09%) |
| 2003 |
rr_AnnualReturn2003 |
30.76% |
| 2004 |
rr_AnnualReturn2004 |
16.87% |
| 2005 |
rr_AnnualReturn2005 |
14.44% |
| 2006 |
rr_AnnualReturn2006 |
5.13% |
| 2007 |
rr_AnnualReturn2007 |
33.07% |
| 2008 |
rr_AnnualReturn2008 |
(45.99%) |
| 2009 |
rr_AnnualReturn2009 |
15.92% |
| 2010 |
rr_AnnualReturn2010 |
13.52% |
| 2011 |
rr_AnnualReturn2011 |
(7.64%) |
| Year to Date Return, Label |
rr_YearToDateReturnLabel |
year-to-date return |
| Bar Chart, Year to Date Return, Date |
rr_BarChartYearToDateReturnDate |
Sep. 30,
2012 |
| Bar Chart, Year to Date Return |
rr_BarChartYearToDateReturn |
9.59% |
| Highest Quarterly Return, Label |
rr_HighestQuarterlyReturnLabel |
Highest Performing Quarter: |
| Highest Quarterly Return, Date |
rr_BarChartHighestQuarterlyReturnDate |
Jun. 30,
2003 |
| Highest Quarterly Return |
rr_BarChartHighestQuarterlyReturn |
17.48% |
| Lowest Quarterly Return, Label |
rr_LowestQuarterlyReturnLabel |
Lowest Performing Quarter: |
| Lowest Quarterly Return, Date |
rr_BarChartLowestQuarterlyReturnDate |
Sep. 30,
2008 |
| Lowest Quarterly Return |
rr_BarChartLowestQuarterlyReturn |
(30.69%) |
| 1 Year |
rr_AverageAnnualReturnYear01 |
(12.72%) |
| 5 Years |
rr_AverageAnnualReturnYear05 |
(3.76%) |
| 10 Years |
rr_AverageAnnualReturnYear10 |
2.32% |
|
Quaker Strategic Growth | Class C
|
|
|
| Risk/Return: |
rr_RiskReturnAbstract |
|
| Maximum Sales Charge (Load) Imposed on Purchases (as a percentage of the offering price) |
rr_MaximumSalesChargeImposedOnPurchasesOverOfferingPrice |
none
|
| Management Fees |
rr_ManagementFeesOverAssets |
1.30% |
| Distribution (12b-1) Fees |
rr_DistributionAndService12b1FeesOverAssets |
1.00% |
| Other Expenses |
rr_OtherExpensesOverAssets |
0.75% |
| Total Annual Fund Operating Expenses |
rr_ExpensesOverAssets |
3.05% |
| One Year |
rr_ExpenseExampleYear01 |
308 |
| Three Years |
rr_ExpenseExampleYear03 |
942 |
| Five Years |
rr_ExpenseExampleYear05 |
1,601 |
| Ten Years |
rr_ExpenseExampleYear10 |
3,365 |
| 1 Year |
rr_AverageAnnualReturnYear01 |
(8.35%) |
| 5 Years |
rr_AverageAnnualReturnYear05 |
(3.39%) |
| 10 Years |
rr_AverageAnnualReturnYear10 |
2.14% |
|
Quaker Strategic Growth | Institutional Class
|
|
|
| Risk/Return: |
rr_RiskReturnAbstract |
|
| Maximum Sales Charge (Load) Imposed on Purchases (as a percentage of the offering price) |
rr_MaximumSalesChargeImposedOnPurchasesOverOfferingPrice |
none
|
| Management Fees |
rr_ManagementFeesOverAssets |
1.30% |
| Distribution (12b-1) Fees |
rr_DistributionAndService12b1FeesOverAssets |
none
|
| Other Expenses |
rr_OtherExpensesOverAssets |
0.75% |
| Total Annual Fund Operating Expenses |
rr_ExpensesOverAssets |
2.05% |
| One Year |
rr_ExpenseExampleYear01 |
208 |
| Three Years |
rr_ExpenseExampleYear03 |
643 |
| Five Years |
rr_ExpenseExampleYear05 |
1,103 |
| Ten Years |
rr_ExpenseExampleYear10 |
2,379 |
| 1 Year |
rr_AverageAnnualReturnYear01 |
(7.47%) |
| 5 Years |
rr_AverageAnnualReturnYear05 |
(2.44%) |
| 10 Years |
rr_AverageAnnualReturnYear10 |
3.15% |
|
Quaker Strategic Growth | Return After Taxes on Distributions | Class A
|
|
|
| Risk/Return: |
rr_RiskReturnAbstract |
|
| 1 Year |
rr_AverageAnnualReturnYear01 |
(12.72%) |
| 5 Years |
rr_AverageAnnualReturnYear05 |
(4.84%) |
| 10 Years |
rr_AverageAnnualReturnYear10 |
1.22% |
|
Quaker Strategic Growth | Return After Taxes on Distributions and Sale of Fund Shares | Class A
|
|
|
| Risk/Return: |
rr_RiskReturnAbstract |
|
| 1 Year |
rr_AverageAnnualReturnYear01 |
(8.27%) |
| 5 Years |
rr_AverageAnnualReturnYear05 |
(3.50%) |
| 10 Years |
rr_AverageAnnualReturnYear10 |
1.62% |
|
Quaker Strategic Growth | S&P 500 Total Return Index
|
|
|
| Risk/Return: |
rr_RiskReturnAbstract |
|
| 1 Year |
rr_AverageAnnualReturnYear01 |
2.11% |
| 5 Years |
rr_AverageAnnualReturnYear05 |
(0.25%) |
| 10 Years |
rr_AverageAnnualReturnYear10 |
2.92% |