UNITED STATES
SECURITIES AND EXCHANGE COMMISSION
WASHINGTON D.C. 20549
FORM 10-K
(MARK ONE)
[ X ] ANNUAL REPORT PURSUANT TO SECTION 13 OR 15(d) OF THE SECURITIES EXCHANGE ACT OF 1934
FOR THE FISCAL YEAR ENDED DECEMBER 31, 2018
OR
[ ] TRANSITION REPORT PURSUANT TO SECTION 13 OR 15(d) OF THE SECURITIES EXCHANGE ACT OF 1934 FOR THE TRANSITION PERIOD FROM TO .
COMMISSION FILE NUMBER 1-13455
TETRA Technologies, Inc.
(EXACT NAME OF THE REGISTRANT AS SPECIFIED IN ITS CHARTER)
DELAWARE | 74-2148293 |
(STATE OR OTHER JURISDICTION OF | (I.R.S. EMPLOYER |
INCORPORATION OR ORGANIZATION) | IDENTIFICATION NO.) |
24955 INTERSTATE 45 NORTH | |
THE WOODLANDS, TEXAS | 77380 |
(ADDRESS OF PRINCIPAL EXECUTIVE OFFICES) | (ZIP CODE) |
REGISTRANT’S TELEPHONE NUMBER, INCLUDING AREA CODE: (281) 367-1983 | |
SECURITIES REGISTERED PURSUANT TO SECTION 12(b) OF THE ACT: | |
COMMON STOCK, PAR VALUE $.01 PER SHARE | NEW YORK STOCK EXCHANGE |
(TITLE OF CLASS) | (NAME OF EXCHANGE ON WHICH REGISTERED) |
SECURITIES REGISTERED PURSUANT TO SECTION 12(g) OF THE ACT: NONE | |
INDICATE BY CHECK MARK IF THE REGISTRANT IS A WELL-KNOWN SEASONED ISSUER (AS DEFINED IN RULE 405 OF THE SECURITIES ACT).
YES [ ] NO [ X ]
INDICATE BY CHECK MARK IF THE REGISTRANT IS NOT REQUIRED TO FILE REPORTS PURSUANT TO SECTION 13 OR SECTION 15(d) OF THE ACT.
YES [ ] NO [ X ]
INDICATE BY CHECK MARK WHETHER THE REGISTRANT (1) HAS FILED ALL REPORTS REQUIRED TO BE FILED BY SECTION 13 OR 15(d) OF THE SECURITIES EXCHANGE ACT OF 1934 DURING THE PRECEDING 12 MONTHS (OR FOR SUCH SHORTER PERIOD THAT THE REGISTRANT WAS REQUIRED TO FILE SUCH REPORTS) AND (2) HAS BEEN SUBJECT TO SUCH FILING REQUIREMENTS FOR THE PAST 90 DAYS. YES [ X ] NO [ ]
INDICATE BY CHECK MARK WHETHER THE REGISTRANT HAS SUBMITTED ELECTRONICALLY EVERY INTERACTIVE DATA FILE REQUIRED TO BE SUBMITTED PURSUANT TO RULE 405 OF REGULATION S-T DURING THE PRECEDING 12 MONTHS (OR FOR SUCH SHORTER PERIOD THAT THE REGISTRANT WAS REQUIRED TO SUBMIT SUCH FILES).
YES [ X ] NO [ ]
INDICATE BY CHECK MARK IF DISCLOSURE OF DELINQUENT FILERS PURSUANT TO ITEM 405 OF REGULATION S-K IS NOT CONTAINED HEREIN, AND WILL NOT BE CONTAINED, TO THE BEST OF REGISTRANT’S KNOWLEDGE, IN DEFINITIVE PROXY OR INFORMATION STATEMENTS INCORPORATED BY REFERENCE IN PART III OF THIS FORM 10-K OR ANY AMENDMENT TO THIS FORM 10-K. [ X]
INDICATE BY CHECK MARK WHETHER THE REGISTRANT IS A LARGE ACCELERATED FILER, AN ACCELERATED FILER, A NON-ACCELERATED FILER, A SMALLER REPORTING COMPANY, OR AN EMERGING GROWTH COMPANY. SEE THE DEFINITIONS OF “LARGE ACCELERATED FILER,” “ACCELERATED FILER,” “SMALLER REPORTING COMPANY,” AND "EMERGING GROWTH COMPANY" IN RULE 12b-2 OF THE EXCHANGE ACT. (CHECK ONE):
LARGE ACCELERATED FILER [ ] | ACCELERATED FILER [ X ] | NON-ACCELERATED FILER [ ] | SMALLER REPORTING COMPANY [ ] |
EMERGING GROWTH COMPANY [ ] | |||
IF AN EMERGING GROWTH COMPANY, INDICATE BY CHECK MARK IF THE REGISTRANT HAS ELECTED NOT TO USE THE EXTENDED TRANSITION PERIOD FOR COMPLYING WITH ANY NEW OR REVISED FINANCIAL ACCOUNTING STANDARDS PROVIDED PURSUANT TO SECTION 13(A) OF THE EXCHANGE ACT [ ]
INDICATE BY CHECK MARK WHETHER THE REGISTRANT IS A SHELL COMPANY (AS DEFINED IN RULE 12b-2 OF THE EXCHANGE ACT).
YES [ ] NO [ X ]
THE AGGREGATE MARKET VALUE OF COMMON STOCK HELD BY NON-AFFILIATES OF THE REGISTRANT WAS $527,447,571 AS OF JUNE 30, 2018, THE LAST BUSINESS DAY OF THE REGISTRANT’S MOST RECENTLY COMPLETED SECOND FISCAL QUARTER.
NUMBER OF SHARES OUTSTANDING OF THE ISSUER’S COMMON STOCK AS OF MARCH 1, 2019, WAS 125,629,069 SHARES.
DOCUMENTS INCORPORATED BY REFERENCE
PART III INFORMATION IS INCORPORATED BY REFERENCE TO THE REGISTRANT’S PROXY STATEMENT FOR ITS ANNUAL MEETING OF STOCKHOLDERS TO BE HELD MAY 3, 2019, TO BE FILED WITH THE SECURITIES AND EXCHANGE COMMISSION WITHIN 120 DAYS OF THE END OF THE REGISTRANT’S FISCAL YEAR.
TABLE OF CONTENTS
Part I | ||
Part II | ||
Part III | ||
Part IV | ||
Item 16. | Form 10-K Summary | |
Forward-Looking Statements
This Annual Report on Form 10-K contains “forward-looking statements” within the meaning of Section 27A of the Securities Act of 1933, as amended, and Section 21E of the Securities Exchange Act of 1934, as amended. Forward-looking statements in this Annual Report are identifiable by the use of the following words, the negative of such words, and other similar words: “anticipates”, “assumes”, “believes”, “budgets”, “could”, “estimates”, “expects”, “forecasts”, “goal”, “intends”, “may”, “might”, “plans”, “predicts”, “projects”, “schedules”, “seeks”, “should, “targets”, “will”, and “would”.
Such forward-looking statements reflect our current views with respect to future events and financial performance and are based on assumptions that we believe to be reasonable, but such forward-looking statements
are subject to numerous risks, and uncertainties, including, but not limited to:
• | economic and operating conditions that are outside of our control, including the supply, demand, and prices of oil and natural gas; |
• | the availability of adequate sources of capital to us; |
• | the levels of competition we encounter; |
• | the activity levels of our customers; |
• | our operational performance; |
• | the availability of raw materials and labor at reasonable prices; |
• | risks related to acquisitions and our growth strategy; |
• | restrictions under our debt agreements and the consequences of any failure to comply with debt covenants; |
• | the effect and results of litigation, regulatory matters, settlements, audits, assessments, and contingencies; |
• | risks related to our foreign operations; |
• | information technology risks including the risk from cyberattack, and |
• | other risks and uncertainties under “Item 1A. Risk Factors” in this Annual Report and as included in our other filings with the U.S. Securities and Exchange Commission (“SEC”), which are available free of charge on the SEC website at www.sec.gov. |
The risks and uncertainties referred to above are generally beyond our ability to control, and we cannot predict all the risks and uncertainties that could cause our actual results to differ from those indicated by the forward-looking statements. If any of these risks or uncertainties materialize, or if any of the underlying assumptions prove incorrect, actual results may vary from those indicated by the forward-looking statements, and such variances may be material.
All subsequent written and oral forward-looking statements made by or attributable to us or to persons acting on our behalf are expressly qualified in their entirety by reference to these risks and uncertainties. You should not place undue reliance on forward-looking statements. Each forward-looking statement speaks only as of the date of the particular statement, and we undertake no obligation to update or revise any forward-looking statements we may make, except as may be required by law.
i
PART I
Item 1. Business.
The financial statements presented in this Annual Report are the consolidated financial statements of TETRA Technologies, Inc., a Delaware corporation and its subsidiaries. When the terms “TETRA,” “the Company,” “we,” “us,” or “our” are used in this document, those terms refer to TETRA Technologies, Inc. and its consolidated subsidiaries.
TETRA is a Delaware corporation, incorporated in 1981. Our corporate headquarters are located at 24955 Interstate 45 North, The Woodlands, Texas, 77380. Our phone number is 281-367-1983, and our website is accessed at www.tetratec.com. Our common stock is traded on the New York Stock Exchange under the symbol “TTI.”
Our Corporate Governance Guidelines, Code of Business Conduct, Code of Ethics for Senior Financial Officers, Audit Committee Charter, Compensation Committee Charter, and Nominating and Corporate Governance Committee Charter, as well as our Annual Reports on Form 10-K, Quarterly Reports on Form 10-Q, and Current Reports on Form 8-K, and all amendments to those reports are all available, free of charge, on our website at www.tetratec.com as soon as practicable after we file the reports with the SEC. Information contained on or connected to our website is not, and shall not be deemed to be, a part of this Annual Report on Form 10-K or incorporated into any other filings with the SEC. The documents referenced above are available in print at no cost to any stockholder who requests them from our Corporate Secretary.
About TETRA
TETRA Technologies, Inc., together with its consolidated subsidiaries, is a leading, geographically diversified oil and gas services company, focused on completion fluids and associated products and services, comprehensive water management, frac flowback, production well testing and offshore rig cooling services, and compression services and equipment. Prior to the March 2018 sale of our Offshore Division, our operations also included certain offshore services including well plugging and abandonment, decommissioning, and diving, as well as a limited domestic oil and gas production business. Following the acquisition and disposition transactions that closed during the three month period ended March 31, 2018, and as of December 31, 2018 we were composed of three reporting segments organized into three Divisions - Completion Fluids & Products, Water & Flowback Services, and Compression.
Our Completion Fluids & Products Division manufactures and markets clear brine fluids ("CBFs"), additives, and associated products and services to the oil and gas industry for use in well drilling, completion and workover operations in the United States and in certain countries in Latin America, Europe, Asia, the Middle East and Africa. The Division also markets liquid and dry calcium chloride products manufactured at its production facilities or purchased from third-party suppliers to a variety of markets outside the energy industry.
Our Water & Flowback Services Division provides onshore oil and gas operators with comprehensive water management services. The Division also provides frac flowback, production well testing, offshore rig cooling, and other associated services in many of the major oil and gas producing regions in the United States, Mexico, and Canada, as well as in oil and gas basins in certain regions in South America, Africa, Europe, the Middle East, and Australia.
Our Compression Division is a provider of compression services and equipment for natural gas and oil production, gathering, transportation, processing, and storage. The Compression Division's equipment sales business includes the fabrication and sale of standard compressor packages and custom-designed compressor packages designed and fabricated at the Division's facilities. The Compression Division's aftermarket business provides compressor package reconfiguration and maintenance services and compressor package parts and components manufactured by third-party suppliers. The Compression Division provides its services and equipment to a broad base of natural gas and oil exploration and production, midstream, transmission, and storage companies operating throughout many of the onshore producing regions of the United States, as well as in a number of foreign countries, including Mexico, Canada and Argentina.
1
We continue to pursue a long-term growth strategy that includes expanding our core businesses, through internal growth and acquisitions, domestically and internationally.
Products and Services
Completion Fluids & Products Division
Liquid calcium chloride, calcium bromide, zinc bromide, zinc calcium bromide, sodium bromide, and blends of such products manufactured by our Completion Fluids & Products Division are referred to as clear brine fluids ("CBFs") in the oil and gas industry. CBFs are salt solutions that have variable densities and are used to control bottom-hole pressures during oil and gas completion and workover operations. The Completion Fluids & Products Division sells CBFs and various CBF additives to U.S. and foreign oil and gas exploration and production companies and to other companies that service customers in the oil and gas industry.
The Completion Fluids & Products Division provides both stock and custom-blended CBFs based on each customer's specific needs and the proposed application. The Completion Fluids & Products Division provides a broad range of associated CBF services, including: on-site fluids filtration, handling and recycling; wellbore cleanup; fluid engineering consultation; and fluid management services. The Completion Fluids & Products Division's newest CBF technology, TETRA CS Neptune® completion fluids, are high-density fluids that are free of solids, zinc and formates. They were developed by TETRA to be environmentally friendly and cost-effective alternatives to traditional zinc bromide and cesium formate high-density completion fluids for use in well completion and workover operations, as well as a low-solids reservoir drilling fluid.
We offer to repurchase (buyback) certain used CBFs from customers, which we are able to recondition and recycle. Selling used CBFs back to us reduces the net cost of the CBFs to our customers and minimizes our customers’ need to dispose of used fluids. We recondition used CBFs through filtration, blending and the use of proprietary chemical processes, and then market the reconditioned CBFs.
By blending different stock CBFs and using various additives, we are able to modify the specific density, crystallization temperature, and chemical composition of the CBFs as necessary. The Division’s fluid engineering personnel determine the optimal CBF blend for a customer’s particular application to maximize its effectiveness and lifespan. Our filtration services use a variety of techniques and equipment to remove particulates from CBFs at the customer’s site so the CBFs can be reused. Filtration also enables recovery of a greater percentage of used CBFs for reconditioning.
The Completion Fluids & Products Division manufactures liquid and dry calcium chloride and liquid calcium bromide, zinc bromide, zinc calcium bromide, and sodium bromide for distribution, primarily into energy markets. Liquid and dry calcium chloride are also sold into water treatment, industrial, cement, food processing, road maintenance, ice melt, agricultural, and consumer products markets. Sodium bromide is also sold into industrial water treatment markets, where it is used as a biocide in recirculated cooling tower waters and in other applications.
Our calcium chloride manufacturing facilities are located in the United States and Finland. We also acquire calcium chloride inventory from other producers. In the United States, we manufacture calcium chloride at five manufacturing plant facilities, the largest of which is our plant near El Dorado, Arkansas, which produces liquid and flake calcium chloride products and sodium chloride. Liquid and flake calcium chloride are also produced at our Kokkola, Finland, plant. We operate our European calcium chloride operations under the name TETRA Chemicals Europe. We also manufacture liquid calcium chloride at our facilities in Parkersburg, West Virginia and Lake Charles, Louisiana, and we have two solar evaporation facility locations located in San Bernardino County, California, that produce liquid calcium chloride and sodium chloride from underground brine reserves, which are replenished naturally. Our calcium chloride production facilities have a combined production capacity of more than 1.5 million equivalent liquid tons per year.
Our Completion Fluids & Products Division manufactures liquid calcium bromide, zinc bromide, zinc calcium bromide and sodium bromide at our West Memphis, Arkansas facility. A patented and proprietary process utilized at this facility uses bromine and zinc to manufacture zinc bromide. This facility also uses proprietary processes to manufacture calcium bromide and sodium bromide and to recondition and upgrade used CBFs that we have repurchased from our customers.
2
Water & Flowback Services Division
Our Water & Flowback Services Division provides a wide variety of water management services that support hydraulic fracturing in unconventional well completions for domestic onshore oil and gas operators. These services include fresh and produced water analysis, treatment, storage, transfer, engineering, recycling, and environmental risk mitigation. The Water & Flowback Services Division's patented equipment and processes include BioRid® treatment services, certain blending technologies, and TETRA Steel 1200 rapid deployment water transfer system. The Water & Flowback Services Division seeks to design environmentally friendly solutions for the unique needs of each customer’s wellsite in order to maximize operational performance and efficiency, and minimize the use of fresh water. These include tailored “Last Mile” infrastructure - which consists of water storage ponds, movable storage tanks, a networks of water transfer lines including poly pipe and TETRA Steel™ lay-flat hose, TETRA Blend™ automated transfer and blending of produced water, and oil recovery from produced water via the TETRA Orapt™ (Oil Recovery After Production Technology) mobile oil separation system to transfer water around well pads in a safe, efficient and environmentally responsible manner.
On February 28, 2018, pursuant to a purchase agreement dated February 13, 2018 (the “SwiftWater Purchase Agreement"), we purchased all of the equity interests in SwiftWater Energy Services, LLC ("SwiftWater"), which provides water management solutions to oil and gas operators in the Permian Basin market. SwiftWater provides a diverse range of water management equipment and services for operators, offering an integrated line of services ranging from lay-flat hose water transfer, water treatment, above-ground water storage for fresh and produced water applications, secondary frac tank containment, poly pipe transfer, pit lining rentals, and supporting ancillary equipment and services. For additional information regarding the acquisition of SwiftWater, see Note E - "Acquisitions and Dispositions" of the Notes to Consolidated Financial Statements.
On December 6, 2018, we purchased all the equity interests in JRGO Energy Services LLC (“JRGO”), which specializes in delivering comprehensive water management services for oil and gas operators, as well as municipal, state and federal organizations in the Appalachian region of the U.S. For additional information regarding the acquisition of JRGO, see Note E - "Acquisitions and Dispositions" of the Notes to Consolidated Financial Statements.
Our Water & Flowback Services Division also provides frac flowback services, early production facilities and services, production well testing services, offshore rig cooling services, and other associated services, including well flow management and evaluation services that enable operators to quantify oil and gas reserves, optimize oil and gas production and minimize oil and gas reservoir damage. In certain gas-producing basins, water, sand and other abrasive materials commonly accompany the initial production of natural gas, often under high-pressure and high-temperature conditions and, in some cases, from reservoirs containing high levels of hydrogen sulfide gas. The Water & Flowback Services Division provides the specialized equipment and qualified personnel to address these impediments to production. Early production services typically include sophisticated evaluation techniques for reservoir management, including unconventional shale reservoir exploitation and optimization of well workover programs. Frac flowback and production well testing services may include well control, well cleanup and laboratory analysis. These services are utilized in the completion process after hydraulic fracturing and in the production phase of oil and gas wells.
This Division maintains one of the largest fleets of high-pressure production testing equipment in the United States, including equipment designed to work in environments where high levels of hydrogen sulfide gas are present. The Division has domestic operating locations in Colorado, Louisiana, New Mexico, North Dakota, Ohio, Oklahoma, Pennsylvania, Texas, West Virginia, and Wyoming. The Division also has locations in Canada, and in certain countries in Latin America, Europe, Africa, and the Middle East. Production Testing operations in Canada are provided through our Greywolf Energy Services subsidiary ("Greywolf").
Through our Optima Solutions Holdings Limited subsidiary ("OPTIMA"), our Water & Flowback Services Division is a provider of offshore oil and gas rig cooling services and associated products that suppress heat and noise generated by high-rate flaring of hydrocarbons during offshore oil and gas well test operations. From off-the-shelf packages to complex engineered systems designed, fitted, and operated by our highly trained onshore and offshore teams. OPTIMA manages a large portfolio of custom-built and off-the-shelf pumping packages and temporary fire safety systems to suit the individual requirements of our customers with offshore operations in Asia-Pacific, Australia, Latin America, and the North Sea.
3
Compression Division
Our Compression Division is a provider of compression services and equipment for natural gas and oil production, gathering, transportation, processing, and storage. The Compression Division fabricates and sells standard and custom-designed compressor packages and provides aftermarket services and compressor package parts and components manufactured by third-party suppliers. The majority of the Compression Division’s service compression fleet is monitored 24/7 via satellite telemetry from Fleet Reliability Centers (FRC) located at The Woodlands, Texas-based corporate office and the Midland, Texas-based packaging facility. The Compression Division provides its compression services and equipment to a broad base of natural gas and oil exploration and production, midstream, transmission and storage companies operating throughout many of the onshore producing regions of the United States, Canada and Mexico, as well as certain countries in South America.
The Compression Division is one of the largest providers of natural gas compression services in the United States. The compression and related services business includes a service fleet of approximately 5,700 compressor packages providing approximately 1.1 million in aggregate horsepower, utilizing a full spectrum of low-, medium-, and high-horsepower engines. Low-horsepower compressor packages enhance production for dry gas wells and liquid-loaded gas wells by deliquifying wells, lowering wellhead pressure and increasing gas velocity. Our low-horsepower compressor packages are also utilized in connection with oil and liquids production and in vapor recovery and casing gas system applications. Low- to medium-horsepower compressor packages are typically utilized in wellhead, gathering, and other applications primarily in connection with oil and liquids production. Our high-horsepower compressor package offerings are typically utilized for natural gas production, natural gas gathering, centralized compression facilities and midstream applications.
The horsepower of our compression services fleet on December 31, 2018, is summarized in the following table:
Range of Horsepower Per Package | Number of Packages | Aggregate Horsepower | % of Total Aggregate Horsepower | ||||
Low horsepower (0-100) | 3,752 | 175,951 | 15.5 | % | |||
Medium-horsepower (101-1,000) | 1,587 | 443,901 | 39.1 | % | |||
High-horsepower (1,001 and over) | 380 | 515,625 | 45.4 | % | |||
Total | 5,719 | 1,135,477 | 100.0 | % | |||
Our Compression Division's equipment sales business includes the fabrication and sale of standard compressor packages and custom-designed compressor packages that are designed and fabricated primarily at its facility in Midland, Texas. Our compressor packages are typically sold to natural gas and oil exploration and production, midstream, transmission, and storage companies for use in various applications including gas gathering, gas lift, carbon dioxide injection, wellhead compression, gas storage, refrigeration plant, gas processing, pressure maintenance, pipeline, vapor recovery, gas transmission, fuel gas booster, and coal bed methane systems. We design and fabricate natural gas reciprocating and rotary compressor packages up to 2,500 horsepower for use in our service fleet and up to 8,000 horsepower for sale to our broadened customer base.
The Compression Division's aftermarket business provides a wide range of services and compressor package parts and components manufactured by third-party suppliers to support the needs of customers who own compression equipment. These services include operations, maintenance, overhaul and reconfiguration services, which may be provided under turnkey engineering, procurement and construction contracts. This business employs factory trained sales and support personnel in most of the major oil- and natural gas-producing basins in the United States to perform these services.
Virtually all of our Compression Division's operations are conducted through our partially owned CSI Compressco LP ("CCLP") subsidiary. Through one of our wholly owned subsidiaries, CSI Compressco GP Inc., we manage and control CCLP, and accordingly, we consolidate CCLP results of operation in our consolidated results of operation. As of December 31, 2018, common units held by the public represented approximately a 65% common unit ownership interest in CCLP.
4
Sources of Raw Materials
Our Completion Fluids & Products Division manufactures calcium chloride, calcium bromide, zinc bromide, zinc calcium bromide, and sodium bromide for sale to its customers. The Completion Fluids & Products Division also recycles used calcium bromide and zinc bromide CBFs repurchased from its oil and gas customers.
The Completion Fluids & Products Division manufactures liquid calcium chloride, either from underground brine or by reacting hydrochloric acid with limestone. The Completion Fluids & Products Division also purchases liquid and dry calcium chloride from a number of U.S. and foreign chemical manufacturers. Our El Dorado, Arkansas, plant produces liquid and flake calcium chloride and sodium chloride, utilizing underground brine (tail brine) obtained from Lanxess AG ("Lanxess") that contains calcium chloride and sodium chloride. We also produce calcium chloride and sodium chloride at our two facilities in San Bernardino County, California, by solar evaporation of pumped underground brine reserves that contain calcium chloride. The underground reserves of this brine are deemed adequate to supply our foreseeable need for calcium chloride at those plants.
The Completion Fluids & Products Division's primary sources of hydrochloric acid are co-product streams obtained from chemical manufacturers. Substantial quantities of limestone are also consumed when converting hydrochloric acid into calcium chloride. Currently, hydrochloric acid and limestone are generally available from multiple sources.
To produce calcium bromide, zinc bromide, zinc calcium bromide, and sodium bromide at our West Memphis, Arkansas facility, we use bromine, hydrobromic acid, zinc, and lime as raw materials. There are multiple sources of zinc that we can use in the production of zinc bromide and zinc calcium bromide. We have a long-term supply agreement with Lanxess, under which the Completion Fluids & Products Division purchases its requirements of raw material bromine from Lanxess’ Arkansas bromine production facilities. In addition, we have a long-term agreement with Lanxess under which Lanxess supplies our El Dorado, Arkansas calcium chloride plant with raw material tail brine.
We also own a calcium bromide manufacturing plant near Magnolia, Arkansas, which was constructed in 1985. This plant was acquired in 1988 and is not operable. We currently lease approximately 30,000 gross acres of bromine-containing brine reserves in the vicinity of this plant. While this plant is designed to produce calcium bromide, it could be modified to produce elemental bromine or select bromine compounds. Development of the brine field, construction of necessary pipelines and reconfiguration of the plant would require a substantial capital investment. The long-term Lanxess bromine supply agreement discussed above provides us with a secure supply of bromine to support the Division’s current operations. We do, however, continue to evaluate our strategy related to the Magnolia, Arkansas, assets and their future development. Lanxess has certain rights to participate in future development of the Magnolia, Arkansas assets.
The Water & Flowback Services Division purchases water management, production testing and rig cooling equipment and components from third-party manufacturers. CCLP designs and fabricates its reciprocating and rotary screw compressor packages with components obtained from third party suppliers. These components represent a significant portion of the cost of the compressor packages. Some of the components used in the assembly of compressor packages, well monitoring, sand separation, water management, production testing, and rig cooling equipment are obtained from a single supplier or a limited group of suppliers. We do not have long-term contracts with these suppliers or manufacturers. Should we experience unavailability of the equipment or the components we use to assemble our equipment, we believe there are adequate alternative suppliers and any impact to us would not be severe. CCLP occasionally experiences long-lead times for components from suppliers and, therefore, may at times make purchases in anticipation of future orders.
5
Market Overview and Competition
Our operations are significantly dependent upon the demand for, and production of, natural gas and oil in the various domestic and international locations in which we operate. Beginning in 2014, and continuing throughout most of 2016, reduced prices of natural gas and oil led to declines in our customers' drilling activities and capital expenditure levels in the domestic and international markets in which we operate. The decline in activity in the natural gas and oil exploration and production industry resulted in reduced demand for certain of our products and services compared to early 2014 levels. Oil and gas pricing increased throughout the second half of 2017 and most of 2018, and onshore demand has improved in the North America and international markets, with offshore activity remaining flat year-over-year. However, oil and gas pricing remains volatile.
Completion Fluids & Products Division
Our Completion Fluids & Products Division provides its products and services to oil and gas exploration and production companies in the United States and certain foreign markets, and to other customers that service such companies. Current areas of market presence include the onshore U.S., the U.S. Gulf of Mexico, the North Sea, Mexico, and certain countries in South America, Europe, Asia, the Middle East, and Africa. Customers with deepwater operations frequently utilize high volumes of clear brine fluids ("CBFs"), which can be subject to harsh downhole conditions, such as high pressure and high temperatures. Demand for CBF products is generally driven by offshore completion activity.
Our Completion Fluids & Products Division’s principal competitors in the sale of CBFs to the oil and gas industry are other major international drilling fluids and energy services companies, to many of which we provide products and services. This market is highly competitive, and competition is based primarily on service, availability, and price. Customers of the Completion Fluids & Products Division include significant oilfield service companies, major and independent U.S. and international oil and gas producers, and U.S. and international chemical providers. The Completion Fluids & Products Division also sells its CBF products through various distributors.
Our liquid and dry calcium chloride products have a wide range of uses outside the energy industry. Non-energy market segments where these products are used include water treatment, industrial, food processing, road maintenance, ice melt, agricultural, and consumer products. We also sell sodium bromide into industrial water treatment markets as a biocide under the BioRid® tradename. Most of these markets are highly competitive. The Completion Fluids & Products Division’s European calcium chloride operations market our calcium chloride products to certain European markets. Our principal competitors in the non-energy related calcium chloride markets include Occidental Chemical Corporation and Vitro in North America and NedMag in Europe.
Water & Flowback Services Division
The Water & Flowback Services Division provides comprehensive water management and frac flowback services to a wide-range of onshore oil and gas operators located in all active North America unconventional oil and gas basins. The acquisition of SwiftWater continues to expand our market share in the Permian Basin, which is one of the fastest growing basins for oilfield services globally. SwiftWater gives us significant additional service capacity as well as incremental services that allow us increased cross-selling of our water management, flowback and fluids products and services.
Our Water & Flowback Services Division also provides frac flowback services, early production facilities and services, production well testing services, offshore rig cooling services, and other associated services in various onshore domestic and international locations, including well flow management and evaluation services that enable operators to quantify oil and gas reserves, optimize oil and gas production, and minimize oil and gas reservoir production damage. Through our Greywolf subsidiary, the Division serves the western Canada market. In addition, through our OPTIMA subsidiary, we offer offshore oil and gas rig cooling services and associated products that suppress heat and noise generated by high-rate flaring of hydrocarbons during offshore well testing operations. OPTIMA primarily serves offshore markets globally.
The water management, flowback and production testing markets are highly competitive, and competition is based on availability of appropriate equipment and qualified personnel, as well as price, quality of service, and safety record. We believe that our skilled personnel, operating procedures, integrated closed-loop water management systems, and safety record give us a competitive advantage. Competition in the U.S. water management markets includes various regional companies and Select Energy, while competition in onshore U.S.
6
and Canadian production testing markets is primarily dominated by numerous small, privately owned operators. Expro International, Halliburton, and Schlumberger are competitors in the foreign markets we serve although we provide these services to their customers on a subcontract basis from time to time. The customers for the Water & Flowback Services Division include major integrated and independent U.S. and international oil and gas producers that are active in the areas in which we operate. Competitors for our water management services include large, multinational providers, as well as small, privately owned operators.
Compression Division
The Compression Division provides its products and services to a broad base of natural gas and oil exploration and production, midstream, pipeline transmission, and storage companies, operating throughout many of the onshore producing regions of the United States. The Compression Division also has operations in Latin America and other foreign regions. While most of the Compression Division's services are performed throughout Texas, the San Juan Basin, the Rocky Mountain region and the Midcontinent region of the United States, we also have a presence in other U.S. producing regions. The Compression Division continues to seek opportunities to further expand its operations into other regions in the U.S. and elsewhere in the world.
This Division’s strategy is to compete on the basis of superior services at a competitive price. The Compression Division believes that it is competitive because of the significant increases in the value that results from the use of its services, its superior customer service, its highly trained field personnel and the quality of the compressor packages it uses to provide services. The Compression Division’s customers include major integrated oil companies, public and private independent exploration and production companies and midstream companies.
The compression services and compressor package fabrication business is highly competitive. Certain of the Compression Division's competitors may be able to more quickly adapt to changes within the compression industry and changes in economic conditions as a whole, more readily take advantage of available opportunities and adopt more aggressive pricing policies. Primary competition for our low-horsepower compression services business comes from various local and regional companies that utilize packages consisting of a screw compressor with a separate engine driver or a reciprocating compressor with a separate engine driver. These local and regional competitors tend to compete with us on the basis of price as opposed to our focus on providing production enhancement value to the customer. Competition for the medium- and high-horsepower compression services business comes primarily from large companies that may have greater financial resources than ours. Such competitors include ArchRock, Kodiak Gas Services, and USA Compression. Our competition in the standard compressor package fabrication and sales market includes several large companies and a large number of small, regional fabricators, including some of those who we compete with for compression services, as well as Enerflex, Exterran and others. The Compression Division's competition in the custom-designed compressor package market usually consists of larger companies that have the ability to address integrated projects and provide product support after the sale. The ability to fabricate these large custom-designed packages at the Compression Division's facilities, which is near the point of end-use of many customers, is often a competitive advantage.
No single customer provided 10% or more of our total consolidated revenues during the year ended December 31, 2018.
Other Business Matters
Backlog
The Compression Division’s equipment sales business consists of the fabrication and sale of standard compressor packages and custom-designed compressor packages that are fabricated to customer specifications and standard specifications, as applicable. The Division's custom-designed compressor packages are typically greater in size and complexity than standard fabrication packages, requiring more labor, materials, and overhead resources. This business requires diligent planning of those resources and project and backlog management in order to meet the customers' desired delivery dates and performance criteria, and achieve fabrication efficiencies. As of December 31, 2018, the Compression Division's equipment sales backlog was $105.2 million, all of which is expected to be recognized in 2019. This backlog consists of firm customer orders for which a purchase or work order has been received, satisfactory credit or financing arrangements exist, and delivery has been scheduled. This backlog is a measure of marketing effectiveness that also allows us to plan future labor and raw material needs and to measure our success in winning bids from our customers.
7
Other than these Compression Division operations, our products and services generally are either not sold under long-term contracts or do not require long lead times to procure or deliver.
Employees
As of December 31, 2018, we had approximately 2,900 employees, including the employees of CCLP. None of our U.S. employees are presently covered by a collective bargaining agreement. Our foreign employees are generally members of labor unions and associations in the countries in which they are employed. We believe that our relations with our employees are good.
Patents, Proprietary Technology and Trademarks
As of December 31, 2018, we owned or licensed thirty-two issued U.S. patents and had six patent applications pending in the United States. We also had thirty-seven owned or licensed patents and fifteen patent applications pending in various other countries. The foreign patents and patent applications are primarily foreign counterparts to certain of our U.S. patents or patent applications. The issued patents expire at various times through 2035. We have elected to maintain certain other internally developed technologies, know-how, and inventions as trade secrets. While we believe that our patents and trade secrets are important to our competitive positions in our businesses, we do not believe any one patent or trade secret is essential to our success.
It is our practice to enter into confidentiality agreements with key employees, consultants and third parties to whom we disclose our confidential and proprietary information, and we have typical policies and procedures designed to maintain the confidentiality of such information. There can be no assurance, however, that these measures will prevent the unauthorized disclosure or use of our trade secrets and expertise, or that others may not independently develop similar trade secrets or expertise.
We sell various products and services under a variety of trademarks and service marks, some of which are registered in the United States or other countries.
Health, Safety, and Environmental Affairs Regulations
We believe that our service and sales operations and manufacturing plants are in substantial compliance with all applicable U.S. and foreign health, safety, and environmental laws and regulations. We are committed to conducting all of our operations under the highest standards of safety and respect for the environment. However, risks of substantial costs and liabilities are inherent in certain of our operations and in the development and handling of certain products and equipment produced or used at our plants, well locations, and worksites. Because of these risks, there can be no assurance that significant costs and liabilities will not be incurred in the future. Changes in environmental and health and safety regulations could subject us to more rigorous standards. We cannot predict the extent to which our operations may be affected by future regulatory and enforcement policies.
We are subject to numerous federal, state, local, and foreign laws and regulations relating to health, safety, and the environment, including regulations regarding air emissions, wastewater and storm water discharges, and the disposal of certain hazardous and nonhazardous wastes. Compliance with laws and regulations may expose us to significant costs and liabilities, and cause us to incur significant capital expenditures in our operations. Failure to comply with these laws and regulations or associated permits may result in the assessment of fines and penalties and the imposition of other obligations.
Our operations in the United States are subject to various evolving environmental laws and regulations that are enforced by the U.S. Environmental Protection Agency ("EPA"); the Bureau of Safety and Environmental Enforcement ("BSEE") of the U.S. Department of the Interior; the U.S. Coast Guard; and various other federal, state, and local environmental authorities. Similar laws and regulations, designed to protect the health and safety of our employees and visitors to our facilities, are enforced by the U.S. Occupational Safety and Health Administration, and other state and local agencies and authorities. Specific environmental laws and regulations applicable to our operations include: (i) the Federal Water Pollution Control Act of 1972 (the "Clean Water Act"); (ii) the Resource Conservation and Recovery Act of 1976; (iii) the Clean Air Act of 1977 ("CAA"); (iv) the Comprehensive Environmental Response, Compensation and Liability Act of 1980 ("CERCLA"); (v) the Superfund Amendments and Reauthorization Act of 1986; (vi) the Toxic Substances Control Act of 1976; (vii) the Hazardous Materials Transportation Act of 1975; (viii) and the Pollution Prevention Act of 1990. Our operations outside the United States
8
are subject to various foreign governmental laws and regulations relating to the environment, health and safety, and other regulated activities in the countries in which we operate.
We routinely deal with natural gas, oil, and other petroleum products. Hydrocarbons or other hazardous wastes may have been released during our operations or by third parties on wellhead sites where we provide services or store our equipment or on or under other locations where wastes have been taken for disposal. These properties may be subject to investigatory, remediation, and monitoring requirements under foreign, federal, state, and local environmental laws and regulations.
The EPA has adopted regulations under the CAA to control emissions of hazardous air pollutants from reciprocal internal combustion engines and more recently the EPA adopted regulations that establish air emission controls for natural gas and natural gas liquids production, processing and transportation activities, including EPA's New Source Performance Standards ("NSPS") as well as emission standards to address hazardous air pollutants. Certain CCLP compressor packages are subject to these new requirements and additional control equipment and maintenance operations are required. While we do not believe that compliance with current regulatory requirements will have a material adverse effect on the business, additional regulations could impose new air permitting or pollution control requirements on our equipment that could require us to incur material costs.
The modification or interpretation of existing environmental laws or regulations, the more vigorous enforcement of existing environmental laws or regulations, or the adoption of new environmental laws or regulations may also adversely affect oil and natural gas exploration and production, which in turn could have an adverse effect on us.
In accordance with Section 402 of the Clean Water Act, the EPA is authorized to issue National Pollutant Discharge Elimination System (NPDES) General Permits to regulate offshore discharges in the Gulf of Mexico which includes Treatment, Completion and Workover ("TCW") fluids. Our operations provide services and materials to oil and gas operators for the use of TCW fluids in the Gulf of Mexico. Both Region IV and Region VI of the EPA are currently working with the oil and gas industry to further investigate the toxicity characteristics of TCW fluids. The study is expected to take place over the next few years and could impose additional restrictions under the Clean Water Act, however they are not expected to have a material adverse impact. The Clean Water Act and comparable state laws, and regulations thereunder, also regulate the discharge of pollutants into regulated waters, including industrial wastewater discharges and storm water runoff.
We maintain various types of insurance intended to reimburse us for certain costs in the event of an accident, including an explosion or similar event involving our offshore operations. Our insurance program is reviewed not less than annually with our insurance brokers and underwriters. As part of our insurance program for offshore operations, we maintain Commercial General Liability, Protection and Indemnity, and Excess Liability policies that provide third-party liability coverage, including but not limited to death and personal injury, collision, damage to property including fixed and floating objects, pollution, and wreck removal up to the applicable policy limits.
Item 1A. Risk Factors.
Certain Business Risks
Although it is not possible to identify all of the risks we encounter, we have identified the following significant risk factors that could affect our actual results and cause actual results to differ materially from any such results that might be projected, forecasted, or estimated by us in this report.
Market Risks
The demand and prices for our products and services are affected by several factors, including the supply, demand, and prices for oil and natural gas.
Demand for our services and products is particularly sensitive to the level of exploration, development, and production activity of, and the corresponding capital spending by, oil and natural gas companies. The level of exploration, development, and production activity is directly affected by trends in oil and natural gas prices, which historically have been volatile and are likely to continue to be volatile. Prices for oil and natural gas are subject to
9
large fluctuations in response to relatively minor changes in the supply of and demand for oil and natural gas, market uncertainty, and a variety of other economic factors that are beyond our control.
The reduction in oil and natural gas prices that began in 2014 and continued through 2015 and 2016 resulted in declining demand for certain of our products and services compared to 2014 levels. Although oil prices steadily increased during late 2017 and early 2018, they fell during the fourth quarter of 2018, with 2018 West Texas Intermediate oil prices dropping from a high of $76.90 per barrel in October 2018 to a low of $42.36 per barrel in December 2018. The West Texas Intermediate price was $55.80 per barrel as of March 1, 2019. U.S. natural gas prices have also been volatile over the past three years, with the Henry Hub price ranging from a low of $1.61 per million British thermal units (“MMBtu”) in March 2016 to a high of $4.93 per MMBtu in November 2018. The Henry Hub price for natural gas as of March 1, 2019 was $2.86 per MMBtu. For more information, see “Management’s Discussion and Analysis of Financial Condition and Results of Operations - Business Overview and Results of Operations.”
The prolonged reduction in oil and natural gas prices depressed levels of exploration, development, and production activity in 2015 and 2016, and if current oil and natural gas prices remain depressed or further decline, they could have a material adverse effect on our business, consolidated results of operations, and consolidated financial condition. Should current market conditions worsen for an extended period of time, we may be required to record additional asset impairments. Such potential impairment charges could have a material adverse impact on our operating results. Even forecasts of longer-term lower oil and natural gas prices by oil and natural gas companies, including current concerns caused by the drop in oil prices during the fourth quarter of 2018, can similarly reduce or defer major expenditures given the long-term nature of many large-scale development projects.
Factors affecting the prices of oil and natural gas include: the level of supply and demand for oil and natural gas; governmental regulations, including the policies of governments regarding the exploration for and production and development of their oil and natural gas reserves; weather conditions and natural disasters; worldwide political, military, and economic conditions; the ability or willingness of the Organization of Petroleum Exporting Countries ("OPEC") to set and maintain oil production levels; the levels of oil production by non-OPEC countries; oil refining capacity and shifts in end-customer preferences toward fuel efficiency and the use of natural gas; the cost of producing and delivering oil and natural gas; and potential acceleration of the development of alternative fuels.
Current debt and equity market conditions may continue to limit our ability, and the ability of our CCLP subsidiary, to obtain additional financing, including to pursue other business opportunities.
Current conditions in the market for debt and equity securities in the energy sector have increased the difficulty of obtaining debt or equity financing to grow our and CCLP's businesses. As of December 31, 2018, the market price for our common stock was $1.68 per share and the market price per common unit of CCLP was $2.32, reflecting steep declines during the fourth quarter of 2018. As of March 1, 2019, the price of our common stock and the price of the common units of CCLP were $2.48 and $3.10, respectively. At the current price for our common stock, acquisition and financing transactions that involve the use of our common equity may be significantly dilutive to our stockholders. The issuance of new convertible debt or equity securities (similar to the Series A Convertible Preferred Units of CCLP that were issued in late 2016 (the "CCLP Preferred Units")) in the future for acquisition and financing transactions, if available, could be significantly dilutive to current common unitholders. In addition, as of December 31, 2018, CCLP had approximately $645.9 million aggregate principal amount outstanding under its 7.25% Senior Notes and 7.50% Senior Secured Notes. Obtaining equity or debt financing in the current market environment is particularly difficult for CCLP, given its current levels of long-term debt.
During the twelve months ended December 31, 2018, CCLP's total capital expenditures were $103.5 million, primarily consisting of growth capital expenditures to increase its compression services equipment fleet. The majority of these capital expenditures were funded through the issuance of long-term debt during 2018. As of December 31, 2018, CCLP's total cash balance was $15.9 million. CCLP expects that the combination of this $15.9 million of cash on hand at the beginning of 2019, operating cash flows expected to be generated during the year, and financing transactions with TETRA will be sufficient to fund its anticipated 2019 capital expenditures without having to access the debt or equity markets. However, CCLP's ability to grow its business through capital expenditure or acquisition activities beyond these sources of financing may be significantly limited or curtailed. Without the ability to increase CCLP's compression equipment fleet or otherwise grow its operations, CCLP's ability to continue to retain customers whose compression services needs are expanding and to increase distributions to its common unitholders, including us, in the future may be limited.
10
We encounter, and expect to continue to encounter, intense competition in the sale of our products and services.
We compete with numerous companies in each of our operating segments, many of which have substantially greater financial and other resources than we have. Certain of our competitors have lower standards of quality, and offer equipment and services at lower prices than we do. Other competitors have newer equipment that is better suited to our customers' needs. Particularly during a period of low oil and natural gas pricing, to the extent competitors offer products or services at lower prices or higher quality, or more cost-effective products or services, our business could be materially and adversely affected. In addition, certain of our customers may elect to perform services internally in lieu of using our services, which could also materially and adversely affect our operations.
The profitability of our operations is dependent on other numerous factors beyond our control.
Our operating results in general, and gross profit in particular, are determined by market conditions and the products and services we sell in any period. Other factors, such as heightened competition, changes in sales and distribution channels, availability of skilled labor and contract services, shortages in raw materials, or inability to obtain supplies at reasonable prices, may also affect the cost of sales and the fluctuation of gross margin in future periods.
Other factors affecting our operating results and activity levels include oil and natural gas industry spending levels for exploration, completion, production, development, and acquisition activities, and impairments of long-lived assets. In particular, Completion Fluids & Products Division profitability in future periods will continue to be affected by the mix of its products and services, including the timing of TETRA CS Neptune completion fluid projects, which are also dependent upon the success of customer offshore exploration and drilling efforts. Several of our customers reduced their capital expenditures during 2016 and 2017 in light of the significant declines in the prices of oil and natural gas, and the decline in oil prices during the fourth quarter of 2018, if sustained, could have a similar impact to 2019 industry capital expenditures. Such industry capital expenditure reductions have had, and are expected to continue to have, a negative effect on the demand for many of our products and services. This has had, and may continue to have, a negative effect on our revenues and results of operations. A large concentration of our operating activities is located in the Permian Basin region of Texas and New Mexico. Our revenues and profitability are particularly dependent upon oil and natural gas industry activity and spending levels in this region. Our operations may also be affected by technological advances, cost of capital, and tax policies. Adverse changes in any of these other factors may have a material adverse effect on our revenues and profitability.
Changes in the economic environment have resulted, and could further result, in significant impairments of certain of our long-lived assets and goodwill.
During the first quarter of 2016, we recorded consolidated long-lived asset impairments (excluding goodwill impairments) of approximately $10.7 million. During the fourth quarter of 2016, primarily as a result of the impact of significant decreases in oil and natural gas prices on certain of our long-lived assets, we recorded consolidated long-lived asset impairments of approximately $7.2 million. During the fourth quarter of 2017, consolidated long-lived asset impairments of approximately $14.9 million were recorded primarily due to the impairment of a certain identified intangible asset resulting from decreased expected future operating cash flows from a Water & Flowback Services Division customer. During the third quarter of 2018, as a result of decreased expected future cash flows from a specific customer contract, we recorded a long-lived asset impairment of $2.9 million of an identified intangible asset within the Water & Flowback Services segment. During the two year period ending December 31, 2018, we have recorded a total of $18.5 million of impairments and other charges. Depressed commodity prices and/or adverse changes in the economic environment could result in a greater decrease in the demand for many of our products and services, which could impact the expected utilization rates of certain of our long-lived assets, including plant facilities, operating locations, and other operating equipment. Under U.S. generally accepted accounting principles ("GAAP"), we review the carrying value of our long-lived assets when events or changes in circumstances indicate that the carrying value of these assets may not be recoverable, based on their expected future cash flows. The impact of reduced expected future cash flow could require the write-down of all or a portion of the carrying value for these assets, which would result in additional impairments, resulting in decreased earnings.
As of December 31, 2018, our consolidated goodwill consists of the $25.9 million of goodwill attributed to our Water Management reporting unit, as part of our Water & Flowback Services Division. Under U.S. GAAP, we review the carrying value of our goodwill for possible impairment annually or when events or changes in
11
circumstances indicate the carrying value may not be recoverable. Changes in circumstances indicating the carrying value of our goodwill may not be recoverable include a decline in our stock price or future cash flows and slower growth rates in our industry. If economic and market conditions decline, we may be required to record additional charges to earnings during the period in which any impairment of our goodwill is determined, resulting in a negative impact on our results of operations. Specific uncertainties affecting the estimated fair value of our Water Management reporting unit includes the impact of competition, prices of oil and natural gas, and future overall activity levels in the regions in which we operate, the activity levels of our significant customers, and other factors affecting the rate of future growth of this reporting unit. These factors will continue to be reviewed and assessed going forward. Negative developments with regard to these factors could have a further negative effect on the fair value of the Water Management reporting unit, resulting in the impairment of all or a portion of goodwill.
We are dependent on third-party suppliers for specific products and equipment necessary to provide certain of our products and services.
We sell a variety of CBFs to the oil and gas industry and non-energy markets, including calcium chloride, calcium bromide, zinc bromide, zinc calcium bromide, sodium bromide, and formate-based brines, some of which we manufacture and some of which are purchased from third parties. Sales of these products contribute significantly to our revenues. In our manufacture of calcium chloride, we use brines, hydrochloric acid, and other raw materials purchased from third parties. In our manufacture of brominated CBF products, we use elemental bromine, hydrobromic acid, and other raw materials that are purchased from third parties. We rely on Lanxess as a supplier of bromine for our brominated CBF products as well as tail brine for our El Dorado, Arkansas, calcium chloride plant. Although we have long-term supply agreements with Lanxess, if we were unable to acquire these raw materials at reasonable prices for a prolonged period, our Completion Fluids & Products Division business could be materially and adversely affected.
The fabrication of CCLP's compression packages and our production testing, well monitoring, and rig cooling equipment requires the purchase of various components, some of which we obtain from a single source or a limited group of suppliers. Our reliance on these suppliers exposes us to the risk of price increases, inferior component quality, or an inability to obtain an adequate supply of required components in a timely manner. The profitability or future growth of our Compression and Water & Flowback Services Divisions may be adversely affected due to our dependence on these key suppliers.
Our success depends upon the continued contributions of our personnel, many of whom would be difficult to replace, and the continued ability to attract new employees.
Our success depends on our ability to attract, train, and retain skilled management and employees at reasonable compensation levels. The delivery of our products and services requires personnel with specialized skills and experience. In addition, our ability to expand our operations depends in part on our ability to increase the size of our skilled labor force. The demand for skilled managers and workers in the U.S. Gulf Coast region and other regions in which we operate is high and the supply is limited. A lack of qualified personnel, could adversely affect operating results.
The demand for our products and services in the U.S. Gulf of Mexico could continue to be adversely impacted by increased regulation and continuing regulatory uncertainty.
Operations in the U.S. Gulf of Mexico have been subject to an increasingly stringent regulatory environment including government regulations focused on offshore operating requirements, spill cleanup, and enforcement matters. These regulations also implement additional safety and certification requirements applicable to offshore activities in the U.S. Gulf of Mexico. Demand for the products and services of our Completion Fluids & Products Division in the U.S. Gulf of Mexico continues to be affected by these regulations. Future regulatory requirements could delay our customers’ activities, reduce our revenues, and increase our operating costs, including the cost to insure offshore operations, resulting in reduced cash flows and profitability.
Operating, Technological, and Strategic Risks
We may not fully realize the benefits from the SwiftWater or JRGO acquisitions.
On February 28, 2018, we purchased all of the equity interests in SwiftWater, which is engaged in the business of providing water management and water solutions to oil and gas operators in the Permian Basin market.
12
On December 6, 2018, we purchased the equity interests of JRGO, which specializes in delivering comprehensive water management services, including containment solutions, for oil and gas operators in the Appalachian region of the U.S.
We performed an inspection of each entity's assets and liabilities, which we believe to be generally consistent with industry practices. However, there could be unknown liabilities or other problems that are not necessarily observable even when the inspection is undertaken. If problems are identified of the SwiftWater and JRGO acquisitions, we may have limited recourse.
We have technological and age-obsolescence risk, both with our products and services as well as with our equipment assets.
New drilling, completion, and production technologies and equipment are constantly evolving. If we are unable to adapt to new advances in technology or replace older assets with new assets, we are at risk of losing customers and market share. Certain equipment, such as a portion of our production testing equipment fleet, may be inadequate to meet the needs of our customers in certain markets. The permanent replacement or upgrade of any of our equipment will require significant capital. Due to the unique nature of many of these assets, finding a suitable or acceptable replacement may be difficult and/or cost prohibitive. The replacement or enhancement of these assets over the next several years may be necessary in order for us to effectively compete in the current marketplace.
We face risks related to our long-term growth strategy.
Our long-term growth strategy includes both internal growth and growth through acquisitions. Internal growth may require significant capital expenditures, some of which may become unrecoverable or fail to generate an acceptable level of cash flows. Internal growth also requires financial resources (including the use of available cash or additional long-term debt), management, and personnel resources. Acquisitions also require significant management resources, both at the time of the transaction and during the process of integrating the newly acquired business into our operations. Acquisitions could adversely affect our operations if we are unable to successfully integrate the newly acquired operations into our existing operations, are unable to hire adequate personnel, or are unable to retain existing personnel. We may not be able to consummate future acquisitions on favorable terms. Acquisition or internal growth assumptions developed to support our decisions could prove to be overly optimistic. Future acquisitions by us could result in issuances of equity securities or the rights associated with the equity securities, which could potentially dilute earnings per share. Future acquisitions could result in the incurrence of additional debt or contingent liabilities and amortization expenses related to intangible assets. These factors could adversely affect our future operating results and financial position.
Our operations involve significant operating risks and insurance coverage may not be available or cost-effective.
We are subject to operating hazards normally associated with the oilfield service industry, including automobile accidents, fires, explosions, blowouts, formation collapse, mechanical problems, abnormally pressured formations, and environmental accidents. Environmental accidents could include, but are not limited to oil spills, gas leaks or ruptures, uncontrollable flows of oil, gas, or well fluids, or discharges of CBFs or toxic gases or other pollutants. These operating hazards may also include injuries to employees and third parties during the performance of our operations. In the past, our Compression Division has on occasion experienced fires that have damaged or destroyed certain of its compression fleet, and similar accidents or fires could reoccur in the future.
We have maintained a policy of insuring our risks of operational hazards that we believe is customary in the industry. We believe that the limits of insurance coverage we have purchased are consistent with the exposures we face and the nature of our products and services. Due to economic conditions in the insurance industry, from time to time, we have increased our self-insured retentions for certain policies in order to minimize the increased costs of coverage, or we have reduced our limits of insurance coverage for, or not procured, named windstorm coverage. In certain areas of our business, we, from time to time, have elected to assume the risk of loss for specific assets. To the extent we suffer losses or claims that are not covered, or are only partially covered by insurance, our results of operations could be adversely affected.
13
Weather-Related Risks
Certain of our operations are seasonal and depend, in part, on weather conditions.
In certain markets, the Water & Flowback Services Division’s onshore water management services can be dependent on adequate water supplies being available to its customers. To the extent severe drought or other weather-related conditions prevent our customers from obtaining needed water, frac water operations may not be possible and our Water & Flowback Services Division business may be negatively affected.
Severe weather, including named windstorms, can cause damage and disruption to our businesses.
A portion of our operations is susceptible to adverse weather conditions in the Gulf of Mexico, including hurricanes and other extreme weather conditions. Even if we do not experience direct damage from storms, we may experience disruptions in our operations, because we are unable to operate or our customers or suppliers may curtail their activities due to damage to their wells, platforms, pipelines, and facilities. From time to time, our onshore operations are also negatively affected by adverse weather conditions, including sustained rain and flooding.
Financial Risks
Our long-term debt agreements contain covenants and other provisions that restrict our ability to take certain actions and may limit our ability to grow our business in the future.
As of December 31, 2018, our total long-term debt outstanding (excluding CCLP) of $182.5 million consisted of the carrying amount outstanding under our credit agreement (the “Term Credit Agreement”) and our Asset-Based Credit Agreement (the "ABL Credit Agreement"), both of which we entered into in September 2018. In addition, in June 2018, CCLP entered into a Loan and Security Agreement (the "CCLP Credit Agreement"), although there was no balance outstanding under the CCLP Credit Agreement as of December 31, 2018. As of December 31, 2018, our consolidated balance sheet includes $633.0 million carrying amount of long-term debt of CCLP, which consisted of (i) $343.2 million carrying amount under its 7.50% Senior Secured Notes due 2025 (the "CCLP 7.50% Senior Secured Notes"), and (ii) $289.8 million carrying amount of CCLP's 7.25% Senior Notes due 2022 (the "CCLP 7.25% Senior Notes"). Debt service costs related to outstanding long-term debt represents a significant use of our and CCLP's operating cash flows and could increase our and CCLP's vulnerability to general adverse economic and industry conditions.
The ABL Credit Agreement and Term Credit Agreement each contains certain affirmative and negative covenants, including covenants that restrict the ability of TETRA and certain of its subsidiaries (other than CCLP) to take certain actions including, among other things and subject to certain significant exceptions, (i) incurring debt, (ii) granting liens, (iii) engaging in mergers and other fundamental changes, (iv) making investments, (v) entering into, or amending, transactions with affiliates, (vi) paying dividends and making other restricted payments, (vii) prepaying other indebtedness, and (viii) selling assets. The ABL Credit Agreement also contains a provision that may require a fixed charge coverage ratio (as defined in the ABL Credit Agreement) of not less than 1.00 to 1.00 in the event that certain conditions associated with outstanding borrowings and cash availability occur. The Term Credit Agreement also contains a requirement that the borrowers comply at the end of each fiscal quarter with a minimum Interest Coverage Ratio (as defined in the Term Credit Agreement) of 1.00 to 1.00.
The CCLP Credit Agreement contains certain affirmative and negative covenants, including covenants that restrict the CCLP's ability to take certain actions including, among other things and subject to certain significant exceptions, (i) incurring debt, (ii) granting liens, (iii) making investments, (iv) entering into or amending transactions with affiliates, (v) paying dividends, and (vi) selling assets. The CCLP Credit Agreement also contains a provision that requires compliance with a fixed charge coverage ratio (as defined in the CCLP Credit Agreement) of not less than 1.0 to 1.0 in the event that certain conditions associated with outstanding borrowings and cash availability occur.
In addition, the indentures governing the CCLP 7.50% Senior Secured Notes and the CCLP 7.25% Senior Notes (the "CCLP Indentures") contain customary covenants restricting CCLP's ability and the ability of its restricted subsidiaries to (i) pay distributions on, purchase, or redeem its common units, make certain investments and other restricted payments, or purchase or redeem any subordinated debt; (ii) incur or guarantee additional indebtedness or issue certain kinds of preferred equity securities; (iii) create or incur certain liens securing indebtedness; (iv) sell
14
assets, including dispositions of the CCLP 7.50% Senior Secured Notes Collateral; (v) consolidate, merge, or transfer all or substantially all of its assets; (vi) enter into, or amend or modify transactions with affiliates; and (vii) enter into agreements that restrict distributions or other payments from CCLP's restricted subsidiaries to CCLP. These covenants are subject to a number of important limitations and exceptions, including certain provisions permitting CCLP, subject to the satisfaction of certain conditions, to transfer assets to certain of its unrestricted subsidiaries.
Our continuing ability to comply with covenants in our Long-Term Debt Agreements depends largely upon our ability to generate adequate earnings and operating cash flow.
The debt levels of our CCLP subsidiary have resulted in a significant use of its operating cash flows being used to fund debt service requirements, resulting in less cash available for distributions.
In March 2018, CCLP issued an aggregate $350.0 million of its 7.50% Senior Secured Notes due 2025 (the "CCLP 7.50% Senior Secured Notes"), the proceeds from which were partially used to repay the remaining outstanding balance of $258.0 million under CCLP's previous bank credit facility, which was then terminated. While the termination of the CCLP previous bank credit agreement removed certain financial covenant requirements, the issuance of the 7.50% Senior Secured Notes increased CCLP's aggregate amount of long-term debt outstanding as well as increased the aggregate interest rate of its debt outstanding. This increase in CCLP indebtedness has increased its total interest expense, which in turn reduces its cash available to fund capital expenditures or for distribution to CCLP's common unitholders, including us. CCLP's ability to service its indebtedness will depend upon, among other things, its future financial and operating performance, which will be affected by prevailing economic conditions and financial, business, regulatory and other factors, some of which are beyond its control. If CCLP operating results are not sufficient to service its current or future indebtedness, CCLP may be forced to consider taking actions such as reducing or delaying is business activities, acquisitions, investments and/or capital expenditures, delaying the increase of distributions, selling assets, restructuring or refinancing its indebtedness, or seeking additional equity capital or bankruptcy protection. CCLP may not be able to take any of these courses of action.
On December 20, 2018, CCLP announced that, given the decline in its common unit price, it was reducing its common unit distributions from $0.75 per unit per year (or $0.1875 per quarter) to $0.04 per unit per year (or $0.01 per quarter) for a period of up to four quarters, beginning with the February 2019 distribution. CCLP intends to use the approximately $34 million of the savings from the reduced distribution to redeem the remaining CCLP Preferred Units for cash and avoid the dilution to its common unitholders that would occur if the CCLP Preferred Units were converted into common units. Given its need to fund capital expenditures and debt service requirements, there can be no assurance that CCLP will increase its distributions to its common unitholders, including us, following the redemption of the CCLP Preferred Units.
We have continuing exposure to abandonment and decommissioning obligations associated with oil and gas properties previously owned by Maritech.
From 2001 to 2012, Maritech sold oil and gas producing properties in numerous transactions to different buyers. In connection with those sales, the buyers assumed the decommissioning liabilities associated with the properties sold (the "Legacy Liabilities") and generally became the successor operator. Some buyers of these Maritech properties subsequently sold certain of these properties to other buyers, who also assumed the financial responsibilities associated with the properties' operations, and these buyers also typically became the successor operator of the properties. To the extent that a buyer of these properties fails to perform the abandonment and decommissioning work required, a previous owner, including Maritech, may be required to perform the abandonment and decommissioning obligation. As the former parent company of Maritech, we also may be responsible for performing these abandonment and decommissioning obligations. A significant portion of the decommissioning liabilities that were assumed by the buyers of the Maritech properties in these previous sales remains unperformed, and we believe the amounts of these remaining liabilities are significant. We generally monitor the financial condition of the buyers of these properties, and if oil and natural gas pricing levels deteriorate, we expect that one or more of these buyers may be unable to perform the decommissioning work required on properties they acquired, either directly or indirectly from Maritech.
In March 2018, pursuant to a series of transactions, Maritech completed the sales of the remaining active leases held by Maritech to Orinoco Natural Resources, LLC ("Orinoco") and, immediately thereafter, we sold all
15
equity interest in Maritech to Orinoco. Under the Maritech Asset Purchase Agreement, Orinoco assumed all of Maritech's abandonment and decommissioning obligations related to the active leases (the “Orinoco Lease Liabilities”) and under the Maritech Equity Purchase Agreement Orinoco assumed all other liabilities of Maritech, including the Legacy Liabilities, subject to limited exceptions unrelated to the asset retirement obligations. Pursuant to a Bonding Agreement executed in connection with such purchase agreements, Orinoco provided non-revocable bonds in the aggregate amount of $47.0 million to secure their performance of Maritech’s abandonment and decommissioning obligations related to the Orinoco Lease Liabilities and Maritech’s remaining current abandonment and decommissioning obligations (not including the Legacy Liabilities). Orinoco was required to replace, within 90 days following the closing, the initial bonds delivered at closing with non-revocable performance bonds, meeting certain requirements, in the aggregate sum of $47.0 million. Orinoco has not delivered such replacement bonds and we are seeking to enforce the terms of the Bonding Agreement. The non-revocable performance bonds delivered at the closing remain in effect.
If in the future we become liable for any abandonment and decommissioning liability associated with any property previously owned by Maritech other than the Legacy Liabilities, the Bonding Agreement provides that, if we call any of these bonds to satisfy such liability and the amount of the bond payment is not sufficient to pay for such liability, Orinoco will pay us for the additional amount required. To the extent Orinoco is unable to cover any such deficiency or we become liable for a significant portion of the Legacy Liabilities, our financial condition and results of operations may be negatively affected.
We are exposed to significant credit risks.
We face credit risk associated with the significant amounts of accounts receivable we have with our customers in the energy industry. Many of our customers, particularly those associated with our onshore operations, are small- to medium-sized oil and gas operators that may be more susceptible to declines in oil and gas commodity prices or generally increased operating expenses than larger companies. Our ability to collect from our customers is impacted by the current volatile oil and natural gas price environment.
Our operating results and cash flows for certain of our subsidiaries are subject to foreign currency risk.
The operations of certain of our subsidiaries are exposed to fluctuations between the U.S. dollar and certain foreign currencies, particularly the euro, the British pound, the Mexican peso, and the Argentinian peso. Our plans to grow our international operations could cause this exposure from fluctuating currencies to increase. Historically, exchange rates of foreign currencies have fluctuated significantly compared to the U.S. dollar, and this exchange rate volatility is expected to continue. Significant fluctuations in foreign currencies against the U.S. dollar could adversely affect our balance sheet and results of operations.
If the remaining CCLP Preferred Units are not redeemed for cash, as intended, the result would be the issuance of additional CCLP common units in the future, resulting in potential dilution of our existing common unit ownership in CCLP.
CCLP's partnership agreement does not limit the number of additional common units that CCLP may issue at any time without the approval of its common unitholders. In addition, subject to the provisions of the CCLP Series A Preferred Unit Purchase Agreements (the “CCLP Unit Purchase Agreements”), CCLP may issue an unlimited number of partnership units that are senior to the common units in right of distribution, liquidation, or voting. On August 8, 2016, CCLP issued an aggregate of 4,374,454 of CCLP Preferred Units for a cash purchase price of $11.43 per CCLP Preferred Unit (the “Issue Price”), resulting in total net proceeds, after deducting certain offering expenses, of $49.8 million. We purchased 874,891 of the CCLP Preferred Units at the Issue Price, for a purchase price of $10.0 million. Additionally, on September 20, 2016, CCLP issued an aggregate of 2,624,672 of CCLP Preferred Units for a cash purchase price of $11.43 per Preferred Unit, resulting in total net proceeds, after deducting certain offering expenses, of $29.0 million.
Pursuant to the initial CCLP Unit Purchase Agreement dated August 8, 2016, our wholly owned CSI Compressco GP Inc. subsidiary (the general partner of CCLP), executed the Second Amended and Restated Agreement of Limited Partnership of the Partnership (the “Amended and Restated CCLP Partnership Agreement”) to, among other things, authorize and establish the rights and preferences of the CCLP Preferred Units. The CCLP Preferred Units are a new class of equity security that ranks senior to CCLP's common units with respect to distribution rights and rights upon liquidation. The holders of CCLP Preferred Units (each, a “CCLP Preferred Unitholder”) will receive quarterly distributions in kind in additional CCLP Preferred Units, equal to an annual rate of
16
11.00% of the Issue Price ($1.2573 per unit annualized), subject to certain adjustments, including adjustments relating to any future issuances of common units below a set price, and any quarterly distributions on our common units in excess of $0.3775 per common unit. In the event CCLP fails to pay in full any quarterly distribution in additional CCLP Preferred Units, then until such failure is cured, CCLP is prohibited from making any distributions on its common units. Beginning March 8, 2017 and on the first trading day of each calendar month thereafter for a total of thirty months (each, a “Conversion Date”), the CCLP Preferred Units convert into common units in an amount equal to, with respect to each CCLP Preferred Unitholder, the number of CCLP Preferred Units held by such CCLP Preferred Unitholder divided by the number of Conversion Dates remaining. On June 7, 2017, as permitted under the Amended and Restated CCLP Partnership Agreement, CCLP elected to defer the monthly conversion of CCLP Preferred Units for each of the Conversion Dates during the three month period beginning July 2017. As a result, no CCLP Preferred Units were converted into CCLP common units during the three month period ended September 30, 2017, and future monthly conversions were increased beginning in October 2017. During 2018, conversions of the CCLP Preferred Units resulted in the issuance of approximately 8.0 million CCLP common units. CCLP may, at its option, pay cash, or a combination of cash and common units, to the CCLP Preferred Unitholders instead of issuing common units on any Conversion Date, subject to certain restrictions as described in the Amended and Restated CCLP Partnership Agreement and the CCLP Credit Agreement.
On December 20, 2018, CCLP announced that, given the decline in its common unit price, CCLP was reducing its common unit distributions from $0.75 per unit per year (or $0.1875 per quarter) to $0.04 per unit per year (or $0.01 per quarter) for a period of up to four quarters, beginning with the February 2019 distribution. CCLP intends to use the approximately $34 million of savings from the reduced distribution to redeem the remaining CCLP Preferred Units for cash and avoid the dilution to its common unitholders that would occur if the CCLP Preferred Units were converted into common units at a low unit price. However, there is no guarantee that CCLP will be able to fully redeem the remaining CCLP Preferred Units for cash and that additional dilution will not occur.
If the remaining CCLP Preferred Units are not redeemed for cash, as intended, the result would be common units issued upon conversion thereof, resulting in dilution of our common unit ownership in CCLP.
We and CCLP are exposed to interest rate risks with regard to our respective credit facility indebtedness.
As of December 31, 2018, we had a total of $0.0 million outstanding under our ABL Credit Agreement and $182.5 million outstanding under our Term Credit Agreement. CCLP has a total of $0.0 million outstanding under the CCLP Credit Agreement. These credit facilities consist of floating rate loans that bear interest at an agreed upon percentage rate spread above London Interbank Offered Rate ("LIBOR") or an alternate base rate. Accordingly, whenever we or CCLP have amounts outstanding under these facilities, our and CCLP's cash flows and results of operations could be subject to interest rate risk exposure associated with the level of the variable rate debt balance outstanding. We currently are not a party to an interest rate swap contract or other derivative instrument designed to hedge our exposure to interest rate fluctuation risk.
Our ABL Credit Agreement is scheduled to mature on September 10, 2023. Our Term Loan Agreement is scheduled to mature on September 10, 2025. The CCLP Credit Agreement is scheduled to mature on June 29, 2023. CCLP's 7.25% Senior Notes, which mature August 15, 2022, and CCLP's 7.50% Senior Secured Notes, which mature April 1, 2025, bear interest at fixed interest rates. There can be no assurance that the financial market conditions or borrowing terms at the times these existing debt agreements are renegotiated will be as favorable as the current terms and interest rates.
Legal, Regulatory, and Political Risks
Our operations are subject to extensive and evolving U.S. and foreign federal, state and local laws and regulatory requirements that increase our operating costs and expose us to potential fines, penalties, and litigation.
Laws and regulations govern our operations, including those relating to corporate governance, employees, taxation, fees, importation and exportation restrictions, environmental affairs, health and safety, and the manufacture, storage, handling, transportation, use, and sale of chemical products. Certain foreign countries impose additional restrictions on our activities, such as currency restrictions and restrictions on various labor practices. These laws and regulations are becoming increasingly complex and stringent, and compliance is becoming increasingly expensive. Governmental authorities have the power to enforce compliance with these regulations, and violators are subject to civil and criminal penalties, including civil fines, and injunctions. Third parties may also have the right to pursue legal actions to enforce compliance with certain laws and regulations. It is
17
possible that increasingly strict environmental, health and safety laws, regulations, and enforcement policies could result in substantial costs and liabilities to us.
The EPA is studying the environmental impact of hydraulic fracturing, a process used by the U.S. oil and gas industry in the development of certain oil and gas reservoirs. Specifically, the EPA is reviewing the impact of hydraulic fracturing on drinking water resources. Certain environmental and other groups have suggested that additional federal, state, and local laws and regulations may be needed to more closely regulate the hydraulic fracturing process. Several states have adopted regulations that require operators to disclose the chemical constituents in hydraulic fracturing fluids. We cannot predict whether any federal, state or local laws or regulations will be enacted regarding hydraulic fracturing, and, if so, what actions any such laws or regulations would require or prohibit. If additional levels of regulation or permitting requirements were imposed on oil and gas operators through the adoption of new laws and regulations, the domestic demand for certain of our products and services could be decreased or subject to delays, particularly for our Water & Flowback Services, Compression, and Completion Fluids & Products Divisions.
We have operations that are either ongoing or scheduled to commence in the U.S. Gulf of Mexico. At this time, we cannot predict the full impact that other regulatory actions that may be mandated by the federal government may have on our operations or the operations of our customers. Other governmental or regulatory actions could further reduce our revenues and increase our operating costs, including the cost to insure offshore operations, resulting in reduced cash flows and profitability.
Our onshore and offshore operations expose us to risks such as the potential for harmful substances escaping into the environment and causing damages or injuries, which could be substantial. Although we maintain general liability and pollution liability insurance, these policies are subject to exceptions and coverage limits. We maintain limited environmental liability insurance covering named locations and environmental risks associated with contract services for oil and gas operations. We could be materially and adversely affected by an enforcement proceeding or a claim that is not covered or is only partially covered by insurance.
Because our business depends on the level of activity in the oil and natural gas industry, existing or future laws, regulations, treaties, or international agreements that impose additional restrictions on the industry may adversely affect our financial results. Regulators are becoming more focused on air emissions from oil and gas operations, including volatile organic compounds, hazardous air pollutants, and greenhouse gases ("GHGs"). In particular, the focus on GHGs and climate change, including incentives to conserve energy or use alternative energy sources, could have a negative impact on our financial results if such laws, regulations, treaties, or international agreements reduce the worldwide demand for oil and natural gas or otherwise result in reduced economic activity generally. In addition, such laws, regulations, treaties, or international agreements could result in increased compliance costs, capital spending requirements, or additional operating restrictions for us, which may have a negative impact on our financial results.
In addition to increasing our risk of environmental liability, the rigorous enforcement of environmental laws and regulations has accelerated the growth of some of the markets we serve.
Our expansion into foreign countries exposes us to complex regulations and may present us with new obstacles to growth.
We plan to continue to grow both in the United States and in foreign countries. We have established operations in, among other countries, Argentina, Brazil, Canada, Finland, Ghana, Mexico, Norway, Saudi Arabia, Sweden, and the United Kingdom. Foreign operations carry special risks. Our business in the countries in which we currently operate and those in which we may operate in the future could be limited or disrupted by:
• | restrictions on repatriating cash back to the United States; |
• | the impact of compliance with anti-corruption laws on our operations and competitive position in affected countries and the risk that actions taken by us or our agents may violate those laws; |
• | government controls and government actions, such as expropriation of assets and changes in legal and regulatory environments; |
• | import and export license requirements; |
• | political, social, or economic instability; |
• | trade restrictions; |
18
• | changes in tariffs and taxes; and |
• | our limited knowledge of these markets or our inability to protect our interests. |
We and our affiliates operate in countries where governmental corruption has been known to exist. While we and our subsidiaries are committed to conducting business in a legal and ethical manner, there is a risk of violating either the U.S. Foreign Corrupt Practices Act, the U.K Bribery Act, or laws or legislation promulgated pursuant to the 1997 OECD Convention on Combating Bribery of Foreign Public Officials in International Business Transactions or other applicable anti-corruption regulations that generally prohibit the making of improper payments to foreign officials for the purpose of obtaining or keeping business. Violation of these laws could result in monetary penalties against us or our subsidiaries and could damage our reputation and, therefore, our ability to do business.
Foreign governments and agencies often establish permit and regulatory standards different from those in the U.S. If we cannot obtain foreign regulatory approvals, or if we cannot obtain them in a timely manner, our growth and profitability from foreign operations could be adversely affected.
Our operations in Argentina expose us to the changing economic, legal, and political environments in that country, including the changing regulations over repatriation of cash generated from our operations in Argentina.
The current economic, legal, and political environment in Argentina and recent devaluation of the Argentinian peso have created increased economic instability for foreign investment in Argentina. The Argentinian government is currently attempting to address the current high rate of inflation and the continuing devaluations pressure. Fiscal and monetary expansion in Argentina has led to devaluations of the Argentinian peso, particularly in late 2013, early 2014, and late 2015. Additional currency adjustment may be necessary to help boost the current Argentina economy, but may be accompanied by fiscal and monetary tightening, including additional restrictions on the purchase of U.S. dollars in Argentina. On June 30, 2018, we determined the economy in Argentina to be highly inflationary. As a result of this determination and in accordance with U.S. GAAP, on July 1, 2018, the functional currency of our operations in Argentina was changed from the Argentine peso to the U.S. dollar. The remeasurement did not have a material impact on our consolidated financial position or results of operations.
As a result of our operations in Argentina, consolidated revenues and operating cash flow generated in Argentina have increased over the past three years. As of December 31, 2018, approximately $0.9 million of our consolidated cash balance is located in Argentina, and the process of repatriating this cash to the U.S. is subject to increasingly complex regulations. There can be no assurances that our growing Argentinian operations will not expose us to a loss of liquidity, foreign exchange losses, and other potential financial impacts.
Climate change legislation or regulations restricting emissions of GHGs could result in increased operating costs and reduced demand for the oil and natural gas our customers produce, while the physical effects of climate change could disrupt production and cause us to incur costs in preparing for or responding to those effects.
The EPA has determined that GHGs present an endangerment to public health and the environment, because emissions of such gases are, according to the EPA, contributing to warming of the earth’s atmosphere and other climatic changes. Based on these findings, the EPA has begun adopting and implementing regulations to restrict emissions of GHGs under existing provisions of the CAA. Such EPA rules regulate GHG emissions under the CAA and require a reduction in emissions of GHGs from motor vehicles and from certain large stationary sources. The EPA rules also require so-called “green” completions at hydraulically fractured natural gas wells beginning in 2015. In addition, the EPA also requires the annual reporting of GHG emissions from specified large GHG emission sources in the United States, including petroleum refineries, as well as from certain oil and gas production facilities.
The EPA has adopted regulations under the CAA to control emissions of hazardous air pollutants from reciprocal internal combustion engines and more recently the EPA adopted regulations that establish air emission controls for natural gas and natural gas liquids production, processing and transportation activities, including NSPS as well as emission standards to address hazardous air pollutants. Certain CCLP compressor packages are subject to these new requirements and additional control equipment and maintenance operations are required. While we do not believe that compliance with current regulatory requirements will have a material adverse effect on the business, additional regulations could impose new air permitting or pollution control requirements on our equipment that could require us to incur material costs.
19
In addition, in December 2015, over 190 countries, including the United States, reached an agreement to reduce global GHG emissions (the “Paris Agreement”). The Paris Agreement entered into force in November 2016 after more than 170 nations, including the United States, ratified or otherwise indicated their intent to be bound by the Paris Agreement. However, in June 2017, President Trump announced that the United States intends to withdraw from the Paris Agreement and to seek negotiations either to reenter the Paris Agreement on different terms or a separate agreement. In August 2017, the U.S. Department of State officially informed the United Nations of the United States’ intent to withdraw from the Paris Agreement. The Paris Agreement provides for a four-year exit process beginning when it took effect in November 2016, which would result in an effective exit date of November 2020. The United States’ adherence to the exit process and/or the terms on which the United States may re-enter the Paris Agreement or a separately negotiated agreement are unclear at this time. To the extent that the United States and other countries implement the Paris Agreement or impose other climate change regulations on the oil and natural gas industry, it could have an adverse effect on our business.
The adoption and implementation of any regulations imposing reporting obligations on, or limiting emissions of GHGs from, our facilities and operations could require us to incur costs. Further, U.S. Congress ("Congress") has considered and almost one-half of the states have adopted legislation that seeks to control or reduce emissions of GHGs from a wide range of sources. Any such legislation could adversely affect demand for the oil and natural gas our customers produce and, in turn, demand for our products and services. Finally, it should be noted that some scientists have concluded that increasing concentrations of GHGs in the Earth’s atmosphere may produce climate changes that have significant physical effects, such as increased frequency and severity of storms, floods, and other climatic events; if any such effects were to occur, they could have an adverse effect on our operations and cause us to incur costs in preparing for or responding to those effects.
Regulatory initiatives related to hydraulic fracturing in the countries where we and our customers operate could result in operating restrictions or delays in the completion of oil and gas wells that may reduce demand for our services.
Hydraulic fracturing is an important and common practice that is used to stimulate production of hydrocarbons from dense subsurface rock formations. The process involves the injection of water, sand or other proppants and chemical additives under pressure into targeted geological formations to fracture the surrounding rock and stimulate production.
Hydraulic fracturing typically is regulated by state oil and gas commissions or similar state agencies, but several federal agencies have asserted regulatory authority over certain aspects of the process. For example, the EPA asserted regulatory authority pursuant to the federal Safe Drinking Water Act Underground Injection Control program over hydraulic fracturing activities involving the use of diesel and issued guidance covering such activities; published final rules under the federal CAA in 2012 and published additional final regulations in June 2016 governing methane and volatile organic compound performance standards, including standards for the capture of air emissions released during for the oil and natural gas hydraulic fracturing industry; published in June 2016 an effluent limitations guidelines final rule prohibiting the discharge of waste water from shale natural-gas extraction operations before discharging to a treatment plant; and in 2014 published an Advance Notice of Proposed Rulemaking regarding Toxic Substances Control Act reporting of the chemical substances and mixtures used in hydraulic fracturing. Also, the U.S. Bureau of Land Management ("BLM") published a final rule in March 2015 that established new or more stringent standards for performing hydraulic fracturing on federal and Indian lands. However, in June 2016, a Wyoming federal judge struck down this final rule, finding that the BLM lacked authority to promulgate the rule, the BLM appealed the decision to the U.S. Circuit Court of Appeals for the Tenth Circuit in July 2016, the appellate court issued a ruling in September 2017 to vacate the Wyoming trial court decision and dismiss the lawsuit challenging the 2015 rule in response to the BLM’s issuance of a proposed rulemaking to rescind the 2015 rule and, in December 2017, the BLM published a final rule rescinding the March 2015 rule. In January 2018, litigation challenging the BLM’s rescission of the 2015 rule was brought in federal court, but, in June 2016, a Wyoming federal judge struck down this final rule, finding that the BLM lacked authority to promulgate the rule. That decision was appealed by the BLM to the U.S. Circuit Court of Appeals for the Tenth Circuit in 2016, but, in March 2017, the BLM filed a request with the Tenth Circuit to put the appeal on hold pending rescission of the 2015 final rule.
20
The Congress has from time to time considered legislation to provide for federal regulation of hydraulic fracturing and to require disclosure of the chemicals used in the hydraulic fracturing process. At the state level, some states, including Texas, Oklahoma and New Mexico, where the drilling program is expected to operate, have adopted, and other states are considering adopting legal requirements that could impose new or more stringent permitting, public disclosure, or well construction requirements on hydraulic fracturing activities. States could elect to prohibit high volume hydraulic fracturing altogether, following the approach taken by the State of New York in 2015. Local governments also may seek to adopt ordinances within their jurisdictions regulating the time, place and manner of drilling activities in general or hydraulic fracturing activities in particular. If new or more stringent federal, state, or local legal restrictions relating to the hydraulic fracturing process are adopted in areas where the drilling program operates, including, for example, on federal and American Indian lands, the partnership could incur potentially significant added costs to comply with such requirements, experience delays or curtailment in the pursuit of exploration, development or production activities, and perhaps even be precluded from drilling wells. In December 2016, the EPA released its final report on the potential impacts of hydraulic fracturing on drinking water resources, concluding that “water cycle” activities associated with hydraulic fracturing may impact drinking water resources under some circumstances. “Water cycle” describes the use of water in hydraulic fracturing, from water withdrawals to the making of hydraulic fracturing fluids, through the mixing and injection of hydraulic fracturing fluids in oil and natural gas production wells, to the collection and disposal or reuse of produced water.
Increased regulation and attention given to the hydraulic fracturing process could lead to greater opposition to oil and gas production activities using hydraulic fracturing techniques. Additional legislation or regulation could also lead to operational delays or increased operating costs for our customers in the production of oil and gas, including from the developing shale plays, or could make it more difficult to perform hydraulic fracturing. The adoption of any federal, state or local laws or the implementation of additional regulations regarding hydraulic fracturing could potentially cause a decrease in the completion of new oil and gas wells and an associated decrease in demand for our services and increased compliance costs and time, which could have a material adverse effect on our liquidity, consolidated results of operations, and consolidated financial condition.
Regulatory initiatives relating to the protection of endangered or threatened species in the United States, in other countries where we operate, could have an adverse impact on our and our customers’ ability to expand operations.
In the United States, the Endangered Species Act (the “ESA”) restricts activities that may affect endangered or threatened species or their habitats. Similar protections are offered to migratory birds under the Migratory Bird Treaty Act (the “MBTA”). To the extent species that are listed under the ESA or similar state laws, or are protected under the MBTA, live in the areas where we or our customers operate, both our and our customers’ abilities to conduct or expand operations and construct facilities could be limited or be forced to incur material additional costs.
The designation of previously unidentified endangered or threatened species could indirectly cause us to incur additional costs, cause our or our customers’ operations to become subject to operating restrictions or bans, and limit future development activity in affected areas. The designation of previously unprotected species as threatened or endangered in areas where we or our customers might conduct operations could result in limitations or prohibitions on our operations and could adversely impact our business.
Our proprietary rights may be violated or compromised, which could damage our operations.
We own numerous patents, patent applications, and unpatented trade secret technologies in the U.S. and certain foreign countries. There can be no assurance that the steps we have taken to protect our proprietary rights will be adequate to deter misappropriation of these rights. In addition, independent third parties may develop competitive or superior technologies.
Our operations and reputation may be impaired if our information technology systems fail to perform adequately or if we are the subject of a data breach or cyberattack.
Our information technology systems are critically important to operating our business efficiently. We rely on our information technology systems to manage our business data, communications, supply chain, customer invoicing, employee information, and other business processes. We outsource certain business process functions to third-party providers and similarly rely on these third parties to maintain and store confidential information on their systems. The failure of these information technology systems to perform as we anticipate could disrupt our
21
business and could result in transaction errors, processing inefficiencies, and the loss of sales and customers, causing our business and results of operations to suffer.
Although we allocate significant resources to protect our information technology systems, we have experienced varying degrees of cyber-incidents in the normal conduct of our business, including viruses, worms, other destructive software, process breakdowns, phishing and other malicious activities. Such breaches have in the past and could again in the future result in unauthorized access to information including customer, supplier, employee, or other company confidential data. We do not carry insurance against these risks, although we do invest in security technology, perform penetration tests from time to time, and design our business processes to attempt to mitigate the risk of such breaches. However, there can be no assurance that security breaches will not occur. Moreover, the development and maintenance of these measures requires continuous monitoring as technologies change and efforts to overcome security measures evolve. We have experienced, and expect to continue to experience, cyber security threats and incidents, none of which has been material to us to date. However, a successful breach or attack could have a material negative impact on our operations or business reputation and subject us to consequences such as litigation and direct costs associated with incident response.
Item 1B. Unresolved Staff Comments.
None.
Item 2. Properties.
Our properties consist primarily of our corporate headquarters facility, chemical plants, processing plants and distribution facilities. The following information describes facilities that we leased or owned as of December 31, 2018. We believe our facilities are adequate for our present needs.
Facilities
Completion Fluids & Products Division
Our Completion Fluids & Products Division facilities include seven chemical production plants located in the states of Arkansas, California, Louisiana, and West Virginia, and the country of Finland, having a total production capacity of more than 1.5 million equivalent liquid tons per year. The two California locations consist of 29 square miles of leased mineral acreage and solar evaporation ponds, and related owned production and storage facilities.
As an inducement to locate our calcium chloride production plant in Union County, Arkansas, we received certain ad valorem property tax incentives. Our facility is located just outside the city of El Dorado, Arkansas, on property that is leased from Union County, Arkansas. We have the option of purchasing the property at any time during the term of the lease for a nominal price. The term of the lease expires in 2035, at which time we also have the option to purchase the property at a nominal price. Under the terms of the lease, we are responsible for all costs incurred related to the facility.
In addition to the production facilities described above, the Completion Fluids & Products Division owns or leases multiple service center facilities in the United States and in other countries. The Completion Fluids & Products Division also leases several offices and numerous terminal locations in the United States and in other countries.
We lease approximately 30,000 gross acres of bromine-containing brine reserves in Magnolia, Arkansas, for possible future development and as a source of supply for our bromine and other raw materials.
Water & Flowback Services Division
The Water & Flowback Services Division conducts its operations through production testing service centers (most of which are leased) in the United States, located in Colorado, Louisiana, North Dakota, Oklahoma, Pennsylvania, Texas, West Virginia, and Wyoming. In addition, the Water & Flowback Services Division has leased facilities in Australia, Canada, Mexico, and certain countries in the United Kingdom, the Middle East and South America.
22
Compression Division
The Compression Division’s facilities include owned offices and fabrication facilities in Midland, Texas, consisting of an aggregate of approximately 177,000 square feet of structures that are located on 38.5 acres of land. In addition, the Division has several owned and leased service, fabrication, and sales facilities in Argentina, Canada, Mexico, and the United States. All obligations under the CCLP 7.50% Senior Secured Notes are secured by a first lien security interest in substantially all of CCLP’s assets, including the Midland, Texas facility.
For a profile of our compression fleet, see "Item 1. Business "Products and Services - Compression Division."
Corporate
Our headquarters is located in The Woodlands, Texas, in a 153,000 square foot office building, which is located on 2.6 acres of land, under a lease that expires in 2027. In addition, we own a 28,000 square foot technical facility in The Woodlands, Texas, to service our Completion Fluids & Products Division operations.
Item 3. Legal Proceedings.
We are named defendants in numerous lawsuits and respondents in certain governmental proceedings arising in the ordinary course of business. While the outcome of lawsuits or other proceedings against us cannot be predicted with certainty, management does not consider it reasonably possible that a loss resulting from such lawsuits or other proceedings in excess of any amounts accrued has been incurred that is expected to have a material adverse effect on our financial condition, results of operations, or liquidity.
Environmental Proceedings
One of our subsidiaries, TETRA Micronutrients, Inc. ("TMI"), previously owned and operated a production facility located in Fairbury, Nebraska. TMI is subject to an Administrative Order on Consent issued to American Microtrace, Inc. (n/k/a/ TETRA Micronutrients, Inc.) in the proceeding styled In the Matter of American Microtrace Corporation, EPA I.D. No. NED00610550, Respondent, Docket No. VII-98-H-0016, dated September 25, 1998 (the "Consent Order"), with regard to the Fairbury facility. TMI is liable for ongoing environmental monitoring at the Fairbury facility under the Consent Order; however, the current owner of the Fairbury facility is responsible for costs associated with the closure of that facility.
Item 4. Mine Safety Disclosures.
None.
PART II
Item 5. Market for Registrant’s Common Equity, Related Stockholder Matters, and Issuer Repurchases of Equity Securities.
Common Stock
Our common stock is traded on the New York Stock Exchange under the symbol “TTI.” As of March 1, 2019, there were approximately 338 holders of record of the common stock.
Market Price of Common Stock
The following graph compares the five-year cumulative total returns of our common stock, the Standard & Poor’s 500 Composite Stock Price Index (S&P 500), and the Philadelphia Oil Service Sector Index (PHLX Oil Service), assuming $100 invested in each stock or index on December 31, 2013, all dividends reinvested, and a fiscal year ending December 31. This information shall be deemed furnished, and not filed, in this Form 10-K and shall not be deemed incorporated by reference into any filing under the Securities Act of 1933 or the Securities Exchange Act of 1934 as a result of this furnishing, except to the extent we specifically incorporate it by reference.
23
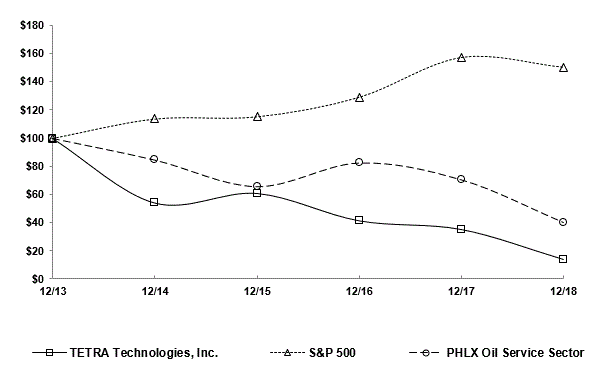
Purchases of Equity Securities by the Issuer and Affiliated Purchasers
In January 2004, our Board of Directors authorized the repurchase of up to $20 million of our common stock. Purchases may be made from time to time in open market transactions at prevailing market prices. The repurchase program may continue until the authorized limit is reached, at which time the Board of Directors may review the option of increasing the authorized limit. During 2004 through 2005, we repurchased 340,950 shares of our common stock pursuant to the repurchase program at a cost of approximately $5.7 million. There were no repurchases made during 2006 through 2018 pursuant to the repurchase program. Shares repurchased during the fourth quarter of 2018, other than pursuant to our repurchase program, are as follows:
Period | Total Number of Shares Purchased | Average Price Paid per Share | Total Number of Shares Purchased as Part of Publicly Announced Plans or Programs(1) | Maximum Number (or Approximate Dollar Value) of Shares that May Yet be Purchased Under the Publicly Announced Plans or Programs(1) | ||||||||||||
Oct 1 – Oct 31, 2018 | 149 | (2) | $ | 2.97 | — | $ | 14,327,000 | |||||||||
Nov 1 – Nov 30, 2018 | 5,172 | (2) | 3.22 | — | 14,327,000 | |||||||||||
Dec 1 – Dec 31, 2018 | 1,513 | (2) | 2.32 | — | 14,327,000 | |||||||||||
Total | 6,834 | — | $ | 14,327,000 | ||||||||||||
(1) | In January 2004, our Board of Directors authorized the repurchase of up to $20 million of our common stock. Purchases may be made from time to time in open market transactions at prevailing market prices. The repurchase program may continue until the authorized limit is reached, at which time the Board of Directors may review the option of increasing the authorized limit. |
(2) | Shares we received in connection with the exercise of certain employee stock options or the vesting of certain employee restricted stock awards. These shares were not acquired pursuant to the stock repurchase program. |
Item 6. Selected Financial Data.
The following tables set forth our selected consolidated financial data for the years ended December 31, 2018, 2017, 2016, 2015, and 2014. The selected consolidated financial data does not purport to be complete and should be read in conjunction with, and is qualified by, the more detailed information, including the Consolidated Financial Statements and related Notes and “Item 7. Management’s Discussion and Analysis of Financial Condition and Results of Operation” appearing elsewhere in this report. Please read “Item 1A. Risk Factors” for a discussion of the material uncertainties that might cause the selected consolidated financial data not to be indicative of our future financial condition or results of operations. During February 2018, our Water & Flowback Services Division acquired SwiftWater Energy Services, LLC ("SwiftWater"). In March 2018, we closed a series of related transactions
24
that resulted in the disposition of what we previously defined as our Offshore Division, consisting of our Offshore Services segment and Maritech segment. Accordingly, we have reflected the operations of our former Offshore Division as discontinued operations. During 2016, 2015, and 2014, we recorded significant impairments of long-lived assets and goodwill. During 2014, our Compression Division acquired Compressor Systems, Inc. ("CSI"), and financed a portion of the $825.0 million purchase price through the issuance of additional common units of CSI Compressco LP and through the issuance of long-term debt. These acquisitions, dispositions, and impairments significantly impact the comparison of our financial statements.
Year Ended December 31, | ||||||||||||||||||||
2018 | 2017 | 2016 | 2015 | 2014 | ||||||||||||||||
(In Thousands, Except Per Share Amounts) | ||||||||||||||||||||
Income Statement Data | ||||||||||||||||||||
Revenues | $ | 998,775 | $ | 723,098 | $ | 617,391 | $ | 1,010,641 | $ | 908,070 | ||||||||||
Gross profit | 162,298 | 108,390 | 60,839 | 181,157 | 175,220 | |||||||||||||||
General and administrative expense | 132,446 | 115,414 | 108,422 | 145,843 | 129,234 | |||||||||||||||
Goodwill impairment | — | — | 106,205 | 177,006 | 60,358 | |||||||||||||||
Interest expense | 72,066 | 58,027 | 59,984 | 55,134 | 35,676 | |||||||||||||||
Interest income | (1,120 | ) | (781 | ) | (1,370 | ) | (688 | ) | (757 | ) | ||||||||||
Other (income) expense, net | (4,668 | ) | (20,227 | ) | 10,818 | 1,596 | 11,174 | |||||||||||||
Loss before taxes and discontinued operations | (36,426 | ) | (44,043 | ) | (223,220 | ) | (197,734 | ) | (60,465 | ) | ||||||||||
Loss from discontinued operations, net of taxes | (41,515 | ) | (17,389 | ) | (14,017 | ) | (5,334 | ) | (73,045 | ) | ||||||||||
Net loss | (84,240 | ) | (62,183 | ) | (239,393 | ) | (209,467 | ) | (167,575 | ) | ||||||||||
Net loss attributable to TETRA stockholders | $ | (61,617 | ) | $ | (39,048 | ) | $ | (161,462 | ) | $ | (126,183 | ) | $ | (169,678 | ) | |||||
Loss per share, before discontinued operations attributable to TETRA stockholders | $ | (0.16 | ) | $ | (0.19 | ) | $ | (1.69 | ) | $ | (1.53 | ) | $ | (1.23 | ) | |||||
Average shares | 124,101 | 114,499 | 87,286 | 79,169 | 78,600 | |||||||||||||||
Loss per diluted share, before discontinued operations attributable to TETRA stockholders | $ | (0.16 | ) | $ | (0.19 | ) | $ | (1.69 | ) | $ | (1.53 | ) | $ | (1.23 | ) | |||||
Average diluted shares | 124,101 | (1), (2) | 114,499 | (1), (2) | 87,286 | (1), (2) | 79,169 | (1) | 78,600 | (1) | ||||||||||
(1) | For the years ended December 31, 2018, 2017, 2016, 2015, and 2014, the calculation of average diluted shares outstanding excludes the impact of all outstanding stock awards, as the inclusion of these shares would have been antidilutive due to the net loss recorded during the year. |
(2) | For the years ended December 31, 2018, 2017, 2016, the calculation of average diluted shares outstanding excludes the impact of warrants, as the inclusion of these shares would have been antidilutive due to the net loss recorded during the year. |
December 31, | ||||||||||||||||||||
2018 | 2017 | 2016 | 2015 | 2014 | ||||||||||||||||
(In Thousands) | ||||||||||||||||||||
Balance Sheet Data | ||||||||||||||||||||
Working capital | $ | 200,340 | $ | 164,640 | $ | 158,906 | $ | 168,783 | $ | 121,476 | ||||||||||
Total assets | 1,385,527 | 1,308,614 | 1,315,540 | 1,636,202 | 2,063,522 | |||||||||||||||
Long-term debt, net | 815,560 | 629,855 | 623,730 | 853,228 | 826,095 | |||||||||||||||
Other long-term liabilities | 27,775 | 29,621 | 30,481 | 21,459 | 23,563 | |||||||||||||||
CCLP Series A Preferred Units | 27,019 | 61,436 | 77,062 | — | — | |||||||||||||||
Warrants liability | 2,073 | 13,202 | 18,503 | — | — | |||||||||||||||
Total equity | 312,749 | 352,561 | 400,466 | 514,180 | 765,601 | |||||||||||||||
25
Item 7. Management’s Discussion and Analysis of Financial Condition and Results of Operation.
The following discussion is intended to analyze major elements of our consolidated financial statements and provide insight into important areas of management’s focus. This section should be read in conjunction with the Consolidated Financial Statements and the accompanying Notes included elsewhere in this Annual Report. Statements in the following discussion may include forward-looking statements. These forward-looking statements involve risks and uncertainties. See “Item 1A. Risk Factors,” for additional discussion of these factors and risks.
Following the acquisition of SwiftWater and the disposition of the Offshore Division during the three month period ended March 31, 2018, we reorganized our reporting segments and now manage our operations through three divisions: Completion Fluids & Products, Water & Flowback Services, and Compression. Our Completion Fluids & Products Division was previously reported as our Fluids Division, and included our water management services operations. Following the acquisition of SwiftWater in February 2018, our expanded water management operations are now included with our production testing operations as part of our Water & Flowback Services Division. The operations of our previous Offshore Division, consisting of our previous Offshore Services and Maritech segments, are now reported as discontinued operations following their disposal in March 2018.
Business Overview
Our consolidated results of operations for the year ended December 31, 2018 reflected the strong improvement in demand for the products and services of many of our businesses. A strong increase in demand for compression equipment and services resulted in our Compression Division contributing a $143.1 million increase to consolidated revenues compared to 2017 and generating improved gross profit compared to the prior year primarily as a result of improved pricing. Improved onshore domestic rig counts and completion activity during 2018, along with the acquisition of SwiftWater Energy Services, LLC ("SwiftWater") during February 2018, led to the growth of our Water & Flowback Services Division, which reported increased revenues of $131.5 million compared to 2017, along with significantly increased gross profit compared to the prior year. Our Completion Fluids & Products Division reported revenues during 2018 consistent with 2017 levels, despite benefiting in the prior year from a TETRA CS Neptune® completion fluids project, as international activity increased compared to the prior year. Future profitability levels of our Completion Fluids & Products Division will continue to be affected by the timing of future TETRA CS Neptune projects. On a consolidated basis, the increased revenues and gross profit during 2018 were partially offset by increased general and administrative cost levels, reflecting the overall growth in our operations, as well as by increased interest expense, primarily from increased borrowings by our CSI Compressco LP subsidiary ("CCLP"). The improved 2018 results occurred despite the impact of decreased oil prices during the fourth quarter of 2018. We are monitoring the 2019 spending plans of our customers as a result of the current reduced oil prices, and if oil prices decrease further during 2019, demand for many of our products and services could be negatively impacted. The consolidated net loss for 2018 includes the impact of the loss attributed to the March 2018 disposal of our former Offshore Division. That disposition increased our ability to focus on the growth of our core businesses.
Our consolidated cash provided by operating activities during the year ended December 31, 2018 decreased by $18.0 million, or 27.9%, compared to the prior year. This decrease in consolidated cash provided by operating activities was driven primarily by increased working capital, particularly accounts receivable and inventory, driven by the growth of certain of our businesses, and despite increased operating profitability. We and CCLP continue to maintain our efforts to manage working capital. Consolidated capital expenditures were $141.9 million during the year ended December 31, 2018, and included $104.0 million of capital expenditures by our Compression Division, compared to $51.9 million of consolidated capital expenditures during the prior year, which included $25.9 million by our Compression Division. Capital expenditure levels continue to be monitored carefully for each of our businesses, including CCLP, to insure that capital investments are only made for the most attractive growth opportunities. A majority of CCLP capital expenditures during 2018 were funded by additional long-term debt borrowings. As obtaining additional financing is challenging in the current debt and equity market environment, growth capital expenditures by CCLP during 2019 are expected to be primarily funded by available cash, expected cash provided by operating activities, and up to $15.0 million of new compression services equipment to be purchased by us, whereby we will lease the equipment to CCLP under a finance lease.
During 2018, we continued our focus on enhancing our debt structure, as well as the debt structure of CCLP. During the third quarter of 2018, we entered into a new credit agreement (the “Term Credit Agreement”) which provided an initial loan in the amount of $200 million and the availability of additional loans, subject to the terms of the Term Credit Agreement, up to an aggregate amount of $75 million for acquisitions. In addition, during the third quarter of 2018, we entered into an asset-based lending credit agreement (the “ABL Credit Agreement”)
26
that provides for a senior secured revolving credit facility of up to $100 million, subject to a borrowing base. As of December 31, 2018, subject to compliance with the covenants, borrowing base, and other provisions of the agreement that may limit borrowings, TETRA had an availability of $47.6 million under this agreement. Proceeds from both the Term Credit Agreement and ABL Credit Agreement were used to repay our 11% Senior Secured Note due November 5, 2022 (the "11% Senior Notes") and repay all outstanding borrowings and obligations under our then existing bank credit agreement. Both the note-purchase agreement related to the 11% Senior Note and the then existing bank credit agreement were terminated. To fund its growth, during the first half of 2018, CCLP enhanced its long-term debt structure through the issuance of the CCLP 7.50% Senior Secured First Lien Notes due 2025 (the "CCLP Senior Secured Notes"), repaying and terminating CCLP's prior credit facility (the "CCLP Prior Credit Facility"), and entering into a Loan and Security Agreement (the "CCLP Credit Agreement"), which provides up to $50.0 million to fund ongoing working capital and letter of credit needs and for general business purposes. As of December 31, 2018, and subject to compliance with the covenants, borrowing base, and other provisions of the agreements that may limit borrowings under the CCLP Credit Agreement, CCLP had availability of $27.1 million. As of March 1, 2019, no borrowings are outstanding under the ABL Credit Agreement or the CCLP Credit Agreement. Key objectives associated with our separate capital structures include the ongoing management of amounts outstanding and available under our ABL Credit Agreement and Term Credit Agreement, and the CCLP Credit Agreement.
We do not analyze or manage our capital structure on a consolidated basis, as there are no cross default provisions, cross collateralization provisions, or cross guarantees between CCLP's long-term debt and TETRA's long-term debt.
Approximately $633.0 million of our consolidated debt balance carrying value is owed by CCLP and serviced by CCLP's existing cash balances and cash provided by CCLP's operations (less its capital expenditures) and $343.2 million of which is secured by certain assets of CCLP. The following table provides condensed consolidating balance sheet information reflecting our net assets, excluding CCLP ("TETRA"), and CCLP's net assets that service our respective capital structures.
27
December 31, 2018 | |||||||||||||||
Condensed Consolidating Balance Sheet | TETRA | CCLP | Eliminations | Consolidated | |||||||||||
(In Thousands) | |||||||||||||||
Cash, excluding restricted cash | $ | 24,180 | $ | 15,858 | $ | — | $ | 40,038 | |||||||
Affiliate receivables | 3,517 | — | (3,517 | ) | — | ||||||||||
Assets of discontinued operations | 1,354 | — | 1,354 | ||||||||||||
Other current assets | 223,410 | 135,889 | 359,299 | ||||||||||||
Property, plant and equipment, net | 212,612 | 641,319 | — | 853,931 | |||||||||||
Other assets, including investment in CCLP | 29,162 | 33,678 | 68,065 | 130,905 | |||||||||||
Total assets | $ | 494,235 | $ | 826,744 | $ | 64,548 | $ | 1,385,527 | |||||||
Affiliate payables | $ | — | $ | 3,517 | $ | (3,517 | ) | $ | — | ||||||
Current portion of long-term debt | — | — | — | — | |||||||||||
Other current liabilities | 105,370 | 90,836 | — | 196,206 | |||||||||||
Long-term debt, net | 182,547 | 633,013 | — | 815,560 | |||||||||||
CCLP Series A Preferred Units | — | 30,900 | (3,881 | ) | 27,019 | ||||||||||
Warrant liability | 2,073 | — | — | 2,073 | |||||||||||
Other non-current liabilities | 26,700 | 1,075 | 27,775 | ||||||||||||
Total equity | 173,400 | 67,403 | 71,946 | 312,749 | |||||||||||
Total liabilities and equity | $ | 494,235 | $ | 826,744 | $ | 64,548 | $ | 1,385,527 | |||||||
TETRA’s debt is serviced by existing cash balances and cash provided from operating activities (excluding CCLP) and the distributions we receive from CCLP in excess of our cash capital expenditures (excluding CCLP). During the year ended December 31, 2018, consolidated cash provided from operating activities was $46.6 million, which included approximately $30.1 million generated by CCLP. During 2018, we received $12.1 million from CCLP as our share of CCLP distributions. In December 2018,CCLP announced a significant reduction, for a period of up to four quarters, in the level of cash distributions to its common unitholders, including us, reducing the distribution to $0.04 per common unit per year. CCLP intends to use the cash savings from the reduced distributions to redeem the remaining CCLP Preferred Units outstanding. Despite this reduced level of cash distributions from CCLP to us, we believe that current increased levels of operating activity will allow us and CCLP to continue to meet our respective financial obligations and fund our respective future growth plans as needed.
Future demand for our products and services depends primarily on activity in the oil and natural gas exploration and production industry, particularly including the level of expenditures for the exploration and production of oil and natural gas reserves, and natural gas compression infrastructure. The future growth of certain of our businesses is dependent on improved future pricing levels of oil and natural gas. When oil and natural gas prices increase, we believe that there are growth opportunities for our products and services, supported primarily by:
• | increases in technologically driven deepwater oil and gas well completions in the Gulf of Mexico; |
• | applications for many of our products and services in the continuing exploitation and development of shale reservoirs; and |
• | increases in selected international oil and gas exploration and development activities. |
28
Our Completion Fluids & Products Division generates revenues and cash flows by manufacturing and marketing clear brine fluids ("CBFs"), additives, and associated products and services to the oil and gas industry for use in well drilling, completion, and workover operations in the United States and in certain countries in Latin America, Europe, Asia, the Middle East, and Africa. The Completion Fluids & Products Division also markets liquid and dry calcium chloride products manufactured at its production facilities or purchased from third-party suppliers to a variety of markets outside the energy industry. Completion Fluids & Products Division revenues decreased $0.4 million during 2018 compared to 2017, primarily due to product and services sales revenues during 2017 associated with a TETRA CS Neptune completion fluid project, and despite improving demand for CBFs and associated product sales in the U.S. Gulf of Mexico during 2018. While offshore rig counts remain low, we have seen an increase in demand from our customers. In addition, international offshore fluid sales and onshore manufactured product sales increased compared to the prior year.
Our Water & Flowback Services Division provides oil and gas operators with comprehensive water management services as well as frac flowback, production well testing, offshore rig cooling, and other associated services in many of the major oil and gas producing regions in the United States, Mexico, and Canada, as well as in oil and gas basins in certain regions in South America, Africa, Europe, the Middle East, and Australia. The Water & Flowback Services Division’s operations are generally driven by the demand for natural gas and oil and the resulting levels of drilling and completion activities in the markets that the Water & Flowback Services Division serves. Many of the markets served by the Water & Flowback Services Division are characterized by high lifting costs for oil and natural gas, such as in certain unconventional shale gas and oil reservoirs located in certain basins in the U.S., Canada, and certain other international markets. North American onshore rig counts increased during 2018 compared to the prior year. The Water & Flowback Services Division’s revenues increased by $131.5 million in 2018 compared to 2017, due to increased activity in certain domestic and international markets and due to the impact of acquired water management services businesses, particularly from the February 28, 2018 acquisition of SwiftWater. Onshore U.S. activity levels in certain markets have reflected increased rig counts compared to the prior year, although customer demand for services during the fourth quarter of 2018 has been reduced due to the recent decline in oil prices.
Our Compression Division, through CCLP, generates revenues and cash flows by providing compression services and equipment for natural gas and oil production, gathering, transportation, processing, and storage. The Compression Division's equipment sales business includes the fabrication and sale of standard compressor packages and custom-designed compressor packages designed and fabricated at the Compression Division's facilities. The Compression Division's aftermarket business provides a wide range of services including operation, maintenance, overhaul and reconfiguration services as well as the sale of compressor package parts and components manufactured by third-party suppliers. The Compression Division provides its services and equipment to a broad base of natural gas and oil exploration and production, midstream, transmission, and storage companies operating throughout many of the onshore producing regions of the United States as well as in a number of foreign countries, including Mexico, Canada and Argentina. Compression Division revenues increased $143.1 million in 2018 as compared to 2017, primarily due to a significant increase in revenues from sales of compressor equipment, as well as increased compression and related services revenues. The overall utilization of the Compression Division's compression fleet has improved sequentially for the past two years, reflecting increasing demand for compression services.
Critical Accounting Policies and Estimates
This discussion and analysis of our financial condition and results of operations is based upon our consolidated financial statements. We prepared these financial statements in conformity with U.S. GAAP. In preparing our consolidated financial statements, we make assumptions, estimates, and judgments that affect the amounts reported. We base these estimates on historical experience, available information, and various other assumptions that we believe are reasonable. We periodically evaluate these estimates and judgments, including those related to potential impairments of long-lived assets (including goodwill), the fair value of financial instruments (our outstanding stock warrants (the "Warrants") and CCLP Preferred Units), the collectability of accounts receivable, the current cost of future asset retirement obligations, the allocation of acquisition purchase price consideration and the fair value of contingent acquisition consideration. Note B – "Summary of Significant Accounting Policies” to the Consolidated Financial Statements contains the accounting policies governing each of these matters. The fair values of portions of our total assets and liabilities are measured using significant unobservable inputs. The combination of these factors forms the basis for our judgments made about the carrying values of assets and liabilities that are not readily apparent from other sources. These judgments and estimates may change as new events occur, as new information is acquired, and as changes in our operating environments
29
are encountered. Actual results are likely to differ from our current estimates, and those differences may be material. The following critical accounting policies reflect the most significant judgments and estimates used in the preparation of our financial statements.
Fair Value of Financial Instruments
During 2016, we issued the Warrants and CCLP issued the CCLP Preferred Units as part of equity offerings to generate proceeds that were used to reduce long-term debt outstanding. The Warrants are accounted for as a derivative liability in accordance with Financial Accounting Standards Board ("FASB") Accounting Standards Codification ("ASC") 815 "Derivatives and Hedging" and therefore they are classified as a long-term liability on our consolidated balance sheet at their fair value. The CCLP Preferred Units may be settled using a variable number of common units, and therefore the fair value of the CCLP Preferred Units is classified as a long-term liability on our consolidated balance sheet in accordance with ASC 480 "Distinguishing Liabilities and Equity." Changes in fair value of these financial instruments during each quarterly period are charged to earnings in the accompanying consolidated statements of operations. The Warrants are valued using the Black Scholes option valuation model that includes estimates of the volatility of the Warrants based on their trading prices. The CCLP Preferred Units are valued using market information related to debt instruments, the trading price of the CCLP common units, and lattice modeling techniques. The fair values of the Warrants and the CCLP Preferred Units will generally increase or decrease with the trading price and volatility of our common stock and the CCLP common units, respectively. Increases (or decreases) in the fair value of these financial instruments will increase (decrease) the associated liability, resulting in future adjustments to earnings for the associated valuation losses (gains), and resulting in future volatility of our earnings during the period the financial instruments are outstanding. These estimates used in the calculated fair values of these financial instruments may not be accurate. As of December 31, 2018, the estimated fair value of the Warrants was $2.1 million, and the $11.1 million change in fair value during the year was credited to earnings during the period. As of December 31, 2018, the estimated fair value of the CCLP Preferred Units was $27.0 million, and the $0.7 million change in fair value during the year was credited to earnings during the period.
Acquisition Purchase Price Allocations
We account for acquisitions of businesses using the purchase method, which requires the allocation of the purchase price consideration based on the fair values of the assets and liabilities acquired. We estimate the fair values of the assets and liabilities acquired using accepted valuation methods, and, in many cases, such estimates are based on our judgments as to the future operating cash flows expected to be generated from the acquired assets throughout their estimated useful lives. Following the February 28, 2018 acquisition of SwiftWater and the December 6, 2018 acquisition of JRGO, we have accounted for the various assets (including intangible assets) and liabilities acquired based on our estimate of their fair values. Goodwill represents the excess of acquisition purchase price consideration over the estimated fair values of the net assets acquired. Our estimates and judgments of the fair value of acquired businesses are imprecise, and the use of inaccurate fair value estimates could result in the improper allocation of the acquisition purchase price consideration to acquired assets and liabilities, which could result in asset impairments, the recording of previously unrecorded liabilities, and other financial statement adjustments. The difficulty in estimating the fair values of acquired assets and liabilities is increased during periods of economic uncertainty.
Contingent Consideration
As part of the purchase of SwiftWater we may be required to pay additional contingent consideration, in an aggregate amount of up to $15.0 million, calculated on EBITDA and revenue of the combined water management business of SwiftWater and our pre-existing operations in the Permian Basin in respect of the period from January 1, 2018 through December 31, 2019. The contingent consideration may be paid in cash or shares of our common stock, at our election. The fair value of the contingent consideration is based on a probability simulation utilizing forecasted revenues and EBITDA of the water management business of SwiftWater and all of our pre-existing operations in the Permian Basin (a Level 3 fair value measurement). During the period from the closing date to December 31, 2018, the estimated fair value for the liabilities associated with the contingent purchase price consideration increased to $11.0 million, resulting in $3.4 million being charged to other (income) expense, net, during the year ended December 31, 2018. As part of the purchase of JRGO, we may be required to pay additional contingent consideration, in an aggregate amount of up to $1.5 million, during 2019 based on JRGO's performance during the fourth quarter of 2018.
30
Impairment of Long-Lived Assets
The determination of impairment of long-lived assets, including identified intangible assets, is conducted periodically whenever indicators of impairment are present. If such indicators are present, the determination of the amount of impairment is based on our judgments as to the future operating cash flows to be generated from these assets throughout their estimated useful lives. If an impairment of a long-lived asset is warranted, we estimate the fair value of the asset based on a present value of these cash flows or the value that could be realized from disposing of the asset in a transaction between market participants. The oil and gas industry is cyclical, and our estimates of the amount of future cash flows, the period over which these estimated future cash flows will be generated, as well as the fair value of an impaired asset, are imprecise. Our failure to accurately estimate these future operating cash flows or fair values could result in certain long-lived assets being overstated, which could result in impairment charges in periods subsequent to the time in which the impairment indicators were first present. Alternatively, if our estimates of future operating cash flows or fair values are understated, impairments might be recognized unnecessarily or in excess of the appropriate amounts. During 2018, primarily as a result of the decreased expected future cash flows from a specific customer contract, we recorded consolidated impairments and other charges of $3.6 million. During periods of economic uncertainty, the likelihood of additional material impairments of long-lived assets is higher due to the possibility of decreased demand for our products and services.
Impairment of Goodwill
The impairment of goodwill is also assessed whenever impairment indicators are present, but not less than once annually at a reporting unit level. We perform the annual test of goodwill impairment as of the last day of the fourth quarter of each year. As of December 31, 2018, consolidated goodwill consists of $25.9 million attributed to our Water Management reporting unit, included as part of our Water & Flowback Services Division. The first step of the impairment test is to compare the estimated fair value with the recorded net book value (including goodwill) of our reporting units. If the estimated fair value is higher than the recorded net book value, no impairment is deemed to exist and no further testing is required. If, however, the carrying amount of the reporting unit exceeds its estimated fair value, an impairment loss is calculated by comparing the carrying amount of the reporting unit’s goodwill to our estimated implied fair value of that goodwill. Our estimates of reporting unit fair value, when required, are based on a combination of an income and market approach. These estimates are imprecise and are subject to our estimates of the future cash flows of each business and our judgment as to how these estimated cash flows translate into each business’ estimated fair value. These estimates and judgments are affected by numerous factors, including the general economic environment at the time of our assessment, which affects our overall market capitalization. If we overestimate the fair value of our reporting units, the balance of our goodwill asset may be overstated. Alternatively, if our estimated reporting unit fair values are understated, impairments might be recognized unnecessarily or in excess of the appropriate amounts.
During the fourth quarter of 2018, global oil prices decreased significantly. An accompanying decrease in our common stock price during the fourth quarter of 2018 has also indicated an overall reduction in our market capitalization. As part of our internal annual business outlook for each of our reporting units that we performed during the fourth quarter, we considered changes in the global economic environment that affected our stock price and market capitalization.
As part of the first step of goodwill impairment testing for our Water Management reporting unit (part of our Water & Flowback Services Division), the only reporting unit with goodwill as of December 31, 2018, we updated our assessment of the future cash flows, applying expected long-term growth rates, discount rates, and terminal values that we consider reasonable for the reporting unit. We calculated a present value of the cash flows for the Water Management reporting unit to arrive at an estimate of fair value using a combination of the income approach and market approach. Based on these assumptions, we determined that the fair value of the Water Management reporting unit exceeded its carrying value, which includes approximately $25.9 million of goodwill, by approximately 30%. Specific uncertainties affecting the estimated fair value of our Water Management reporting unit includes the impact of competition, prices of oil and natural gas, and future overall activity levels in the regions in which we operate, the activity levels of our significant customers, and other factors affecting the rate of future growth of this reporting unit. These factors will continue to be reviewed and assessed going forward. Negative developments with regard to these factors could have a further negative effect on the fair value of the Water Management reporting unit.
31
Throughout 2016, lower oil and natural gas commodity prices resulted in a decreased demand for many of the products and services of each of our reporting units. Specifically to our Compression Division, which is one reporting unit, demand for low-horsepower wellhead compression services and for sales of compressor equipment decreased significantly. During the first quarter of 2016, as the market for services of CCLP continued to decline, the market capitalization of CCLP dropped significantly from December 31, 2015. Accordingly, the fair value, including the market capitalization for CCLP, for the Compression reporting unit was less than its carrying value as of March 31, 2016.
Our Water & Flowback Services Division has two reporting units; Production Testing and Water Management. For our Production Testing reporting unit, market activity continued to decrease during the first quarter of 2016. As a result, the fair value of the Production Testing reporting unit was also less than its carrying value as of March 31, 2016.
After making the hypothetical purchase price adjustments as part of the second step of the goodwill impairment test as of March 31, 2016, we concluded that a full impairment of $92.3 million of remaining recorded goodwill for our Compression reporting unit and a full impairment of $13.9 million of the remaining recorded goodwill for our Production Testing reporting unit (included in our Water & Flowback Services Division) was required as of March 31, 2016.
Income Taxes
We are a U.S. company and are subject to income taxes in the U.S. We also operate in a number of countries under many legal forms. Our operations are taxed on various bases, including actual income before taxes, deemed profits (which are generally determined using a percentage of revenue rather than profits) and withholding taxes based on revenue. Determination of taxable income in any jurisdiction requires the interpretation of the applicable tax laws and regulations and the use of estimates and assumptions regarding significant future events such as the amount, timing, and character of deductions, permissible revenue recognition methods under the applicable tax laws, and the sources and character of income and tax credits.
We provide for income taxes by taking into account the differences between the financial statement treatment and tax treatment of certain transactions. Deferred tax assets and liabilities are recognized for the anticipated future tax consequences attributable to differences between the financial statement carrying amounts of existing assets and liabilities and their respective tax basis amounts. Deferred tax assets and liabilities are measured using enacted tax rates expected to apply to taxable income in the years in which those temporary differences are expected to be recovered or settled. The effect of a change in tax rates is recognized as income or expense in the period that includes the enactment date. Management must make certain assumptions regarding whether tax differences are permanent or temporary and must estimate the timing of their reversal, and whether taxable operating income in future periods will be sufficient to fully recognize any gross deferred tax assets.
We establish valuation allowances to reduce deferred tax assets when it is more likely than not that some portion or all of the deferred tax assets will not be realized. In determining the need for valuation allowances, management has considered and made judgments and estimates regarding estimated future taxable income and ongoing prudent and feasible tax planning strategies. Changes in state, federal, and foreign tax laws, as well as changes in our financial condition, could affect these estimates.
In addition, we maintain liabilities for estimated tax exposures and uncertainties in jurisdictions where we operate. The annual tax provision includes the impact of income tax provisions and benefits for changes to liabilities that we consider appropriate, as well as related interest and penalties. We consider many factors when evaluating and estimating income tax uncertainties. These factors include an evaluation of the technical merits of the tax position as well as the amounts and probabilities of the outcomes that could be realized upon ultimate settlement. The actual resolution of those uncertainties will inevitably differ from those estimates, and such differences may be material to the financial statements. We believe that an appropriate liability has been established for the estimated exposures associated with these uncertainties under the guidance in ASC 740 “Income Taxes.” However, the actual resolution of those uncertainties will inevitably differ from those estimates, and such differences may be material to our consolidated financial statements.
32
Results of Operations
The following data should be read in conjunction with the Consolidated Financial Statements and the associated Notes contained elsewhere in this report.
2018 Compared to 2017
Consolidated Comparisons
Year Ended December 31, | Period to Period Change | ||||||||||||||
2018 | 2017 | 2018 vs. 2017 | % Change | ||||||||||||
(In Thousands, Except Percentages) | |||||||||||||||
Revenues | $ | 998,775 | $ | 723,098 | $ | 275,677 | 38.1 | % | |||||||
Gross profit | 162,298 | 108,390 | 53,908 | 49.7 | % | ||||||||||
Gross profit as a percentage of revenue | 16.2 | % | 15.0 | % | |||||||||||
General and administrative expense | 132,446 | 115,414 | 17,032 | 14.8 | % | ||||||||||
General and administrative expense as a percentage of revenue | 13.3 | % | 16.0 | % | |||||||||||
Interest expense, net | 70,946 | 57,246 | 13,700 | 23.9 | % | ||||||||||
Gain on sale of assets | (729 | ) | — | (729 | ) | ||||||||||
Warrants fair value adjustment | (11,129 | ) | (5,301 | ) | (5,828 | ) | |||||||||
CCLP Series A Preferred fair value adjustment | (733 | ) | (2,975 | ) | 2,242 | ||||||||||
Litigation arbitration award income | — | (12,816 | ) | 12,816 | |||||||||||
Other (income) expense, net | 7,923 | 865 | 7,058 | ||||||||||||
Loss before taxes and discontinued operations | (36,426 | ) | (44,043 | ) | 7,617 | ||||||||||
Loss before taxes and discontinued operations as a percentage of revenue | (3.6 | )% | (6.1 | )% | |||||||||||
Provision for income taxes | 6,299 | 751 | 5,548 | ||||||||||||
Loss before discontinued operations | (42,725 | ) | (44,794 | ) | 2,069 | ||||||||||
Loss from discontinued operations (including 2018 loss on disposal of $33.8 million), net of taxes | (41,515 | ) | (17,389 | ) | (24,126 | ) | |||||||||
Net loss | (84,240 | ) | (62,183 | ) | (22,057 | ) | |||||||||
Loss attributable to noncontrolling interest | 22,623 | 23,135 | (512 | ) | |||||||||||
Net loss attributable to TETRA stockholders | $ | (61,617 | ) | $ | (39,048 | ) | $ | (22,569 | ) | ||||||
Consolidated revenues for 2018 increased compared to the prior year due to increased revenues in our Compression and Water & Flowback Services Divisions. Compression Division revenues increased by $143.1 million driven by increased new compressor equipment sales activity and improved pricing. Our Water & Flowback Services Division revenues increased by $131.5 million due to increased activity in certain domestic and international markets and the February 28, 2018 acquisition of SwiftWater. See Divisional Comparisons section below for additional discussion.
Consolidated gross profit increased during 2018 compared to the prior year due to the increased revenues of our Water & Flowback Services and Compression Divisions. The increased gross profit from these divisions more than offset the lower gross profit of our Completion Fluids & Products Division, which resulted from the mix of products and services compared to the prior year. Despite the improvement in activity levels of certain of our businesses, offshore activity levels remain flat and the impact of pricing pressures continues to challenge profitability in certain onshore markets. Operating expense levels reflect the increase in consolidated revenues, although we remain aggressive in managing operating costs and minimizing increased headcount.
Consolidated general and administrative expenses increased during 2018 compared to the prior year, primarily due to $10.1 million of increased salary related expenses, $3.3 million of insurance and other general expenses, $2.7 million of increased professional services fees, and $0.9 million of increased bad debt and marketing expenses. Due to the increased consolidated revenues discussed above, general and administrative expense as a percentage of revenues decreased compared to the prior year.
33
Consolidated interest expense, net, increased in 2018 compared to the prior year primarily due to increased Compression Division interest expense. Compression Division interest expense increased due to higher CCLP outstanding debt balances and a higher interest rate on the CCLP Senior Secured Notes, a portion of the proceeds of which were used to repay the balance outstanding under the CCLP Prior Credit Facility. Increased interest expense is expected to continue compared to prior years. Corporate interest expense also increased due to the Term Credit Agreement and ABL Credit Agreement, which were entered into in September 2018 and replaced the 11% Senior Note and the previous bank credit agreement. Interest expense during 2018 and 2017 includes $4.3 million and $4.7 million, respectively, of finance cost amortization.
The Warrants are accounted for as a derivative liability in accordance with ASC 815 and therefore they are classified as a long-term liability on our consolidated balance sheet at their fair value. Increases (or decreases) in the fair value of the Warrants are generally associated with increases (or decreases) in the trading price of our common stock, resulting in adjustments to earnings for the associated valuation losses (gains), and resulting in future volatility of our earnings during the period the Warrants are outstanding.
The CCLP Preferred Units may be settled using a variable number of CCLP common units, and therefore the fair value of the CCLP Preferred Units is classified as a long-term liability on our consolidated balance sheet in accordance with ASC 480. Because the CCLP Preferred Units are convertible into CCLP common units at the option of the holder, the fair value of the CCLP Preferred Units will generally increase or decrease with the trading price of the CCLP common units, and this increase (decrease) in CCLP Preferred Unit fair value will be charged (credited) to earnings, as appropriate, resulting in future volatility of our earnings during the period the CCLP Preferred Units are outstanding.
In January 2017, our Completion Fluids & Products Division collected $12.8 million from a successful legal arbitration award, resulting in a credit to earnings. See Commitments and Contingencies - Litigation section below for additional discussion.
Consolidated other (income) expense, net, was $7.9 million of expense during 2018 compared to $0.9 million of expense during the prior year, primarily due to $3.4 million of increased expense associated with the remeasurement of the contingent purchase price consideration for SwiftWater and $3.5 million of increased expense related to the unamortized deferred financing costs charged to earnings as a result of the termination of the CCLP Prior Credit Facility. These increased expenses were partially offset by increased foreign currency gains.
Our consolidated provisions for income taxes during 2018 was primarily attributable to taxes in certain foreign jurisdictions and Texas gross margin taxes. Our consolidated effective tax rate for the year ended December 31, 2018 of negative 17.3% was primarily the result of losses generated in entities for which no related tax benefit has been recorded. The losses generated by these entities do not result in tax benefits due to offsetting valuation allowances being recorded against the related net deferred tax assets. We establish a valuation allowance to reduce the deferred tax assets when it is more likely than not that some portion or all of the deferred tax assets will not be realized. Included in our deferred tax assets are net operating loss carryforwards and tax credits that are available to offset future income tax liabilities in the U.S. as well as in certain foreign jurisdictions.
We applied the guidance in Staff Accounting Bulletin 118 (“SAB 118”) when accounting for the enactment-date effects of the Act. During the 4th quarter of 2017, we recorded our best estimate of the impact of the Act in our year-end income tax provision in accordance with our understanding of the Act and guidance available and as a result recorded income tax expense of $54.1 million. This income tax expense was fully offset by a decrease in the valuation allowance previously recorded on our deferred tax assets. As such, the Act resulted in no net tax expense. As of December 31, 2018, we completed our accounting analysis for all of the enactment-date income tax effects and reduced our December 31, 2017 provisional amount by $2.5 million. The decrease in the income tax expense was fully offset by an increase in the valuation allowance. As such, the Act resulted in no net tax expense.
In January 2018, the FASB released guidance on the accounting for tax on the global intangible low-taxed income ("GILTI") provisions of the Act. The GILTI provisions impose a tax on foreign income in excess of a deemed return on tangible assets of foreign corporations. The guidance indicates that either accounting for deferred taxes related to GILTI inclusions or to treat any taxes on GILTI inclusions as period costs are both acceptable methods subject to an accounting policy election. As of December 31, 2017, we had not yet completed our assessment or elected an accounting policy to either recognize deferred taxes for basis differences expected to reverse as GILTI
34
or to record GILTI as period costs if and when incurred. After further consideration in 2018, we have elected to account for GILTI as a period cost in the year the tax is incurred. See "Note H - Income Taxes" contained in the Notes to Consolidated Financial Statements for the effect on our 2018 tax provision.
Divisional Comparisons
Completion Fluids & Products Division
Year Ended December 31, | Period to Period Change | ||||||||||||||
2018 | 2017 | 2018 vs. 2017 | % Change | ||||||||||||
(In Thousands, Except Percentages) | |||||||||||||||
Revenues | $ | 257,408 | $ | 257,851 | $ | (443 | ) | (0.2 | )% | ||||||
Gross profit | 48,675 | 71,022 | (22,347 | ) | (31.5 | )% | |||||||||
Gross profit as a percentage of revenue | 18.9 | % | 27.5 | % | |||||||||||
General and administrative expense | 18,830 | 19,661 | (831 | ) | (4.2 | )% | |||||||||
General and administrative expense as a percentage of revenue | 7.3 | % | 7.6 | % | |||||||||||
Interest (income) expense, net | (599 | ) | (53 | ) | (546 | ) | |||||||||
Litigation arbitration award income | — | (12,816 | ) | 12,816 | |||||||||||
Other (income) expense, net | (179 | ) | 339 | (518 | ) | ||||||||||
Income before taxes | $ | 30,623 | $ | 63,891 | $ | (33,268 | ) | (52.1 | )% | ||||||
Income before taxes as a percentage of revenue | 11.9 | % | 24.8 | % | |||||||||||
The decrease in Completion Fluids & Products Division revenues during 2018 compared to the prior year was due to $16.7 million of decreased service revenues, largely due to a reduction in completion services activity associated with a 2017 TETRA CS Neptune completion fluid project. This decrease was offset by $16.3 million of increased product sales revenue, attributed to increased manufactured products sales and international CBF product sales, partially offset by reduced CBF product sales revenues in the U.S. Gulf of Mexico.
Completion Fluids & Products Division gross profit during 2018 decreased compared to the prior year primarily due to the profitability associated with the mix of CBF products and services, particularly for offshore completion fluids products. Completion Fluids & Products Division profitability in future periods will continue to be affected by the mix of its products and services, including the timing of TETRA CS Neptune completion fluid projects.
The Completion Fluids & Products Division reported a decrease in pretax earnings during 2018 compared to the prior year primarily due to the reduction in gross profit discussed above and due to the collection of a successful legal arbitration award of $12.8 million during January 2017 that was credited to earnings. Completion Fluids & Products Division administrative cost levels decreased compared to the prior year, primarily due to $2.0 million of decreased salary and employee related expenses and $0.2 million of decreased insurance and other general expenses. These decreases were partially offset by $1.1 million of increased legal and professional fees and $0.3 million of increased bad debt expense. The Completion Fluids & Products Division continues to review opportunities to further reduce its administrative costs. The Division reported other income, net, during 2018 compared to other expense, net, during the prior year period primarily due to contract income recorded during the current year.
35
Water & Flowback Services Division
Year Ended December 31, | Period to Period Change | ||||||||||||||
2018 | 2017 | 2018 vs. 2017 | % Change | ||||||||||||
(In Thousands, Except Percentages) | |||||||||||||||
Revenues | $ | 303,072 | $ | 171,621 | $ | 131,451 | 76.6 | % | |||||||
Gross profit | 55,247 | 2,319 | 52,928 | 2,282.4 | % | ||||||||||
Gross profit as a percentage of revenue | 18.2 | % | 1.4 | % | |||||||||||
General and administrative expense | 23,640 | 16,155 | 7,485 | 46.3 | % | ||||||||||
General and administrative expense as a percentage of revenue | 7.8 | % | 9.4 | % | |||||||||||
Interest (income) expense, net | — | (296 | ) | 296 | |||||||||||
Other (income) expense, net | 2,895 | (724 | ) | 3,619 | |||||||||||
Income (loss) before taxes | $ | 28,712 | $ | (12,816 | ) | $ | 41,528 | 324.0 | % | ||||||
Income (loss) before taxes as a percentage of revenue | 9.5 | % | (7.5 | )% | |||||||||||
Water & Flowback Services Division revenues increased during 2018 compared to the prior year primarily due to increased water management services activity. Water management and flowback service revenues increased $142.1 million during 2018 compared to the prior year primarily resulting from the acquisition of SwiftWater and increased completion activity. We estimate that approximately $95.2 million of the water management services revenue increase was generated from the operations of SwiftWater, which was acquired on February 28, 2018. Product sales revenue decreased by $10.6 million, as there was an international equipment sale in the prior year. We continue to focus on expanding our Water & Flowback Services Division equipment asset fleet, particularly in selected markets, which is expected to generate increased revenues going forward.
The Water & Flowback Services Division reflected increased gross profit during 2018 compared to the prior year due to the increase in revenues and improving customer pricing levels. This improvement was also due to the impact of a $2.9 million long-lived asset impairment during 2018 compared to $14.9 million of long-lived asset impairments during 2017. Customer pricing continues to be challenging due to excess availability of equipment in certain markets. The Water & Flowback Services Division continues to monitor its cost structure, minimizing increased costs despite increasing activity levels.
The Water & Flowback Services Division reported pretax income compared to a pretax loss during the prior year, primarily due to the improvement in gross profit described above. General and administrative expenses increased primarily due to SwiftWater operations, with increased wage and benefit expenses of $6.2 million, increased general expenses of $0.4 million, increased professional fees of $0.4 million, and $0.5 million of increased bad debt and consulting fees. Other expense, net, was recorded during the year primarily due to $3.4 million of increased expense associated with the remeasurement of the contingent purchase price consideration for SwiftWater and increased foreign currency losses.
36
Compression Division
Year Ended December 31, | Period to Period Change | ||||||||||||||
2018 | 2017 | 2018 vs. 2017 | % Change | ||||||||||||
(In Thousands, Except Percentages) | |||||||||||||||
Revenues | $ | 438,673 | $ | 295,587 | $ | 143,086 | 48.4 | % | |||||||
Gross profit | 59,017 | 35,114 | 23,903 | 68.1 | % | ||||||||||
Gross profit as a percentage of revenue | 13.5 | % | 11.9 | % | |||||||||||
General and administrative expense | 39,544 | 33,442 | 6,102 | 18.2 | % | ||||||||||
General and administrative expense as a percentage of revenue | 9.0 | % | 11.3 | % | |||||||||||
Interest (income) expense, net | 51,905 | 42,082 | 9,823 | ||||||||||||
CCLP Series A Preferred fair value adjustment | (733 | ) | (2,975 | ) | 2,242 | ||||||||||
Other (income) expense, net | 2,098 | (189 | ) | 2,287 | |||||||||||
Loss before taxes | $ | (33,797 | ) | $ | (37,246 | ) | $ | 3,449 | (9.3 | )% | |||||
Loss before taxes as a percentage of revenue | (7.7 | )% | (12.6 | )% | |||||||||||
Compression Division revenues increased during 2018 compared to the prior year due to a $98.2 million increase in product sales revenues, due to a higher number of new compressor equipment sales compared to the prior year. Demand for new compressor equipment continues to increase, and the current new equipment sales backlog has increased significantly compared to the prior year period. Cumulative new equipment sales orders added to our backlog during 2018 were $188 million. New equipment sales orders generally take less than 12 months to build and deliver. In addition, 2018 revenues reflect a $44.9 million increase in service revenues from compression and aftermarket services operations. This increase in service revenues was primarily due to increasing demand for compression services, as reflected by increased compression fleet utilization rates. Overall utilization of the Compression Division's compression fleet has improved sequentially for the past two years, led by increased utilization of the high- and medium-horsepower fleet.
Compression Division gross profit increased during 2018 compared to the prior year due to increased revenues discussed above. The increased compression fleet utilization rates have led to increases in customer contract pricing.
The Compression Division recorded a decreased pretax loss during 2018 compared to the prior year due to increased gross profit as discussed above. Interest expense increased compared to the prior year due to higher outstanding CCLP debt balances and a higher interest rate on the CCLP Senior Secured Notes, issued in March 2018, when compared to the CCLP Prior Credit Facility. In addition, other (income) expense, net, reflected an increased expense primarily due to $3.5 million of unamortized deferred financing costs charged to earnings as a result of the termination of the CCLP Prior Credit Facility offset by foreign currency gains and decreased income associated with insurance proceeds from the prior year. In addition, the CCLP Preferred Units fair value adjustment resulted in a decreased credit to earnings in 2018 as compared to the prior year. Changes in the fair value of the CCLP Preferred Units may generate additional volatility to our earnings going forward. General and administrative expense levels increased compared to the prior year, due to increased salary and employee-related expenses, including equity compensation, of $5.3 million, increased other general expenses of $1.6 million, and increased sales and marketing expenses of $0.2 million. These increases were offset by decreased professional fees of $1.0 million.
37
Corporate Overhead
Year Ended December 31, | Period to Period Change | ||||||||||||||
2018 | 2017 | 2018 vs. 2017 | % Change | ||||||||||||
(In Thousands, Except Percentages) | |||||||||||||||
Gross profit (loss) (primarily depreciation expense) | $ | (658 | ) | $ | (84 | ) | $ | (574 | ) | (683.3 | )% | ||||
General and administrative expense | 50,431 | 46,156 | 4,275 | 9.3 | % | ||||||||||
Interest expense, net | 19,640 | 15,513 | 4,127 | ||||||||||||
Warrants fair value adjustment (income) expense | (11,128 | ) | (5,301 | ) | (5,827 | ) | |||||||||
Other (income) expense, net | 2,374 | 1,269 | 1,105 | ||||||||||||
Loss before taxes | $ | (61,975 | ) | $ | (57,721 | ) | $ | (4,254 | ) | (7.4 | )% | ||||
Corporate Overhead pretax loss increased during 2018 compared to the prior year. Interest expense increased due to increased borrowings. Corporate general and administrative expense increased primarily due to $2.3 million of increased professional fees, including $0.9 million of transaction costs, $1.5 million of increased general expenses, and $0.6 million of salary and employee-related expenses. Interest expense increased due to increased borrowings under the Term Credit Agreement and ABL Credit Agreement, which were entered into in September 2018 and replaced the 11% Senior Note and the previous bank credit agreement. Other expense, net also increased, primarily due to $1.0 million of debt issuance fees pursuant to the new ABL Credit Agreement and the new Term Credit Agreement. These increases in expense were offset by the fair value adjustment of the outstanding Warrants liability in the current year resulting in a $5.8 million increased credit to earnings compared to the prior year.
2017 Compared to 2016
Consolidated Comparisons
Year Ended December 31, | Period to Period Change | ||||||||||||||
2017 | 2016 | 2017 vs. 2016 | % Change | ||||||||||||
(In Thousands, Except Percentages) | |||||||||||||||
Revenues | $ | 723,098 | $ | 617,391 | $ | 105,707 | 17.1 | % | |||||||
Gross profit | 108,390 | 60,839 | 47,551 | 78.2 | % | ||||||||||
Gross profit as a percentage of revenue | 15.0 | % | 9.9 | % | |||||||||||
General and administrative expense | 115,414 | 108,422 | 6,992 | 6.4 | % | ||||||||||
General and administrative expense as a percentage of revenue | 16.0 | % | 17.6 | % | |||||||||||
Goodwill impairment | — | 106,205 | (106,205 | ) | |||||||||||
Interest expense, net | 57,246 | 58,614 | (1,368 | ) | (2.3 | )% | |||||||||
Warrants fair value adjustment | (5,301 | ) | 2,106 | (7,407 | ) | ||||||||||
CCLP Series A Preferred fair value adjustment | (2,975 | ) | 4,404 | (7,379 | ) | ||||||||||
Litigation arbitration award income, net | (12,816 | ) | — | (12,816 | ) | ||||||||||
Other (income) expense, net | 865 | 4,308 | (3,443 | ) | |||||||||||
Loss before taxes and discontinued operations | (44,043 | ) | (223,220 | ) | 179,177 | ||||||||||
Loss before taxes as a percentage of revenue | (6.1 | )% | (36.2 | )% | |||||||||||
Provision (benefit) for income taxes | 751 | 2,156 | (1,405 | ) | |||||||||||
Income (loss) from continuing operations | (44,794 | ) | (225,376 | ) | 180,582 | ||||||||||
Loss from discontinued operations, net of taxes | (17,389 | ) | (14,017 | ) | (3,372 | ) | |||||||||
Net loss | (62,183 | ) | (239,393 | ) | 177,210 | ||||||||||
Net (income loss attributable to noncontrolling interest | 23,135 | 77,931 | (54,796 | ) | |||||||||||
Net income (loss) attributable to TETRA stockholders | $ | (39,048 | ) | $ | (161,462 | ) | $ | 122,414 | |||||||
38
Consolidated revenues for 2017 increased compared to the prior year primarily due to increased Water & Flowback Services revenues, which increased by $66.6 million, driven by increased onshore production testing and water management services activity. In addition, our Completion Fluids & Products Division also reported increased revenues compared to the prior year. Partially offsetting these increases, our Compression Division reported a $15.8 million decrease in revenues compared to the prior year, due to decreased demand for new compressor equipment in 2017 and pricing pressures for compression services, despite recent increases in compression fleet utilization. Challenging and competitive markets and activity levels continue to impact each of our businesses, although we continue to see indicators of improving demand for many of our products and services.
Consolidated gross profit increased significantly during 2017 compared to the prior year due to increased revenues and activity, particularly for the Completion Fluids & Products Division. Despite the improving demand for many of our products and services, the impact of pricing pressures continued to challenge the profitability of each of our businesses. While we remain aggressive in managing operating costs and maintaining reduced headcount, the results of each of our businesses reflect the impact of company-wide reinstatements during the first half of 2017 reversing wage and benefit reductions that were implemented during the first half of 2016.
Consolidated general and administrative expenses increased during 2017 compared to the prior year, primarily due to $10.7 million of increased salary related expenses and $2.2 million of insurance and other general expenses, partly offset by decreased professional services fees of $4.2 million and decreased bad debt and marketing expenses of $1.6 million. Due to the increased consolidated revenues discussed above, general and administrative expense as a percentage of revenues decreased compared to the prior year.
During the first quarter of 2016, we updated our test of goodwill impairment in accordance with the Financial Accounting Standards Board ("FASB") Accounting Standards Codification ("ASC") 350-20 "Goodwill" due to the decreases in the price of our common stock and the common unit price of CCLP. Continued decreased oil and natural gas prices had, and were expected to have, a continuing negative impact on industry drilling and capital expenditure activity, which affects the expected demand for products and services of each of our reporting units. Specifically, demand for our Compression Division's compression services and for sales of new compressor equipment had decreased significantly and was expected to continue to be decreased for the foreseeable future. Demand for our Water & Flowback Services Division's production testing services also had decreased as a result of decreased drilling and completion activity. This expected decreased demand, along with the decreases in the price of our common stock and the common unit price of CCLP, also caused an overall reduction in the fair values of each of our reporting units, particularly our Compression and Production Testing reporting units. As part of the test of goodwill impairment, we estimated the fair value of each of our reporting units, and determined, based on these estimated values, that impairments of the remaining goodwill of our Compression and Production Testing reporting units were necessary, primarily due to the market factors discussed above. Accordingly, during the first quarter of 2016, we recorded total impairment charges of $106.2 million associated with the goodwill of these reporting units. We did not record any goodwill impairment charges during 2017.
Consolidated interest expense, net, decreased in 2017 compared to the prior year primarily due to the decrease in Corporate interest expense, reflecting the decrease in long-term debt outstanding. Largely offsetting this decrease, Compression Division interest expense increased related to the paid in kind quarterly distributions on the CCLP Preferred Units. Interest expense during 2017 and 2016 includes $4.7 million and $4.1 million, respectively, of finance cost amortization.
Gain on sales of assets decreased during 2017 compared to the prior year primarily due to significant gains on sales of Water & Flowback Services Division assets during 2016.
The Warrants are accounted for as a derivative liability in accordance with ASC 815 and therefore they are classified as a long-term liability on our consolidated balance sheet at their fair value. Increases (or decreases) in the fair value of the Warrants are generally associated with the increase (or decrease) in the trading price of our common stock, resulting in adjustments to earnings for the associated valuation losses (gains), and resulting in future volatility of our earnings during the period the Warrants are outstanding.
The CCLP Preferred Units may be settled using a variable number of CCLP common units, and therefore the fair value of the CCLP Preferred Units is classified as a long-term liability on our consolidated balance sheet in accordance with ASC 480. Because the CCLP Preferred Units are convertible into CCLP common units at the option of the holder, the fair value of the CCLP Preferred Units will generally increase or decrease with the trading
39
price of the CCLP common units, and this increase (decrease) in CCLP Preferred Unit fair value will be charged (credited) to earnings, resulting in future volatility of our earnings during the period the CCLP Preferred Units are outstanding.
In January 2017, our Completion Fluids & Products Division collected $12.8 million from a successful legal arbitration award, resulting in a credit to earnings. See Commitments and Contingencies - Litigation section below for additional discussion.
Consolidated other (income) expense, net, was $0.9 million of expense during 2017 compared to $4.3 million of expense during 2016, with the improvement primarily due to $2.1 million of issuance costs from the CCLP Preferred Units which were issued during 2016, $1.8 million of unamortized deferred finance costs that were charged to earnings in 2016 as a result of the repayment of senior notes and senior secured notes, $1.0 million of decreased finance fees associated with warrants issued in 2016, $1.1 million of insurance recoveries and $0.9 million of increased foreign currency gains. Partially offsetting these decreases is $1.4 million of net gains on the extinguishment of certain CCLP 7.25% Senior Notes during 2016.
Our consolidated provision for income taxes during 2017 was primarily attributable to taxes in certain foreign jurisdictions and Texas gross margin taxes. Our consolidated effective tax rate for the year ended December 31, 2017 of negative 1.7% was primarily the result of losses generated in entities for which no related tax benefit has been recorded. The losses generated by these entities do not result in tax benefits due to offsetting valuation allowances being recorded against the related net deferred tax assets. We establish a valuation allowance to reduce the deferred tax assets when it is more likely than not that some portion or all of the deferred tax assets will not be realized. Included in our deferred tax assets are net operating loss carryforwards and tax credits that are available to offset future income tax liabilities in the U.S. as well as in certain foreign jurisdictions. Further, the effective tax rate during 2016 was negatively impacted by the nondeductible portion of our goodwill impairments recorded during the three month period ended March 31, 2016.
The Act was enacted on December 22, 2017, making significant changes to the Internal Revenue Code. Changes included, but were not limited to, a corporate tax rate decrease from 35% to 21% effective for tax years beginning after December 31, 2017, the transition of U.S. international taxation from a worldwide tax system to a territorial system, and a one-time transition tax on the mandatory deemed repatriation of cumulative foreign earnings as of December 31, 2017. We calculated our best estimate of the impact of the Act in our year end 2017 income tax provision. See Note H – "Income Taxes" contained in the Notes to Consolidated Financial Statements for the effect on our 2017 tax provision.
Divisional Comparisons
Completion Fluids & Products Division
Year Ended December 31, | Period to Period Change | ||||||||||||||
2017 | 2016 | 2017 vs. 2016 | % Change | ||||||||||||
(In Thousands, Except Percentages) | |||||||||||||||
Revenues | $ | 257,851 | $ | 205,156 | $ | 52,695 | 25.7 | % | |||||||
Gross profit | 71,022 | 40,157 | 30,865 | 76.9 | % | ||||||||||
Gross profit as a percentage of revenue | 27.5 | % | 19.6 | % | |||||||||||
General and administrative expense | 19,661 | 22,673 | (3,012 | ) | (13.3 | )% | |||||||||
General and administrative expense as a percentage of revenue | 7.6 | % | 11.1 | % | |||||||||||
Interest income, net | (53 | ) | (4 | ) | (49 | ) | |||||||||
Litigation arbitration award income | (12,816 | ) | — | (12,816 | ) | ||||||||||
Other (income) expense, net | 339 | (254 | ) | 593 | |||||||||||
Income before taxes | $ | 63,891 | $ | 17,742 | $ | 46,149 | 260.1 | % | |||||||
Income before taxes as a percentage of revenue | 24.8 | % | 8.6 | % | |||||||||||
Increased Completion Fluids & Products Division revenues during 2017 compared to 2016 were primarily due to $49.3 million of increased product sales revenues attributed to increased CBFs and associated product sales
40
revenues in the U.S. Gulf of Mexico, including product sales associated with a TETRA CS Neptune completion fluid project during 2017. While offshore rig counts remain low, we have seen an increase in demand from our offshore customers. In addition, international offshore fluid sales and onshore manufactured product sales increased compared to the prior year. Service revenues increased $3.3 million, primarily due to increased offshore completion services associated with the U.S. Gulf of Mexico TETRA CS Neptune completion project.
Completion Fluids & Products Division gross profit during 2017 increased significantly compared to 2016 primarily due to the profitability associated with the mix of CBF products and services, particularly for offshore completion fluids products and increased revenues. Completion Fluids & Products Division profitability in future periods will continue to be affected by the mix of its products and services and the timing of TETRA CS Neptune completion projects.
The Completion Fluids & Products Division reported a significant increase in pretax earnings during 2017 compared to the prior year primarily due to the increased gross profit discussed above. In addition, pretax earnings also increased due to the collection of a successful legal arbitration award of $12.8 million during January 2017 that was credited to earnings. Completion Fluids & Products Division administrative cost levels decreased compared to 2016, primarily due to $3.7 million of decreased legal and professional fees, following the legal arbitration award. In addition, bad debt and consulting expenses decreased by $0.1 million. These decreases were partially offset by $0.8 million of increased wage and benefit related expenses. The Division reported other expense, net, during 2017 compared to other income, net, during the prior year period primarily due to increased foreign currency losses compared to the prior year.
Water & Flowback Services Division
Year Ended December 31, | Period to Period Change | ||||||||||||||
2017 | 2016 | 2017 vs. 2016 | % Change | ||||||||||||
(In Thousands, Except Percentages) | |||||||||||||||
Revenues | $ | 171,621 | $ | 105,057 | $ | 66,564 | 63.4 | % | |||||||
Gross profit (loss) | 2,319 | (16,586 | ) | 18,905 | (114.0 | )% | |||||||||
Gross profit (loss) as a percentage of revenue | 1.4 | % | (15.8 | )% | |||||||||||
General and administrative expense | 16,155 | 14,783 | 1,372 | 9.3 | % | ||||||||||
General and administrative expense as a percentage of revenue | 9.4 | % | 14.1 | % | |||||||||||
Goodwill impairment | — | 13,871 | (13,871 | ) | |||||||||||
Interest income, net | (296 | ) | (594 | ) | 298 | ||||||||||
Other (income) expense, net | (724 | ) | (1,863 | ) | 1,139 | ||||||||||
Loss before taxes | $ | (12,816 | ) | $ | (42,783 | ) | $ | 29,967 | 70.0 | % | |||||
Loss before taxes as a percentage of revenue | (7.5 | )% | (40.7 | )% | |||||||||||
Water & Flowback Services Division revenues increased during 2017 compared to the prior year primarily due to increased service revenues of $54.1 million during 2017 compared to 2016, reflecting increased water management services activity resulting from the impact of increased demand, reflecting the growth in domestic onshore rig count and activity in certain domestic and international markets. Onshore U.S. activity levels in certain markets, particularly the Permian Basin of Texas, have reflected the increased rig counts during the last half of 2017 compared to the prior year, although customer pricing levels in certain markets continue to be challenging due to excess availability of equipment. Water & Flowback Services revenues also increased during 2017 due to $12.4 million of product sales revenues associated with international equipment sales.
The Water & Flowback Services Division reported an increased gross profit during 2017 compared to a gross loss during 2016 due to the international equipment sales discussed above as well as due to the increased industry activity levels. This improvement was despite $14.9 million of long-lived asset impairments during 2017 compared to $6.4 million of long-lived asset impairments during the prior year.
The Water & Flowback Services Division reported a decreased pretax loss compared to the prior year, primarily due to the gross profit discussed above and due to a goodwill impairment recorded during the prior year.
41
General and administrative expenses increased compared to the prior year, primarily due to increased general expenses and increased salary and benefit expenses. Other income, net decreased primarily due to decreased foreign currency gains and decreased gains on disposal of assets.
Compression Division
Year Ended December 31, | Period to Period Change | ||||||||||||||
2017 | 2016 | 2017 vs. 2016 | % Change | ||||||||||||
(In Thousands, Except Percentages) | |||||||||||||||
Revenues | $ | 295,587 | $ | 311,374 | $ | (15,787 | ) | (5.1 | )% | ||||||
Gross profit | 35,114 | 37,681 | (2,567 | ) | (6.8 | )% | |||||||||
Gross profit as a percentage of revenue | 11.9 | % | 12.1 | % | |||||||||||
General and administrative expense | 33,442 | 36,199 | (2,757 | ) | (7.6 | )% | |||||||||
General and administrative expense as a percentage of revenue | 11.3 | % | 11.6 | % | |||||||||||
Goodwill impairment | — | 92,334 | (92,334 | ) | |||||||||||
Interest expense, net | 42,082 | 38,055 | 4,027 | ||||||||||||
CCLP Series A Preferred fair value adjustment | (2,975 | ) | 5,036 | (8,011 | ) | ||||||||||
Other (income) expense, net | (189 | ) | 2,384 | (2,573 | ) | ||||||||||
Loss before taxes | $ | (37,246 | ) | $ | (136,327 | ) | $ | 99,081 | (72.7 | )% | |||||
Loss before taxes as a percentage of revenue | (12.6 | )% | (43.8 | )% | |||||||||||
Compression Division revenues decreased during 2017 compared to 2016 due to reductions in both compression and related services revenues and new compressor equipment sales revenues. The $10.7 million decrease in compression and related service revenues resulted primarily from the reduction in pricing for compression services, and was realized despite increased overall compression fleet utilization. Although overall utilization of the Compression Division's compression fleet has improved sequentially for five consecutive quarterly periods, demand for low-horsepower production enhancement compression services remains challenged. Revenues from sales of compressor equipment and parts during 2017 decreased $5.1 million compared to the prior year primarily due to decreased sales of new compressor equipment.
Compression Division gross profit decreased during 2017 compared to the prior year despite a $2.4 million insurance recovery in 2017 for equipment that was damaged in the prior year, and despite $10.2 million in impairments and other charges recorded during the prior year period. This decrease in gross profit was primarily due to compression services customer pricing pressures discussed above. Although some customer pricing still remains lower than early 2016 levels, pricing pressures have been easing, and pricing for compression services is expected to continue to improve going forward.
The Compression Division recorded a decreased pretax loss during 2017 compared to 2016 primarily due to the impact of goodwill impairment recorded during the prior year. In addition, the fair value adjustment of the CCLP Preferred Units was credited to earnings during 2017 compared to a charge to earnings in the prior year. Changes in the fair value of the CCLP Preferred Units may generate additional volatility to our earnings going forward. Also, general and administrative expense levels decreased compared to the prior year, mainly due to decreased professional fees of $1.0 million, decreased bad debt expense of $0.7 million, decreased salary related expenses of $0.5 million and decreased other expenses of $0.3 million. The Compression Division recorded other income, net, during 2017 compared to other expense, net, during the prior year due to $2.1 million of CCLP Preferred Units issuance costs that were expensed during the prior year, and due to $0.6 million of insurance recoveries credited to other income during 2017. These decreased expenses were partially offset by the decreased gross profit discussed above, and due to increased interest expense, net, compared to the prior year due to the expense associated with paid in kind quarterly distributions on the CCLP Preferred Units that were issued during the third quarter of 2016.
42
Corporate Overhead
Year Ended December 31, | Period to Period Change | ||||||||||||||
2017 | 2016 | 2017 vs. 2016 | % Change | ||||||||||||
(In Thousands, Except Percentages) | |||||||||||||||
Gross profit (loss) (primarily depreciation expense) | $ | (84 | ) | $ | (430 | ) | $ | 346 | 80.5 | % | |||||
General and administrative expense | 46,156 | 34,767 | 11,389 | 32.8 | % | ||||||||||
Interest expense, net | 15,513 | 21,593 | (6,080 | ) | |||||||||||
Warrants fair value adjustment (income) expense | (5,301 | ) | 2,106 | (7,407 | ) | ||||||||||
Other (income) expense, net | 1,269 | 4,037 | (2,768 | ) | |||||||||||
Loss before taxes | $ | (57,721 | ) | $ | (62,933 | ) | $ | 5,212 | 8.3 | % | |||||
Corporate Overhead pretax loss decreased during 2017 compared to the prior year, primarily due to the adjustment of the fair value of the outstanding Warrants liability that resulted in a $5.3 million credit to earnings during 2017 compared to a charge to earnings during 2016. In addition, interest expense, net, during 2017 decreased compared to the prior year reflecting the reduction in outstanding long-term debt following the June and December 2016 equity offerings, the proceeds from which were primarily used to retire long-term debt outstanding. In addition, other expense, net, decreased primarily due to $1.8 million of unamortized deferred finance costs that were charged to earnings pursuant to the repayment of senior notes and senior secured notes in the prior year. Corporate general and administrative expense increased primarily due to $9.8 million of increased salary, incentives and employee related expense, $1.9 million of increased general expenses, and $0.4 million of increased professional fees. The increased salary, incentives and employee related expenses include the impact of company-wide wage and salary reinstatements during the first half of 2017 and the discontinuation of the workweek reductions that were implemented during the first half of 2016, as well as the impact of severance expense during 2017. These increases were partially offset by $0.8 million of decreased consulting marketing fees.
Liquidity and Capital Resources
We reported decreased consolidated cash flows provided by operating activities during 2018 compared to the prior year. This decrease occurred despite improved profitability of our operations, due to increased working capital needs largely due to the timing of payments of accounts payable. We generated $46.6 million of consolidated operating cash flows during the year ended December 31, 2018, with CCLP providing $30.1 million of this consolidated total. We received $12.1 million of cash distributions from CCLP during the year ended December 31, 2018 compared to $14.2 million during the prior year. The amount of distributions we receive from CCLP is expected to decrease further in 2019, following CCLP's announcement in December 2018 of a significant reduction in distributions to its common unitholders, including us. As a result of the acquisition of SwiftWater, our operating cash flows increased during 2018, and such increase more than offset the decrease in operating cash flows following the March 2018 disposal of our Offshore Division. We believe that the capital restructuring steps we have taken during the past three years support our ability to meet our financial obligations and fund future growth as needed, despite current uncertain operating and financial markets.
We and CCLP are in compliance with all covenants of our respective debt agreements as of December 31, 2018. We have reviewed our financial forecasts for the twelve month period subsequent to March 4, 2019, which consider our debt covenant requirements. Based on our financial forecasts, which are based on current market conditions and certain operating and other business assumptions that we believe to be reasonable as of March 4, 2019, we believe that we will have adequate liquidity, earnings, and operating cash flows to fund our operations and debt obligations and maintain compliance with our debt covenants through at least the next twelve months. With regard to CCLP, also considering financial forecasts based on current market conditions as of March 4, 2019, CCLP believes that it will have adequate liquidity, earnings, and operating cash flows to fund its operations and debt obligations and maintain compliance with the covenants under its long-term debt agreements through at least the next twelve months.
43
Our consolidated sources and uses of cash during the year ended December 31, 2018, 2017, and 2016 are as follows:
Year Ended December 31, | |||||||||||
2018 | 2017 | 2016 | |||||||||
(In Thousands) | |||||||||||
Operating activities | $ | 46,586 | $ | 64,595 | $ | 55,659 | |||||
Investing activities | (188,646 | ) | (47,897 | ) | (14,295 | ) | |||||
Financing activities | 154,994 | (21,336 | ) | (32,633 | ) | ||||||
Because of the level of our consolidated debt, we believe it is important to consider our capital structure and CCLP's capital structure separately, as there are no cross default provisions, cross collateralization provisions, or cross guarantees between CCLP's debt and TETRA's debt. (See Financing Activities section below for a complete discussion of the terms of our and CCLP's respective debt arrangements.) Our consolidated debt outstanding has a carrying value of approximately $815.6 million as of December 31, 2018. However, approximately $633.0 million of this consolidated debt balance is owed by CCLP and is serviced from the cash balances and cash flows of CCLP, $343.2 million of which is secured by certain of CCLP's assets. Through our approximately 35% common unit ownership interest in CCLP and ownership of an approximately 1% general partner interest, we receive our share of the distributable cash flows of CCLP through its quarterly cash distributions. Approximately $15.9 million of the $40.0 million of the cash balance reflected on our consolidated balance sheet is owned by CCLP and is not available to us. In September 2018, we entered into the ABL Credit Agreement and Term Credit Agreement. In connection with the closing of these debt agreements, we used a portion of the proceeds to repay all outstanding borrowings and obligations under our then existing bank credit agreement and all outstanding indebtedness under the 11% Senior Note, and both the bank credit agreement and the note purchase agreement for the 11% Senior Note were then terminated. As of December 31, 2018, subject to compliance with the covenants, borrowing base requirements, and other provisions of the agreement that may limit borrowings, we had availability of approximately $47.6 million under the ABL Credit Agreement. Following the March 2018 issuance of the CCLP Senior Secured Notes, CCLP used a portion of the proceeds to repay the outstanding borrowings under the CCLP Prior Credit Facility, which was then terminated. In June 2018, CCLP entered into the CCLP Credit Agreement. As of December 31, 2018, and subject to compliance with the covenants, borrowing base requirements, and other provisions of the agreement that may limit borrowings under the CCLP Credit Agreement, CCLP had availability of $27.1 million. See CCLP Financing Activities below for further discussion.
Operating Activities
Consolidated cash flows provided by operating activities totaled $46.6 million during 2018 compared to $64.6 million during the prior year, a decrease of $18.0 million. Operating cash flows decreased despite improved operating profitability due to the use of cash for working capital changes, particularly related to the timing of payments of accounts payable. We have taken steps to aggressively manage working capital, including increased collection efforts. We continue to monitor customer credit risk and have historically focused on serving larger capitalized oil and gas operators and national oil companies. Cash utilized for increased inventory primarily relates to work in progress inventory for new compressor package sales by our Compression Division, and this increase was largely offset by advance funding by its customers.
Demand for the vast majority of our products and services is driven by oil and gas industry activity, which is affected by oil and natural gas pricing. With the increase in oil prices in early 2018, operating plans and capital expenditure levels of many of our oil and natural gas customers increased, benefiting certain of our operating segments with improved revenues and cash flows. The acquisition of SwiftWater provided additional revenues and operating cash flows during the year ended December 31, 2018, and, along with the acquisition of JRGO in December 2018, is expected to continue to do so going forward. Growth in completion activity compared to early 2017 has resulted in improved cash provided by operating activities of our Water & Flowback Services Division. The increased capital expenditure activity of our Compression Division customers has resulted in increased demand for compression services and equipment, and related increased revenues. The improved 2018 results were realized despite the impact of decreased oil commodity prices that occurred during the fourth quarter of 2018. We are monitoring the 2019 spending plans of our customers as a result of the current reduced oil prices, and if oil prices decrease further during 2019, demand for many of our products and services, and our associated operating cash
44
flows, could be negatively impacted. During early 2018, and despite increasing activity levels, our goal was to minimize growth to our operating and administrative headcount and continue to maintain a low cost structure for our businesses, particularly during the current period of volatile oil and natural gas prices.
As part of the sale of our Offshore Division in March 2018, Orinoco Natural Resources, LLC ("Orinoco") assumed all liabilities and obligations currently associated with our former Maritech subsidiary, including but not limited to all current and future decommissioning obligations related to properties owned or formerly owned by our Maritech subsidiary prior to its purchase by Orinoco.
Investing Activities
During 2018, the total amount of our net cash utilized on investing activities was $188.6 million. Total cash capital expenditures during 2018 were $141.9 million, which is net of $10.1 million cost of equipment sold. Our Completion Fluids & Products Division spent $5.3 million on capital expenditures during 2018, the majority of which related to plant and facility additions. Our Water & Flowback Services Division spent $30.2 million on capital expenditures, primarily to add to its water management equipment fleet. Our Compression Division spent $114.0 million, primarily for growth capital expenditure projects to increase its compression fleet. The acquisition of SwiftWater included initial cash purchase price consideration of $42.0 million, plus $1.0 million which was subsequently paid in August 2018 as a working capital adjustment. The acquisition of JRGO included initial cash purchase price consideration of $7.6 million.
Generally, a significant majority of our planned capital expenditures has been related to identified opportunities to grow and expand our existing businesses. However, certain of these planned expenditures have been, and may continue to be, postponed or canceled as we are reviewing all capital expenditure plans carefully in an effort to conserve cash. We currently have no long-term capital expenditure commitments. The deferral of capital projects could affect our ability to compete in the future. Excluding our Compression Division, we expect to spend approximately $25 to $35 million during 2019, primarily to further expand the Water & Flowback Services Division equipment fleet. Our Compression Division expects to spend approximately $75 million to $80 million on capital expenditures during 2019, primarily to expand its compression fleet in response to increased demand for compression services. Growth capital expenditures by our Compression Division during 2019 are expected to be funded by CCLP's available cash, cash provided by operating activities, and a portion funded by TETRA. The level of future growth capital expenditures depends on forecasted demand for our products and services. If the forecasted demand for our products and services during 2019 increases or decreases, the amount of planned expenditures on growth and expansion may be adjusted accordingly.
Financing Activities
During 2018, the total amount of consolidated cash provided by financing activities was $155.0 million, consisting primarily of the proceeds from the issuance of long-term debt. In September 2018, we entered into the ABL Credit Agreement and Term Credit Agreement, a portion of the proceeds of which were used to repay all outstanding borrowings and obligations under our then existing bank credit agreement and all outstanding indebtedness under the 11% Senior Note and both the bank credit agreement and the note purchase agreement for the 11% Senior Note were then terminated. Borrowings of up to $100 million under the ABL Credit Agreement, and up to $75 million of additional borrowings under the Term Credit Agreement will be available, subject to their availability, to fund future working capital requirements, capital expenditure requirements as well as potential acquisition financing. In March 2018, CCLP issued the CCLP Senior Secured Notes, a portion of the proceeds of which were used to repay the outstanding balance under the CCLP Prior Credit Facility and provide funding for 2018 capital expenditures. In June 2018, CCLP entered into the CCLP Credit Agreement, which provides up to $50.0 million to fund ongoing working capital and letter of credit needs and for general business purposes of CCLP. We and CCLP may supplement our existing cash balances and cash flow from operating activities with short-term borrowings, long-term borrowings, leases, issuances of equity and debt securities, and other sources of capital, subject to availability. During December 2018, CCLP decided to begin redeeming a portion of the CCLP Preferred Units using cash, rather than converting using CCLP common units, beginning with the January 2019 conversion date. We and CCLP are in compliance with all covenants of our respective credit and debt agreements as of December 31, 2018.
45
See CCLP Financing Activities below for discussion of the CCLP Preferred Units and CCLP's long-term debt.
TETRA Long-Term Debt
Asset-Based Credit Agreement. On September 10, 2018, TETRA, as borrower, and certain of its subsidiaries, entered into the ABL Credit Agreement with a syndicate of lenders, including JPMorgan Chase Bank, N.A., as administrative agent (collectively, the "ABL Lenders"). The ABL Credit Agreement provides for a senior secured revolving credit facility of up to $100 million, subject to a borrowing base to be determined by reference to the value of inventory and accounts receivable, and includes a sublimit of $20.0 million for letters of credit and a swingline loan sublimit of $10.0 million. As of December 31, 2018, subject to compliance with the covenants, borrowing base, and other provisions of the agreement that may limit borrowings, TETRA had an availability of $47.6 million under this agreement. As of March 1, 2019, we have $32.0 million outstanding under our ABL Credit Agreement and $9.0 million letters of credit.
Borrowings under the ABL Credit Agreement bear interest at a rate per annum equal to, at the option of TETRA, either (i) London Interbank Offering Rate (“LIBOR”) plus a margin based upon a fixed charge coverage ratio or (ii) a base rate plus a margin based on a fixed charge coverage ratio. The base rate is determined by reference to the highest of (a) the prime rate of interest as announced from time to time by JPMorgan Chase Bank, N.A. (b) the Federal Funds Effective Rate (as defined in the ABL Credit Agreement) plus 0.5% per annum and (c) LIBOR (adjusted to reflect any required bank reserves) for a one-month period on such day plus 1.0% per annum. Borrowings outstanding have an applicable margin ranging from 1.75% to 2.25% per annum for LIBOR-based loans and 0.75% to 1.25% per annum for base-rate loans, based upon the applicable fixed charge coverage ratio. In addition to paying interest on the outstanding principal under the ABL Credit Agreement, TETRA is required to pay certain fees.
The revolving loans under the ABL Credit Agreement may be voluntarily prepaid, in whole or in part, without premium or penalty, subject to applicable breakage fees. The maturity date of the ABL Facility is September 10, 2023.
The ABL Credit Agreement contains certain affirmative and negative covenants, including covenants that restrict the ability of TETRA and certain of its subsidiaries to take certain actions including, among other things and subject to certain significant exceptions, incurring debt, granting liens, engaging in mergers and other fundamental changes, making investments, entering into or amending transactions with affiliates, paying dividends and making other restricted payments, prepaying other indebtedness, and selling assets. The ABL Credit Agreement also contains a provision that requires a fixed charge coverage ratio (as defined in the ABL Credit Agreement) of not less than 1.00 to 1.00 in the event that certain conditions associated with outstanding borrowings and cash availability occur. As of December 31, 2018, such conditions have not occurred. All obligations under the ABL Credit Agreement and the guarantees of those obligations are secured, subject to certain exceptions, by a security interest on substantially all of the personal property of TETRA and certain subsidiaries of TETRA, the equity interests in certain domestic subsidiaries, including CCLP, and a maximum of 65% of the equity interests in certain foreign subsidiaries.
The ABL Credit Agreement includes customary events of default, including non-payment of principal, interest or fees, violation of covenants, inaccuracy of representations or warranties, cross-default to other material indebtedness, bankruptcy and insolvency events, invalidity or impairment of security interests or invalidity of loan documents, certain ERISA events, unsatisfied or unstayed judgments, and any change of control.
Proceeds of loans under the ABL Credit Agreement were used to pay certain debt of TETRA existing on the effective date of the ABL Credit Agreement and may be used for working capital needs, capital expenditures and other general corporate purposes. The ABL Credit Agreement replaced our previous Bank Credit Agreement, as defined and discussed in further detail below.
Term Credit Agreement. On September 10, 2018, TETRA, as borrower, entered into the Term Credit Agreement with a syndicate of lenders (collectively, the “Term Lenders”) and Wilmington Trust, National Association, as administrative agent. The Term Credit Agreement provides an initial loan in the amount of $200 million (the “Initial Term Loan”) and the availability of additional loans, subject to the terms of the Term Credit Agreement, up to an aggregate amount of $75 million for certain acquisitions (the “Additional Term Loans,” and together with the
46
Initial Term Loan, the “Term Loan”). As of March 1, 2019, $200.0 million in aggregate principal amount of our Term Credit Agreement is outstanding.
Borrowings under the Term Credit Agreement bear interest at a rate per annum equal to, at the option of TETRA, either (i) LIBOR plus a margin of 6.25% per annum or (ii) a base rate plus a margin of 5.25% per annum. In addition to paying interest on the outstanding principal under the Term Credit Agreement, TETRA is required to pay a commitment fee in respect of the unutilized commitments at the rate of 1.0% per annum, paid quarterly in arrears based on utilization of the commitments under the Term Credit Agreement.
The Term Credit Agreement contains certain affirmative and negative covenants, including covenants that restrict the ability of TETRA and certain of its subsidiaries to take certain actions including, among other things and subject to certain significant exceptions, incurring debt, granting liens, engaging in mergers and other fundamental changes, making investments, entering into or amending transactions with affiliates, paying dividends and making other restricted payments, prepaying other indebtedness, and selling assets. The Term Credit Agreement also contains a requirement that the borrowers comply at the end of each fiscal quarter with a minimum Interest Coverage Ratio (as defined in the Term Credit Agreement) of 1.00 to 1.00. As of December 31, 2018, TETRA is in compliance with the Interest Coverage Ratio requirement.
All obligations under the Term Credit Agreement and the guarantees of those obligations are secured, subject to certain exceptions, by a security interest for the benefit of the Term Lenders on substantially all of the personal property of TETRA and certain of its subsidiaries, the equity interests in certain domestic subsidiaries, including CCLP, and a maximum of 65% of the equity interests in certain foreign subsidiaries.
The Term Credit Agreement includes customary events of default including non-payment of principal, interest or fees, violation of covenants, inaccuracy of representations or warranties, cross-default to other material indebtedness, bankruptcy and insolvency events, invalidity or impairment of security interests or invalidity of loan documents, certain ERISA events, unsatisfied or unstayed judgments, and any change of control.
The net proceeds from the Initial Term Loan were used to prepay outstanding indebtedness under the 11% Senior Note and indebtedness of TETRA under our then existing bank credit agreement discussed below. Proceeds of any Additional Term Loans may be used for acquisitions, subject to the terms of the Term Credit Agreement. The loans under the Term Credit Agreement may be voluntarily prepaid, in whole or in part, subject to applicable breakage fees. Any prepayment prior to the one-year anniversary is also subject to a “make-whole” payment as set forth in the Term Credit Agreement. Thereafter, any prepayment during the period commencing after the one-year anniversary and ending on the two-year anniversary will have a premium of 3.0% and during the period commencing after the two-year anniversary and ending on the three-year anniversary, a premium of 1.0%. The maturity date of the Term Credit Agreement is September 10, 2025. There is no prepayment premium required after the third anniversary.
Prior Bank Credit Agreement. On September 10, 2018, in connection with the closing of the above-described loans, TETRA repaid all outstanding borrowings and obligations under our then existing bank credit agreement with a portion of the net proceeds from the above-described loans and terminated the existing bank credit agreement. Certain of the ABL Lenders were lenders under the then existing bank credit agreement and, accordingly, received a portion of the proceeds from the above-described loans in connection with the repayment of the outstanding borrowings under the then existing bank credit agreement.
11% Senior Note. On September 10, 2018, in connection with the closing of the above-described loans, TETRA repaid all outstanding indebtedness under the 11% Senior Note with a portion of the proceeds from the above-described loans and terminated its obligations under the 11% Senior Note. Affiliates of certain Term Lenders were holders of the 11% Senior Note and, accordingly, received a portion of the proceeds from the Term Credit Agreement in connection with the repayment of the outstanding indebtedness under the 11% Senior Note. In connection with the early termination of the 11% Senior Note, TETRA paid $7 million of "make-whole" prepayment fee in accordance with the terms of the 11% Senior Note.
47
CCLP Financing Activities
In March 2018, CCLP issued an aggregate $350.0 million of its CCLP Senior Secured Notes, and the net proceeds of $342.5 million were partially used to repay the remaining outstanding balance of $258.0 million under the CCLP Prior Credit Facility, which was then terminated. See below for a further discussion of the CCLP Senior Secured Notes. The remaining proceeds are being used to fund CCLP capital expenditures, as well as for general partnership needs.
CCLP Preferred Units. During 2016, CCLP issued an aggregate of 6,999,126 of CCLP Preferred Units for a cash purchase price of $11.43 per CCLP Preferred Unit (the “Issue Price”), resulting in total 2016 net proceeds of approximately $77.3 million. We purchased 874,891 of the CCLP Preferred Units at the aggregate Issue Price of $10.0 million.
In connection with the closing of the Initial Private Placement, CSI Compressco GP Inc (our wholly owned subsidiary) executed the Second Amended and Restated CCLP Partnership Agreement to, among other things, authorize and establish the rights and preferences of the CCLP Preferred Units. The CCLP Preferred Units are a new class of equity security that rank senior to all classes or series of equity securities of CCLP with respect to distribution rights and rights upon liquidation. We and the other holders of CCLP Preferred Units (each, a “CCLP Preferred Unitholder”) receive quarterly distributions, which are paid in kind in additional CCLP Preferred Units, equal to an annual rate of 11.00% of the Issue Price ($1.2573 per unit annualized) of the outstanding CCLP Preferred Units, subject to certain adjustments. The rights of the CCLP Preferred Units include certain anti-dilution adjustments, including adjustments for economic dilution resulting from the issuance of common units in the future below a set price.
Unless otherwise redeemed for cash, a ratable portion of the CCLP Preferred Units has been, and will be, converted into CCLP common units on the eighth day of each month over a period of thirty months that began in March 2017 (each, a “Conversion Date”), subject to certain provisions of the Second Amended and Restated CCLP Partnership Agreement that may delay or accelerate all or a portion of such monthly conversions. On each Conversion Date, a portion of the CCLP Preferred Units will convert into, at CCLP's election, cash or CCLP common units representing limited partner interests in CCLP in an amount equal to, with respect to each CCLP Preferred Unitholder, the number of CCLP Preferred Units held by such CCLP Preferred Unitholder divided by the number of Conversion Dates remaining, subject to adjustment described in the Second Amended and Restated CCLP Partnership Agreement, with the conversion price (the "Conversion Price") determined by the trading prices of the common units over the prior month, among other factors, and as otherwise impacted by the existence of certain conditions related to the CCLP common units. The maximum aggregate number of CCLP common units that could be required to be issued pursuant to the conversion provisions of the CCLP Preferred Units is potentially unlimited; however, CCLP may, at its option, pay cash, or a combination of cash and CCLP common units, to the CCLP Preferred Unitholders instead of issuing CCLP common units on any Conversion Date, subject to certain restrictions as described in the Second Amended and Restated CCLP Partnership Agreement and the CCLP Credit Agreement (defined below). On December 20, 2018, CCLP announced that, given the decline in its common unit price, CCLP was reducing its common unit distributions from $0.75 per unit per year (or $0.1875 per quarter) to $0.04 per unit per year (or $0.01 per quarter) for a period of up to four quarters, beginning with the fourth quarter of 2018 distribution. Beginning with the January 2019 conversion date, CCLP intends to use the approximately $34 million of savings from the reduced distribution to redeem the remaining CCLP Preferred Units for cash and avoid the dilution to CCLP's common unitholders that would occur if the remaining CCLP Preferred Units were converted into CCLP common units.
Including the impact of paid in kind distributions of CCLP Preferred Units and previous conversions of CCLP Preferred Units into CCLP common units, the total number of CCLP Preferred Units outstanding as of December 31, 2018 was 2,732,981, of which we held 343,232.
Because the CCLP Preferred Units may be settled using a variable number of CCLP common units, the fair value of the CCLP Preferred Units is classified as a long-term liability on our consolidated balance sheet in accordance with ASC 480 "Distinguishing Liabilities and Equity." The fair value of the CCLP Preferred Units as of December 31, 2018 was $30.9 million. Changes in the fair value during each quarterly period, if any, are charged or credited to earnings in the accompanying consolidated statements of operations. Charges or credits to earnings for changes in the fair value of the CCLP Preferred Units, along with the interest expense for the accrual and payment of paid-in-kind distributions associated with the CCLP Preferred Units, are non-cash charges and credits associated with the CCLP Preferred Units.
48
CCLP Bank Credit Facility. On June 29, 2018, CCLP and two of its wholly owned subsidiaries (collectively the "CCLP Borrowers"), and certain of its wholly owned subsidiaries named therein as guarantors (the "CCLP Credit Agreement Guarantors"), entered into a Loan and Security Agreement (the "CCLP Credit Agreement") with the lenders thereto (the "Lenders"), and Bank of America, N.A., in its capacity as administrative agent, collateral agent, letter of credit issuer, and swing line lender. All of the CCLP Borrowers' obligations under the CCLP Credit Agreement are guaranteed by certain of their existing and future domestic subsidiaries. The CCLP Credit Agreement includes a maximum credit commitment of $50.0 million which is available for loans, letters of credit (with a sublimit of $25.0 million), and swingline loans (with a sublimit of $5.0 million), subject to a borrowing base determined by reference to the value of CCLP’s and any other borrowers’ accounts receivable. As of December 31, 2018, and subject to compliance with the covenants, borrowing base, and other provisions of the agreements that may limit borrowings under the CCLP Credit Agreement, CCLP had availability of $27.1 million. Such maximum credit commitment may be increased by $25.0 million in accordance with the terms and conditions of the CCLP Credit Agreement.
The CCLP Borrowers may borrow funds under the CCLP Credit Agreement to pay fees and expenses related to the CCLP Credit Agreement and for the Borrowers' ongoing working capital needs and for general partnership purposes. The revolving loans under the CCLP Credit Agreement may be voluntarily prepaid, in whole or in part, without premium or penalty, subject to breakage or similar costs. The maturity date of the CCLP Credit Agreement is June 29, 2023. As of December 31, 2018, no balance was outstanding under the CCLP Credit Agreement. As of March 1, 2019, CCLP has no balance outstanding under the CCLP Credit Agreement and $3.5 million letters of credit.
Borrowings under the CCLP Credit Agreement will bear interest at a rate per annum equal to, at the option of the CCLP Borrowers, either (i) LIBOR plus a margin based on average daily excess availability or (ii) a base rate plus a margin based on average daily excess availability. LIBOR-based loans will have an applicable margin ranging between 1.75% and 2.25% per annum and base-rate loans will have an applicable margin ranging from 0.75% to 1.25% per annum, according to average daily excess availability when financial statements are delivered. In addition to paying interest on outstanding principal under the CCLP Credit Agreement, the CCLP Borrowers are required to pay certain fees.
The CCLP Credit Agreement contains certain affirmative and negative covenants, including covenants that restrict the ability of the CCLP Borrowers, the CCLP Credit Agreement Guarantors, and certain of their subsidiaries to take certain actions including, among other things and subject to certain significant exceptions, incurring debt, granting liens, making investments, entering into or amending transactions with affiliates, paying dividends, and selling assets. The CCLP Credit Agreement also contains a provision that requires compliance with a fixed charge coverage ratio (as defined in the CCLP Credit Agreement) of not less than 1.0 to 1.0 in the event that certain conditions associated with outstanding borrowings and cash availability occur. As of December 31, 2018, such conditions have not occurred.
All obligations under the CCLP Credit Agreement and the guarantees of those obligations are secured, subject to certain exceptions, by a first priority security interest for the benefit of the Lenders in the CCLP Borrowers’ and the CCLP Credit Agreement Guarantors’ present and future accounts receivable, inventories and related assets, and proceeds of the foregoing.
CCLP Senior Secured Notes. The obligations under the CCLP Senior Secured Notes are jointly and severally, and fully and unconditionally guaranteed on a senior secured basis by each of our domestic restricted subsidiaries (other than CSI Compressco Finance) that guarantee its other indebtedness (the "CCLP Senior Secured Notes Guarantors" and together with CCLP and CSI Compressco Finance Inc, the "CCLP Senior Secured Notes Obligors"). The CCLP Senior Secured Notes and the subsidiary guarantees thereof (together, the "CCLP Senior Secured Notes Securities") were issued pursuant to an indenture described below. As of March 1, 2019, $350.0 million in aggregate principal amount of the CCLP Senior Secured Notes are outstanding. The CCLP Senior Secured Notes Securities are secured by a first-priority security interest in substantially all of CCLP Senior Secured Notes Obligors' assets (the "Collateral"), subject to certain permitted encumbrances and exceptions.
The CCLP Senior Secured Notes accrue interest at a rate of 7.50% per annum. Interest on the CCLP Senior Secured Notes is payable semi-annually in arrears on April 1 and October 1 of each year. The CCLP Senior Secured Notes are scheduled to mature on April 1, 2025.
49
The CCLP Senior Secured Notes Indenture contains customary covenants restricting CCLP's ability and the ability of its restricted subsidiaries to: (i) pay distributions on, purchase, or redeem CCLP common units or purchase or redeem any subordinated debt; (ii) incur or guarantee additional indebtedness or issue certain kinds of preferred equity securities; (iii) create or incur certain liens securing indebtedness; (iv) sell assets, including dispositions of the Collateral; (v) consolidate, merge, or transfer all or substantially all of CCLP's assets; (vi) enter into transactions with affiliates; and (vii) enter into agreements that restrict distributions or other payments from CCLP's restricted subsidiaries to CCLP. These covenants are subject to a number of important limitations and exceptions, including certain provisions permitting CCLP, subject to the satisfaction of certain conditions, to transfer assets to certain of its unrestricted subsidiaries. Moreover, if the CCLP Senior Secured Notes receive an investment grade rating from at least two rating agencies and no default has occurred and is continuing under the CCLP Senior Secured Notes indenture, many of the restrictive covenants in the CCLP Senior Secured Notes Indenture will be terminated. The CCLP Senior Secured Notes Indenture also contains customary events of default and acceleration provisions relating to events of default, which provide that upon an event of default under the CCLP Senior Secured Notes Indenture, the Trustee or the holders of at least 25% in aggregate principal amount of the then outstanding CCLP Senior Secured Notes may declare all of the CCLP Senior Secured Notes to be due and payable immediately. CCLP is in compliance with all covenants of the CCLP Senior Secured Notes Indenture as of December 31, 2018.
CCLP Senior Notes. The obligations under the CCLP 7.25% Senior Notes (the "CCLP Senior Notes") are jointly and severally and fully and unconditionally, guaranteed on a senior unsecured basis by each of CCLP’s domestic restricted subsidiaries (other than CSI Compressco Finance) that guarantee CCLP’s other indebtedness (the "Guarantors" and together with the Issuers, the "Obligors"). The CCLP Senior Notes and the subsidiary guarantees thereof (together, the "CCLP Senior Note Securities") were issued pursuant to an indenture described below. As of March 1, 2019, $295.9 million in aggregate principal amount of the CCLP Senior Notes are outstanding.
The Obligors issued the CCLP Senior Note Securities pursuant to the Indenture dated as of August 4, 2014 (the "CCLP Senior Notes Indenture") by and among the Obligors and U.S. Bank National Association, as trustee (the "Trustee"). The CCLP Senior Notes accrue interest at a rate of 7.25% per annum. Interest on the CCLP Senior Notes is payable semi-annually in arrears on February 15 and August 15 of each year. The CCLP Senior Notes are scheduled to mature on August 15, 2022.
The CCLP Senior Notes Indenture contains customary covenants restricting CCLP’s ability and the ability of its restricted subsidiaries to: (i) pay dividends and make certain distributions, investments and other restricted payments; (ii) incur additional indebtedness or issue certain preferred shares; (iii) create certain liens; (iv) sell assets; (v) merge, consolidate, sell or otherwise dispose of all or substantially all of its assets; (vi) enter into transactions with affiliates; and (vii) designate its subsidiaries as unrestricted subsidiaries under the CCLP Senior Notes Indenture. The CCLP Senior Notes Indenture also contains customary events of default and acceleration provisions relating to such events of default, which provide that upon an event of default under the CCLP Senior Notes Indenture, the Trustee or the holders of at least 25% in aggregate principal amount of the CCLP Senior Notes then outstanding may declare all amounts owing under the CCLP Senior Notes to be due and payable. CCLP is in compliance with all covenants of the CCLP Senior Note Purchase Agreement as of December 31, 2018.
Other Sources and Uses
In addition to the aforementioned credit facilities and senior notes, we and CCLP fund our respective short-term liquidity requirements from cash generated by our respective operations, leases, and from short-term vendor financing. Should additional capital be required, we believe that we have the ability to raise such capital through the issuance of additional debt or equity securities. However, instability or volatility in the capital markets at the times we need to access capital may affect the cost of capital and the ability to raise capital for an indeterminable length of time.
TETRA's ABL Credit Agreement, matures in September 2023, TETRA's Term Credit Agreement matures in September 2025, the CCLP Senior Notes mature in August 2022, the CCLP Senior Secured Notes mature in April 2025, and the CCLP Credit Agreement matures in June 2023. The replacement of these capital sources on similar or more favorable terms is not certain. If it is necessary to issue additional equity to fund our capital needs, additional dilution to our common stockholders will occur.
50
Although near-term growth plans pursuant to our long-term growth strategy have resumed, they are being reviewed carefully and are subject to our continuing efforts to conserve cash. CCLP has also increased its growth capital expenditure activity in response to increased demand for compression services. CCLP's long-term growth objectives are funded from its available cash, cash provided by operations, financing transactions with TETRA, other borrowings, and cash generated from the issuance of equity or debt securities.
As part of long-term strategic growth plans, we and CCLP evaluate opportunities to acquire businesses and assets. Such acquisitions may be funded with existing cash balances, borrowings under credit facilities, or cash generated from the issuance of equity or debt securities or the issuance of equity securities to the seller.
The Second Amended and Restated Partnership Agreement of CCLP requires that within 45 days after the end of each quarter, CCLP distribute all of its available cash, as defined in the Second Amended and Restated Partnership Agreement, to its unitholders of record on the applicable record date. During the year ended December 31, 2018, CCLP distributed approximately $31.3 million in cash, including approximately $19.2 million to its public unitholders. The amount of quarterly distributions is determined based on a variety of factors, including estimates of CCLP's cash needs to fund its future operating, investing, and debt service requirements. The amount of distributions we receive from CCLP is expected to decrease further in 2019, following CCLP's announcement in December 2018 of a significant reduction in distributions to its common unitholders, including us. There can be no assurance that quarterly distributions from CCLP will increase from this amount per unit going forward.
Off Balance Sheet Arrangements
An “off balance sheet arrangement” is defined as any contractual arrangement to which an entity that is not consolidated with us is a party, under which we have, or in the future may have:
• | any obligation under a guarantee contract that requires initial recognition and measurement under U.S. GAAP; |
• | a retained or contingent interest in assets transferred to an unconsolidated entity or similar arrangement that serves as credit, liquidity, or market risk support to that entity for the transferred assets; |
• | any obligation under certain derivative instruments; or |
• | any obligation under a material variable interest held by us in an unconsolidated entity that provides financing, liquidity, market risk or credit risk support to us, or engages in leasing, hedging, or research and development services with us. |
As of December 31, 2018 and 2017, we had no “off balance sheet arrangements” that may have a current or future material effect on our consolidated financial condition or results of operations. For a discussion of operating leases, including the lease of our corporate headquarters facility, see Note G – "Leases” in the Notes to Consolidated Financial Statements.
Commitments and Contingencies
Litigation
We are named defendants in several lawsuits and respondents in certain governmental proceedings arising in the ordinary course of business. While the outcome of lawsuits or other proceedings against us cannot be predicted with certainty, management does not consider it reasonably possible that a loss resulting from such lawsuits or other proceedings in excess of any amounts accrued has been incurred that is expected to have a material adverse impact on our financial condition, results of operations, or liquidity.
On March 18, 2011, we filed a lawsuit in the Circuit Court of Union County, Arkansas, asserting claims of professional negligence, breach of contract and other claims against the engineering firm we hired for engineering design, equipment, procurement, advisory, testing and startup services for our El Dorado, Arkansas chemical production facility. The engineering firm disputed our claims and promptly filed a motion to compel the matter to arbitration. After a lengthy procedural dispute in Arkansas state court, arbitration proceedings were initiated on November 15, 2013. Ultimately, on December 16, 2016, the arbitration panel ruled in our favor, declared us as the prevailing party, and awarded us a total net amount of $12.8 million. We received full payment of the $12.8 million final award on January 5, 2017.
51
Environmental
One of our subsidiaries, TETRA Micronutrients, Inc. (TMI), previously owned and operated a production facility located in Fairbury, Nebraska. TMI is subject to an Administrative Order on Consent issued to American Microtrace, Inc. (n/k/a/ TETRA Micronutrients, Inc.) in the proceeding styled In the Matter of American Microtrace Corporation, EPA I.D. No. NED00610550, Respondent, Docket No. VII-98-H-0016, dated September 25, 1998 (the Consent Order), with regard to the Fairbury facility. TMI is liable for ongoing environmental monitoring at the Fairbury facility under the Consent Order; however, the current owner of the Fairbury facility is responsible for costs associated with the closure of that facility. While the outcome cannot be predicted with certainty, management does not consider it reasonably possible that a loss in excess of any amounts accrued has been incurred or is expected to have a material adverse impact on our financial condition, results of operations, or liquidity.
Product Purchase Obligations
In the normal course of our Completion Fluids & Products Division operations, we enter into supply agreements with certain manufacturers of various raw materials and finished products. Some of these agreements have terms and conditions that specify a minimum or maximum level of purchases over the term of the agreement. Other agreements require us to purchase the entire output of the raw material or finished product produced by the manufacturer. Our purchase obligations under these agreements apply only with regard to raw materials and finished products that meet specifications set forth in the agreements. We recognize a liability for the purchase of such products at the time we receive them. As of December 31, 2018, the aggregate amount of the fixed and determinable portion of the purchase obligation pursuant to our Completion Fluids & Products Division’s supply agreements was approximately $104.0 million, extending through 2029.
Contingencies of Discontinued Operations
During 2011, in connection with the sale of a significant majority of Maritech's oil and gas producing properties, the buyers of the properties assumed the associated decommissioning liabilities pursuant to the purchase and sale agreements. To the extent that a buyer of these properties fails to perform the abandonment and decommissioning work required, a previous owner, including Maritech, may be required to perform the abandonment and decommissioning obligation. As the former parent company of Maritech, we also may be responsible for performing these abandonment and decommissioning obligations. In March 2018, we closed the Maritech Asset Purchase Agreement with Orinoco that provided for the purchase by Orinoco of the Maritech Properties. Also in March 2018, we finalized the Maritech Equity Purchase Agreement with Orinoco that provided for the purchase by Orinoco of the Maritech Equity Interests. As a result of these transactions, we have effectively exited the businesses of our Maritech segment and Orinoco assumed all of Maritech's remaining abandonment and decommissioning obligations. For further discussion, see Note E - "Acquisitions and Dispositions," in the Notes to Consolidated Financial Statements.
52
Contractual Obligations
The table below summarizes our consolidated contractual cash obligations as of December 31, 2018:
Payments Due | ||||||||||||||||||||||||||||
Total | 2019 | 2020 | 2021 | 2022 | 2023 | Thereafter | ||||||||||||||||||||||
(In Thousands) | ||||||||||||||||||||||||||||
Long-term debt - TETRA | $ | 200,000 | $ | — | $ | — | $ | — | $ | — | $ | — | $ | 200,000 | ||||||||||||||
Long-term debt - CCLP | 645,930 | — | — | — | 295,930 | — | 350,000 | |||||||||||||||||||||
Interest on debt - TETRA | 109,505 | 16,223 | 16,223 | 16,223 | 16,223 | 16,223 | 28,390 | |||||||||||||||||||||
Interest on debt - CCLP | 242,134 | 47,542 | 47,542 | 47,542 | 40,445 | 26,250 | 32,813 | |||||||||||||||||||||
Purchase obligations | 104,000 | 9,500 | 9,500 | 9,500 | 9,500 | 9,500 | 56,500 | |||||||||||||||||||||
Asset retirement obligations(1) | 12,202 | — | — | — | — | — | 12,202 | |||||||||||||||||||||
Operating and capital leases | 88,685 | 18,654 | 15,982 | 10,483 | 8,410 | 7,441 | 27,715 | |||||||||||||||||||||
Total contractual cash obligations(2) | $ | 1,402,456 | $ | 91,919 | $ | 89,247 | $ | 83,748 | $ | 370,508 | $ | 59,414 | $ | 707,620 | ||||||||||||||
(1) | We have estimated the timing of these payments for asset retirement obligation liabilities based upon our plans. The amounts shown represent the discounted obligation as of December 31, 2018. |
(2) | Amounts exclude other long-term liabilities reflected in our Consolidated Balance Sheet that do not have known payment streams. These excluded amounts include approximately $0.8 million of liabilities under FASB Codification Topic 740, “Accounting for Uncertainty in Income Taxes,” as we are unable to reasonably estimate the ultimate amount or timing of settlements. See Note H – "Income Taxes” in the Notes to Consolidated Financial Statements for further discussion. These excluded amounts also include approximately $27.0 million of liabilities related to the CCLP Series A Convertible Preferred Units. The CCLP Preferred Units are expected to be serviced with non-cash paid-in-kind distributions, and may be satisfied either through conversions to CCLP common units or redemptions for cash, at CCLP's election. See Note K – "CCLP Series A Convertible Preferred Units," in the Notes to Consolidated Financial Statements for further discussion. |
New Accounting Pronouncements
For a discussion of new accounting pronouncements that may affect our consolidated financial statements, see Note B – "Summary of Significant Accounting Policies, New Accounting Pronouncements," in the Notes to Consolidated Financial Statements.
Item 7A. Quantitative and Qualitative Disclosures about Market Risk.
Interest Rate Risk
As of December 31, 2018, we had no outstanding balance on our ABL Credit Agreement, and CCLP had no balance outstanding under the CCLP Credit Agreement. As of December 31, 2018, we had a balance outstanding, net of associated deferred financing costs, under the Term Credit Agreement of $182.5 million. Each of these borrowings bears interest at an agreed-upon percentage rate spread above LIBOR, and is therefore subject to market risk exposure related to changes in applicable interest rates.
The following table sets forth as of December 31, 2018, our principal cash flows for our and CCLP's long-term debt obligations and weighted average effective interest rates by their expected maturity dates. Neither we nor CCLP is a party to an interest rate swap contract or other derivative instrument designed to hedge our or their exposure to interest rate fluctuation risk.
Expected Maturity Date | Fair Market Value | |||||||||||||||||||||||||||||||
($ amounts in thousands) | 2019 | 2020 | 2021 | 2022 | 2023 | Thereafter | Total | |||||||||||||||||||||||||
December 31, 2018 | ||||||||||||||||||||||||||||||||
Long-term debt: | ||||||||||||||||||||||||||||||||
U.S. dollar variable rate - TETRA | $ | — | $ | — | $ | — | $ | — | $ | — | $ | 200,000 | $ | 200,000 | $ | 200,000 | ||||||||||||||||
Weighted average interest rate (variable) | — | % | — | % | — | % | — | % | — | % | 8.40 | % | ||||||||||||||||||||
U.S. dollar fixed rate - CCLP | $ | — | $ | — | $ | — | $295,930 | $ | — | $ | 350,000 | $ | 645,930 | $ | 598,800 | |||||||||||||||||
Weighted average interest rate (fixed) | — | % | — | % | — | % | 7.25 | % | — | % | 7.50 | % | ||||||||||||||||||||
53
Exchange Rate Risk
We are exposed to financial and market risks that affect our businesses. We also have currency exchange rate risk exposure related to revenues, expenses, operating receivables, and payables denominated in foreign currencies. We and CCLP enter into short term foreign currency forward derivative contracts as part of a program designed to mitigate the currency exchange rate risk exposure on selected transactions of certain foreign subsidiaries. As of December 31, 2018, we and CCLP had the following foreign currency derivative contracts outstanding relating to a portion of our foreign operations:
Derivative Contracts | U.S. Dollar Notional Amount | Traded Exchange Rate | Settlement Date | |||||
(In Thousands) | ||||||||
Forward purchase euro | $ | 3,571 | 1.18 | 3/15/2019 | ||||
Forward purchase euro | 3,585 | 1.18 | 3/15/2019 | |||||
Forward sale euro | 1,930 | 1.14 | 1/17/2019 | |||||
Forward purchase pounds sterling | 948 | 1.26 | 1/17/2019 | |||||
Forward sale Canadian dollar | 5,942 | 1.35 | 1/17/2019 | |||||
Forward purchase Mexican peso | 1,086 | 20.25 | 1/17/2019 | |||||
Forward sale Norwegian krone | 975 | 8.72 | 1/17/2019 | |||||
Forward sale Mexican peso | 4,783 | 20.07 | 1/17/2019 | |||||
Derivative Contracts | British Pound Notional Amount | Traded Exchange Rate | Settlement Date | ||||
(In Thousands) | |||||||
Forward purchase euro | 1,173 | .90 | 1/17/2019 | ||||
Under this program, we and CCLP may enter into similar derivative contracts from time to time. Although contracts pursuant to this program will serve as an economic hedge of the cash flow of our currency exchange risk exposure, they will not be formally designated as hedge contracts or qualify for hedge accounting treatment. Accordingly, any change in the fair value of these derivative instruments during a period will be included in the determination of earnings for that period.
The fair value of foreign currency derivative instruments are based on quoted market values. The fair values of our foreign currency derivative instruments as of December 31, 2018, are as follows:
Foreign currency derivative instruments | Balance Sheet Location | Fair Value at December 31, 2018 | ||||
(In Thousands) | ||||||
Forward purchase contracts | Current assets | $ | 41 | |||
Forward sale contracts | Current assets | 76 | ||||
Forward sale contracts | Current liabilities | (126 | ) | |||
Forward purchase contracts | Current liabilities | (168 | ) | |||
Total | $ | (177 | ) | |||
Based on the derivative contracts that were in place as of December 31, 2018, a five percent devaluation of the euro compared to the British pound sterling would result in an increase in the market value of our forward purchase contract of $0.1 million. A five percent devaluation of the euro compared to the U.S. dollar would result in an increase in the market value of our forward purchase contract of $0.4 million. A five percent devaluation of the British pound sterling compared to the U.S. dollar would result in an increase in the market value of our forward purchase contract of $0.05 million. A five percent devaluation of the Mexican peso compared to the U.S. dollar would result in a decrease in the market value of our forward purchase contract of $0.1 million. A five percent
54
devaluation of the euro compared to the U.S. dollar would result in an increase in the market value of our forward sale contract of $0.1 million. A five percent devaluation of the Canadian dollar compared to the U.S. dollar would result in a decrease in the market value of our forward purchase contract of $0.3 million. A five percent devaluation of the Norwegian krone compared to the U.S. dollar would result in a decrease in the market value of our forward sale contract of $0.05 million. A five percent devaluation of the Mexican peso compared to the U.S. dollar would result in a decrease in the market value of our forward sale contracts of $0.2 million.
Commodity Price Risk
Prior to the disposal of Maritech in March 2018, we were exposed to the commodity price risk associated with Maritech’s oil and natural gas production on its remaining properties. Due to the minimal amount of production, such commodity price risk exposure was not significant. Following the disposal of Maritech in March 2018, we are no longer exposed to such commodity price risks.
Item 8. Financial Statements and Supplementary Data.
Our financial statements and supplementary data for us and our subsidiaries required to be included in this Item 8 are set forth in Item 15 of this Report.
Item 9. Changes in and Disagreements with Accountants on Accounting and Financial Disclosure.
None.
Item 9A. Controls and Procedures.
Conclusion Regarding the Effectiveness of Disclosure Controls and Procedures
Under the supervision and with the participation of our management, including our Chief Executive Officer and Chief Financial Officer, we conducted an evaluation of our disclosure controls and procedures, as such term is defined under Rule 13a-15(e) promulgated under the Securities Exchange Act of 1934, as amended (the "Exchange Act") as of the end of the period covered by this report. Based on this evaluation, our Chief Executive Officer and Chief Financial Officer concluded that our disclosure controls and procedures were effective as of December 31, 2018.
Management’s Report on Internal Control over Financial Reporting
Our management is responsible for establishing and maintaining adequate internal control over financial reporting, as such term is defined in Exchange Act Rule 13a-15(f). Our Internal control over financial reporting is a process to provide reasonable assurance regarding the reliability of our financial reporting for external purposes in accordance with accounting principles generally accepted in the United States of America.
Our internal control over financial reporting includes those policies and procedures that (1) pertain to the maintenance of records that in reasonable detail accurately and fairly reflect the transactions and dispositions of our assets; (2) provide reasonable assurance that transactions are recorded as necessary to permit preparation of financial statements in accordance with generally accepted accounting principles, and that receipts and expenditures are being made only in accordance with authorizations of our management and directors; and (3) provide reasonable assurance regarding prevention or timely detection of unauthorized acquisition, use or disposition of our assets that could have a material effect on the financial statements.
Because of its inherent limitations, internal control over financial reporting may not prevent or detect misstatements. In addition, projections of any evaluation of effectiveness to future periods are subject to the risk that controls may become inadequate because of changes in conditions, or that the degree of compliance with the policies or procedures may deteriorate.
Under the supervision and with the participation of management, including our Chief Executive Officer and Chief Financial Officer, an evaluation of the effectiveness of our internal control over financial reporting as of December 31, 2018, was conducted based on the framework in Internal Control – Integrated Framework issued by the Committee of Sponsoring Organizations of the Treadway Commission (2013 framework) ("COSO"). Based on
55
this assessment, management has determined that our internal control over financial reporting was effective as of December 31, 2018.
On February 28, 2018, pursuant to a purchase agreement dated February 13, 2018, we purchased all of the equity interests in SwiftWater Energy Services, LLC ("SwiftWater"), which is engaged in the business of providing water management and water solutions to oil and gas operators in the Permian Basin market of Texas. Also, on December 6, 2018, we purchased JRGO Energy Services LLC ("JRGO"), which specializes in delivering comprehensive water management services in the Appalachian region. We are currently finalizing the integration of SwiftWater and JRGO into our internal control over financial reporting processes. In executing this integration, we are analyzing, evaluating, and, where necessary, making changes in controls and procedures related to the SwiftWater and JRGO businesses. In accordance with SEC Staff guidance permitting the exclusion of an acquired business from management’s assessment of the effectiveness of internal control over financial reporting for the year in which the acquisition is completed, we have excluded SwiftWater and JRGO from our assessment of the effectiveness of internal control over financial reporting as of December 31, 2018. SwiftWater represented 7.5%of the total consolidated assets as of December 31, 2018 and an estimated 9.6% of the total consolidated revenues for the year ended December 31, 2018. JRGO represented less than 1.0% of the total consolidated assets and total consolidated revenues as of December 31, 2018 and for the year ended December 31, 2018, respectively. The scope of management’s evaluation of the effectiveness of the design and operations of our disclosure controls and procedures includes all consolidated operations with the exception of those specifically supporting the financial reporting of the SwiftWater and JRGO acquisitions.
Ernst & Young LLP, our independent registered public accounting firm, has issued an attestation report on the effectiveness of our internal control over financial reporting as of December 31, 2018. Ernst & Young LLP's report on our internal control over financial reporting is included herein.
Changes in Internal Control over Financial Reporting
There were no changes in our internal control over financial reporting that occurred during the fourth quarter of the fiscal year ended December 31, 2018, that have materially affected, or are reasonably likely to materially affect, our internal control over financial reporting.
56
REPORT OF INDEPENDENT REGISTERED PUBLIC ACCOUNTING FIRM
Board of Directors and Stockholders of
TETRA Technologies, Inc. and Subsidiaries
Opinion on Internal Control over Financial Reporting
We have audited TETRA Technologies, Inc. and subsidiaries’ internal control over financial reporting as of December 31, 2018, based on criteria established in Internal Control-Integrated Framework issued by the Committee of Sponsoring Organizations of the Treadway Commission (2013 Framework) (the COSO criteria). In our opinion, TETRA Technologies, Inc. (the Company) maintained, in all material respects, effective internal control over financial reporting as of December 31, 2018, based on the COSO criteria.
As indicated in the accompanying Management’s Report on Internal Control over Financial Reporting, management’s assessment of and conclusion on the effectiveness of internal control over financial reporting did not include the internal controls of SwiftWater Energy Services, LLC ("SwiftWater") and JRGO Energy Services LLC ("JRGO"), which are included in the 2018 consolidated financial statements of the Company. SwiftWater constituted 7.5% of total consolidated assets and 9.6% of total consolidated revenues as of and for the year ended December 31, 2018, respectively. JRGO constituted less than 1.0% of total consolidated assets and total consolidated revenues as of and for the year ended December 31, 2018, respectively. Our audit of internal control over financial reporting of the Company also did not include an evaluation of the internal control over financial reporting of Swiftwater and JRGO.
We also have audited, in accordance with the standards of the Public Company Accounting Oversight Board (United States) (PCAOB), the 2018 consolidated financial statements of the Company and our report dated March 4, 2019, expressed an unqualified opinion thereon.
Basis for Opinion
The Company's management is responsible for maintaining effective internal control over financial reporting, and for its assessment of the effectiveness of internal control over financial reporting included in the accompanying “Management’s Report on Internal Control Over Financial Reporting.” Our responsibility is to express an opinion on the Company’s internal control over financial reporting based on our audit. We are a public accounting firm registered with the PCAOB and are required to be independent with respect to the Company in accordance with the U.S. federal securities laws and the applicable rules and regulations of the Securities and Exchange Commission and the PCAOB.
We conducted our audit in accordance with the standards of the PCAOB. Those standards require that we plan and perform the audit to obtain reasonable assurance about whether effective internal control over financial reporting was maintained in all material respects.
Our audit included obtaining an understanding of internal control over financial reporting, assessing the risk that a material weakness exists, testing and evaluating the design and operating effectiveness of internal control based on the assessed risk, and performing such other procedures as we considered necessary in the circumstances. We believe that our audit provides a reasonable basis for our opinion.
Definition and Limitations of Internal Control Over Financial Reporting
A company’s internal control over financial reporting is a process designed to provide reasonable assurance regarding the reliability of financial reporting and the preparation of financial statements for external purposes in accordance with generally accepted accounting principles. A company’s internal control over financial reporting includes those policies and procedures that (1) pertain to the maintenance of records that, in reasonable detail, accurately and fairly reflect the transactions and dispositions of the assets of the company; (2) provide reasonable assurance that transactions are recorded as necessary to permit preparation of financial statements in accordance with generally accepted accounting principles, and that receipts and expenditures of the company are being made only in accordance with authorizations of management and directors of the company; and (3) provide reasonable assurance regarding prevention or timely detection of unauthorized acquisition, use, or disposition of the company’s assets that could have a material effect on the financial statements.
Because of its inherent limitations, internal control over financial reporting may not prevent or detect misstatements. Also, projections of any evaluation of effectiveness to future periods are subject to the risk that controls may
57
become inadequate because of changes in conditions, or that the degree of compliance with the policies or procedures may deteriorate.
/s/ERNST & YOUNG LLP
Houston, Texas
March 4, 2019
Item 9B. Other Information.
None.
58
PART III
Item 10. Directors, Executive Officers, and Corporate Governance.
The information required by this Item is hereby incorporated by reference from the information appearing under the captions “Proposal No. 1: Election of Directors,” “Executive Officers,” “Corporate Governance,” “Board Meetings and Committees,” and “Section 16(a) Beneficial Ownership Reporting Compliance” in our definitive proxy statement (the "Proxy Statement") for the annual meeting of stockholders to be held on May 3, 2019, which involves the election of directors and is to be filed with the SEC pursuant to the Securities Exchange Act of 1934 as amended (the "Exchange Act") within 120 days of the end of our fiscal year on December 31, 2018.
Item 11. Executive Compensation.
The information required by this Item is hereby incorporated by reference from the information appearing under the captions “Management and Compensation Committee Report,” “Management and Compensation Committee Interlocks and Insider Participation,” “Compensation Discussion and Analysis,” “Compensation of Executive Officers,” and “Director Compensation” in our Proxy Statement. Notwithstanding the foregoing, in accordance with the instructions to Item 407 of Regulation S-K, the information contained in our Proxy Statement under the subheading “Management and Compensation Committee Report” shall be deemed furnished, and not filed, in this Form 10-K, and shall not be deemed incorporated by reference into any filing under the Securities Act of 1933, or the Exchange Act, as a result of this furnishing, except to the extent we specifically incorporate it by reference.
Item 12. Security Ownership of Certain Beneficial Owners and Management and Related Stockholder Matters.
The information required by this Item is hereby incorporated by reference from the information appearing under the captions “Beneficial Stock Ownership of Certain Stockholders and Management” and “Equity Compensation Plan Information” in our Proxy Statement.
Item 13. Certain Relationships and Related Transactions, and Director Independence.
The information required by this Item is hereby incorporated by reference from the information appearing under the captions “Certain Transactions” and “Director Independence” in our Proxy Statement.
Item 14. Principal Accounting Fees and Services.
The information required by this Item is hereby incorporated by reference from the information appearing under the caption “Fees Paid to Principal Accounting Firm” in our Proxy Statement.
59
PART IV
Item 15. Exhibits and Financial Statement Schedules.
(a) List of documents filed as part of this Report
1. | Financial Statements of the Company | |
Page | ||
F-1 | ||
Consolidated Balance Sheets at December 31, 2018 and 2017 | F-2 | |
F-4 | ||
F-5 | ||
F-6 | ||
F-7 | ||
F-8 | ||
2. | Financial statement schedules | |
All other schedules for which provision is made in the applicable accounting regulation of the Securities and Exchange Commission are not required under the related instructions or are inapplicable and therefore have been omitted. | ||
3. | List of Exhibits | |
2.1 | |
2.2 | |
2.3 | |
2.4 | |
3.1 | |
3.2 | |
3.3 | |
4.1 | |
4.2 | |
4.3 | |
4.4 | |
4.5 | |
60
4.6 | |
4.7 | |
10.1*** | |
10.2*** | |
10.3*** | |
10.4*** | |
10.5*** | |
10.6*** | |
10.7*** | |
10.8*** | |
10.9*** | |
10.10*** | |
10.11*** | |
10.12*** | |
10.13 | |
10.14 | |
10.15*** | |
61
10.16*** | |
10.17*** | |
10.18 | |
10.19*** | |
10.20*** | |
10.21*** | |
10.22 | |
10.23 | |
10.24 | |
10.25 | |
10.26 | |
10.27 | |
10.28*** | |
10.29*** | |
10.30*** | |
10.31*** | |
10.32 | |
62
10.33 | |
10.34*** | |
10.35*** | |
10.36*** | |
10.37*** | |
10.38*** | |
10.39*** | |
10.40*** | |
10.41*** | |
10.42*** | |
10.43*** | |
10.44+ | |
10.45 | |
10.46 | |
10.47 | |
10.48 | |
10.49 | |
10.50 | |
10.51 | |
10.52 | |
10.53 | |
63
21+ | |
23.1+ | |
31.1+ | |
31.2+ | |
32.1** | |
32.2** | |
101.INS++ | XBRL Instance Document. |
101.SCH++ | XBRL Taxonomy Extension Schema Document. |
101.CAL++ | XBRL Taxonomy Extension Calculation Linkbase Document. |
101.LAB++ | XBRL Taxonomy Extension Label Linkbase Document. |
101.PRE++ | XBRL Taxonomy Extension Presentation Linkbase Document. |
101.DEF++ | XBRL Taxonomy Extension Definition Linkbase Document. |
+ | Filed with this report |
** | Furnished with this report. |
*** | Management contract or compensatory plan or arrangement. |
++ | Attached as Exhibit 101 to this report are the following documents formatted in XBRL (Extensible Business Reporting Language): (i) Consolidated Statements of Operations for the years ended December 31, 2018, 2017 and 2016; (ii) Consolidated Balance Sheets as of December 31, 2018 and December 31, 2017; (iii) Consolidated Statements of Comprehensive Income for the years ended December 31, 2018, 2017 and 2016; (iv) Consolidated Statements of Cash Flows for the years ended December 31, 2018, 2017 and 2016; (v) Consolidated Statements of Stockholders’ Equity for the years ended December 31, 2018, 2017 and 2016; and (vi) Notes to Consolidated Financial Statements for the year ended December 31, 2018. |
64
Item 16. Form 10-K Summary.
None.
SIGNATURES
Pursuant to the requirements of Section 13 or 15(d) of the Securities Exchange Act of 1934, TETRA Technologies, Inc. has duly caused this report to be signed on its behalf by the undersigned, thereunto duly authorized.
TETRA Technologies, Inc. | |||
Date: | March 4, 2019 | By: | /s/Stuart M. Brightman |
Stuart M. Brightman, Chief Executive Officer | |||
Pursuant to the requirements of the Securities Exchange Act of 1934, this report has been signed below by the following persons on behalf of the Registrant and in the capacities and on the dates indicated:
Signature | Title | Date |
/s/William D. Sullivan | Chairman of | March 4, 2019 |
William D. Sullivan | the Board of Directors | |
/s/Stuart M. Brightman | Chief Executive Officer | March 4, 2019 |
Stuart M. Brightman | and Director | |
(Principal Executive Officer) | ||
/s/Elijio V. Serrano | Senior Vice President, | March 4, 2019 |
Elijio V. Serrano | Chief Financial Officer | |
(Principal Financial Officer), | ||
and Principal Accounting Officer | ||
/s/Mark E. Baldwin | Director | March 4, 2019 |
Mark E. Baldwin | ||
/s/Thomas R. Bates, Jr. | Director | March 4, 2019 |
Thomas R. Bates, Jr. | ||
/s/Paul D. Coombs | Director | March 4, 2019 |
Paul D. Coombs | ||
/s/John F. Glick | Director | March 4, 2019 |
John F. Glick | ||
/s/Gina A. Luna | Director | March 4, 2019 |
Gina A. Luna | ||
/s/Brady M. Murphy | Chief Operating Officer | March 4, 2019 |
Brady M. Murphy | and Director | |
/s/Joseph C. Winkler III | Director | March 4, 2019 |
Joseph C. Winkler III | ||
65
REPORT OF INDEPENDENT REGISTERED PUBLIC ACCOUNTING FIRM
Board of Directors and Stockholders of
TETRA Technologies, Inc. and Subsidiaries
Opinion on the Financial Statements
We have audited the accompanying consolidated balance sheets of TETRA Technologies, Inc. and subsidiaries (the Company) as of December 31, 2018 and 2017, and the related consolidated statements of operations, comprehensive income (loss), equity, and cash flows for each of the three years in the period ended December 31, 2018, and the related notes (collectively referred to as the “consolidated financial statements”). In our opinion, the consolidated financial statements present fairly, in all material respects, the financial position of the Company at December 31, 2018 and 2017, and the results of its operations and its cash flows for each of the three years in the period ended December 31, 2018, in conformity with U.S. generally accepted accounting principles.
We also have audited, in accordance with the standards of the Public Company Accounting Oversight Board (United States) (PCAOB), the Company's internal control over financial reporting as of December 31, 2018, based on criteria established in Internal Control - Integrated Framework issued by the Committee of Sponsoring Organizations of the Treadway Commission (2013 Framework) and our report dated March 4, 2019, expressed an unqualified opinion thereon.
Basis for Opinion
These financial statements are the responsibility of the Company’s management. Our responsibility is to express an opinion on the Company’s financial statements based on our audits. We are a public accounting firm registered with the PCAOB and are required to be independent with respect to the Company in accordance with the U.S. federal securities laws and the applicable rules and regulations of the Securities and Exchange Commission and the PCAOB.
We conducted our audits in accordance with the standards of the PCAOB. Those standards require that we plan and perform the audit to obtain reasonable assurance about whether the financial statements are free of material misstatement, whether due to error or fraud. Our audits included performing procedures to assess the risks of material misstatement of the financial statements, whether due to error or fraud, and performing procedures that respond to those risks. Such procedures include examining, on a test basis, evidence regarding the amounts and disclosures in the financial statements. Our audits also included evaluating the accounting principles used and significant estimates made by management, as well as evaluating the overall presentation of the financial statements. We believe that our audits provide a reasonable basis for our opinion.
/s/ERNST & YOUNG LLP
We have served as the Company's auditor since 1981.
Houston, Texas
March 4, 2019
F-1
TETRA Technologies, Inc. and Subsidiaries
Consolidated Balance Sheets
(In Thousands)
December 31, 2018 | December 31, 2017 | |||||||
ASSETS | ||||||||
Current assets: | ||||||||
Cash and cash equivalents | $ | 40,038 | $ | 26,128 | ||||
Restricted cash | 64 | 261 | ||||||
Trade accounts receivable, net of allowances of $2,583 in 2018 and $1,286 in 2017 | 187,592 | 144,051 | ||||||
Inventories | 143,571 | 115,438 | ||||||
Assets of discontinued operations | 1,354 | 34,879 | ||||||
Note receivable, including accrued interest | 7,544 | — | ||||||
Prepaid expenses and other current assets | 20,528 | 17,597 | ||||||
Total current assets | 400,691 | 338,354 | ||||||
Property, plant, and equipment: | ||||||||
Land and building | 78,746 | 78,559 | ||||||
Machinery and equipment | 1,265,732 | 1,167,680 | ||||||
Automobiles and trucks | 35,568 | 34,744 | ||||||
Chemical plants | 188,641 | 186,790 | ||||||
Construction in progress | 44,419 | 31,566 | ||||||
Total property, plant, and equipment | 1,613,106 | 1,499,339 | ||||||
Less accumulated depreciation | (759,175 | ) | (689,907 | ) | ||||
Net property, plant, and equipment | 853,931 | 809,432 | ||||||
Other assets: | ||||||||
Goodwill | 25,859 | 6,636 | ||||||
Patents, trademarks and other intangible assets, net of accumulated amortization of $80,401 in 2018 and $71,114 in 2017 | 82,184 | 47,405 | ||||||
Deferred tax assets | 13 | 10 | ||||||
Long-term assets of discontinued operations | — | 86,255 | ||||||
Other assets | 22,849 | 20,522 | ||||||
Total other assets | 130,905 | 160,828 | ||||||
Total assets | $ | 1,385,527 | $ | 1,308,614 | ||||
See Notes to Consolidated Financial Statements
F-2
TETRA Technologies, Inc. and Subsidiaries
Consolidated Balance Sheets
(In Thousands, Except Share Amounts)
December 31, 2018 | December 31, 2017 | |||||||
LIABILITIES AND EQUITY | ||||||||
Current liabilities: | ||||||||
Trade accounts payable | $ | 80,279 | $ | 70,847 | ||||
Unearned Income | 26,695 | 18,701 | ||||||
Accrued liabilities | 89,232 | 58,478 | ||||||
Liabilities of discontinued operations | 4,145 | 25,688 | ||||||
Total current liabilities | 200,351 | 173,714 | ||||||
Long-term debt, net | 815,560 | 629,855 | ||||||
Deferred income taxes | 3,242 | 4,404 | ||||||
Asset retirement obligations | 12,202 | 11,738 | ||||||
CCLP Series A Preferred Units | 27,019 | 61,436 | ||||||
Warrants liability | 2,073 | 13,202 | ||||||
Long-term liabilities of discontinued operations | — | 48,225 | ||||||
Other liabilities | 12,331 | 13,479 | ||||||
Total long-term liabilities | 872,427 | 782,339 | ||||||
Commitments and contingencies | ||||||||
Equity: | ||||||||
TETRA stockholders' equity: | ||||||||
Common stock, par value $0.01 per share; 250,000,000 shares authorized at December 31, 2018 and December 31, 2017; 128,455,134 shares issued at December 31, 2018, and 118,515,797 shares issued at December 31, 2017 | 1,285 | 1,185 | ||||||
Additional paid-in capital | 460,680 | 425,648 | ||||||
Treasury stock, at cost; 2,717,569 shares held at December 31, 2018, and 2,638,093 shares held at December 31, 2017 | (18,950 | ) | (18,651 | ) | ||||
Accumulated other comprehensive income (loss) | (51,663 | ) | (43,767 | ) | ||||
Retained deficit | (217,952 | ) | (156,335 | ) | ||||
Total TETRA stockholders' equity | 173,400 | 208,080 | ||||||
Noncontrolling interests | 139,349 | 144,481 | ||||||
Total equity | 312,749 | 352,561 | ||||||
Total liabilities and equity | $ | 1,385,527 | $ | 1,308,614 | ||||
See Notes to Consolidated Financial Statements
F-3
TETRA Technologies, Inc. and Subsidiaries
Consolidated Statements of Operations
(In Thousands, Except Per Share Amounts)
Year Ended December 31, | ||||||||||||
2018 | 2017 | 2016 | ||||||||||
Revenues: | ||||||||||||
Product sales | $ | 409,227 | $ | 305,404 | $ | 248,691 | ||||||
Services | 589,548 | 417,694 | 368,700 | |||||||||
Total revenues | 998,775 | 723,098 | 617,391 | |||||||||
Cost of revenues: | ||||||||||||
Cost of product sales | 327,553 | 223,504 | 193,966 | |||||||||
Cost of services | 390,378 | 274,627 | 228,345 | |||||||||
Depreciation, amortization, and accretion | 114,925 | 104,053 | 117,147 | |||||||||
Impairments and other charges | 3,621 | 14,876 | 17,094 | |||||||||
Insurance recoveries | — | (2,352 | ) | — | ||||||||
Total cost of revenues | 836,477 | 614,708 | 556,552 | |||||||||
Gross profit | 162,298 | 108,390 | 60,839 | |||||||||
General and administrative expense | 132,446 | 115,414 | 108,422 | |||||||||
Goodwill impairment | — | — | 106,205 | |||||||||
Interest expense, net | 70,946 | 57,246 | 58,614 | |||||||||
Warrants fair value adjustment (income) expense | (11,129 | ) | (5,301 | ) | 2,106 | |||||||
CCLP Series A Preferred fair value adjustment (income) expense | (733 | ) | (2,975 | ) | 4,404 | |||||||
Litigation arbitration award income | — | (12,816 | ) | — | ||||||||
Other (income) expense, net | 7,194 | 865 | 4,308 | |||||||||
Loss before taxes and discontinued operations | (36,426 | ) | (44,043 | ) | (223,220 | ) | ||||||
Provision for income taxes | 6,299 | 751 | 2,156 | |||||||||
Loss before discontinued operations | (42,725 | ) | (44,794 | ) | (225,376 | ) | ||||||
Discontinued operations: | ||||||||||||
Loss from discontinued operations, net of taxes | (41,515 | ) | (17,389 | ) | (14,017 | ) | ||||||
Net loss | (84,240 | ) | (62,183 | ) | (239,393 | ) | ||||||
Less: loss attributable to noncontrolling interest | 22,623 | 23,135 | 77,931 | |||||||||
Net loss attributable to TETRA stockholders | $ | (61,617 | ) | $ | (39,048 | ) | $ | (161,462 | ) | |||
Basic net loss per common share: | ||||||||||||
Loss before discontinued operations attributable to TETRA stockholders | $ | (0.16 | ) | $ | (0.19 | ) | $ | (1.69 | ) | |||
Loss from discontinued operations attributable to TETRA stockholders | (0.34 | ) | (0.15 | ) | (0.16 | ) | ||||||
Net loss attributable to TETRA stockholders | $ | (0.50 | ) | $ | (0.34 | ) | $ | (1.85 | ) | |||
Average shares outstanding | 124,101 | 114,499 | 87,286 | |||||||||
Diluted net loss per common share: | ||||||||||||
Loss before discontinued operations attributable to TETRA stockholders | $ | (0.16 | ) | $ | (0.19 | ) | $ | (1.69 | ) | |||
Loss from discontinued operations attributable to TETRA stockholders | $ | (0.34 | ) | $ | (0.15 | ) | $ | (0.16 | ) | |||
Net loss attributable to TETRA stockholders | $ | (0.50 | ) | $ | (0.34 | ) | $ | (1.85 | ) | |||
Average diluted shares outstanding | 124,101 | 114,499 | 87,286 | |||||||||
See Notes to Consolidated Financial Statements
F-4
TETRA Technologies, Inc. and Subsidiaries
Consolidated Statements of Comprehensive Income (Loss)
(In Thousands)
Year Ended December 31, | ||||||||||||
2018 | 2017 | 2016 | ||||||||||
Net loss | $ | (84,240 | ) | $ | (62,183 | ) | $ | (239,393 | ) | |||
Foreign currency translation gain (loss), net of taxes of $0 in 2018, $0 in 2017, and $0 in 2016 | (10,084 | ) | 6,894 | (9,286 | ) | |||||||
Comprehensive loss | (94,324 | ) | (55,289 | ) | (248,679 | ) | ||||||
Less: comprehensive loss attributable to noncontrolling interest | 24,811 | 23,759 | 79,067 | |||||||||
Comprehensive loss attributable to TETRA stockholders | $ | (69,513 | ) | $ | (31,530 | ) | $ | (169,612 | ) | |||
See Notes to Consolidated Financial Statements
F-5
TETRA Technologies, Inc. and Subsidiaries
Consolidated Statements of Equity
(In Thousands)
Common Stock Par Value | Additional Paid-In Capital | Treasury Stock | Accumulated Other Comprehensive Income (Loss) | Retained Earnings | Noncontrolling Interest | Total Equity | |||||||||||||||||||||
Currency Translation | |||||||||||||||||||||||||||
Balance at December 31, 2015 | $ | 826 | $ | 256,188 | $ | (16,837 | ) | $ | (43,135 | ) | $ | 44,175 | $ | 272,963 | $ | 514,180 | |||||||||||
Net loss for 2016 | (161,462 | ) | (77,931 | ) | (239,393 | ) | |||||||||||||||||||||
Translation adjustment, net of taxes of $0 | (8,150 | ) | (1,136 | ) | (9,286 | ) | |||||||||||||||||||||
Comprehensive loss | (248,679 | ) | |||||||||||||||||||||||||
Distributions to public unitholders | (28,957 | ) | (28,957 | ) | |||||||||||||||||||||||
Equity award activity | 11 | 10 | 21 | ||||||||||||||||||||||||
Treasury stock activity, net | (1,479 | ) | (1,479 | ) | |||||||||||||||||||||||
Proceeds from the issuance of stock, net of offering costs | 338 | 152,319 | 152,657 | ||||||||||||||||||||||||
Equity compensation expense | 10,719 | 2,198 | 12,917 | ||||||||||||||||||||||||
Other | (194 | ) | (194 | ) | |||||||||||||||||||||||
Balance at December 31, 2016 | $ | 1,175 | $ | 419,236 | $ | (18,316 | ) | $ | (51,285 | ) | $ | (117,287 | ) | $ | 166,943 | $ | 400,466 | ||||||||||
Net loss for 2017 | (39,048 | ) | (23,135 | ) | (62,183 | ) | |||||||||||||||||||||
Translation adjustment, net of taxes of $0 | 7,518 | (624 | ) | 6,894 | |||||||||||||||||||||||
Comprehensive loss | (55,289 | ) | |||||||||||||||||||||||||
Distributions to public unitholders | (18,826 | ) | (18,826 | ) | |||||||||||||||||||||||
Equity award activity | 10 | 10 | |||||||||||||||||||||||||
Treasury stock activity, net | (335 | ) | (335 | ) | |||||||||||||||||||||||
Equity compensation expense | 6,412 | 862 | 7,274 | ||||||||||||||||||||||||
Conversions of CCLP Series A Preferred | 19,978 | 19,978 | |||||||||||||||||||||||||
Other | (717 | ) | (717 | ) | |||||||||||||||||||||||
Balance at December 31, 2017 | $ | 1,185 | $ | 425,648 | $ | (18,651 | ) | $ | (43,767 | ) | $ | (156,335 | ) | $ | 144,481 | $ | 352,561 | ||||||||||
Net loss for 2018 | (61,617 | ) | (22,623 | ) | (84,240 | ) | |||||||||||||||||||||
Translation adjustment, net of taxes of $0 | (7,896 | ) | (2,188 | ) | (10,084 | ) | |||||||||||||||||||||
Comprehensive loss | (94,324 | ) | |||||||||||||||||||||||||
Distributions to public unitholders | (19,224 | ) | (19,224 | ) | |||||||||||||||||||||||
Equity award activity | 23 | 251 | 274 | ||||||||||||||||||||||||
Treasury stock activity, net | (299 | ) | (299 | ) | |||||||||||||||||||||||
Issuance of common stock for business combination | 77 | 28,135 | 28,212 | ||||||||||||||||||||||||
Equity compensation expense | 6,715 | 450 | 7,165 | ||||||||||||||||||||||||
Conversions of CCLP Series A Preferred | 38,322 | 38,322 | |||||||||||||||||||||||||
Other | (69 | ) | 131 | 62 | |||||||||||||||||||||||
Balance at December 31, 2018 | $ | 1,285 | $ | 460,680 | $ | (18,950 | ) | $ | (51,663 | ) | $ | (217,952 | ) | $ | 139,349 | $ | 312,749 | ||||||||||
See Notes to Consolidated Financial Statements
F-6
TETRA Technologies, Inc. and Subsidiaries
Consolidated Statements of Cash Flows
(In Thousands)
Year Ended December 31, | ||||||||||||
2018 | 2017 | 2016 | ||||||||||
Operating activities: | ||||||||||||
Net loss | $ | (84,240 | ) | $ | (62,183 | ) | $ | (239,393 | ) | |||
Reconciliation of net loss to cash provided by operating activities: | ||||||||||||
Depreciation, amortization, and accretion | 117,010 | 116,159 | 129,595 | |||||||||
Impairments and other charges | 3,621 | 14,876 | 18,172 | |||||||||
Impairment of goodwill | — | — | 106,205 | |||||||||
Benefit for deferred income taxes | (888 | ) | (3,048 | ) | (1,808 | ) | ||||||
Equity-based compensation expense | 7,379 | 7,727 | 13,747 | |||||||||
Provision for doubtful accounts | 2,156 | 1,428 | 2,436 | |||||||||
Non-cash loss on disposition of business | 32,369 | — | — | |||||||||
Excess decommissioning/abandoning costs | — | — | 2,629 | |||||||||
Expense for unamortized finance costs and other non-cash charges and credits | 4,398 | (65 | ) | 1,724 | ||||||||
Amortization of deferred financing costs | 4,297 | 4,743 | 4,141 | |||||||||
Insurance recoveries associated with damaged equipment | — | (2,352 | ) | — | ||||||||
Transaction financing expenses | 203 | 37 | 4,066 | |||||||||
CCLP Series A Preferred accrued paid in kind distributions | 4,738 | 7,328 | 2,659 | |||||||||
CCLP Series A Preferred fair value adjustment | (733 | ) | (2,975 | ) | 4,404 | |||||||
Warrants fair value adjustment | (11,129 | ) | (5,301 | ) | 2,106 | |||||||
Contingent consideration liability fair value adjustment | 3,400 | — | — | |||||||||
Gain on sale of property, plant, and equipment | (729 | ) | (674 | ) | (5,461 | ) | ||||||
Changes in operating assets and liabilities, net of assets acquired: | ||||||||||||
Accounts receivable | (5,512 | ) | (55,197 | ) | 64,331 | |||||||
Inventories | (29,221 | ) | (11,332 | ) | 1,384 | |||||||
Prepaid expenses and other current assets | (3,888 | ) | (1,608 | ) | 3,348 | |||||||
Trade accounts payable and accrued expenses | 5,463 | 58,937 | (54,092 | ) | ||||||||
Decommissioning liabilities | (35 | ) | (565 | ) | (4,040 | ) | ||||||
Other | (2,073 | ) | (1,340 | ) | (494 | ) | ||||||
Net cash provided by operating activities | 46,586 | 64,595 | 55,659 | |||||||||
Investing activities: | ||||||||||||
Purchases of property, plant, and equipment, net | (141,931 | ) | (51,923 | ) | (21,066 | ) | ||||||
Acquisition of businesses, net of cash acquired | (49,630 | ) | — | — | ||||||||
Proceeds from disposal of business | 3,121 | — | — | |||||||||
Proceeds from sale of property, plant, and equipment | 1,138 | 862 | 3,354 | |||||||||
Insurance recoveries associated with damaged equipment | — | 2,352 | — | |||||||||
Other investing activities | (1,344 | ) | 812 | 3,417 | ||||||||
Net cash used in investing activities | (188,646 | ) | (47,897 | ) | (14,295 | ) | ||||||
Financing activities: | ||||||||||||
Proceeds from long-term debt | 767,887 | 384,550 | 458,580 | |||||||||
Principal payments on long-term debt | (581,935 | ) | (384,100 | ) | (689,783 | ) | ||||||
CCLP distributions | (19,224 | ) | (18,826 | ) | (28,956 | ) | ||||||
Proceeds from issuance of common stock and warrants, net of underwriters' discount | — | — | 168,275 | |||||||||
Proceeds from CCLP Series A Preferred Units, net of offering costs | — | — | 66,935 | |||||||||
Proceeds from sale of common stock and exercise of stock options | 251 | — | 68 | |||||||||
Tax remittances on equity based compensation | (768 | ) | (803 | ) | (1,679 | ) | ||||||
Debt issuance costs | (11,217 | ) | (2,157 | ) | (6,073 | ) | ||||||
Net cash provided by (used in) financing activities | 154,994 | (21,336 | ) | (32,633 | ) | |||||||
Effect of exchange rate changes on cash | 779 | 1,122 | (1,987 | ) | ||||||||
Increase (decrease) in cash and cash equivalents and restricted cash | 13,713 | (3,516 | ) | 6,744 | ||||||||
Cash and cash equivalents and restricted cash at beginning of period | 26,389 | 29,905 | 23,161 | |||||||||
Cash and cash equivalents and restricted cash at end of period | $ | 40,102 | $ | 26,389 | $ | 29,905 | ||||||
Supplemental cash flow information: | ||||||||||||
Interest paid | $ | 56,261 | $ | 46,286 | $ | 54,506 | ||||||
Taxes paid | 4,680 | 6,782 | 4,254 | |||||||||
See Notes to Consolidated Financial Statements
F-7
TETRA Technologies, Inc. and Subsidiaries
Notes to Consolidated Financial Statements
December 31, 2018
NOTE A — ORGANIZATION AND OPERATIONS
We are a geographically diversified oil and gas services company, focused on completion fluids and associated products and services, comprehensive water management, frac flowback, production well testing and offshore rig cooling services, and compression services and equipment. Prior to the March 2018 sale of our Offshore Division, our operations also included certain offshore services including well plugging and abandonment, decommissioning, and diving, as well as a limited domestic oil and gas production business. We were incorporated in Delaware in 1981. Following the acquisition and disposition transactions described in Note E – "Acquisitions and Dispositions" that closed during the three month period ended March 31, 2018, we reorganized our business into three reporting segments – Completion Fluids & Products, Water & Flowback Services, and Compression. Prior period financial information has been revised to reflect the change in reportable segments. See Note T - "Industry Segments and Geographic Information." Additionally, following the disposition of our Offshore Division, its operations have been presented as discontinued operations for all periods presented. See Note F - "Discontinued Operations." Unless the context requires otherwise, when we refer to “we,” “us,” and “our,” we are describing TETRA Technologies, Inc. and its consolidated subsidiaries on a consolidated basis.
Our Completion Fluids & Products Division manufactures and markets clear brine fluids ("CBFs"), additives, and associated products and services to the oil and gas industry for use in well drilling, completion and workover operations in the United States and in certain countries in Latin America, Europe, Asia, the Middle East and Africa. The Division also markets liquid and dry calcium chloride products manufactured at its production facilities or purchased from third-party suppliers to a variety of markets outside the energy industry.
Our Water & Flowback Services Division provides onshore oil and gas operators with comprehensive water management services. The Division also provides frac flowback, production well testing, offshore rig cooling, and other associated services in many of the major oil and gas producing regions in the United States, Mexico, and Canada, as well as in oil and gas basins in certain regions in South America, Africa, Europe, the Middle East, and Australia.
Our Compression Division is a provider of compression services and equipment for natural gas and oil production, gathering, transportation, processing, and storage. The Compression Division's equipment sales business includes the fabrication and sale of standard compressor packages and custom-designed compressor packages designed and fabricated at the Division's facilities. The Compression Division's aftermarket business provides compressor package reconfiguration and maintenance services and compressor package parts and components manufactured by third-party suppliers. The Compression Division provides its services and equipment to a broad base of natural gas and oil exploration and production, midstream, transmission, and storage companies operating throughout many of the onshore producing regions of the United States, as well as in a number of foreign countries, including Mexico, Canada and Argentina.
We have reviewed our financial forecasts for the twelve month period subsequent to March 4, 2019, which consider our debt covenant requirements. Based on our financial forecasts, which are based on current market conditions and certain operating and other business assumptions that we believe to be reasonable as of March 4, 2019, we believe that we will have adequate liquidity, earnings, and operating cash flows to fund our operations and debt obligations and maintain compliance with our debt covenants through at least the next twelve months.
NOTE B — BASIS OF PRESENTATION AND SIGNIFICANT ACCOUNTING POLICIES
Principles of Consolidation
Our consolidated financial statements include the accounts of our wholly owned subsidiaries. We consolidate the financial statements of CCLP as part of our Compression Division, as we determined that CCLP is a variable interest entity and we are the primary beneficiary. We control the financial interests of CCLP and have the ability to direct the activities of CCLP that most significantly impact its economic performance through our ownership of its general partner. The share of CCLP net assets and earnings that is not owned by us is presented as noncontrolling interest in our consolidated financial statements. Our cash flows from our investment in CCLP are
F-8
limited to the quarterly distributions we receive on our CCLP common units and general partner interest (including incentive distribution rights) and the amounts collected for services we perform on behalf of CCLP, as TETRA's capital structure and CCLP's capital structure are separate, and do not include cross default provisions, cross collateralization provisions, or cross guarantees. As of December 31, 2018, our consolidated balance sheet includes $67.4 million of restricted net assets, consisting of the consolidated net assets of CCLP. All intercompany accounts and transactions have been eliminated in consolidation.
Use of Estimates
The preparation of financial statements in conformity with U.S. generally accepted accounting principles ("GAAP") requires management to make estimates and assumptions that affect the reported amounts of assets and liabilities and disclose contingent assets and liabilities at the date of the financial statements and the reported amounts of revenues, expenses, and impairments during the reporting period. Actual results could differ from those estimates, and such differences could be material.
Reclassifications
Certain previously reported financial information has been reclassified to conform to the current year's presentation. For a discussion of the reclassification of the financial presentation of our Offshore Division as discontinued operations, see Note F - "Discontinued Operations."
Cash Equivalents
We consider all highly liquid cash investments with a maturity of three months or less when purchased to be cash equivalents.
Restricted Cash
Restricted cash is classified as a current asset when it is expected to be repaid or settled in the next twelve month period.
Financial Instruments
Financial instruments that subject us to concentrations of credit risk consist principally of trade receivables with companies in the energy industry. Our policy is to evaluate, prior to providing goods or services, each customer's financial condition and to determine the amount of open credit to be extended. We generally require appropriate, additional collateral as security for credit amounts in excess of approved limits. Our customers consist primarily of major, well-established oil and gas producers and independent oil and gas companies. Payment terms are on a short-term basis.
We have currency exchange rate risk exposure related to transactions denominated in a foreign currency as well as to investments in certain of our international operations. Our risk management activities include the use of foreign currency forward purchase and sale derivative contracts as part of a program designed to mitigate the currency exchange rate risk exposure on selected international operations.
We have no outstanding balances under our and CCLP's variable rate revolving credit facilities as of December 31, 2018. However, if we were to have outstanding balances on these variable rate bank credit facilities, we would face market risk exposure related to changes in applicable interest rates.
Allowances for Doubtful Accounts
Allowances for doubtful accounts are determined generally and on a specific identification basis when we believe that the collection of specific amounts owed to us is not probable. The changes in allowances for doubtful accounts for the three year period ended December 31, 2018, are as follows:
F-9
Year Ended December 31, | ||||||||||||
2018 | 2017 | 2016 | ||||||||||
(In Thousands) | ||||||||||||
At beginning of period | $ | 1,286 | $ | 3,872 | $ | 6,279 | ||||||
Activity in the period: | ||||||||||||
Provision for doubtful accounts | 2,156 | 1,428 | 2,436 | |||||||||
Account (chargeoffs) recoveries | (859 | ) | (4,014 | ) | (4,843 | ) | ||||||
At end of period | $ | 2,583 | $ | 1,286 | $ | 3,872 | ||||||
Inventories
Inventories are stated at the lower of cost or net realizable value. Except for work in progress inventory, cost is determined using the weighted average method. The cost of work in progress is determined using the specific identification method.
Property, Plant, and Equipment
Property, plant, and equipment are stated at cost. Expenditures that increase the useful lives of assets are capitalized. The cost of repairs and maintenance is charged to operations as incurred. For financial reporting purposes, we provide for depreciation using the straight-line method over the estimated useful lives of assets, which are generally as follows:
Buildings | 15 – 40 years | |
Machinery and equipment | 2 – 20 years | |
Automobiles and trucks | 3 – 4 years | |
Chemical plants | 15 – 30 years | |
Compressors | 12 – 20 years | |
Leasehold improvements are depreciated over the shorter of the remaining term of the associated lease or its useful life. Depreciation expense, excluding impairments and other charges, for the years ended December 31, 2018, 2017, and 2016 was $106.9 million, $97.3 million, and $109.4 million, respectively.
Construction in progress as of December 31, 2018 and 2017 consists primarily of equipment fabrication projects.
Intangible Assets other than Goodwill
Patents, trademarks, and other intangible assets are amortized on a straight-line basis over their estimated useful lives, ranging from 2 to 20 years. Amortization expense of patents, trademarks, and other intangible assets was $7.3 million, $6.1 million, and $6.8 million for the years ended December 31, 2018, 2017, and 2016, respectively, and is included in depreciation, amortization and accretion. The estimated future annual amortization expense of patents, trademarks, and other intangible assets is $7.8 million for 2019, $7.7 million for 2020, $7.4 million for 2021, $7.0 million for 2022, and $6.7 million for 2023.
Intangible assets other than goodwill are tested for recoverability whenever events or changes in circumstances indicate that the carrying value of the asset may not be recoverable. In such an event, we will determine the fair value of the asset using an undiscounted cash flow analysis of the asset at the lowest level for which identifiable cash flows exist. If an impairment has occurred, we will recognize a loss for the difference between the carrying value and the estimated fair value of the intangible asset. During 2018, 2017, and 2016, certain intangible assets were impaired. See "Impairments of Long-Lived Assets" section below.
F-10
Goodwill
Goodwill represents the excess of cost over the fair value of the net assets acquired in business combinations. We perform a goodwill impairment test at a reporting unit level on an annual basis or whenever indicators of impairment are present. We perform the annual test of goodwill impairment as of the last day of the fourth quarter of each year. As of December 31, 2018, consolidated goodwill consists of $25.9 million attributed to our Water Management reporting unit, included as part of our Water & Flowback Services Division. The first step of the impairment test is to compare the estimated fair value with the recorded net book value (including goodwill) of our reporting units. If the estimated fair value is higher than the recorded net book value, no impairment is deemed to exist and no further testing is required. If, however, the carrying amount of the reporting unit exceeds its estimated fair value, an impairment loss is calculated by comparing the carrying amount of the reporting unit’s goodwill to our estimated implied fair value of that goodwill. Our estimates of reporting unit fair value, when required, are based on a combination of an income and market approach. These estimates are imprecise and are subject to our estimates of the future cash flows of each business and our judgment as to how these estimated cash flows translate into each business’ estimated fair value. These estimates and judgments are affected by numerous factors, including the general economic environment at the time of our assessment, which affects our overall market capitalization. See Note D - "Goodwill" for additional discussion of our goodwill.
Impairments of Long-Lived Assets
Impairments of long-lived assets, including identified intangible assets, are determined periodically when indicators of impairment are present. If such indicators are present, the determination of the amount of impairment is based on our judgments as to the future undiscounted operating cash flows to be generated from these assets throughout their remaining estimated useful lives. If these undiscounted cash flows are less than the carrying amount of the related asset, an impairment is recognized for the excess of the carrying value over its fair value. Assets held for disposal are recorded at the lower of carrying value or estimated fair value less estimated selling costs.
During the third quarter of 2018, as a result of decreased expected future cash flows from a specific customer contract, we recorded a long-lived asset impairment of $2.9 million of an identified intangible asset within the Water & Flowback Services segment.
During the fourth quarter of 2017, consolidated long-lived asset impairments of approximately $14.9 million were recorded primarily due to the impairment of a certain identified intangible asset resulting from decreased expected future operating cash flows from a Water & Flowback Services segment customer.
During the first quarter of 2016, our Compression and Water & Flowback Services segments recorded impairments of approximately $7.9 million and $2.8 million, respectively, due to expected decreased demand due to current market conditions. During the fourth quarter of 2016, our Compression, Completion Fluids & Products, and Water & Flowback Services segments recorded certain consolidated impairments and other charges of approximately $2.4 million, $0.5 million, and $3.6 million, respectively, due to expected decreased demand due to current market conditions and equipment damage.
Asset Retirement Obligations
The values of our asset retirement obligations for properties were $12.2 million and $11.7 million as of December 31, 2018 and 2017, respectively. Decommissioning and asset retirement work performed for the years 2018, 2017, and 2016 was $0.04 million, $0.4 million, and $0.0 million, respectively. For a further discussion of asset retirement obligations, see Note L – "Asset Retirement Obligations."
Environmental Liabilities
Environmental expenditures that result in additions to property and equipment are capitalized, while other environmental expenditures are expensed. Environmental remediation liabilities are recorded on an undiscounted basis when environmental assessments or cleanups are probable and the costs can be reasonably estimated. Estimates of future environmental remediation expenditures often consist of a range of possible expenditure amounts, a portion of which may be in excess of amounts of liabilities recorded. In such an instance, we disclose the full range of amounts reasonably possible of being incurred. Any changes or developments in environmental
F-11
remediation efforts are accounted for and disclosed each quarter as they occur. Any recoveries of environmental remediation costs from other parties are recorded as assets when their receipt is deemed probable.
Complexities involving environmental remediation efforts can cause estimates of the associated liability to be imprecise. Factors that cause uncertainties regarding the estimation of future expenditures include, but are not limited to, the effectiveness of the anticipated work plans in achieving targeted results and changes in the desired remediation methods and outcomes as prescribed by regulatory agencies. Uncertainties associated with environmental remediation contingencies are pervasive and often result in wide ranges of reasonably possible outcomes. Estimates developed in the early stages of remediation can vary significantly. Normally, a finite estimate of cost does not become fixed and determinable at a specific point in time. Rather, the costs associated with environmental remediation become estimable as the work is performed and the range of ultimate cost becomes more defined. It is possible that cash flows and results of operations could be materially affected by the impact of the ultimate resolution of these contingencies.
Revenue Recognition
Revenue is recognized when performance obligations under the terms of a contract with our customer are satisfied. Refer to Note U - "Revenue From Contracts With Customers" for further discussion.
Operating Costs
Cost of product sales includes direct and indirect costs of manufacturing and producing our products, including raw materials, fuel, utilities, labor, overhead, repairs and maintenance, materials, services, transportation, warehousing, equipment rentals, insurance, and certain taxes. In addition, cost of product sales includes oil and gas operating expense. Cost of services includes operating expenses we incur in delivering our services, including labor, equipment rental, fuel, repair and maintenance, transportation, overhead, insurance, and certain taxes. We include in product sales revenues the reimbursements we receive from customers for shipping and handling costs. Shipping and handling costs are included in cost of product sales. Amounts we incur for “out-of-pocket” expenses in the delivery of our services are recorded as cost of services. Reimbursements for “out-of-pocket” expenses we incur in the delivery of our services are recorded as service revenues. Depreciation, amortization, and accretion includes depreciation expense for all of our facilities, equipment and vehicles, amortization expense on our intangible assets, and accretion expense related to our decommissioning and other asset retirement obligations.
We include in general and administrative expense all costs not identifiable to our specific product or service operations, including divisional and general corporate overhead, professional services, corporate office costs, sales and marketing expenses, insurance, and certain taxes.
Equity-Based Compensation
We and CCLP have various equity incentive compensation plans which provide for the granting of restricted common stock, options for the purchase of our common stock, and other performance-based, equity-based compensation awards to our executive officers, key employees, nonexecutive officers, and directors. Total equity-based compensation expense, net of taxes, for the three years ended December 31, 2018, 2017, and 2016, was $5.8 million, $5.0 million, and $9.5 million, respectively. For further discussion of equity-based compensation, see Note O – "Equity-Based Compensation."
Income Taxes
Deferred tax assets and liabilities are recognized for the future tax consequences attributable to differences between the financial statement carrying amounts of existing assets and liabilities and their respective tax basis amounts. Deferred tax assets and liabilities are measured using enacted tax rates expected to apply to taxable income in the years in which those temporary differences are expected to be recovered or settled. The effect of a change in tax rates is recognized as income or expense in the period that includes the enactment date. A portion of the carrying value of certain deferred tax assets are subject to a valuation allowance. See Note H – "Income Taxes" for further discussion.
F-12
Accumulated Other Comprehensive Income (Loss)
Certain of our international operations maintain their accounting records in the local currencies that are their functional currencies. For these operations, the functional currency financial statements are converted to United States dollar equivalents, with the effect of the foreign currency translation adjustment reflected as a component of accumulated other comprehensive income (loss). Accumulated other comprehensive income (loss) is included in partners' capital in the accompanying audited consolidated balance sheets and consists of the cumulative currency translation adjustments associated with such international operations. Activity within accumulated other comprehensive income includes no reclassifications to net income.
Income (Loss) per Common Share
The calculation of basic earnings per share excludes any dilutive effects of equity awards or warrants. The calculation of diluted earnings per share includes the effect of equity awards and warrants, if dilutive, which is computed using the treasury stock method during the periods such equity awards and warrants were outstanding. A reconciliation of the common shares used in the computations of income (loss) per common and common equivalent shares is presented in Note S – "Income (Loss) Per Share."
Foreign Currency Translation
We have designated the euro, the British pound, the Norwegian krone, the Canadian dollar, the Brazilian real, and the Mexican peso as the functional currencies for our operations in Finland and Sweden, the United Kingdom, Norway, Canada, Brazil, and certain of our operations in Mexico, respectively. The U.S. dollar is the designated functional currency for all of our other foreign operations. The cumulative translation effects of translating the applicable accounts from the functional currencies into the U.S. dollar at current exchange rates are included as a separate component of equity. Foreign currency exchange (gains) and losses are included in other (income) expense, net, and totaled $(0.1) million, $(1.6) million, and $(0.9) million for the years ended December 31, 2018, 2017 and 2016, respectively.
On June 30, 2018, we determined the economy in Argentina to be highly inflationary. As a result of this determination and in accordance with U.S. GAAP, on July 1, 2018, the functional currency of our operations in Argentina was changed from the Argentine peso to the U.S. dollar. The remeasurement did not have a material impact on our consolidated financial position or results of operations.
Fair Value Measurements
We utilize fair value measurements to account for certain items and account balances within our consolidated financial statements. Fair value measurements are utilized on a recurring basis in the determination of the carrying values of certain liabilities, including the liabilities for the warrants to purchase 11.2 million shares of our common stock (the "Warrants"), the CCLP Series A Convertible Preferred Units (the "CCLP Preferred Units"), and contingent consideration liability. We also utilize fair value measurements on a recurring basis in the accounting for our foreign currency derivative contracts. Refer to Note R - "Fair Value Measurements" for further discussion.
Fair value measurements are also utilized on a nonrecurring basis in certain circumstances, such as in the allocation of purchase consideration for acquisition transactions to the assets and liabilities acquired, including intangible assets and goodwill (a Level 3 fair value measurement), the initial recording of our asset retirement obligations, and for the impairment of long-lived assets, including goodwill (a Level 3 fair value measurement).
New Accounting Pronouncements
Standards adopted in 2018
In May 2014, the Financial Accounting Standards Board ("FASB") issued Accounting Standards Update ("ASU") 2014-09, "Revenue from Contracts with Customers." This ASU supersedes the revenue recognition requirements in Accounting Standards Codification ("ASC") 605, "Revenue Recognition", and most industry-specific guidance. This ASU is effective for annual periods beginning after December 15, 2017, and interim periods within those years, under either full or modified retrospective adoption.
F-13
On January 1, 2018, we adopted ASU 2014-09 and all related amendments, which was codified into ASC 606. We utilized the modified retrospective method of adoption. Comparative information has not been restated and continues to be reported under the accounting standards in effect for those periods.
The core principle of ASC 606 is that an entity should recognize revenue to depict the transfer of promised goods or services to customers in an amount that reflects the consideration to which the entity expects to be entitled in exchange for those goods or services. ASC 606 also provides a five-step model for determining revenue recognition for arrangements that are within the scope of the standard: (i) identify the contract(s) with a customer; (ii) identify the performance obligations in the contract; (iii) determine the transaction price; (iv) allocate the transaction price to the performance obligations in the contract; and (v) recognize revenue when (or as) the entity satisfies a performance obligation. We only apply the five-step model to contracts when it is probable that we will collect the consideration we are entitled to in exchange for the goods or services we transfer to the customer. At contract inception, once the contract is determined to be within the scope of ASC 606, we assess the goods or services promised within each contract and determine those that are performance obligations and assess whether each promised good or service is distinct. We then recognize as revenue the amount of the transaction price that is allocated to the respective performance obligation when (or as) the performance obligation is satisfied. For a complete discussion of accounting for revenues, see Note U - "Revenue from Contracts with Customers."
The impact from the adoption of ASC 606 to our January 1, 2018 consolidated balance sheet, our December 31, 2018 consolidated balance sheet, and our consolidated results of operations for the year ended December 31, 2018 was immaterial. The adoption of ASC 606 had no impact to cash provided by operating, financing, or investing activities in our consolidated statement of cash flows.
In August 2016, the FASB issued ASU 2016-15, "Statement of Cash Flows (Topic 230): Classification of Certain Cash Receipts and Cash Payments" to reduce diversity in practice in classification of certain transactions in the statement of cash flows. We adopted this ASU during the three month period ended March 31, 2018, with no impact to our consolidated financial statements.
In November 2016, the FASB issued ASU 2016-16, "Intra-Entity Transfers of Assets Other Than Inventory," which requires companies to account for the income tax effects of intercompany transfers of assets other than inventory when the transfer occurs. We adopted this ASU during the three month period ended March 31, 2018. The adoption of this standard did not have a material impact to our consolidated financial statements.
Additionally, in November 2016, the FASB issued ASU 2016-18, "Statement of Cash Flows (Topic 230): Restricted Cash" to reduce diversity in the presentation of restricted cash and restricted cash equivalents in the statement of cash flows. We adopted this ASU during the three month period ended March 31, 2018, resulting in restricted cash, if any, being classified with cash and cash equivalents in our consolidated statement of cash flows.
In May 2017, the FASB issued ASU 2017-09, "Compensation-Stock Compensation (Topic 718): Scope of Modification Accounting" to clarify when to account for a change to the terms or conditions of a share-based payment award as a modification. We adopted this ASU during the three month period ended March 31, 2018, with no impact to our consolidated financial statements.
F-14
Standards not yet adopted
In February 2016, the FASB issued ASU 2016-02, "Leases (Topic 842)" to increase comparability and transparency among different organizations. Organizations are required to recognize right-of-use lease assets and lease liabilities in the balance sheet related to the right to use the underlying asset for the lease term. In addition, through improved disclosure requirements, ASC 842 will enable users of financial statements to further understand the amount, timing, and uncertainty of cash flows arising from leases. ASC 842 is effective for annual periods beginning after December 15, 2018 and interim periods within those annual periods. In July 2018, the FASB provided an additional transition method allowing for the recognition of a cumulative effect adjustment to the opening balance of retained earnings in the period of adoption rather than in the earliest period presented. We plan to adopt ASC 842 effective January 1, 2019 using the optional transition method. Comparative information will continue to be reported under the accounting standards that were in effect for those periods. Based on our preliminary assessment of our portfolio of leases where we are the lessee, upon adoption of ASC 842, we will record an amount for right-to-use assets and lease obligations ranging from approximately $60.0 million to $70.0 million pursuant to the new requirements.
The July 2018 amendment also provided lessors with a practical expedient to not separate nonlease components from the associated lease component and, instead, to account for those components as a single component if the nonlease components otherwise would be accounted for under ASC 606 and certain conditions are met. The amendment also provided clarification on whether ASC 842 or ASC 606 is applicable to the combined component based on determination of the predominant component. An entity that elects the lessor practical expedient also should provide certain disclosures. We evaluated the impact of the July 2018 amendment on our compression services contracts and have concluded that the services nonlease component is predominant, which results in the ongoing recognition following ASC 606.
In June 2016, the FASB issued ASU 2016-13, "Financial Instruments - Credit Losses (Topic 326): Measurement of Credit Losses on Financial Instruments." ASU 2016-13 amends the impairment model to utilize an expected loss methodology in place of the currently used incurred loss methodology, which will result in the more timely recognition of losses. ASU 2016-13 has an effective date of the first quarter of fiscal 2022. We are currently assessing the potential effects of these changes to our consolidated financial statements.
In January 2017, the FASB issued ASU 2017-04, "Intangibles-Goodwill and Other (Topic 350): Simplifying the Test for Goodwill Impairment," which simplifies how an entity is required to test goodwill for impairment by eliminating Step 2 from the goodwill impairment test. The ASU is effective for annual periods beginning after December 15, 2019, and interim periods within those annual periods, with early adoption permitted, under a prospective adoption. We do not expect the adoption of this standard to have a material impact on our consolidated financial statements.
In June 2018, the FASB issued ASU 2018-07, “Compensation-Stock Compensation (Topic 718): Improvements to Nonemployee Share-Based Payment Accounting” to align the measurement and classification guidance for share-based payments to nonemployees with the guidance currently applied to employees, with certain exceptions. The ASU is effective for annual periods beginning after December 15, 2018, and interim periods within those annual periods, with early adoption permitted. We are currently assessing the potential effects of these changes to our consolidated financial statements and do not expect the adoption of this standard to have a material impact on our consolidated financial statements.
F-15
NOTE C – INVENTORIES
Components of inventories are as follows:
December 31, | ||||||||
2018 | 2017 | |||||||
(In Thousands) | ||||||||
Finished goods | $ | 69,762 | $ | 66,377 | ||||
Raw materials | 3,503 | 4,027 | ||||||
Parts and supplies | 47,386 | 33,632 | ||||||
Work in progress | 22,920 | 11,402 | ||||||
Total inventories | $ | 143,571 | $ | 115,438 | ||||
Finished goods inventories include newly manufactured clear brine fluids as well as used brines that are repurchased from certain customers for recycling. Work in progress inventory consists primarily of new compressor packages located in the CCLP fabrication facility in Midland, Texas.
NOTE D — GOODWILL
Our Water & Flowback Services Division consists of two reporting units, Production Testing and Water Management. During the fourth quarter of 2018, global oil commodity prices decreased significantly. An accompanying decrease in our common stock price during the fourth quarter of 2018 has also indicated an overall reduction in our market capitalization. As part of our internal annual business outlook for each of our reporting units that we performed during the fourth quarter of 2018, we considered changes in the global economic environment that affected our stock price and market capitalization. As part of the first step of goodwill impairment testing for our Water Management reporting unit (part of our Water & Flowback Services Division), the only reporting unit with goodwill as of December 31, 2018, we updated our assessment of the future cash flows, applying expected long-term growth rates, discount rates, and terminal values that we consider reasonable for the reporting unit. We calculated a present value of the cash flows for the Water Management reporting unit to arrive at an estimate of fair value using a combination of the income approach and the market approach. Based on these assumptions, we determined that the fair value of the Water Management reporting unit exceeded its carrying value, which includes approximately $25.9 million of goodwill, by approximately 30%. Specific uncertainties affecting the estimated fair value of our Water Management reporting unit includes the impact of competition, prices of oil and natural gas, and future overall activity levels in the regions in which we operate, the activity levels of our significant customers, and other factors affecting the rate of future growth of this reporting unit. These factors will continue to be reviewed and assessed going forward. Negative developments with regard to these factors could have a further negative effect on the fair value of the Water Management reporting unit.
Because quoted market prices for our reporting units other than Compression are not available, our management must apply judgment in determining the estimated fair value of our reporting units for purposes of reconciling the fair values of our reporting units to our overall market capitalization. Management uses all available information to make these fair value determinations, including the present value of expected future cash flows using discount rates commensurate with the risks involved in the assets. The resultant fair values calculated for the reporting units are then compared to observable metrics for other companies in our industry or to mergers and acquisitions in our industry to determine whether those valuations, in our judgment, appear reasonable.
The accounting principles regarding goodwill acknowledge that the observed market prices of individual trades of a company’s stock (and thus its computed market capitalization) may not be representative of the fair value of the company as a whole. Substantial value may arise from the ability to take advantage of synergies and other benefits that flow from control over another entity. Consequently, measuring the fair value of a collection of assets and liabilities that operate together in a controlled entity is different from measuring the fair value of a single share of that entity’s common stock. Therefore, once the fair value of the reporting units was determined, we also added a control premium to the calculations. This control premium is judgmental and is based on observed mergers and acquisitions in our industry.
Due to the decrease in the price of our common stock and the price per common unit of CCLP during the first three months of 2016, our and CCLP's market capitalizations as of March 31, 2016, were below their respective
F-16
recorded net book values, including remaining goodwill. In addition, the continuing low oil and natural gas commodity price environment resulted in a further negative impact on demand for the products and services for each of our reporting units. As a result of these factors, we determined that it was “more likely than not” that the fair values of our Compression Division, which is one reporting unit, and our Production Testing reporting unit, a part of our Water & Flowback Services Division, were less than their respective carrying values as of March 31, 2016. As a result of the goodwill impairment process, we recorded impairments of goodwill of $106.2 million as of March 31, 2016. Following these goodwill impairments, as of December 31, 2018, our consolidated goodwill consists of $25.9 million of goodwill attributed to our Water Management reporting unit, a part of our Water & Flowback Services Division.
As of December 31, 2018, the carrying amount of goodwill for the Completion Fluids & Products, Water & Flowback Services, and Compression reporting segments are net of $23.8 million, $111.8 million, and $231.8 million, respectively, of accumulated impairment losses. The changes in the carrying amount of goodwill by segment for the three year period ended December 31, 2018, are as follows:
Water & Flowback Services | Compression | Total | ||||||||||
(In Thousands) | ||||||||||||
Balance as of December 31, 2015 | $ | 20,543 | $ | 92,402 | $ | 112,945 | ||||||
Goodwill adjustments | (13,907 | ) | (92,402 | ) | (106,309 | ) | ||||||
Balance as of December 31, 2016 | 6,636 | — | 6,636 | |||||||||
Goodwill adjustments | — | — | — | |||||||||
Balance as of December 31, 2017 | 6,636 | — | 6,636 | |||||||||
Goodwill acquired during the year | 19,223 | — | 19,223 | |||||||||
Goodwill adjustments | — | — | — | |||||||||
Balance as of December 31, 2018 | $ | 25,859 | $ | — | $ | 25,859 | ||||||
NOTE E — ACQUISITIONS AND DISPOSITIONS
Acquisition of SwiftWater Energy Services
On February 28, 2018, pursuant to a purchase agreement dated February 13, 2018 (the "SwiftWater Purchase Agreement"), we purchased all of the equity interests in SwiftWater Energy Services, LLC ("SwiftWater"), which is engaged in the business of providing water management and water solutions to oil and gas operators in the Permian Basin market of Texas. Strategically, the acquisition of SwiftWater enhances our position as one of the leading integrated water management companies, providing water transfer, storage, and treatment services, along with proprietary automation technology and numerous other water-related services.
Under the terms of the SwiftWater Purchase Agreement, consideration of $42.0 million of cash, subject to a working capital adjustment, and 7,772,021 shares of our common stock (valued at $28.2 million) were paid at closing. Subsequent to closing, in August 2018, a working capital adjustment of approximately $1.0 million was paid. The sellers also have the right to receive contingent consideration payments, in an aggregate amount of up to $15.0 million, calculated on EBITDA and revenue (each as defined in the SwiftWater Purchase Agreement) of the combined water management business of SwiftWater and our pre-existing operations in the Permian Basin in respect of the period from January 1, 2018 through December 31, 2019. The contingent consideration may be paid in cash or shares of our common stock, at our election.
F-17
As of the February 28, 2018 closing date, our allocation of the SwiftWater purchase price is as follows (in thousands):
Current assets | $ | 16,880 | |
Property and equipment | 11,631 | ||
Intangible assets | 41,960 | ||
Goodwill | 15,560 | ||
Total assets acquired | 86,031 | ||
Current liabilities | 7,189 | ||
Total liabilities assumed | 7,189 | ||
Net assets acquired | $ | 78,842 | |
The above allocation of the purchase price to the SwiftWater net tangible assets and liabilities considers approximately $7.6 million of the initial estimated fair value for the liabilities associated with the contingent purchase price consideration. The initial fair value of the obligation to pay the contingent purchase price consideration was calculated based on the anticipated EBITDA and revenue as of the closing date for the operations of SwiftWater and our pre-existing operations in the Permian Basin and could have increased (to $15.0 million) or decreased (to $0) depending on the actual earnings from these operations. Increases or decreases in the value of the anticipated contingent purchase price consideration liability due to changes in the amounts paid or expected to be paid are charged or credited to earnings in the period in which such changes occur. During the period from the closing date to December 31, 2018, the estimated fair value for the liabilities associated with the contingent purchase price consideration increased to $11.0 million, resulting in $3.4 million being charged to other (income) expense, net, during the year ended December 31, 2018. A $10.0 million portion of the liability for contingent consideration was based on EBITDA and revenue during 2018 and is classified as Accrued Liabilities as of December 31, 2018 in the accompanying consolidated balance sheet.
The allocation of the purchase price to the SwiftWater net tangible assets and liabilities and identifiable intangible assets, as well as the initial estimated fair value for the liabilities associated with the contingent purchase price consideration, as of February 28, 2018, is final and adjustments to the purchase price allocation have been reflected in the accompanying consolidated balance sheets as of December 31, 2018. The allocation of purchase price includes approximately $15.6 million of deductible goodwill allocated to our Water & Flowback Services segment, and is supported by the strategic benefits discussed above and expected to be generated from the acquisition. The acquired property and equipment is stated at fair value, and depreciation on the acquired property and equipment is computed using the straight-line method over the estimated useful lives of each asset. Machinery and equipment is depreciated using useful lives of 3 to 15 and automobiles and trucks are depreciated using useful lives of 3 to 4 years. The acquired intangible assets include $3.3 million for the trademark/tradename, $37.2 million for customer relationships, and $1.5 million of other intangible assets that are stated at estimated fair value and are amortized on a straight-line basis over their estimated useful lives, ranging from 5 to 16 years. These identified intangible assets are recorded net of $2.5 million of accumulated amortization as of December 31, 2018.
Subsequent to the February 28, 2018 acquisition closing date, we have continued to integrate the acquired SwiftWater operations into our existing Water & Flowback Services Division in the Permian Basin in order to better serve our customers through seamless combined service offerings. With the addition of SwiftWater services, such as water treatment, we are now able to offer integrated water management services to both TETRA and SwiftWater customers that would have not been possible prior to the acquisition. Moreover, services performed for certain pre-acquisition SwiftWater customers have utilized TETRA employees and equipment. Similarly, certain pre-SwiftWater acquisition TETRA customers have utilized SwiftWater employees, equipment, and services. We have also added to SwiftWater's fleet of operating equipment through additional capital expenditures. As a result of the combined operations, the distinction of the revenue originating from SwiftWater versus TETRA is a subjective estimate. Due to these limitations, we have considered the $95.6 million of revenues for services performed for pre-acquisition SwiftWater customers subsequent to the closing on February 28, 2018 as the estimate of the impact from the SwiftWater acquisition on our consolidated revenues for the year ended December 31, 2018.
As a result of our focus since the date of the acquisition on integrating and managing SwiftWater services with our pre-existing operations in the Permian Basin, quantifying the financial impact on our consolidated earnings
F-18
of the operations specific to SwiftWater is impracticable. SwiftWater acquisition-related costs of approximately $0.4 million were incurred during the year ended December 31, 2018, consisting of external legal fees, transaction consulting fees, and due diligence costs. These costs have been recognized in general and administrative expenses in the consolidated statement of operations.
Acquisition of JRGO Energy Services LLC
On December 6, 2018, we purchased JRGO Energy Services LLC (“JRGO”) for a cash purchase price of $7.6 million paid at closing, subject to a working capital adjustment. In addition, contingent consideration of up to $1.5 million is to be paid during 2019, based on JRGO's performance during the fourth quarter of 2018. JRGO specializes in delivering comprehensive water management services for oil and gas operators, as well as municipal, state and federal organizations. JRGO will be integrated into our Water & Flowback Services Division. The acquisition of JRGO broadens our footprint in the Appalachian region and is expected to provide our customers an enhanced, more efficient, diverse, and strategically positioned portfolio of integrated water management services in the Marcellus and Utica basins.
As of December 31, 2018, subject to completion of management's review, our preliminary allocation of the JRGO purchase price is as follows (in thousands):
Current assets | $ | 2,173 | |
Property and equipment | 3,413 | ||
Intangible assets | 3,197 | ||
Goodwill | 3,662 | ||
Total assets acquired | 12,445 | ||
Current liabilities | 2,716 | ||
Total liabilities assumed | 2,716 | ||
Net assets acquired | $ | 9,729 | |
Pro Forma Financial Information (Unaudited)
The pro forma information presented below has been prepared to give effect to the SwiftWater acquisition as if the transaction had occurred at the beginning of the periods presented. The impact of the acquisition of JRGO is not significant and is therefore not included in the pro forma information. The pro forma information includes the impact from the allocation of the SwiftWater acquisition purchase price on depreciation and amortization. The pro forma information also excludes the SwiftWater acquisition-related costs charged to earnings during the 2018 period. The pro forma information is presented for illustrative purposes only and is based on estimates and assumptions we deemed appropriate. The following pro forma information is not necessarily indicative of the historical results that would have been achieved if the SwiftWater acquisition transaction had occurred in the past, and our operating results may have been different from those reflected in the pro forma information below. Therefore, the pro forma information should not be relied upon as an indication of the operating results that we would have achieved if the SwiftWater transaction had occurred at the beginning of the periods presented or the future results that we will achieve after the transaction.
Twelve Months Ended December 31, | |||||||
2018 | 2017 | ||||||
(In Thousands) | |||||||
Revenues | $ | 1,012,925 | $ | 779,145 | |||
Depreciation, amortization, and accretion | $ | 115,902 | $ | 109,484 | |||
Gross profit | $ | 169,391 | $ | 132,239 | |||
Net income (loss) from continuing operations | $ | (41,017 | ) | $ | (42,329 | ) | |
Net income (loss) attributable to TETRA stockholders | $ | (61,525 | ) | $ | (39,570 | ) | |
F-19
Sale of Offshore Division
On March 1, 2018, we closed a series of related transactions that resulted in the disposition of our Offshore Division. Pursuant to an Asset Purchase and Sale Agreement (the "Maritech Asset Purchase Agreement") with Orinoco Natural Resources, LLC ("Orinoco"), Orinoco purchased certain remaining offshore oil, gas and mineral leases and related assets of Maritech (the "Maritech Properties"). Immediately thereafter, we closed the transactions contemplated by a Membership Interest Purchase and Sale Agreement (the "Maritech Equity Purchase Agreement") with Orinoco, whereby Orinoco purchased all of the equity interests of Maritech (the "Maritech Equity Interests"). Immediately thereafter, we closed the transactions contemplated by an Equity Interest Purchase Agreement (the "Offshore Services Purchase Agreement") with Epic Offshore Specialty, LLC, an affiliate of Orinoco ("Epic Offshore"), whereby Epic Offshore (the "Offshore Services Sale") purchased all of the equity interests in the wholly owned subsidiaries that comprised our Offshore Services segment operations (the "Offshore Services Equity Interests").
Under the terms of the Maritech Asset Purchase Agreement, the Maritech Equity Purchase Agreement, and the Offshore Services Purchase Agreement, the consideration delivered by Orinoco and Epic Offshore for the Maritech Properties, the Maritech Equity Interests and the Offshore Services Equity Interests consisted of (i) the assumption by Orinoco of substantially all of the liabilities and obligations relating to the ownership, operation and condition of the Maritech Properties and the provision of certain indemnities by Orinoco to us under the Maritech Asset Purchase Agreement, (ii) the assumption by Orinoco of substantially all of the liabilities of Maritech and the provision of certain indemnities by Orinoco under the Maritech Equity Purchase Agreement, (iii) the assumption by Epic Offshore of substantially all of the liabilities of the Offshore Services Equity Interests relating to the periods following the closing of the Offshore Services Sale and the provision of certain indemnities by Epic Offshore under the Offshore Services Purchase Agreement, (iv) cash in the amount $3.1 million (v) a promissory note in the original principal amount of $7.5 million payable by Epic Offshore to us in full, together with interest at a rate of 1.52% per annum, on December 31, 2019, (vi) performance by Orinoco under a Bonding Agreement executed in connection with the Maritech Asset Purchase Agreement and the Maritech Equity Purchase Agreement whereby Orinoco provided at closing non-revocable performance bonds in an amount equal to $46.8 million to cover the performance by Orinoco and Maritech of the asset retirement obligations of Maritech, and (vii) the delivery of a personal guaranty agreement from Thomas M. Clarke and Ana M. Clarke guaranteeing the payment obligations of Orinoco under the Bonding Agreement (collectively, the "Transaction Consideration"). Pursuant to the Bonding Agreement, Orinoco is required to replace, within 90 days following the closing, the initial bonds delivered at closing with non-revocable performance bonds, meeting certain requirements, in the aggregate sum of $47.0 million. Orinoco has not delivered such replacement bonds and we are seeking to enforce the terms of the Bonding Agreement. The non-revocable performance bonds delivered at the closing remain in effect.
As a result of these transactions, we have effectively exited the businesses of our Offshore Services and Maritech segments, and these operations are reflected as discontinued operations in our consolidated financial statements. See Note F - "Discontinued Operations" for further discussion. Our consolidated pre-tax results of operations for the year period ending December 31, 2018 included a loss on the disposal of our Offshore Division of $34.1 million, net of tax, including transaction costs of $1.4 million.
F-20
NOTE F – DISCONTINUED OPERATIONS
As discussed in Note E - "Acquisitions and Dispositions," on March 1, 2018, we closed a series of related transactions that resulted in the disposition of our Offshore Division. As a result, we have accounted for our Offshore Division, consisting of our Offshore Services and Maritech segments, as discontinued operations and have revised prior period financial statements to exclude these businesses from continuing operations. A summary of financial information related to our discontinued operations is as follows:
Reconciliation of the Line Items Constituting Pretax Loss from Discontinued Operations to the After-Tax Loss from Discontinued Operations
(in thousands)
Twelve Months Ended December 31, 2018 | Twelve Months Ended December 31, 2017 | Twelve Months Ended December 31, 2016 | |||||||||||||||||||||||||||||||||
Offshore Services | Maritech | Total | Offshore Services | Maritech | Total | Offshore Services | Maritech | Total | |||||||||||||||||||||||||||
Major classes of line items constituting pretax loss from discontinued operations | |||||||||||||||||||||||||||||||||||
Revenue | $ | 4,487 | $ | 187 | $ | 4,674 | $ | 96,741 | $ | 538 | $ | 97,279 | $ | 76,622 | $ | 751 | $ | 77,373 | |||||||||||||||||
Cost of revenues | 11,151 | 139 | 11,290 | 92,674 | 1,064 | 93,738 | 70,032 | 3,236 | 73,268 | ||||||||||||||||||||||||||
Depreciation, amortization, and accretion | 1,873 | 212 | 2,085 | 10,678 | 1,428 | 12,106 | 12,164 | 1,362 | 13,526 | ||||||||||||||||||||||||||
General and administrative expense | 1,917 | 187 | 2,104 | 5,705 | 783 | 6,488 | 6,451 | 1,087 | 7,538 | ||||||||||||||||||||||||||
Other (income) expense, net | (1,036 | ) | — | (1,036 | ) | 2,453 | (565 | ) | 1,888 | 3 | (3,092 | ) | (3,089 | ) | |||||||||||||||||||||
Pretax loss from discontinued operations | (9,418 | ) | (351 | ) | (9,769 | ) | (14,769 | ) | (2,172 | ) | (16,941 | ) | (12,028 | ) | (1,842 | ) | (13,870 | ) | |||||||||||||||||
Pretax loss on disposal of discontinued operations | (34,072 | ) | — | — | |||||||||||||||||||||||||||||||
Total pretax loss from discontinued operations | (43,841 | ) | (16,941 | ) | (13,870 | ) | |||||||||||||||||||||||||||||
Income tax provision (benefit) | (2,326 | ) | 448 | 147 | |||||||||||||||||||||||||||||||
Total loss from discontinued operations | $ | (41,515 | ) | $ | (17,389 | ) | $ | (14,017 | ) | ||||||||||||||||||||||||||
F-21
Reconciliation of Major Classes of Assets and Liabilities of the Discontinued Operations to Amounts Presented Separately in the Statement of Financial Position
(in thousands)
December 31, 2018 | December 31, 2017 | ||||||||||||||||||||||
Offshore Services | Maritech | Total | Offshore Services | Maritech | Total | ||||||||||||||||||
Carrying amounts of major classes of assets included as part of discontinued operations | |||||||||||||||||||||||
Trade receivables | $ | — | $ | 1,340 | $ | 1,340 | $ | 27,385 | $ | 1,542 | $ | 28,927 | |||||||||||
Inventories | — | — | — | 4,616 | — | 4,616 | |||||||||||||||||
Other Current Assets | 14 | — | 14 | 1,292 | 44 | 1,336 | |||||||||||||||||
Current assets of discontinued operations | 14 | 1,340 | 1,354 | 33,293 | 1,586 | 34,879 | |||||||||||||||||
Property, plant, and equipment | — | — | — | 85,873 | — | 85,873 | |||||||||||||||||
Other assets | — | — | — | 382 | — | 382 | |||||||||||||||||
Long-term assets of discontinued operations | — | — | — | 86,255 | — | 86,255 | |||||||||||||||||
Total major classes of assets of the discontinued operations | $ | 14 | $ | 1,340 | $ | 1,354 | $ | 119,548 | $ | 1,586 | $ | 121,134 | |||||||||||
Carrying amounts of major classes of liabilities included as part of discontinued operations | |||||||||||||||||||||||
Trade payables | $ | 740 | $ | — | $ | 740 | $ | 13,942 | $ | 87 | $ | 14,029 | |||||||||||
Accrued liabilities | 1,330 | 2,075 | 3,405 | 8,904 | 2,278 | 11,182 | |||||||||||||||||
Current portion of decommissioning liability | — | — | — | — | 477 | 477 | |||||||||||||||||
Current liabilities of discontinued operations | 2,070 | 2,075 | 4,145 | 22,846 | 2,842 | 25,688 | |||||||||||||||||
Decommissioning and other asset retirement obligations | — | — | — | — | 46,185 | 46,185 | |||||||||||||||||
Other liabilities | — | — | — | 2,040 | — | 2,040 | |||||||||||||||||
Long-term liabilities of discontinued operations | — | — | — | 2,040 | 46,185 | 48,225 | |||||||||||||||||
Total major classes of liabilities of the discontinued operations | $ | 2,070 | $ | 2,075 | $ | 4,145 | $ | 24,886 | $ | 49,027 | $ | 73,913 | |||||||||||
NOTE G — LEASES
We lease some of our transportation equipment, office space, warehouse space, operating locations, and machinery and equipment. Certain facility storage tanks being constructed are leased pursuant to a ten year term, which is classified as a capital lease. Capitalized costs pursuant to a capital lease are depreciated over the term of the lease. The office, warehouse, and operating location leases, which vary from one to thirty-five year terms that expire at various dates through 2034, with some leases having renewal clauses of various periods, are classified as operating leases. Transportation equipment leases expire at various dates through 2024 and are also classified as operating leases. The office, warehouse, and operating location leases, and machinery and equipment leases generally require us to pay all maintenance and insurance costs.
Our corporate headquarters facility located in The Woodlands, Texas, was sold on December 31, 2012, pursuant to a sale and leaseback transaction. Pursuant to the transaction, we sold the building, parking garage, and land to an unaffiliated third party for a sale price of $43.8 million, before transaction costs and other deductions. As a condition to the consummation of the purchase and sale of the facility, the parties entered into a lease agreement for the facility having an initial lease term of 15 years, which is classified as an operating lease. Under the terms of the lease agreement, we have the ability to extend the lease for five successive five year periods at base rental rates to be determined at the time of each extension. We are responsible for the payment of all related taxes,
F-22
utilities, insurance, and certain maintenance and improvement costs. Pursuant to sale and leaseback accounting, approximately $5.0 million in deferral of the gain on the sale of the facility remains at December 31, 2018, to be recognized on a straight line basis over the initial lease term.
Future minimum lease payments by year and in the aggregate, under non-cancelable capital and operating leases with terms in excess of one year, and including the headquarters facility lease discussed above, consist of the following at December 31, 2018:
Capital Lease | Operating Leases | |||||||
(In Thousands) | ||||||||
2019 | $ | 188 | $ | 18,466 | ||||
2020 | 35 | 15,947 | ||||||
2021 | 27 | 10,456 | ||||||
2022 | — | 8,410 | ||||||
2023 | — | 7,441 | ||||||
After 2024 | — | 27,715 | ||||||
Total minimum lease payments | $ | 250 | $ | 88,435 | ||||
Rental expense for all operating leases was $40.9 million, $27.1 million, and $24.8 million for the years ended December 31, 2018, 2017, and 2016, respectively. At December 31, 2018, future minimum rental receipts under a non-cancelable sublease totaled $6.4 million.
NOTE H — INCOME TAXES
On December 22, 2017, the United States enacted significant changes to the U.S. tax law following the passage and signing of H.R.1, “An Act to Provide the Reconciliation Pursuant to Titles II and V of the Concurrent Resolution on the Budget for Fiscal Year 2018” (the “Act”) (previously known as “The Tax Cuts and Jobs Act”). We applied the guidance in Staff Accounting Bulletin 118 (“SAB 118”) when accounting for the enactment-date effects of the Act. During the 4th quarter of 2017, we recorded our best estimate of the impact of the Act in our year-end income tax provision in accordance with our understanding of the Act and guidance available and as a result recorded income tax expense of $54.1 million. This income tax expense was fully offset by a decrease in the valuation allowance previously recorded on our deferred tax assets. As such, the Act resulted in no net tax expense. As of December 31, 2018, we completed our accounting analysis for all of the enactment-date income tax effects and reduced our December 31, 2017 provisional amount by $2.5 million. The decrease in the income tax expense was fully offset by an increase in the valuation allowance. As such, the Act resulted in no net tax expense.
In January 2018, the FASB released guidance on the accounting for tax on the global intangible low-taxed income ("GILTI") provisions of the Act. The GILTI provisions impose a tax on foreign income in excess of a deemed return on tangible assets of foreign corporations. The guidance indicates that either accounting for deferred taxes related to GILTI inclusions or to treat any taxes on GILTI inclusions as period costs are both acceptable methods subject to an accounting policy election. As of December 31, 2017, we had not yet completed our assessment or elected an accounting policy to either recognize deferred taxes for basis differences expected to reverse as GILTI or to record GILTI as period costs if and when incurred. After further consideration in 2018, we have elected to account for GILTI as a period cost in the year the tax is incurred.
F-23
The income tax provision (benefit) attributable to continuing operations for the years ended December 31, 2018, 2017, and 2016, consists of the following:
Year Ended December 31, | ||||||||||||
2018 | 2017 | 2016 | ||||||||||
(In Thousands) | ||||||||||||
Current | ||||||||||||
Federal | $ | — | $ | (651 | ) | $ | — | |||||
State | 1,465 | 799 | 783 | |||||||||
Foreign | 5,430 | 3,943 | 3,181 | |||||||||
6,895 | 4,091 | 3,964 | ||||||||||
Deferred | ||||||||||||
Federal | (79 | ) | 394 | — | ||||||||
State | (153 | ) | (648 | ) | (610 | ) | ||||||
Foreign | (364 | ) | (3,086 | ) | (1,198 | ) | ||||||
(596 | ) | (3,340 | ) | (1,808 | ) | |||||||
Total tax provision (benefit) | $ | 6,299 | $ | 751 | $ | 2,156 | ||||||
A reconciliation of the provision (benefit) for income taxes attributable to continuing operations, computed by applying the federal statutory rate to income (loss) before income taxes and the reported income taxes, is as follows:
Year Ended December 31, | ||||||||||||
2018 | 2017 | 2016 | ||||||||||
(In Thousands) | ||||||||||||
Income tax provision (benefit) computed at statutory federal income tax rates | $ | (7,650 | ) | $ | (15,415 | ) | $ | (78,128 | ) | |||
State income taxes (net of federal benefit) | 55 | 1,664 | (2,960 | ) | ||||||||
Impact of international operations | 14,477 | 10,847 | 7,556 | |||||||||
Impact of U.S. tax law change | (2,510 | ) | 55,813 | — | ||||||||
Goodwill impairments | — | — | 12,990 | |||||||||
Impact of noncontrolling interest | 5,204 | 5,151 | 2,247 | |||||||||
Valuation allowance | (7,443 | ) | (63,635 | ) | 53,918 | |||||||
Other | 4,166 | 6,326 | 6,533 | |||||||||
Total tax provision (benefit) | $ | 6,299 | $ | 751 | $ | 2,156 | ||||||
Income (loss) before taxes and discontinued operations includes the following components:
Year Ended December 31, | ||||||||||||
2018 | 2017 | 2016 | ||||||||||
(In Thousands) | ||||||||||||
Domestic | $ | (44,957 | ) | $ | (29,419 | ) | $ | (221,609 | ) | |||
International | 8,531 | (14,624 | ) | (1,611 | ) | |||||||
Total | $ | (36,426 | ) | $ | (44,043 | ) | $ | (223,220 | ) | |||
F-24
A reconciliation of the beginning and ending amount of our gross unrecognized tax benefit is as follows:
Year Ended December 31, | ||||||||||||
2018 | 2017 | 2016 | ||||||||||
(In Thousands) | ||||||||||||
Gross unrecognized tax benefits at beginning of period | $ | 530 | $ | 857 | $ | 1,219 | ||||||
Decreases in tax positions for prior years | — | — | — | |||||||||
Increases in tax positions for current year | — | — | 16 | |||||||||
Lapse in statute of limitations | (202 | ) | (327 | ) | (378 | ) | ||||||
Gross unrecognized tax benefits at end of period | $ | 328 | $ | 530 | $ | 857 | ||||||
We recognize interest and penalties related to uncertain tax positions in income tax expense. During the years ended December 31, 2018, 2017, and 2016, we recognized $(0.2) million, $(0.3) million, and $(0.2) million, respectively, of interest and penalties to the provision for income tax. As of December 31, 2018 and 2017, we had $0.5 million and $0.7 million, respectively, of accrued potential interest and penalties associated with these uncertain tax positions. The total amount of unrecognized tax benefits that would affect our effective tax rate if recognized is $0.8 million and $1.1 million as of December 31, 2018 and 2017, respectively. We do not expect a significant change to the unrecognized tax benefits during the next twelve months.
We file tax returns in the U.S. and in various state, local, and non-U.S. jurisdictions. The following table summarizes the earliest tax years that remain subject to examination by taxing authorities in any major jurisdiction in which we operate:
Jurisdiction | Earliest Open Tax Period |
United States – Federal | 2012 |
United States – State and Local | 2002 |
Non-U.S. jurisdictions | 2011 |
We use the liability method for reporting income taxes, under which current and deferred tax assets and liabilities are recorded in accordance with enacted tax laws and rates. Under this method, at the end of each period, the amounts of deferred tax assets and liabilities are determined using the tax rate expected to be in effect when the taxes are actually paid or recovered. We establish a valuation allowance to reduce the deferred tax assets when it is more likely than not that some portion or all of the deferred tax assets will not be realized. We considered all available evidence, both positive and negative, in determining whether, based on the weight of that evidence, a valuation allowance is needed for some portion or all of our deferred tax assets. In determining the need for a valuation allowance on our deferred tax assets we placed greater weight on recent and objectively verifiable current information, as compared to more forward-looking information that is used in valuating other assets on the balance sheet. While we have considered taxable income in prior carryback years, future reversals of existing taxable temporary differences, future taxable income, and tax planning strategies in assessing the need for the valuation allowance, there can be no guarantee that we will be able to realize all of our deferred tax assets. Significant components of our deferred tax assets and liabilities as of December 31, 2018 and 2017 are as follows:
December 31, | ||||||||
2018 | 2017 | |||||||
(In Thousands) | ||||||||
Net operating losses | $ | 100,910 | $ | 88,025 | ||||
Federal tax credits | 3,441 | 19,346 | ||||||
Accruals | 9,396 | 24,577 | ||||||
Depreciation and amortization for book in excess of tax expense | 35,242 | 40,979 | ||||||
All other | 11,140 | 3,813 | ||||||
Total deferred tax assets | 160,129 | 176,740 | ||||||
Valuation allowance | (129,034 | ) | (130,453 | ) | ||||
Net deferred tax assets | $ | 31,095 | $ | 46,287 | ||||
F-25
December 31, | ||||||||
2018 | 2017 | |||||||
(In Thousands) | ||||||||
Depreciation and amortization for tax in excess of book expense | $ | 31,999 | $ | 48,618 | ||||
All other | 2,325 | 2,064 | ||||||
Total deferred tax liability | 34,324 | 50,682 | ||||||
Net deferred tax liability | $ | 3,229 | $ | 4,395 | ||||
We believe that it is more likely than not we will not realize all the tax benefits of the deferred tax assets within the allowable carryforward period. Therefore, an appropriate valuation allowance has been provided. The valuation allowance as of December 31, 2018 and 2017 primarily relates to federal deferred tax assets. The increase (decrease) in the valuation allowance during the years ended December 31, 2018, 2017, and 2016, were $(1.4) million, $(54.8) million, and $58.6 million, respectively.
At December 31, 2018, we had federal, state, and foreign net operating loss carryforwards/carrybacks equal to approximately $75.3 million, $11.1 million, and $14.5 million, respectively. In those countries and states in which net operating losses are subject to an expiration period, our loss carryforwards, if not utilized, will expire at various dates from 2019 through 2037. At December 31, 2018, we had $2.9 million of foreign tax credits available to offset future payment of federal income taxes. The foreign tax credits expire in varying amounts from 2020 through 2027. We have amended our 2012 - 2015 U.S. federal income tax returns to take a foreign tax deduction instead of a credit. This resulted in a decrease in our foreign tax credit carryforward of $16.2 million. The net impact to our deferred tax assets was a decrease of $12.8 million, offset by a corresponding increase in our valuation allowance. As such, the amended income tax returns resulted in no net tax expense. Utilization of the net operating loss and credit carryforwards may be subject to a significant annual limitation due to ownership changes that have occurred previously or could occur in the future provided by Section 382 of the Internal Revenue Code.
NOTE I — ACCRUED LIABILITIES
Accrued liabilities are detailed as follows:
December 31, | ||||||||
2018 | 2017 | |||||||
(In Thousands) | ||||||||
Compensation and employee benefits | $ | 25,286 | $ | 20,621 | ||||
Accrued interest | 15,158 | 9,272 | ||||||
Accrued capital expenditures | 1,561 | 1,617 | ||||||
Accrued taxes | 15,756 | 11,763 | ||||||
Contingent consideration, current portion | 11,452 | — | ||||||
Other accrued liabilities | 20,019 | 15,205 | ||||||
Total accrued liabilities | $ | 89,232 | $ | 58,478 | ||||
F-26
NOTE J — LONG-TERM DEBT AND OTHER BORROWINGS
We believe our capital structure, excluding CCLP, ("TETRA") and CCLP's capital structure should be considered separately, as there are no cross default provisions, cross collateralization provisions, or cross guarantees between CCLP's debt and TETRA's debt.
Consolidated long-term debt, net of associated deferred financing costs, consists of the following:
December 31, 2018 | December 31, 2017 | ||||||||
(In Thousands) | |||||||||
TETRA | Scheduled Maturity | ||||||||
Asset-based credit agreement | September 10, 2023 | $ | — | $ | — | ||||
Term credit agreement (presented net of the unamortized discount of $7.2 million and net of unamortized deferred financing costs of $10.2 million as of December 31, 2018) | September 10, 2025 | 182,547 | — | ||||||
Bank revolving line of credit facility, terminated September 10, 2018 | — | — | |||||||
11.0% Senior Note, Series 2015 (presented net of the unamortized discount of $3.9 million and net of unamortized deferred financing costs of $3.4 million as of December 31, 2017), terminated September 10, 2018 | — | 117,679 | |||||||
TETRA total debt | 182,547 | 117,679 | |||||||
Less current portion | — | — | |||||||
TETRA total long-term debt | $ | 182,547 | $ | 117,679 | |||||
CCLP | |||||||||
CCLP Prior Credit Facility (presented net of the unamortized deferred financing costs of $4.0 million as of December 31, 2017), terminated March 22, 2018 | — | 223,985 | |||||||
CCLP Credit Agreement | June 29, 2023 | — | — | ||||||
CCLP 7.25% Senior Notes (presented net of the unamortized discount of $2.2 million as of December 31, 2018 and $2.8 million as of December 31, 2017 and net of unamortized deferred financing costs of $3.9 million as of December 31, 2018 and $5.0 million as of December 31, 2017) | August 15, 2022 | 289,797 | 288,191 | ||||||
CCLP 7.50% Senior Secured Notes (presented net of unamortized deferred financing costs of $6.8 million as of December 31, 2018) | April 1, 2025 | 343,216 | — | ||||||
CCLP total debt | 633,013 | 512,176 | |||||||
Less current portion | — | — | |||||||
CCLP total long-term debt | 633,013 | 512,176 | |||||||
Consolidated total long-term debt | $ | 815,560 | $ | 629,855 | |||||
F-27
Scheduled maturities for the next five years and thereafter are as follows:
December 31, 2018 | ||||||||||||
(In Thousands) | ||||||||||||
TETRA | CCLP | Consolidated | ||||||||||
2019 | $ | — | $ | — | $ | — | ||||||
2020 | — | — | — | |||||||||
2021 | — | — | — | |||||||||
2022 | — | 295,930 | 295,930 | |||||||||
2023 | — | — | — | |||||||||
Thereafter | 200,000 | 350,000 | 550,000 | |||||||||
Total maturities | $ | 200,000 | $ | 645,930 | $ | 845,930 | ||||||
As of December 31, 2018, TETRA had no outstanding balance and had $6.1 million in letters of credit against its ABL Credit Agreement (as defined below). As of December 31, 2018, subject to compliance with the covenants, borrowing base, and other provisions of the agreement that may limit borrowings, TETRA had an availability of $47.6 million under this agreement. Because there was no outstanding balance on this ABL Credit Agreement, associated deferred financing costs of $1.6 million as of December 31, 2018, were classified as other long-term assets on the accompanying consolidated balance sheet. Because there was no balance outstanding under the CCLP Credit Agreement (as defined below) as of December 31, 2018, associated deferred financing costs of $1.1 million as of December 31, 2018, were classified as other long-term assets on the accompanying consolidated balance sheet. As of December 31, 2018, and subject to compliance with the covenants, borrowing base, and other provisions of the agreements that may limit borrowings under the CCLP Credit Agreement, CCLP had availability of $27.1 million.
As described below, TETRA and CCLP are both in compliance with all covenants of their respective credit and senior note agreements as of December 31, 2018.
TETRA Long-Term Debt
Asset-Based Credit Agreement. On September 10, 2018, TETRA, as borrower, and certain of its subsidiaries, entered into an asset-based lending credit agreement (the “ABL Credit Agreement”) with a syndicate of lenders, including JPMorgan Chase Bank, N.A., as administrative agent (collectively, the "ABL Lenders"). The ABL Credit Agreement provides for a senior secured revolving credit facility of up to $100 million, subject to a borrowing base to be determined by reference to the value of inventory and accounts receivable, and includes a sublimit of $20.0 million for letters of credit and a swingline loan sublimit of $10.0 million.
Borrowings under the ABL Credit Agreement bear interest at a rate per annum equal to, at the option of TETRA, either (i) London Interbank Offering Rate (“LIBOR”) plus a margin based upon a fixed charge coverage ratio or (ii) a base rate plus a margin based on a fixed charge coverage ratio. The base rate is determined by reference to the highest of (a) the prime rate of interest as announced from time to time by JPMorgan Chase Bank, N.A. (b) the Federal Funds Effective Rate (as defined in the ABL Credit Agreement) plus 0.5% per annum and (c) LIBOR (adjusted to reflect any required bank reserves) for a one-month period on such day plus 1.0% per annum. Borrowings outstanding have an applicable margin ranging from 1.75% to 2.25% per annum for LIBOR-based loans and 0.75% to 1.25% per annum for base-rate loans, based upon the applicable fixed charge coverage ratio. In addition to paying interest on the outstanding principal under the ABL Credit Agreement, TETRA is required to pay a commitment fee in respect of the unutilized commitments at an applicable rate ranging from 0.375% to 0.5% per annum, paid monthly in arrears based on utilization of the commitments under the ABL Credit Agreement. TETRA is also required to pay a customary letter of credit fee equal to the applicable margin on LIBOR-based loans and fronting fees.
The revolving loans under the ABL Credit Agreement may be voluntarily prepaid, in whole or in part, without premium or penalty, subject to applicable breakage fees. The maturity date of the ABL Credit Agreement is September 10, 2023.
The ABL Credit Agreement contains certain affirmative and negative covenants, including covenants that restrict the ability of TETRA and certain of its subsidiaries to take certain actions including, among other things and
F-28
subject to certain significant exceptions, incurring debt, granting liens, engaging in mergers and other fundamental changes, making investments, entering into or amending transactions with affiliates, paying dividends and making other restricted payments, prepaying other indebtedness, and selling assets. The ABL Credit Agreement also contains a provision that may require a fixed charge coverage ratio (as defined in the ABL Credit Agreement) of not less than 1.00 to 1.00 in the event that certain conditions associated with outstanding borrowings and cash availability occur. As of December 31, 2018, such conditions have not occurred. All obligations under the ABL Credit Agreement and the guarantees of those obligations are secured, subject to certain exceptions, by a security interest for the benefit of the ABL Lenders on substantially all of the personal property of TETRA and certain subsidiaries of TETRA, the equity interests in certain domestic subsidiaries, including CCLP, and a maximum of 65% of the equity interests in certain foreign subsidiaries.
The ABL Credit Agreement includes customary events of default including non-payment of principal, interest or fees, violation of covenants, inaccuracy of representations or warranties, cross-default to other material indebtedness, bankruptcy and insolvency events, invalidity or impairment of security interests or invalidity of loan documents, certain ERISA events, unsatisfied or unstayed judgments, and any change of control.
Proceeds of loans under the ABL Credit Agreement were used to pay certain debt of TETRA existing on the effective date of the ABL Credit Agreement and may be used for working capital needs, capital expenditures, and other general corporate purposes. The ABL Credit Agreement replaced TETRA's previous Bank Credit Agreement, as defined and discussed in further detail below. In connection with the execution of the ABL Credit Agreement, $1.3 million of financing costs were incurred, and deferred against the carrying value of the amount outstanding, if any.
Term Credit Agreement
On September 10, 2018, TETRA, as borrower, entered into a credit agreement (the “Term Credit Agreement”) with a syndicate of lenders (collectively, the “Term Lenders”) and Wilmington Trust, National Association, as administrative agent. The Term Credit Agreement provides an initial loan in the amount of $200 million (the “Initial Term Loan”) and the availability of additional loans, subject to the terms of the Term Credit Agreement, up to an aggregate amount of $75 million for certain acquisitions (the “Additional Term Loans,” and together with the Initial Term Loan, the “Term Loan”).
Borrowings under the Term Credit Agreement bear interest at a rate per annum equal to, at the option of TETRA, either (i) LIBOR plus a margin of 6.25% per annum or (ii) a base rate plus a margin of 5.25% per annum. In addition to paying interest on the outstanding principal under the Term Credit Agreement, TETRA is required to pay a commitment fee in respect of the unutilized commitments at the rate of 1.0% per annum, paid quarterly in arrears based on utilization of the commitments under the Term Credit Agreement.
The Term Credit Agreement contains certain affirmative and negative covenants, including covenants that restrict the ability of TETRA and certain of its subsidiaries to take certain actions including, among other things and subject to certain significant exceptions, incurring debt, granting liens, engaging in mergers and other fundamental changes, making investments, entering into or amending transactions with affiliates, paying dividends and making other restricted payments, prepaying other indebtedness, and selling assets. The Term Credit Agreement also contains a requirement that the borrowers comply at the end of each fiscal quarter with a minimum Interest Coverage Ratio (as defined in the Term Credit Agreement) of 1.00 to 1.00. As of December 31, 2018, TETRA is in compliance with the Interest Coverage Ratio requirement.
All obligations under the Term Credit Agreement and the guarantees of those obligations are secured, subject to certain exceptions, by a security interest for the benefit of the Term Lenders on substantially all of the personal property of TETRA and certain of its subsidiaries, the equity interests in certain domestic subsidiaries, including CCLP, and a maximum of 65% of the equity interests in certain foreign subsidiaries.
The Term Credit Agreement includes customary events of default including non-payment of principal, interest or fees, violation of covenants, inaccuracy of representations or warranties, cross-default to other material indebtedness, bankruptcy and insolvency events, invalidity or impairment of security interests or invalidity of loan documents, certain ERISA events, unsatisfied or unstayed judgments and any change of control.
Proceeds from the Initial Term Loan, net of a 2% discount in the amount of $4.0 million, were used to prepay the outstanding indebtedness under the $125.0 million 11% Senior Secured Notes due November 5, 2022
F-29
(the “11% Senior Notes”) and indebtedness of TETRA under its then existing bank credit agreement. Proceeds of any Additional Term Loans may be used for acquisitions, subject to the terms of the Term Credit Agreement. The loans under the Term Credit Agreement may be voluntarily prepaid, in whole or in part, subject to applicable breakage fees. Any prepayment prior to the one-year anniversary is subject to a “make-whole” payment as set forth in the Term Credit Agreement. Thereafter, any prepayment during the period commencing after the one-year anniversary and ending on the two-year anniversary will have a premium of 3.0% and during the period commencing after the two-year anniversary and ending on the three-year anniversary, a premium of 1.0%. The maturity date of the Term Credit Agreement is September 10, 2025. There is no prepayment premium required after the third anniversary. In connection with the issuance of the Term Credit Agreement, TETRA incurred $1.0 million of financing costs, $0.4 million of which was charged to other (income) expense, net during the three months ended September 30, 2018 and $0.6 million of lender fees were deferred against the carrying value of the amount outstanding. These deferred financing costs, along with the 2% discount, are amortized over the term of the Term Credit Agreement.
Bank Credit Agreement
On September 10, 2018, in connection with the closing of the above-described loans, TETRA repaid all outstanding borrowings and obligations under its then existing bank credit agreement dated as of January 27, 2006, as previously amended with a portion of the net proceeds from the above-described loans, and terminated the then existing bank credit agreement. As a result of the termination of the then existing bank credit agreement, during the three month period ended September 30, 2018, associated unamortized deferred financing costs of $0.5 million were charged to other (income) expense, net, and $0.4 million were deferred and will be amortized over the term of the ABL Credit Agreement. Certain ABL Lenders were lenders under the existing bank credit agreement and, accordingly, received a portion of the proceeds from the above-described loans in connection with the repayment of the outstanding borrowings under the bank credit agreement.
11% Senior Note
On September 10, 2018, in connection with the closing of the above-described loans, TETRA repaid all outstanding indebtedness under the 11% Senior Note with a portion of the proceeds from the above-described loans, terminated its obligations under the 11% Senior Note and related note purchase agreement. Affiliates of certain Term Lenders were holders of the 11% Senior Note and, accordingly, received a portion of the proceeds from the Term Credit Agreement in connection with the repayment of the outstanding indebtedness under the 11% Senior Note. In connection with the early termination of the 11% Senior Note, TETRA paid a $7.0 million "make-whole" prepayment fee in accordance with the terms of the 11% Senior Note. This prepayment fee, along with $3.4 million of unamortized discount and $2.9 million of unamortized deferred financing costs associated with the 11% Senior Note, has been deferred and is being amortized over the term of the new Term Credit Agreement.
CCLP Long-Term Debt
CCLP Bank Credit Facility.
On March 22, 2018, in connection with the closing of the CCLP Offering (as defined below), CCLP repaid all outstanding borrowings and obligations under its then existing CCLP Prior Credit Facility with a portion of the net proceeds from the CCLP Offering, and terminated the CCLP Prior Credit Facility. As a result of the termination of the CCLP Prior Credit Facility, associated unamortized deferred financing costs of $3.5 million were charged to other (income) expense, net, during the three month period ended March 31, 2018.
On June 29, 2018, CCLP and two of its wholly owned subsidiaries (collectively the "CCLP Borrowers"), and certain of its wholly owned subsidiaries named therein as guarantors (the "CCLP Credit Agreement Guarantors"), entered into a Loan and Security Agreement (the "CCLP Credit Agreement") with the lenders thereto (the "Lenders"), and Bank of America, N.A., in its capacity as administrative agent, collateral agent, letter of credit issuer, and swing line lender. All of the CCLP Borrowers' obligations under the CCLP Credit Agreement are guaranteed by certain of their existing and future domestic subsidiaries. The CCLP Credit Agreement includes a maximum credit commitment of $50.0 million which is available for loans, letters of credit with a sublimit of $25.0 million and swingline loans with a sublimit of $5.0 million, subject to a borrowing base to be determined by reference to the value of CCLP’s and any other borrowers’ accounts receivable. Such maximum credit commitment may be increased by $25.0 million in accordance with the terms and conditions of the CCLP Credit Agreement.
F-30
The CCLP Borrowers may borrow funds under the CCLP Credit Agreement to pay fees and expenses related to the CCLP Credit Agreement and for the Borrower's ongoing working capital needs and for general business purposes. The revolving loans under the CCLP Credit Agreement may be voluntarily prepaid, in whole or in part, without premium or penalty, subject to breakage or similar costs. The maturity date of the CCLP Credit Agreement is June 29, 2023. As of December 31, 2018, no balance was outstanding under the CCLP Credit Agreement.
Borrowings under the CCLP Credit Agreement will bear interest at a rate per annum equal to, at the option of the CCLP Borrowers, either (i) the London Interbank Offered Rate (“LIBOR”) plus a margin based on average daily excess availability or (ii) a base rate plus a margin based on average daily excess availability LIBOR-based loans will have an applicable margin of 2.00% per annum and base-rate loans will have an applicable margin of 1.00% per annum; thereafter, the applicable margin will range between 1.75% and 2.25% per annum for LIBOR-based loans and 0.75% and 1.25% per annum for base-rate loans, according to average daily excess availability when financial statements are delivered. In addition to paying interest on outstanding principal under the CCLP Credit Agreement, the CCLP Borrowers are required to pay a commitment fee in respect of the unutilized commitments thereunder, initially at the rate of 0.375% per annum until the delivery of the financial statements for the fiscal quarter ending December 31, 2018 and thereafter at the applicable rate ranging from 0.250% to 0.375% per annum, paid quarterly in arrears based on utilization of the commitments under the CCLP Credit Agreement. The CCLP Borrowers are also required to pay a customary letter of credit fee equal to the applicable margin on revolving credit LIBOR loans and fronting fees.
The CCLP Credit Agreement contains certain affirmative and negative covenants, including covenants that restrict the ability of the CCLP Borrowers, the CCLP Credit Agreement Guarantors and certain of their subsidiaries to take certain actions including, among other things and subject to certain significant exceptions, incurring debt, granting liens, making investments, entering into or amending transactions with affiliates, paying dividends and selling assets. The CCLP Credit Agreement also contains a provision that requires compliance with a fixed charge coverage ratio (as defined in the CCLP Credit Agreement) of not less than 1.0 to 1.0 in the event that certain conditions associated with outstanding borrowings and cash availability occur. As of December 31, 2018, such conditions have not occurred.
All obligations under the CCLP Credit Agreement and the guarantees of those obligations are secured, subject to certain exceptions, by a first priority security interest for the benefit of the Lenders in the CCLP Borrowers’ and the CCLP Credit Agreement Guarantors’ present and future accounts receivable, inventory and related assets and proceeds of the foregoing.
CCLP Senior Notes
The obligations under the CCLP 7.25% Senior Notes (the "CCLP Senior Notes") are jointly and severally and fully and unconditionally, guaranteed on a senior unsecured basis by each of CCLP’s domestic restricted subsidiaries (other than CSI Compressco Finance) that guarantee CCLP’s other indebtedness (the "Guarantors" and together with the Issuers, the "Obligors"). The CCLP Senior Notes and the subsidiary guarantees thereof (together, the "CCLP Senior Note Securities") were issued pursuant to an indenture described below. As of December 31, 2018, $295.9 million in aggregate principal amount of the 7.25% Senior Notes are outstanding.
The Obligors issued the CCLP Senior Note Securities pursuant to the Indenture dated as of August 4, 2014 (the "CCLP Senior Notes Indenture") by and among the Obligors and U.S. Bank National Association, as trustee (the "Trustee"). The CCLP Senior Notes accrue interest at a rate of 7.25% per annum. Interest on the CCLP Senior Notes is payable semi-annually in arrears on February 15 and August 15 of each year. The CCLP Senior Notes are scheduled to mature on August 15, 2022.
The CCLP Senior Notes Indenture contains customary covenants restricting CCLP’s ability and the ability of its restricted subsidiaries to: (i) pay dividends and make certain distributions, investments and other restricted payments; (ii) incur additional indebtedness or issue certain preferred shares; (iii) create certain liens; (iv) sell assets; (v) merge, consolidate, sell or otherwise dispose of all or substantially all of its assets; (vi) enter into transactions with affiliates; and (vii) designate its subsidiaries as unrestricted subsidiaries under the CCLP Senior Notes Indenture. The CCLP Senior Notes Indenture also contains customary events of default and acceleration provisions relating to such events of default, which provide that upon an event of default under the CCLP Senior
F-31
Notes Indenture, the Trustee or the holders of at least 25% in aggregate principal amount of the CCLP Senior Notes then outstanding may declare all amounts owing under the CCLP Senior Notes to be due and payable. CCLP is in compliance with all covenants of the CCLP Senior Note Purchase Agreement as of December 31, 2018.
During September 2016 and October 2016, we repurchased on the open market and retired $54.1 million aggregate principal amount of 7.25% Senior Notes for a purchase price of $50.9 million, at an average repurchase price of 94% of the principal amount of the 7.25% Senior Notes, plus accrued interest, utilizing a portion of the net proceeds of the sale of the CCLP Preferred Units. Following the repurchase of these 7.25% Senior Notes, $295.9 million aggregate principal amount of 7.25% Senior Notes remain outstanding. In connection with the repurchase of these 7.25% Senior Notes, $1.4 million of early extinguishment net gain was credited to other (income) expense, net during the year ended December 31, 2016, representing the difference between the repurchase price and the $54.1 million aggregate principal amount of the 7.25% Senior Notes repurchased, and $1.8 million of remaining unamortized deferred finance costs and discounts associated with the repurchased 7.25% Senior Notes.
CCLP Senior Secured Notes
On March 8, 2018, CCLP, and its wholly owned subsidiary, CSI Compressco Finance Inc. (together with CCLP, the "CCLP Issuers") entered into the Purchase Agreement (the “Purchase Agreement”) with Merrill Lynch, Pierce, Fenner & Smith Incorporated as representative of the initial purchasers listed in Schedule A thereto (collectively, the “Initial Purchasers”), pursuant to which the CCLP Issuers agreed to issue and sell to the Initial Purchasers $350 million aggregate principal amount of the CCLP Issuers’ 7.50% Senior Secured First Lien Notes due 2025 (the "CCLP Senior Secured Notes") (the "CCLP Offering") pursuant to an exemption from the registration requirements of the Securities Act of 1933, as amended (the "Securities Act").
The CCLP Issuers closed the CCLP Offering on March 22, 2018. The CCLP Senior Secured Notes were issued at par for net proceeds of approximately $342.5 million, after deducting certain financing costs. CCLP used a portion of the net proceeds to repay in full and terminate its existing CCLP Prior Credit Facility and plans to use the remainder for general partnership purposes, including the expansion of its compression fleet. The obligations under the CCLP Senior Secured Notes are jointly and severally, and fully and unconditionally guaranteed on a senior secured basis by each of CCLP's domestic restricted subsidiaries (other than CSI Compressco Finance) that guarantee its indebtedness (the "CCLP Senior Secured Notes Guarantors" and together with CCLP and CSI Compressco Finance Inc, the "CCLP Senior Secured Notes Obligors"). The CCLP Senior Secured Notes and the subsidiary guarantees thereof (together, the "CCLP Senior Secured Notes Securities") were issued pursuant to an indenture described below. The CCLP Senior Secured Notes Securities are secured by a first-priority security interest in substantially all of CCLP Senior Secured Notes Obligors' assets (other than certain excluded assets) (the "Collateral") as collateral security for their obligations under the CCLP Senior Secured Notes Securities, subject to certain permitted encumbrances and exceptions. On the closing date, CCLP entered into an indenture (the "CCLP Senior Secured Notes Indenture") by and among the Obligors and U.S. Bank National Association, as trustee with respect to the Securities. The CCLP Senior Secured Notes accrue interest at a rate of 7.50% per annum. Interest on the CCLP Senior Secured Notes is payable semi-annually in arrears on April 1 and October 1 of each year, beginning October 1, 2018. The CCLP Senior Secured Notes are scheduled to mature on April 1, 2025. During the year ended December 31, 2018, CCLP incurred total financing costs of $7.6 million related to the CCLP Senior Secured Notes. These costs are deferred, netting against the carrying value of the amount outstanding.
The CCLP Senior Secured Notes Indenture contains customary covenants restricting CCLP's ability and the ability of its restricted subsidiaries to: (i) pay distributions on, purchase, or redeem CCLP common units or purchase or redeem any subordinated debt; (ii) incur or guarantee additional indebtedness or issue certain kinds of preferred equity securities; (iii) create or incur certain liens securing indebtedness; (iv) sell assets, including dispositions of the Collateral; (v) consolidate, merge, or transfer all or substantially all of CCLP's assets; (vi) enter into transactions with affiliates; and (vii) enter into agreements that restrict distributions or other payments from CCLP's restricted subsidiaries to CCLP. These covenants are subject to a number of important limitations and exceptions, including certain provisions permitting CCLP, subject to the satisfaction of certain conditions, to transfer assets to certain of its unrestricted subsidiaries. Moreover, if the CCLP Senior Secured Notes receive an investment grade rating from at least two rating agencies and no default has occurred and is continuing under the CCLP Senior Secured Notes indenture, many of the restrictive covenants in the CCLP Senior Secured Notes Indenture will be terminated. The CCLP Senior Secured Notes Indenture also contains customary events of default and acceleration provisions relating to events of default, which provide that upon an event of default under the CCLP Senior Secured Notes Indenture, the Trustee or the holders of at least 25% in aggregate principal amount of the then outstanding CCLP Senior Secured Notes may declare all of the CCLP Senior Secured Notes to be due and payable
F-32
immediately. CCLP is in compliance with all covenants of the CCLP Senior Secured Notes Indenture as of December 31, 2018.
On and after April 1, 2021, CCLP may redeem all or a part of the CCLP Senior Secured Notes, from time to time, at the following redemption prices (expressed as a percentage of principal amount), plus accrued and unpaid interest thereon to, but not including, the applicable redemption date, subject to the right of holders of record on the relevant record date to receive interest due on the relevant interest payment date, if redeemed during the 12-month period beginning on April 1 of the years indicated below:
Date | Price | ||
2021 | 105.625 | % | |
2022 | 103.750 | % | |
2023 | 101.875 | % | |
2024 | 100.000 | % | |
In addition, at any time and from time to time before April 1, 2021, CCLP may, at its option, redeem all or a portion of the CCLP Senior Secured Notes at a redemption price equal to 100% of the principal amount thereof plus the Applicable Premium (as defined in the CCLP Senior Secured Notes Indenture) with respect to the CCLP Senior Secured Notes plus accrued and unpaid interest, if any, to, but not including, the applicable redemption date, subject to the rights of holders of the CCLP Senior Secured Notes on the relevant record date to receive interest due on the relevant interest payment date.
Prior to April 1, 2021, CCLP may on one or more occasions redeem up to 35% of the principal amount of the CCLP Senior Secured Notes with an amount of cash not greater than the amount of the net cash proceeds from one or more equity offerings at a redemption price equal to 107.500% of the principal amount of the CCLP Senior Secured Notes to be redeemed, plus accrued and unpaid interest, if any, to, but not including, the date of redemption, subject to the right of holders of record on the relevant record date to receive interest due on the relevant interest payment date, provided that (a) at least 65% of the aggregate principal amount of the CCLP Senior Secured Notes originally issued on the issue date (excluding notes held by CCLP and its subsidiaries) remains outstanding after each such redemption; and (b) the redemption occurs within 180 days after the date of the closing of the equity offering.
If CCLP experiences certain kinds of changes of control, each holder of the CCLP Senior Secured Notes will be entitled to require CCLP to repurchase all or any part (equal to $2,000 or an integral multiple of $1,000 in excess of $2,000) of that holder’s CCLP Senior Secured Notes pursuant to an offer on the terms set forth in the CCLP Senior Secured Notes Indenture. CCLP will offer to make a cash payment equal to 101% of the aggregate principal amount of the CCLP Senior Secured Notes repurchased plus accrued and unpaid interest, if any, on the CCLP Senior Secured Notes repurchased to the date of repurchase, subject to the rights of holders of the CCLP Senior Secured Notes on the relevant record date to receive interest due on the relevant interest payment date.
NOTE K — CCLP SERIES A CONVERTIBLE PREFERRED UNITS
During 2016, CCLP issued an aggregate of 6,999,126 of CCLP Preferred Units for a cash purchase price of $11.43 per CCLP Preferred Unit (the “Issue Price”), resulting in total 2016 net proceeds to CCLP, after deducting certain offering expenses, of $77.3 million. We purchased 874,891 of the CCLP Preferred Units in the Initial Private Placement at the aggregate Issue Price of $10.0 million.
We and the other holders of CCLP Preferred Units (each, a “CCLP Preferred Unitholder”) receive quarterly distributions, which are paid in kind in additional CCLP Preferred Units, equal to an annual rate of 11.00% of the Issue Price ($1.2573 per unit annualized), subject to certain adjustments. The rights of the CCLP Preferred Units include certain anti-dilution adjustments, including adjustments for economic dilution resulting from the issuance of CCLP common units in the future below a set price.
Unless otherwise redeemed for cash, a ratable portion of the CCLP Preferred Units has been, and will be, converted into CCLP common units on the eighth day of each month over a period of thirty months that began in March 2017 (each, a “Conversion Date”), subject to certain provisions of the Second Amended and Restated CCLP
F-33
Partnership Agreement that may delay or accelerate all or a portion of such monthly conversions. On each Conversion Date, a portion of the CCLP Preferred Units will convert into, at CCLP's election, cash or CCLP common units representing limited partner interests in CCLP in an amount equal to, with respect to each CCLP Preferred Unitholder, the number of CCLP Preferred Units held by such CCLP Preferred Unitholder divided by the number of Conversion Dates remaining, subject to adjustment described in the Second Amended and Restated CCLP Partnership Agreement, with the conversion price (the "Conversion Price") determined by the trading prices of the common units over the prior month, among other factors, and as otherwise impacted by the existence of certain conditions related to the CCLP common units. Based on the number of CCLP Preferred Units outstanding as of December 31, 2018, the maximum aggregate number of CCLP common units that could be required to be issued pursuant to the conversion provisions of the CCLP Preferred Units is approximately 15.6 million CCLP common units; however, CCLP may, at its option, pay cash, or a combination of cash and common units, to the CCLP Preferred Unitholders instead of issuing common units on any Conversion Date, subject to certain restrictions as described in the Second Amended and Restated CCLP Partnership Agreement and the CCLP Credit Agreement. On December 20, 2018, CCLP announced that, given the decline in its common unit price, CCLP was reducing its common unit distributions for a period of up to four quarters, beginning with the February 2019 distribution. Beginning with the January 2019 conversion date, CCLP intends to use the approximately $34 million of savings from the reduced distribution to redeem the remaining CCLP Preferred Units for cash and avoid the dilution to CCLP's common unitholders that would occur if the remaining CCLP Preferred Units were converted into CCLP common units. The total number of CCLP Preferred Units outstanding as of December 31, 2018 was 2,732,981, of which we held 343,232.
Because the CCLP Preferred Units may be settled using a variable number of CCLP common units, the total fair value of the CCLP Preferred Units of $30.9 million, net of the fair value of the units we purchased of $3.9 million, is classified as long-term liabilities on our consolidated balance sheet in accordance with ASC 480 "Distinguishing Liabilities and Equity." The net fair value of the CCLP Preferred Units as of December 31, 2018 was $27.0 million. Changes in the fair value during each period, resulted in $0.7 million net decrease, $3.0 million net decrease, and $4.4 million net increase in fair value during 2018, 2017, and 2016 respectively, are charged or credited to earnings in the accompanying consolidated statements of operations.
Based on the conversion provisions of the CCLP Preferred Units, and using the Conversion Price calculated as of December 31, 2018, the theoretical number of CCLP common units that would be issued if all of the outstanding CCLP Preferred Units were converted into CCLP common units on December 31, 2018 on the same basis as the monthly conversions would be approximately 13.9 million CCLP common units, with an aggregate market value of $32.2 million. A $1 decrease in the Conversion Price would result in the issuance of 1.7 million additional CCLP common units pursuant to these conversion provisions.
NOTE L — ASSET RETIREMENT OBLIGATIONS
We operate facilities in various U.S. and foreign locations that are used in the manufacture, storage, and sale of our products, inventories, and equipment. These facilities are a combination of owned and leased assets. We are required to take certain actions in connection with the retirement of these assets. The values of our asset retirement obligations for these properties were $12.2 million and $11.7 million as of December 31, 2018 and 2017, respectively. Asset retirement obligations are recorded in accordance with ASC 410, "Asset Retirement and Environmental Obligations," whereby the estimated fair value of a liability for asset retirement obligations is recognized in the period in which it is incurred and in which a reasonable estimate can be made. Such estimates are based on relevant assumptions that we believe are reasonable. We have reviewed our obligations in this regard in detail and estimated the cost of these actions. The associated asset retirement costs are capitalized as part of the carrying amount of these long-lived assets and are depreciated on a straight-line basis over the life of the assets.
F-34
The changes in the values of our asset retirement obligations during the most recent two year period are as follows:
Year Ended December 31, | ||||||||
2018 | 2017 | |||||||
(In Thousands) | ||||||||
Beginning balance for the period, as reported | $ | 11,738 | $ | 9,912 | ||||
Activity in the period: | ||||||||
Accretion of liability | 563 | 624 | ||||||
Retirement obligations incurred | 59 | 265 | ||||||
Revisions in estimated cash flows | (123 | ) | 1,349 | |||||
Settlement of retirement obligations | (35 | ) | (412 | ) | ||||
Ending balance | $ | 12,202 | $ | 11,738 | ||||
We review the adequacy of our asset retirement obligation liabilities whenever indicators suggest that the estimated cash flows underlying the liabilities have changed.
NOTE M — COMMITMENTS AND CONTINGENCIES
Litigation
We are named defendants in several lawsuits and respondents in certain governmental proceedings arising in the ordinary course of business. While the outcome of lawsuits or other proceedings against us cannot be predicted with certainty, management does not consider it reasonably possible that a loss resulting from such lawsuits or other proceedings in excess of any amounts accrued has been incurred that is expected to have a material adverse impact on our financial condition, results of operations, or liquidity.
On March 18, 2011, we filed a lawsuit in the Circuit Court of Union County, Arkansas, asserting claims of professional negligence, breach of contract and other claims against the engineering firm we hired for engineering design, equipment, procurement, advisory, testing and startup services for our El Dorado, Arkansas chemical production facility. The engineering firm disputed our claims and promptly filed a motion to compel the matter to arbitration. After a lengthy procedural dispute in Arkansas state court, arbitration proceedings were initiated on November 15, 2013. Ultimately, on December 16, 2016, the arbitration panel ruled in our favor, declared us as the prevailing party, and awarded us a total net amount of $12.8 million. We received full payment of the $12.8 million final award on January 5, 2017, and this amount was credited to earnings during the first quarter of 2017.
Environmental
One of our subsidiaries, TETRA Micronutrients, Inc. (TMI), previously owned and operated a production facility located in Fairbury, Nebraska. TMI is subject to an Administrative Order on Consent issued to American Microtrace, Inc. (n/k/a/ TETRA Micronutrients, Inc.) in the proceeding styled In the Matter of American Microtrace Corporation, EPA I.D. No. NED00610550, Respondent, Docket No. VII-98-H-0016, dated September 25, 1998 (the "Consent Order"), with regard to the Fairbury facility. TMI is liable for ongoing environmental monitoring at the Fairbury facility under the Consent Order; however, the current owner of the Fairbury facility is responsible for costs associated with the closure of that facility. While the outcome cannot be predicted with certainty, management does not consider it reasonably possible that a loss in excess of any amounts accrued has been incurred or is expected to have a material adverse impact on our financial condition, results of operations, or liquidity.
Product Purchase Obligations
In the normal course of our Completion Fluids & Products Division operations, we enter into supply agreements with certain manufacturers of various raw materials and finished products. Some of these agreements have terms and conditions that specify a minimum or maximum level of purchases over the term of the agreement. Other agreements require us to purchase the entire output of the raw material or finished product produced by the manufacturer. Our purchase obligations under these agreements apply only with regard to raw materials and finished products that meet specifications set forth in the agreements. We recognize a liability for the purchase of
F-35
such products at the time we receive them. As of December 31, 2018, the aggregate amount of the fixed and determinable portion of the purchase obligation pursuant to our Completion Fluids & Products Division’s supply agreements was approximately $104.0 million, including $9.5 million during 2019, $9.5 million during 2020, $9.5 million during 2021, $9.5 million during 2022, $9.5 million during 2023, and $56.5 million thereafter, extending through 2029. Amounts purchased under these agreements for each of the years ended December 31, 2018, 2017, and 2016, was $18.0 million, $16.1 million, and $13.3 million, respectively.
Contingencies of Discontinued Operations
During 2011, in connection with the sale of a significant majority of Maritech's oil and gas producing properties, the buyers of the properties assumed the associated decommissioning liabilities pursuant to the purchase and sale agreements. To the extent that a buyer of these properties fails to perform the abandonment and decommissioning work required, a previous owner, including Maritech, may be required to perform the abandonment and decommissioning obligation. As the former parent company of Maritech, we also may be responsible for performing these abandonment and decommissioning obligations. In March 2018, we closed the Maritech Asset Purchase Agreement with Orinoco that provided for the purchase by Orinoco of the Maritech Properties. Also in March 2018, we finalized the Maritech Equity Purchase Agreement with Orinoco that provided for the purchase by Orinoco of the Maritech Equity Interests. As discussed in Note E - "Acquisitions and Dispositions," pursuant to the Bonding Agreement, Orinoco is required to replace, within 90 days following the closing, the initial bonds delivered at closing with non-revocable performance bonds, meeting certain requirements, in the aggregate sum of $47.0 million. Orinoco has not delivered such replacement bonds and we are seeking to enforce the terms of the Bonding Agreement. The non-revocable performance bonds delivered at the closing remain in effect. As a result of these transactions, we have effectively exited the businesses of our Offshore Services and Maritech segments and Orinoco assumed all of Maritech's remaining abandonment and decommissioning obligations.
NOTE N — CAPITAL STOCK AND WARRANTS
Our Restated Certificate of Incorporation, as amended during 2017, authorizes us to issue 250,000,000 shares of common stock, par value $.01 per share, and 5,000,000 shares of preferred stock, par value $.01 per share. As of December 31, 2018, we had 125,737,565 shares of common stock outstanding, with 2,717,569 shares held in treasury, and no shares of preferred stock outstanding. The voting, dividend, and liquidation rights of the holders of common stock are subject to the rights of the holders of preferred stock. The holders of common stock are entitled to one vote for each share held. There is no cumulative voting. Dividends may be declared and paid on common stock as determined by our Board of Directors, subject to any preferential dividend rights of any then outstanding preferred stock.
Issuances of Common Stock. On February 28, 2018, we issued 7,772,021 shares of our common stock as part of the consideration paid for the acquisition of SwiftWater. For further discussion of the SwiftWater acquisition, see Note E - "Acquisitions and Dispositions."
On June 21, 2016, we completed an underwritten public offering of 11.5 million shares of our common stock, which included 1.5 million shares of common stock pursuant to an option granted to the underwriters to purchase additional shares, at a price to the public of $5.50 per share ($5.2525 per share net of underwriting discounts). We utilized the net offering proceeds of $60.2 million to repay the remaining balance outstanding of certain senior secured notes, to reduce the balance outstanding under our previous bank credit agreement, to pay offering related discounts and expenses, and for general corporate purposes. The offering was made pursuant to a shelf registration statement filed with the SEC on March 23, 2016.
On December 14, 2016, we completed a firm commitment underwritten offering of 22.3 million shares of our common stock at a price to the public of $5.15 per share ($4.9183 per share net of underwriting discounts) and the Warrants to purchase 11.2 million shares of our common stock at an exercise price of $5.75 per share prior to the 60-month expiration date of the Warrants. The 22.3 million shares of our common stock issued and the Warrants to purchase 11.2 million shares of our common stock includes 2.9 million shares of our common stock and Warrants to acquire an additional 1.5 million shares of our common stock related to the exercise of an option granted to the underwriters. We utilized the net offering proceeds of $109.7 million to repay outstanding indebtedness and other offering expenses. As of December 31, 2018, all of the Warrants remain outstanding.
The Warrants were issued pursuant to a Warrant Agreement, dated December 14, 2016, and are exercisable immediately upon issuance and from time to time thereafter through and including the fifth year anniversary of the
F-36
initial issuance date. At the request of a holder following a change of control, we or the successor entity will exchange such Warrant for consideration in accordance with a Black Scholes option pricing model in the form of, at our election, Rights (as defined in the Warrant Agreement) or cash. Similarly, within a period of time prior to the consummation of a change of control, we have the right to redeem all of the Warrants for cash in an amount determined in accordance with a Black-Scholes option pricing model.
The Warrants are accounted for as a derivative liability in accordance with ASC 815 "Derivatives and Hedging" and accordingly are carried at their fair value, with changes in fair value included in earnings in the period of change. As of December 31, 2018 and 2017, the fair value of the Warrants was $2.1 million and $13.2 million, respectively. Changes in fair value during the year included a $11.1 million change in fair value credited to earnings during 2018, a $5.3 million change in fair value credited to earnings during 2017, and a $2.1 million change in fair value charged to earnings during 2016. In connection with the Warrants, approximately $0.9 million of the $6.5 million total issuance costs, including underwriting discounts, associated with the December 2016 offering was charged to earnings.
A summary of the activity of our common shares outstanding and treasury shares held for the three year period ending December 31, 2018, is as follows:
Common Shares Outstanding | Year Ended December 31, | ||||||||
2018 | 2017 | 2016 | |||||||
At beginning of period | 115,877,704 | 114,985,072 | 80,256,544 | ||||||
Exercise of common stock options, net | 65,524 | — | 636,937 | ||||||
Grants of restricted stock, net | 2,022,316 | 892,632 | 281,591 | ||||||
Issuance of common stock | 7,772,021 | — | 33,810,000 | ||||||
At end of period | 125,737,565 | 115,877,704 | 114,985,072 | ||||||
Treasury Shares Held | Year Ended December 31, | ||||||||
2018 | 2017 | 2016 | |||||||
At beginning of period | 2,638,093 | 2,536,421 | 2,281,495 | ||||||
Shares received upon exercise of common stock options | — | — | 13,854 | ||||||
Shares received upon vesting of restricted stock, net | 79,476 | 101,672 | 241,072 | ||||||
At end of period | 2,717,569 | 2,638,093 | 2,536,421 | ||||||
Our Board of Directors is empowered, without approval of the stockholders, to cause shares of preferred stock to be issued in one or more series and to establish the number of shares to be included in each such series and the rights, powers, preferences, and limitations of each series. Because the Board of Directors has the power to establish the preferences and rights of each series, it may afford the holders of any series of preferred stock preferences, powers and rights, voting or otherwise, senior to the rights of holders of common stock. The issuance of the preferred stock could have the effect of delaying or preventing a change in control of the Company.
Upon our dissolution or liquidation, whether voluntary or involuntary, holders of our common stock will be entitled to receive all of our assets available for distribution to our stockholders, subject to any preferential rights of any then outstanding preferred stock.
In January 2004, our Board of Directors authorized the repurchase of up to $20.0 million of our common stock. During the three years ending December 31, 2018, we made no purchases of our common stock pursuant to this authorization.
F-37
NOTE O — EQUITY-BASED COMPENSATION
We have various equity incentive compensation plans that provide for the granting of restricted common stock, options for the purchase of our common stock, and other performance-based, equity-based compensation awards to our executive officers, key employees, nonexecutive officers, and directors. Stock options are exercisable for periods of up to ten years. Compensation cost for all share-based payments is based on the grant date fair value and is recognized in earnings over the requisite service period. Total equity-based compensation expense, before tax, for the three years ended December 31, 2018, 2017, and 2016, was $7.4 million, $7.8 million, and $13.7 million, respectively, and is included in general and administrative expense. Total equity-based compensation expense, net of taxes, for the three years ended December 31, 2018, 2017, and 2016, was $5.8 million, $5.0 million, and $9.5 million, respectively.
Stock Incentive Plans
In May 2007, our stockholders approved the adoption of the TETRA Technologies, Inc. 2007 Equity Incentive Compensation Plan. In May 2008, our stockholders approved the adoption of the TETRA Technologies, Inc. Amended and Restated 2007 Equity Incentive Compensation Plan, which among other changes, resulted in an increase in the maximum number of shares authorized for issuance. In May 2010, our stockholders approved further amendments to the TETRA Technologies, Inc. Amended and Restated 2007 Equity Incentive Compensation Plan (renamed as the 2007 Long Term Incentive Compensation Plan) which, among other changes, resulted in an additional increase in the maximum number of shares authorized for issuance. Pursuant to the 2007 Long Term Incentive Compensation Plan, we are authorized to grant up to 5,590,000 shares in the form of stock options (including incentive stock options and nonqualified stock options); restricted stock; bonus stock; stock appreciation rights; and performance awards to employees, and non-employee directors. As of February 2017, no further awards may be granted under the TETRA Technologies, Inc. Amended and Restated 2007 Equity Incentive Compensation Plan.
In May 2011, our stockholders approved the adoption of the TETRA Technologies, Inc. 2011 Long Term Incentive Compensation Plan. Pursuant to this plan, we were authorized to grant up to 2,200,000 shares in the form of stock options, restricted stock, bonus stock, stock appreciation rights, and performance awards to employees, and non-employee directors. On May 3, 2013, shareholders approved the TETRA Technologies, Inc. 2011 Long Term Incentive Compensation Plan that, among other things, increased the number of authorized shares to 5,600,000. On May 3, 2016, shareholders approved the TETRA Technologies, Inc. Third Amended and Restated 2011 Long Term Incentive Compensation Plan which, among other things, increased the number of authorized shares to 11,000,000. As of May 2018, no further awards may be granted under the TETRA Technologies, Inc. Third Amended and Restated 2011 Long Term Incentive Compensation Plan.
In June 2011, the Compressco Partners, L.P. 2011 Long Term Incentive Plan ("CCLP Long Term Incentive Plan") was adopted by the board of directors of CCLP’s general partner. The CCLP Long Term Incentive Plan provides for grants of restricted units, phantom units, unit awards and other unit-based awards up to a plan maximum of 1,537,122 common units. On November 28, 2018, unitholders approved the CSI Compressco LP Second Amended and Restated 2011 Long Term Incentive Plan that, among other things, increased the number of authorized units to 5,037,122.
In February 2018, the board of directors adopted the 2018 Inducement Restricted Stock Plan (“2018 Inducement Plan”). The 2018 Inducement Plan provides for grants of restricted stock up to a plan maximum of 1,000,000 shares.
In May 2018, our stockholders approved the adoption of the TETRA Technologies, Inc. 2018 Equity Incentive Plan (“2018 Equity Plan”). Pursuant to this plan, we were authorized to grant up to 6,635,000 shares in the form of stock options, restricted stock, restricted stock units, bonus stock, stock appreciation rights, performance units, performance awards, other stock-based awards and cash-based awards to employees and non-employee directors.
In May 2018, our stockholders approved the adoption of the TETRA Technologies, Inc. 2018 Non-Employee Director Equity Incentive Plan (“2018 Director Plan”). Pursuant to this plan, we were authorized to grant up to 335,000 shares in the form of nonqualified stock options, stock appreciation rights, restricted stock, restricted stock units, other stock‑based awards and cash-based awards to non-employee directors.
F-38
Grants of Equity Awards by CCLP
During each of the three years ended December 31, 2018, CCLP granted restricted unit, phantom unit, or performance phantom unit awards to certain employees, officers, and directors of its general partner or of our employees. Awards of restricted units and phantom units generally vest over a three year period. Awards of performance phantom units cliff vest at the end of a performance period and are settled based on achievement of related performance measures over the performance period. Phantom units are notional units that entitle the grantee to receive a common unit upon the vesting of the award. Each of the phantom unit and performance phantom unit awards includes distribution equivalent rights that enable the recipient to receive additional units equal in value to the accumulated cash distributions made on the units subject to the award from the date of grant. Accumulated distributions associated with each underlying unit are payable upon settlement of the related phantom unit award (and are forfeited if the related award is forfeited).
The following is a summary of CCLP’s equity award activity for the year ended December 31, 2018:
Units | Weighted Average Grant Date Fair Value Per Unit | ||||||
(In Thousands) | |||||||
Nonvested units outstanding at December 31, 2017 | 469 | $ | 9.31 | ||||
Units granted(1) | 330 | 7.33 | |||||
Units canceled | (186 | ) | 8.96 | ||||
Units vested | (121 | ) | 12.37 | ||||
Nonvested units outstanding at December 31, 2018(2) | 492 | $ | 7.36 | ||||
(1) | The number excludes 93,996 performance-based phantom units, which represents the additional number of common units that would be issued if the maximum level of performance under the awards is achieved. |
(2) The number of units granted shown above excludes 15,422 performance-based phantom units, which, when combined with the 93,996 granted (net of 2018 forfeitures), represents the maximum number of common units that would be issued if the maximum level of performance under the awards is achieved. The number of units actually issued under the awards may range from zero to 218,836.
Stock Options
The weighted average fair value of options granted during the years ended December 31, 2018, 2017, and 2016, was $1.88, $2.01, and $3.16, respectively, using the Black-Scholes option valuation model with the following weighted average assumptions:
Year Ended December 31, | |||||||||
2018 | 2017 | 2016 | |||||||
Expected stock price volatility | 57% | 53% | 52% | ||||||
Expected life of options | 4.5 years | 4.5 years | 4.6 years | ||||||
Risk free interest rate | 2.6% | 1.8% | 1.2% | ||||||
Expected dividend yield | — | — | — | ||||||
The risk-free interest rate is based on the U.S. Treasury yield curve in effect on the grant date for a period commensurate with the estimated expected life of the stock options. Expected volatility is based on the historical volatility of our stock over the period commensurate with the expected life of the stock options and other factors. The dividend yield is based on the current annualized dividend rate in effect during the quarter in which the grant was made. At the time of the stock option grants during each of the years ended December 31, 2018, 2017 and 2016, we had not historically paid any dividends and did not expect to pay any dividends during the expected life of the stock options.
F-39
The following is a summary of stock option activity for the year ended December 31, 2018:
Shares Under Option | Weighted Average Option Price Per Share | Weighted-Average Remaining Contractual Life | Aggregate Intrinsic Value (in thousands) | ||||||||||
(In Thousands) | |||||||||||||
Outstanding at January 1, 2018 | 5,217 | $ | 8.59 | ||||||||||
Options granted | 791 | 3.89 | |||||||||||
Options canceled | (922 | ) | 6.97 | ||||||||||
Options exercised | (66 | ) | 3.78 | ||||||||||
Options expired | (540 | ) | $ | 21.16 | |||||||||
Outstanding at December 31, 2018 | 4,480 | $ | 6.65 | 5.9 | $ | — | |||||||
Expected to vest at December 31, 2018 | 4,480 | $ | 6.65 | 5.9 | $ | — | |||||||
Exercisable at December 31, 2018 | 3,324 | $ | 7.48 | 4.9 | $ | — | |||||||
Intrinsic value is the difference between the market value of our stock option multiplied by the number of stock options outstanding for those stock options where the market value exceeds their exercise price. The total intrinsic value of stock options exercised during December 31, 2018, 2017, and 2016, was approximately $0.1 million, $0.0 million, and $0.1 million, respectively.
At December 31, 2018, total unrecognized compensation cost related to unvested stock options of
$1.8 million is expected to be recognized over a weighted-average remaining service period of 1.50 years.
Restricted Stock
Restricted stock awards are periodically granted to key employees, including grants for employment inducements, as well as to members of our Board of Directors. Employee awards provide for vesting periods ranging from three to five years. Non-employee director grants vest in full before the first anniversary of the grant. Upon vesting of these grants, shares are issued to award recipients. The following is a summary of activity for our outstanding restricted stock awards for the year ended December 31, 2018:
Shares | Weighted Average Grant Date Fair Value Per Share | ||||||
(In Thousands) | |||||||
Nonvested restricted shares outstanding at December 31, 2017 | 1,036 | $ | 5.06 | ||||
Granted | 2,509 | 3.72 | |||||
Vested | (657 | ) | 4.93 | ||||
Canceled/Forfeited | (309 | ) | 4.68 | ||||
Nonvested restricted shares outstanding at December 31, 2018 | 2,579 | $ | 3.84 | ||||
Total compensation cost recognized for restricted stock awards was $4.9 million, $4.0 million, and $8.4 million for the years ended December 31, 2018, 2017, and 2016, respectively. Total unrecognized compensation cost at December 31, 2018, related to restricted stock awards is approximately $6.9 million which is expected to be recognized over a weighted-average remaining amortization period of 1.95 years. During the years ended December 31, 2018, 2017, and 2016, the total fair value of shares vested was $3.2 million, $4.8 million and $8.4 million, respectively.
During 2018, 2017, and 2016, we received 79,476, 101,669 and 254,858 shares, respectively, of our common stock related to the vesting of certain employee restricted stock. Such surrendered shares received by us are included in treasury stock. At December 31, 2018, net of options previously exercised pursuant to our various equity compensation plans, we have a maximum of 6,373,059 shares of common stock issuable pursuant to awards previously granted and outstanding and awards authorized to be granted in the future.
F-40
NOTE P — 401(k) PLAN
We have a 401(k) retirement plan (the "Plan") that covers substantially all employees and entitles them to contribute up to 70% of their annual compensation, subject to maximum limitations imposed by the Internal Revenue Code. We have historically matched 50% of each employee’s contribution up to 6% of annual compensation, subject to certain limitations as outlined in the Plan. Beginning in May 2016, we suspended the matching of employee contributions for an indefinite period. In August 2017, the matching of employee contributions was reinstated. Effective October 1, 2018, enhancements were made to the plan, including changing the employer match to 100% of each employee's contribution up to 4%. Additionally, participants will be 100% vested in employer match contributions after 3 years of service, instead of after 5 years of service. In addition, we can make discretionary contributions which are allocable to participants in accordance with the Plan. Total expense related to our 401(k) plan was $3.8 million, $0.9 million, and $1.4 million in 2018, 2017, and 2016, respectively.
NOTE Q — DEFERRED COMPENSATION PLAN
We provide our officers, directors, and certain key employees with the opportunity to participate in an unfunded, deferred compensation program. There were twenty-two participants in the program at December 31, 2018. Under the program, participants may defer up to 100% of their yearly total cash compensation. The amounts deferred remain our sole property, and we use a portion of the proceeds to purchase life insurance policies on the lives of certain of the participants. The insurance policies, which also remain our sole property, are payable to us upon the death of the insured. We separately contract with the participant to pay to the participant the amount of deferred compensation, as adjusted for gains or losses, invested in participant-selected investment funds. Participants may elect to receive deferrals and earnings at termination, death, or at a specified future date while still employed. Distributions while employed must be at least three years after the deferral election. The program is not qualified under Section 401 of the Internal Revenue Code. At December 31, 2018, the amounts payable under the plan approximated the value of the corresponding assets we owned.
NOTE R — FAIR VALUE MEASUREMENTS
Fair value is defined as “the price that would be received to sell an asset or paid to transfer a liability in an orderly transaction between market participants at the measurement date” within an entity’s principal market, if any. The principal market is the market in which the reporting entity would sell the asset or transfer the liability with the greatest volume and level of activity, regardless of whether it is the market in which the entity will ultimately transact for a particular asset or liability or if a different market is potentially more advantageous. Accordingly, this exit price concept may result in a fair value that may differ from the transaction price or market price of the asset or liability.
Under U.S. GAAP, the fair value hierarchy prioritizes inputs to valuation techniques used to measure fair value. Fair value measurements should maximize the use of observable inputs and minimize the use of unobservable inputs, where possible. Observable inputs are developed based on market data obtained from sources independent of the reporting entity. Unobservable inputs may be needed to measure fair value in situations where there is little or no market activity for the asset or liability at the measurement date and are developed based on the best information available in the circumstances, which could include the reporting entity’s own judgments about the assumptions market participants would utilize in pricing the asset or liability.
Financial Instruments
CCLP Preferred Units
The CCLP Preferred Units are valued using a lattice modeling technique that, among a number of lattice structures, includes significant unobservable items (a Level 3 fair value measurement). These unobservable items include (i) the volatility of the trading price of CCLP's common units compared to a volatility analysis of equity prices of CCLP's comparable peer companies, (ii) a yield analysis that utilizes market information related to the debt yields of comparable peer companies, and (iii) a future conversion price analysis. The fair valuation of the CCLP Preferred Units liability is increased by, among other factors, projected increases in CCLP's common unit price and by increases in the volatility and decreases in the debt yields of CCLP's comparable peer companies. Increases (or decreases) in the fair value of CCLP Preferred Units will increase (decrease) the associated liability and result in future adjustments to earnings for the associated valuation losses (gains). During the years ended December 31,
F-41
2018, 2017, and 2016 the changes in the fair value of the CCLP Preferred Units resulted in $0.7 million credited to earnings, $3.0 million credited to earnings, and $4.4 million charged to earnings, respectively, in the consolidated statement of operations.
Warrants
The Warrants are valued either by using their traded market prices (a Level 1 fair value measurement) or, for periods when market prices are not available, by using the Black Scholes option valuation model that includes estimates of the volatility of the Warrants implied by their trading prices (a Level 3 fair value measurement). As of December 31, 2018 and 2017, the fair valuation methodology utilized for the Warrants was a Level 3 fair value measurement, as there were no available traded market prices to value the Warrants. The fair valuation of the Warrants liability is increased by, among other factors, increases in our common stock price, and by increases in the volatility of our common stock price. Increases (or decreases) in the fair value of the Warrants will increase (decrease) the associated liability and result in future adjustments to earnings for the associated valuation losses (gains). During the years ended December 31, 2018, 2017, and 2016, the changes in the fair value of the Warrants liability resulted in $11.1 million credited to earnings, $5.3 million credited to earnings, and $2.1 million charged to earnings, respectively, in the consolidated statement of operations.
Acquisition Contingent Consideration
As part of the purchase of SwiftWater during the first quarter of 2018, the sellers have the right to receive contingent consideration payments, in an aggregate amount of up to $15.0 million, calculated based on EBITDA and revenue of the combined water management business of SwiftWater and our pre-existing operations in the Permian Basin in respect of the period from January 1, 2018 through December 31, 2019. The contingent consideration may be paid in cash or shares of our common stock, at our election. The fair value of the contingent consideration is based on a probability simulation utilizing forecasted revenues and EBITDA of the water management business of SwiftWater and all of our pre-existing operations in the Permian Basin (a Level 3 fair value measurement). During the period from the closing date to December 31, 2018, the estimated fair value for the liabilities associated with the contingent purchase price consideration increased to $11.0 million, resulting in $3.4 million being charged to other (income) expense, net, during the year ended December 31, 2018. In addition, as part of the purchase of JRGO during December 2018, the sellers have the right to receive contingent consideration of up to $1.5 million to be paid during 2019, based on JRGO's performance during the fourth quarter of 2018. Approximately $11.5 million of the $12.5 million combined contingent consideration liability is based on actual 2018 performance, with the remaining being a fair value measurement based on a forecast of SwiftWater 2019 revenues and EBITDA.
Derivative Contracts
We are exposed to financial and market risks that affect our businesses. We have concentrations of credit risk as a result of trade receivables owed to us by companies in the energy industry. We have currency exchange rate risk exposure related to transactions denominated in foreign currencies as well as to investments in certain of our international operations. As a result of our variable rate debt facilities, we face market risk exposure related to changes in applicable interest rates. Our financial risk management activities may at times involve, among other measures, the use of derivative financial instruments, such as swap and collar agreements, to hedge the impact of market price risk exposures. For these fair value measurements, we utilize the quoted value (a Level 2 fair value measurement).
We and CCLP each enter into short term foreign currency forward derivative contracts with third parties as part of a program designed to mitigate the currency exchange rate risk exposure on selected transactions of certain foreign subsidiaries. As of December 31, 2018, we and CCLP had the following foreign currency derivative contracts outstanding relating to portions of our foreign operations:
F-42
Derivative Contracts | U.S. Dollar Notional Amount | Traded Exchange Rate | Settlement Date | ||||||
(In Thousands) | |||||||||
Forward purchase euro | $ | 3,571 | 1.18 | 3/15/2019 | |||||
Forward purchase euro | $ | 3,585 | 1.18 | 3/15/2019 | |||||
Forward sale euro | $ | 1,930 | 1.14 | 1/17/2019 | |||||
Forward purchase pounds sterling | $ | 948 | 1.26 | 1/17/2019 | |||||
Forward sale Canadian dollar | $ | 5,942 | 1.35 | 1/17/2019 | |||||
Forward purchase Mexican peso | $ | 1,086 | 20.25 | 1/17/2019 | |||||
Forward sale Norwegian krone | $ | 975 | 8.72 | 1/17/2019 | |||||
Forward sale Mexican peso | $ | 4,783 | 20.07 | 1/17/2019 | |||||
Derivative Contracts | British Pound Notional Amount | Traded Exchange Rate | Settlement Date | ||||||
(In Thousands) | |||||||||
Forward purchase euro | £ | 1,173 | 0.90 | 1/17/2019 | |||||
As of December 31, 2017, we and CCLP had the following foreign currency derivative contracts outstanding relating to a portion of our foreign operations:
Derivative Contracts | US Dollar Notional Amount | Traded Exchange Rate | Settlement Date | |||||
(In Thousands) | ||||||||
Forward purchase euro | $ | 1,743 | 1.19 | 1/18/2018 | ||||
Forward purchase pounds sterling | $ | 5,998 | 1.33 | 1/18/2018 | ||||
Forward sale Canadian dollar | $ | 3,756 | 1.29 | 1/18/2018 | ||||
Forward purchase Mexican peso | $ | 6,974 | 19.28 | 1/18/2018 | ||||
Forward sale Norwegian krone | $ | 4,131 | 8.40 | 1/18/2018 | ||||
Forward sale Mexican peso | $ | 6,067 | 19.28 | 1/18/2018 | ||||
Under this program, we and CCLP may enter into similar derivative contracts from time to time. Although contracts pursuant to this program will serve as an economic hedge of the cash flow of our currency exchange risk exposure, they are not formally designated as hedge contracts or qualify for hedge accounting treatment. Accordingly, any change in the fair value of these derivative instruments during a period will be included in the determination of earnings for that period.
The fair values of foreign currency derivative instruments are based on quoted market values (a Level 2 fair value measurement). The fair values of our and CCLP's foreign currency derivative instruments as of December 31, 2018 and 2017, are as follows:
Foreign currency derivative instruments | Balance Sheet Location | Fair Value at December 31, 2018 | Fair Value at December 31, 2017 | ||||||
(In Thousands) | |||||||||
Forward purchase contracts | Current assets | $ | 41 | $ | 111 | ||||
Forward sale contracts | Current assets | 76 | 130 | ||||||
Forward sale contracts | Current liabilities | (126 | ) | (255 | ) | ||||
Forward purchase contracts | Current liabilities | (168 | ) | (113 | ) | ||||
Total | $ | (177 | ) | $ | (127 | ) | |||
None of the foreign currency derivative contracts contain credit risk related contingent features that would require us to post assets or collateral for contracts that are classified as liabilities. During the year ended December 31, 2018, 2017, and 2016, we recognized approximately $(0.4) million, $(1.3) million and $2.0 million of
F-43
net (gains) losses, respectively, reflected in other (income) expense, net, associated with our foreign currency derivative program.
A summary of these recurring fair value measurements by valuation hierarchy as of December 31, 2018 and December 31, 2017, is as follows:
Fair Value Measurements Using | ||||||||||||||||
Total as of | Quoted Prices in Active Markets for Identical Assets or Liabilities | Significant Other Observable Inputs | Significant Unobservable Inputs | |||||||||||||
Description | Dec 31, 2018 | (Level 1) | (Level 2) | (Level 3) | ||||||||||||
(In Thousands) | ||||||||||||||||
CCLP Series A Preferred Units | $ | (27,019 | ) | $ | — | $ | — | $ | (27,019 | ) | ||||||
Warrants liability | (2,073 | ) | — | — | (2,073 | ) | ||||||||||
Asset for foreign currency derivative contracts | 117 | — | 117 | — | ||||||||||||
Liability for foreign currency derivative contracts | (294 | ) | — | (294 | ) | — | ||||||||||
Acquisition contingent consideration liability | (12,452 | ) | — | — | (12,452 | ) | ||||||||||
Total | $ | (41,721 | ) | |||||||||||||
Fair Value Measurements Using | ||||||||||||||||
Total as of | Quoted Prices in Active Markets for Identical Assets or Liabilities | Significant Other Observable Inputs | Significant Unobservable Inputs | |||||||||||||
Description | Dec 31, 2017 | (Level 1) | (Level 2) | (Level 3) | ||||||||||||
(In Thousands) | ||||||||||||||||
CCLP Series A Preferred Units | $ | (61,436 | ) | $ | — | $ | — | $ | (61,436 | ) | ||||||
Warrants liability | (13,202 | ) | — | — | (13,202 | ) | ||||||||||
Asset for foreign currency derivative contracts | 241 | — | 241 | — | ||||||||||||
Liability for foreign currency derivative contracts | (378 | ) | — | (378 | ) | — | ||||||||||
Total | $ | (74,775 | ) | |||||||||||||
During 2018, our Water & Flowback Services Division recorded certain long-lived asset impairments, primarily related to an identified intangible asset resulting from decreased expected future cash flows from a Water & Flowback Services segment customer contract. During 2017, our Water & Flowback Services segment recorded certain long-lived asset impairments, primarily related to an identified intangible asset resulting from decreased expected future cash flows from a Water & Flowback Services segment customer contract. For further discussion, see Note B - Basis of Presentation and Significant Accounting Policies "Impairment of Long-Lived Assets." The fair values used in these impairment calculations were estimated based on discounted estimated future cash flows, which is based on significant unobservable inputs (Level 3) in accordance with the fair value hierarchy. A summary of these nonrecurring fair value measurements during the year ended December 31, 2018, using the fair value hierarchy, is as follows:
F-44
Fair Value Measurements Using | |||||||||||||||||
Quoted Prices in Active Markets for Identical Assets or Liabilities (Level 1) | Significant Other Observable Inputs (Level 2) | Significant Unobservable Inputs (Level 3) | Year-to-Date Impairment Losses | ||||||||||||||
Description | Fair Value | ||||||||||||||||
(In Thousands) | |||||||||||||||||
Water & Flowback Services intangible assets | — | — | — | — | 2,940 | ||||||||||||
Total | $ | — | $ | 2,940 | |||||||||||||
A summary of these nonrecurring fair value measurements during the year ended December 31, 2017, using the fair value hierarchy, is as follows:
Fair Value Measurements Using | |||||||||||||||||
Fair Value as of | Quoted Prices in Active Markets for Identical Assets or Liabilities (Level 1) | Significant Other Observable Inputs (Level 2) | Significant Unobservable Inputs (Level 3) | Year-to-Date Impairment Losses | |||||||||||||
Description | Dec 31, 2017 | ||||||||||||||||
(In Thousands) | |||||||||||||||||
Water & Flowback Services equipment | — | — | — | — | 324 | ||||||||||||
Water & Flowback Services intangible assets | 3,206 | — | — | 3,206 | 14,552 | ||||||||||||
Total | $ | 3,206 | $ | 14,876 | |||||||||||||
The fair values of cash, restricted cash, accounts receivable, accounts payable, short-term borrowings and long-term debt pursuant to TETRA's ABL Credit Agreement and Term Credit Agreement, and the CCLP Credit Agreement approximate their carrying amounts. The fair value of our long-term 11% Senior Note at December 31, 2017, was approximately$130.8 million, based on current interest rates on that date, which was different from the stated interest rate on the 11% Senior Note of $125.0 million at December 31, 2017. The fair values of the publicly traded CCLP 7.25% Senior Notes (as herein defined) at December 31, 2018 and 2017, were approximately $266.3 million and $279.7 million, respectively. Those fair values compare to the face amount of $295.9 million both at December 31, 2018 and 2017. The fair value of the publicly traded CCLP 7.50% Senior Secured Notes at December 31, 2018 was approximately $332.5 million. This fair value compares to aggregate principal amount of such notes at December 31, 2018 of $350.0 million. We calculated the fair value of our 11% Senior Note as of December 31, 2017 internally, using current market conditions and average cost of debt (a Level 2 fair value measurement). We based the fair values of the CCLP 7.25% Senior Notes and the CCLP 7.50% Senior Secured Notes as of December 31, 2018 on recent trades for these notes. See Note J - "Long-Term Debt and Other Borrowings," for a complete discussion of our debt.
NOTE S — NET INCOME (LOSS) PER SHARE
The following is a reconciliation of the weighted average number of common shares outstanding with the number of shares used in the computations of net income (loss) per common and common equivalent share for each of the following periods:
Year Ended December 31, | |||||||||
2018 | 2017 | 2016 | |||||||
(In Thousands) | |||||||||
Number of weighted average common shares outstanding | 124,101 | 114,499 | 87,286 | ||||||
Assumed exercise of equity awards and warrants | — | — | — | ||||||
Average diluted shares outstanding | 124,101 | 114,499 | 87,286 | ||||||
F-45
For the years ended December 31, 2018, 2017 and 2016, the average diluted shares outstanding excludes the impact of all outstanding equity awards and warrants, as the inclusion of these shares would have been anti-dilutive due to the net losses recorded during the year. In addition, for the years ended December 31, 2018, 2017, and 2016, the calculation of diluted earnings per common share excludes the impact of the CCLP Preferred Units, as the inclusion of the impact from conversion of the CCLP Preferred Units (as defined in Note K) into CCLP common units would have been anti-dilutive.
NOTE T — INDUSTRY SEGMENTS AND GEOGRAPHIC INFORMATION
Following the acquisition of SwiftWater and the disposition of the Offshore Division during the three month period ended March 31, 2018, we reorganized our reporting segments and now manage our operations through three divisions: Completion Fluids & Products, Water & Flowback Services, and Compression. Our Completion Fluids & Products Division was previously reported as our Fluids Division, and included our water management services operations. Following the acquisition of SwiftWater in February 2018, our expanded water management operations are now included with our production testing operations as part of our Water & Flowback Services Division. The operations of our previous Offshore Division, consisting of our previous Offshore Services and Maritech segments, are now reported as discontinued operations following their disposal in March 2018.
Our Completion Fluids & Products Division manufactures and markets clear brine fluids ("CBFs"), additives, and associated products and services to the oil and gas industry for use in well drilling, completion and workover operations in the United States and in certain countries in Latin America, Europe, Asia, the Middle East and Africa. The Division also markets liquid and dry calcium chloride products manufactured at its production facilities or purchased from third-party suppliers to a variety of markets outside the energy industry.
Our Water & Flowback Services Division provides onshore oil and gas operators with comprehensive water management services. The Division also provides frac flowback, production well testing, offshore rig cooling, and other associated services in many of the major oil and gas producing regions in the United States, Mexico, and Canada, as well as in oil and gas basins in certain regions in South America, Africa, Europe, the Middle East, and Australia.
Our Compression Division is a provider of compression services and equipment for natural gas and oil production, gathering, transportation, processing, and storage. The Compression Division's equipment sales business includes the fabrication and sale of standard compressor packages and custom-designed compressor packages designed and fabricated at the Division's facilities. The Compression Division's aftermarket business provides compressor package reconfiguration and maintenance services and compressor package parts and components manufactured by third-party suppliers. The Compression Division provides its services and equipment to a broad base of natural gas and oil exploration and production, midstream, transmission, and storage companies operating throughout many of the onshore producing regions of the United States, as well as in a number of foreign countries, including Mexico, Canada and Argentina.
We generally evaluate the performance of and allocate resources to our segments based on profit or loss from their operations before income taxes and nonrecurring charges, return on investment, and other criteria. Transfers between segments and geographic areas are priced at the estimated fair value of the products or services as negotiated between the operating units. “Corporate overhead” includes corporate general and administrative expenses, corporate depreciation and amortization, interest income and expense, and other income and expense.
F-46
Summarized financial information concerning the business segments is as follows:
Year Ended December 31, | ||||||||||||
2018 | 2017 | 2016 | ||||||||||
(In Thousands) | ||||||||||||
Revenues from external customers | ||||||||||||
Product sales | ||||||||||||
Completion Fluids & Products Division | $ | 242,412 | $ | 226,132 | $ | 176,720 | ||||||
Water & Flowback Services Division | 1,961 | 12,581 | 162 | |||||||||
Compression Division | 164,854 | 66,691 | 71,809 | |||||||||
Consolidated | $ | 409,227 | $ | 305,404 | $ | 248,691 | ||||||
Services | ||||||||||||
Completion Fluids & Products Division | $ | 15,002 | $ | 31,688 | $ | 28,349 | ||||||
Water & Flowback Services Division | 300,727 | 157,110 | 100,786 | |||||||||
Compression Division | 273,819 | 228,896 | 239,565 | |||||||||
Consolidated | $ | 589,548 | $ | 417,694 | $ | 368,700 | ||||||
Interdivision revenues | ||||||||||||
Completion Fluids & Products Division | $ | (6 | ) | $ | 31 | $ | 87 | |||||
Water & Flowback Services Division | 384 | 1,930 | 4,109 | |||||||||
Compression Division | — | — | — | |||||||||
Interdivision eliminations | (378 | ) | (1,961 | ) | (4,196 | ) | ||||||
Consolidated | $ | — | $ | — | $ | — | ||||||
Total revenues | ||||||||||||
Completion Fluids & Products Division | $ | 257,408 | $ | 257,851 | $ | 205,156 | ||||||
Water & Flowback Services Division | 303,072 | 171,621 | 105,057 | |||||||||
Compression Division | 438,673 | 295,587 | 311,374 | |||||||||
Interdivision eliminations | (378 | ) | (1,961 | ) | (4,196 | ) | ||||||
Consolidated | $ | 998,775 | $ | 723,098 | $ | 617,391 | ||||||
F-47
Year Ended December 31, | ||||||||||||
2018 | 2017 | 2016 | ||||||||||
(In Thousands) | ||||||||||||
Depreciation, amortization, and accretion | ||||||||||||
Completion Fluids & Products | $ | 15,345 | $ | 16,298 | $ | 28,338 | ||||||
Water & Flowback Services | 28,439 | 18,092 | 16,221 | |||||||||
Compression | 70,500 | 69,142 | 72,159 | |||||||||
Corporate overhead | 658 | 521 | 429 | |||||||||
Consolidated | $ | 114,925 | $ | 104,053 | $ | 117,147 | ||||||
Interest expense | ||||||||||||
Completion Fluids & Products | $ | 179 | $ | 124 | $ | 32 | ||||||
Water & Flowback Services | 5 | 6 | 42 | |||||||||
Compression | 52,317 | 42,309 | 38,271 | |||||||||
Corporate overhead | 19,565 | 15,588 | 21,639 | |||||||||
Consolidated | $ | 72,066 | $ | 58,027 | $ | 59,984 | ||||||
Income (loss) before taxes | ||||||||||||
Completion Fluids & Products | $ | 30,623 | $ | 63,891 | $ | 17,742 | ||||||
Water & Flowback Services | 28,712 | (12,816 | ) | (42,783 | ) | |||||||
Compression | (33,797 | ) | (37,246 | ) | (136,327 | ) | ||||||
Interdivision eliminations | 11 | (151 | ) | 12 | ||||||||
Corporate overhead(1) | (61,975 | ) | (57,721 | ) | (61,864 | ) | ||||||
Consolidated | $ | (36,426 | ) | $ | (44,043 | ) | $ | (223,220 | ) | |||
Year Ended December 31, | ||||||||||||
2018 | 2017 | 2016 | ||||||||||
(In Thousands) | ||||||||||||
Total assets | ||||||||||||
Completion Fluids & Products | $ | 296,129 | $ | 293,507 | $ | 287,347 | ||||||
Water & Flowback Services | 230,442 | 139,771 | 122,973 | |||||||||
Compression | 869,474 | 784,745 | 816,148 | |||||||||
Corporate overhead and eliminations | (11,872 | ) | (30,543 | ) | (23,939 | ) | ||||||
Assets of discontinued operations | 1,354 | 121,134 | 113,011 | |||||||||
Consolidated | $ | 1,385,527 | $ | 1,308,614 | $ | 1,315,540 | ||||||
Capital expenditures | ||||||||||||
Completion Fluids & Products | $ | 5,259 | $ | 3,091 | $ | 1,629 | ||||||
Water & Flowback Services(2) | 30,175 | 16,194 | 1,484 | |||||||||
Compression Division (3) | 104,002 | 25,920 | 11,568 | |||||||||
Corporate overhead | 809 | 932 | 472 | |||||||||
Discontinued operations | 1,686 | 5,786 | 5,913 | |||||||||
Consolidated | $ | 141,931 | $ | 51,923 | $ | 21,066 | ||||||
(1) | Amounts reflected include the following general corporate expenses: |
F-48
2018 | 2017 | 2016 | ||||||||||
(In Thousands) | ||||||||||||
General and administrative expense | $ | 50,431 | $ | 46,156 | $ | 34,767 | ||||||
Depreciation and amortization | 658 | 84 | 430 | |||||||||
Interest expense, net | 19,640 | 15,513 | 21,593 | |||||||||
Warrants fair value adjustment (income) expense | (11,128 | ) | (5,301 | ) | 2,106 | |||||||
Other general corporate (income) expense, net | 2,374 | 1,269 | 4,037 | |||||||||
Total | $ | 61,975 | $ | 57,721 | $ | 62,933 | ||||||
(2) | Amounts presented net of cost of equipment sold, including $0.1 million during 2018 and $4.2 million during 2017 for our Water and Flowback Services. |
(3) | Amounts presented net of cost of equipment sold, including $10.0 million during 2018, $8.5 million during 2017, and $6.6 million during 2016 for our Compression Division. |
Summarized financial information concerning the geographic areas of our customers and in which we operate at December 31, 2018, 2017, and 2016, is presented below:
Year Ended December 31, | ||||||||||||
2018 | 2017 | 2016 | ||||||||||
(In Thousands) | ||||||||||||
Revenues from external customers: | ||||||||||||
U.S. | $ | 791,389 | $ | 545,964 | $ | 458,227 | ||||||
Canada and Mexico | 41,524 | 36,074 | 34,594 | |||||||||
South America | 25,781 | 28,040 | 20,480 | |||||||||
Europe | 93,262 | 80,721 | 71,882 | |||||||||
Africa | 12,367 | 700 | 10,345 | |||||||||
Asia and other | 34,452 | 31,599 | 21,863 | |||||||||
Total | $ | 998,775 | $ | 723,098 | $ | 617,391 | ||||||
Transfers between geographic areas: | ||||||||||||
U.S. | $ | — | $ | — | $ | — | ||||||
Canada and Mexico | — | — | — | |||||||||
South America | — | — | — | |||||||||
Europe | 3,157 | 2,025 | 93 | |||||||||
Africa | — | — | — | |||||||||
Asia and other | — | — | — | |||||||||
Eliminations | (3,157 | ) | (2,025 | ) | (93 | ) | ||||||
Total revenues | $ | 998,775 | $ | 723,098 | $ | 617,391 | ||||||
Identifiable assets: | ||||||||||||
U.S. | $ | 1,211,759 | $ | 1,131,650 | $ | 1,132,986 | ||||||
Canada and Mexico | 59,355 | 62,537 | 64,163 | |||||||||
South America | 25,122 | 23,352 | 21,354 | |||||||||
Europe | 57,807 | 61,000 | 53,713 | |||||||||
Africa | 14,772 | 3,696 | 5,711 | |||||||||
Asia and other | 16,712 | 26,379 | 37,613 | |||||||||
Total identifiable assets | $ | 1,385,527 | $ | 1,308,614 | $ | 1,315,540 | ||||||
During each of the three years ended December 31, 2018, 2017, and 2016, no single customer accounted for more than 10% of our consolidated revenues.
F-49
NOTE U — REVENUE FROM CONTRACTS WITH CUSTOMERS
Performance Obligations. Revenue is recognized when performance obligations under the terms of a contract with our customer are satisfied. Generally this occurs with the transfer of control of our products or services to our customers. Revenue is measured as the amount of consideration we expect to receive in exchange for transferring products or providing services to our customers. For a general discussion of the nature of the goods and services that we provide, see Note T – "Industry Segments and Geographic Information.”
Product Sales. Product sales revenues are recognized at a point in time when we transfer control of our product offerings to our customers, generally when we ship products from our facility to our customer. The product sales for our Completion Fluid & Products Division consist primarily of CBFs, additives, and associated manufactured products. Product sales for our Water & Flowback Services Division are typically attributed to specific performance obligations within certain production testing service arrangements. Parts and equipment sales comprise the product sales for the Compression Division.
Services. Service revenues represent revenue recognized over time, as our customer arrangements typically provide agreed upon day-rates (monthly service rates for compression services) and we recognize service revenue based upon the number of days services have been performed. Service revenue recognized over time is associated with a majority of our Water & Flowback Services Division arrangements, compression service and aftermarket service contracts within our Compression Division, and a small portion of Completion Fluids & Products Division revenue that is associated with completion fluid service arrangements. With the exception of the initial terms of the compression services contracts for medium- and high-horsepower compressor packages of our Compression Division, our customer contracts are generally for terms of one year or less. The majority of the service arrangements in the Water & Flowback Services Division are for a period of 90 days or less. Within our Compression Division service revenue, most aftermarket service revenues are recognized at a point in time when we transfer control of our products and complete the delivery of services to our customers.
We receive cash equal to the invoice price for most product sales and services and payment terms typically range from 30 to 60 days from the date we invoice our customer. Since the period between when we deliver products or services and when the customer pays for products or services are not expected to exceed one year, we have elected not to calculate or disclose a financing component for our customer contracts.
Depending on the terms of the arrangement, we may also defer the recognition of revenue for a portion of the consideration received because we have to satisfy a future performance obligation. For example, consideration received from customers during the fabrication of new compressor packages is typically deferred until control of the compressor package is transferred to our customer. For any arrangements with multiple performance obligations, we use management's estimated selling price to determine the stand-alone selling price for separate performance obligations. For revenue associated with mobilization of service equipment as part of a service contract arrangement, such revenue, if significant, is deferred and amortized over the estimated service period. As of December 31, 2018, we had $29.6 million of remaining performance obligations related to our compression service contracts. As a practical expedient, this amount does not reflect revenue for compression service contracts whose original expected duration is less than 12 months and does not consider the effects of the time value of money. The remaining performance obligations expected to be recognized through 2023 are as follows (in thousands):
2019 | 2020 | 2021 | 2022 | 2023 | Total | ||||||||||||||||||
(In Thousands) | |||||||||||||||||||||||
Compression service contracts remaining performance obligations | $ | 16,980 | $ | 8,401 | $ | 4,236 | $ | — | $ | — | $ | 29,617 | |||||||||||
Sales taxes, value added taxes, and other taxes we collect concurrent with revenue-producing activities are excluded from revenue. We have elected to recognize the cost for freight and shipping costs as part of cost of product sales when control over our products (i.e. delivery) has transferred to the customer.
Use of Estimates. Contracts where the amount of revenue that will ultimately be realized is subject to uncertainties not fully known as of the time revenue is recognized are known as variable consideration arrangements. In recognizing revenue for these arrangements, the amount of variable consideration recognized is limited so that it is probable that significant amounts of revenues will not be reversed in future periods when the
F-50
uncertainty is resolved. For products returned by the customer, we estimate the expected returns based on an analysis of historical experience. For volume discounts earned by the customer, we estimate the discount (if any) based on our estimate of the total expected volume of products sold or services to be provided to the customer during the discount period. In certain contracts for the sale of CBFs, we may agree to issue credits for the repurchase of reclaimable used fluids from certain customers at an agreed price that is based on the condition of the fluids. For sales of CBFs, we adjust the revenue recognized in the period of shipment by the estimated amount of the credit expected to be issued to the customer, and this estimate is based on historical experience. As of December 31, 2018, the amount of remaining credits expected to be issued for the repurchase of reclaimable used fluids was $1.9 million that were recorded in inventory (right of return asset) and accounts payable. There were no material differences between amounts recognized during the year ended December 31, 2018, compared to estimates made in a prior period from these variable consideration arrangements.
Contract Assets and Liabilities. Contract assets arise when we transfer products or perform services in fulfillment of a contract obligation but must perform other performance obligations before being entitled to payment. Generally, once we have transferred products or performed services for the customer pursuant to a contract, we recognize revenue and trade accounts receivable, as we are entitled to payment that is unconditional. Any contract assets, along with billed and unbilled accounts receivable, are included in Trade Accounts Receivable in our consolidated balance sheets. Contract liabilities arise when we receive consideration, or consideration is unconditionally due, from a customer prior to transferring products or services to the customer under the terms of a sales contract. We classify contract liabilities as Unearned Income in our consolidated balance sheets. Such deferred revenue typically results from advance payments received on orders for new compressor equipment prior to the time such equipment is completed and transferred to the customer in accordance with the customer contract.
As of December 31, 2018 and December 31, 2017, contract assets were immaterial. The following table reflects the changes in our contract liabilities during the year ended December 31, 2018:
December 31, 2018 | |||
(In Thousands) | |||
Unearned Income, beginning of period | $ | 17,050 | |
Additional unearned income | 138,684 | ||
Revenue recognized | (130,401 | ) | |
Unearned income, end of period | $ | 25,333 | |
Bad debt expense on accounts receivables and contract assets was $1.7 million and $1.1 million during the years ended December 31, 2018 and December 31, 2017. During the year ended December 31, 2018, $130.4 million of unearned income was recognized as product sales revenue, primarily associated with deliveries of new compression equipment.
Contract Costs. When costs are incurred to obtain contracts, such as professional fees and sales bonuses, such costs are deferred and amortized over the expected period of benefit. Costs of mobilizing service equipment necessary to perform under service contracts, if significant, are deferred and amortized over the estimated service period, which is generally a few weeks. Where applicable, we establish provisions for estimated obligations pursuant to product warranties by accruing for estimated future product warranty cost in the period of the product sale. Such estimates are based on historical warranty loss experience. Major components of fabricated compressor packages have manufacturer warranties that we pass through to the customer.
Disaggregation of Revenue. We disaggregate revenue from contracts with customers into Product Sales and Services within each segment, as noted in our three reportable segments in Note T. In addition, we disaggregate revenue from contracts with customers by geography based on the following table below.
F-51
Twelve months ended December 31, | |||||||||||
2018 | 2017 | 2016 | |||||||||
(In Thousands) | |||||||||||
Completion Fluids & Products | |||||||||||
U.S. | $ | 129,160 | $ | 160,221 | $ | 118,751 | |||||
International | 128,248 | 97,630 | 86,405 | ||||||||
257,408 | 257,851 | 205,156 | |||||||||
Water & Flowback Services | |||||||||||
U.S. | 261,238 | 120,463 | 68,735 | ||||||||
International | 41,834 | 51,158 | 36,322 | ||||||||
303,072 | 171,621 | 105,057 | |||||||||
Compression | |||||||||||
U.S. | 400,986 | 265,311 | 270,828 | ||||||||
International | 37,687 | 30,276 | 40,546 | ||||||||
438,673 | 295,587 | 311,374 | |||||||||
Interdivision eliminations | |||||||||||
U.S. | 5 | (31 | ) | (87 | ) | ||||||
International | (383 | ) | (1,930 | ) | (4,109 | ) | |||||
(378 | ) | (1,961 | ) | (4,196 | ) | ||||||
Total Revenue | |||||||||||
U.S. | 791,389 | 545,964 | 458,227 | ||||||||
International | 207,386 | 177,134 | 159,164 | ||||||||
$ | 998,775 | $ | 723,098 | $ | 617,391 | ||||||
NOTE V — QUARTERLY FINANCIAL INFORMATION (Unaudited)
Summarized quarterly financial data for 2018 and 2017 is as follows:
Three Months Ended 2018 | ||||||||||||||||
March 31 | June 30 | September 30 | December 31 | |||||||||||||
(In Thousands, Except Per Share Amounts) | ||||||||||||||||
Total revenues | $ | 199,381 | $ | 260,072 | $ | 256,851 | $ | 282,471 | ||||||||
Gross profit | 27,983 | 47,801 | 41,330 | 45,184 | ||||||||||||
Income (loss) before discontinued operations | (21,057 | ) | (12,132 | ) | (12,852 | ) | 3,316 | |||||||||
Net income (loss) | (62,763 | ) | (12,153 | ) | (12,056 | ) | 2,732 | |||||||||
Net income (loss) attributable to TETRA stockholders | (53,648 | ) | (5,965 | ) | (6,936 | ) | 4,932 | |||||||||
Net income (loss) per share before discontinued operations attributable to TETRA stockholders | $ | (0.10 | ) | $ | (0.05 | ) | $ | (0.06 | ) | $ | 0.04 | |||||
Net income (loss) per diluted share before discontinued operations attributable to TETRA stockholders | $ | (0.10 | ) | $ | (0.05 | ) | $ | (0.06 | ) | $ | 0.04 | |||||
Net income (loss) per share attributable to TETRA stockholders | $ | (0.46 | ) | $ | (0.05 | ) | $ | (0.06 | ) | $ | 0.04 | |||||
Net income (loss) per diluted share attributable to TETRA stockholders | $ | (0.46 | ) | $ | (0.05 | ) | $ | (0.06 | ) | $ | 0.04 | |||||
F-52
Three Months Ended 2017 | ||||||||||||||||
March 31 | June 30 | September 30 | December 31 | |||||||||||||
(In Thousands, Except Per Share Amounts) | ||||||||||||||||
Total revenues | $ | 159,409 | $ | 179,931 | $ | 183,677 | $ | 200,081 | ||||||||
Gross profit | 19,654 | 29,535 | 42,651 | 16,550 | ||||||||||||
Loss before discontinued operations | (4,245 | ) | (7,966 | ) | (857 | ) | (31,726 | ) | ||||||||
Net loss | (11,252 | ) | (14,619 | ) | (1,338 | ) | (34,974 | ) | ||||||||
Net income (loss) attributable to TETRA stockholders | (2,463 | ) | (10,991 | ) | 3,145 | (28,739 | ) | |||||||||
Net income (loss) per share before discontinued operations attributable to TETRA stockholders | $ | 0.04 | $ | (0.04 | ) | $ | 0.03 | $ | (0.22 | ) | ||||||
Net income (loss) per diluted share before discontinued operations attributable to TETRA stockholders | $ | 0.04 | $ | (0.04 | ) | $ | 0.03 | $ | (0.22 | ) | ||||||
Net income (loss) per share attributable to TETRA stockholders | $ | (0.02 | ) | $ | (0.10 | ) | $ | 0.03 | $ | (0.25 | ) | |||||
Net income (loss) per diluted share attributable to TETRA stockholders | $ | (0.02 | ) | $ | (0.10 | ) | $ | 0.03 | $ | (0.25 | ) | |||||
Gross profit for the three months ended September 30, 2018, includes the impact of $2.9 million for certain impairments of long-lived assets. Gross profit for the three months ended December 31, 2017, includes the impact of $14.9 million for certain impairments of long-lived assets.
F-53