Exhibit 99.1
Press Release
For Further Information Contact:
| INVESTORS: | MEDIA: |
| Matt Schroeder | Susan Henderson |
| (717) 214-8867 | (717) 730-7766 |
or investor@riteaid.com
FOR IMMEDIATE RELEASE
Rite Aid Reports Fiscal 2017 Second Quarter Results
| · | Revenues of $8.0 Billion for the Second Quarter, Up 4.8 Percent Year-Over-Year |
| · | Second Quarter Net Income of $14.8 Million or $0.01 Per Share, Compared to the Prior Year’s Second Quarter Net Income of $21.5 Million or $0.02 Per Share |
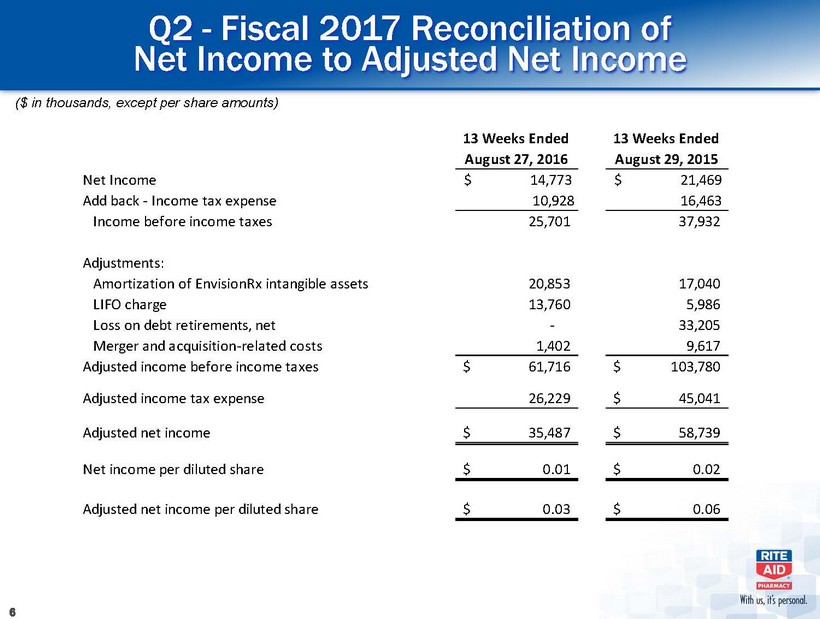
| · | Second Quarter Adjusted Net Income Per Diluted Share of $0.03, Compared to the Prior Year Second Quarter Adjusted Net Income Per Diluted Share of $0.06 |
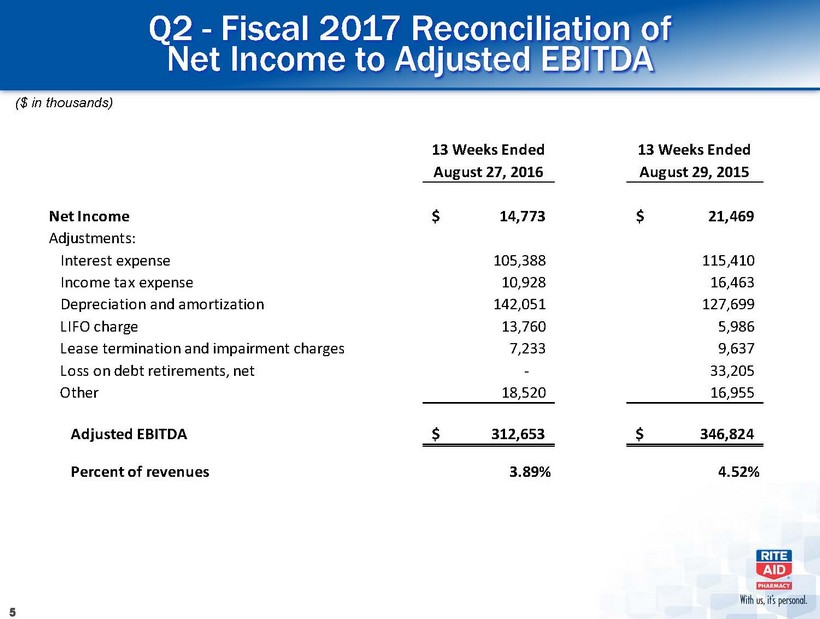
| · | Adjusted EBITDA of $312.7 Million for the Second Quarter, Compared to the Prior Year’s Adjusted EBITDA of $346.8 Million |
CAMP HILL, Pa. (Sept. 22, 2016) - Rite Aid Corporation (NYSE: RAD) today reported operating results for its second fiscal quarter ended August 27, 2016.
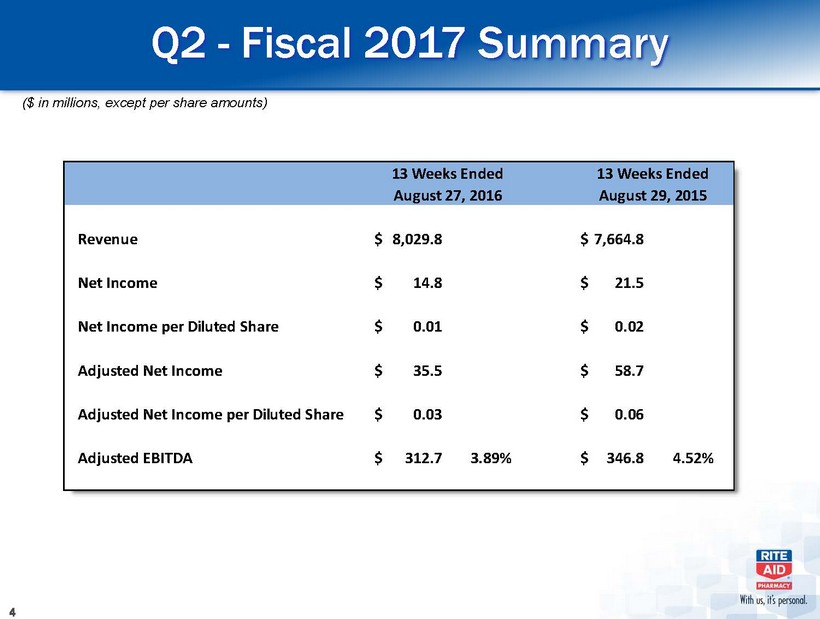
For the second quarter, the company reported revenues of $8.0 billion, net income of $14.8 million, or $0.01 per diluted share, Adjusted net income of $35.5 million, or $0.03 per diluted share and Adjusted EBITDA of $312.7 million, or 3.9 percent of revenues.
“In the second quarter, we continued to drive positive results in our Pharmacy Services Segment, which includes our EnvisionRx PBM, and had strong performance in our front-end business” said Chairman and CEO John Standley. “We also saw improvements in prescription drug costs, but these improvements were more than offset by the challenging reimbursement rate environment, which we expect to continue through the remainder of the fiscal year. Heading forward, we will remain focused on operating our business as efficiently as possible while pursuing key growth opportunities such as our flu immunization campaign and converting additional stores to the Wellness format, which continue to perform well and now represent nearly half of our chain.”
-More-
Rite Aid FY 2017 Q2 Press Release - page 2
Second Quarter Summary
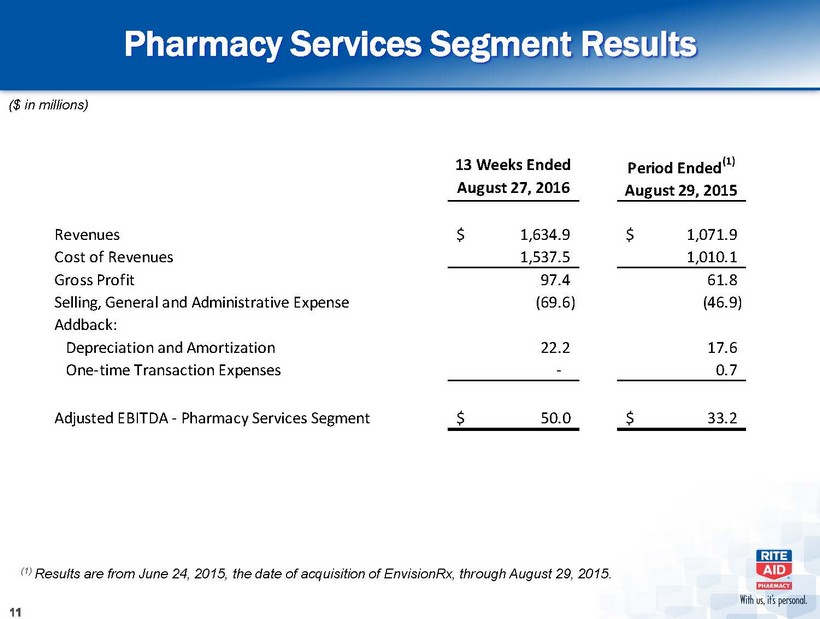
Revenues for the quarter were $8.0 billion compared to revenues of $7.7 billion in the prior year’s second quarter, an increase of $365.0 million or 4.8 percent. Retail Pharmacy Segment revenues were $6.5 billion and decreased 2.4 percent compared to the prior year period primarily as a result of a decrease in same store sales. Revenues in the company’s Pharmacy Services Segment, which was acquired on June 24, 2015, were $1.6 billion.
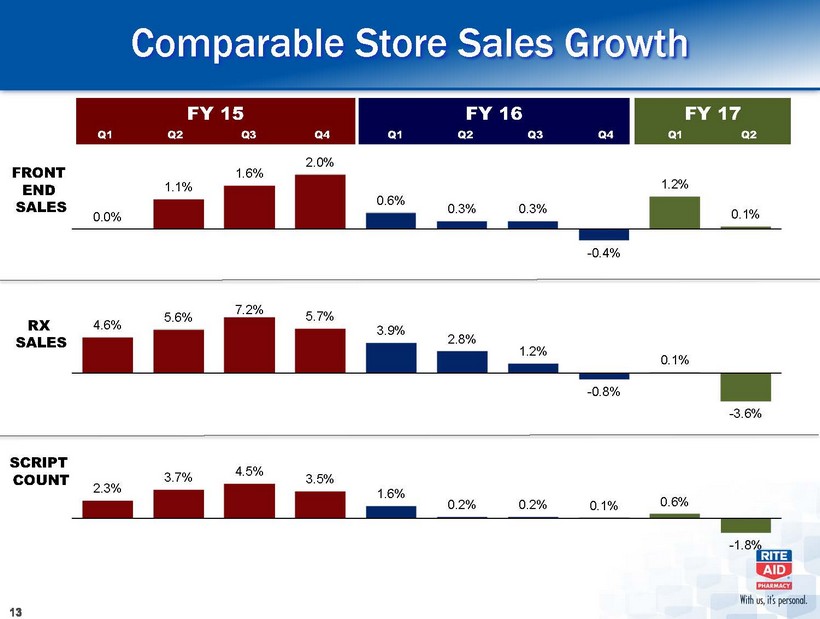
Same store sales for the quarter decreased 2.5 percent over the prior year, consisting of a 3.6 percent decrease in pharmacy sales, partially offset by a 0.1 percent increase in front-end sales. Pharmacy sales included an approximate 101 basis point negative impact from new generic introductions. The number of prescriptions filled in same stores decreased 1.8 percent over the prior year period. Prescription sales accounted for 68.5 percent of total drugstore sales, and third party prescription revenue was 98.1 percent of pharmacy sales.
Net income was $14.8 million or $0.01 per diluted share compared to last year’s second quarter net income of $21.5 million or $0.02 per diluted share. The decline in operating results is due primarily to a higher LIFO charge, and a decline in Adjusted net income, partially offset by a $33.2 million loss on debt retirement in the prior year related to the redemption of the company’s 8.00% senior secured notes.
Adjusted net income and Adjusted net income per diluted share (which is reconciled to net income on the attached table) was $35.5 million or $0.03 per diluted share compared to last year’s second quarter Adjusted net income of $58.7 million or $0.06 per diluted share. The decline in Adjusted net income and Adjusted net income per share is due to a decrease in Adjusted EBITDA, partially offset by lower income tax and interest expenses.
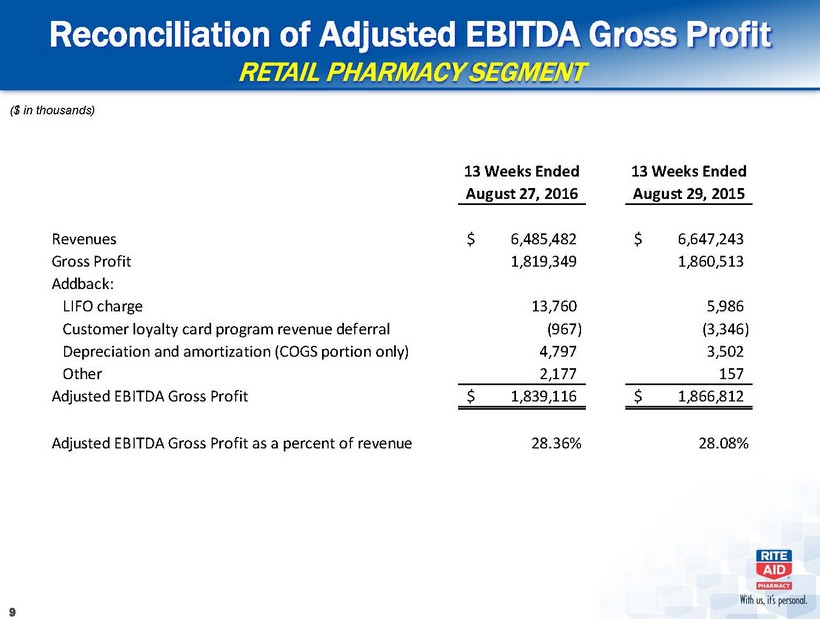
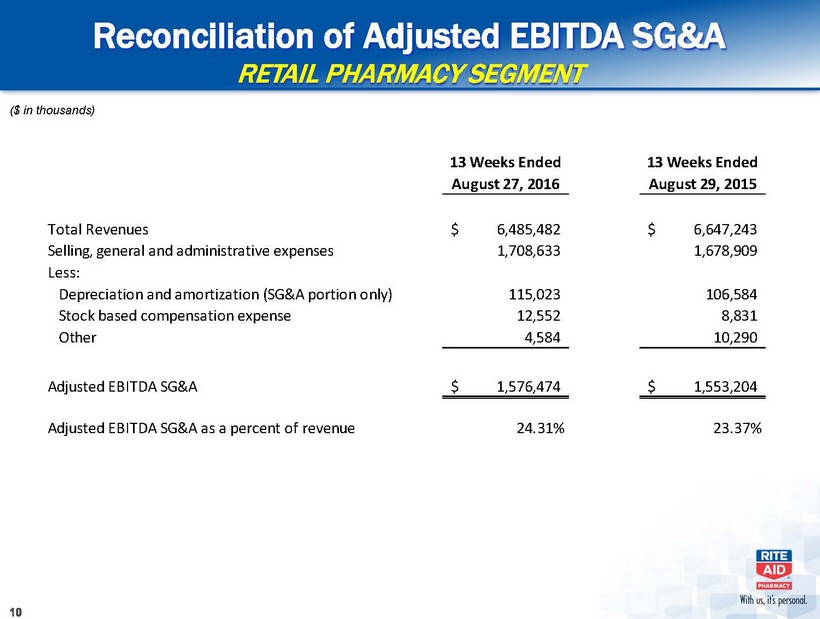
Adjusted EBITDA (which is reconciled to net income on the attached table) was $312.7 million or 3.9 percent of revenues for the second quarter compared to $346.8 million or 4.5 percent of revenues for the same period last year. The decline in Adjusted EBITDA is due to a decrease of $51.0 million in the Retail Pharmacy Segment, resulting from lower gross profit and higher SG&A expense. Gross profit declined due to lower pharmacy gross profit partially offset by an increase in front end gross profit. Pharmacy gross profit decreased because of lower reimbursement rates and script count, partially offset by improvements in prescription drug costs. SG&A expense increased due to a shift in the timing of Memorial Day holiday pay and increased benefit costs. The decline in Retail Pharmacy Segment Adjusted EBITDA was partially offset by an increase of $16.8 million of Pharmacy Services Segment Adjusted EBITDA. This increase was due to strong operating results in the current year and the fact that prior year’s Pharmacy Services Segment results do not reflect a full quarter’s ownership of Envision Rx.
In the second quarter, the company opened 3 stores, relocated 6 stores, and remodeled 85 stores, bringing the total number of wellness stores chainwide to 2,214. The company also acquired 1 store and closed 14 stores, resulting in a total store count of 4,550 at the end of the second quarter. The company also opened 10 clinics in the second quarter, bringing the total to 90.
As previously announced on October 27, 2015, Rite Aid and Walgreens Boots Alliance, Inc. (“WBA”) entered into a definitive agreement under which WBA will acquire all outstanding shares of Rite Aid for $9.00 per share in cash. The board of directors of both companies and Rite Aid’s shareholders have approved the transaction, which is subject to certain conditions, including, among others, the receipt of approval under applicable antitrust laws and other customary closing conditions. The company continues to believe that the transaction will close in the second half of calendar year 2016.
Rite Aid is one of the nation’s leading drugstore chains with 4,550 stores in 31 states and the District of Columbia. Information about Rite Aid, including corporate background and press releases, is available through Rite Aid’s website at www.riteaid.com.
-More-
Rite Aid FY 2017 Q2 Press Release - page 3
Cautionary Statement Regarding Forward Looking Statements
Statements in this release that are not historical and statements regarding the expected timing of the closing of the proposed merger with WBA and the ability of the parties to complete such transaction considering the various closing conditions and any assumptions underlying any of the foregoing, are forward-looking statements made pursuant to the safe harbor provisions of the Private Securities Litigation Reform Act of 1995. Words such as “anticipate,” “believe,” “continue,” “could,” “estimate,” “expect,” “intend,” “may,” “plan,” “predict,” “project,” “should,” and “will” and variations of such words and similar expressions are intended to identify such forward-looking statements. These forward-looking statements are not guarantees of future performance and involve risks, assumptions and uncertainties, including, but not limited to, our high level of indebtedness and our ability to make interest and principal payments on our debt and satisfy the other covenants contained in our debt agreements, general economic, market and competitive conditions, our ability to improve the operating performance of our stores in accordance with our long term strategy, the impact of private and public third-party payers continued reduction in prescription drug reimbursements and efforts to encourage mail order, our ability to manage expenses and our investments in working capital, outcomes of legal and regulatory matters, changes in legislation or regulations, including healthcare reform, our ability to achieve the benefits of our efforts to reduce the costs of our generic and other drugs and risks related to the proposed merger. These and other risks, assumptions and uncertainties are more fully described in Item 1A (Risk Factors) of our most recent Annual Report on Form 10-K, in the definitive proxy statement that we filed with the Securities and Exchange Commission on December 21, 2015 in connection with the proposed merger, and in other documents that we file or furnish with the Securities and Exchange Commission, which you are encouraged to read. Should one or more of these risks or uncertainties materialize, or should underlying assumptions prove incorrect, actual results may vary materially from those indicated or anticipated by such forward-looking statements. Additionally, there can be no assurance that the proposed merger will be completed, or if it is completed, that it will close within the anticipated time period or that the expected benefits of the proposed merger will be realized. Accordingly, you are cautioned not to place undue reliance on these forward-looking statements, which speak only as of the date they are made. Rite Aid expressly disclaims any current intention to update publicly any forward-looking statement after the distribution of this release, whether as a result of new information, future events, changes in assumptions or otherwise.
Reconciliation of Non-GAAP Financial Measures
The company separately reports financial results on the basis of Adjusted Net Income, Adjusted Net Income per diluted share, and Adjusted EBITDA, which are non-GAAP financial measures. See the attached tables for a reconciliation of Adjusted Net Income, Adjusted Net Income per diluted share and Adjusted EBITDA to net income, and net income per diluted share, which are the most directly comparable GAAP financial measures. Adjusted Net Income and Adjusted Net Income per diluted share exclude amortization of EnvisionRx intangible assets, merger and acquisition-related costs, loss on debt retirements and LIFO adjustments. Adjusted EBITDA is defined as net income excluding the impact of income taxes, interest expense, depreciation and amortization, LIFO adjustments, charges or credits for facility closing and impairment, inventory write-downs related to store closings, debt retirements and other items (including stock-based compensation expense, merger and acquisition-related costs, severance and costs related to distribution center closures, gain or loss on sale of assets and revenue deferrals related to our customer loyalty program).
###
RITE AID CORPORATION AND SUBSIDIARIES
CONSOLIDATED BALANCE SHEETS
(Dollars in thousands)
(unaudited)
| August 27, 2016 | February 27, 2016 | |||||||
| ASSETS | ||||||||
| Current assets: | ||||||||
| Cash and cash equivalents | $ | 136,093 | $ | 124,471 | ||||
| Accounts receivable, net | 1,828,641 | 1,601,008 | ||||||
| Inventories, net of LIFO reserve of $1,033,907 and $1,006,396 | 2,827,018 | 2,697,104 | ||||||
| Prepaid expenses and other current assets | 146,764 | 128,144 | ||||||
| Total current assets | 4,938,516 | 4,550,727 | ||||||
| Property, plant and equipment, net | 2,281,392 | 2,255,398 | ||||||
| Goodwill | 1,715,479 | 1,713,475 | ||||||
| Other intangibles, net | 921,348 | 1,004,379 | ||||||
| Deferred tax assets | 1,538,604 | 1,539,141 | ||||||
| Other assets | 215,630 | 213,890 | ||||||
| Total assets | $ | 11,610,969 | $ | 11,277,010 | ||||
| LIABILITIES AND STOCKHOLDERS' EQUITY | ||||||||
| Current liabilities: | ||||||||
| Current maturities of long-term debt and lease financing obligations | $ | 24,399 | $ | 26,848 | ||||
| Accounts payable | 1,695,840 | 1,542,797 | ||||||
| Accrued salaries, wages and other current liabilities | 1,331,707 | 1,427,250 | ||||||
| Total current liabilities | 3,051,946 | 2,996,895 | ||||||
| Long-term debt, less current maturities | 7,173,656 | 6,914,393 | ||||||
| Lease financing obligations, less current maturities | 46,641 | 52,895 | ||||||
| Other noncurrent liabilities | 722,057 | 731,399 | ||||||
| Total liabilities | 10,994,300 | 10,695,582 | ||||||
| Commitments and contingencies | - | - | ||||||
| Stockholders' equity: | ||||||||
| Common stock | 1,052,125 | 1,047,754 | ||||||
| Additional paid-in capital | 4,841,988 | 4,822,665 | ||||||
| Accumulated deficit | (5,231,025 | ) | (5,241,210 | ) | ||||
| Accumulated other comprehensive loss | (46,419 | ) | (47,781 | ) | ||||
| Total stockholders' equity | 616,669 | 581,428 | ||||||
| Total liabilities and stockholders' equity | $ | 11,610,969 | $ | 11,277,010 | ||||
RITE AID CORPORATION AND SUBSIDIARIES
CONSOLIDATED STATEMENTS OF OPERATIONS
(Dollars in thousands, except per share amounts)
(unaudited)
| Thirteen weeks ended August 27, 2016 | Thirteen weeks ended August 29, 2015 | |||||||
| Revenues | $ | 8,029,806 | $ | 7,664,776 | ||||
| Costs and expenses: | ||||||||
| Cost of revenues | 6,113,063 | 5,742,485 | ||||||
| Selling, general and administrative expenses | 1,778,247 | 1,725,826 | ||||||
| Lease termination and impairment charges | 7,233 | 9,637 | ||||||
| Interest expense | 105,388 | 115,410 | ||||||
| Loss on debt retirements, net | - | 33,205 | ||||||
| Loss on sale of assets, net | 174 | 281 | ||||||
| 8,004,105 | 7,626,844 | |||||||
| Income before income taxes | 25,701 | 37,932 | ||||||
| Income tax expense | 10,928 | 16,463 | ||||||
| Net income | $ | 14,773 | $ | 21,469 | ||||
| Basic and diluted earnings per share: | ||||||||
| Numerator for earnings per share: | ||||||||
| Income attributable to common stockholders - basic and diluted | $ | 14,773 | $ | 21,469 | ||||
| Denominator: | ||||||||
| Basic weighted average shares | 1,044,198 | 1,029,793 | ||||||
| Outstanding options and restricted shares, net | 17,251 | 19,341 | ||||||
| Diluted weighted average shares | 1,061,449 | 1,049,134 | ||||||
| Basic and diluted income per share | $ | 0.01 | $ | 0.02 | ||||
RITE AID CORPORATION AND SUBSIDIARIES
CONSOLIDATED STATEMENTS OF OPERATIONS
(Dollars in thousands, except per share amounts)
(unaudited)
| Twenty-six weeks ended August 27, 2016 | Twenty-six weeks ended August 29, 2015 | |||||||
| Revenues | $ | 16,213,987 | $ | 14,312,337 | ||||
| Costs and expenses: | ||||||||
| Cost of revenues | 12,402,944 | 10,530,516 | ||||||
| Selling, general and administrative expenses | 3,571,494 | 3,425,411 | ||||||
| Lease termination and impairment charges | 13,014 | 14,659 | ||||||
| Interest expense | 210,501 | 239,017 | ||||||
| Loss on debt retirements, net | - | 33,205 | ||||||
| Loss on sale of assets, net | 1,230 | 320 | ||||||
| 16,199,183 | 14,243,128 | |||||||
| Income before income taxes | 14,804 | 69,209 | ||||||
| Income tax expense | 4,619 | 28,904 | ||||||
| Net income | $ | 10,185 | $ | 40,305 | ||||
| Basic and diluted earnings per share: | ||||||||
| Numerator for earnings per share: | ||||||||
| Income attributable to common stockholders - basic and diluted | $ | 10,185 | $ | 40,305 | ||||
| Denominator: | ||||||||
| Basic weighted average shares | 1,043,317 | 1,008,242 | ||||||
| Outstanding options and restricted shares, net | 17,210 | 18,959 | ||||||
| Diluted weighted average shares | 1,060,527 | 1,027,201 | ||||||
| Basic and diluted income per share | $ | 0.01 | $ | 0.04 | ||||
RITE AID CORPORATION AND SUBSIDIARIES
CONSOLIDATED STATEMENTS OF COMPREHENSIVE INCOME
(In thousands)
(unaudited)
| Thirteen weeks ended August 27, 2016 | Thirteen weeks ended August 29, 2015 | |||||||
| Net income | $ | 14,773 | $ | 21,469 | ||||
| Other comprehensive income: | ||||||||
| Defined benefit pension plans: | ||||||||
| Amortization of prior service cost, net transition obligation and net actuarial losses included in net periodic pension cost, net of $451 and $398 tax expense | 681 | 598 | ||||||
| Total other comprehensive income | 681 | 598 | ||||||
| Comprehensive income | $ | 15,454 | $ | 22,067 | ||||
RITE AID CORPORATION AND SUBSIDIARIES
CONSOLIDATED STATEMENTS OF COMPREHENSIVE INCOME
(In thousands)
(unaudited)
| Twenty-six weeks ended August 27, 2016 | Twenty-six weeks ended August 29, 2015 | |||||||
| Net income | $ | 10,185 | $ | 40,305 | ||||
| Other comprehensive income: | ||||||||
| Defined benefit pension plans: | ||||||||
| Amortization of prior service cost, net transition obligation and net actuarial losses included in net periodic pension cost, net of $902 and $796 tax expense | 1,362 | 1,195 | ||||||
| Total other comprehensive income | 1,362 | 1,195 | ||||||
| Comprehensive income | $ | 11,547 | $ | 41,500 | ||||
RITE AID CORPORATION AND SUBSIDIARIES
SUPPLEMENTAL SEGMENT OPERATING INFORMATION
(Dollars in thousands)
(unaudited)
| Thirteen weeks ended August 27, 2016 | Thirteen weeks ended August 29, 2015 | |||||||
| Retail Pharmacy Segment | ||||||||
| Revenues (a) | $ | 6,485,482 | $ | 6,647,243 | ||||
| Cost of revenues (a) | 4,666,133 | 4,786,730 | ||||||
| Gross profit | 1,819,349 | 1,860,513 | ||||||
| LIFO charge | 13,760 | 5,986 | ||||||
| FIFO gross profit | 1,833,109 | 1,866,499 | ||||||
| Gross profit as a percentage of revenues | 28.05 | % | 27.99 | % | ||||
| LIFO charge as a percentage of revenues | 0.21 | % | 0.09 | % | ||||
| FIFO gross profit as a percentage of revenues | 28.26 | % | 28.08 | % | ||||
| Selling, general and administrative expenses | 1,708,633 | 1,678,909 | ||||||
| Selling, general and administrative expenses as a percentage of revenues | 26.35 | % | 25.26 | % | ||||
| Cash interest expense | 100,105 | 109,796 | ||||||
| Non-cash interest expense | 5,273 | 5,608 | ||||||
| Total interest expense | 105,378 | 115,404 | ||||||
| Adjusted EBITDA | 262,643 | 313,602 | ||||||
| Adjusted EBITDA as a percentage of revenues | 4.05 | % | 4.72 | % | ||||
| Pharmacy Services Segment | ||||||||
| Revenues (a) | $ | 1,634,876 | $ | 1,071,889 | ||||
| Cost of revenues (a) | 1,537,482 | 1,010,111 | ||||||
| Gross profit | 97,394 | 61,778 | ||||||
| Gross profit as a percentage of revenues | 5.96 | % | 5.76 | % | ||||
| Adjusted EBITDA | 50,010 | 33,222 | ||||||
| Adjusted EBITDA as a percentage of revenues | 3.06 | % | 3.10 | % | ||||
(a) - Revenues and cost of revenues include $90,552 and $54,356 of inter-segment activity for the thirteen weeks ended August 27, 2016 and August 29, 2015, respectively, that is eliminated in consolidation.
RITE AID CORPORATION AND SUBSIDIARIES
SUPPLEMENTAL SEGMENT OPERATING INFORMATION
(Dollars in thousands)
(unaudited)
| Twenty-six weeks ended August 27, 2016 | Twenty-six weeks ended August 29, 2015 | |||||||
| Retail Pharmacy Segment | ||||||||
| Revenues (a) | $ | 13,161,030 | $ | 13,294,804 | ||||
| Cost of revenues (a) | 9,536,314 | 9,574,761 | ||||||
| Gross profit | 3,624,716 | 3,720,043 | ||||||
| LIFO charge | 27,511 | 11,973 | ||||||
| FIFO gross profit | 3,652,227 | 3,732,016 | ||||||
| Gross profit as a percentage of revenues | 27.54 | % | 27.98 | % | ||||
| LIFO charge as a percentage of revenues | 0.21 | % | 0.09 | % | ||||
| FIFO gross profit as a percentage of revenues | 27.75 | % | 28.07 | % | ||||
| Selling, general and administrative expenses | 3,432,536 | 3,378,494 | ||||||
| Selling, general and administrative expenses as a percentage of revenues | 26.08 | % | 25.41 | % | ||||
| Cash interest expense | 199,787 | 212,558 | ||||||
| Non-cash interest expense | 10,702 | 26,453 | ||||||
| Total interest expense | 210,489 | 239,011 | ||||||
| Adjusted EBITDA | 507,470 | 612,865 | ||||||
| Adjusted EBITDA as a percentage of revenues | 3.86 | % | 4.61 | % | ||||
| Pharmacy Services Segment | ||||||||
| Revenues (a) | $ | 3,237,235 | $ | 1,071,889 | ||||
| Cost of revenues (a) | 3,050,908 | 1,010,111 | ||||||
| Gross profit | 186,327 | 61,778 | ||||||
| Gross profit as a percentage of revenues | 5.76 | % | 5.76 | % | ||||
| Adjusted EBITDA | 91,185 | 33,222 | ||||||
| Adjusted EBITDA as a percentage of revenues | 2.82 | % | 3.10 | % | ||||
(a) - Revenues and cost of revenues include $184,278 and $54,356 of inter-segment activity for the twenty-six weeks ended August 27, 2016 and August 29, 2015, respectively, that is eliminated in consolidation.
RITE AID CORPORATION AND SUBSIDIARIES
SUPPLEMENTAL INFORMATION
RECONCILIATION OF NET INCOME TO ADJUSTED EBITDA
(In thousands)
(unaudited)
| Thirteen weeks ended August 27, 2016 | Thirteen weeks ended August 29, 2015 | |||||||
| Reconciliation of net income to adjusted EBITDA: | ||||||||
| Net income | $ | 14,773 | $ | 21,469 | ||||
| Adjustments: | ||||||||
| Interest expense | 105,388 | 115,410 | ||||||
| Income tax expense | 10,928 | 16,463 | ||||||
| Depreciation and amortization | 142,051 | 127,699 | ||||||
| LIFO charge | 13,760 | 5,986 | ||||||
| Lease termination and impairment charges | 7,233 | 9,637 | ||||||
| Loss on debt retirements, net | - | 33,205 | ||||||
| Other | 18,520 | 16,955 | ||||||
| Adjusted EBITDA | $ | 312,653 | $ | 346,824 | ||||
| Percent of revenues | 3.89 | % | 4.52 | % | ||||
RITE AID CORPORATION AND SUBSIDIARIES
SUPPLEMENTAL INFORMATION
RECONCILIATION OF NET INCOME TO ADJUSTED EBITDA
(In thousands)
(unaudited)
| Twenty-six weeks
ended August 27, 2016 | Twenty-six weeks
ended August 29, 2015 | |||||||
| Reconciliation of net income to adjusted EBITDA: | ||||||||
| Net income | $ | 10,185 | $ | 40,305 | ||||
| Adjustments: | ||||||||
| Interest expense | 210,501 | 239,017 | ||||||
| Income tax expense | 4,619 | 28,904 | ||||||
| Depreciation and amortization | 280,839 | 237,348 | ||||||
| LIFO charge | 27,511 | 11,973 | ||||||
| Lease termination and impairment charges | 13,014 | 14,659 | ||||||
| Loss on debt retirements, net | - | 33,205 | ||||||
| Other | 51,986 | 40,676 | ||||||
| Adjusted EBITDA | $ | 598,655 | $ | 646,087 | ||||
| Percent of revenues | 3.69 | % | 4.51 | % | ||||
RITE AID CORPORATION AND SUBSIDIARIES
SUPPLEMENTAL INFORMATION
ADJUSTED NET INCOME
(Dollars in thousands, except per share amounts)
(unaudited)
| Thirteen weeks ended August 27, 2016 | Thirteen weeks ended August 29, 2015 | |||||||
| Net income | $ | 14,773 | $ | 21,469 | ||||
| Add back - Income tax expense | 10,928 | 16,463 | ||||||
| Income before income taxes | 25,701 | 37,932 | ||||||
| Adjustments: | ||||||||
| Amortization of EnvisionRx intangible assets | 20,853 | 17,040 | ||||||
| LIFO charge | 13,760 | 5,986 | ||||||
| Loss on debt retirements, net | - | 33,205 | ||||||
| Merger and Acquisition-related costs | 1,402 | 9,617 | ||||||
| Adjusted income before income taxes | 61,716 | 103,780 | ||||||
| Adjusted income tax expense | 26,229 | 45,041 | ||||||
| Adjusted net income | $ | 35,487 | $ | 58,739 | ||||
| Adjusted net income per diluted share: | ||||||||
| Numerator for adjusted net income per diluted share: | ||||||||
| Adjusted net income | $ | 35,487 | $ | 58,739 | ||||
| Denominator: | ||||||||
| Basic weighted average shares | 1,044,198 | 1,029,793 | ||||||
| Outstanding options and restricted shares, net | 17,251 | 19,341 | ||||||
| Diluted weighted average shares | 1,061,449 | 1,049,134 | ||||||
| Net income per diluted share | $ | 0.01 | $ | 0.02 | ||||
| Adjusted net income per diluted share | $ | 0.03 | $ | 0.06 | ||||
RITE AID CORPORATION AND SUBSIDIARIES
SUPPLEMENTAL INFORMATION
ADJUSTED NET INCOME
(Dollars in thousands, except per share amounts)
(unaudited)
| Twenty-six weeks ended August 27, 2016 | Twenty-six weeks ended August 29, 2015 | |||||||
| Net income | $ | 10,185 | $ | 40,305 | ||||
| Add back - Income tax expense | 4,619 | 28,904 | ||||||
| Income before income taxes | 14,804 | 69,209 | ||||||
| Adjustments: | ||||||||
| Amortization of EnvisionRx intangible assets | 41,168 | 17,040 | ||||||
| LIFO charge | 27,511 | 11,973 | ||||||
| Loss on debt retirements, net | - | 33,205 | ||||||
| Merger and Acquisition-related costs | 4,158 | 11,701 | ||||||
| Adjusted income before income taxes | 87,641 | 143,128 | ||||||
| Adjusted income tax expense | 27,344 | 59,828 | ||||||
| Adjusted net income | $ | 60,297 | $ | 83,300 | ||||
| Adjusted net income per diluted share: | ||||||||
| Numerator for adjusted net income per diluted share: | ||||||||
| Adjusted net income | $ | 60,297 | $ | 83,300 | ||||
| Denominator: | ||||||||
| Basic weighted average shares | 1,043,317 | 1,008,242 | ||||||
| Outstanding options and restricted shares, net | 17,210 | 18,959 | ||||||
| Diluted weighted average shares | 1,060,527 | 1,027,201 | ||||||
| Net income per diluted share | $ | 0.01 | $ | 0.04 | ||||
| Adjusted net income per diluted share | $ | 0.06 | $ | 0.08 | ||||
RITE AID CORPORATION AND SUBSIDIARIES
CONSOLIDATED STATEMENTS OF CASH FLOWS
(Dollars in thousands)
(unaudited)
| Thirteen weeks ended August 27, 2016 | Thirteen weeks ended August 29, 2015 | |||||||
| OPERATING ACTIVITIES: | ||||||||
| Net income | $ | 14,773 | $ | 21,469 | ||||
| Adjustments to reconcile to net cash used in operating activities: | ||||||||
| Depreciation and amortization | 142,051 | 127,699 | ||||||
| Lease termination and impairment charges | 7,233 | 9,637 | ||||||
| LIFO charge | 13,760 | 5,986 | ||||||
| Loss on sale of assets, net | 174 | 281 | ||||||
| Stock-based compensation expense | 12,552 | 8,831 | ||||||
| Loss on debt retirements, net | - | 33,205 | ||||||
| Changes in deferred taxes | 7,747 | (7,966 | ) | |||||
| Excess tax benefit on stock options and restricted stock | (2,365 | ) | (18,049 | ) | ||||
| Changes in operating assets and liabilities: | ||||||||
| Accounts receivable | (152,725 | ) | (2,908 | ) | ||||
| Inventories | (216,911 | ) | (80,673 | ) | ||||
| Accounts payable | 34,693 | (47,806 | ) | |||||
| Other assets and liabilities, net | (8,060 | ) | (75,969 | ) | ||||
| Net cash used in operating activities | (147,078 | ) | (26,263 | ) | ||||
| INVESTING ACTIVITIES: | ||||||||
| Payments for property, plant and equipment | (119,641 | ) | (130,646 | ) | ||||
| Intangible assets acquired | (12,488 | ) | (29,169 | ) | ||||
| Acquisition of businesses, net of cash acquired | - | (1,779,571 | ) | |||||
| Proceeds from dispositions of assets and investments | 3,745 | 3,243 | ||||||
| Net cash used in investing activities | (128,384 | ) | (1,936,143 | ) | ||||
| FINANCING ACTIVITIES: | ||||||||
| Net proceeds from revolver | 270,000 | 869,000 | ||||||
| Principal payments on long-term debt | (5,509 | ) | (655,640 | ) | ||||
| Change in zero balance cash accounts | (1,728 | ) | (17,034 | ) | ||||
| Net proceeds from the issuance of common stock | 1,587 | 4,727 | ||||||
| Financing fees paid for early debt redemption | - | (26,003 | ) | |||||
| Excess tax benefit on stock options and restricted stock | 2,365 | 18,049 | ||||||
| Deferred financing costs paid | - | (175 | ) | |||||
| Net cash provided by financing activities | 266,715 | 192,924 | ||||||
| Decrease in cash and cash equivalents | (8,747 | ) | (1,769,482 | ) | ||||
| Cash and cash equivalents, beginning of period | 144,840 | 1,922,129 | ||||||
| Cash and cash equivalents, end of period | $ | 136,093 | $ | 152,647 | ||||
| SUPPLEMENTAL CASH FLOW INFORMATION | ||||||||
| Payments for property, plant and equipment | $ | 119,641 | $ | 130,646 | ||||
| Intangible assets acquired | 12,488 | 29,169 | ||||||
| Total cash capital expenditures | 132,129 | 159,815 | ||||||
| Equipment received for noncash consideration | 114 | 1,466 | ||||||
| Equipment financed under capital leases | 1,307 | 471 | ||||||
| Gross capital expenditures | $ | 133,550 | $ | 161,752 | ||||
RITE AID CORPORATION AND SUBSIDIARIES
CONSOLIDATED STATEMENTS OF CASH FLOWS
(Dollars in thousands)
(unaudited)
| Twenty-six weeks ended August 27, 2016 | Twenty-six weeks ended August 29, 2015 | |||||||
| OPERATING ACTIVITIES: | ||||||||
| Net income | $ | 10,185 | $ | 40,305 | ||||
| Adjustments to reconcile to net cash provided by operating activities: | ||||||||
| Depreciation and amortization | 280,839 | 237,348 | ||||||
| Lease termination and impairment charges | 13,014 | 14,659 | ||||||
| LIFO charge | 27,511 | 11,973 | ||||||
| Loss on sale of assets, net | 1,230 | 320 | ||||||
| Stock-based compensation expense | 23,696 | 16,201 | ||||||
| Loss on debt retirements, net | - | 33,205 | ||||||
| Changes in deferred taxes | 1,998 | 1,574 | ||||||
| Excess tax benefit on stock options and restricted stock | (3,248 | ) | (20,869 | ) | ||||
| Changes in operating assets and liabilities: | ||||||||
| Accounts receivable | (227,255 | ) | 8,119 | |||||
| Inventories | (157,471 | ) | (24,469 | ) | ||||
| Accounts payable | 150,339 | 31,909 | ||||||
| Other assets and liabilities, net | (107,972 | ) | (8,703 | ) | ||||
| Net cash provided by operating activities | 12,866 | 341,572 | ||||||
| INVESTING ACTIVITIES: | ||||||||
| Payments for property, plant and equipment | (225,718 | ) | (271,683 | ) | ||||
| Intangible assets acquired | (28,869 | ) | (43,462 | ) | ||||
| Acquisition of businesses, net of cash acquired | - | (1,779,571 | ) | |||||
| Proceeds from dispositions of assets and investments | 6,833 | 6,081 | ||||||
| Net cash used in investing activities | (247,754 | ) | (2,088,635 | ) | ||||
| FINANCING ACTIVITIES: | ||||||||
| Proceeds from issuance of long-term debt | - | 1,800,000 | ||||||
| Net proceeds from revolver | 250,000 | 728,000 | ||||||
| Principal payments on long-term debt | (11,230 | ) | (661,217 | ) | ||||
| Change in zero balance cash accounts | 534 | (51,309 | ) | |||||
| Net proceeds from the issuance of common stock | 3,958 | 8,105 | ||||||
| Financing fees paid for early debt redemption | - | (26,003 | ) | |||||
| Excess tax benefit on stock options and restricted stock | 3,248 | 20,869 | ||||||
| Deferred financing costs paid | - | (34,634 | ) | |||||
| Net cash provided by financing activities | 246,510 | 1,783,811 | ||||||
| Increase in cash and cash equivalents | 11,622 | 36,748 | ||||||
| Cash and cash equivalents, beginning of period | 124,471 | 115,899 | ||||||
| Cash and cash equivalents, end of period | $ | 136,093 | $ | 152,647 | ||||
| SUPPLEMENTAL CASH FLOW INFORMATION | ||||||||
| Payments for property, plant and equipment | $ | 225,718 | $ | 271,683 | ||||
| Intangible assets acquired | 28,869 | 43,462 | ||||||
| Total cash capital expenditures | 254,587 | 315,145 | ||||||
| Equipment received for noncash consideration | 746 | 2,011 | ||||||
| Equipment financed under capital leases | 2,860 | 1,271 | ||||||
| Gross capital expenditures | $ | 258,193 | $ | 318,427 | ||||