 |
 |
 |
UNITED STATES
SECURITIES AND EXCHANGE COMMISSION
Washington, D.C. 20549
________________
FORM
| | ANNUAL REPORT PURSUANT TO SECTION 13 OR 15(d) OF THE SECURITIES EXCHANGE ACT OF 1934 | |
|
| OR | |
| | TRANSITION REPORT PURSUANT TO SECTION 13 OR 15(d) OF THE SECURITIES EXCHANGE ACT OF 1934 | |
| For the transition period from ___________________ to ___________________ |
Commission File Number
THE SHYFT GROUP, INC.
(Exact Name of Registrant as Specified in Its Charter)
|
|
|
|
|
|
|
|
Registrant’s Telephone Number, Including Area Code: (
| Securities registered pursuant to Section 12(b) of the Securities Exchange Act: |
| Title of Each Class | Trading Symbol(s) | Name of Each Exchange on which Registered |
| Securities registered pursuant to Section 12(g) of the Securities Exchange Act: None |
Indicate by check mark if the registrant is a well-known seasoned issuer, as defined in Rule 405 of the Securities Act.
|
| Yes | ☐ |
| | ☒ |
|
Indicate by check mark if the registrant is not required to file reports pursuant to Section 13 or Section 15(d) of the Act.
|
| Yes | ☐ |
| | ☒ |
|
Indicate by check mark whether the registrant: (1) has filed all reports required to be filed by Section 13 or 15(d) of the Securities Exchange Act of 1934 during the preceding 12 months (or for such shorter period that the registrant was required to file such reports), and (2) has been subject to such filing requirements for the past 90 days.
|
| | ☒ |
| No | ☐ |
|
Indicate by check mark whether the registrant has submitted electronically every Interactive Data File required to be submitted pursuant to Rule 405 of Regulation S-T (§ 232.405 of this chapter) during the preceding 12 months (or for such shorter period that the registrant was required to submit such files).
|
| | ☒ |
| No | ☐ |
|
Indicate by check mark whether the registrant is a large accelerated filer, an accelerated filer, a non-accelerated filer, a smaller reporting company, or an emerging growth company. See the definitions of “large accelerated filer”, “accelerated filer”, “smaller reporting company” and “emerging growth company” in Rule 12b-2 of the Exchange Act.
| | ☒ |
| Accelerated filer | ☐ | Non-accelerated filer | ☐ | Smaller reporting company | | Emerging growth company | |
If an emerging growth company, indicate by check mark if the registrant has elected not to use the extended transition period for complying with any new or revised financial accounting standards provided pursuant to Section 13(a) of the Exchange Act. ☐
Indicate by check mark whether the registrant has filed a report on and attestation to its management’s assessment of the effectiveness of its internal control over financial reporting under Section 404(b) of the Sarbanes-Oxley Act (15 U.S.C. 7262(b)) by the registered public accounting firm that prepared or issued its audit report.
If securities are registered pursuant to Section 12(b) of the Act, indicate by check mark whether the financial statements of the registrant included in the filing reflect the correction of an error to previously issued financial statements. ☐
Indicate by check mark whether any of those error corrections are restatements that required a recovery analysis of incentive-based compensation received by any of the registrant’s executive officers during the relevant recovery period pursuant to §240.10D-1(b). ☐
Indicate by check mark whether the registrant is a shell company (as defined in Rule 12b-2 of the Exchange Act).
|
| Yes | |
| No | ☒ |
|
The aggregate market value of the registrant’s common stock held by non-affiliates of the registrant, based on the last sales price of such stock on NASDAQ Global Select Market on June 30, 2022, the last business day of the registrant’s most recently completed second fiscal quarter: $
The number of shares outstanding of the registrant’s Common Stock as of February 17, 2023:
Documents Incorporated by Reference
Portions of the definitive proxy statement for the registrant’s May 17, 2023 annual meeting of shareholders, to be filed with the Securities and Exchange Commission no later than 120 days after December 31, 2022 are incorporated by reference in Part III.
FORWARD-LOOKING STATEMENTS
This Form 10-K contains some statements that are not historical facts. These statements are called “forward-looking statements” within the meaning of Section 27A of the Securities Act of 1933, as amended, and Section 21E of the Securities Exchange Act of 1934, as amended. These statements involve important known and unknown risks, uncertainties and other factors and generally can be identified by phrases using “estimate,” “anticipate,” “believe,” “project,” “expect,” “intend,” “predict,” “potential,” “future,” “may,” “will,” “should” or similar expressions or words. The Shyft Group, Inc.'s (the “Company,” “we,” “us” or “our”) future results, performance or achievements may differ materially from the results, performance or achievements discussed in the forward-looking statements. These statements are not guarantees of future performance and involve certain risks, uncertainties and assumptions (“Risk Factors”) that are difficult to predict with regard to timing, extent, likelihood and degree of occurrence. Therefore, actual results and outcomes may materially differ from what may be expressed or forecasted in such forward-looking statements.
Risk Factors include the risk factors listed and more fully described in Item 1A below, “Risk Factors,” as well as risk factors that we have discussed in previous public reports and other documents filed with the Securities and Exchange Commission. The list in Item 1A below includes the primary risks our management believes could materially affect the potential results described by forward-looking statements contained in this Form 10-K. However, these risks may not be the only risks we face. Our business, operations and financial performance could also be affected by additional factors that are not presently known to us or that we currently consider to be immaterial to our operations. In addition, new Risk Factors may emerge from time to time that may cause actual results to differ materially from those contained in any forward-looking statements. Given these risks and uncertainties, although we believe that the forward-looking statements contained in this Form 10-K are reasonable, we cannot provide you with any guarantee that the results described in those forward-looking statements will be achieved. All forward-looking statements in this Form 10-K are expressly qualified in their entirety by the cautionary statements contained in this section, and investors should not place undue reliance on forward-looking statements as a prediction of actual results. The Company undertakes no obligation to update or revise any forward-looking statements to reflect developments or information obtained after the date this Form 10-K is filed with the Securities and Exchange Commission.
Trademarks and Service Marks
We own or have rights to trademarks, service marks or trade names that we use in connection with the operation of our business. Solely for convenience, some of the copyrights, trademarks, service marks and trade names referred to in this Annual Report on Form 10-K are listed without the ©, ® and ™ symbols, but we will assert, to the fullest extent under applicable law, our rights to our copyrights, trademarks, service marks, trade names and domain names. The trademarks, service marks and trade names of other companies appearing in this Annual Report on Form 10-K are, to our knowledge, the property of their respective owners.
PART I
| Item 1. |
Business. |
General
As used herein, the term “Company”, “we”, “us” or “our” refers to The Shyft Group, Inc. and its subsidiaries unless designated or identified otherwise.
We are a niche market leader in specialty vehicle manufacturing and assembly for the commercial vehicle (including last-mile delivery, specialty service and vocation-specific upfit segments) and recreational vehicle industries. Our products include walk-in vans, truck bodies, and cargo van and pick-up truck upfits used in e-commerce/parcel delivery, upfit equipment used in the mobile retail and utility trades, as well as luxury Class A diesel motorhome custom chassis and contract manufacturing and assembly services. We also supply replacement parts and offer repair, maintenance, field service and refurbishment services for the vehicles that we manufacture. Our operating activities are conducted through our wholly-owned operating subsidiary, The Shyft Group USA, Inc., with locations in Novi, Charlotte, and Plymouth, Michigan; Bristol, Indiana; Waterville, Maine; Landisville, Pennsylvania; North Charleston, South Carolina; Pompano Beach and West Palm Beach, Florida; Kansas City, Missouri; Carson, McClellan Park, and Montebello, California; Mesa, Arizona; Dallas and Weatherford, Texas; and Saltillo, Mexico.
Our vehicles, parts and services are sold to commercial users, original equipment manufacturers (OEMs), dealers, individual end users, and municipalities and other governmental entities. Our diversification across several sectors provides numerous opportunities while reducing overall risk as the various markets we serve tend to have different cyclicality. We have an innovative team focused on building lasting relationships with our customers by designing and delivering market leading specialty vehicles, vehicle components and services. Additionally, our business structure provides agility to quickly respond to market needs, take advantage of strategic opportunities when they arise and correctly size and scale operations to ensure stability and growth. Our growing opportunities that we have capitalized on in last mile delivery as a result of the rapidly changing e-commerce market is an excellent example of our ability to generate growth and profitability by quickly fulfilling customer needs.
Performance Overview
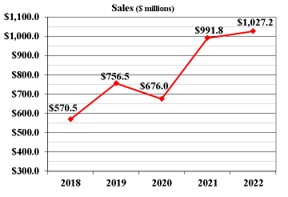
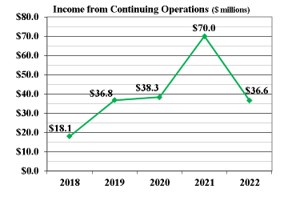
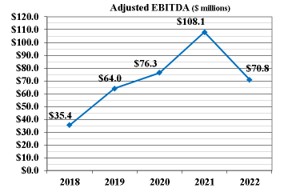
Unless noted otherwise, the data in this Form 10-K reflects our continuing operations and, therefore, excludes the performance of our prior Emergency Response Vehicles (“ERV”) business. Over the past five years our sales have increased by $456.7 million, a compound annual growth rate (CAGR) of 15.8%, while income from continuing operations has grown by $18.5 million, a CAGR of 19.2%, and Adjusted EBITDA has grown by $35.4 million, a CAGR of 18.9%. Please see the reconciliation of income from continuing operations to Adjusted EBITDA near the end of Item 1 of this Form 10-K.
|
|
|
Our Segments
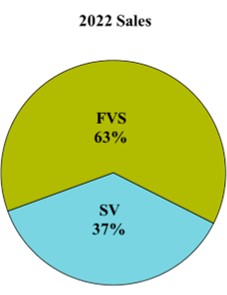
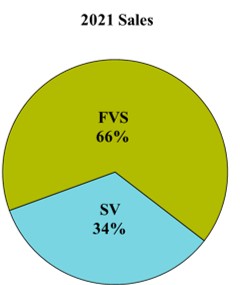
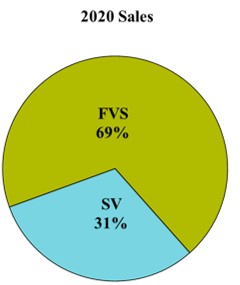
We identify our reportable segments based on our management structure and the financial data utilized by our chief operating decision maker to assess segment performance and allocate resources among our operating units. We have two reportable segments: Fleet Vehicles and Services (“FVS”) and Specialty Vehicles (“SV”). Sales by segment are as follows:
 |
 |
 |
Fleet Vehicles and Services Segment
We manufacture commercial vehicles used in the e-commerce/last mile/parcel delivery, beverage and grocery delivery, laundry and linen, mobile retail, and trades and construction industries through our Bristol, Indiana; Landisville, Pennsylvania; and Charlotte, Michigan locations. Our commercial vehicles are marketed under the Utilimaster brand name, which serves a diverse customer base and sells aftermarket parts and accessories for walk-in vans and other delivery vehicles. We also provide vocation-specific equipment upfit services, which are marketed and sold as Utilimaster Upfit Services, through our manufacturing operations in Kansas City, Missouri; North Charleston, South Carolina; and Saltillo, Mexico. Our Fleet Vehicles and Services segment employed approximately 2,600 employees and 400 contractors as of December 31, 2022.
We offer fleet vehicles in Gross Vehicle Weight Rating (“GVWR”) Class 1 through Class 7, the largest range of product offerings amongst our competitors.
| Cargo Van Upfit | “Velocity” | Traditional Walk-in-Van | Truck Body |
 |
 |
 |
 |
| Class 1 & 2 | Class 2 & 3 | Class 4 & 5 | Class 6 & 7 |
Innovation
Our Solution Experts employ a customer-centric approach by working with customers through a process of listening and learning, needs assessment, and design innovation through building and implementing solutions designed with our customers and their end customers in mind. Innovations implemented by our Solution Experts include efficiency improvements and cost saving solutions for the service segment, utility industry, food and beverage delivery, and mobile retail industry, such as safe loading equipment, keyless entry and cargo access systems, backup camera systems, and refrigeration solutions. Our teams can deliver product customization ranging from out-of-the-box to 100% custom solutions, based on customer needs and business requirements.
Innovations launched by the product development team include a new walk-in-van format, named the Velocity. Available in GVWR Class 2 and Class 3 designs, the Velocity lineup spans multiple OEM chassis formats to accommodate buyer preference and to increase manufacturing and distribution scale.
Products
|
Walk-in Vans Assembled on a de-contented or “stripped” truck chassis supplied with engine and drive train components, our walk-in vans are used across a variety of vocations for multiple delivery and mobile service options. The vehicles feature a durable and lightweight aluminum body with a highly modularized cargo area, featuring extensive driver ergonomics options and a low step-in height for easy entry and egress. |
|
|
|
|
|
Truck Bodies Utilimaster dry van truck bodies are the industry standard for heavy-duty commercial delivery and are installed on chassis from a variety of manufacturers, which are supplied with a finished cab. They feature a highly customizable cargo area for maximum versatility and are manufactured with anti-rust galvanized steel, Utiliplate, and aluminum component parts. Available with cargo lengths from 10 to 28 feet and interior heights ranging from 72 to 108 inches. |
|
|
|
 |
Cutaway Utilimaster cutaway truck bodies are the industry standard for medium-duty commercial delivery and are installed on chassis from a variety of manufacturers that are supplied with a finished cab. The highly configurable design can be configured with a set-back walk-through bulkhead allowing access to the cargo area from the cab. Available with cargo lengths from 10 to 18 feet and interior heights ranging from 72 to 90 inches. |
|
|
|
|
|
Velocity® A nimble, fuel efficient, and ergonomically designed walk-in van lineup built on commercial cargo van chassis across OEMs is designed to combine the cargo capacity of a traditional walk-in-van with the drivability of a smaller format vehicle. The Velocity lineup makes large product/package deliveries easy, with lower entry/egress height and 3-point grab rails at side and rear doors, and comfortable safe seats. Economical to operate, the Velocity features a lower total cost of ownership than that of a traditional walk-in van. |
|
|
|
 |
Specialty Upfit We install specialty interior and exterior upfit equipment for walk-in vans, truck bodies, cargo vans, and light duty pick-up trucks for added safety, cargo handling efficiency, and vocational functionality. |
 |
Parts and Accessories We provide a full line of parts and accessories for our walk-in vans and truck bodies. |
Marketing
We market our commercial vehicles, including walk-in vans, cutaway vans, and truck bodies, under the Aeromaster®, Velocity, Trademaster®, and Utilivan® product brand names. We sell our fleet vehicles to leasing companies, national and fleet accounts (national accounts typically have 1,000+ vehicle fleets and fleet accounts typically have 100+ vehicle fleets), and through a network of independent truck dealers in the U.S. and Canada. We also market our truck bodies direct to retail customers in select markets. We provide aftermarket support, including parts sales and field services, to all of our fleet vehicle customers through our Customer Service Department located in Bristol, Indiana.
Manufacturing
We have implemented the Shyft Production System, lean manufacturing and continuous improvement in all of our fleet vehicle facilities in order to maximize efficiency and reduce costs. Our facilities are aligned with our commercial and OEM customers for the installation of upfit equipment. Our walk-in vans and truck bodies are manufactured on non-automated assembly lines utilizing a combination of high-skilled tradespeople and assemblers. Our upfit facilities utilize teams of workers requiring minimal capital investment for efficient and timely installation of a variety of equipment for various vocations.
Specialty Vehicles Segment
Our Specialty Vehicles segment includes our Spartan RV Chassis and Builtmore Contract Manufacturing brands, service bodies, and vocation specific upfit. Spartan RV is manufactured out of our Charlotte, Michigan facility where we engineer and manufacture luxury Class A diesel motorhome chassis, provide contract assembly of specialty vehicles and other commercial vehicles, and distribute related aftermarket parts and accessories under the Red Diamond Aftermarket Solutions and Builtmore Contract Manufacturing brand names. Our service body operations include locations in Charlotte, Michigan; Carson, McClellan Park, and Montebello, California; Mesa, Arizona; Dallas and Weatherford, Texas; and Waterville, Maine. We also provide vocation-specific equipment upfit services, which are marketed and sold under the Strobes-R-Us brand, through our manufacturing operations in Pompano and West Palm Beach, Florida. Our specialty vehicle products are manufactured to customer specifications upon receipt of confirmed purchase orders. As a specialty chassis and vehicle manufacturer, we believe we hold a unique position for continued growth due to the high quality and performance of our products, our proactive engineering, manufacturing expertise and flexibility, and the scalability of our operations. Our specialty vehicle products are generally sold through original equipment manufacturers in the case of chassis and vehicles and to dealers, distributors or directly to consumers for service bodies and aftermarket parts and accessories. The Specialty Vehicles segment employed approximately 1,000 employees and less than 100 contractors as of December 31, 2022.
Innovation
Through trade shows and motorhome rallies, we talk with a wide variety of motorhome owners to identify needs and provide our customers the latest technology and highest quality in our motorhome and specialty chassis. Recent innovations to our motorhome chassis include: our Premier Drive™ system, with custom tuned shocks, 20k independent front suspension, and passive steer tag axle that greatly improve ride, handling and maneuverability; automatic air leveling that adds convenience and functionality to luxury motorhomes; and updates to the Connected Coach experience with the Tri-Pod Steering Wheel, rain sensing wiper controls, a 15in anti-glare Digital Dash that receives direct notifications from the Spartan RV Chassis Advanced Protection System™ (APS), which includes adaptive cruise control, collision mitigation, electronic stability control and lane departure warning – all designed to create a safer, more intuitive driving experience. We also support trade shows, OEM and dealer events to promote our service body products and upfit services. We continue to expand our product portfolio and execute innovations in that segment.
Products
|
|
Motorhome Chassis We custom manufacture diesel chassis for luxury Class A motorhome to the individual specifications of our motorhome OEM customers under the Spartan RV Chassis brand name. These specifications vary based on specific interior and exterior design specifications, gross vehicle weight, horsepower, and electrical needs of the motorhome bodies to be attached to our chassis. Our motorhome chassis feature diesel engines of 360 to 605 horsepower and are used in motorhomes ranging from 34 to 45 feet. Our motorhome chassis are separated into four models: the K1, K2, K3, and K4 series chassis. |
 |
Contract Manufacturing We provide final assembly services for Isuzu N-gas and F-series chassis for the North American market under the Builtmore Contract Manufacturing brand name. These class 3 and class 5 chassis are utilized in a variety of final configurations for light duty freight hauling and industrial uses. We have an efficient, flexible and a highly skilled team of assembly workers and management, which, along with a dedication to lean manufacturing and continuous improvement, allow us to deliver superior quality and value in contract manufacturing. |
|
|
Service Bodies We manufacture and assemble truck bodies for a variety of trades and vocations. Those body configurations include utility bodies, stake bodies, contractor bodies, dump/landscape bodies and vocational dry freight bodies under the Royal Truck Body and DuraMag brand names. |
 |
Specialty Upfit We design and install custom lighting and upfit solutions to meet the unique needs of certain fleet industries including a range of specialty industries such as law enforcement, Department of Transportation, security companies, and providers of funeral, towing, and utility services. We provide durable, reliable, and high-quality product installations for any vehicle requiring specialty exterior and interior accessory upfits. |
 |
Parts and Accessories We provide truck accessories under our Magnum brand and provide a full line of parts and accessories as well as maintenance and repair services for our motorhome and specialty chassis. |
Marketing
We sell our Class A diesel motorhome chassis to OEMs for use in the manufacturing of luxury motorhomes. We actively participate in a variety of trade shows and motorhome rallies that promote our products and Red Diamond aftermarket solutions in addition to providing an opportunity to communicate with our end customers to showcase our latest innovations and identify needs and opportunities for continuous improvement of our chassis. We sell our service bodies through a commercial dealer network and through OEM pools, and we actively participate in a variety of regional and national trade shows that promote our products. We also provide vocation-specific equipment upfit services, which are marketed and sold under the Strobes-R-Us brand. We are expanding the marketing of Magnum accessories beyond work trucks to include outdoor enthusiasts and truck owners.
Manufacturing
Our motorhome chassis, service body, and specialty manufacturing operations employ the Shyft Production System, lean manufacturing, and continuous improvement to bring efficiency and cost reduction throughout our Specialty Vehicles segment. We engineer, manufacture, and assemble Spartan RV chassis, as well as other specialty vehicles on non-automated assembly lines. We assemble both the Isuzu N-gas and F-series chassis on high-volume assembly lines that utilize a variety of state-of-the-art automation and testing equipment. Our upfit facilities utilize teams of workers requiring minimal capital investment for efficient and timely installation of a variety of equipment.
Competition
The principal methods we use to build competitive advantages include short engineering reaction time, custom design capability, high product quality, superior customer service and quick delivery. We employ a solutions-based approach to offer specialized products tailored to customer needs across the spectrum of our products. We compete with companies that manufacture for similar markets, including some divisions of large diversified organizations that have total sales and financial resources exceeding ours. Our competition in the fleet vehicle market ranges from one large manufacturer in the walk-in van market to a number of smaller manufacturers in the truck body and equipment upfit markets. Our competitors in the specialty vehicle market are principally large multi-product line manufacturers of specialty and heavy-duty vehicles. In addition to established mature competitors, we also face competition from new market entrants including technology companies.
Suppliers
We are dedicated to establishing long-term and mutually beneficial relationships with our suppliers. Through these relationships, we benefit from new innovations, higher quality, reduced lead times, smoother/faster manufacturing ramp-up of new vehicle introductions and lower total costs of doing business. Our accelerating growth and company-wide supply chain management initiatives allow us to benefit from economies of scale and maximize focus on a common vision.
The single largest commodity directly utilized in production is aluminum, which we purchase under purchase agreements based on forecasted production requirements. To a lesser extent we are dependent upon suppliers of lumber, fiberglass and steel for our manufacturing. We have initiated long-term supplier agreements and are consolidating suppliers where beneficial to gain pricing advantages. There are several readily available sources for the majority of these raw materials. However, we are heavily dependent on specific component part products from a few single source vendors. We maintain a qualification, on-site inspection, assistance, and performance measurement system to control risks associated with reliance on suppliers. We normally do not carry inventories of such raw materials or components in excess of those reasonably required to meet production and shipping schedules. Material and component cost increases are passed on to our customers whenever possible. There can be no assurance that there will not be any supply issues over the long-term.
In the assembly of certain of our vehicles, we use chassis supplied by third parties, and we generally do not purchase these chassis for inventory. For this market, we typically accept shipment of truck chassis owned by dealers or end users, for the purpose of installing and/or manufacturing our specialized commercial vehicles on such chassis, but from time to time we do purchase chassis for use in fulfilling certain customer orders.
Research and Development
Our success depends on our ability to innovate and add new products and features ahead of changing market demands and new regulatory requirements. Thus, we emphasize research and development and commit significant resources to develop and adapt new products and production techniques. Our engineering team is looking past “current practices” and “best practices” to deliver “next practices” for our customers and shareholders. Our engineering group's goal throughout the company: to deliver world class products and manufacturing processes regardless of product line or location. Results are accomplished with the appropriate blend of predictive analysis and physical property testing in our Research and Development facilities along with ride-and-drive analysis. Our efforts range from executing special orders for current production; to new production development for new functionality and product improvements; to exciting technologies that are new to the markets we serve, like vehicle electrification. Our engineering actions are driven by our firm commitment to safety, quality, delivery, and productivity. We spent $25.3 million, $8.5 million, and $4.4 million on research and development in 2022, 2021, and 2020, respectively.
Shyft’s Blue Arc™ EV Solutions brought forward an all-electric purpose-built Class 3, 4, and 5 chassis platform built from the ground up and designed to serve a wide array of medium-duty truck markets, from last mile parcel delivery fleets to work trucks, passenger busses, recreational vehicles, and more. The EV-powered chassis will feature customizable length and wheelbase, making it well-suited for a variety of vehicle types. The chassis’ modular design can accommodate multiple GVWR classifications, based on build out and usage. With this high degree of configurability, the all-electric chassis is adaptable to last mile delivery, work truck, mass transit, recreational vehicle, and other emerging EV markets.
Product Warranties
We provide limited warranties against assembly and construction defects. These warranties generally provide for the replacement or repair of defective parts or workmanship for specified periods, ranging from one year to twenty years, following the date of sale. With the use of validation testing, predictive analysis tools and engineering and design standards, we strive to continuously improve product quality and durability, and reduce our exposure to warranty claims. The end users also may receive limited warranties from suppliers of components that are incorporated into our chassis and vehicles. For more information concerning our product warranties, see “Note 11 – Commitments and Contingent Liabilities” of the Notes to Consolidated Financial Statements in Item 8 appearing in this Form 10-K.
Patents, Trademarks and Licenses
We have 18 United States patents, which include rights to the design and structure of chassis and certain peripheral equipment, and we have 22 United States, Canada, and Patent Cooperation Treaty pending patent applications. The existing patents will expire on various dates from 2025 through 2040 and utility patents are subject to payment of required maintenance fees. We also own or license 103 federal and international trademark and service mark registrations. The trademark and service mark registrations are generally renewable under applicable laws, subject to payment of required fees and the filing of affidavits of use. In addition, we have various pending trademark applications.
Our products and services are identified by our trademarks and service marks. Our trademarks and service marks are valuable assets to both of our business segments. We are not aware of any infringing uses or any prior claims of ownership of our trademarks that could materially affect our business. It is our policy to pursue registration of our primary marks whenever possible and to vigorously defend our patents, trademarks and other proprietary marks against infringement or other threats to the extent practicable under applicable laws.
Human Capital Management
We believe people are the most critical component in our continued success, and we strive to attract high-performing talent. As of December 31, 2022, we employed approximately 4,200 employees and contractors. Approximately 10% of our total workforce consists of contractors, including all personnel at our Saltillo, Mexico operation. Our production processes leverage a combination of skilled tradespeople and high-touch assemblers working in body, electrical, mechanical, paint, and assembly operations. As a team, our employees and contractors put the Company’s core values into action, while executing on key growth initiatives to maintain long-term sustainable growth. We strive to create a workplace of choice to attract, retain, and develop top talent to achieve our vision and deliver shareholder results.
In our locations, we compete with many local companies for talent. We have implemented talent strategies and market competitive wages and benefits to support talent acquisition and retention. In addition to these actions, we have implemented employee surveys and focus groups that encourage our employees to share their opinions and feedback on the culture of our company. The results of the surveys are analyzed and measured to learn how we can enhance and accelerate improvements in the attraction and retention in a difficult talent environment.
We adhere to a philosophy that includes, among other things, commitments to create ongoing job opportunities, pay fair wages, and protect worker health and safety. Fundamental to these commitments are our Company’s core values of honesty and integrity, accountability, trust, and performance excellence. Management considers relations with the Company’s workforce to be positive.
Compensation and Benefits
We believe the structure of our compensation packages provides the appropriate incentives to attract, retain and motivate our employees. We provide base pay that is competitive and that aligns with employee positions, skill levels, experience and geographic location. In addition to base pay, we seek to reward employees with incentive awards, recognition programs, educational opportunities, paid time off, and equity awards for employees in certain roles.
Diversity and Inclusion
We value and advance the diversity and inclusion of the people with whom we work. We are committed to equal opportunity and are intolerant of discrimination and harassment. We strive to maintain workplaces that are free from discrimination or harassment on the basis of race, sex, color, national or social origin, ethnicity, religion, age, disability, sexual orientation, gender identification or expression, political opinion or any other status protected by applicable law.
The basis for recruitment, hiring, placement, development, training, compensation and advancement at the Company includes qualifications, performance, skills and experience.
We do not tolerate disrespectful or inappropriate behavior, unfair treatment or retaliation of any kind. Harassment is not tolerated in the workplace and in any work-related circumstance outside the workplace.
Customer Base
We serve customers ranging from municipalities to OEMs to commercial customers and vehicle dealers throughout our product lines. Sales to our top 10 customers in 2022 accounted for 52.6% of our sales. Sales to customers that individually exceeded 10% of our consolidated sales for 2022, 2021 and 2020 are detailed in the chart below.
|
Year |
Customer |
Sales ($ millions) |
Percentage of consolidated sales |
Segment |
||||||||
| 2022 | Amazon | $ | 153.6 | 15.0 | % | FVS | ||||||
| 2022 | Newmar | $ | 107.7 | 10.5 | % | SV | ||||||
| 2021 | Amazon | $ | 248.6 | 25.1 | % | FVS | ||||||
| 2020 |
Amazon |
$ |
198.3 |
29.3 |
% |
FVS |
||||||
We do have other significant customers which, if the relationship changes significantly, could have a material adverse impact on our financial position and results of operations. We believe that we have developed strong relationships with our customers and continually work to develop new customers and markets. See related risk factors in Item 1A of this Form 10-K.
Sales to customers outside the United States were $7.7 million, $11.7 million, and $9.5 million for the years ended December 31, 2022, 2021 and 2020, respectively, or 0.7%, 1.2%, and 1.4%, respectively, of sales for those years. Substantially all of our long-lived assets are located in the United States.
Order Backlog
Our order backlog by reportable segment is summarized in the following table (in thousands).
| December 31, 2022 |
December 31, 2021 |
Decrease |
||||||||||
| FVS |
$ | 736,690 | $ | 859,442 | $ | (122,752 | ) | |||||
| SV |
96,023 | 104,117 | (8,094 | ) | ||||||||
| Total consolidated |
$ | 832,713 | $ | 963,559 | $ | (130,846 | ) | |||||
Our FVS backlog decreased by $122.8 million, or 14.3%. Our SV segment backlog decreased by $8.1 million, or 7.8%.
While orders in the backlog are subject to modification, cancellation or rescheduling by customers, this has not been a major factor in the past. Although the backlog of unfilled orders is one of many indicators of market demand, several factors, such as chassis and component availability, changes in production rates, available capacity, new product introductions and competitive pricing actions, may affect actual sales. Accordingly, a comparison of backlog from period-to-period is not necessarily indicative of eventual actual shipments.
Non-GAAP Financial Measure
This Form 10-K presents Adjusted EBITDA (earnings before interest, taxes, depreciation and amortization), which is a non-GAAP financial measure. This non-GAAP measure is calculated by excluding items that we believe to be infrequent or not indicative of our underlying operating performance, as well as certain non-cash expenses. We define Adjusted EBITDA as income from continuing operations before interest, income taxes, depreciation and amortization, as adjusted to eliminate the impact of restructuring charges, acquisition related expenses and adjustments, non-cash stock-based compensation expenses, and other gains and losses not reflective of our ongoing operations.
We present the non-GAAP measure Adjusted EBITDA because we consider it to be an important supplemental measure of our performance. The presentation of Adjusted EBITDA enables investors to better understand our operations by removing items that we believe are not representative of our continuing operations and may distort our longer-term operating trends. We believe this measure to be useful to improve the comparability of our results from period to period and with our competitors, as well as to show ongoing results from operations distinct from items that are infrequent or not indicative of our continuing operating performance. We believe that presenting this non-GAAP measure is useful to investors because it permits investors to view performance using the same tools that management uses to budget, make operating and strategic decisions, and evaluate our historical performance. We believe that the presentation of this non-GAAP measure, when considered together with the corresponding GAAP financial measures and the reconciliations to that measure, provides investors with additional understanding of the factors and trends affecting our business than could be obtained in the absence of this disclosure.
Our management uses Adjusted EBITDA to evaluate the performance of and allocate resources to our segments. Adjusted EBITDA is also used, along with other financial and non-financial measures, for purposes of determining annual incentive compensation for our management team and long-term incentive compensation for certain members of our management team.
The following table reconciles Income from continuing operations to Adjusted EBITDA for the periods indicated.
| 2022 | 2021 |
2020 |
2019 |
2018 |
||||||||||||||||
| Income from continuing operations |
$ | 36,558 | $ | 69,974 | $ | 38,289 | $ | 36,790 | $ | 18,116 | ||||||||||
| Net (income) attributable to non-controlling interest |
- | (1,230 | ) | (347 | ) |
(140 | ) |
- | ||||||||||||
| Interest expense |
2,833 | 414 | 1,293 | 1,839 | 1,080 | |||||||||||||||
| Income tax expense |
7,368 | 14,506 | 9,867 | 10,355 | 3,334 | |||||||||||||||
| Depreciation and amortization |
14,774 | 11,356 | 13,903 | 6,073 | 6,214 | |||||||||||||||
| Restructuring and other related charges |
757 | 505 | 1,873 | 316 | 662 | |||||||||||||||
| Acquisition related expenses and adjustments |
884 | 1,585 | 1,332 | 3,531 | 1,952 | |||||||||||||||
| Non-cash stock-based compensation expense |
7,619 | 8,745 | 7,706 | 5,281 | 4,027 | |||||||||||||||
| Loss from write-off of construction in process |
- | - | 2,430 | - | - | |||||||||||||||
| Loss from liquidation of JV | - | 643 | - | - | - | |||||||||||||||
| Non-recurring professional fees | - | 1,568 | - | - | - | |||||||||||||||
| Adjusted EBITDA |
$ | 70,793 | $ | 108,066 | $ | 76,346 | $ | 64,045 | $ | 35,385 | ||||||||||
Available Information
Our Annual Reports on Form 10-K, Quarterly Reports on Form 10-Q, Current Reports on Form 8-K and other reports (and amendments thereto) filed or furnished pursuant to Section 13(a) of the Securities Exchange Act are available, free of charge, on our internet website (www.TheShyftGroup.com) as soon as reasonably practicable after we electronically file or furnish such materials with the Securities and Exchange Commission (“SEC”).
The SEC maintains an internet website (www.sec.gov) that contains reports, proxy and information statements, and other information regarding issuers that file electronically with the SEC.
Information About our Executive Officers
The executive officers of the Company, their business experience and their ages as of February 1, 2023, are as follows:
| Name |
Position |
Business Experience |
Age |
Executive Officer Since |
||
| Daryl M. Adams |
President and Chief Executive Officer |
President and Chief Executive Officer since February 2015. Director since December 2014. Chief Operating Officer from July 2014 to February 2015. Chief Executive Officer, Midway Products from 2007 to 2014. |
61 |
2015 |
| Name |
Position |
Business Experience |
Age |
Executive Officer Since |
||
| Jonathan C. Douyard |
Chief Financial Officer |
Chief Financial Officer since March 2020. Vice President and Chief Financial Officer, Fluke Corporation from June 2016 to February 2020. Prior roles included finance leadership positions with Commercial Systems & Services business unit, Sikorsky Aircraft (United Technologies) and General Electric subsidiaries. |
43 |
2020 |
||
| Todd A. Heavin |
Chief Operating Officer |
Chief Operating Officer since June 2019. Independent Management Consultant from August 2017 to May 2019. Division President, American Axle from April 2017 to August 2017. Division General Manager, Metaldyne Performance Group from 2014 to April 2017. |
61 |
2019 |
||
| John Dunn |
President, Fleet Vehicles and Services |
President, Shyft Fleet Vehicles and Services since January 2023. President and CEO, North and South America of Plastic Omnium, Clean Energy Systems from April 2014 to December 2022. President, Brose North America from July 2012 to April 2014. |
56 |
2023 |
||
| Stephen K. Guillaume |
President, Specialty Vehicles |
President, Shyft Specialty Vehicles since May 2015. Vice President of New Business Development and Joint Ventures from January 2015 to May 2015.Vice President and General Manager, Navistar Commercial Trucks from 2010 through 2014. |
55 |
2015 |
||
| Joshua A. Sherbin |
Chief Legal Officer, Chief Compliance Officer and Corporate Secretary |
Chief Legal Officer, Chief Compliance Officer and Corporate Secretary since May 2021. Senior Vice President, General Counsel, Chief Compliance Officer and Corporate Secretary, TriMas Corporation from March 2016 to May 2021. |
59 |
2021 |
||
| Colin Hindman | Chief Human Resources Officer | Chief Human Resources Officer since June 2020. Chief Human Resources Officer, Dayco Products LLC from March 2017 to June 2020. Vice President, Human Resources, TriMas Corporation from March 2010 to November 2016. | 48 | 2022 |
| Item 1A. |
Risk Factors. |
Our financial condition, results of operations and cash flows are subject to various risks, many of which are not exclusively within our control that may cause actual performance to differ materially from historical or projected future performance. The risks described below are the primary risks known to us that we believe could materially affect our business, financial condition, results of operations, or cash flows. However, these risks may not be the only risks we face. Our business could also be affected by additional factors that are not presently known to us, factors we currently consider to be immaterial to our operations, or factors that emerge as new risks in the future. Readers should not interpret the disclosure of any risk factor to imply that the risk has not already materialized.
Risks Related to Global Events
Uncertain global macro-economic and political conditions could materially adversely affect our business, financial condition, results of operations, or cash flows.
Global and local business conditions include inflation, recession, interest rates, availability of capital, energy and commodity prices, trade laws and the effects of governmental initiatives to manage economic conditions. We have experienced, and are continuing to experience, challenges and increases in costs for logistics and in our supply chains, such as increased port congestion, intermittent supplier delays, and volatility in prices of commodities such as base metals and raw materials. In addition, we are experiencing varying levels of inflation resulting in part from various supply chain disruptions, increased shipping and transportation costs, increased raw material and labor costs, and other disruptions caused by the COVID-19 pandemic and general economic conditions. Further unfavorable conditions such as a general slowdown of the U.S. economy, uncertainty and volatility in the financial markets, uncertainty or volatility in commodity prices or additional inflationary factors and rising interest rates could result in higher operating costs and expenses for our Company and could make it more difficult and expensive for us to obtain financing.
The current invasion of Ukraine by Russia has escalated tensions among the United States, the North Atlantic Treaty Organization (NATO) and Russia. Such invasion, ongoing military conflict, resulting sanctions and related countermeasures by NATO states, the United States and other countries could lead to market disruptions, including significant volatility in commodity prices, credit and capital markets, as well as supply chain interruptions for equipment, which could have an adverse impact on our business, financial condition, results of operations, or cash flows.
These challenges also impact our suppliers, and we have experienced supply chain disruptions as a result. Our inability to obtain raw materials, chassis and other supplies on a timely basis negatively impacts our ability to fulfill customer orders, which may have a material adverse impact on our results of operations, financial condition, and liquidity.
Risks Related to Our Company and Business
Any negative change in our relationship with our major customers could have significant adverse effects on revenues and profits.
Our financial success is directly related to the willingness of our customers to continue to purchase our products. Failure to fill customers’ orders in a timely manner or on the terms and conditions they may impose could harm our relationships with our customers. The importance of maintaining excellent relationships with our major customers may also give these customers leverage in our negotiations with them, including pricing and other supply terms, as well as post-sale disputes. This leverage may lead to increased costs to us. Furthermore, if any of our major customers experience a significant downturn in their business or fail to remain committed to our products or brands, then these customers may reduce or discontinue purchases from us, which could have an adverse effect on our business, results of operations and financial condition. There were two customers that each accounted for 10 percent or greater of consolidated sales in 2022. Sales to our top 10 customers in 2022 accounted for 52.6 percent of our sales in the aggregate. In addition, our largest customer owns a significant share of a new entrant competitor, and our business may be adversely affected if the customer’s ownership of or our competitive relationship in the marketplace with our competitor results in a decline or discontinuation of the customer’s purchases from us.
We may not be able to remain competitive in the rapidly changing markets in which we compete.
The markets we serve are undergoing rapid transformation, particularly with respect to parcel delivery services and electric vehicle (EV) technologies. Our current and potential competitors include companies that have significantly greater financial, technical, manufacturing, marketing and other resources than we do, including OEMs and certain of our customers, and which are highly motivated by market opportunities to deploy those resources to the design, development, manufacturing, distribution, promotion, sale and support of their products, including their electric vehicles. In addition to these established, mature competitors, we also face competition from new market entrants, including technology companies. As a result of these market opportunities, OEMs and other companies have taken actions to reduce costs, including through in-sourcing and supply base consolidation. We expect these trends to continue and even accelerate. We expect competition for electric vehicles to intensify due to increased demand and a regulatory push for alternative fuel vehicles, continuing globalization, and consolidation in the worldwide vehicle industry. Increased competition may lead to lower vehicle unit sales and increased inventory, which may result in downward price pressure and adversely affect our business, financial condition, operating results, and prospects. Our business will be adversely affected if we are unable to adequately respond to these pressures or otherwise continue to compete in these markets.
Amounts included in order backlog may not result in actual revenue and are an uncertain indicator of our future revenue.
Backlog is generally comprised of agreements and purchase orders from customers that are subject to modification, cancellation, or rescheduling. While realization of revenue related to order backlog has not been a major issue in the past, we cannot assure that we will recognize revenue with respect to each order included in order backlog. Should a cancellation occur, our order backlog and anticipated revenue would be reduced unless we are able to replace the cancelled order. As a result, the order backlog may not be indicative of future sales and can vary significantly from period to period. Reductions in our order backlog could negatively impact our future results of operations.
We evaluate our order backlog at least quarterly to determine if the orders continue to meet our criteria for inclusion in order backlog. We may adjust our reported order backlog to account for any changes, including those arising from continued customer intent and ability to fulfill order, supply base capacity, and changes in our ability, or the methodology used, to determine whether an order is likely to be completed. We cannot assure that our order backlog will result in revenue on a timely basis or at all, or that any cancelled contracts will be replaced.
As a result, the order backlog may not be indicative of future sales and can vary significantly from period to period. In addition, it is possible that the methodology for determining the order backlog may not be comparable to methods used by other companies.
The integration of businesses or assets we have acquired or may acquire in the future involves challenges that could disrupt our business and harm our financial condition.
As part of our growth strategy, we have pursued and expect we will continue to selectively pursue acquisitions of businesses or assets in order to diversify, expand our capabilities, enter new markets, or increase our market share. Integrating any newly acquired business or assets can be expensive and can require a great deal of management time and other resources. We cannot guarantee that we will be able to identify attractive acquisition targets or assets. If we are unable to successfully integrate the newly acquired businesses with our existing business, we may not realize the synergies we expect from the acquisition and our business and results of operations may be adversely impacted.
Re-configuration or relocation of our production operations could negatively impact our earnings.
We may, from time to time, reconfigure our production lines or relocate production of products between buildings or locations or to new locations to maximize the efficient utilization of our existing production capacity or take advantage of opportunities to increase manufacturing efficiencies. Costs incurred to affect these reconfigurations or relocations may exceed our estimates, and efficiencies gained may be less than anticipated, each of which may have a negative impact on our results of operations and financial position.
Disruptions within our dealer network could adversely affect our business.
We rely, for certain of our products, on a network of independent dealers to market, deliver, provide training for, and service our products to and for customers. Our business is influenced by our ability to initiate and manage new and existing relationships with dealers.
From time to time, we or an individual dealer may choose to terminate the relationship, or the dealership could face financial difficulty leading to failure or difficulty in transitioning to new ownership. In addition, our competitors could engage in a strategy to attempt to acquire or convert our dealers to carry their products. We do not believe our business is dependent on any single dealer, the loss of which would have a sustained material adverse effect upon our business.
However, disruption of dealer coverage within a specific local market could have an adverse impact on our business within the affected market. The loss or termination of a significant number of dealers could cause difficulties in marketing and distributing our products and have an adverse effect on our business, operating results or financial condition. In the event that a dealer in a strategic market experiences financial difficulty, we may choose to provide financial support such as extending credit to a dealership, reducing the risk of disruption, but increasing our financial exposure.
We may not be able to successfully implement and manage our growth strategy.
Our growth strategy includes expanding existing market share through product innovation, continued expansion into industrial and global markets and merger or acquisition related activities. We believe our future success depends in part on our research and development and engineering efforts, our ability to manufacture or source the products and customer acceptance of our products. As it relates to new markets, our success also depends on our ability to create and implement local supply chain, sales and distribution strategies to reach these markets.
The potential inability to successfully implement and manage our growth strategy could adversely affect our business and our results of operations. The successful implementation of our growth strategy will depend, in part, on our ability to integrate operations with acquired companies.
Our efforts to grow our business in emerging markets are subject to all of these risks plus additional, unique risks. In certain markets, the legal and political environment can be unstable and uncertain which could make it difficult for us to compete successfully and could expose us to liabilities.
We also make investments in new business development initiatives which could have a relatively high failure rate. We limit our investments in these initiatives and establish governance procedures to contain the associated risks, but losses could result and may be material. Our growth strategy also may involve acquisitions, joint venture alliances and additional arrangements of distribution. We may not be able to enter into acquisitions or joint venture arrangements on acceptable terms, and we may not successfully integrate these activities into our operations. We also may not be successful in implementing new distribution channels, and changes could create discord in our existing channels of distribution.
Increased costs, including costs of raw materials, component parts and labor costs, potentially impacted by changes in labor rates and practices, disruptions in supply chains and/or new or increased tariffs or similar restrictions, could reduce our operating income.
Our results of operations may be significantly affected by the availability and pricing of manufacturing components and labor, changes in labor rates and practices, and increases in tariffs or similar restrictions on materials we import. Increases in costs of raw materials used in our products could affect the cost of our supply materials and components, as rising steel and aluminum prices as well as increased tariffs have impacted the cost of certain of our manufacturing components. In addition, a growth in popularity of EVs without a significant expansion in battery cell production capacity could result in shortages, which could result in increased materials costs to us and could adversely impact our projected manufacturing and delivery timelines. Although we attempt to mitigate the effect of any escalation in components, labor costs, and tariffs by negotiating with current or new suppliers and by increasing productivity or, where possible, by increasing the sales prices of our products, we cannot be certain that we will be able to do so without it having an adverse impact on the competitiveness of our products and, therefore, our sales volume. If we cannot successfully offset increases in our manufacturing costs, this could have a material adverse impact on our margins, operating income and cash flows. Our profit margins may decrease if prices of purchased component parts, labor rates, and/or tariffs increase, and we are unable to pass on those increases to our customers.
Implementing new information systems could interfere with our business or operations.
We are in the process of implementing new information systems infrastructure and applications that impact multiple locations. These projects require significant investment of capital and human resources, the re-engineering of many processes of our business, and the attention of many employees and managers who would otherwise be focused on other aspects of our business. Should the systems not be implemented successfully, we may incur impairment charges that could materially impact our financial results. If the systems do not perform in a satisfactory manner once implementation is complete, our business and operations could be disrupted and our results of operations negatively affected, including our ability to report accurate and timely financial results.
Our EVs will rely on software and hardware that is highly technical, and if these systems contain errors, bugs, vulnerabilities, or design defects, or if we are unsuccessful in addressing or mitigating technical limitations in our systems, our EV business could be adversely affected.
Our EVs will rely on software and hardware that is highly technical and complex and will require modification and updates over the life of the vehicles. Our software and hardware may contain errors, bugs, vulnerabilities or design defects, and our systems are subject to certain technical limitations that may compromise our ability to meet our objectives. Some errors, bugs, vulnerabilities, or design defects inherently may be difficult to detect and may only be discovered after the product has been released. Although we will attempt to remedy any issues we observe in our vehicles effectively and rapidly, such efforts may not be timely, may hamper production or may not be to the satisfaction of our customers.
If we are unable to prevent or effectively remedy errors, bugs, vulnerabilities or defects in our software and hardware, or fail to deploy updates to our software properly, we would suffer damage to our reputation, loss of customers, loss of revenue or liability for damages, any of which could adversely affect our business, prospects, financial condition, results of operations, and cash flows.
There are complex software and technology systems that need to be developed by us and in coordination with vendors and suppliers to reach mass production for our EVs, and there can be no assurance such systems will be successfully developed or integrated.
Our EVs and EV operations will use a substantial amount of complex third-party and in-house software and hardware. The development and integration of such advanced technologies are inherently complex, and we will need to coordinate with our vendors and suppliers to reach mass production for our EVs. Defects and errors may be revealed over time and our control over the performance of third-party services and systems may be limited. Thus, our potential inability to develop and integrate the necessary software and technology systems may adversely affect our EV business.
We rely on third-party suppliers to develop a number of emerging technologies for use in our EVs, including battery technology and the use of different battery cell chemistries. Certain of these technologies and chemistries are not today, and may not ever be, commercially viable. There can be no assurances that our suppliers will be able to meet the technological requirements, production timing, and volume requirements to support our business plan. Furthermore, if we experience delays by our third-party suppliers, we could experience delays in delivering on our timelines. In addition, the technology may not comply with the cost, performance useful life, and warranty characteristics we anticipate in our business plan. As a result, our business plan could be significantly impacted and we may incur significant liabilities under warranty claims which could materially and adversely affect our business, prospects, financial condition, results of operations, and cash flows.
Our EVs will make use of lithium-ion battery cells, which, if not appropriately managed and controlled, have been observed to catch fire or vent smoke and flame.
The battery packs within our EVs will make use of lithium-ion cells. If not properly managed or subject to environmental stresses, lithium-ion cells can rapidly release the energy they contain by venting smoke and flames in a manner that can ignite nearby materials as well as other lithium-ion cells. While the battery pack is designed to contain any single cell’s release of energy without spreading to neighboring cells, a field or testing failure of battery packs in our vehicles could occur, which could result in bodily injury or death and could subject us to lawsuits, field actions (including product recalls), or redesign efforts, all of which would be time consuming and expensive and could harm our brand image. Also, negative public perceptions regarding the suitability of lithium-ion cells for automotive applications, the social and environmental impacts of mineral mining or procurement associated with the constituents of lithium-ion cells, or any future incident involving lithium-ion cells, such as a vehicle or other fire, could materially and adversely affect our reputation and business, prospects, financial condition, results of operations, and cash flows.
Disruption of our supply base could affect our ability to obtain component parts.
We increasingly rely on component parts from global sources in order to manufacture our products. Disruption of this supply base due to international political events (including the conflict between Russia and Ukraine), natural disasters or adverse weather conditions (including any disasters or weather conditions caused by climate change), the COVID-19 pandemic, or other factors could affect our ability to obtain component parts at acceptable prices, or at all, and have a negative impact on our sales, results of operations and financial position.
When we introduce new products, we may incur expenses that we did not anticipate, such as recall expenses, resulting in reduced earnings.
The introduction of new products is critical to our future success. We have additional costs when we introduce new products, such as initial labor or purchasing inefficiencies, but we may also incur unexpected expenses. For example, we may experience unexpected engineering or design issues that will force a recall of a new product or increase production costs of the product above levels needed to ensure profitability. In addition, we may make business decisions that include offering incentives to stimulate the sales of products not adequately accepted by the market, or to stimulate sales of older or less marketable products. The costs resulting from these types of problems could be substantial and have a significant adverse effect on our earnings.
We depend on a small group of suppliers for some of our components, and the loss of any of these suppliers could affect our ability to obtain components at competitive prices, which would decrease our sales or earnings.
Most chassis and specialty vehicle commodity components are readily available from a variety of sources. However, a few proprietary or specialty components are produced by a small group of suppliers.
In addition, we generally do not purchase chassis for our delivery vehicles. Rather, we accept shipments of vehicle chassis owned by dealers or end-users for the purpose of installing and/or manufacturing our specialized truck bodies on such chassis. There are four primary sources for commercial chassis, and we have established relationships with all major chassis manufacturers.
Changes in our relationships with these suppliers, shortages, production delays, their ability to secure components required for chassis production or work stoppages by the employees of such suppliers could have a material adverse effect on our ability to timely manufacture our products and secure sales. If we cannot obtain an adequate supply of components or commercial chassis, this could result in a decrease in our sales and earnings.
Our business could be adversely affected by the decision of our employees to unionize.
Currently, none of our U.S. employees are represented by a collective bargaining agreement. If in the future our employees decide to unionize, this would increase our operating costs and potentially force us to alter the way we operate causing an adverse effect on our operating results.
The ability to hire or retain management and other key personnel is critical to our continued success, and the loss of or inability to hire such personnel could have a material adverse effect on our business, financial condition and results of operations.
Our ability to sustain and grow our business requires us to hire, retain and develop a highly skilled and diverse management team and workforce. Overall, there is intense competition for qualified and skilled employees. As all key personnel devote their full time to our business, the loss of any member of our management team, or other key persons, or the inability to hire key persons, could have an adverse effect on us. If we lose key members of our senior management team or are unable to effect successful transitions from one executive to another as part of our succession plan, we may not be able to effectively manage our current operations or meet ongoing and future business challenges, and this could have a material adverse effect on our business, financial condition and results of operations.
Risks associated with international sales and contracts could have a negative effect on our business.
In 2022, 2021, and 2020, we derived 0.7%, 1.2%, and 1.4% of our revenue from sales to, or related to, end customers outside the United States. We face numerous risks associated with conducting international operations, any of which could negatively affect our financial performance, including changes in foreign country regulatory requirements, the strength of the U.S. dollar compared to foreign currencies, import/export restrictions, the imposition of foreign tariffs and other trade barriers and disruptions in the shipping of exported products.
Additionally, as a public company, we are subject to the Foreign Corrupt Practices Act, which may place us at a competitive disadvantage to foreign companies that are not subject to similar regulations.
Changes in the method of determining London Interbank Offered Rate (LIBOR), or the replacement of LIBOR with an alternative rate, may adversely affect interest charged on our outstanding debt.
The interest rate charged on our outstanding borrowings pursuant to our credit facility is currently based on LIBOR, as described in “Note 13 – Debt” below. On July 27, 2017, the Financial Conduct Authority in the U.K. announced that it would phase out LIBOR by the end of 2021. On November 30, 2020, the ICE Benchmark Administration Limited (ICE) announced plans to delay the phase out of LIBOR to June 30, 2023. The U.S. Federal Reserve is considering replacing U.S. dollar LIBOR with a newly created index called the Secured Overnight Funding Rate (SOFR), a broad measure of the cost of borrowing cash overnight collateralized by U.S. Treasury securities. Our credit facility provides for the transition to a replacement for LIBOR, and it also provides for an alternative to LIBOR. When LIBOR ceases to exist, our interest expense may increase. It is also possible that the overall financing market may be disrupted as a result of the phase-out or replacement of LIBOR with SOFR or any other reference rate. Increased interest expense and/or disruption in the financial market could have a material adverse effect on our business, financial condition, or results of operations.
More General Risks Applicable to Our Industry
General economic, market, and/or political conditions, whether on a global, national, or more regional scale, could have a negative effect on our business.
Acts of terrorism, armed conflicts, natural disasters (including those caused by climate change), budget shortfalls, cyber events, civil unrest, governmental actions, and epidemics have in the past and could in the future create significant uncertainties that may have material and adverse effects on consumer demand, shipping and transportation, the availability of manufacturing components, commodity prices and our ability to engage in overseas markets as tariffs are implemented. An economic recession, whether resulting from one of these events or others, would have a material adverse impact on our financial condition and results of operations.
If there is a rise in the frequency and size of product liability, warranty and other claims against us, including wrongful death claims, our business, results of operations and financial condition may be harmed.
We are frequently subject, in the ordinary course of business, to litigation involving product liability and other claims, including wrongful death claims, related to personal injury and warranties. We insure our product liability claims in the commercial insurance market. We cannot be certain that our insurance coverage will be sufficient to cover all future claims against us. Any increase in the frequency and size of these claims, as compared to our experience in prior years, may cause the premiums that we are required to pay for such insurance to rise significantly. It may also increase the amounts we pay in punitive damages, which may not be covered by our insurance. In addition, a major product recall or increased levels of warranty claims could have a material adverse effect on our results of operations.
Changes to laws and regulations governing our business could have a material impact on our operations.
Our manufactured products and the industries in which we operate are subject to extensive federal and state regulations. Changes to any of these regulations or the implementation of new regulations could significantly increase the costs of manufacturing, purchasing, operating or selling our products and could have a material adverse effect on our results of operations. Our failure to comply with present or future regulations could result in fines, potential civil and criminal liability, suspension of sales or production, or cessation of operations.
Certain U.S. tax laws currently afford favorable tax treatment for financing the purchase of recreational vehicles that are used as the equivalent of second homes. These laws and regulations have historically been amended frequently, and it is likely that further amendments and additional regulations will be applicable to us and our products in the future. Amendments to these laws and regulations and the implementation of new regulations could have a material adverse effect on our results of operations.
Our operations are subject to a variety of federal and state environmental regulations relating to noise pollution and the use, generation, storage, treatment, emission and disposal of hazardous materials and wastes. Our failure to comply with present or future regulations could result in fines, potential civil and criminal liability, suspension of production or operations, alterations to the manufacturing process, costly cleanup or capital expenditures. Climate change regulations at the federal, state or local level could require us to change our manufacturing processes or product portfolio or undertake other activities that may require us to incur additional expense, which may be material.
Our vehicles are subject to motor vehicle safety standards, and the failure to satisfy such mandated safety standards could have a material adverse effect on our business, financial condition, results of operations, and cash flows.
All vehicles sold must comply with international, federal, and state motor vehicle safety standards. In the United States, vehicles that meet or exceed all federally mandated safety standards are self-certified by the manufacturer under the federal regulations. Rigorous testing and the use of approved materials and equipment are among the requirements for achieving federal certification. Other jurisdictions outside the United States require us to meet Type Approval requirements proving to regulators that our vehicles meet those relevant safety standards in effect in those countries. Failure by us to maintain compliance of our current vehicles or obtain certification of compliance for any future vehicle, including future EV models, with motor vehicle safety standards in the United States, Canada or other jurisdictions could have a material adverse effect on our business, prospects, financial condition, results of operations, and cash flows.
Our operating results may fluctuate significantly on a quarter-to-quarter basis.
Our quarterly operating results depend on a variety of factors including the timing and volume of orders, the completion of product inspections and acceptance by our customers, and various restructuring initiatives that may be undertaken from time to time. As an example, our Fleet Vehicles and Services segment experiences seasonality whereby product shipments in the first and fourth quarters are generally lower than other quarters as a result of the busy holiday delivery operations experienced by some of its largest customers. Accordingly, our financial results may be subject to significant and/or unanticipated quarter-to-quarter fluctuations.
Our businesses are cyclical, and this can lead to fluctuations in our operating results.
The industries in which we operate are highly cyclical and there can be substantial fluctuations in our manufacturing, shipments and operating results, and the results for any prior period may not be indicative of results for any future period. Companies within these industries are subject to volatility in operating results due to external factors such as economic, demographic and political changes. Factors affecting the manufacture of chassis, specialty vehicles, delivery vehicles and other of our products include but are not limited to:
| ● |
Commodity prices; |
| ● |
Fuel availability and prices. |
| ● |
Unemployment trends; |
| ● |
International tensions and hostilities; |
| ● |
General economic conditions; |
| ● |
Various tax incentives; |
| ● |
Strength of the U.S. dollar compared to foreign currencies; |
| ● |
Overall consumer confidence and the level of discretionary consumer spending; |
| ● |
Dealers’ and manufacturers’ inventory levels; and |
| ● |
Interest rates and the availability of financing. |
Economic, legal and other factors could impact our customers’ ability to pay accounts receivable balances due from them.
In the ordinary course of business, customers are granted terms related to the sale of goods and services delivered to them. These terms typically include a period between when the goods and services are tendered for delivery to the customer and when the customer needs to pay for these goods and services. The amounts due under these payment terms are listed as accounts receivable on our balance sheet. Prior to collection of these accounts receivable, our customers could encounter drops in sales, unexpected increases in expenses, or other factors which could impact their ability to continue as a going concern and which could affect the collectability of these amounts. Writing off uncollectible accounts receivable could have a material adverse effect on our earnings and cash flow as we have major customers with material accounts receivable balances at any given time.
Our business operations could be disrupted if our information technology systems fail to perform adequately or experience a security breach.
We rely on our information technology systems to effectively manage our business data, communications, supply chain, product engineering, manufacturing, accounting and other business processes. If these systems are damaged, cease to function properly or are subject to a cyber-security breach such as ransomware, phishing, infection with viruses or intentional attacks aimed at theft or destruction of sensitive data, we may suffer an interruption in our ability to manage and operate the business, and our results of operations and financial condition may be adversely affected.
Like most corporations, our information systems are a target of attacks. In addition, third-party providers of data hosting or cloud services, as well as our suppliers, may experience cyber-security incidents that may involve data we share with them. There can be no assurance that such incidents will not have a material adverse effect on us in the future. In order to address risks to our information systems, we continue to make investments in personnel, technologies and training of personnel.
Fuel shortages, or higher prices for fuel, could have a negative effect on sales.
Gasoline or diesel fuel is required for the operation of the specialty vehicles we manufacture. There can be no assurance that the supply of these petroleum products will continue uninterrupted, that rationing will not be imposed or that the price of or tax on these petroleum products will not significantly increase in the future. Increases in gasoline and diesel prices and speculation about potential fuel shortages have had an unfavorable effect on consumer demand for motorhome from time to time in the past and may continue to do so in the future. This, in turn, may have a material adverse effect on our sales volume. Increases in the price of oil also can result in significant increases in the price of many of the components in our products, which may have an adverse impact on margins or sales volumes.
We could incur asset impairment charges for goodwill, intangible assets or other long-lived assets.
We have a significant amount of goodwill, intangible assets and other long-lived assets. At least annually, we review goodwill and non-amortizing intangible assets for impairment. Identifiable intangible assets, goodwill and other long-lived assets are also reviewed for impairment whenever events or changes in circumstances indicate the carrying amount of an asset may not be recoverable from future cash flows. If the operating performance at one or more of our reporting units fails to meet future forecasts, or if future cash flow estimates decline, we could be required, under current U.S. accounting rules, to record impairment charges for our goodwill, intangible assets or other long-lived assets. Any write-off of a material portion of such assets could negatively affect our results of operations or financial position. See “Note 2 – Discontinued Operations” and “Note 6 – Goodwill and Intangible Assets” of the Notes to Consolidated Financial Statements appearing in Item 8 of this Form 10-K for further discussion of goodwill, intangibles and other long-lived assets.
We may be unable to adequately protect our intellectual property.
While we believe that our patents, trademarks, know-how and other intellectual property have significant value, it is uncertain that this intellectual property or any intellectual property acquired or developed by us in the future will provide a meaningful competitive advantage. Our patents or pending applications may be challenged, invalidated or circumvented by competitors or rights granted thereunder may not provide meaningful proprietary protection. Moreover, competitors may infringe on our patents or successfully avoid them through design innovation. Policing unauthorized use of our intellectual property is difficult and expensive, and we may not be able to, or have the resources to, prevent misappropriation of our proprietary rights, particularly in countries where the laws may not protect such rights as fully as in the U.S. The cost of protecting our intellectual property may be significant and have a material adverse effect on our financial condition and future results of operations.
The unavailability, reduction, elimination or adverse application of government incentives could have an adverse effect on our business, prospects, financial condition and operating results.
Expectations relating to environmental, social and governance considerations expose us to potential liabilities, increased costs, reputational harm and other adverse effects on our business.
Many governments, regulators, investors, employees, customers and other stakeholders are increasingly focused on environmental, social and governance (ESG) considerations relating to businesses, including climate change and greenhouse gas emissions, human capital and diversity, equity and inclusion. We make statements about our ESG goals and initiatives through information provided on our website, press statements and other communications, including through our Sustainability Report. Responding to these ESG considerations and implementation of these goals and initiatives involves risks and uncertainties, including those described under “Forward-Looking Statements,” requires investments and are impacted by factors that may be outside of our control. In addition, some stakeholders may disagree with our goals and initiatives and the focus of stakeholders may change and evolve over time. Stakeholders also may have very different views on where ESG focus should be placed, including differing views of regulators in various jurisdictions in which we operate. Any failure, or perceived failure, by us to achieve our goals, further our initiatives, adhere to our public statements, comply with federal, state or international ESG laws and regulations, or meet evolving and varied stakeholder expectations and standards could result in legal and regulatory proceedings against us and materially adversely affect our business, reputation, results of operations, financial condition and stock price.
Risk Applicable to Our Securities
Our stock price has been and may continue to be volatile, which may result in losses to our shareholders.
The market price of our common stock has been and may continue to be subject to wide fluctuations in response to, among other things, quarterly fluctuations in operating results, a failure to meet published estimates of or changes in earnings estimates by securities analysts, sales of common stock by existing stockholders, loss of key personnel, market conditions in our industries, shortages of key product inventory components and general economic conditions.
| Item 1B. |
Unresolved Staff Comments. |
None.
| Item 2. |
Properties. |
We operate facilities in a total of 17 locations, 16 throughout the U.S. and one location in Mexico. The number of physical locations we operate has grown significantly in recent years as part of our strategy to develop coast-to-coast manufacturing and distribution capabilities.
Our Fleet Vehicles and Services segment operates facilities in Bristol, Indiana; Charlotte, Michigan; Landisville, Pennsylvania; North Charleston, South Carolina; and Kansas City, Missouri. All of these facilities are leased except for facilities in Charlotte, which are owned by the Company. FVS also operates facilities in Saltillo, Mexico.
Our Specialty Vehicles segment operates facilities in Charlotte, Michigan; Carson, McClellan Park, and Montebello, California; Dallas and Weatherford, Texas; Mesa, Arizona; Waterville, Maine; and Pompano Beach and West Palm Beach, Florida. All of these facilities are leased except for the Charlotte and Pompano Beach facilities, which are owned by the Company.
In addition, our corporate headquarters are located in an office building and showroom in Novi, Michigan, that we lease. We also have certain corporate functions that operate out of our campus in Charlotte and Plymouth, Michigan.
We consider our properties to generally be in good condition, well maintained, and suitable and adequate to meet our business requirements for the foreseeable future. We do not anticipate difficulty in renewing existing leases as they expire or in finding alternative facilities.
| Item 3. |
Legal Proceedings. |
At December 31, 2022, we were parties, both as plaintiff or defendant, to a number of lawsuits and claims arising out of the normal conduct of our businesses. Our management does not currently expect our financial position, future operating results or cash flows to be materially affected by the final outcome of these legal proceedings. The information contained in “Note 11 – Commitments and Contingent Liabilities – EPA Matter” of the Notes to Consolidated Financial Statements appearing in Item 8 of this Form 10-K is incorporated herein by reference.
| Item 4. |
Mine Safety Disclosures. |
Not applicable.
PART II
| Item 5. |
Market for Registrant’s Common Equity, Related Stockholder Matters, and Issuer Purchases of Equity Securities. |
Our common stock is traded on the NASDAQ Global Select Market under the symbol “SHYF.” The number of shareholders of record of our common stock on February 17, 2023 was 252. See Item 12 below for information concerning our equity compensation plans.
We paid dividends on our outstanding common shares in 2022 and 2021 as shown in the table below.
| Date dividend declared |
Record date |
Payment date |
Dividend per share ($) |
||||
| Nov. 1, 2022 | Nov. 16, 2022 | Dec. 15, 2022 | 0.050 | ||||
| Aug. 5, 2022 | Aug. 17, 2022 | Sep. 16, 2022 | 0.050 | ||||
| May 2, 2022 | May 17, 2022 | Jun. 17, 2022 | 0.050 | ||||
| Feb. 16, 2022 | Feb. 17, 2022 | Mar. 17, 2022 | 0.050 | ||||
| Nov. 5, 2021 | Nov. 16, 2021 | Dec. 16, 2021 | 0.025 | ||||
| Aug. 6, 2021 | Aug. 18, 2021 | Sep. 15, 2021 | 0.025 | ||||
| May 7, 2021 | May 18, 2021 | Jun. 18, 2021 | 0.025 | ||||
| Feb. 15, 2021 | Feb. 25, 2021 | Mar. 25, 2021 | 0.025 | ||||
On February 3, 2022, our Board of Directors authorized an increase in the Company’s quarterly dividend from $0.025 to $0.05 per share payable on or before March 17, 2022, to shareholders of record at the close of business on February 17, 2022.
No assurance, however, can be given that any future dividends will be made or, if made, as to the amounts or timing of any future dividends as such dividends are subject to earnings, financial condition, liquidity, capital requirements, and such other factors as our Board of Directors deems relevant.
The following graph compares the cumulative total stockholder return on our common stock with the cumulative total return on the NASDAQ Composite Index and the Dow Jones U.S. Commercial Vehicles & Trucks Total Stock Market Index for the period beginning on December 31, 2017 and ending on the last day of 2022. The graph assumes an investment of $100 in our stock, the NASDAQ Composite Index, and the Dow Jones U.S. Commercial Vehicles & Trucks Total Stock Market Index on December 31, 2017, and further assumes the reinvestment of all dividends. Stock price performance, presented for the period from December 31, 2017 to December 31, 2022, is not necessarily indicative of future results.
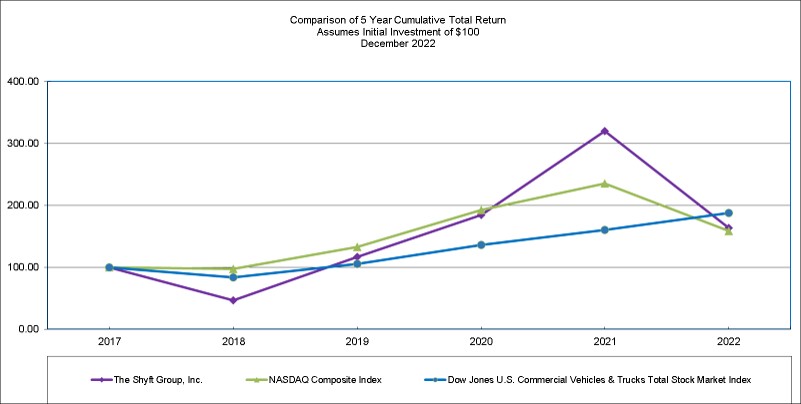
| 12/31/2017 |
12/31/2018 |
12/31/2019 |
12/31/2020 |
12/31/2021 |
12/31/2022 | |||||||||||||||||||
| The Shyft Group, Inc. |
$ | 100.00 | $ | 46.34 | $ | 116.85 | $ | 184.42 | $ | 320.05 | $ | 163.08 | ||||||||||||
| NASDAQ Composite Index |
$ | 100.00 | $ | 97.16 | $ | 132.81 | $ | 192.47 | $ | 235.15 | $ | 158.65 | ||||||||||||
| Dow Jones U.S. Commercial Vehicles & Trucks Total Stock Market Index |
$ | 100.00 | $ | 83.73 | $ | 105.66 | $ | 136.09 | $ | 160.10 | $ | 188.02 | ||||||||||||
The stock price performance graph and related information shall not be deemed “filed” with the Securities and Exchange Commission, nor shall such information be incorporated by reference by any general statement incorporating by reference this Form 10-K into any filing under the Securities Act of 1933 or the Securities Exchange Act of 1934, each as amended, except to the extent that we specifically incorporate this information by reference.
Issuer Purchases of Equity Securities
On February 22, 2022, we announced that our Board of Directors had authorized the repurchase of up to $250.0 million of our common stock. The repurchase authorization does not have an expiration date. We believe that we have sufficient resources to fund any potential stock buyback in which we may engage.
During the quarter ended December 31, 2022, no shares were repurchased under this authorization. A summary of our purchases of our common stock during the fourth quarter of 2022 is as follows:
|
|
|
Average |
Total Number of |
Approximate Dollar Value of Shares That |
||||||||||||
| October 2022 |
- | $ | - | - | $ | 242.1 | ||||||||||
| November 2022 |
234 | 23.08 | - | 242.1 | ||||||||||||
| December 2022 |
- | - | - | 242.1 | ||||||||||||
| Total |
- | |||||||||||||||
| (1) During the quarter ended December 31, 2022, 234 shares were delivered by employees in satisfaction of tax withholding obligations that occurred upon the vesting of restricted shares. These shares are not repurchased pursuant to the Board of Directors authorization disclosed above. (2) This column reflects the number of shares that may yet be purchased pursuant to the Board of Directors authorization described above. |
| Item 6. |
[Reserved] |
| Item 7. |
Management’s Discussion and Analysis of Financial Condition and Results of Operations. |
General
The Shyft Group, Inc. was organized as a Michigan corporation and is headquartered in Novi, Michigan. We are a niche market leader in specialty vehicle manufacturing and assembly for the commercial vehicle (including last-mile delivery, specialty service and vocation-specific upfit segments) and recreational vehicle industries. Our products include walk-in vans and truck bodies used in e-commerce/parcel delivery, upfit equipment used in the mobile retail and utility trades, service and vocational truck bodies, luxury Class A diesel motorhome chassis and contract manufacturing and assembly services. We also supply replacement parts and offer repair, maintenance, field service and refurbishment services for the vehicles that we manufacture as well as truck accessories.
Our vehicles, parts and services are sold to commercial users, original equipment manufacturers (OEMs), dealers, individual end users, and municipalities and other governmental entities. Our diversification across several sectors provides numerous opportunities while reducing overall risk as the various markets we serve tend to have different cyclicality. We have an innovative team focused on building lasting relationships with our customers by designing and delivering market leading specialty vehicles, vehicle components, and services. Additionally, our business structure is agile and able to quickly respond to market needs, take advantage of strategic opportunities when they arise and correctly size and scale operations to ensure stability and growth. Our growing opportunities that we have capitalized on in last mile delivery as a result of the rapidly changing e-commerce market is an excellent example of our ability to generate growth and profitability by quickly fulfilling customer needs.
We believe we can best carry out our long-term business plan and obtain optimal financial flexibility by using a combination of borrowings under our credit facilities, and internally or externally generated equity capital, as sources of expansion capital.
Executive Overview
| ● |
Sales of $1,027.2 million in 2022, compared to $991.8 million in 2021 |
| ● |
Gross margin of 17.6% in 2022, compared to 20.1% in 2021 |
| ● |
Operating expense of $132.9 million ($25.3 million related to research and development), or 12.9% of sales in 2022, compared to $115.2 million ($8.5 million related to research and development), or 11.6% of sales in 2021 |
| ● |
Operating income of $47.5 million in 2022, compared to $84.1 million in 2021 |
| ● |
Income tax expense of $7.4 million in 2022, compared to $14.5 million in 2021 |
| ● |
Income from continuing operations of $36.6 million in 2022, compared to $70.0 million in 2021 |
| ● |
Diluted earnings per share from continuing operations of $1.03 in 2022, compared to $1.91 in 2021 |
| ● |
Operating cash flow of $(18.8) million in 2022, compared to $74.0 million in 2021 |
| ● |
Order backlog of $832.7 million in 2022, compared to $963.6 million in 2021 |
The following table shows our sales by market for the years ended December 31, 2022, 2021 and 2020 as a percentage of total sales:
| 2022 | 2021 |
2020 |
||||||||||
| Fleet vehicles sales |
58.9 | % | 63.0 | % |
63.3 | % |
||||||
| Motorhome chassis sales |
17.0 | % | 17.0 | % |
16.0 | % |
||||||
| Other specialty vehicles sales |
18.1 | % | 14.6 | % |
14.0 | % |
||||||
| Aftermarket parts and accessories sales |
6.0 | % | 5.4 | % |
6.7 | % |
||||||
| Total sales |
100.0 | % | 100.0 | % |
100.0 | % |
||||||
We continue to seek out opportunities to grow the business, both organically and by acquisition, by expanding relationships with existing customers, seeking out new business wins, and pursuing acquisitions in a strategic fashion.
We believe we are well positioned to take advantage of long-term opportunities and continue our efforts to bring product innovations to each of the markets we serve. Some of our recent innovations and strategic developments include:
| ● |
In March 2022, we announced Blue Arc™ Electric Vehicle (“EV”) Solutions, a new go-to-market brand alongside a trio of initial product offerings—an industry-first commercial grade purpose-built EV chassis; a fully reimagined from the ground up all-electric delivery walk-in van; and a fully portable, remote-controlled charging station, the Power Cube™. |
| ○ | The proprietary battery-powered chassis features customizable length and wheelbase, making it well-suited to serve a wide range of medium-duty trucks and end uses. The chassis’ modular design will accommodate multiple weight ratings and classifications, based on build-out and usage. The lithium-ion battery packs provide an approximate range of 150 to 175 miles with the opportunity to enhance range through expanded battery options. |
| ○ | Leveraging a scalable design, the full Blue Arc EV portfolio is available in Class 3, 4 and 5 walk-in van configurations with body length options from 12 to 22 feet. Designed for high-frequency, last-mile delivery fleets, these vehicles are powered by lithium-ion battery packs that can deliver 150 mile range at 50% payload in parcel mode with optional extended range packs available. With these options, Shyft customers can maximize productivity and minimize cost of ownership, including fuel and maintenance costs. |
| ○ | The Blue Arc ecosystem also includes the Power Cube, a fully portable remote-controlled charging station with onboard energy storage to serve a variety of commercial vehicle needs and other applications. Understanding that lack of EV infrastructure is one of the roadblocks to adoption, this design requires no digging and trenching or costly infrastructure changes and can be up and running in a matter of hours. |
| ● |
The Velocity lineup of last-mile delivery vehicles span Gross Vehicle Weight Rating class sizes 2 and 3 and are available on Ford Transit, Mercedes Sprinter, and RAM Promaster chassis. The Velocity combines fuel efficiency, comfort, and maneuverability with the cargo space, access, and load capacity similar to a traditional walk-in van. |
| ● |
Royal Truck Body’s new Severe Duty body, built to fit General Motors’ medium duty truck class and Ford's Super Duty truck class, includes more standard features than any other service body on the market. With its fortress five-point lock system, 10-gauge steel box tops treated with a protective Polyeurea coating and 3/8″ tread plate steel floors, this work truck is built to last and is ideal for contractors and business owners that need heavy-duty work trucks. |
| ● |
The K3 and K4 motorhome chassis are equipped with the Spartan® RV Chassis Connected Coach®, featuring the new 15-inch anti-glare digital dash that is custom designed for the RV customer to meet their specific display or operational needs. Integrating with the digital dash is the new Tri-Pod Steering Wheel, which places driving features and instrumentation right at the driver's fingertips, enabling a more effortless engagement with driving features and controls. |
| ● |
The strength of our balance sheet and access to working capital through our revolving credit facility. |
The following section provides a narrative discussion about our financial condition and results of operations. Certain amounts in the narrative may not sum due to rounding. The comments should be read in conjunction with our Consolidated Financial Statements and related Notes thereto appearing in Item 8 of this Form 10-K.
Results of Operations
The discussion of our 2021 consolidated operating results compared to our 2020 consolidated operating results is included in Item 7. Management’s Discussion and Analysis of Financial Condition and Results of Operations (“MD&A”) of our 2021 Annual Report on Form 10-K filed February 24, 2022 and is incorporated by reference into this MD&A.
The following table sets forth, for the periods indicated, the components of our consolidated statements of operations, as a percentage of sales (percentages may not sum due to rounding):
| Year Ended December 31, |
||||||||
| 2022 | 2021 |
|||||||
| Sales |
100.0 | 100.0 | ||||||
| Cost of products sold |
82.4 | 79.9 | ||||||
| Gross profit |
17.6 | 20.1 | ||||||
| Operating expenses: |
||||||||
| Research and development |
2.5 | 0.9 | ||||||
| Selling, general and administrative |
10.5 | 10.8 | ||||||
| Operating income |
4.6 | 8.5 | ||||||
| Other expense, net |
(0.3 | ) | - | |||||
| Income from continuing operations before income taxes |
4.3 | 8.5 | ||||||
| Income tax expense |
0.7 | 1.5 | ||||||
| Income from continuing operations |
3.6 | 7.1 | ||||||
| Loss from discontinued operations, net of income taxes |
- | - | ||||||
| Non-controlling interest |
- | 0.1 | ||||||
| Net income attributable to The Shyft Group, Inc. |
3.6 | 6.9 | ||||||
Sales
Consolidated sales for the year ended December 31, 2022 increased by $35.4 million, or 3.6% to $1,027.2 million from $991.8 million in 2021. This increase reflects strong demand in our SV segment and favorable pricing implemented to offset material and labor inflation, partially offset by lower sales volumes in our FVS segment primarily due to supply chain constraints. These changes in sales are discussed more fully in the discussion of our segments below.
Cost of Products Sold
Cost of products sold increased by $54.2 million, or 6.8%, to $846.7 million for the year ended December 31, 2022 from $792.5 million in 2021. Cost of products sold increased $56.1 million due to higher material and labor costs and $20.1 million due to inefficiencies and other costs in locations impacted by supply chain constraints, partially offset by lower volume and mix of 22.0 million. As a percentage of sales, cost of products sold increased to 82.4% in 2022, compared to 79.9% in 2021.
Gross Profit
Gross profit decreased by $18.9 million, or 9.5%, to $180.4 million in 2022 from $199.3 million in 2021. The decrease was due to higher material and labor costs of $56.1 million, inefficiencies of $20.1 million in locations impacted by supply chain constraints, and $10.2 million in volume, partially offset by price and mix increases of $67.5 million. Gross margin decreased to 17.6% in 2022 from 20.1% over 2021 due to the items mentioned above.
Operating Expenses
Operating expenses for the year ended December 31, 2022 increased by $17.7 million, or 15.4%, to $132.9 million from $115.2 million in 2021. Research and development expense increased $16.8 million in 2022 primarily related to electric vehicle development initiatives including materials and components associated with building prototype vehicles. Selling, general and administrative expense increased by $0.9 million, or 0.9 %, to $107.6 million in 2022 from $106.7 million in 2021.
Other Income and Expense
Interest expense for the year ended December 31, 2022 increased by $2.4 million to $2.8 million from $0.4 million in 2021. The increase was due to additional borrowings and higher borrowing costs. Other expense was $0.8 million for the year ended December 31, 2022 compared to other income of $0.8 million for the year ended December 31, 2021.
Income Tax Expense
Income tax expense from continuing operations for the year ended December 31, 2022 was $7.4 million as compared to the prior year at $14.5 million. Our effective tax rate in 2022 was 16.8%, compared to 17.2% in 2021.
Income from Continuing Operations
Income from continuing operations for the year ended December 31, 2022 decreased by $33.4 million, or 47.8%, to $36.6 million compared to $70.0 million in 2021. On a diluted per share basis, income from continuing operations decreased $0.88 to $1.03 in 2022 compared to $1.91 per share in 2021. Driving this decrease were the factors noted above.
Our Segments
This Form 10-K presents Adjusted EBITDA (earnings before interest, taxes, depreciation and amortization), which is a non-GAAP financial measure when presented on a consolidated basis. This non-GAAP measure is calculated by excluding items that we believe to be infrequent or not indicative of our underlying operating performance, as well as certain non-cash expenses. We define Adjusted EBITDA as income from continuing operations before interest, income taxes, depreciation and amortization, as adjusted to eliminate the impact of restructuring charges, acquisition related expenses and adjustments, non-cash stock-based compensation expenses, and other gains and losses not reflective of our ongoing operations.
We present the non-GAAP measure Adjusted EBITDA because we consider it to be an important supplemental measure of our performance. The presentation of Adjusted EBITDA enables investors to better understand our operations by removing items that we believe are not representative of our continuing operations and may distort our longer-term operating trends. We believe this measure to be useful to improve the comparability of our results from period to period and with our competitors, as well as to show ongoing results from operations distinct from items that are infrequent or not indicative of our continuing operating performance. We believe that presenting this non-GAAP measure is useful to investors because it permits investors to view performance using the same tools that management uses to budget, make operating and strategic decisions, and evaluate our historical performance. We believe that the presentation of this non-GAAP measure, when considered together with the corresponding GAAP financial measures and the reconciliations to that measure, provides investors with additional understanding of the factors and trends affecting our business than could be obtained in the absence of this disclosure.
Our management uses Adjusted EBITDA to evaluate the performance of and allocate resources to our segments. Adjusted EBITDA is also used, along with other financial and non-financial measures, for purposes of determining annual incentive compensation for our management team and long-term incentive compensation for certain members of our management team.
The following table reconciles Income from continuing operations to Adjusted EBITDA for the periods indicated.
| Year Ended December 31, 2022 |
Year Ended December 31, 2021 |
|||||||
| Income from continuing operations |
$ | 36,558 | $ | 69,974 | ||||
| Net (income) attributable to non-controlling interest |
- | (1,230 | ) | |||||
| Interest expense |
2,833 | 414 | ||||||
| Income tax expense |
7,368 | 14,506 | ||||||
| Depreciation and amortization expense |
14,774 | 11,356 | ||||||
| Restructuring and other related charges |
757 | 505 | ||||||
| Acquisition related expenses and adjustments |
884 | 1,585 | ||||||
| Non-cash stock-based compensation expense |
7,619 | 8,745 | ||||||
| Loss from liquidation of JV | - | 643 | ||||||
| Non-recurring professional fees | - | 1,568 | ||||||
| Adjusted EBITDA |
$ | 70,793 | $ | 108,066 | ||||
Our FVS segment consists of our operations at our Bristol, Indiana; Charlotte, Michigan; Kansas City, Missouri; Landisville, Pennsylvania; North Charleston, South Carolina; and Saltillo, Mexico locations. This segment focuses on designing and manufacturing walk-in vans for the parcel delivery, mobile retail, and trades and construction industries; the production of commercial truck bodies, upfit services, and supply of related aftermarket parts and services under the Utilimaster brand name.
Our SV segment consists of our Charlotte, Michigan operations that engineer and manufacture motorhome chassis, other specialty chassis and distribute related aftermarket parts and assemblies. We also provide vocation-specific equipment upfit services, which are marketed and sold under the Strobes-R-Us brand, through our manufacturing operations in Pompano and West Palm Beach, Florida. Our service bodies operations include locations in Charlotte, Michigan; Carson, McClellan Park, and Montebello, California; Mesa, Arizona; Dallas and Weatherford, Texas; and Waterville, Maine.
The accounting policies of the segments are the same as those described, or referred to, in “Note 1 – Nature of Operations and Basis of Presentation.” Interest expense and Taxes on income are not included in the information utilized by the chief operating decision maker to assess segment performance and allocate resources, and accordingly, are excluded from the segment results presented below. Appropriate expense amounts are allocated to the two reportable segments and are included in their reported operating income or loss.
For certain financial information related to each segment, see “Note 17 – Business Segments” of the Notes to Consolidated Financial Statements appearing in Item 8 of this Form 10-K.
Fleet Vehicles and Services
| Segment Financial Data (Dollars in Thousands) |
Year Ended December 31, |
|||||||||||||||
| 2022 | 2021 |
|||||||||||||||
| Amount | Percentage | Amount |
Percentage |
|||||||||||||
| Sales |
$ | 647,003 | 100.0 | % | $ | 659,432 | 100.0 | % | ||||||||
| Adjusted EBITDA |
$ | 65,719 | 10.2 | % | $ | 108,621 | 16.5 | % | ||||||||
| Segment assets |
$ | 308,357 | $ | 174,799 | ||||||||||||
Sales in our FVS segment decreased by $12.4 million, or 1.9%, to $647.0 million in 2022 from $659.4 million in 2021. This decrease was primarily attributable to a sales volume decrease due to supply chain constraints, partially offset by pricing actions.
Adjusted EBITDA in our FVS segment was $65.7 million for the year ended December 31, 2022, a decrease of $42.9 million compared to $108.6 million for the year ended December 31, 2021. This decrease was primarily attributable to $32.6 million in material and labor inflation, $27.1 million in lower volume and inefficiencies due to supply chain constraints, and 9.1 million in manufacturing and other costs. These decreases were partially offset by pricing and mix of $25.9 million.
Order backlog for our FVS segment decreased by $122.8 million, or 14.3%, to $736.7 million at December 31, 2022 compared to $859.4 million at December 31, 2021. This decrease was primarily due to order fulfillment as chassis availability improved. Our backlog enables visibility into future sales which can normally range from two to twelve months depending on the product. This visibility allows us to more effectively plan and predict our sales and production activity.
Specialty Vehicles
| Segment Financial Data (Dollars in Thousands) |
Year Ended December 31, |
|||||||||||||||
| 2022 | 2021 |
|||||||||||||||
| Amount | Percentage | Amount |
Percentage |
|||||||||||||
| Sales |
$ | 386,644 | 100.0 | % | $ | 332,360 | 100.0 | % | ||||||||
| Adjusted EBITDA |
$ | 54,413 | 14.1 | % | $ | 32,668 | 9.8 | % | ||||||||
| Segment assets |
$ | 220,768 | $ | 202,302 | ||||||||||||
Sales in our SV segment increased by $54.2 million or 16.3%, to $386.6 million in 2022 compared to $332.4 million in 2021. This increase was due to strong sales volume growth and pricing actions.
Adjusted EBITDA for our SV segment was $54.4 million for the year ended December 31, 2022, an increase of $21.7 million compared to $32.7 million for the year ended December 31, 2021. This increase was primarily attributable to favorable pricing and mix of $43.1 million and volume and productivity of $6.0 million, offset by material and labor inflation of $23.5 million and increased operating and other expenses of $3.9 million.
Order backlog for our SV segment decreased by $8.1 million, or 7.8%, to $96.0 million at December 31, 2022 compared to $104.1 million at December 31, 2021. This decrease was due to consumer demand for RV travel returning back to pre-pandemic levels, partially offset by strong demand for service bodies. Our backlog enables visibility into future sales which can normally range from less than one month to twelve months depending on the product. This visibility allows us to more effectively plan and predict our sales and production activity.
Liquidity and Capital Resources
Cash Flows
Our cash flows from operating, investing and financing activities, as reflected in the Consolidated Statements of Cash Flows appearing in Item 8 of this Form 10-K, are summarized in the following table (in thousands):
| Year Ended December 31, |
||||||||
| 2022 | 2021 |
|||||||
| Cash provided by (used in): |
||||||||
| Operating activities |
$ | (18,843 | ) | $ | 74,009 | |||
| Investing activities |
(20,416 | ) | (22,076 | ) | ||||
| Financing activities |
13,649 | (35,770 | ) | |||||
| Net increase (decrease) in cash and cash equivalents |
$ | (25,610 | ) | $ | 16,163 | |||
During 2022, cash and cash equivalents decreased by $25.6 million to a balance of $11.5 million as of December 31, 2022. These funds, in addition to cash generated from future operations and available credit facilities, are expected to be sufficient to finance our foreseeable liquidity and capital needs, including potential future acquisitions.
Cash Flow from Operating Activities
We used $18.8 million of cash for operating activities during the year ended December 31, 2022, a decrease in cash provided of $92.8 million from $74.0 million of cash provided by operating activities during the year ended December 31, 2021. The $18.8 million of cash used in 2022 was driven by a $73.1 million net outflow related to the change in net working capital, partially offset by a $54.3 million net inflow related to income adjusted for non-cash charges to operations. The change in working capital in 2022 was driven by a $94.0 million outflow related to increased receivables and contract assets primarily attributable to increased work in process production resulting from industry wide supply chain constraints, a $33.0 million outflow related to increased inventories primarily attributable to increased raw material inventories resulting from industry wide supply chain interruptions, partially offset by a $41.3 million inflow related to increased payables primarily attributable to our continued focus on managing the supply base and a $12.6 million inflow related to a net increase in remaining other assets and liabilities, including accrued compensation and warranty.
Cash Flow from Investing Activities
We used $20.4 million in investing activities during the year ended December 31, 2022, a $1.7 million decrease compared to the $22.1 million used during the year ended December 31, 2021. The decrease in cash used in investing activities is primarily attributable to a $2.6 million of purchases of property, plant and equipment net of disposals, partially offset by $0.9 million of lower cost of business acquisition.
Cash Flow from Financing Activities
We generated $13.6 million of cash through financing activities during the year ended December 31, 2022, compared to $35.8 million used during the year ended December 31, 2021. The $49.4 million increase in cash provided by financing activities is primarily attributable to $78.3 million of increased proceeds from long-term debt net of repayments, partially offset by $23.4 million of increased purchase and retirement of common stock and $5.5 million of increased issuance and vesting of stock incentive awards.
Effect of Inflation
Inflation affects us in two principal ways. First, our revolving credit facility is generally tied to the prime and LIBOR interest rates so that increases in those interest rates would be translated into additional interest expense. Second, general inflation impacts prices paid for labor, parts and supplies. Whenever possible, we attempt to cover increased costs of production and capital by adjusting the sales prices of our products. However, we generally do not attempt to negotiate inflation-based price adjustment provisions into our contracts. We have limited ability to pass on cost increases to our customers on a short-term basis. In addition, the markets we serve are competitive in nature, and competition limits our ability to pass through cost increases in many cases. We strive to minimize the effect of inflation through cost reductions and improved productivity. Refer to the Commodities Risk section in Item 7A of this Form 10-K for further information regarding commodity cost fluctuations.
Contingent Liabilities
EPA Matter
As previously disclosed, in May 2020, the Company received an information request from the United States Environmental Protection Agency (“EPA”) requesting certain information regarding emissions labels on chassis, vocational vehicles, and vehicles that the Company manufactured or imported into the U.S. between January 1, 2017 to the date the Company received the request in May 2020. The Company responded to the EPA’s request and furnished the requested materials in the third quarter of 2020.
On April 6, 2022, the Company received a Notice of Violation from the EPA alleging a failure to secure certain certifications on manufactured chassis and a failure to comply with recordkeeping and reporting requirements related to supplier-provided chassis. The Company continues to investigate this matter, including potential defenses, and will continue discussions with the EPA regarding the allegations. At this time, it is not possible to estimate the potential fines or penalties that the Company may incur (if any) for this matter.
Debt
On November 30, 2021, we entered into an Amended and Restated Credit Agreement (the “Credit Agreement”) by and among us and certain of our subsidiaries as borrowers, Wells Fargo Bank, N.A. (“Wells Fargo”), as administrative agent, and the lenders party thereto consisting of Wells Fargo, JPMorgan Chase Bank, N.A., PNC Bank, National Association and Bank of America, N.A. (the “Lenders”). Certain of our other subsidiaries have executed guaranties guarantying the borrowers' obligations under the Credit Agreement.
Under the Credit Agreement, we may borrow up to $400.0 million from the Lenders under a secured revolving credit facility which matures November 30, 2026. We may also request an increase in the facility of up to $200.0 million in the aggregate, subject to customary conditions. The revolving credit facility is also available for the issuance of letters of credit of up to $20.0 million and swing line loans of up to $10.0 million, subject to certain limitations and restrictions. The revolving credit facility carries an interest rate of either (i) the highest of prime rate, the federal funds effective rate from time to time plus 0.5%, or the one month adjusted LIBOR plus 1.0%; or (ii) adjusted LIBOR, in each case plus a margin based upon our ratio of debt to earnings from time to time. The applicable borrowing rate including the margin was 5.12% (or one-month LIBOR plus 1.00%) at December 31, 2022. The revolving credit facility is secured by security interests in, and liens on, all assets of the borrowers and guarantors, other than real property and certain other excluded assets. At December 31, 2022 and December 31, 2021, we had outstanding letters of credit totaling $1.2 million and $0.8 million, respectively, related to our workers’ compensation insurance.
Under the terms of our Credit Agreement, available borrowings (exclusive of outstanding borrowings) totaled $187.2 million and $376.8 million at December 31, 2022 and December 31, 2021, respectively. The Credit Agreement requires us to maintain certain financial ratios and other financial covenants; prohibits us from incurring additional indebtedness; limits certain acquisitions, investments, advances or loans; limits our ability to pay dividends in certain circumstances; and restricts substantial asset sales, all subject to certain exceptions and baskets. At December 31, 2022 and December 31, 2021, we were in compliance with all covenants in our Credit Agreement.
Material Cash Requirements
We are party to contractual obligations involving commitments to make payments to third parties, and such commitments require a material amount of cash. As part of our normal course of business, we enter into contracts with suppliers for purchases of certain raw materials, components, and services to facilitate adequate supply of these materials and services. These arrangements may contain fixed or minimum quantity purchase requirements.
Our current cash position, available borrowing capacity on our credit facilities, and the cash flows we expect to generate from continuing operations are expected to be sufficient to finance our operating and capital needs, including day to day operations, capital expenditures, research and development, investments in information technology systems, dividends and potential future acquisitions, for at least the next twelve months and the foreseeable future thereafter.
Our future contractual obligations, as described above, are summarized below.
| Payments Due by Period (in thousands) | ||||||||||||||||||||
| Less than |
More than |
|||||||||||||||||||
| Total |
1 Year |
1-3 Years |
4-5 Years |
5 Years |
||||||||||||||||
| Debt (1) |
$ | 70,335 | 2,867 | 5,734 | 5,734 | 56,000 | ||||||||||||||
| Operating lease obligations |
61,511 | 10,952 | 18,949 | 11,483 | 20,127 | |||||||||||||||
| Purchase obligations |
7,800 | 7,800 | - | - | - | |||||||||||||||
| Total contractual obligations |
$ | 139,646 | $ | 21,619 | $ | 24,683 | $ | 17,217 | $ | 76,127 | ||||||||||
| (1) |
Debt includes revolving credit facility estimated interest payments and payments on finance leases. The interest payments on the related variable rate debt were calculated using the effective interest rate of 5.12% at December 31, 2022. |
Equity Securities
February 22, 2022, we announced that our Board of Directors had authorized the repurchase of up to $250.0 million of our common stock. The repurchase authorization does not have an expiration date. We believe that we have sufficient resources to fund any potential stock buyback in which we may engage.
Dividends
We paid dividends on our outstanding common shares in 2022 and 2021 as shown in the table below.
| Date dividend declared |
Record date |
Payment date |
Dividend per share ($) |
|||||
| Nov. 1, 2022 | Nov. 16, 2022 | Dec. 15, 2022 | 0.050 | |||||
| Aug. 5, 2022 | Aug. 17, 2022 | Sep. 16, 2022 | 0.050 | |||||
| May 2, 2022 | May 17, 2022 | Jun. 17, 2022 | 0.050 | |||||
| Feb. 16, 2022 | Feb. 17, 2022 | Mar. 17, 2022 | 0.050 | |||||
| Nov. 5, 2021 | Nov. 6, 2021 | Dec. 16, 2021 | 0.025 | |||||
| Aug. 6, 2021 | Aug. 18, 2021 | Sep. 15, 2021 | 0.025 | |||||
| May 7, 2021 | May 18, 2021 | Jun. 18, 2021 | 0.025 | |||||
| Feb. 15, 2021 | Feb. 25, 2021 | Mar. 25, 2021 | 0.025 | |||||
On February 3, 2022, our Board of Directors authorized an increase in the Company’s quarterly dividend from $0.025 to $0.05 per share payable on or before March 17, 2022, to shareholders of record at the close of business on February 17, 2022.
Critical Accounting Policies and Estimates
The following discussion of critical accounting policies and estimates is intended to supplement “Note 1 – Nature of Operations and Basis of Presentation” of the Notes to Consolidated Financial Statements appearing in Item 8 of this Form 10-K. These policies were selected because they are broadly applicable within our operating units and they involve additional management judgment due to the sensitivity of the methods, assumptions and estimates necessary in determining the related statement of income, asset and/or liability amounts.
Revenue Recognition
Essentially all of our revenue is generated through contracts with our customers. We may recognize revenue over time or at a point in time when or as obligations under the terms of a contract with our customer are satisfied, depending on the terms and features of the contract and the products supplied. Our contracts generally do not have any significant variable consideration. The collectability of consideration on the contract is reasonably assured before revenue is recognized. On certain vehicles, payment may be received in advance of us satisfying our performance obligations. Such payments are recorded in Deposits from customers on the Consolidated Balance Sheets. The corresponding performance obligations are generally satisfied within one year of the contract inception. We have elected to utilize the practical expedient to recognize the incremental costs of obtaining a contract as an expense when incurred because the amortization period for the prepaid costs that would have otherwise been deferred and amortized is one year or less. We use an observable price to allocate the stand-alone selling price to separate performance obligations within a contract or a cost-plus margin approach when an observable price is not available. The estimated costs to fulfill our base warranties are recognized as expense when the products are sold.
Revenue for parts sales for both segments is recognized at the time that control and risk of ownership has passed to the customer, which is generally, when the ordered part is shipped to the customer. Historical return rates on parts sales have been immaterial.
Revenue for upfit and field service contracts and walk-in vans and truck bodies built on a chassis owned and controlled by the customer is recognized over time, as equipment is installed in the customer’s vehicle, repairs and enhancements are made to the customer’s vehicles, or as the vehicles are built.
For certain of our vehicles and chassis, we sell separately priced service contracts that provide roadside assistance or extend certain warranty coverage beyond our base warranty agreements. These separately priced contracts range from one to six years from the date of the shipment of the related vehicle or chassis. We receive payment with the shipment of the related vehicle or at the inception of the extended service contract, if later, and recognize revenue over the coverage term of the agreement, generally on a straight-line basis, which approximates the pattern of costs expected to be incurred in satisfying the obligations under the contract.
Business Combinations
When acquiring other businesses, we recognize identifiable assets acquired and liabilities assumed at their acquisition date estimated fair values, and separately from any goodwill that may be required to be recognized. Goodwill, when recognizable, is measured as the excess amount of any consideration transferred, which is measured at fair value, over the acquisition date fair values of the identifiable assets acquired and liabilities assumed. Amounts recorded in a business combination may change during the measurement period, which is a period not to exceed one year from the date of acquisition, as additional information about conditions existing at the acquisition date becomes available.
Accounting for such acquisitions requires us to make significant assumptions and estimates and are adjusted during the measurement period for a period of up to one year after the acquisition date. Costs incurred to effect an acquisition, such as legal, accounting, valuation or other third-party costs, as well as internal general and administrative costs incurred are charged to expense in the periods incurred.
Goodwill and Other Indefinite-Lived Intangible Assets
In accordance with authoritative guidance on goodwill and other indefinite-lived intangible assets, such assets are tested for impairment at least annually, and written down when and to the extent impaired. We perform our annual impairment test for goodwill and indefinite-lived intangible assets as of October 1 of each year, or more frequently if an event occurs or conditions change that would more likely than not reduce the fair value of the asset below its carrying value.
As of October 1, 2022, the most recent annual goodwill impairment assessment date, two reporting units were determined for goodwill impairment testing: Fleet Vehicles and Services and Specialty Vehicles. We qualitatively assessed goodwill assigned to the Fleet Vehicles and Services and Specialty Vehicles reporting units and found no indicators of impairment.
We first assess qualitative factors including, but not limited to, macroeconomic conditions, industry conditions, the competitive environment, changes in the market for our products and current and forecasted financial performance to determine whether it is more likely than not that the fair value of a reporting unit is less than its carrying amount. If we determine that it is more likely than not that the fair value of the reporting unit is greater than its carrying amount, we are not required to calculate the fair value of a reporting unit. We have the option to bypass this qualitative assessment and proceed to a quantitative goodwill impairment assessment. If we elect to bypass the qualitative assessment, or if after completing the assessment it is determined to be more likely than not that the fair value of a reporting unit is less than its carrying value, we perform an impairment test by comparing the fair value of a reporting unit with its carrying amount, including goodwill. The fair value of the reporting unit is determined by estimating the future cash flows of the reporting unit to which the goodwill relates, and then discounting the future cash flows at a market-participant-derived weighted-average cost of capital (“WACC”). In determining the estimated future cash flows, we consider current and projected future levels of income based on our plans for that business; business trends, prospects and market and economic conditions; and market-participant considerations. If the fair value of a reporting unit exceeds its carrying amount, goodwill of the reporting unit is considered to not be impaired. If the carrying amount of the reporting unit exceeds its fair value, an impairment loss is recognized in an amount equal to the excess, up to the value of the goodwill.
We evaluate the recoverability of our indefinite lived intangible assets by comparing the estimated fair value of the trade names with their carrying values. We estimate the fair value of our trade names based on estimates of future royalty payments that are avoided through our ownership of the trade name, discounted to their present value. In determining the estimated fair value of the trade names, we consider current and projected future levels of revenue based on our plans for branded products, business trends, prospects and market and economic conditions.
Significant judgments inherent in these analyses include assumptions about appropriate sales growth rates, WACC and the amount of expected future net cash flows. The judgments and assumptions used in the estimate of fair value are generally consistent with the projections and assumptions that are used in current operating plans. Such assumptions are subject to change as a result of changing economic and competitive conditions. The determination of fair value is highly sensitive to differences between estimated and actual cash flows and changes in the related discount rate used to evaluate the fair value of the reporting units and trade name.
See “Note 6 – Goodwill and Intangible Assets” in the Notes to Consolidated Financial Statements appearing in Item 8 of this Form 10-K for further details on our goodwill and indefinite-lived intangible assets.
Warranties
Our policy is to record a provision for the estimated cost of warranty-related claims at the time of the sale, and periodically adjust the warranty liability to reflect actual experience. The amount of warranty liability accrued reflects actual historical warranty cost, which is accumulated on specific identifiable units. From that point, there is a projection of the expected future cost of honoring our obligations under the warranty agreements. Historically, the cost of fulfilling our warranty obligations has principally involved replacement parts and labor for field retrofit campaigns and recalls, which increase the reserve. Our estimates are based on historical experience, the number of units involved, and the extent of features and components included in product models. See “Note 11 – Commitments and Contingent Liabilities” in the Notes to Consolidated Financial Statements appearing in Item 8 of this Form 10-K for further information regarding warranties.
Provision for Income Taxes
We account for income taxes under a method that requires deferred income tax assets and liabilities to be recognized using enacted tax rates for the effect of temporary differences between the book and tax bases of recorded assets and liabilities. Authoritative guidance also requires deferred income tax assets, which include state tax credit carryforwards, operating loss carryforwards and deductible temporary differences, be reduced by a valuation allowance if it is more likely than not that some portion or all of the deferred income tax assets will not be realized.
We evaluate the likelihood of realizing our deferred income tax assets by assessing our valuation allowance and by adjusting the amount of such allowance, if necessary. The factors used to assess the likelihood of realization include our forecast of future taxable income, the projected reversal of temporary differences and available tax planning strategies that could be implemented to realize the net deferred income tax assets.
We recognize the tax benefit from an uncertain tax position only if it is more likely than not that the tax position will be sustained on examination by the taxing authorities. The determination is based on the technical merits of the position and presumes that each uncertain tax position will be examined by the relevant taxing authority that has full knowledge of all relevant information. Although management believes the estimates are reasonable, no assurance can be given that the final outcome of these matters will not be different than what is reflected in the historical income tax provisions and accruals.
Interest and penalties attributable to income taxes are recorded as a component of income taxes.
New and Pending Accounting Policies
See “Note 1 – Nature of Operations and Basis of Presentation” in the Notes to Consolidated Financial Statements appearing in Item 8 of this Form 10-K.
| Item 7A. |
Quantitative and Qualitative Disclosures About Market Risk. |
Interest Rate Risk
We are exposed to market risks related to changes in interest rates and the effect of such a change on outstanding variable rate short-term and long-term debt. At December 31, 2022, we had $56.0 million debt outstanding under our revolving credit facility. An increase of 100 basis points in interest rates would result in $0.6 million additional interest expense on an annualized basis. We believe that we have sufficient financial resources to accommodate this hypothetical increase in interest rates. We do not enter into market-risk-sensitive instruments for trading or other purposes.
The interest rate charged on our outstanding borrowings pursuant to our credit facility is currently based on LIBOR, as described in “Note 13 – Debt” below. On July 27, 2017, the Financial Conduct Authority in the U.K. announced that it would phase out LIBOR by the end of 2021. On November 30, 2020, the ICE Benchmark Administration Limited (ICE) announced plans to delay the phase out of LIBOR to June 30, 2023. The U.S. Federal Reserve is considering replacing U.S. dollar LIBOR with a newly created index called the Secured Overnight Funding Rate (SOFR), a broad measure of the cost of borrowing cash overnight collateralized by U.S. Treasury securities. Our revolving credit facility provides for the transition to a replacement for LIBOR, and it also provides for an alternative to LIBOR. When LIBOR ceases to exist, our interest expense is not expected to increase materially. It is also possible that the overall financing market may be disrupted as a result of the phase-out or replacement of LIBOR with SOFR or any other reference rate. Increased interest expense and/or disruption in the financial market could have a material adverse effect on our business, financial condition, or results of operations.
Commodities Risk
We are also exposed to changes in the prices of raw materials, primarily steel and aluminum, along with components that are made from these raw materials. We generally do not enter into derivative instruments for the purpose of managing exposures associated with fluctuations in steel and aluminum prices. We do, from time to time, engage in pre-buys of components that are impacted by changes in steel, aluminum and other commodity prices in order to mitigate our exposure to such price increases and align our costs with prices quoted in specific customer orders. We also actively manage our material supply sourcing and may employ various methods to limit risk associated with commodity cost fluctuations due to normal market conditions and other factors including tariffs. See Management’s Discussion and Analysis of Financial Condition and Results of Operations included in Part 1, Item 7 of this Form 10-K for information on the impacts of changes in input costs during the year ended December 31, 2022.
We do not believe that there has been a material change in the nature or categories of the primary market risk exposures or in the particular markets that present our primary risk of loss. As of the date of this report, we do not know of or expect any material changes in the general nature of our primary market risk exposure in the near term. In this discussion, “near term” means a period of one year following the date of the most recent balance sheet contained in this report.
Prevailing interest rates, interest rate relationships and commodity costs are primarily determined by market factors that are beyond our control. All information provided in response to this item consists of forward-looking statements. Reference is made to the section captioned “Forward-Looking Statements” before Part I of this Form 10-K for a discussion of the limitations on our responsibility for such statements.
| Item 8. |
Financial Statements and Supplementary Data. |
REPORT OF INDEPENDENT REGISTERED PUBLIC ACCOUNTING FIRM
To the shareholders and the Board of Directors of The Shyft Group, Inc.
Opinions on the Financial Statements and Internal Control over Financial Reporting
We have audited the accompanying consolidated balance sheets of The Shyft Group, Inc. and subsidiaries (the “Company”) as of December 31, 2022 and 2021, the related consolidated statements of operations, shareholders' equity, and cash flows, for each of the two years in the period ended December 31, 2022, and the related notes and the schedule listed in the Index at Item 15 (collectively referred to as the “financial statements”). We also have audited the Company’s internal control over financial reporting as of December 31, 2022, based on criteria established in Internal Control — Integrated Framework (2013) issued by the Committee of Sponsoring Organizations of the Treadway Commission (COSO).
In our opinion, the financial statements referred to above present fairly, in all material respects, the financial position of the Company as of December 31, 2022 and 2021, and the results of its operations and its cash flows for each of the two years in the period ended December 31, 2022, in conformity with accounting principles generally accepted in the United States of America. Also, in our opinion, the Company maintained, in all material respects, effective internal control over financial reporting as of December 31, 2022, based on criteria established in Internal Control — Integrated Framework (2013) issued by COSO.
Basis for Opinions
The Company’s management is responsible for these financial statements, for maintaining effective internal control over financial reporting, and for its assessment of the effectiveness of internal control over financial reporting, included in the accompanying Management’s Report on Internal Control over Financial Reporting. Our responsibility is to express an opinion on these financial statements and an opinion on the Company’s internal control over financial reporting based on our audits. We are a public accounting firm registered with the Public Company Accounting Oversight Board (United States) (PCAOB) and are required to be independent with respect to the Company in accordance with the U.S. federal securities laws and the applicable rules and regulations of the Securities and Exchange Commission and the PCAOB.
We conducted our audits in accordance with the standards of the PCAOB. Those standards require that we plan and perform the audits to obtain reasonable assurance about whether the financial statements are free of material misstatement, whether due to error or fraud, and whether effective internal control over financial reporting was maintained in all material respects.
Our audits of the financial statements included performing procedures to assess the risks of material misstatement of the financial statements, whether due to error or fraud, and performing procedures to respond to those risks. Such procedures included examining, on a test basis, evidence regarding the amounts and disclosures in the financial statements. Our audits also included evaluating the accounting principles used and significant estimates made by management, as well as evaluating the overall presentation of the financial statements. Our audit of internal control over financial reporting included obtaining an understanding of internal control over financial reporting, assessing the risk that a material weakness exists, and testing and evaluating the design and operating effectiveness of internal control based on the assessed risk. Our audits also included performing such other procedures as we considered necessary in the circumstances. We believe that our audits provide a reasonable basis for our opinions.
Definition and Limitations of Internal Control over Financial Reporting
A company’s internal control over financial reporting is a process designed to provide reasonable assurance regarding the reliability of financial reporting and the preparation of financial statements for external purposes in accordance with generally accepted accounting principles. A company’s internal control over financial reporting includes those policies and procedures that (1) pertain to the maintenance of records that, in reasonable detail, accurately and fairly reflect the transactions and dispositions of the assets of the company; (2) provide reasonable assurance that transactions are recorded as necessary to permit preparation of financial statements in accordance with generally accepted accounting principles, and that receipts and expenditures of the company are being made only in accordance with authorizations of management and directors of the company; and (3) provide reasonable assurance regarding prevention or timely detection of unauthorized acquisition, use, or disposition of the company’s assets that could have a material effect on the financial statements.
Because of its inherent limitations, internal control over financial reporting may not prevent or detect misstatements. Also, projections of any evaluation of effectiveness to future periods are subject to the risk that controls may become inadequate because of changes in conditions, or that the degree of compliance with the policies or procedures may deteriorate.
Critical Audit Matter
The critical audit matter communicated below is a matter arising from the current-period audit of the financial statements that was communicated or required to be communicated to the audit committee and that (1) relates to accounts or disclosures that are material to the financial statements and (2) involved our especially challenging, subjective, or complex judgments. The communication of critical audit matters does not alter in any way our opinion on the financial statements, taken as a whole, and we are not, by communicating the critical audit matter below, providing a separate opinion on the critical audit matter or on the accounts or disclosures to which it relates.
Goodwill – Specialty Vehicles Reporting Unit - Refer to Notes 1 and 6 to the consolidated financial statements
Critical Audit Matter Description
The Company performs its annual impairment test for goodwill as of October 1 of each year, or more frequently if an event occurs or conditions change that would more likely than not reduce the fair value of the asset below its carrying value. The Company assesses qualitative factors to determine whether it is more likely than not that the fair value of a reporting unit is less than its carrying amount. The qualitative assessment involves significant use of management’s judgment and assumptions including, but not limited to, macroeconomic conditions, industry conditions, the competitive environment, changes in the market for the Company’s products and current and forecasted financial performance. Changes in these assumptions could have a significant impact on either the fair value, the amount of any goodwill impairment charge, or both.
The Company’s goodwill balance was $48.9 million as of December 31, 2022, of which $33.6 million was allocated to the Specialty Vehicles reporting unit (“SV”). The Company concluded there were no indications that the fair value of any reporting unit was less than the carrying amount, therefore a quantitative assessment was not performed, and no impairment was recognized.
We identified goodwill for SV as a critical audit matter because of the significant judgment and assumptions used in the qualitative assessment, and the difference between the most recent fair value estimate and the carrying amount of SV. Auditing management’s judgments related to the impact of macroeconomic conditions, industry and market considerations, overall financial performance, entity and reporting unit specific events, capital markets pricing, recent fair value estimates, and carrying amounts required a high degree of auditor judgment and an increased extent of effort, including the need to involve our fair value specialists.
How the Critical Audit Matter Was Addressed in the Audit
Our audit procedures related to management’s qualitative assessment of goodwill for the SV reporting unit included the following, among others:
| ● | We tested the effectiveness of controls over goodwill, including those over management's judgments and assumptions related to macroeconomic conditions, industry and market considerations, overall financial performance, entity and reporting unit specific events, capital markets pricing, recent fair value estimates and carrying amounts. |
| ● | With the assistance of fair value specialists, we compared the qualitative factors used by management to current industry and economic trends, historical Company results, changes to the Company's business model, customer base or product mix and other relevant factors including contrary evidence. |
| ● | We considered the completeness of management's identification of qualitative factors affecting SV by considering other information obtained in our review of board minutes, inquiries with management and substantive testing around operating revenues. |
/s/
February 23, 2023
We have served as the Company's auditor since 2021.
Report of Independent Registered Public Accounting Firm
Shareholders and Board of Directors
The Shyft Group, Inc.
Novi, Michigan
Opinion on the Consolidated Financial Statements
We have audited the consolidated statements of operations, shareholders' equity, and cash flows for the year ended December 31, 2020 for The Shyft Group Inc. (the “Company”), and the related notes and financial statement schedule (collectively referred to as the “consolidated financial statements”). In our opinion, the consolidated financial statements present fairly, in all material respects, the results of its operations and its cash flows for the year ended December 31, 2020, in conformity with accounting principles generally accepted in the United States of America.
Basis for Opinion
These consolidated financial statements are the responsibility of the Company’s management. Our responsibility is to express an opinion on the Company’s consolidated financial statements based on our audits. We are a public accounting firm registered with the Public Company Accounting Oversight Board (United States) (“PCAOB”) and are required to be independent with respect to the Company in accordance with the U.S. federal securities laws and the applicable rules and regulations of the Securities and Exchange Commission and the PCAOB.
We conducted our audit in accordance with the standards of the PCAOB. Those standards require that we plan and perform the audit to obtain reasonable assurance about whether the consolidated financial statements are free of material misstatement, whether due to error or fraud.
Our audit included performing procedures to assess the risks of material misstatement of the consolidated financial statements, whether due to error or fraud, and performing procedures that respond to those risks. Such procedures included examining, on a test basis, evidence regarding the amounts and disclosures in the consolidated financial statements. Our audits also included evaluating the accounting principles used and significant estimates made by management, as well as evaluating the overall presentation of the consolidated financial statements. We believe that our audit provide a reasonable basis for our opinion.
/s/
We served as the Company’s auditor from 2007 to 2020.
March 25, 2021, except for Notes 4 and 17, as to which the date is February 24, 2022
THE SHYFT GROUP, INC. AND SUBSIDIARIES
CONSOLIDATED BALANCE SHEETS
(In thousands)
| December 31, | December 31, | |||||||
| 2022 | 2021 | |||||||
| ASSETS | ||||||||
| Current assets: | ||||||||
| Cash and cash equivalents | $ | $ | ||||||
| Accounts receivable, less allowance of $ and $ | ||||||||
| Contract assets | ||||||||
| Inventories | ||||||||
| Other receivables – chassis pool agreements | ||||||||
| Other current assets | ||||||||
| Total current assets | ||||||||
| Property, plant and equipment, net | ||||||||
| Right of use assets – operating leases | ||||||||
| Goodwill | ||||||||
| Intangible assets, net | ||||||||
| Net deferred tax assets | ||||||||
| Other assets | ||||||||
| TOTAL ASSETS | $ | $ | ||||||
| LIABILITIES AND SHAREHOLDERS' EQUITY | ||||||||
| Current liabilities: | ||||||||
| Accounts payable | $ | $ | ||||||
| Accrued warranty | ||||||||
| Accrued compensation and related taxes | ||||||||
| Contract liabilities | ||||||||
| Operating lease liability | ||||||||
| Other current liabilities and accrued expenses | ||||||||
| Short-term debt – chassis pool agreements | ||||||||
| Current portion of long-term debt | ||||||||
| Total current liabilities | ||||||||
| Other non-current liabilities | ||||||||
| Long-term operating lease liability | ||||||||
| Long-term debt, less current portion | ||||||||
| Total liabilities | | |||||||
| Commitments and contingent liabilities | ||||||||
| Shareholders' equity: | ||||||||
| Preferred stock, par value: shares authorized ( issued) | ||||||||
| Common stock, par value: shares authorized; and outstanding | ||||||||
| Retained earnings | ||||||||
| Total Shyft Group, Inc. shareholders’ equity | ||||||||
| Non-controlling interest | ||||||||
| Total shareholders' equity | ||||||||
| TOTAL LIABILITIES AND SHAREHOLDERS' EQUITY | $ | $ | ||||||
See accompanying Notes to Consolidated Financial Statements.
THE SHYFT GROUP, INC. AND SUBSIDIARIES
CONSOLIDATED STATEMENTS OF OPERATIONS
(In thousands, except per share data)
| Year Ended December 31, |
||||||||||||
| 2022 | 2021 |
2020 |
||||||||||
| Sales |
$ | $ | $ | |||||||||
| Cost of products sold |
||||||||||||
| Gross profit |
||||||||||||
| Operating expenses: |
||||||||||||
| Research and development |
||||||||||||
| Selling, general and administrative |
||||||||||||
| Total operating expenses |
||||||||||||
| Operating income |
||||||||||||
| Other income (expense): |
||||||||||||
| Interest expense |
( |
) | ( |
) | ( |
) |
||||||
| Other income (expense) |
( |
) | ||||||||||
| Total other income (expense) |
( |
) | ( |
) |
||||||||
| Income from continuing operations before income taxes |
||||||||||||
| Income tax expense |
||||||||||||
| Income from continuing operations |
||||||||||||
| Income (loss) from discontinued operations, net of income taxes |
( |
) |
||||||||||
| Net income |
||||||||||||
| Less: net income attributable to non-controlling interest |
||||||||||||
| Net income attributable to Shyft Group, Inc. |
$ | $ | $ | |||||||||
| Basic earnings per share |
||||||||||||
| Continuing operations |
$ | $ | $ | |||||||||
| Discontinued operations |
( |
) |
||||||||||
| Basic earnings per share |
$ | $ | $ | |||||||||
| Diluted earnings per share |
||||||||||||
| Continuing operations |
$ | $ | $ | |||||||||
| Discontinued operations |
( |
) |
||||||||||
| Diluted earnings per share |
$ | $ | $ | |||||||||
| Basic weighted average common shares outstanding |
||||||||||||
| Diluted weighted average common shares outstanding |
||||||||||||
See accompanying Notes to Consolidated Financial Statements
THE SHYFT GROUP, INC. AND SUBSIDIARIES
CONSOLIDATED STATEMENTS OF SHAREHOLDERS’ EQUITY
(In thousands, except per share data)
| Number of Shares | Common Stock | Additional Paid In Capital | Retained Earnings | Non- Controlling Interest | Total Shareholders' Equity | |||||||||||||||||||
| Balance at January 1, 2020 | $ | $ | $ | $ | ( | ) | $ | |||||||||||||||||
| Issuance of common stock and tax impact of stock incentive plan | ( | ) | - | - | ( | ) | ||||||||||||||||||
| Dividends declared ($ per share) | - | - | ( | ) | - | ( | ) | |||||||||||||||||
| Purchase and retirement of common stock | ( | ) | ( | ) | ( | ) | ( | ) | - | ( | ) | |||||||||||||
| Issuance of restricted stock, net of cancellation | ( | ) | ||||||||||||||||||||||
| Stock-based compensation expense | - | |||||||||||||||||||||||
| Reclassification upon removal of par value on common stock | - | ( | ) | |||||||||||||||||||||
| Net income | - | - | ||||||||||||||||||||||
| Balance at December 31, 2020 | $ | $ | $ | $ | ( | ) | $ | |||||||||||||||||
| Issuance of common stock and tax impact of stock incentive plan | ( | ) | - | - | ( | ) | ||||||||||||||||||
| Dividends declared ($ per share) | - | - | ( | ) | - | ( | ) | |||||||||||||||||
| Purchase and retirement of common stock | ( | ) | ( | ) | ( | ) | ( | ) | ||||||||||||||||
| Purchase of non-controlling interest | - | ( | ) | ( | ) | ( | ) | |||||||||||||||||
| Issuance of restricted stock, net of cancellation | ||||||||||||||||||||||||
| Stock-based compensation expense | - | |||||||||||||||||||||||
| Net income | - | - | ||||||||||||||||||||||
| Balance at December 31, 2021 | $ | $ | $ | $ | $ | |||||||||||||||||||
| Issuance of common stock and tax impact of stock incentive plan | ( | ) | - | - | ( | ) | ||||||||||||||||||
| Dividends declared ($ per share) | - | - | ( | ) | - | ( | ) | |||||||||||||||||
| Purchase and retirement of common stock | ( | ) | ( | ) | ( | ) | ( | ) | ||||||||||||||||
| Issuance of restricted stock, net of cancellation | - | - | - | - | ||||||||||||||||||||
| Stock-based compensation expense | - | |||||||||||||||||||||||
| Net income | - | - | ||||||||||||||||||||||
| Balance at December 31, 2022 | $ | $ | $ | $ | $ | |||||||||||||||||||
See accompanying Notes to Consolidated Financial Statements.
THE SHYFT GROUP, INC. AND SUBSIDIARIES
CONSOLIDATED STATEMENTS OF CASH FLOWS
(In thousands)
| Year Ended December 31, |
||||||||||||
| 2022 | 2021 |
2020 |
||||||||||
| Cash flows from operating activities: |
||||||||||||
| Net income |
$ | $ | $ | |||||||||
| Adjustments to reconcile net income to net cash provided by operating activities |
||||||||||||
| Depreciation and amortization |
||||||||||||
| Deferred income taxes |
( |
) | ||||||||||
| Non-cash stock based compensation expense |
||||||||||||
| Loss on sale of business |
||||||||||||
| Loss (gain) on disposal of assets |
( |
) | ||||||||||
| Loss from write-off of construction in process |
||||||||||||
| Changes in fair value of contingent consideration |
( |
) |
||||||||||
| Changes in accounts receivable and contract assets |
( |
) | ( |
) | ( |
) |
||||||
| Changes in inventories |
( |
) | ( |
) | ||||||||
| Changes in accounts payable |
( |
) |
||||||||||
| Changes in accrued compensation and related taxes |
( |
) | ||||||||||
| Changes in accrued warranty |
( |
) |
||||||||||
| Changes in other assets and liabilities |
|
( |
) |
|||||||||
| Net cash provided by (used in) operating activities |
( |
) | ||||||||||
| Cash flows from investing activities: |
||||||||||||
| Purchases of property, plant and equipment |
( |
) | ( |
) | ( |
) |
||||||
| Proceeds from sale of property, plant and equipment |
||||||||||||
| Acquisition of businesses, net of cash acquired |
( |
) |
||||||||||
| Proceeds from sale of business |
||||||||||||
| Net cash provided by (used in) investing activities |
( |
) | ( |
) | ||||||||
| Cash flows from financing activities: |
||||||||||||
| Proceeds from long-term debt |
||||||||||||
| Payments on long-term debt |
( |
) | ( |
) | ( |
) |
||||||
| Payments of debt issuance costs | ( |
) | ||||||||||
| Payments of dividends |
( |
) | ( |
) | ( |
) |
||||||
| Purchase and retirement of common stock |
( |
) | ( |
) | ( |
) |
||||||
| Exercise and vesting of stock incentive awards |
( |
) | ( |
) | ( |
) |
||||||
| Purchase of non-controlling interest | ( |
) | ||||||||||
| Net cash provided by (used in) financing activities |
( |
) | ( |
) |
||||||||
| Net increase (decrease) in cash and cash equivalents |
( |
) | ||||||||||
| Cash and cash equivalents at beginning of year |
||||||||||||
| Cash and cash equivalents at end of year |
$ | $ | $ | |||||||||
Note: Consolidated Statements of Cash Flows include continuing operations and discontinued operations for all years presented.
See accompanying Notes to Consolidated Financial Statements.
THE SHYFT GROUP, INC. AND SUBSIDIARIES
NOTES TO CONSOLIDATED FINANCIAL STATEMENTS
(Dollar amounts in thousands, except per share data)
NOTE 1 – NATURE OF OPERATIONS AND BASIS OF PRESENTATION
As used herein, the term “Company”, “we”, “us” or “our” refers to The Shyft Group, Inc. and its subsidiaries unless designated or identified otherwise.
Nature of Operations
The consolidated financial statements include our accounts and the accounts of our wholly owned subsidiary, The Shyft Group USA, Inc. and its subsidiaries. All inter-company transactions have been eliminated.
Non-Controlling Interest. At December 31, 2022, The Shyft Group USA, Inc. held a
Use of Estimates. In the preparation of our financial statements in accordance with U.S. generally accepted accounting principles (“GAAP”), management uses estimates and makes judgments and assumptions that affect asset and liability values and the amounts reported as income and expense during the periods presented. Certain of these estimates, judgments and assumptions, such as the allowance for credit losses, warranty expenses, impairment assessments of tangible and intangible assets, and the provision for income taxes, are particularly sensitive. If actual results are different from estimates used by management, they may have a material impact on the financial statements.
Revenue Recognition. Essentially all of our revenue is generated through contracts with our customers. We may recognize revenue over time or at a point in time when or as obligations under the terms of a contract with our customer are satisfied, depending on the terms and features of the contract and the products supplied. Our contracts generally do not have any significant variable consideration. The collectability of consideration on the contract is reasonably assured before revenue is recognized. On certain vehicles, payment may be received in advance of us satisfying our performance obligations. Such payments are recorded in Deposits from customers on the Consolidated Balance Sheets. The corresponding performance obligations are generally satisfied within one year of the contract inception. In such cases, we have elected to apply the practical expedient to not adjust the promised amount of consideration for the effects of a significant financing component. The financing impact on contracts that contain performance obligations that are not expected to be satisfied within one year are expected to be immaterial to our consolidated financial statements.
We have elected to utilize the practical expedient to recognize the incremental costs of obtaining a contract as an expense when incurred because the amortization period for the prepaid costs that would have otherwise been deferred and amortized is one year or less. We use an observable price to allocate the stand-alone selling price to separate performance obligations within a contract or a cost-plus margin approach when an observable price is not available. The estimated costs to fulfill our base warranties are recognized as expense when the products are sold (see “Note 11 – Commitments and Contingent Liabilities” for further information on warranties). Our contracts with customers do not contain a provision for product returns, except for contracts related to certain parts sales.
Revenue for parts sales for all segments is recognized at the time that control and risk of ownership has passed to the customer, which is generally when the ordered part is shipped to the customer. Historical return rates on parts sales have been immaterial.
THE SHYFT GROUP, INC. AND SUBSIDIARIES
NOTES TO CONSOLIDATED FINANCIAL STATEMENTS
(Dollar amounts in thousands, except per share data)
For certain of our vehicles and chassis, we sell separately priced service contracts that provide roadside assistance or extend certain warranty coverage beyond our base warranty agreements. These separately priced contracts range from one to six years from the date of the shipment of the related vehicle or chassis. We receive payment with the shipment of the related vehicle or at the inception of the extended service contract, if later, and recognize revenue over the coverage term of the agreement, generally on a straight-line basis, which approximates the pattern of costs expected to be incurred in satisfying the obligations under the contract.
Distinct revenue recognition policies for our segments are as follows:
Fleet Vehicles and Services (“FVS”)
Our walk-in vans and truck bodies are generally built on a chassis that is owned and controlled by the customer. Due to the customer ownership of the chassis, the performance obligation for these walk-in vans and truck bodies is satisfied as the vehicles are built. Accordingly, the revenue and corresponding cost of products sold associated with these contracts are recognized over time based on the inputs completed for a given performance obligation during the reporting period. Certain contracts will specify that a walk-in van or truck body is to be built on a chassis that we purchase and subsequently sell to the customer. The revenue on these contracts is recognized at the time that the performance obligation is satisfied, and control and risk of ownership has passed to the customer, which is generally upon shipment of the vehicle from our manufacturing facility to the customer or receipt of the vehicle by the customer, depending on contract terms. We have elected to treat shipping and handling costs subsequent to transfer of control as fulfillment activities and, accordingly, recognize these costs as the revenue is recognized.
Revenue for upfit and field service contracts is recognized over time, as equipment is installed in the customer’s vehicle or as repairs and enhancements are made to the customer’s vehicles. Revenue and the corresponding cost of products sold is estimated based on the inputs completed for a given performance obligation. Our receivables are generally collected in less than three months, in accordance with our underlying payment terms.
Specialty Vehicles (“SV”)
We recognize revenue and the corresponding cost of products sold on the sale of motorhome chassis when the performance obligation is completed and control and risk of ownership of the chassis has passed to our customer, which is generally upon shipment of the chassis or vehicle to the customer.
Revenue and the corresponding cost of products sold associated with other specialty vehicles is recognized over time based on the inputs completed for a given performance obligation during the reporting period. Other specialty vehicles are generally built on a chassis that is owned and controlled by the customer. Due to the customer ownership of the chassis, the performance obligations for other specialty chassis contracts are satisfied as the products are assembled. Our receivables will generally be collected in less than three months, in accordance with our underlying payment terms.
Some of our service bodies are built on a chassis that is owned and controlled by the customer. Due to the customer ownership of the chassis, the performance obligation for these service bodies is satisfied as the vehicles are built. Accordingly, the revenue and corresponding cost of products sold associated with these contracts are recognized over time based on the inputs completed for a given performance obligation during the reporting period. Certain contracts will specify that a service body is to be built on a chassis that we purchase and subsequently sell to the customer. The revenue on these contracts is recognized at the time that the performance obligation is satisfied, and control and risk of ownership has passed to the customer, which is generally upon shipment of the vehicle from our manufacturing facility to the customer or receipt of the vehicle by the customer, depending on contract terms. We have elected to treat shipping and handling costs subsequent to transfer of control as fulfillment activities and, accordingly, recognize these costs as the revenue is recognized.
Revenue for upfit and field service contracts is recognized over time, as equipment is installed in the customer’s vehicle or as repairs and enhancements are made to the customer’s vehicles. Revenue and the corresponding cost of products sold is estimated based on the inputs completed for a given performance obligation. Our receivables are generally collected in less than three months, in accordance with our underlying payment terms.
THE SHYFT GROUP, INC. AND SUBSIDIARIES
NOTES TO CONSOLIDATED FINANCIAL STATEMENTS
(Dollar amounts in thousands, except per share data)
Business Combinations. When acquiring other businesses, we recognize identifiable assets acquired and liabilities assumed at their acquisition date estimated fair values, and separately from any goodwill that may be required to be recognized. Goodwill, when recognizable, is measured as the excess amount of any consideration transferred, which is measured at fair value, over the acquisition date fair values of the identifiable assets acquired and liabilities assumed. Amounts recorded in a business combination may change during the measurement period, which is a period not to exceed one year from the date of acquisition, as additional information about conditions existing at the acquisition date becomes available.
Accounting for such acquisitions requires us to make significant assumptions and estimates and are adjusted during the measurement period for a period of up to one year after the acquisition date. Costs incurred to effect an acquisition, such as legal, accounting, valuation or other third-party costs, as well as internal general and administrative costs incurred are charged to expense in the periods incurred.
Shipping and Handling of Products. Costs incurred related to the shipment and handling of products are classified in cost of products sold. Amounts billed to customers for shipping and handling of products are included in sales.
Cash and Cash Equivalents include cash on hand, cash on deposit, treasuries and money market funds. We consider all highly liquid investments purchased with an original maturity of three months or less to be cash equivalents.
Accounts Receivable. Our receivables are subject to credit risk, and we do not typically require collateral on our accounts receivable. We perform periodic credit evaluations of our customers’ financial condition and generally require a security interest in the products sold. Receivables generally are due within 30 to 60 days. We maintain an allowance for customer accounts that reduces receivables to amounts that are expected to be collected. In estimating the allowance for doubtful accounts consistent with it reflecting related lifetime expected credit losses, management considers relevant information about past events, current conditions and reasonable and supportable forecasts that affect the collectability of financial assets.
Inventories are stated at the lower of first-in, first-out cost or net realizable value. Net realizable value is the estimated selling price in the ordinary course of business less cost to sell and considers our current assessment of general market and economic conditions, slow-moving inventory, and future demands.
Contract Assets arise upon the transfer of goods or services to a customer before the customer pays consideration. The Company presents the contract as either a contract asset or as a receivable, depending on the nature of the entity’s right to consideration for its performance. Contract assets are a right to consideration in exchange for goods or services that the Company has transferred to a customer, when the right is conditioned on something other than the passage of time.
Property, Plant and Equipment is stated at cost and the related assets are depreciated over their estimated useful lives on a straight-line basis for financial statement purposes and an accelerated method for income tax purposes. Cost includes an amount of interest associated with significant capital projects. Estimated useful lives range from
Assets and Liabilities Held for Sale We classify assets and liabilities (disposal groups) to be sold as held for sale in the period in which all of the following criteria are met: management, having the authority to approve the action, commits to a plan to sell the disposal group; the disposal group is available for immediate sale in its present condition subject only to terms that are usual and customary for sales of such disposal groups; an active program to locate a buyer and other actions required to complete the plan to sell the disposal group have been initiated; the sale of the disposal group is probable, and transfer of the disposal group is expected to qualify for recognition as a completed sale within one year, except if events or circumstances beyond the Company's control extend the period of time required to sell the disposal group beyond one year; the disposal group is being actively marketed for sale at a price that is reasonable in relation to its current fair value; and actions required to complete the plan indicate that it is unlikely that significant changes to the plan will be made or that the plan will be withdrawn.
THE SHYFT GROUP, INC. AND SUBSIDIARIES
NOTES TO CONSOLIDATED FINANCIAL STATEMENTS
(Dollar amounts in thousands, except per share data)
We initially measure a disposal group that is classified as held for sale at the lower of its carrying value or fair value less costs to sell. Any loss resulting from this measurement is recognized in the period in which the held for sale criteria are met. Conversely, gains are not recognized on the sale of a disposal group until the date of sale. We assess the fair value of a disposal group each reporting period it remains classified as held for sale and any subsequent changes are reported as an adjustment to the carrying value of the disposal group, as long as the new carrying value does not exceed the carrying value of the disposal group at the time it was initially classified as held for sale.
Upon determining that a disposal group meets the criteria to be classified as held for sale, the Company reports the assets and liabilities of the disposal group, if material, in the line items assets held for sale and liabilities held for sale in the Consolidated Balance Sheets. Depreciation is not recorded during the period in which the long-lived assets, included in the disposal group, are classified as held for sale.
Additionally, we report the reporting results for a disposal group in discontinued operations separately from continuing operations to distinguish the financial impact of disposal transactions from ongoing operations if the disposal represents a strategic shift that has or will have a major effect on our operations and financial results.
Goodwill and Other Intangible Assets. Goodwill represents the excess of the cost of a business combination over the fair value of the net assets acquired. Goodwill and intangible assets deemed to have indefinite lives are not amortized but are subject to impairment tests on an annual basis, or whenever events or changes in circumstances indicate that the carrying value may not be recoverable. Goodwill is allocated to the reporting unit from which it was created. A reporting unit is an operating segment or sub-segment to which goodwill is assigned when initially recorded. We review indefinite lived intangible assets annually for impairment by comparing the carrying value of those assets to their fair value.
Other intangible assets with finite lives are amortized over their estimated useful lives and are tested for impairment whenever events or changes in circumstances indicate that their carrying amounts may not be recoverable.
We perform our annual goodwill and indefinite lived intangible assets impairment test as of October 1 and monitor for interim triggering events on an ongoing basis. For goodwill we first assess qualitative factors to determine whether it is more likely than not that the fair value of a reporting unit is less than its carrying amount. Under authoritative guidance, we are not required to calculate the fair value of a reporting unit unless we determine that it is more likely than not that the fair value of the reporting unit is less than its carrying amount. We have the option to bypass the qualitative assessment and proceed to a quantitative impairment test.
If we elect to bypass the qualitative assessment for a reporting unit, or if after completing the assessment we determine that it is more likely than not that the fair value of a reporting unit is less than its carrying value, we perform a quantitative impairment test, whereby we compare the fair value of a reporting unit with its carrying amount, including goodwill. The fair value of the reporting unit is determined by estimating the future cash flows of the reporting unit to which the goodwill relates, and then discounting the future cash flows at a market-participant-derived weighted-average cost of capital (“WACC”). In determining the estimated future cash flows, we consider current and projected future levels of income based on our plans for that business; business trends, prospects and market and economic conditions; and market-participant considerations. If the fair value of a reporting unit exceeds its carrying amount, goodwill of the reporting unit is considered to not be impaired. If the carrying amount of the reporting unit exceeds its estimated fair value, an impairment loss is recognized in an amount equal to the excess, up to the carrying value of the goodwill.
We evaluate the recoverability of our indefinite lived intangible assets by comparing the estimated fair value of the trade names with their carrying values. We estimate the fair value of our trade names based on estimates of future royalty payments that are avoided through our ownership of the trade name, discounted to their present value. In determining the estimated fair value of the trade names, we consider current and projected future levels of sales based on our plans for those branded products, business trends, prospects and market and economic conditions.
THE SHYFT GROUP, INC. AND SUBSIDIARIES
NOTES TO CONSOLIDATED FINANCIAL STATEMENTS
(Dollar amounts in thousands, except per share data)
Significant judgments inherent in these assessments and analyses include assumptions about macroeconomic and industry conditions, appropriate sales growth rates, WACC and the amount of expected future net cash flows. The judgments and assumptions used in the estimate of fair value are generally consistent with the projections and assumptions that are used in current operating plans. Such assumptions are subject to change because of changing economic and competitive conditions. The determination of fair value is highly sensitive to differences between estimated and actual cash flows and changes in the related discount rate used to evaluate the fair value of the reporting units and trade names. See “Note 2 – Discontinued Operations” for further details on our goodwill and indefinite-lived intangible assets related to the ERV business. See “Note 6 – Goodwill and Intangible Assets” for further details on our goodwill and other intangible assets.
Warranties. Our policy is to record a provision for the estimated cost of warranty-related claims at the time of the sale, and periodically adjust the warranty liability to reflect actual experience. The amount of warranty liability accrued reflects management’s best estimate of the expected future cost of honoring our obligations under the warranty agreements. Expense related to warranty liabilities accrued for product sales, as well as adjustments to pre-existing warranty liabilities, are reflected within Cost of products sold on our Consolidated Statements of Operations. Our estimates are based on historical experience, the number of units involved, and the extent of features and components included in product models. See “Note 11 – Commitments and Contingent Liabilities” for further information regarding warranties.
Contract Liabilities. We sometimes receive advance payments from customers for product orders and record these amounts as liabilities. We accept such deposits when presented by customers seeking improved pricing in connection with orders that are placed for products to be manufactured and sold at a future date. Sales associated with these deposits are recognized over time based on the inputs completed for a given performance obligation during the reporting period or deferred and recognized upon shipment of the related product to the customer depending on the terms of the contract.
Research and Development. Our research and development costs, which consist of compensation costs, travel and entertainment, administrative expenses and new product development among other items, are expensed as incurred.
Taxes on Income. We recognize deferred income tax assets and liabilities using enacted tax rates for the effect of temporary differences between the book and tax bases of recorded assets and liabilities. Deferred tax liabilities generally represent tax expense recognized for which payment has been deferred, or expenses which have been deducted in our tax returns, but which have not yet been recognized as an expense in our financial statements.
We establish valuation allowances for deferred income tax assets in accordance with GAAP, which provides that such valuation allowances shall be established unless realization of the income tax benefits is more likely than not. The ultimate realization of deferred tax assets is dependent upon the generation of future taxable income during the periods in which those temporary differences become deductible. At each reporting period, we consider the scheduled reversal of deferred tax liabilities, available taxes in carryback periods, tax planning strategies and projected future taxable income in making this assessment.
We recognize the tax benefit from an uncertain tax position only if it is more likely than not that the tax position will be sustained on examination by the taxing authorities. The determination is based on the technical merits of the position and presumes that each uncertain tax position will be examined by the relevant taxing authority that has full knowledge of all relevant information. Although we believe the estimates are reasonable, no assurance can be given that the final outcome of these matters will not be different than what is reflected in the historical income tax provisions and accruals.
Interest and penalties attributable to income taxes are recorded as a component of income taxes. See “Note 9 – Taxes on Income” for further details on our income taxes.
THE SHYFT GROUP, INC. AND SUBSIDIARIES
NOTES TO CONSOLIDATED FINANCIAL STATEMENTS
(Dollar amounts in thousands, except per share data)
Earnings Per Share. Basic earnings per share is based on the weighted average number of common shares outstanding during the period. Diluted earnings per share also include the dilutive effect of additional potential common shares issuable from stock-based awards and are determined using the treasury stock method. Basic earnings per share represents net earnings divided by basic weighted average number of common shares outstanding during the period. Diluted earnings per share represents net earnings divided by diluted weighted average number of common shares outstanding, which includes the average dilutive effect of all potentially dilutive securities that are outstanding during the period. Our unvested restricted stock units and performance stock units are included in the number of shares outstanding for diluted earnings per share calculations, unless a net loss is reported, in which situation unvested stock awards are excluded from the number of shares outstanding for diluted earnings per share calculations. See “Note 14 – Stock-Based Compensation” and “Note 16 – Earnings Per Share” for further details.
Stock-Based Compensation. Stock based compensation cost for equity-based awards is measured on the grant date based on the estimated fair value of the award at that date, and is recognized over the requisite service period, net of estimated forfeitures. Fair value of restricted stock awards, restricted stock units and performance stock units subject to a performance condition is based upon the quoted market price of the common stock on the date of grant. Fair value of performance stock units subject to a market condition is calculated using the Monte Carlo simulation model. Our stock-based compensation plans are described in more detail in “Note 14 – Stock Based Compensation”.
Fair Value. We are required to disclose the estimated fair value of our financial instruments. The carrying value at December 31, 2022 and 2021 of cash and cash equivalents, accounts receivable and accounts payable approximate their fair value due to their short-term nature. The carrying value of variable rate debt instruments approximate their fair value based on their relative terms and market rates.
Segment Reporting. We identify our reportable segments based on our management structure and the financial data utilized by the chief operating decision maker to assess segment performance and allocate resources among our operating units. We have reportable segments: Fleet Vehicles and Services and Specialty Vehicles. More detailed information about our reportable segments can be found in “Note 17 – Business Segments”.
Supplemental Disclosures of Cash Flow Information. Cash paid for interest was $
THE SHYFT GROUP, INC. AND SUBSIDIARIES
NOTES TO CONSOLIDATED FINANCIAL STATEMENTS
(Dollar amounts in thousands, except per share data)
NOTE 2 – DISCONTINUED OPERATIONS
On February 1, 2020, we completed the sale of our Emergency Response Vehicle (“ERV”) business for $
The Income (loss) from discontinued operations presented in the Consolidated Statement of Operations are summarized below:
| Year Ended December 31, |
||||||||||||
| 2022 | 2021 |
2020 |
||||||||||
| Sales |
$ | $ | $ | |||||||||
| Cost of products sold |
||||||||||||
| Gross profit |
||||||||||||
| Operating expenses |
||||||||||||
| Operating loss |
( |
) |
||||||||||
| Loss on asset impairments |
||||||||||||
| Other income (expense) |
( |
) |
||||||||||
| Income (loss) from discontinued operations before taxes |
( |
) |
||||||||||
| Income tax (expense) benefit |
( |
) | ||||||||||
| Net income (loss) from discontinued operations |
$ | $ | $ | ( |
) |
|||||||
Total depreciation and amortization and capital expenditures for the discontinued operations for the years ended December 31, 2022, 2021 and 2020:
| Year Ended December 31, |
||||||||||||
| 2022 | 2021 |
2020 |
||||||||||
| Depreciation and amortization |
$ | $ | $ | |||||||||
| Capital expenditures |
$ | $ | $ | |
||||||||
THE SHYFT GROUP, INC. AND SUBSIDIARIES
NOTES TO CONSOLIDATED FINANCIAL STATEMENTS
(Dollar amounts in thousands, except per share data)
NOTE 3 – ACQUISITION ACTIVITIES
DuraMag Acquisition
On October 1, 2020, the Company acquired substantially all of the assets and certain liabilities of F3 MFG Inc. through the Company’s subsidiary, The Shyft Group DuraMag LLC (“DuraMag”). The Company paid $
NOTE 4 – REVENUE
Contract Assets and Liabilities
The tables below disclose changes in contract assets and liabilities as of the periods indicated.
| December 31, 2022 | December 31, 2021 | |||||||
| Contract Assets | ||||||||
| Contract assets, beginning of year | $ | $ | ||||||
| Reclassification of the beginning contract assets to receivables, as the result of rights to consideration becoming unconditional | ) | ( | ) | |||||
| Contract assets recognized, net of reclassification to receivables | ||||||||
| Contract assets, end of year | $ | $ | ||||||
| Contract Liabilities | ||||||||
| Contract liabilities, beginning of year | $ | $ | ||||||
| Reclassification of the beginning contract liabilities to revenue, as the result of performance obligations satisfied | ( | ) | ( | ) | ||||
| Cash received in advance and not recognized as revenue | ||||||||
| Contract liabilities, end of year | $ | $ | ||||||
The aggregate amount of the transaction price allocated to remaining performance obligations in existing contracts that are yet to be completed in the FVS and SV segments are $
For performance obligations that are satisfied over time, revenue is expected to be recognized evenly over the time period to complete the contract due to the assembly line nature of the business operations. For performance obligations that are satisfied at a point in time, revenue is expected to be recognized when the customer obtains control of the product, which is generally upon shipment from our facility. No amounts have been excluded from the transaction prices above related to the guidance on constraining estimates of variable consideration.
THE SHYFT GROUP, INC. AND SUBSIDIARIES
NOTES TO CONSOLIDATED FINANCIAL STATEMENTS
(Dollar amounts in thousands, except per share data)
In the following tables, revenue is disaggregated by primary geographical market and timing of revenue recognition for the years ended December 31, 2022, 2021, and 2020. The tables also include a reconciliation of the disaggregated revenue with the reportable segments.
| Year Ended December 31, 2022 | ||||||||||||||||||||
| FVS | SV | Total Reportable Segments | Eliminations and Other | Total | ||||||||||||||||
| Primary geographical markets | ||||||||||||||||||||
| United States | $ | $ | $ | $ | ( | ) | $ | |||||||||||||
| Other | ||||||||||||||||||||
| Total sales | $ | $ | $ | $ | ( | ) | $ | |||||||||||||
| Timing of revenue recognition | ||||||||||||||||||||
| Products transferred at a point in time | $ | $ | $ | $ | $ | |||||||||||||||
| Products and services transferred over time | ( | ) | ||||||||||||||||||
| Total sales | $ | $ | $ | $ | ( | ) | $ | |||||||||||||
| Year Ended December 31, 2021 | ||||||||||||||||||||
| FVS | SV | Total Reportable Segments | Eliminations and Other | Total | ||||||||||||||||
| Primary geographical markets | ||||||||||||||||||||
| United States | $ | $ | $ | $ | $ | |||||||||||||||
| Other | ||||||||||||||||||||
| Total sales | $ | $ | $ | $ | $ | |||||||||||||||
| Timing of revenue recognition | ||||||||||||||||||||
| Products transferred at a point in time | $ | $ | $ | $ | $ | |||||||||||||||
| Products and services transferred over time | ||||||||||||||||||||
| Total sales | $ | $ | $ | $ | $ | |||||||||||||||
THE SHYFT GROUP, INC. AND SUBSIDIARIES
NOTES TO CONSOLIDATED FINANCIAL STATEMENTS
(Dollar amounts in thousands, except per share data)
| Year Ended December 31, 2020 | ||||||||||||||||||||
| FVS | SV | Total Reportable Segments | Eliminations and Other | Total | ||||||||||||||||
| Primary geographical markets | ||||||||||||||||||||
| United States | $ | $ | $ | $ | $ | |||||||||||||||
| Other | ||||||||||||||||||||
| Total sales | $ | $ | $ | $ | $ | |||||||||||||||
| Timing of revenue recognition | ||||||||||||||||||||
| Products transferred at a point in time | $ | $ | $ | $ | $ | |||||||||||||||
| Products and services transferred over time | ||||||||||||||||||||
| Total sales | $ | $ | $ | $ | $ | |||||||||||||||
NOTE 5 – INVENTORIES
Inventories are summarized as follows:
| December 31, |
||||||||
| 2022 | 2021 |
|||||||
| Finished goods |
$ | $ | ||||||
| Work in process |
||||||||
| Raw materials and purchased components |
||||||||
| Total Inventories |
$ | $ | ||||||
NOTE 6 – GOODWILL AND INTANGIBLE ASSETS
Goodwill
We test goodwill for impairment at the reporting unit level on an annual basis as of October 1, or whenever an event or change in circumstances occurs that would more likely than not reduce the fair value of a reporting unit below its carrying amount. See “Goodwill and Other Intangible Assets” within “Note 1 – Nature of Operations and Basis of Presentation” for a description of our accounting policies regarding goodwill and other intangible assets.
As of October 1, 2022, the most recent annual goodwill impairment assessment date, two reporting units were determined for goodwill impairment testing: Fleet Vehicles and Services and Specialty Vehicles. We qualitatively assessed goodwill assigned to the Fleet Vehicles and Services and Specialty Vehicles reporting units and found no indicators of impairment.
As discussed in “Note 1 – Nature of Operations and Basis of Presentation” there are significant judgments inherent in our impairment assessments and discounted cash flow analyses. These discounted cash flow analyses are most sensitive to the weighted-average cost of capital (“WACC”) assumption.
THE SHYFT GROUP, INC. AND SUBSIDIARIES
NOTES TO CONSOLIDATED FINANCIAL STATEMENTS
(Dollar amounts in thousands, except per share data)
The change in the carrying amount of goodwill for the year ended December 31, 2022 and 2021 were as follows (in thousands):
| FVS | SV | Total | ||||||||||||||||||||||
| December 31, | December 31, | December 31, | ||||||||||||||||||||||
| 2022 | 2021 | 2022 | 2021 | 2022 | 2021 | |||||||||||||||||||
| Goodwill, beginning of year | $ | $ | $ | $ | $ | $ | ||||||||||||||||||
| Acquisition and measurement period adjustments | ( | ) | ( | ) | ||||||||||||||||||||
| Goodwill, end of year | $ | $ | $ | $ | $ | $ | ||||||||||||||||||
OtherIntangible Assets
At December 31, 2022, we had other intangible assets, including customer and dealer relationships, non-compete agreements, trade names, trademarks, unpatented technology, patented technology. Certain non-compete agreements and certain other intangible assets are being amortized over their expected remaining useful lives based on the pattern of estimated after-tax operating income generated, or on a straight-line basis. Unpatented technology, patented technology and certain non-compete agreements are amortized utilizing a straight-line approach over the estimated useful lives. We amortize the customer relationships utilizing an accelerated approach over the estimated remaining life. The Royal, DuraMag, Magnum, Utilimaster, and Strobes-R-Us trade names and trademarks are considered to have indefinite lives and are not amortized.
We evaluate the recoverability of our indefinite lived intangible assets, which, as of October 1, 2022, consisted of our Royal, DuraMag, and Magnum trade names, by comparing the estimated fair value of the trade names with their carrying values. We estimate the fair value of our trade names based on estimates of future royalty payments that are avoided through our ownership of the trade name, discounted to their present value. In determining the estimated fair value of the trade names, we consider current and projected future levels of sales based on our plans for these trade name branded products, business trends, prospects and market and economic conditions. The fair value of our Royal, DuraMag, and Magnum trade names exceeded their carrying values, and therefore do not result in an impairment. We qualitatively assessed Utilimaster and Strobes-R-Us trade names and trademarks and found no indicators of impairment.
The following table provides information regarding our other intangible assets:
| As of December 31, 2022 | As of December 31, 2021 | |||||||||||||||||||||||
| Gross carrying amount | Accumulated amortization | Net | Gross carrying amount | Accumulated amortization | Net | |||||||||||||||||||
| Customer relationships | $ | $ | $ | $ | $ | $ | ||||||||||||||||||
| Unpatented technology | ||||||||||||||||||||||||
| Patented technology | ||||||||||||||||||||||||
| Non-compete agreements | ||||||||||||||||||||||||
| Trade Names | ||||||||||||||||||||||||
| $ | $ | $ | $ | $ | $ | |||||||||||||||||||
We recorded $
THE SHYFT GROUP, INC. AND SUBSIDIARIES
NOTES TO CONSOLIDATED FINANCIAL STATEMENTS
(Dollar amounts in thousands, except per share data)
The estimated remaining amortization associated with finite-lived intangible assets is expected to be expensed as follows:
| Amount | ||||
| 2023 | ||||
| 2024 | ||||
| 2025 | ||||
| 2026 | ||||
| 2027 | ||||
| Thereafter | ||||
| Total | $ | |||
NOTE 7 – PROPERTY, PLANT AND EQUIPMENT
Property, plant and equipment are summarized by major classifications as follows:
| December 31, | ||||||||
| 2022 | 2021 | |||||||
| Land and improvements | $ | $ | ||||||
| Buildings and improvements | ||||||||
| Plant machinery and equipment | ||||||||
| Furniture and fixtures | ||||||||
| Vehicles | ||||||||
| Construction in process | ||||||||
| Subtotal | ||||||||
| Less accumulated depreciation | ( | ) | ( | ) | ||||
| Total property, plant and equipment, net | $ | $ | ||||||
We recorded depreciation expense of $
NOTE 8 – LEASES
We have operating and finance leases for land, buildings and certain equipment. Our leases have remaining lease terms of year to
THE SHYFT GROUP, INC. AND SUBSIDIARIES
NOTES TO CONSOLIDATED FINANCIAL STATEMENTS
(Dollar amounts in thousands, except per share data)
Operating lease expenses are classified as cost of products sold and operating expenses on the Consolidated Statements of Operations. The components of lease expense were as follows:
| Year ended December 31, 2022 | Year ended December 31, 2021 | Year ended December 31, 2020 | ||||||||||
| Operating leases | $ | $ | $ | |||||||||
| Short-term leases (1) | ||||||||||||
| Total lease expense | $ | $ | $ | |||||||||
(1) Includes expenses for month-to-month equipment leases, which are classified as short-term as the Company is not reasonably certain to renew the lease term beyond one month.
The weighted average remaining lease term and weighted average discount rate were as follows:
| Year ended December 31, 2022 | Year ended December 31, 2021 | |||||||
| Weighted average remaining lease term of operating leases (in years) | ||||||||
| Weighted average discount rate of operating leases | % | % | ||||||
Supplemental cash flow information related to leases was as follows:
| Year ended December 31, 2022 | Year ended December 31, 2021 | Year ended December 31, 2020 | ||||||||||
| Cash paid for amounts included in the measurement of lease liabilities: | ||||||||||||
| Operating cash flow for operating leases | $ | $ | $ | |||||||||
| Right of use assets obtained in exchange for lease obligations: | ||||||||||||
| Operating leases | $ | $ | $ | |||||||||
| Finance leases | $ | $ | $ | |||||||||
Maturities of operating lease liabilities as of December 31, 2022 are as follows:
| Years ending December 31: | ||||
| 2023 | ||||
| 2024 | ||||
| 2025 | ||||
| 2026 | ||||
| 2027 | ||||
| Thereafter | ||||
| Total lease payments | ||||
| Less: imputed interest | ( | ) | ||
| Total lease liabilities | $ |
THE SHYFT GROUP, INC. AND SUBSIDIARIES
NOTES TO CONSOLIDATED FINANCIAL STATEMENTS
(Dollar amounts in thousands, except per share data)
NOTE 9 – TAXES ON INCOME
Income taxes consist of the following:
| Year Ended December 31, | ||||||||||||
| 2022 | 2021 | 2020 | ||||||||||
| Taxes on income from continuing operations | $ | $ | $ | |||||||||
| Income tax expense (benefit) from discontinued operations | ( | ) | ||||||||||
| Total taxes on income | $ | $ | $ | |||||||||
Income taxes from continuing operations consist of the following:
| Year Ended December 31, | ||||||||||||
| 2022 | 2021 | 2020 | ||||||||||
| Current (benefit): | ||||||||||||
| Federal | $ | $ | $ | |||||||||
| State | ||||||||||||
| Foreign | ||||||||||||
| Total current | ||||||||||||
| Deferred (benefit): | ||||||||||||
| Federal | ( | ) | ( | ) | ||||||||
| State | ( | ) | ||||||||||
| Total deferred | ( | ) | ( | ) | ||||||||
| Total taxes on income | $ | $ | $ | |||||||||
Differences between the expected income tax expense derived from applying the federal statutory income tax rate to earnings from continuing operations before taxes on income and the actual tax expense are as follows:
| Year Ended December 31, | ||||||||||||
| 2022 | 2021 | 2020 | ||||||||||
| Federal income taxes at the statutory rate | $ | $ | $ | |||||||||
| State tax expense, net of federal income tax benefit | ||||||||||||
| Increase (decrease) in income taxes resulting from: | ||||||||||||
| Tax rate benefit from NOL carryback due to CARES Act | ( | ) | ||||||||||
| Other deferred income tax adjustment | ||||||||||||
| Non-deductible compensation | ||||||||||||
| Other non-deductible expenses | ||||||||||||
| Stock based compensation | ( | ) | ( | ) | ( | ) | ||||||
| Foreign tax expense | ||||||||||||
| Valuation allowance adjustment | ( | ) | ( | ) | ||||||||
| Unrecognized tax benefit adjustment | ( | ) | ||||||||||
| Federal research and development tax credit | ( | ) | ( | ) | ( | ) | ||||||
| Foreign tax credit | ( | ) | ||||||||||
| Other | ( | ) | ( | ) | ||||||||
| Total | $ | $ | $ | |||||||||
THE SHYFT GROUP, INC. AND SUBSIDIARIES
NOTES TO CONSOLIDATED FINANCIAL STATEMENTS
(Dollar amounts in thousands, except per share data)
Temporary differences which give rise to deferred income tax assets (liabilities) are as follows:
| December 31, | ||||||||
| 2022 | 2021 | |||||||
| Deferred income tax assets: | ||||||||
| Operating lease liability | $ | $ | ||||||
| Research and development costs | ||||||||
| Warranty reserve | ||||||||
| Inventory costs and reserves | ||||||||
| Deferment of employer's portion Social Security tax payment | ||||||||
| Contract assets | ||||||||
| Stock-based compensation | ||||||||
| Net operating loss carry-forwards, net of federal income tax benefit | ||||||||
| Compensation related accruals | ||||||||
| Credit carry-forwards net of federal income tax benefit | ||||||||
| Other | ||||||||
| Total deferred income tax assets | $ | $ | ||||||
| Deferred income tax liabilities: | ||||||||
| Cost offset method | $ | ( | ) | $ | ||||
| Right of use assets | ( | ) | ( | ) | ||||
| Depreciation | ( | ) | ( | ) | ||||
| Intangible assets | ( | ) | ( | ) | ||||
| Prepaid expenses | ( | ) | ( | ) | ||||
| Total deferred income tax liabilities | $ | ( | ) | $ | ( | ) | ||
| Net deferred tax asset | $ | $ | ||||||
Based upon an assessment of the available positive and negative evidence at December 31, 2022 and 2021, the total deferred income tax assets are more likely than not to be realized based on the consideration of deferred tax liability reversals and projected future taxable income. Therefore,
As required by the 2017 Tax Cuts and Jobs Act, effective January 1, 2022 our research and development costs were capitalized and amortized for income tax purposes and resulted in an equal amount of deferred tax benefit as of December 31, 2022.
At December 31, 2022 and 2021, we had state tax NOL carry-forwards of $
| 2022 | 2021 | 2020 | ||||||||||
| Balance at January 1, | $ | $ | ||||||||||
| Increase (decrease) related to prior year tax positions | ( | ) | ( | ) | ||||||||
| Increase related to current year tax positions | ||||||||||||
| Settlement | ( | ) | ||||||||||
| Expiration of statute | ( | ) | ( | ) | ( | ) | ||||||
| Balance at December 31, | $ | $ | $ | |||||||||
THE SHYFT GROUP, INC. AND SUBSIDIARIES
NOTES TO CONSOLIDATED FINANCIAL STATEMENTS
(Dollar amounts in thousands, except per share data)
As of December 31, 2022, we had an ending UTB balance of $
As of December 31, 2022, we are no longer subject to examination by federal taxing authorities for 2018 and earlier years, however federal carryforwards from 2018 and earlier are open to adjustment. We also file tax returns in several states and those jurisdictions remain subject to audit in accordance with relevant state statutes. These audits can involve complex issues that may require an extended period of time to resolve and may cover multiple years.
We do not expect the total amount of UTB to significantly increase or decrease over the next twelve months.
NOTE 10 – TRANSACTIONS WITH MAJOR CUSTOMERS
Major customers are defined as those with sales greater than 10 percent of consolidated sales in a given year. We had certain customers whose sales individually represented 10 percent or more of the Company's total sales as follows:
| Year | Number of major customers | Combined percentage of consolidated sales | Segment | |||||||
| 2022 | % | FVS and SV | ||||||||
| 2021 | % | FVS | ||||||||
| 2020 | % | FVS | ||||||||
NOTE 11 – COMMITMENTS AND CONTINGENT LIABILITIES
At December 31, 2022, we and our subsidiaries were parties, both as plaintiff and defendant, to a number of lawsuits and claims arising out of the normal course of our businesses. In the opinion of management, our financial position, future operating results or cash flows will not be materially affected by the final outcome of these legal proceedings.
Warranty Related
We provide limited warranties against assembly/construction defects. These warranties generally provide for the replacement or repair of defective parts or workmanship for a specified period following the date of sale. The end users also may receive limited warranties from suppliers of components that are incorporated into our chassis and vehicles.
THE SHYFT GROUP, INC. AND SUBSIDIARIES
NOTES TO CONSOLIDATED FINANCIAL STATEMENTS
(Dollar amounts in thousands, except per share data)
Certain warranty and other related claims involve matters of dispute that ultimately are resolved by negotiation, arbitration or litigation. Infrequently, a material warranty issue can arise which is beyond the scope of our historical experience. We provide for any such warranty issues as they become known and are estimable. It is reasonably possible that additional warranty and other related claims could arise from disputes or other matters beyond the scope of our historical experience. An estimate of possible penalty or loss, if any, cannot be made at this time.
Changes in our warranty liability during the years ended December 31, 2022 and 2021 were as follows:
| 2022 | 2021 | |||||||
| Balance of accrued warranty at January 1 | $ | $ | ||||||
| Provisions for current period sales | ||||||||
| Cash settlements | ( | ) | ( | ) | ||||
| Changes in liability for pre-existing warranties | ||||||||
| Acquisitions | ||||||||
| Balance of accrued warranty at December 31 | $ | $ | ||||||
EPA Matter
As previously disclosed, in May 2020, the Company received an information request from the United States Environmental Protection Agency (“EPA”) requesting certain information regarding emissions labels on chassis, vocational vehicles, and vehicles that the Company manufactured or imported into the U.S. between January 1, 2017 to the date the Company received the request in May 2020. The Company responded to the EPA’s request and furnished the requested materials in the third quarter of 2020.
On April 6, 2022, the Company received a Notice of Violation from the EPA alleging a failure to secure certain certifications on manufactured chassis and a failure to comply with recordkeeping and reporting requirements related to supplier-provided chassis. The Company continues to investigate this matter, including potential defenses, and will continue discussions with the EPA regarding the allegations. At this time, it is not possible to estimate the potential fines or penalties that the Company may incur (if any) for this matter.
NOTE 12 – DEFINED CONTRIBUTION PLANS
We sponsor defined contribution retirement plans which cover all employees who meet length of service and minimum age requirements. Our matching contributions vest over years and were $
NOTE 13 – DEBT
Short-term debt consists of the following:
| December 31, 2022 | December 31, | |||||||
| Chassis pool agreements | $ | $ | ||||||
| Total short-term debt | $ | $ | ||||||
THE SHYFT GROUP, INC. AND SUBSIDIARIES
NOTES TO CONSOLIDATED FINANCIAL STATEMENTS
(Dollar amounts in thousands, except per share data)
Chassis Pool Agreements
The Company obtains certain vehicle chassis for its walk-in vans, service bodies and specialty vehicles directly from the chassis manufacturers under converter pool agreements. Chassis are obtained from the manufacturers based on orders from customers, and in some cases, for unallocated orders. The agreements generally state that the manufacturer will provide a supply of chassis to be maintained at the Company’s facilities with the condition that we will store such chassis and will not move, sell, or otherwise dispose of such chassis except under the terms of the agreement. In addition, the manufacturer typically retains the sole authority to authorize commencement of work on the chassis and to make certain other decisions with respect to the chassis including the terms and pricing of sales of the chassis to the manufacturer’s dealers. The manufacturer also does not transfer the certificate of origin to the Company nor permit the Company to sell or transfer the chassis to anyone other than the manufacturer (for ultimate resale to a dealer).
Although the Company is party to related finance agreements with manufacturers, the Company has not historically settled, nor expects to in the future settle, any related obligations in cash. Instead, the obligation is settled by the manufacturer upon reassignment of the chassis to an accepted dealer, and the dealer is invoiced for the chassis by the manufacturer. Accordingly, as of December 31, 2022 and December 31, 2021, the Company’s outstanding chassis converter pool with manufacturers totaled $
Long-term debt consists of the following:
| December 31, 2022 | December 31, | |||||||
| Revolving credit facility | $ | $ | ||||||
| Finance lease obligations | ||||||||
| Other | ||||||||
| Total debt | ||||||||
| Less current portion of long-term debt | ( | ) | ( | ) | ||||
| Total long-term debt | $ | $ | ||||||
Revolving Credit Facility
On November 30, 2021, we entered into an Amended and Restated Credit Agreement (the “Credit Agreement”) by and among us and certain of our subsidiaries as borrowers, Wells Fargo Bank, N.A. (“Wells Fargo”), as administrative agent, and the lenders party thereto consisting of Wells Fargo, JPMorgan Chase Bank, N.A., PNC Bank, National Association and Bank of America, N.A. (the “Lenders”). Certain of our other subsidiaries have executed guaranties guarantying the borrowers' obligations under the Credit Agreement.
Under the Credit Agreement, we may borrow up to $
Under the terms of our Credit Agreement, available borrowings (exclusive of outstanding borrowings) totaled $
THE SHYFT GROUP, INC. AND SUBSIDIARIES
NOTES TO CONSOLIDATED FINANCIAL STATEMENTS
(Dollar amounts in thousands, except per share data)
NOTE 14 – STOCK BASED COMPENSATION
We have stock incentive plans covering certain employees and non-employee directors. Shares reserved for stock awards under these plans total
Restricted Stock
We issue restricted stock, at no cash cost, to our key employees. Shares awarded entitle the shareholder to all rights of common stock ownership except that the shares are subject to the risk of forfeiture and may not be sold, transferred, pledged, exchanged or otherwise disposed of during the vesting period, which is years. The unearned stock-based compensation related to restricted stock awards, using the market price on the date of grant, is being amortized to compensation expense over the applicable vesting periods.
We receive an excess tax benefit or liability during the period the restricted shares vest. The excess tax benefit (liability) is determined by the excess (shortfall) of the market price of the stock on date of vesting over (under) the grant date market price used to amortize the awards to compensation expense. As required, any excess tax benefits or liabilities are reported in the Consolidated Statements of Cash Flows as operating cash flows.
Restricted stock activity for the years ended December 31, 2022, 2021, and 2020, is as follows:
| Total (000) | Weighted | Weighted | ||||||||||
| Non-vested shares outstanding at January 1, 2020 | $ | |||||||||||
| Granted | ||||||||||||
| Vested | ( | ) | ||||||||||
| Forfeited | ( | ) | ||||||||||
| Non-vested shares outstanding at December 31, 2020 | ||||||||||||
| Granted | ||||||||||||
| Vested | ( | ) | ||||||||||
| Forfeited | ( | ) | ||||||||||
| Non-vested shares outstanding at December 31, 2021 | ||||||||||||
| Vested | ( | ) | ||||||||||
| Forfeited | ( | ) | ||||||||||
| Non-vested shares outstanding at December 31, 2022 | $ | |||||||||||
The weighted-average grant date fair value of non-vested shares granted was $
Performance Stock Units
During the year ended December 31, 2022, 2021, and 2020, we granted
THE SHYFT GROUP, INC. AND SUBSIDIARIES
NOTES TO CONSOLIDATED FINANCIAL STATEMENTS
(Dollar amounts in thousands, except per share data)
After completion of the performance period, the number of PSUs earned will be issued as shares of common stock. The aggregate number of shares of common stock that ultimately may be issued under PSUs where the performance period has not been completed can range from
A dividend equivalent is calculated based on the actual number of units earned at the end of the performance period equal to the dividends that would have been payable on the earned units had they been held during the entire performance period as common stock. At the end of the performance period, the dividend equivalents are paid in the form of cash at the discretion of the Human Resources and Compensation Committee.
The fair value of the TSR PSUs granted was calculated using the Monte Carlo simulation model which resulted in the grant date fair value for these TSR PSUs of $
The Monte Carlo simulation was computed using the following assumptions:
| Granted in 2022 | Granted in 2021 | Granted in 2020 | ||||||||||
| Three-year risk-free interest rate (1) | % | % | % | |||||||||
| Expected term (in years) | ||||||||||||
| Estimated volatility (2) | % | % | % | |||||||||
| (1) | Based on the U.S. government bond benchmark on the grant date. |
| (2) | Represents the historical price volatility of the Company’s common stock for the three-year period preceding the grant date. |
The total PSU expense and associated tax benefit for all outstanding awards for the year ended December 31, 2022 was $
THE SHYFT GROUP, INC. AND SUBSIDIARIES
NOTES TO CONSOLIDATED FINANCIAL STATEMENTS
(Dollar amounts in thousands, except per share data)
The PSU activity for the years ended December 31, 2022, 2021, and 2020, is as follows:
|
Total Number of Non-vested Shares (000) | Weighted- Average Grant Date Fair Value per Unit | |||||||
| Non-vested as of January 1, 2020 | $ | |||||||
| Granted | ||||||||
| ( | ) | |||||||
| Non-vested as of December 31, 2020 | ||||||||
| Granted | ||||||||
| Forfeited | ( | ) | ||||||
| Non-vested as of December 31, 2021 | ||||||||
| Granted | ||||||||
| Forfeited | ( | ) | ||||||
| Vested | ( | ) | ||||||
| Non-vested as of December 31, 2022 | $ | |||||||
As of December 31, 2022 there was $
Restricted Stock Units
During the year ended December 31, 2022, 2021, and 2020, we awarded
The RSU expense and associated tax benefit for all outstanding awards for the year ended December 31, 2022 was $
THE SHYFT GROUP, INC. AND SUBSIDIARIES
NOTES TO CONSOLIDATED FINANCIAL STATEMENTS
(Dollar amounts in thousands, except per share data)
The RSU activity for the years ended December 31, 2022, 2021, and 2020, is as follows:
|
Total Number of Non-vested Shares (000) | Weighted- Average Grant Date Fair Value per Unit | |||||||
| Non-vested as of January 1, 2020 | $ | |||||||
| Granted | ||||||||
| Forfeited | ( | ) | ||||||
| Vested | ( | ) | ||||||
| Non-vested as of December 31, 2020 | ||||||||
| Granted | ||||||||
| Forfeited | ( | ) | ||||||
| Vested | ( | ) | ||||||
| Non-vested as of December 31, 2021 | ||||||||
| Granted | ||||||||
| Forfeited | ( | ) | ||||||
| Vested | ( | ) | ||||||
| Non-vested as of December 31, 2022 | $ | |||||||
As of December 31, 2022 there was $
Employee Stock Purchase Plan
We instituted an employee stock purchase plan (“ESPP”) beginning on October 1, 2011 whereby essentially all employees who meet certain service requirements can purchase our common stock on quarterly offering dates at
THE SHYFT GROUP, INC. AND SUBSIDIARIES
NOTES TO CONSOLIDATED FINANCIAL STATEMENTS
(Dollar amounts in thousands, except per share data)
NOTE 15 – SHAREHOLDERS EQUITY
On February 22, 2022, we announced that our Board of Directors had authorized the repurchase of up to $
The following table represents our purchases of our common stock during the year ended December 31, 2022 under the share repurchase program.
| Year Ended December 31, | Shares purchased (000) | Purchase value | Approximate Dollar Value of Shares That | |||||||||
| 2022 | $ | $ | ||||||||||
During the year ended December 31, 2021,
In January 2022, we repurchased the remaining
NOTE 16 – EARNINGS PER SHARE
The table below reconciles basic weighted average common shares outstanding to diluted weighted average shares outstanding for 2022, 2021, and 2020 (in thousands). Basic earnings per share is based on the weighted average number of common shares outstanding during the period. Diluted earnings per share also include the dilutive effect of additional potential common shares issuable from stock-based awards and are determined using the treasury stock method. Basic earnings per share represents net earnings divided by basic weighted average number of common shares outstanding during the period. Diluted earnings per share represents net earnings divided by diluted weighted average number of common shares outstanding, which includes the average dilutive effect of all potentially dilutive securities that are outstanding during the period. Our unvested restricted stock units and performance stock units are included in the number of shares outstanding for diluted earnings per share calculations, unless a net loss is reported, in which situation unvested stock awards are excluded from the number of shares outstanding for diluted earnings per share calculations.
| Year Ended December 31, |
||||||||||||
| 2022 | 2021 |
2020 |
||||||||||
| Basic weighted average common shares outstanding |
||||||||||||
| Plus dilutive effect of Restricted Stock Units and Performance Stock Units |
||||||||||||
| Diluted weighted average common shares outstanding |
||||||||||||
NOTE 17 – BUSINESS SEGMENTS
We identify our reportable segments based on our management structure and the financial data utilized by our chief operating decision maker to assess segment performance and allocate resources among our operating units. We have reportable segments: Fleet Vehicles and Services and Specialty Vehicles.
THE SHYFT GROUP, INC. AND SUBSIDIARIES
NOTES TO CONSOLIDATED FINANCIAL STATEMENTS
(Dollar amounts in thousands, except per share data)
We evaluate the performance of our reportable segments based on Adjusted EBITDA (earnings before interest, taxes, depreciation and amortization), which is defined as income from continuing operations before interest, income taxes, depreciation and amortization, as adjusted to eliminate the impact of restructuring charges, acquisition related expenses and adjustments, non-cash stock-based compensation expenses, and other gains and losses not reflective of our ongoing operations.
Our FVS segment consists of our operations at our Bristol, Indiana; Landisville, Pennsylvania; North Charleston, South Carolina; Charlotte, Michigan locations along with our operations at our upfit centers in Kansas City, Missouri; North Charleston, South Carolina; and Saltillo, Mexico. The segment focuses on designing and manufacturing walk-in vans for parcel delivery, mobile retail, and trades and construction industries, the production of commercial truck bodies, and the distribution of related aftermarket parts and accessories.
Our SV segment consists of our Charlotte, Michigan operations that engineer and manufacture motorhome chassis, other specialty chassis and distribute related aftermarket parts and assemblies. Our service bodies operations include locations in Charlotte, Michigan; Carson, McClellan Park, and Montebello, California; Mesa, Arizona; Dallas and Weatherford, Texas; and Waterville, Maine. We also provide vocation-specific equipment upfit services, which are marketed and sold under the Strobes-R-Us brand, through our manufacturing operations in Pompano and West Palm Beach, Florida.
The accounting policies of the segments are the same as those described, or referred to, in “Note 1 – Nature of Operations and Basis of Presentation”. Assets and related depreciation expense in the column labeled “Eliminations and Other” pertain to capital assets maintained at the corporate level. Eliminations for inter-segment sales are shown in the column labeled “Eliminations and other”. Segment loss from operations in the “Eliminations and other” column contains corporate related expenses not allocable to the operating segments. Interest expense and Taxes on income are not included in the information utilized by the chief operating decision makers to assess segment performance and allocate resources, and accordingly, are excluded from the segment results presented below.
Sales to customers outside the United States were $
Sales and other financial information by business segment are as follows:
Year Ended December 31, 2022
| Segment | ||||||||||||||||
| FVS | SV | Eliminations and Other | Consolidated | |||||||||||||
| Fleet vehicles sales | $ | $ | $ | $ | ||||||||||||
| Motorhome chassis sales | ||||||||||||||||
| Other specialty vehicles sales | ( | ) | ||||||||||||||
| Aftermarket parts and accessories sales | ||||||||||||||||
| Total sales | $ | $ | $ | ( | ) | $ | ||||||||||
| Depreciation and amortization expense | $ | $ | $ | $ | ||||||||||||
| Adjusted EBITDA | ( | ) | ||||||||||||||
| Segment assets | ||||||||||||||||
| Capital expenditures | ||||||||||||||||
THE SHYFT GROUP, INC. AND SUBSIDIARIES
NOTES TO CONSOLIDATED FINANCIAL STATEMENTS
(Dollar amounts in thousands, except per share data)
Year Ended December 31, 2021
| Segment | ||||||||||||||||
| FVS | SV | Eliminations and Other | Consolidated | |||||||||||||
| Fleet vehicles sales | $ | $ | $ | $ | ||||||||||||
| Motorhome chassis sales | ||||||||||||||||
| Other specialty vehicles sales | ||||||||||||||||
| Aftermarket parts and accessories sales | ||||||||||||||||
| Total sales | $ | $ | $ | $ | ||||||||||||
| Depreciation and amortization expense | $ | $ | $ | $ | ||||||||||||
| Adjusted EBITDA | ( | ) | ||||||||||||||
| Segment assets | ||||||||||||||||
| Capital expenditures | ||||||||||||||||
Year Ended December 31, 2020
| Segment | ||||||||||||||||
| FVS | SV | Eliminations and Other | Consolidated | |||||||||||||
| Fleet vehicles sales | $ | $ | $ | $ | ||||||||||||
| Motorhome chassis sales | ||||||||||||||||
| Other specialty vehicles sales | ||||||||||||||||
| Aftermarket parts and accessories sales | ||||||||||||||||
| Total sales | $ | $ | $ | $ | ||||||||||||
| Depreciation and amortization expense | $ | $ | $ | $ | ||||||||||||
| Adjusted EBITDA | ( | ) | ||||||||||||||
| Segment assets | ||||||||||||||||
| Capital expenditures | ||||||||||||||||
| Item 9. |
Changes in and Disagreements with Accountants on Accounting and Financial Disclosure. |
None.
| Item 9A. |
Controls and Procedures. |
Evaluation of Disclosure Controls and Procedures.
Our management, with the participation of our Chief Executive Officer and Chief Financial Officer, has evaluated the effectiveness of our disclosure controls and procedures (as defined in Rules 13a-15(e) and 15d-15(e) under the Securities Exchange Act of 1934, as amended), as of the end of the period covered by this Annual Report. Based on the evaluation of our disclosure controls and procedures as of December 31, 2022, our Chief Executive Officer and Chief Financial Officer concluded that our disclosure controls and procedures were effective.
Management’s Report on Internal Control Over Financial Reporting
Management is responsible for establishing and maintaining adequate “internal control over financial reporting,” as defined in Rules 13a-15(f) and 15d- 15(f) under the Exchange Act. Our internal control over financial reporting is designed to provide reasonable assurance regarding the reliability of financial reporting and the preparation of financial statements for external purposes in accordance with U.S. generally accepted accounting principles and includes those policies and procedures that (i.) pertain to the maintenance of records that, in reasonable detail, accurately and fairly reflect the transactions and dispositions of the assets of the Company; (ii.) provide reasonable assurance that transactions are recorded as necessary to permit preparation of financial statements in accordance with generally accepted accounting principles, and that receipts and expenditures of the Company are being made only in accordance with authorizations of management and directors of the Company; and (iii.) provide reasonable assurance regarding prevention or timely detection of unauthorized acquisition, use, or disposition of the Company’s assets that could have a material effect on the financial statements.
Under the supervision of and with the participation of management, including the Chief Executive Officer and the Chief Financial Officer, the Company conducted an evaluation of the effectiveness of internal control over financial reporting based on the framework in Internal Control—Integrated Framework (2013) issued by the Committee of Sponsoring Organizations of the Treadway Commission (COSO). Based on this evaluation, management concluded that the Company's internal control over financial reporting was effective as of December 31, 2022.
Deloitte & Touche LLP, an independent registered public accounting firm, has audited the effectiveness of the Company’s internal control over financial reporting as of December 31, 2022, as stated in their report which is included herein.
Changes in Internal Control over Financial Reporting
During the last fiscal quarter of the period covered by this report, there were no changes in our internal controls over financial reporting that have materially affected or are reasonably likely to materially affect such controls.
Inherent Limitations on Effectiveness of Controls
An effective internal control system, no matter how well designed, has inherent limitations, including the possibility of human error or overriding of controls, and therefore can provide only reasonable assurance with respect to reliable financial reporting. Because of its inherent limitations, our internal control over financial reporting may not prevent or detect all misstatements, including the possibility of human error, the circumvention or overriding of controls, or fraud. Effective internal controls can provide only reasonable assurance with respect to the preparation and fair presentation of financial statements.
| Item 9B. |
Other Information. |
None.
| Item 9C. |
Disclosure Regarding Foreign Jurisdictions that Prevent Inspections |
Not applicable.
PART III
| Item 10. |
Directors, Executive Officers, and Corporate Governance. |
Information regarding our executive officers is included in Part I of this Form 10-K under the heading “Information about our Executive Officers.”
The Code of Ethics is available on the “Corporate Responsibility” portion of the Company's website under the “Policies and Charters” link. The Company's website address is www.theshyftgroup.com.
The information required by this item is incorporated by reference from our definitive proxy statement for the 2023 Annual Meeting of Shareholders.
| Item 11. |
Executive Compensation. |
The information required by this item is incorporated by reference from our definitive proxy statement for the 2023 Annual Meeting of Shareholders.
| Item 12. |
Security Ownership of Certain Beneficial Owners and Management and Related Stockholder Matters. |
The information required by this item (other than as set forth below) is incorporated by reference from our definitive proxy statement for the 2023 Annual Meeting of Shareholders.
The following table provides information about our equity compensation plans regarding the number of securities to be issued under these plans upon the exercise of outstanding options, the weighted-average exercise prices of options outstanding under these plans, and the number of securities available for future issuance as of December 31, 2022.
| Equity Compensation Plan Information |
|||||||||||||
| Plan category |
Number of securities to exercise options, rights (a) |
Weighted average |
Number of securities equity compensation plans (excluding securities reflected in column (a)) (4) |
||||||||||
| Equity compensation plans approved by security holders (1) |
681,872 | N/A (3) | 1,150,734 | ||||||||||
| Equity compensation plans not approved by security holders (2) |
- | N/A | 53,471 | ||||||||||
| Total |
681,872 | N/A | 1,204,205 | ||||||||||
| (1) |
Consists of The Shyft Group, Inc. Stock Incentive Plan of 2016 (the “2016 Plan”). See “Note 14 – Stock-Based Compensation” for more information regarding this plan. |
| (2) |
Consists of The Shyft Group, Inc. Directors’ Stock Purchase Plan. This plan provides that non-employee directors of the Company may elect to receive at least 25% and up to 100% of their “director’s fees” in the form of the Company’s common stock. The term “director’s fees” means the amount of income payable to a non-employee director for his or her service as a director of the Company, including payments for attendance at meetings of the Company’s Board of Directors or meetings of committees of the Board, and any retainer fee paid to such persons as members of the Board. A non-employee director who elects to receive Company common stock in lieu of some or all of his or her director’s fees will, on or shortly after each “applicable date,” receive a number of shares of common stock (rounded down to the nearest whole share) determined by dividing (1) the dollar amount of the director’s fees payable to him or her on the applicable date that he or she has elected to receive in common stock by (2) the market value of common stock on the applicable date. The term “applicable date” means any date on which a director’s fee is payable to the participant. 2,779 shares have been issued under this plan. |
| (3) | The number of shares reflected in column (a) in the table above represents shares issuable pursuant to outstanding PSUs and RSUs, for which there is no exercise price. |
| (4) | Each of the plans reflected in the above table contains customary anti-dilution provisions that are applicable in the event of a stock split or certain other changes in the Company’s capitalization. In addition, the 2016 Plan provides that if a stock option is canceled, surrendered, modified, expires or is terminated during the term of the plan but before the exercise of the option, the shares subject to the option will be available for other awards under the plan. |
| The numbers of shares reflected in column (c) in the table above with respect to the 2016 Plan represent new shares that may be granted by the Company, and not shares issuable upon the exercise of an existing option, warrant or right. |
| Item 13. |
Certain Relationships and Related Transactions, and Director Independence. |
The information required by this item is incorporated by reference from our definitive proxy statement for the 2023 Annual Meeting of Shareholders.
| Item 14. |
Principal Accountant Fees and Services. |
The information required by this item about aggregate fees billed to us by our principal accountant, Deloitte & Touche LLP [PCAOB ID No.
PART IV
| Item 15. |
Exhibits, Financial Statement Schedules. |
| Item 15(a)(1). |
List of Financial Statements. |
The following consolidated financial statements of the Company and its subsidiaries, and reports of our registered independent public accounting firm, are filed as a part of this report under Item 8 - Financial Statements and Supplementary Data:
| Independent Registered Public Accounting Firm’s Report on Consolidated Financial Statements and Internal Control over Financial Reporting – Year Ended December 31, 2022 and 2021 | ||
| Independent Registered Public Accounting Firm’s Report on Consolidated Financial Statements – Year Ended December 31, 2020 (BDO USA, LLP; Grand Rapids, Michigan; PCAOB ID # |
||
| Consolidated Balance Sheets – December 31, 2022 and December 31, 2021 | ||
| Consolidated Statements of Operations – Years Ended December 31, 2022, 2021 and 2020 | ||
| Consolidated Statements of Shareholders’ Equity – Years Ended December 31, 2022, 2021 and 2020 | ||
| Consolidated Statements of Cash Flows – Years Ended December 31, 2022, 2021 and 2020 | ||
| Notes to Consolidated Financial Statements | ||
| Item 15(a)(2). |
Financial Statement Schedules. Attached as Appendix A. |
The following consolidated financial statement schedule of the Company and its subsidiaries is filed as part of this report:
| Schedule II-Valuation and Qualifying Accounts |
All other financial statement schedules are not required under the related instructions or are inapplicable and therefore have been omitted.
| Item 15(a)(3). |
List of Exhibits. The following exhibits are filed as a part of this report: |
| Exhibit Number |
||
| 32 |
||
| 101.INS |
Inline XBRL Instance Document (the Instance Document does not appear in the Interactive Data File because its XBRL tags are embedded within the Inline XBRL document) |
|
| 101.SCH |
Inline XBRL Taxonomy Extension Schema Document |
|
| 101.CAL |
Inline XBRL Taxonomy Extension Calculation Linkbase Document |
|
| 101.DEF | Inline XBRL Taxonomy Extension Definition Linkbase Document | |
| 101.LAB | Inline XBRL Taxonomy Extension Label Linkbase Document | |
| 101.PRE | Inline XBRL Taxonomy Extension Presentation Linkbase Document | |
| 104 |
Cover Page Interactive Data File (Embedded within the Inline XBRL document and included in Exhibit 101) |
_________________________
*Management contract or compensatory plan or arrangement.
The Company will furnish a copy of any exhibit listed above to any shareholder of the Company without charge upon written request to: Chief Financial Officer, The Shyft Group, Inc., 41280 Bridge Street, Novi, Michigan 48375.
| Item 16. |
Form 10-K Summary |
None.
SIGNATURES
Pursuant to the requirements of Section 13 or 15(d) of the Securities Exchange Act of 1934, the registrant has duly caused this report to be signed on its behalf by the undersigned, thereunto duly authorized.
|
|
THE SHYFT GROUP, INC. |
|
|
|
|
|
| February 23, 2023 |
By |
/s/ Jonathan C. Douyard |
|
|
|
Jonathan C. Douyard (Principal Financial Officer) |
Pursuant to the requirements of the Securities Exchange Act of 1934, this report has been signed below by the following persons on behalf of the registrant and in the capacities and on the dates indicated.
| February 23, 2023 | By |
/s/ Daryl M. Adams |
|
|
|
Daryl M. Adams Director, President and Chief Executive Officer |
|
|
|
|
| February 23, 2023 | By |
/s/ Jonathan C. Douyard |
|
|
|
Jonathan C. Douyard (Principal Financial Officer) |
| February 23, 2023 | By | /s/ Scott M. Ocholik |
|
|
|
Scott M. Ocholik Vice President, Chief Accounting Officer and Corporate Controller (Principal Accounting Officer) |
| February 23, 2023 | By |
/s/ James A. Sharman |
|
|
|
James A. Sharman, Director |
|
|
|
|
| February 23, 2023 | By |
/s/ Thomas R. Clevinger |
|
|
|
Thomas R. Clevinger, Director |
| February 23, 2023 | By |
/s/ Michael Dinkins |
|
|
|
Michael Dinkins, Director |
|
|
|
|
| February 23, 2023 | By |
/s/ Carl Esposito |
|
|
|
Carl Esposito, Director |
|
|
|
|
| February 23, 2023 | By |
/s/ Angela K. Freeman |
|
|
|
Angela K. Freeman, Director |
|
|
|
|
| February 23, 2023 | By |
/s/ Paul A. Mascarenas |
|
|
|
Paul A. Mascarenas, Director |
|
|
|
|
| February 23, 2023 | By |
/s/ Terri Pizzuto |
|
|
|
Terri Pizzuto, Director |
|
|
|
|
| February 23, 2023 | By |
/s/ Mark Rourke |
|
|
|
Mark Rourke, Director |
APPENDIX A
SCHEDULE II
VALUATION AND QUALIFYING ACCOUNTS
THE SHYFT GROUP, INC. AND SUBSIDIARIES
| Column A |
Column B |
Column C |
Column D |
Column E |
||||||||||||||||
| Description |
Balance at |
Additions |
Additions |
Deductions |
Balance |
|||||||||||||||
| Year ended December 31, 2022: | ||||||||||||||||||||
| Allowance for doubtful accounts | $ | $ | $ | $ | ( |
) | $ | |||||||||||||
| Year ended December 31, 2021: |
||||||||||||||||||||
| Allowance for doubtful accounts |
$ | $ | $ | $ | ( |
) | $ | |||||||||||||
| Year ended December 31, 2020: |
||||||||||||||||||||
| Allowance for doubtful accounts |
$ | $ | $ | $ | ( |
) |
$ | |||||||||||||

