false--12-31Q220190000732712750000000765000000745000000P5YP2Y0.591.180.60251.2050.10.162500000006250000000429143364642914336460004100000000.003300.00450.038750.0590.013750.01750.030.0350.050.05150.011750.008750.012500.0250.026250.08750.035000.040160.046720.050120.010030P13YP25YP7YP8YP2YP3Y15000000004000000200000022100000000232000000000100000002000000550000001250000001930000001980000001300000060000003000000200000058000000118000000560000001120000000.10.125000000025000000000P5YP6MP1Y159400267155668837P1YP2YP2YP30Y35000000000
0000732712
2019-01-01
2019-06-30
0000732712
exch:XNYM
vz:A1.375NotesDue2028Member
2019-01-01
2019-06-30
0000732712
exch:XNYM
vz:A0.500NotesDue2022Member
2019-01-01
2019-06-30
0000732712
exch:XNYM
vz:A4.073NotesDue2024Member
2019-01-01
2019-06-30
0000732712
exch:XNYM
vz:A2.875NotesDue2038Member
2019-01-01
2019-06-30
0000732712
exch:XNYM
vz:A0.875NotesDue2027Member
2019-01-01
2019-06-30
0000732712
exch:XNYM
vz:A1.625NotesDue2024Member
2019-01-01
2019-06-30
0000732712
exch:XNYM
vz:A2.500NotesDue2031Member
2019-01-01
2019-06-30
0000732712
exch:XNYM
vz:A2.625NotesDue2031Member
2019-01-01
2019-06-30
0000732712
exch:XNYM
us-gaap:CommonStockMember
2019-01-01
2019-06-30
0000732712
exch:XNYM
vz:A3.375NotesDue2036Member
2019-01-01
2019-06-30
0000732712
exch:XNYM
vz:A1.875NotesDue2029Member
2019-01-01
2019-06-30
0000732712
exch:XNGS
us-gaap:CommonStockMember
2019-01-01
2019-06-30
0000732712
exch:XNYM
vz:A3.125NotesDue2035Member
2019-01-01
2019-06-30
0000732712
exch:XNYM
vz:A0.875NotesDue2025Member
2019-01-01
2019-06-30
0000732712
exch:XNYM
vz:A1.250NotesDue2030Member
2019-01-01
2019-06-30
0000732712
exch:XNYM
vz:A4.75NotesDue2034Member
2019-01-01
2019-06-30
0000732712
exch:XNYM
vz:A2.375NotesDue2022Member
2019-01-01
2019-06-30
0000732712
exch:XNYM
vz:A1.375NotesDue2026Member
2019-01-01
2019-06-30
0000732712
exch:XNYM
vz:A3.25NotesDue2026Member
2019-01-01
2019-06-30
0000732712
2019-06-30
0000732712
2018-01-01
2018-06-30
0000732712
2019-04-01
2019-06-30
0000732712
2018-04-01
2018-06-30
0000732712
us-gaap:ProductMember
2018-01-01
2018-06-30
0000732712
us-gaap:ProductMember
2019-04-01
2019-06-30
0000732712
us-gaap:ProductMember
2019-01-01
2019-06-30
0000732712
us-gaap:ServiceMember
2019-04-01
2019-06-30
0000732712
us-gaap:ServiceMember
2019-01-01
2019-06-30
0000732712
vz:ServiceAndOtherMember
2018-04-01
2018-06-30
0000732712
vz:ServiceAndOtherMember
2018-01-01
2018-06-30
0000732712
us-gaap:ServiceMember
2018-04-01
2018-06-30
0000732712
vz:ServiceAndOtherMember
2019-01-01
2019-06-30
0000732712
us-gaap:ProductMember
2018-04-01
2018-06-30
0000732712
us-gaap:ServiceMember
2018-01-01
2018-06-30
0000732712
vz:ServiceAndOtherMember
2019-04-01
2019-06-30
0000732712
2018-12-31
0000732712
2018-06-30
0000732712
2017-12-31
0000732712
us-gaap:PrepaidExpensesAndOtherCurrentAssetsMember
2018-12-31
0000732712
us-gaap:OtherAssetsMember
2019-06-30
0000732712
us-gaap:OtherAssetsMember
2019-01-01
2019-06-30
0000732712
us-gaap:OtherAssetsMember
2018-12-31
0000732712
us-gaap:PrepaidExpensesAndOtherCurrentAssetsMember
2019-06-30
0000732712
us-gaap:PrepaidExpensesAndOtherCurrentAssetsMember
2019-01-01
2019-06-30
0000732712
2019-01-01
0000732712
us-gaap:AccountingStandardsUpdate201602Member
2019-01-01
0000732712
us-gaap:AccountingStandardsUpdate201602Member
us-gaap:RetainedEarningsMember
2019-01-01
0000732712
2018-01-01
0000732712
vz:WirelineConsumerAndSmallAndMediumBusinessContractsMember
2018-06-30
0000732712
vz:MediaBusinessMember
2018-01-01
2018-06-30
0000732712
2021-01-01
2019-06-30
0000732712
vz:MediaBusinessMember
2019-01-01
2019-06-30
0000732712
2019-04-01
2019-06-30
0000732712
vz:MediaBusinessMember
2018-04-01
2018-06-30
0000732712
vz:CustomerContractsThatHaveContractMinimumOverTotalContractTermMember
2019-07-01
2019-06-30
0000732712
srt:MaximumMember
vz:VerizonBusinessGroupMember
2019-01-01
2019-06-30
0000732712
vz:MediaBusinessMember
2019-04-01
2019-06-30
0000732712
2020-01-01
2019-06-30
0000732712
vz:WirelessPostpaidContractsMember
2019-06-30
0000732712
vz:WirelessPostpaidContractsMember
2018-06-30
0000732712
vz:VerizonConsumerGroupMember
2019-01-01
2019-06-30
0000732712
us-gaap:OtherLiabilitiesMember
2019-06-30
0000732712
us-gaap:OtherLiabilitiesMember
2018-12-31
0000732712
us-gaap:OtherCurrentLiabilitiesMember
2018-12-31
0000732712
us-gaap:OtherCurrentLiabilitiesMember
2019-06-30
0000732712
srt:MinimumMember
2019-06-30
0000732712
srt:MaximumMember
2019-06-30
0000732712
2019-07-01
2019-06-30
0000732712
vz:SpectrumLicensesMember
2019-01-01
2019-06-30
0000732712
vz:SpectrumLicenses24GHzMember
2019-01-01
2019-06-30
0000732712
vz:SpectrumLicenses28GHzMember
2019-01-01
2019-06-30
0000732712
vz:WirelessLicensesMember
2019-06-30
0000732712
vz:WirelessLicensesMember
2018-06-30
0000732712
vz:WirelessLicensesMember
2019-01-01
2019-06-30
0000732712
vz:WirelessLicensesMember
2018-01-01
2018-06-30
0000732712
us-gaap:CustomerListsMember
2019-06-30
0000732712
us-gaap:CustomerListsMember
2018-12-31
0000732712
vz:NonNetworkInternalUseSoftwareMember
2018-12-31
0000732712
us-gaap:OtherIntangibleAssetsMember
2019-06-30
0000732712
vz:NonNetworkInternalUseSoftwareMember
2019-06-30
0000732712
us-gaap:OtherIntangibleAssetsMember
2018-12-31
0000732712
2019-04-02
2019-06-30
0000732712
us-gaap:OperatingSegmentsMember
vz:VerizonBusinessGroupMember
2019-04-02
2019-06-30
0000732712
us-gaap:OperatingSegmentsMember
vz:WirelineMember
2019-03-31
0000732712
us-gaap:OperatingSegmentsMember
vz:VerizonBusinessGroupMember
2019-04-01
0000732712
us-gaap:OperatingSegmentsMember
vz:WirelessMember
2019-03-31
0000732712
us-gaap:OperatingSegmentsMember
vz:VerizonConsumerGroupMember
2019-04-02
2019-06-30
0000732712
us-gaap:OperatingSegmentsMember
vz:WirelineMember
2019-01-01
2019-03-31
0000732712
us-gaap:OperatingSegmentsMember
vz:VerizonBusinessGroupMember
2019-06-30
0000732712
us-gaap:OperatingSegmentsMember
vz:VerizonConsumerGroupMember
2019-04-01
0000732712
us-gaap:OperatingSegmentsMember
vz:VerizonBusinessGroupMember
2019-04-01
2019-04-01
0000732712
us-gaap:OperatingSegmentsMember
vz:VerizonConsumerGroupMember
2019-06-30
0000732712
us-gaap:CorporateNonSegmentMember
2018-12-31
0000732712
2019-01-01
2019-03-31
0000732712
us-gaap:OperatingSegmentsMember
vz:WirelineMember
2019-04-01
2019-04-01
0000732712
us-gaap:CorporateNonSegmentMember
2019-04-01
2019-04-01
0000732712
us-gaap:OperatingSegmentsMember
vz:VerizonConsumerGroupMember
2019-04-01
2019-04-01
0000732712
2019-04-01
0000732712
us-gaap:OperatingSegmentsMember
2019-04-02
2019-06-30
0000732712
us-gaap:CorporateNonSegmentMember
2019-01-01
2019-03-31
0000732712
2019-03-31
0000732712
us-gaap:OperatingSegmentsMember
vz:WirelessMember
2019-01-01
2019-03-31
0000732712
us-gaap:CorporateNonSegmentMember
2019-04-02
2019-06-30
0000732712
us-gaap:OperatingSegmentsMember
vz:WirelessMember
2018-12-31
0000732712
us-gaap:OperatingSegmentsMember
vz:WirelessMember
2019-04-01
2019-04-01
0000732712
us-gaap:CorporateNonSegmentMember
2019-03-31
0000732712
us-gaap:CorporateNonSegmentMember
2019-06-30
0000732712
us-gaap:OperatingSegmentsMember
vz:WirelineMember
2018-12-31
0000732712
us-gaap:CorporateNonSegmentMember
2019-04-01
0000732712
srt:MinimumMember
us-gaap:CustomerListsMember
2019-01-01
2019-06-30
0000732712
srt:MaximumMember
us-gaap:CustomerListsMember
2019-01-01
2019-06-30
0000732712
srt:MaximumMember
us-gaap:OtherIntangibleAssetsMember
2019-01-01
2019-06-30
0000732712
srt:MinimumMember
vz:NonNetworkInternalUseSoftwareMember
2019-01-01
2019-06-30
0000732712
srt:MaximumMember
vz:NonNetworkInternalUseSoftwareMember
2019-01-01
2019-06-30
0000732712
srt:MinimumMember
us-gaap:OtherIntangibleAssetsMember
2019-01-01
2019-06-30
0000732712
us-gaap:SubsequentEventMember
2019-07-23
2019-07-23
0000732712
srt:MinimumMember
2019-01-01
2019-06-30
0000732712
vz:TowerMonetizationTransactionMember
2015-03-31
0000732712
vz:TowerMonetizationTransactionMember
2015-03-01
2015-03-31
0000732712
srt:MaximumMember
2019-01-01
2019-06-30
0000732712
vz:A3.875NotesDue2029Member
2019-01-01
2019-03-31
0000732712
vz:A1.250NotesDue2030Member
2019-06-30
0000732712
vz:A2.500NotesDue2031Member
2019-06-30
0000732712
vz:A3.875NotesDue2029Member
2019-03-31
0000732712
vz:A0.875NotesDue2027Member
2019-04-01
2019-06-30
0000732712
vz:Verizon5.000NotesDue2051Member
2019-03-31
0000732712
vz:A1.250NotesDue2030Member
2019-04-01
2019-06-30
0000732712
vz:Verizon5.000NotesDue2051Member
2019-01-01
2019-03-31
0000732712
vz:A2.500NotesDue2031Member
2019-04-01
2019-06-30
0000732712
vz:A0.875NotesDue2027Member
2019-06-30
0000732712
vz:AssetBackedNotesJune2019Member
vz:ClassCJuniorSecuredNotesMember
2019-06-30
0000732712
vz:AssetBackedNotesJune2019Member
vz:ClassBJuniorSecuredNotesMember
2019-06-01
2019-06-30
0000732712
vz:AssetBackedNotesJune2019Member
vz:ClassA1aSeniorSecuredNotesMember
2019-06-01
2019-06-30
0000732712
vz:AssetBackedNotesMarch2019Member
vz:ClassA1aSeniorSecuredNotesMember
2019-03-31
0000732712
vz:AssetBackedNotesMember
2019-06-30
0000732712
vz:AssetBackedNotesJune2019Member
vz:ClassBJuniorSecuredNotesMember
2019-06-30
0000732712
vz:AssetBackedNotesMarch2019Member
2019-03-31
0000732712
vz:AssetBackedNotesMarch2019Member
vz:ClassCJuniorSecuredNotesMember
2019-03-01
2019-03-31
0000732712
vz:AssetBackedNotesMarch2019Member
vz:ClassA1aSeniorSecuredNotesMember
2019-03-01
2019-03-31
0000732712
vz:AssetBackedNotesMarch2019Member
vz:ClassA1bSeniorSecuredNotesMember
2019-03-01
2019-03-31
0000732712
vz:AssetBackedNotesJune2019Member
vz:ClassA1bSeniorSecuredNotesMember
2019-06-30
0000732712
vz:AssetBackedNotesJune2019Member
vz:ClassA1aSeniorSecuredNotesMember
2019-06-30
0000732712
vz:AssetBackedNotesMarch2019Member
vz:ClassBJuniorSecuredNotesMember
2019-03-31
0000732712
vz:AssetBackedNotesJune2019Member
2019-06-30
0000732712
vz:AssetBackedNotesJune2019Member
vz:ClassCJuniorSecuredNotesMember
2019-06-01
2019-06-30
0000732712
vz:AssetBackedNotesJune2019Member
vz:ClassA1bSeniorSecuredNotesMember
2019-06-01
2019-06-30
0000732712
vz:AssetBackedNotesMarch2019Member
vz:ClassA1bSeniorSecuredNotesMember
2019-03-31
0000732712
vz:AssetBackedNotesMarch2019Member
vz:ClassCJuniorSecuredNotesMember
2019-03-31
0000732712
vz:AssetBackedNotesMarch2019Member
vz:ClassBJuniorSecuredNotesMember
2019-03-01
2019-03-31
0000732712
vz:LongtermDebtCurrentMember
2019-06-30
0000732712
us-gaap:LongTermDebtMember
2019-06-30
0000732712
us-gaap:AccountsPayableAndAccruedLiabilitiesMember
2019-06-30
0000732712
vz:LongtermDebtCurrentMember
2018-12-31
0000732712
us-gaap:AccountsPayableAndAccruedLiabilitiesMember
2018-12-31
0000732712
us-gaap:AccountsReceivableMember
2019-06-30
0000732712
us-gaap:LongTermDebtMember
2018-12-31
0000732712
us-gaap:AccountsReceivableMember
2018-12-31
0000732712
vz:Verizon1.750To5.150NotesAndFloatingRateNotesDue2021To2025Member
vz:February2019ExchangeOffersMember
2019-06-30
0000732712
vz:February2019ExchangeOffersMember
2019-06-30
0000732712
vz:GTELLC8.750DebenturesDue2021Member
vz:February2019ExchangeOffersMember
2019-06-30
0000732712
vz:Verizon4.016NotesDue2029Member
vz:February2019ExchangeOffersMember
2019-06-30
0000732712
vz:Verizon5.012NotesDue2054Member
vz:May2019TenderOffersMember
2019-06-30
0000732712
vz:May2019TenderOffersMember
2019-06-30
0000732712
vz:Verizon4.672NotesDue2055Member
vz:May2019TenderOffersMember
2019-06-30
0000732712
vz:March2018TenderOffersMember
2018-01-01
2018-06-30
0000732712
vz:EquipmentCreditFacilitiesMember
2019-04-01
2019-06-30
0000732712
vz:ShortTermUncommittedCreditFacilityMember
2019-06-30
0000732712
vz:VendorFinancingFacilityMember
vz:NetworkEquipmentMember
2018-06-30
0000732712
vz:EquipmentCreditFacilitiesMember
2018-01-01
2018-06-30
0000732712
vz:A2019ABSFinancingFacilityMember
us-gaap:SubsequentEventMember
2019-08-01
2019-08-08
0000732712
vz:A2019ABSFinancingFacilityMember
2019-04-01
2019-06-30
0000732712
srt:MinimumMember
vz:Verizon1.750To5.012NotesDue2021To2055Member
vz:March2018TenderOffersMember
2018-06-30
0000732712
vz:EquipmentCreditFacilitiesMember
2019-01-01
2019-06-30
0000732712
vz:May2019TenderOffersMember
2019-04-01
2019-06-30
0000732712
vz:EquipmentCreditFacilitiesMember
2019-06-30
0000732712
vz:AssetBackedDebtMember
2019-06-30
0000732712
vz:EquipmentCreditFacilitiesMember
vz:NetworkEquipmentMember
2019-06-30
0000732712
vz:VendorFinancingFacilityMember
vz:NetworkEquipmentMember
2019-06-30
0000732712
vz:VendorFinancingFacilityMember
vz:NetworkEquipmentMember
2019-01-01
2019-06-30
0000732712
vz:GuaranteeOfDebtObligationsOfGeneralTelephoneAndElectronicsCorporationMember
2019-06-30
0000732712
vz:A2018ABSFinancingFacilityMember
2019-04-01
2019-06-30
0000732712
vz:EquipmentCreditFacilitiesMember
vz:NetworkEquipmentMember
2016-03-31
0000732712
vz:AssetBackedNotesMember
us-gaap:SecuredDebtMember
2019-01-01
2019-06-30
0000732712
vz:A2019ABSFinancingFacilityMember
2019-01-01
2019-06-30
0000732712
srt:MaximumMember
vz:Verizon1.750To5.012NotesDue2021To2055Member
vz:March2018TenderOffersMember
2018-06-30
0000732712
vz:A2019ABSFinancingFacilityMember
2019-06-30
0000732712
vz:ShortTermUncommittedCreditFacilityMember
2019-04-01
2019-06-30
0000732712
vz:GuaranteeOfDebenturesOfOperatingTelephoneCompanySubsidiariesMember
2019-06-30
0000732712
vz:AssetBackedNotesMember
us-gaap:SecuredDebtMember
2019-04-01
2019-06-30
0000732712
vz:AssetBackedNotesMember
vz:ClassA1bSeniorSecuredNotesMember
2019-06-30
0000732712
vz:EquipmentCreditFacilitiesMember
2017-07-31
0000732712
vz:VendorFinancingFacilityMember
vz:NetworkEquipmentMember
2018-01-01
2018-06-30
0000732712
vz:A2.625NotesDue2020Member
vz:June2019Member
2019-04-01
2019-06-30
0000732712
vz:Verizon1.750NotesDue2021Member
vz:March2019Member
2019-03-31
0000732712
vz:A5.900NotesDue2054Member
vz:March2019Member
2019-03-31
0000732712
vz:June2019Member
2019-06-30
0000732712
vz:A5.900NotesDue2054Member
vz:March2019Member
2019-01-01
2019-03-31
0000732712
vz:Verizon1.375NotesDue2019Member
vz:March2019Member
2019-03-31
0000732712
vz:Verizon3.500NotesDue2021Member
vz:March2019Member
2019-03-31
0000732712
vz:Verizon1.750NotesDue2021Member
vz:March2019Member
2019-01-01
2019-03-31
0000732712
vz:VerizonFloatingRateNotesDue2019LIBORPlus0.770Member
vz:June2019Member
2019-04-01
2019-06-30
0000732712
vz:Verizon1.375NotesDue2019Member
vz:March2019Member
2019-01-01
2019-03-31
0000732712
vz:March2019Member
2019-03-31
0000732712
vz:Verizon3.500NotesDue2021Member
vz:June2019Member
2019-06-30
0000732712
vz:VerizonFloatingRateNotesDue2019LIBORPlus0.770Member
vz:June2019Member
2019-06-30
0000732712
vz:Verizon3.000NotesDue2021Member
vz:March2019Member
2019-03-31
0000732712
vz:A2.625NotesDue2020Member
vz:June2019Member
2019-06-30
0000732712
vz:VariousVerizonNotesOfOpenMarketRepurchaseMember
vz:March2019Member
2019-03-31
0000732712
vz:Verizon3.000NotesDue2021Member
vz:March2019Member
2019-01-01
2019-03-31
0000732712
vz:Verizon3.500NotesDue2021Member
vz:June2019Member
2019-04-01
2019-06-30
0000732712
vz:Verizon3.500NotesDue2021Member
vz:March2019Member
2019-01-01
2019-03-31
0000732712
srt:MinimumMember
vz:Verizon1.750To5.150NotesAndFloatingRateNotesDue2021To2025Member
vz:February2019ExchangeOffersMember
2019-06-30
0000732712
srt:MaximumMember
vz:Verizon1.750To5.150NotesAndFloatingRateNotesDue2021To2025Member
vz:February2019ExchangeOffersMember
2019-06-30
0000732712
vz:AssetBackedNotesMember
2019-01-01
2019-06-30
0000732712
vz:A2018ABSFinancingFacilityMember
2019-01-01
2019-06-30
0000732712
vz:Verizon1.375NotesDue2019Member
2019-03-31
0000732712
vz:VerizonFloatingRateNotesDue2019LIBORPlus0.770Member
2019-06-30
0000732712
vz:A5.900NotesDue2054Member
2019-03-31
0000732712
vz:A2.625NotesDue2020Member
2019-06-30
0000732712
vz:Verizon1.750NotesDue2021Member
2019-03-31
0000732712
vz:Verizon3.000NotesDue2021Member
2019-03-31
0000732712
vz:Verizon3.500NotesDue2021Member
2019-03-31
0000732712
vz:Verizon3.500NotesDue2021Member
2019-06-30
0000732712
vz:AssetBackedNotesMarch2019Member
vz:ClassA1bSeniorSecuredNotesMember
us-gaap:LondonInterbankOfferedRateLIBORMember
2019-03-01
2019-03-31
0000732712
vz:AssetBackedNotesJune2019Member
vz:ClassA1bSeniorSecuredNotesMember
us-gaap:LondonInterbankOfferedRateLIBORMember
2019-06-01
2019-06-30
0000732712
vz:ProductTradeInMember
2018-12-31
0000732712
vz:ProductTradeInMember
2019-06-30
0000732712
us-gaap:BilledRevenuesMember
2019-06-30
0000732712
us-gaap:BilledRevenuesMember
2018-12-31
0000732712
us-gaap:UnbilledRevenuesMember
2019-06-30
0000732712
us-gaap:UnbilledRevenuesMember
2018-12-31
0000732712
us-gaap:LongTermDebtMember
us-gaap:FairValueHedgingMember
2019-06-30
0000732712
us-gaap:LongTermDebtMember
us-gaap:FairValueHedgingMember
2018-12-31
0000732712
us-gaap:ForeignExchangeForwardMember
us-gaap:FairValueHedgingMember
2019-04-01
2019-06-30
0000732712
us-gaap:InterestRateSwapMember
us-gaap:FairValueHedgingMember
2019-01-01
2019-06-30
0000732712
us-gaap:CurrencySwapMember
us-gaap:CashFlowHedgingMember
2019-04-01
2019-06-30
0000732712
us-gaap:ForeignExchangeForwardMember
us-gaap:FairValueHedgingMember
2019-01-01
2019-06-30
0000732712
vz:ForwardStartingInterestRateSwapsMember
us-gaap:CashFlowHedgingMember
2019-04-01
2019-06-30
0000732712
vz:EuroDenominatedDebtMember
us-gaap:NetInvestmentHedgingMember
2019-06-30
0000732712
us-gaap:CurrencySwapMember
us-gaap:CashFlowHedgingMember
2018-04-01
2018-06-30
0000732712
us-gaap:CurrencySwapMember
us-gaap:CashFlowHedgingMember
2019-01-01
2019-06-30
0000732712
vz:ForwardStartingInterestRateSwapsMember
us-gaap:CashFlowHedgingMember
2019-01-01
2019-06-30
0000732712
us-gaap:FairValueInputsLevel1Member
us-gaap:FixedIncomeSecuritiesMember
2019-06-30
0000732712
us-gaap:FairValueInputsLevel1Member
vz:ForwardStartingInterestRateSwapsMember
2019-06-30
0000732712
us-gaap:FairValueInputsLevel1Member
us-gaap:CurrencySwapMember
2019-06-30
0000732712
us-gaap:CurrencySwapMember
2019-06-30
0000732712
us-gaap:InterestRateCapMember
2019-06-30
0000732712
us-gaap:ForeignExchangeForwardMember
2019-06-30
0000732712
us-gaap:FairValueInputsLevel3Member
us-gaap:InterestRateSwapMember
2019-06-30
0000732712
us-gaap:FairValueInputsLevel3Member
us-gaap:ForeignExchangeForwardMember
2019-06-30
0000732712
us-gaap:FairValueInputsLevel1Member
us-gaap:InterestRateSwapMember
2019-06-30
0000732712
us-gaap:FairValueInputsLevel3Member
us-gaap:InterestRateCapMember
2019-06-30
0000732712
us-gaap:FairValueInputsLevel2Member
us-gaap:FixedIncomeSecuritiesMember
2019-06-30
0000732712
us-gaap:FairValueInputsLevel2Member
vz:ForwardStartingInterestRateSwapsMember
2019-06-30
0000732712
us-gaap:FairValueInputsLevel3Member
2019-06-30
0000732712
us-gaap:FairValueInputsLevel1Member
2019-06-30
0000732712
us-gaap:FairValueInputsLevel2Member
2019-06-30
0000732712
us-gaap:FairValueInputsLevel1Member
us-gaap:InterestRateCapMember
2019-06-30
0000732712
vz:ForwardStartingInterestRateSwapsMember
2019-06-30
0000732712
us-gaap:FairValueInputsLevel3Member
us-gaap:CurrencySwapMember
2019-06-30
0000732712
us-gaap:InterestRateSwapMember
2019-06-30
0000732712
us-gaap:FairValueInputsLevel2Member
us-gaap:InterestRateCapMember
2019-06-30
0000732712
us-gaap:FairValueInputsLevel3Member
vz:ForwardStartingInterestRateSwapsMember
2019-06-30
0000732712
us-gaap:FairValueInputsLevel2Member
us-gaap:InterestRateSwapMember
2019-06-30
0000732712
us-gaap:FairValueInputsLevel2Member
us-gaap:CurrencySwapMember
2019-06-30
0000732712
us-gaap:FixedIncomeSecuritiesMember
2019-06-30
0000732712
us-gaap:FairValueInputsLevel1Member
us-gaap:ForeignExchangeForwardMember
2019-06-30
0000732712
us-gaap:FairValueInputsLevel2Member
us-gaap:ForeignExchangeForwardMember
2019-06-30
0000732712
us-gaap:FairValueInputsLevel3Member
us-gaap:FixedIncomeSecuritiesMember
2019-06-30
0000732712
us-gaap:CarryingReportedAmountFairValueDisclosureMember
2018-12-31
0000732712
us-gaap:EstimateOfFairValueFairValueDisclosureMember
2019-06-30
0000732712
us-gaap:CarryingReportedAmountFairValueDisclosureMember
2019-06-30
0000732712
us-gaap:EstimateOfFairValueFairValueDisclosureMember
2018-12-31
0000732712
us-gaap:FairValueInputsLevel3Member
2018-12-31
0000732712
us-gaap:FairValueInputsLevel2Member
us-gaap:InterestRateCapMember
2018-12-31
0000732712
us-gaap:FairValueInputsLevel2Member
us-gaap:CurrencySwapMember
2018-12-31
0000732712
us-gaap:FairValueInputsLevel1Member
us-gaap:InterestRateCapMember
2018-12-31
0000732712
vz:ForwardStartingInterestRateSwapsMember
2018-12-31
0000732712
us-gaap:FairValueInputsLevel3Member
us-gaap:CurrencySwapMember
2018-12-31
0000732712
us-gaap:FairValueInputsLevel2Member
us-gaap:InterestRateSwapMember
2018-12-31
0000732712
us-gaap:InterestRateCapMember
2018-12-31
0000732712
us-gaap:FairValueInputsLevel3Member
us-gaap:FixedIncomeSecuritiesMember
2018-12-31
0000732712
us-gaap:FairValueInputsLevel3Member
us-gaap:InterestRateSwapMember
2018-12-31
0000732712
us-gaap:FairValueInputsLevel1Member
us-gaap:FixedIncomeSecuritiesMember
2018-12-31
0000732712
us-gaap:FairValueInputsLevel2Member
2018-12-31
0000732712
us-gaap:FairValueInputsLevel1Member
vz:ForwardStartingInterestRateSwapsMember
2018-12-31
0000732712
us-gaap:FairValueInputsLevel3Member
us-gaap:InterestRateCapMember
2018-12-31
0000732712
us-gaap:InterestRateSwapMember
2018-12-31
0000732712
us-gaap:CurrencySwapMember
2018-12-31
0000732712
us-gaap:FixedIncomeSecuritiesMember
2018-12-31
0000732712
us-gaap:FairValueInputsLevel2Member
vz:ForwardStartingInterestRateSwapsMember
2018-12-31
0000732712
us-gaap:FairValueInputsLevel1Member
us-gaap:CurrencySwapMember
2018-12-31
0000732712
us-gaap:FairValueInputsLevel2Member
us-gaap:FixedIncomeSecuritiesMember
2018-12-31
0000732712
us-gaap:FairValueInputsLevel1Member
2018-12-31
0000732712
us-gaap:FairValueInputsLevel1Member
us-gaap:InterestRateSwapMember
2018-12-31
0000732712
us-gaap:FairValueInputsLevel3Member
vz:ForwardStartingInterestRateSwapsMember
2018-12-31
0000732712
us-gaap:InterestRateCapMember
2018-12-31
0000732712
us-gaap:CurrencySwapMember
2018-12-31
0000732712
us-gaap:InterestRateSwapMember
2019-06-30
0000732712
us-gaap:ForeignExchangeForwardMember
2018-12-31
0000732712
us-gaap:InterestRateCapMember
2019-06-30
0000732712
us-gaap:CurrencySwapMember
2019-06-30
0000732712
vz:ForwardStartingInterestRateSwapsMember
2019-06-30
0000732712
us-gaap:InterestRateSwapMember
2018-12-31
0000732712
us-gaap:ForeignExchangeForwardMember
2019-06-30
0000732712
vz:ForwardStartingInterestRateSwapsMember
2018-12-31
0000732712
vz:EuroDenominatedDebtMember
us-gaap:NetInvestmentHedgingMember
2018-12-31
0000732712
vz:A2018VoluntarySeparationProgramMember
2018-09-01
2018-09-30
0000732712
us-gaap:PensionPlansDefinedBenefitMember
2019-01-01
2019-06-30
0000732712
us-gaap:NonqualifiedPlanMember
us-gaap:PensionPlansDefinedBenefitMember
2019-04-01
2019-06-30
0000732712
us-gaap:QualifiedPlanMember
us-gaap:PensionPlansDefinedBenefitMember
2018-01-01
2018-06-30
0000732712
us-gaap:QualifiedPlanMember
us-gaap:PensionPlansDefinedBenefitMember
2019-01-01
2019-06-30
0000732712
us-gaap:SellingGeneralAndAdministrativeExpensesMember
us-gaap:PensionPlansDefinedBenefitMember
2018-01-01
2018-06-30
0000732712
vz:CostofServiceMember
us-gaap:OtherPostretirementBenefitPlansDefinedBenefitMember
2019-01-01
2019-06-30
0000732712
us-gaap:PensionPlansDefinedBenefitMember
2018-01-01
2018-06-30
0000732712
us-gaap:SellingGeneralAndAdministrativeExpensesMember
us-gaap:OtherPostretirementBenefitPlansDefinedBenefitMember
2019-01-01
2019-06-30
0000732712
us-gaap:OtherPostretirementBenefitPlansDefinedBenefitMember
2019-01-01
2019-06-30
0000732712
us-gaap:SellingGeneralAndAdministrativeExpensesMember
us-gaap:OtherPostretirementBenefitPlansDefinedBenefitMember
2018-01-01
2018-06-30
0000732712
us-gaap:OtherPostretirementBenefitPlansDefinedBenefitMember
2018-01-01
2018-06-30
0000732712
us-gaap:SellingGeneralAndAdministrativeExpensesMember
us-gaap:PensionPlansDefinedBenefitMember
2019-01-01
2019-06-30
0000732712
vz:CostofServiceMember
us-gaap:OtherPostretirementBenefitPlansDefinedBenefitMember
2018-01-01
2018-06-30
0000732712
vz:CostofServiceMember
us-gaap:PensionPlansDefinedBenefitMember
2018-01-01
2018-06-30
0000732712
vz:CostofServiceMember
us-gaap:PensionPlansDefinedBenefitMember
2019-01-01
2019-06-30
0000732712
us-gaap:OtherPostretirementBenefitPlansDefinedBenefitMember
2018-04-01
2018-06-30
0000732712
us-gaap:PensionPlansDefinedBenefitMember
2018-04-01
2018-06-30
0000732712
us-gaap:PensionPlansDefinedBenefitMember
2019-04-01
2019-06-30
0000732712
us-gaap:OtherPostretirementBenefitPlansDefinedBenefitMember
2019-04-01
2019-06-30
0000732712
us-gaap:SellingGeneralAndAdministrativeExpensesMember
us-gaap:OtherPostretirementBenefitPlansDefinedBenefitMember
2019-04-01
2019-06-30
0000732712
us-gaap:SellingGeneralAndAdministrativeExpensesMember
us-gaap:PensionPlansDefinedBenefitMember
2018-04-01
2018-06-30
0000732712
vz:CostofServiceMember
us-gaap:OtherPostretirementBenefitPlansDefinedBenefitMember
2019-04-01
2019-06-30
0000732712
us-gaap:SellingGeneralAndAdministrativeExpensesMember
us-gaap:OtherPostretirementBenefitPlansDefinedBenefitMember
2018-04-01
2018-06-30
0000732712
us-gaap:SellingGeneralAndAdministrativeExpensesMember
us-gaap:PensionPlansDefinedBenefitMember
2019-04-01
2019-06-30
0000732712
vz:CostofServiceMember
us-gaap:OtherPostretirementBenefitPlansDefinedBenefitMember
2018-04-01
2018-06-30
0000732712
vz:CostofServiceMember
us-gaap:PensionPlansDefinedBenefitMember
2019-04-01
2019-06-30
0000732712
vz:CostofServiceMember
us-gaap:PensionPlansDefinedBenefitMember
2018-04-01
2018-06-30
0000732712
us-gaap:NonqualifiedPlanMember
us-gaap:PensionPlansDefinedBenefitMember
2019-01-01
2019-06-30
0000732712
vz:StraightPathCommunicationsIncMember
2018-02-01
2018-02-28
0000732712
us-gaap:TreasuryStockMember
2018-12-31
0000732712
us-gaap:TreasuryStockMember
2019-01-01
2019-06-30
0000732712
us-gaap:TreasuryStockMember
2018-01-01
2018-06-30
0000732712
us-gaap:AccumulatedOtherComprehensiveIncomeMember
2019-01-01
2019-06-30
0000732712
us-gaap:AdditionalPaidInCapitalMember
2019-01-01
2019-06-30
0000732712
us-gaap:RetainedEarningsMember
2017-12-31
0000732712
us-gaap:NoncontrollingInterestMember
2017-12-31
0000732712
us-gaap:AccumulatedOtherComprehensiveIncomeMember
2018-12-31
0000732712
us-gaap:DeferredCompensationShareBasedPaymentsMember
2017-12-31
0000732712
us-gaap:NoncontrollingInterestMember
2019-01-01
2019-06-30
0000732712
us-gaap:NoncontrollingInterestMember
2018-12-31
0000732712
us-gaap:TreasuryStockMember
2017-12-31
0000732712
us-gaap:NoncontrollingInterestMember
2019-06-30
0000732712
us-gaap:RetainedEarningsMember
2018-12-31
0000732712
us-gaap:CommonStockMember
2019-01-01
2019-06-30
0000732712
us-gaap:CommonStockMember
2017-12-31
0000732712
us-gaap:AccumulatedOtherComprehensiveIncomeMember
2017-12-31
0000732712
us-gaap:CommonStockMember
2019-06-30
0000732712
us-gaap:AdditionalPaidInCapitalMember
2019-06-30
0000732712
us-gaap:TreasuryStockMember
2018-06-30
0000732712
us-gaap:AccumulatedOtherComprehensiveIncomeMember
2018-06-30
0000732712
us-gaap:NoncontrollingInterestMember
2018-06-30
0000732712
us-gaap:RetainedEarningsMember
2018-01-01
2018-06-30
0000732712
us-gaap:CommonStockMember
2018-12-31
0000732712
us-gaap:AccumulatedOtherComprehensiveIncomeMember
2018-01-01
2018-06-30
0000732712
us-gaap:DeferredCompensationShareBasedPaymentsMember
2019-01-01
2019-06-30
0000732712
us-gaap:DeferredCompensationShareBasedPaymentsMember
2018-01-01
2018-06-30
0000732712
us-gaap:NoncontrollingInterestMember
2018-01-01
2018-06-30
0000732712
us-gaap:CommonStockMember
2018-06-30
0000732712
us-gaap:AdditionalPaidInCapitalMember
2018-06-30
0000732712
us-gaap:RetainedEarningsMember
2019-01-01
2019-06-30
0000732712
us-gaap:AdditionalPaidInCapitalMember
2017-12-31
0000732712
us-gaap:AdditionalPaidInCapitalMember
2018-01-01
2018-06-30
0000732712
us-gaap:AccumulatedOtherComprehensiveIncomeMember
2019-06-30
0000732712
us-gaap:CommonStockMember
2018-01-01
2018-06-30
0000732712
us-gaap:DeferredCompensationShareBasedPaymentsMember
2018-06-30
0000732712
us-gaap:TreasuryStockMember
2019-06-30
0000732712
us-gaap:DeferredCompensationShareBasedPaymentsMember
2019-06-30
0000732712
us-gaap:DeferredCompensationShareBasedPaymentsMember
2018-12-31
0000732712
us-gaap:RetainedEarningsMember
2019-06-30
0000732712
us-gaap:AdditionalPaidInCapitalMember
2018-12-31
0000732712
us-gaap:RetainedEarningsMember
2018-06-30
0000732712
us-gaap:CommonStockMember
2018-04-01
2018-06-30
0000732712
us-gaap:AccumulatedOtherComprehensiveIncomeMember
2019-04-01
2019-06-30
0000732712
us-gaap:DeferredCompensationShareBasedPaymentsMember
2018-03-31
0000732712
us-gaap:RetainedEarningsMember
2019-04-01
2019-06-30
0000732712
us-gaap:TreasuryStockMember
2018-04-01
2018-06-30
0000732712
us-gaap:TreasuryStockMember
2019-04-01
2019-06-30
0000732712
us-gaap:CommonStockMember
2019-03-31
0000732712
us-gaap:AdditionalPaidInCapitalMember
2019-04-01
2019-06-30
0000732712
us-gaap:NoncontrollingInterestMember
2018-04-01
2018-06-30
0000732712
us-gaap:AccumulatedOtherComprehensiveIncomeMember
2018-04-01
2018-06-30
0000732712
us-gaap:AdditionalPaidInCapitalMember
2018-03-31
0000732712
us-gaap:TreasuryStockMember
2018-03-31
0000732712
us-gaap:TreasuryStockMember
2019-03-31
0000732712
us-gaap:RetainedEarningsMember
2018-04-01
2018-06-30
0000732712
us-gaap:CommonStockMember
2019-04-01
2019-06-30
0000732712
us-gaap:RetainedEarningsMember
2018-03-31
0000732712
us-gaap:AccumulatedOtherComprehensiveIncomeMember
2018-03-31
0000732712
us-gaap:NoncontrollingInterestMember
2019-04-01
2019-06-30
0000732712
us-gaap:NoncontrollingInterestMember
2018-03-31
0000732712
us-gaap:AdditionalPaidInCapitalMember
2018-04-01
2018-06-30
0000732712
us-gaap:DeferredCompensationShareBasedPaymentsMember
2019-04-01
2019-06-30
0000732712
us-gaap:NoncontrollingInterestMember
2019-03-31
0000732712
us-gaap:RetainedEarningsMember
2019-03-31
0000732712
us-gaap:AccumulatedOtherComprehensiveIncomeMember
2019-03-31
0000732712
us-gaap:DeferredCompensationShareBasedPaymentsMember
2018-04-01
2018-06-30
0000732712
us-gaap:AdditionalPaidInCapitalMember
2019-03-31
0000732712
us-gaap:CommonStockMember
2018-03-31
0000732712
us-gaap:DeferredCompensationShareBasedPaymentsMember
2019-03-31
0000732712
us-gaap:AccumulatedNetUnrealizedInvestmentGainLossMember
2018-12-31
0000732712
us-gaap:AccumulatedDefinedBenefitPlansAdjustmentMember
2018-12-31
0000732712
us-gaap:AccumulatedTranslationAdjustmentMember
2019-06-30
0000732712
us-gaap:AccumulatedDefinedBenefitPlansAdjustmentMember
2019-06-30
0000732712
us-gaap:AccumulatedTranslationAdjustmentMember
2019-01-01
2019-06-30
0000732712
us-gaap:AccumulatedTranslationAdjustmentMember
2018-12-31
0000732712
us-gaap:AccumulatedNetGainLossFromDesignatedOrQualifyingCashFlowHedgesMember
2019-06-30
0000732712
us-gaap:AccumulatedNetUnrealizedInvestmentGainLossMember
2019-01-01
2019-06-30
0000732712
us-gaap:AccumulatedNetUnrealizedInvestmentGainLossMember
2019-06-30
0000732712
us-gaap:AccumulatedDefinedBenefitPlansAdjustmentMember
2019-01-01
2019-06-30
0000732712
us-gaap:AccumulatedNetGainLossFromDesignatedOrQualifyingCashFlowHedgesMember
2019-01-01
2019-06-30
0000732712
us-gaap:AccumulatedNetGainLossFromDesignatedOrQualifyingCashFlowHedgesMember
2018-12-31
0000732712
us-gaap:OperatingSegmentsMember
vz:VerizonBusinessGroupMember
2018-04-01
2018-06-30
0000732712
us-gaap:OperatingSegmentsMember
vz:VerizonBusinessGroupMember
2018-01-01
2018-06-30
0000732712
vz:ExternalOperatingRevenuesMember
2019-04-01
2019-06-30
0000732712
us-gaap:OperatingSegmentsMember
vz:VerizonConsumerGroupMember
2019-01-01
2019-06-30
0000732712
vz:ExternalOperatingRevenuesMember
vz:SmallAndMediumBusinessMember
vz:VerizonBusinessGroupMember
2019-04-01
2019-06-30
0000732712
vz:ExternalOperatingRevenuesMember
vz:ConsumerOtherMember
vz:VerizonConsumerGroupMember
2019-04-01
2019-06-30
0000732712
us-gaap:IntersegmentEliminationMember
vz:VerizonBusinessGroupMember
2019-04-01
2019-06-30
0000732712
vz:ExternalOperatingRevenuesMember
vz:SmallAndMediumBusinessMember
vz:VerizonBusinessGroupMember
2018-04-01
2018-06-30
0000732712
vz:ExternalOperatingRevenuesMember
us-gaap:ProductMember
vz:VerizonConsumerGroupMember
2019-04-01
2019-06-30
0000732712
vz:ExternalOperatingRevenuesMember
vz:PublicSectorAndOtherMember
vz:VerizonBusinessGroupMember
2019-01-01
2019-06-30
0000732712
us-gaap:IntersegmentEliminationMember
vz:VerizonBusinessGroupMember
2018-01-01
2018-06-30
0000732712
us-gaap:OperatingSegmentsMember
2018-01-01
2018-06-30
0000732712
vz:ExternalOperatingRevenuesMember
2018-01-01
2018-06-30
0000732712
vz:ExternalOperatingRevenuesMember
vz:BusinessGlobalEnterpriseMember
vz:VerizonBusinessGroupMember
2018-04-01
2018-06-30
0000732712
us-gaap:IntersegmentEliminationMember
vz:VerizonBusinessGroupMember
2018-04-01
2018-06-30
0000732712
vz:ExternalOperatingRevenuesMember
vz:WholesaleMember
vz:VerizonBusinessGroupMember
2019-01-01
2019-06-30
0000732712
vz:ExternalOperatingRevenuesMember
vz:VerizonBusinessGroupMember
2018-01-01
2018-06-30
0000732712
us-gaap:OperatingSegmentsMember
2019-04-01
2019-06-30
0000732712
us-gaap:IntersegmentEliminationMember
2018-01-01
2018-06-30
0000732712
vz:ExternalOperatingRevenuesMember
vz:ConsumerOtherMember
vz:VerizonConsumerGroupMember
2019-01-01
2019-06-30
0000732712
vz:ExternalOperatingRevenuesMember
vz:VerizonConsumerGroupMember
2018-01-01
2018-06-30
0000732712
vz:ExternalOperatingRevenuesMember
vz:VerizonConsumerGroupMember
2019-04-01
2019-06-30
0000732712
vz:ExternalOperatingRevenuesMember
vz:VerizonConsumerGroupMember
2019-01-01
2019-06-30
0000732712
vz:ExternalOperatingRevenuesMember
vz:BusinessGlobalEnterpriseMember
vz:VerizonBusinessGroupMember
2019-01-01
2019-06-30
0000732712
us-gaap:OperatingSegmentsMember
2018-04-01
2018-06-30
0000732712
vz:ExternalOperatingRevenuesMember
us-gaap:ServiceMember
vz:VerizonConsumerGroupMember
2018-01-01
2018-06-30
0000732712
vz:ExternalOperatingRevenuesMember
vz:SmallAndMediumBusinessMember
vz:VerizonBusinessGroupMember
2018-01-01
2018-06-30
0000732712
vz:ExternalOperatingRevenuesMember
vz:SmallAndMediumBusinessMember
vz:VerizonBusinessGroupMember
2019-01-01
2019-06-30
0000732712
us-gaap:OperatingSegmentsMember
vz:VerizonConsumerGroupMember
2018-01-01
2018-06-30
0000732712
vz:ExternalOperatingRevenuesMember
vz:WholesaleMember
vz:VerizonBusinessGroupMember
2018-01-01
2018-06-30
0000732712
vz:ExternalOperatingRevenuesMember
vz:PublicSectorAndOtherMember
vz:VerizonBusinessGroupMember
2018-04-01
2018-06-30
0000732712
vz:ExternalOperatingRevenuesMember
2018-04-01
2018-06-30
0000732712
us-gaap:OperatingSegmentsMember
vz:VerizonConsumerGroupMember
2018-04-01
2018-06-30
0000732712
vz:ExternalOperatingRevenuesMember
2019-01-01
2019-06-30
0000732712
us-gaap:OperatingSegmentsMember
vz:VerizonBusinessGroupMember
2019-01-01
2019-06-30
0000732712
vz:ExternalOperatingRevenuesMember
vz:VerizonBusinessGroupMember
2019-01-01
2019-06-30
0000732712
vz:ExternalOperatingRevenuesMember
us-gaap:ServiceMember
vz:VerizonConsumerGroupMember
2019-01-01
2019-06-30
0000732712
vz:ExternalOperatingRevenuesMember
vz:VerizonConsumerGroupMember
2018-04-01
2018-06-30
0000732712
us-gaap:OperatingSegmentsMember
2019-01-01
2019-06-30
0000732712
vz:ExternalOperatingRevenuesMember
vz:VerizonBusinessGroupMember
2019-04-01
2019-06-30
0000732712
vz:ExternalOperatingRevenuesMember
vz:PublicSectorAndOtherMember
vz:VerizonBusinessGroupMember
2018-01-01
2018-06-30
0000732712
vz:ExternalOperatingRevenuesMember
vz:ConsumerOtherMember
vz:VerizonConsumerGroupMember
2018-01-01
2018-06-30
0000732712
us-gaap:OperatingSegmentsMember
vz:VerizonBusinessGroupMember
2019-04-01
2019-06-30
0000732712
us-gaap:IntersegmentEliminationMember
2019-04-01
2019-06-30
0000732712
us-gaap:IntersegmentEliminationMember
vz:VerizonConsumerGroupMember
2019-04-01
2019-06-30
0000732712
vz:ExternalOperatingRevenuesMember
vz:WholesaleMember
vz:VerizonBusinessGroupMember
2018-04-01
2018-06-30
0000732712
us-gaap:IntersegmentEliminationMember
vz:VerizonBusinessGroupMember
2019-01-01
2019-06-30
0000732712
us-gaap:IntersegmentEliminationMember
vz:VerizonConsumerGroupMember
2018-04-01
2018-06-30
0000732712
vz:ExternalOperatingRevenuesMember
vz:BusinessGlobalEnterpriseMember
vz:VerizonBusinessGroupMember
2018-01-01
2018-06-30
0000732712
vz:ExternalOperatingRevenuesMember
vz:VerizonBusinessGroupMember
2018-04-01
2018-06-30
0000732712
vz:ExternalOperatingRevenuesMember
us-gaap:ProductMember
vz:VerizonConsumerGroupMember
2018-04-01
2018-06-30
0000732712
vz:ExternalOperatingRevenuesMember
us-gaap:ServiceMember
vz:VerizonConsumerGroupMember
2019-04-01
2019-06-30
0000732712
vz:ExternalOperatingRevenuesMember
us-gaap:ProductMember
vz:VerizonConsumerGroupMember
2018-01-01
2018-06-30
0000732712
us-gaap:OperatingSegmentsMember
vz:VerizonConsumerGroupMember
2019-04-01
2019-06-30
0000732712
us-gaap:IntersegmentEliminationMember
vz:VerizonConsumerGroupMember
2018-01-01
2018-06-30
0000732712
vz:ExternalOperatingRevenuesMember
vz:BusinessGlobalEnterpriseMember
vz:VerizonBusinessGroupMember
2019-04-01
2019-06-30
0000732712
us-gaap:IntersegmentEliminationMember
vz:VerizonConsumerGroupMember
2019-01-01
2019-06-30
0000732712
vz:ExternalOperatingRevenuesMember
us-gaap:ServiceMember
vz:VerizonConsumerGroupMember
2018-04-01
2018-06-30
0000732712
vz:ExternalOperatingRevenuesMember
vz:PublicSectorAndOtherMember
vz:VerizonBusinessGroupMember
2019-04-01
2019-06-30
0000732712
vz:ExternalOperatingRevenuesMember
vz:ConsumerOtherMember
vz:VerizonConsumerGroupMember
2018-04-01
2018-06-30
0000732712
vz:ExternalOperatingRevenuesMember
vz:WholesaleMember
vz:VerizonBusinessGroupMember
2019-04-01
2019-06-30
0000732712
vz:ExternalOperatingRevenuesMember
us-gaap:ProductMember
vz:VerizonConsumerGroupMember
2019-01-01
2019-06-30
0000732712
us-gaap:IntersegmentEliminationMember
2018-04-01
2018-06-30
0000732712
us-gaap:IntersegmentEliminationMember
2019-01-01
2019-06-30
0000732712
vz:FiosRevenuesMember
vz:VerizonConsumerGroupMember
2018-01-01
2018-06-30
0000732712
vz:FiosRevenuesMember
2018-01-01
2018-06-30
0000732712
vz:FiosRevenuesMember
2018-04-01
2018-06-30
0000732712
vz:FiosRevenuesMember
vz:VerizonConsumerGroupMember
2019-04-01
2019-06-30
0000732712
vz:FiosRevenuesMember
2019-04-01
2019-06-30
0000732712
vz:FiosRevenuesMember
vz:VerizonBusinessGroupMember
2018-01-01
2018-06-30
0000732712
vz:FiosRevenuesMember
vz:VerizonBusinessGroupMember
2018-04-01
2018-06-30
0000732712
vz:FiosRevenuesMember
2019-01-01
2019-06-30
0000732712
vz:FiosRevenuesMember
vz:VerizonConsumerGroupMember
2018-04-01
2018-06-30
0000732712
vz:FiosRevenuesMember
vz:VerizonConsumerGroupMember
2019-01-01
2019-06-30
0000732712
vz:FiosRevenuesMember
vz:VerizonBusinessGroupMember
2019-01-01
2019-06-30
0000732712
vz:FiosRevenuesMember
vz:VerizonBusinessGroupMember
2019-04-01
2019-06-30
0000732712
vz:WirelessServiceMember
2018-04-01
2018-06-30
0000732712
vz:WirelessServiceMember
vz:VerizonConsumerGroupMember
2018-04-01
2018-06-30
0000732712
vz:WirelessServiceMember
vz:VerizonBusinessGroupMember
2019-04-01
2019-06-30
0000732712
vz:WirelessServiceMember
vz:VerizonBusinessGroupMember
2018-01-01
2018-06-30
0000732712
vz:WirelessServiceMember
vz:VerizonConsumerGroupMember
2018-01-01
2018-06-30
0000732712
vz:WirelessServiceMember
vz:VerizonConsumerGroupMember
2019-01-01
2019-06-30
0000732712
vz:WirelessServiceMember
2019-04-01
2019-06-30
0000732712
vz:WirelessServiceMember
2018-01-01
2018-06-30
0000732712
vz:WirelessServiceMember
vz:VerizonBusinessGroupMember
2019-01-01
2019-06-30
0000732712
vz:WirelessServiceMember
vz:VerizonConsumerGroupMember
2019-04-01
2019-06-30
0000732712
vz:WirelessServiceMember
vz:VerizonBusinessGroupMember
2018-04-01
2018-06-30
0000732712
vz:WirelessServiceMember
2019-01-01
2019-06-30
0000732712
vz:CorporateAndReconcilingItemsMember
2018-01-01
2018-06-30
0000732712
vz:CorporateAndReconcilingItemsMember
2019-01-01
2019-06-30
0000732712
vz:CorporateAndReconcilingItemsMember
2019-04-01
2019-06-30
0000732712
vz:CorporateAndReconcilingItemsMember
2018-04-01
2018-06-30
0000732712
srt:ConsolidationEliminationsMember
2018-04-01
2018-06-30
0000732712
srt:ConsolidationEliminationsMember
2019-04-01
2019-06-30
0000732712
srt:ConsolidationEliminationsMember
2018-01-01
2018-06-30
0000732712
srt:ConsolidationEliminationsMember
2019-01-01
2019-06-30
0000732712
vz:ServiceAndOtherMember
vz:VerizonBusinessGroupMember
2019-01-01
2019-06-30
0000732712
us-gaap:ProductMember
vz:VerizonBusinessGroupMember
2018-01-01
2018-06-30
0000732712
us-gaap:ProductMember
vz:VerizonBusinessGroupMember
2019-04-01
2019-06-30
0000732712
vz:ServiceAndOtherMember
vz:VerizonBusinessGroupMember
2018-01-01
2018-06-30
0000732712
us-gaap:ProductMember
vz:VerizonBusinessGroupMember
2018-04-01
2018-06-30
0000732712
vz:ServiceAndOtherMember
vz:VerizonBusinessGroupMember
2018-04-01
2018-06-30
0000732712
vz:ServiceAndOtherMember
vz:VerizonBusinessGroupMember
2019-04-01
2019-06-30
0000732712
us-gaap:ProductMember
vz:VerizonBusinessGroupMember
2019-01-01
2019-06-30
vz:auction
iso4217:USD
vz:option
iso4217:USD
xbrli:shares
xbrli:shares
vz:License
vz:segment
iso4217:EUR
iso4217:GBP
xbrli:pure
vz:Lease
vz:Agreement
vz:Employee
vz:legal_matter
UNITED STATES
SECURITIES AND EXCHANGE COMMISSION
Washington, D.C. 20549
FORM 10-Q
|
| | |
(Mark one) | | |
☒ | QUARTERLY REPORT PURSUANT TO SECTION 13 OR 15(d) OF THE SECURITIES EXCHANGE ACT OF 1934 | |
For the quarterly period ended June 30, 2019
OR
|
| | |
☐ | TRANSITION REPORT PURSUANT TO SECTION 13 OR 15(d) OF THE SECURITIES EXCHANGE ACT OF 1934 | |
| | |
| For the transition period from to | |
Commission file number: 1-8606
Verizon Communications Inc.
(Exact name of registrant as specified in its charter)
|
| | |
Delaware | | 23-2259884 |
(State or other jurisdiction of incorporation or organization) | | (I.R.S. Employer Identification No.) |
|
| | | |
1095 Avenue of the Americas | | 10036 |
New York | New York | | |
(Address of principal executive offices) | | (Zip Code) |
Registrant’s telephone number, including area code: (212) 395-1000
Securities registered pursuant to Section 12(b) of the Act:
|
| | | | |
Title of Each Class | | Trading Symbol(s) | | Name of Exchange on Which Registered |
Common Stock, par value $0.10 | | VZ | | New York Stock Exchange |
Common Stock, par value $0.10 | | VZ | | The NASDAQ Global Select Market |
2.375% Notes due 2022 | | VZ22A | | New York Stock Exchange |
0.500% Notes due 2022 | | VZ22B | | New York Stock Exchange |
1.625% Notes due 2024 | | VZ24B | | New York Stock Exchange |
4.073% Notes due 2024 | | VZ24C | | New York Stock Exchange |
0.875% Notes due 2025 | | VZ25 | | New York Stock Exchange |
3.25% Notes due 2026 | | VZ26 | | New York Stock Exchange |
1.375% Notes due 2026 | | VZ26B | | New York Stock Exchange |
0.875% Notes due 2027 | | VZ27E | | New York Stock Exchange |
1.375% Notes due 2028 | | VZ28 | | New York Stock Exchange |
1.875% Notes due 2029 | | VZ29B | | New York Stock Exchange |
1.250% Notes due 2030 | | VZ30 | | New York Stock Exchange |
2.625% Notes due 2031 | | VZ31 | | New York Stock Exchange |
2.500% Notes due 2031 | | VZ31A | | New York Stock Exchange |
4.75% Notes due 2034 | | VZ34 | | New York Stock Exchange |
3.125% Notes due 2035 | | VZ35 | | New York Stock Exchange |
3.375% Notes due 2036 | | VZ36A | | New York Stock Exchange |
2.875% Notes due 2038 | | VZ38B | | New York Stock Exchange |
Indicate by check mark whether the registrant (1) has filed all reports required to be filed by Section 13 or 15(d) of the Securities Exchange Act of 1934 during the preceding 12 months (or for such shorter period that the registrant was required to file such reports), and (2) has been subject to such filing requirements for the past 90 days. ☒ Yes ☐ No
Indicate by check mark whether the registrant has submitted electronically every Interactive Data File required to be submitted pursuant to Rule 405 of Regulation S-T (§232.405 of this chapter) during the preceding 12 months (or for such shorter period that the registrant was required to submit such files). ☒ Yes ☐ No
|
| | | | | |
Indicate by check mark whether the registrant is a large accelerated filer, an accelerated filer, a non-accelerated filer, a smaller reporting company, or an emerging growth company. See the definitions of "large accelerated filer," "accelerated filer," "smaller reporting company," and "emerging growth company" in Rule 12b-2 of the Exchange Act. |
| | | | | |
| Large accelerated filer | ☒ | | Accelerated filer | ☐ |
| Non-accelerated filer | ☐ | | Smaller reporting company | ☐ |
| | | | Emerging growth company | ☐ |
If an emerging growth company, indicate by check mark if the registrant has elected not to use the extended transition period for complying with any new or revised accounting standards provided pursuant to Section 13(a) of the Exchange Act. ☐
Indicate by check mark whether the registrant is a shell company (as defined in Rule 12b-2 of the Exchange Act). ☐ Yes ☒ No
At June 30, 2019, 4,135,764,809 shares of the registrant’s common stock were outstanding, after deducting 155,668,837 shares held in treasury.
|
| | |
Item No. | | Page |
| | |
| |
| | |
Item 1. | | |
| | |
| | |
| Three and six months ended June 30, 2019 and 2018 | |
| | |
| | |
| Three and six months ended June 30, 2019 and 2018 | |
| | |
| | |
| At June 30, 2019 and December 31, 2018 | |
| | |
| | |
| Six months ended June 30, 2019 and 2018 | |
| | |
| | |
| | |
Item 2. | | |
| | |
Item 3. | | |
| | |
Item 4. | | |
| |
| |
| | |
Item 1. | | |
| | |
Item 1A. | | |
| | |
Item 2. | | |
| | |
Item 6. | | |
| |
| |
| |
| |
|
|
Part I - Financial Information |
|
|
Item 1. Financial Statements (Unaudited) |
|
|
Condensed Consolidated Statements of Income Verizon Communications Inc. and Subsidiaries |
|
| | | | | | | | | | | | | | | |
| Three Months Ended | | | Six Months Ended | |
| June 30, | | | June 30, | |
(dollars in millions, except per share amounts) (unaudited) | 2019 |
| | 2018 |
| | 2019 |
| | 2018 |
|
| | | | | | | |
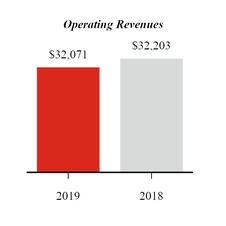
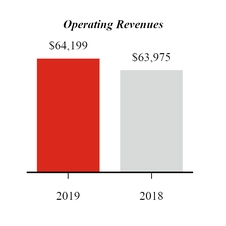
Operating Revenues | | | | | | | |
Service revenues and other | $ | 27,351 |
| | $ | 27,159 |
| | $ | 54,548 |
| | $ | 53,891 |
|
Wireless equipment revenues | 4,720 |
| | 5,044 |
| | 9,651 |
| | 10,084 |
|
Total Operating Revenues | 32,071 |
| | 32,203 |
| | 64,199 |
| | 63,975 |
|
| | | | | | | |
Operating Expenses | | | | | | | |
Cost of services (exclusive of items shown below) | 7,702 |
| | 8,234 |
| | 15,494 |
| | 16,180 |
|
Cost of wireless equipment | 5,019 |
| | 5,397 |
| | 10,217 |
| | 10,706 |
|
Selling, general and administrative expense | 7,268 |
| | 7,605 |
| | 14,466 |
| | 14,449 |
|
Depreciation and amortization expense | 4,232 |
| | 4,350 |
| | 8,463 |
| | 8,674 |
|
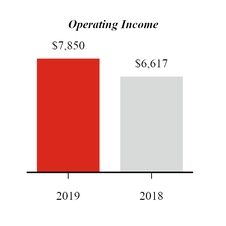
Total Operating Expenses | 24,221 |
| | 25,586 |
| | 48,640 |
| | 50,009 |
|
| | | | | | | |
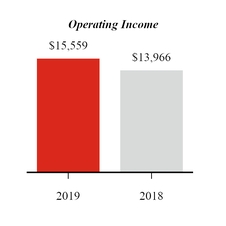
Operating Income | 7,850 |
| | 6,617 |
| | 15,559 |
| | 13,966 |
|
Equity in losses of unconsolidated businesses | (13 | ) | | (228 | ) | | (19 | ) | | (247 | ) |
Other income (expense), net | (1,312 | ) | | 360 |
| | (1,017 | ) | | 285 |
|
Interest expense | (1,215 | ) | | (1,222 | ) | | (2,425 | ) | | (2,423 | ) |
Income Before Provision For Income Taxes | 5,310 |
| | 5,527 |
| | 12,098 |
| | 11,581 |
|
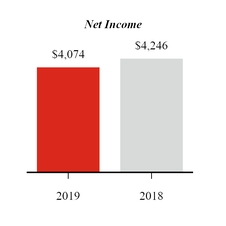
Provision for income taxes | (1,236 | ) | | (1,281 | ) | | (2,864 | ) | | (2,669 | ) |
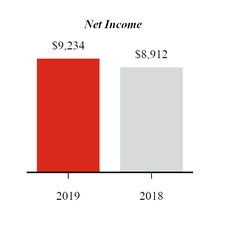
Net Income | $ | 4,074 |
| | $ | 4,246 |
| | $ | 9,234 |
| | $ | 8,912 |
|
| | | | | | | |
Net income attributable to noncontrolling interests | $ | 130 |
| | $ | 126 |
| | $ | 258 |
| | $ | 247 |
|
Net income attributable to Verizon | 3,944 |
| | 4,120 |
| | 8,976 |
| | 8,665 |
|
Net Income | $ | 4,074 |
| | $ | 4,246 |
| | $ | 9,234 |
| | $ | 8,912 |
|
| | | | | | | |
Basic Earnings Per Common Share | | | | | | | |
Net income attributable to Verizon | $ | 0.95 |
| | $ | 1.00 |
| | $ | 2.17 |
| | $ | 2.10 |
|
Weighted-average shares outstanding (in millions) | 4,138 |
| | 4,135 |
| | 4,138 |
| | 4,120 |
|
| | | | | | | |
Diluted Earnings Per Common Share | | | | | | | |
Net income attributable to Verizon | $ | 0.95 |
| | $ | 1.00 |
| | $ | 2.17 |
| | $ | 2.10 |
|
Weighted-average shares outstanding (in millions) | 4,139 |
| | 4,139 |
| | 4,140 |
| | 4,123 |
|
See Notes to Condensed Consolidated Financial Statements
|
|
Condensed Consolidated Statements of Comprehensive Income Verizon Communications Inc. and Subsidiaries |
|
| | | | | | | | | | | | | | | |
| Three Months Ended | | | Six Months Ended | |
| June 30, | | | June 30, | |
(dollars in millions) (unaudited) | 2019 |
| | 2018 |
| | 2019 |
| | 2018 |
|
| | | | | | | |
Net Income | $ | 4,074 |
| | $ | 4,246 |
| | $ | 9,234 |
| | $ | 8,912 |
|
Other Comprehensive Income (Loss), Net of Tax (Expense) Benefit | | | | | | | |
Foreign currency translation adjustments, net of tax of $3, $13, $(2) and $6 | (67 | ) | | (176 | ) | | (43 | ) | | (83 | ) |
Unrealized gain (loss) on cash flow hedges, net of tax of $193, $55, $198 and $(125) | (537 | ) | | (152 | ) | | (550 | ) | | 349 |
|
Unrealized gain (loss) on marketable securities, net of tax of $0, $0, $(2) and $1 | 4 |
| | 1 |
| | 8 |
| | (4 | ) |
Defined benefit pension and postretirement plans, net of tax of $56, $58, $112 and $118 | (169 | ) | | (173 | ) | | (338 | ) | | (346 | ) |
Other comprehensive loss attributable to Verizon | (769 | ) | | (500 | ) | | (923 | ) | | (84 | ) |
Total Comprehensive Income | $ | 3,305 |
| | $ | 3,746 |
| | $ | 8,311 |
| | $ | 8,828 |
|
| | | | | | | |
Comprehensive income attributable to noncontrolling interests | $ | 130 |
| | $ | 126 |
| | $ | 258 |
| | $ | 247 |
|
Comprehensive income attributable to Verizon | 3,175 |
| | 3,620 |
| | 8,053 |
| | 8,581 |
|
Total Comprehensive Income | $ | 3,305 |
| | $ | 3,746 |
| | $ | 8,311 |
| | $ | 8,828 |
|
See Notes to Condensed Consolidated Financial Statements
|
|
Condensed Consolidated Balance Sheets Verizon Communications Inc. and Subsidiaries |
|
| | | | | | | |
| At June 30, |
| | At December 31, |
|
(dollars in millions, except per share amounts) (unaudited) | 2019 |
| | 2018 |
|
| | | |
Assets | | | |
Current assets | | | |
Cash and cash equivalents | $ | 1,949 |
| | $ | 2,745 |
|
Accounts receivable, net of allowances of $745 and $765 | 24,926 |
| | 25,102 |
|
Inventories | 1,167 |
| | 1,336 |
|
Prepaid expenses and other | 5,266 |
| | 5,453 |
|
Total current assets | 33,308 |
| | 34,636 |
|
| | | |
Property, plant and equipment | 257,395 |
| | 252,835 |
|
Less accumulated depreciation | 169,577 |
| | 163,549 |
|
Property, plant and equipment, net | 87,818 |
| | 89,286 |
|
| | | |
Investments in unconsolidated businesses | 650 |
| | 671 |
|
Wireless licenses | 94,333 |
| | 94,130 |
|
Goodwill | 24,632 |
| | 24,614 |
|
Other intangible assets, net | 9,474 |
| | 9,775 |
|
Operating lease right-of-use assets | 22,467 |
| | — |
|
Other assets | 10,426 |
| | 11,717 |
|
Total assets | $ | 283,108 |
| | $ | 264,829 |
|
| | | |
Liabilities and Equity | | | |
Current liabilities | | | |
Debt maturing within one year | $ | 8,773 |
| | $ | 7,190 |
|
Accounts payable and accrued liabilities | 17,633 |
| | 22,501 |
|
Current operating lease liabilities | 3,154 |
| | — |
|
Other current liabilities | 8,654 |
| | 8,239 |
|
Total current liabilities | 38,214 |
| | 37,930 |
|
| | | |
Long-term debt | 104,598 |
| | 105,873 |
|
Employee benefit obligations | 18,040 |
| | 18,599 |
|
Deferred income taxes | 34,225 |
| | 33,795 |
|
Non-current operating lease liabilities | 18,254 |
| | — |
|
Other liabilities | 11,830 |
| | 13,922 |
|
Total long-term liabilities | 186,947 |
| | 172,189 |
|
| | | |
Commitments and Contingencies (Note 12) |
| |
|
| | | |
Equity | | | |
Series preferred stock ($0.10 par value; 250,000,000 shares authorized; none issued) | — |
| | — |
|
Common stock ($0.10 par value; 6,250,000,000 shares authorized in each period; 4,291,433,646 issued in each period) | 429 |
| | 429 |
|
Additional paid in capital | 13,419 |
| | 13,437 |
|
Retained earnings | 47,945 |
| | 43,542 |
|
Accumulated other comprehensive income | 1,447 |
| | 2,370 |
|
Common stock in treasury, at cost (155,668,837 and 159,400,267 shares outstanding) | (6,823 | ) | | (6,986 | ) |
Deferred compensation – employee stock ownership plans and other | 165 |
| | 353 |
|
Noncontrolling interests | 1,365 |
| | 1,565 |
|
Total equity | 57,947 |
| | 54,710 |
|
Total liabilities and equity | $ | 283,108 |
| | $ | 264,829 |
|
See Notes to Condensed Consolidated Financial Statements
|
|
Condensed Consolidated Statements of Cash Flows Verizon Communications Inc. and Subsidiaries |
|
| | | | | | | |
| Six Months Ended | |
| June 30, | |
(dollars in millions) (unaudited) | 2019 |
| | 2018 |
|
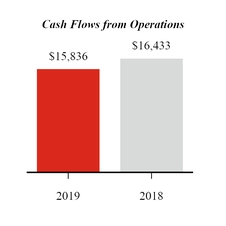
| | | |
Cash Flows from Operating Activities | | | |
Net Income | $ | 9,234 |
| | $ | 8,912 |
|
Adjustments to reconcile net income to net cash provided by operating activities: | | | |
Depreciation and amortization expense | 8,463 |
| | 8,674 |
|
Employee retirement benefits | (294 | ) | | (300 | ) |
Deferred income taxes | 588 |
| | 1,354 |
|
Provision for uncollectible accounts | 738 |
| | 462 |
|
Equity in losses of unconsolidated businesses, net of dividends received | 50 |
| | 268 |
|
Changes in current assets and liabilities, net of effects from acquisition/disposition of businesses | (4,593 | ) | | (1,538 | ) |
Discretionary employee benefits contributions | (300 | ) | | (1,679 | ) |
Other, net | 1,950 |
| | 280 |
|
Net cash provided by operating activities | 15,836 |
| | 16,433 |
|
| | | |
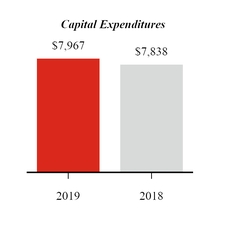
Cash Flows from Investing Activities | | | |
Capital expenditures (including capitalized software) | (7,967 | ) | | (7,838 | ) |
Acquisitions of businesses, net of cash acquired | (28 | ) | | (38 | ) |
Acquisitions of wireless licenses | (199 | ) | | (1,155 | ) |
Other, net | (395 | ) | | 303 |
|
Net cash used in investing activities | (8,589 | ) | | (8,728 | ) |
| | | |
Cash Flows from Financing Activities | | | |
Proceeds from long-term borrowings | 6,237 |
| | 4,584 |
|
Proceeds from asset-backed long-term borrowings | 3,982 |
| | 1,716 |
|
Repayments of long-term borrowings and finance lease obligations | (9,630 | ) | | (6,568 | ) |
Repayments of asset-backed long-term borrowings | (2,817 | ) | | (2,000 | ) |
Dividends paid | (4,981 | ) | | (4,845 | ) |
Other, net | (834 | ) | | (752 | ) |
Net cash used in financing activities | (8,043 | ) | | (7,865 | ) |
| | | |
Decrease in cash, cash equivalents and restricted cash | (796 | ) | | (160 | ) |
Cash, cash equivalents and restricted cash, beginning of period | 3,916 |
| | 2,888 |
|
Cash, cash equivalents and restricted cash, end of period (Note 1) | $ | 3,120 |
| | $ | 2,728 |
|
See Notes to Condensed Consolidated Financial Statements
|
|
Notes to Condensed Consolidated Financial Statements (Unaudited) Verizon Communications Inc. and Subsidiaries |
|
|
Note 1. Basis of Presentation |
The accompanying unaudited condensed consolidated financial statements have been prepared in accordance with generally accepted accounting principles (GAAP) in the United States (U.S.) and based upon Securities and Exchange Commission rules that permit reduced disclosure for interim periods. For a more complete discussion of significant accounting policies and certain other information, you should refer to the financial statements of Verizon Communications Inc. (Verizon or the Company) included in our Annual Report on Form 10-K for the year ended December 31, 2018. These financial statements reflect all adjustments that are necessary for a fair presentation of results of operations and financial condition for the interim periods shown, including normal recurring accruals and other items. The results for the interim periods are not necessarily indicative of results for the full year.
In November 2018, we announced a strategic reorganization of our business. Under the new structure, effective April 1, 2019, there are two reportable segments that we operate and manage as strategic business units - Verizon Consumer Group (Consumer) and Verizon Business Group (Business). In conjunction with the new reporting structure, we recast our segment disclosures for all periods presented.
Our Consumer segment provides consumer-focused wireless and wireline communications services and products. Our wireless services are provided across one of the most extensive wireless networks in the U.S. under the Verizon Wireless brand and through wholesale and other arrangements. Our wireline services are provided in nine states in the Mid-Atlantic and Northeastern U.S., as well as Washington D.C., over our 100% fiber-optic network under the Fios brand and over a traditional copper-based network to customers who are not served by Fios. Our Consumer segment’s wireless and wireline products and services are available to our retail customers, as well as resellers that purchase wireless network access from us on a wholesale basis.
Our Business segment provides wireless and wireline communications services and products, video and data services, corporate networking solutions, security and managed network services, local and long distance voice services and network access to deliver various Internet of Things (IoT) services and products. We provide these products and services to businesses, government customers and wireless and wireline carriers across the U.S. and select products and services to customers around the world.
Basis of Presentation
We have reclassified certain prior year amounts to conform to the current year presentation, including impacts for changes in our reportable segments.
Earnings Per Common Share
There were a total of approximately 2 million outstanding dilutive securities, primarily consisting of restricted stock units, included in the computation of diluted earnings per common share for both the three and six months ended June 30, 2019. There were a total of approximately 4 million outstanding dilutive securities, primarily consisting of restricted stock units, included in the computation of diluted earnings per common share for both the three and six months ended June 30, 2018.
Cash, Cash Equivalents and Restricted Cash
We consider all highly liquid investments with an original maturity of 90 days or less when purchased to be cash equivalents. Cash equivalents are stated at cost, which approximates quoted market value and includes amounts held in money market funds.
Cash collections on the device payment plan agreement receivables collateralizing asset-backed debt securities are required at certain specified times to be placed into segregated accounts. Deposits to the segregated accounts are considered restricted cash and are included in Prepaid expenses and other and Other assets in our condensed consolidated balance sheets.
Cash, cash equivalents and restricted cash are included in the following line items on the condensed consolidated balance sheets:
|
| | | | | | | | | | | |
| At June 30, |
| | At December 31, |
| | Increase / (Decrease) |
|
(dollars in millions) | 2019 |
| | 2018 |
| |
Cash and cash equivalents | $ | 1,949 |
| | $ | 2,745 |
| | $ | (796 | ) |
Restricted cash: | | | | | |
Prepaid expenses and other | 1,055 |
| | 1,047 |
| | 8 |
|
Other assets | 116 |
| | 124 |
| | (8 | ) |
Cash, cash equivalents and restricted cash | $ | 3,120 |
| | $ | 3,916 |
| | $ | (796 | ) |
Goodwill
Goodwill is the excess of the acquisition cost of businesses over the fair value of the identifiable net assets acquired. Impairment testing for goodwill is performed annually in the fourth quarter or more frequently if impairment indicators are present. We transitioned into our new segment reporting structure effective April 1, 2019, which resulted in certain changes to our operating segments and reporting units. Upon the
date of reorganization, the goodwill of our historical Wireless reporting unit, historical Wireline reporting unit and historical Verizon Connect reporting unit were reallocated to our new Consumer and Business reporting units using a relative fair value approach.
We performed an impairment assessment of the impacted reporting units, specifically our historical Wireless, historical Wireline and historical Connect reporting units on March 31, 2019, immediately before our strategic reorganization became effective. Our impairment assessments indicated that the fair value for each of our historical Wireless, historical Wireline and historical Connect reporting units exceeded their respective carrying value, and therefore did not result in a goodwill impairment. We then performed an impairment assessment for our Consumer and Business reporting units on April 1, 2019, immediately following our strategic reorganization. Our impairment assessments indicated that the fair value for each of our Consumer and Business reporting units exceeded their respective carrying values and therefore, did not result in a goodwill impairment. Our Media reporting unit was not impacted by the strategic reorganization and there was no indicator of impairment.
Recently Adopted Accounting Standard
The following Accounting Standard Updates (ASUs) were issued by Financial Accounting Standards Board (FASB), and have been recently adopted by Verizon.
|
| | | | | |
| | Description | Date of Adoption | Effect on Financial Statements |
| | ASU 2016-02, ASU 2018-01, ASU 2018-10, ASU 2018-11, ASU 2018-20 and ASU 2019-01, Leases (Topic 842) |
| | The FASB issued Topic 842 requiring entities to recognize assets and liabilities on the balance sheet for all leases, with certain exceptions. In addition, Topic 842 will enable users of financial statements to further understand the amount, timing and uncertainty of cash flows arising from leases. Topic 842 allows for a modified retrospective application and is effective as of the first quarter of 2019. Entities are allowed to apply the modified retrospective approach: (1) retrospectively to each prior reporting period presented in the financial statements with the cumulative-effect adjustment recognized at the beginning of the earliest comparative period presented; or (2) retrospectively at the beginning of the period of adoption (January 1, 2019) through a cumulative-effect adjustment. The modified retrospective approach includes a number of optional practical expedients that entities may elect to apply. | 1/1/2019 | We adopted Topic 842 beginning on January 1, 2019, using the modified retrospective approach with a cumulative-effect adjustment to opening retained earnings recorded at the beginning of the period of adoption. Therefore, upon adoption, we have recognized and measured leases without revising comparative period information or disclosure. We recorded an increase of $410 million (net of tax) to retained earnings on January 1, 2019 which related to deferred sale leaseback gains recognized from prior transactions. Additionally, the adoption of the standard had a significant impact in our condensed consolidated balance sheet due to the recognition of $22.1 billion of operating lease liabilities, along with $23.2 billion of operating lease right-of-use-assets. |
| |
The cumulative after-tax effect of the changes made to our condensed consolidated balance sheet for the adoption of Topic 842 were as follows:
|
| | | | | | | | | | | |
(dollars in millions) | At December 31, 2018 |
| | Adjustments due to Topic 842 |
| | At January 1, 2019 |
|
Prepaid expenses and other | $ | 5,453 |
| | $ | (329 | ) | | $ | 5,124 |
|
Operating lease right-of-use assets | — |
| | 23,241 |
| | 23,241 |
|
Other assets | 11,717 |
| | (2,048 | ) | | 9,669 |
|
Accounts payable and accrued liabilities | 22,501 |
| | (3 | ) | | 22,498 |
|
Other current liabilities | 8,239 |
| | (2 | ) | | 8,237 |
|
Current operating lease liabilities | — |
| | 2,931 |
| | 2,931 |
|
Deferred income taxes | 33,795 |
| | 139 |
| | 33,934 |
|
Non-current operating lease liabilities | — |
| | 19,203 |
| | 19,203 |
|
Other liabilities | 13,922 |
| | (1,815 | ) | | 12,107 |
|
Retained earnings | 43,542 |
| | 410 |
| | 43,952 |
|
Noncontrolling interests | 1,565 |
| | 1 |
| | 1,566 |
|
In addition to the increase to the operating lease liabilities and right-of-use assets and the derecognition of deferred sale leaseback gains through opening retained earnings, Topic 842 also resulted in reclassifying the presentation of prepaid and deferred rent to operating lease right-of-use assets. The operating lease right-of-use assets amount also includes the balance of any prepaid lease payments, unamortized initial direct costs, and lease incentives.
We elected the package of practical expedients permitted under the transition guidance within the new standard. Accordingly, we have adopted these practical expedients and did not reassess: (1) whether an expired or existing contract is a lease or contains an embedded lease; (2) lease classification of an expired or existing lease; or (3) capitalization of initial direct costs for an expired or existing lease. In addition, we have elected the land easement transition practical expedient, and did not reassess whether an existing or expired land easement is a lease or contains a lease if it has not historically been accounted for as a lease.
We lease network equipment including towers, distributed antenna systems, small cells, real estate, connectivity mediums which include dark fiber, equipment leases, and other various types of assets for use in our operations under both operating and finance leases. We assess whether an arrangement is a lease or contains a lease at inception. For arrangements considered leases or that contain a lease that is accounted for
separately, we determine the classification and initial measurement of the right-of-use asset and lease liability at the lease commencement date, which is the date that the underlying asset becomes available for use.
For both operating and finance leases, we recognize a right-of-use asset, which represents our right to use the underlying asset for the lease term, and a lease liability, which represents the present value of our obligation to make payments arising over the lease term. The present value of the lease payments is calculated using the incremental borrowing rate for operating and finance leases. The incremental borrowing rate is determined using a portfolio approach based on the rate of interest that the Company would have to pay to borrow an amount equal to the lease payments on a collateralized basis over a similar term. Management uses the unsecured borrowing rate and risk-adjusts that rate to approximate a collateralized rate, which will be updated on a quarterly basis for measurement of new lease liabilities.
In those circumstances where the Company is the lessee, we have elected to account for non-lease components associated with our leases (e.g., common area maintenance costs) and lease components as a single lease component for substantially all of our asset classes. Additionally, in arrangements where we are the lessor, we have customer premise equipment for which we apply the lease and non-lease component practical expedient and account for non-lease components (e.g., service revenue) and lease components as combined components under the revenue recognition guidance in ASU 2014-09, "Revenue from Contracts with Customers" (Topic 606) as the service revenues are the predominant components in the arrangements.
Rent expense for operating leases is recognized on a straight-line basis over the term of the lease and is included in either Cost of services or Selling, general and administrative expense in our condensed consolidated statements of income, based on the use of the facility on which rent is being paid. Variable rent payments related to both operating and finance leases are expensed in the period incurred. Our variable lease payments consist of payments dependent on various external indicators, including real estate taxes, common area maintenance charges and utility usage.
Operating leases with a term of 12 months or less are not recorded on the balance sheet; we recognize a rent expense for these leases on a straight-line basis over the lease term.
We recognize the amortization of the right-of-use asset for our finance leases on a straight-line basis over the shorter of the term of the lease or the useful life of the right-of-use asset in Depreciation and amortization expense in our condensed consolidated statements of income. The interest expense related to finance leases is recognized using the effective interest method based on the discount rate determined at lease commencement and is included within Interest expense in our condensed consolidated statements of income.
See Note 5 for additional information related to leases, including disclosure required under Topic 842.
Recently Issued Accounting Standards
The following ASUs have been recently issued by the FASB.
|
| | | | | |
| | Description | Date of Adoption | Effect on Financial Statements |
| | ASU 2016-13, ASU 2018-19, ASU 2019-04, ASU 2019-05, Financial Instruments - Credit Losses (Topic 326) |
| | In June 2016, the FASB issued this standard update which requires certain financial assets be measured at amortized cost net of an allowance for estimated credit losses such that the net receivable represents the present value of expected cash collection. In addition, this standard update requires that certain financial assets be measured at amortized cost reflecting an allowance for estimated credit losses expected to occur over the life of the assets. The estimate of credit losses must be based on all relevant information including historical information, current conditions and reasonable and supportable forecasts that affect the collectability of the amounts. An entity will apply the update through a cumulative effect adjustment to retained earnings as of the beginning of the first reporting period in which the guidance is effective (January 1, 2020). A prospective transition approach is required for debt securities for which an other-than-temporary impairment has been recognized before the effective date. Early adoption of this standard is permitted. | 1/1/2020 | We are currently evaluating the impacts that this standard update will have on our various financial assets, which we expect to include, but are not limited to, our device payment plan agreement receivables, service receivables and contract assets.
We have established a cross-functional coordinated team to implement the standard update. We are in the process of determining the potential impacts to our processes, including allowance estimation models, and internal controls in order to meet the standard update's accounting and reporting requirements.
|
| |
| |
|
|
Note 2. Revenues and Contract Costs |
We earn revenue from contracts with customers, primarily through the provision of telecommunications and other services and through the sale of wireless equipment.
Revenue by Category
We have two reportable segments that we operate and manage as strategic business units - Consumer and Business. Revenue is disaggregated by products and services within Consumer, and customer groups (Global Enterprise, Small and Medium Business, Public Sector and Other, and Wholesale) within Business. See Note 11 for additional information on revenue by segment.
Corporate and other includes the results of our media business, Verizon Media Group (Verizon Media), which operated under the "Oath" brand until January 2019, and other businesses. Verizon Media generated revenues from contracts with customers under Topic 606 of approximately $1.8 billion and $3.6 billion, during the three and six months ended June 30, 2019, respectively. Verizon Media generated revenues from contracts with customers under Topic 606 of approximately $1.9 billion and $3.8 billion during the three and six months ended June 30, 2018, respectively.
We also earn revenues, that are not accounted for under Topic 606, from leasing arrangements (such as towers), captive reinsurance arrangements primarily related to wireless device insurance and the interest on equipment financed on a device payment plan agreement when sold to the customer by an authorized agent. As allowed by the practical expedient within Topic 842, we have elected to combine the lease and non-lease components for those arrangements of customer premise equipment where we are the lessor as components accounted for under Topic 606. During the three and six months ended June 30, 2019, revenues from arrangements that were not accounted for under Topic 606 were approximately $797 million and $1.6 billion, respectively. During the three and six months ended June 30, 2018, revenues from arrangements that were not accounted for under Topic 606 were approximately $1.1 billion and $2.3 billion, respectively.
Remaining Performance Obligations
When allocating the total contract transaction price to identified performance obligations, a portion of the total transaction price may relate to service performance obligations which were not satisfied or are partially satisfied as of the end of the reporting period. Below we disclose information relating to these unsatisfied performance obligations. Upon adoption, we elected to apply the practical expedient available under Topic 606 that provides the option to exclude the expected revenues arising from unsatisfied performance obligations related to contracts that have an original expected duration of one year or less. This situation primarily arises with respect to certain month-to-month service contracts. At June 30, 2019, month-to-month service contracts represented approximately 87% of our wireless postpaid contracts and approximately 57% of our wireline Consumer and Small and Medium Business contracts, compared to June 30, 2018, for which month-to-month service contracts represented approximately 83% of our wireless postpaid contracts and 56% of our wireline Consumer and Small and Medium Business contracts.
Additionally, certain contracts provide customers the option to purchase additional services. The fees related to these additional services are recognized when the customer exercises the option (typically on a month-to-month basis).
Contracts for wireless services are generally either month-to-month and cancellable at any time (typically under a device payment plan) or contain terms ranging from greater than one month to up to two years (typically under a fixed-term plan). Additionally, customers may incur charges based on usage or additional optional services purchased in conjunction with entering into a contract that can be cancelled at any time and therefore are not included in the transaction price. The transaction price allocated to service performance obligations, which are not satisfied or are partially satisfied as of the end of the reporting period, are generally related to our fixed-term plans.
Our Consumer group customers also include other telecommunications companies who utilize Verizon's networks to resell wireless service to their respective end customers. Reseller arrangements generally include a stated contract term, which typically extends longer than two years. These arrangements generally include an annual minimum revenue commitment over the term of the contract for which revenues will be recognized in future periods.
Consumer customer contracts for wireline services generally have a service term of two years; however, this term may be shorter than twelve months or may be month-to-month. Certain contracts with Business customers for wireline services extend into future periods, contain fixed monthly fees and usage-based fees, and can include annual commitments in each year of the contract or commitments over the entire specified contract term; however, a significant number of contracts for wireline services with our Business customers have a contract term that is twelve months or less.
Additionally, there are certain contracts with Business customers for wireline services that have a contractual minimum fee over the total contract term. We cannot predict the time period when revenue will be recognized related to those contracts; thus, they are excluded from the time bands below. These contracts have varying terms spanning over approximately five years ending in June 2024 and have aggregate contract minimum payments totaling $3.9 billion.
At June 30, 2019, the transaction price related to unsatisfied performance obligations for total Verizon that is expected to be recognized for 2019, 2020 and thereafter was $10.8 billion, $14.7 billion and $5.9 billion, respectively. Remaining performance obligation estimates are subject to change and are affected by several factors, including terminations and changes in the timing and scope of contracts, arising from contract modifications.
Accounts Receivable and Contract Balances
The timing of revenue recognition may differ from the time of billing to our customers. Receivables presented in our consolidated balance sheet represent an unconditional right to consideration. Contract balances represent amounts from an arrangement when either Verizon has performed, by transferring goods or services to the customer in advance of receiving all or partial consideration for such goods and services from the customer,
or the customer has made payment to Verizon in advance of obtaining control of the goods and/or services promised to the customer in the contract.
Contract assets primarily relate to our rights to consideration for goods or services provided to customers but for which we do not have an unconditional right at the reporting date. Under a fixed-term plan, total contract revenue is allocated between wireless service and equipment revenues. In conjunction with these arrangements, a contract asset is created, which represents the difference between the amount of equipment revenue recognized upon sale and the amount of consideration received from the customer when the performance obligation related to the transfer of control of the equipment is satisfied. The contract asset is reclassified to accounts receivable as wireless services are provided and billed. We have the right to bill the customer as service is provided over time, which results in our right to the payment being unconditional. The contract asset balances are presented in our consolidated balance sheet as Prepaid expenses and other and Other assets. We assess our contract assets for impairment on a quarterly basis and will recognize an impairment charge to the extent their carrying amount is not recoverable.
Contract liabilities arise when we bill our customers and receive consideration in advance of providing the goods or services promised in the contract. We typically bill service one month in advance, which is the primary component of the contract liability balance. Contract liabilities are recognized as revenue when services are provided to the customer. The contract liability balances are presented in our condensed consolidated balance sheet as Other current liabilities and Other liabilities.
The following table presents information about receivables from contracts with customers:
|
| | | | | | | | | | | | | | | |
| At June 30, |
| | At January 1, |
| | At June 30, |
| | At January 1, |
|
(dollars in millions) | 2019 |
| | 2019 |
| | 2018 |
| | 2018 |
|
Receivables(1) | $ | 12,173 |
| | $ | 12,104 |
| | $ | 11,412 |
| | $ | 12,073 |
|
Device payment plan agreement receivables(2) | 10,053 |
| | 8,940 |
| | 5,258 |
| | 1,461 |
|
| |
(1) | Balances do not include receivables related to the following contracts: leasing arrangements (such as towers), captive reinsurance arrangements primarily related to wireless device insurance and the interest on equipment financed on a device payment plan agreement when sold to the customer by an authorized agent. |
| |
(2) | Included in device payment plan agreement receivables presented in Note 7. Balances do not include receivables related to contracts completed prior to January 1, 2018 and receivables derived from the sale of equipment on a device payment plan through an authorized agent. |
The following table presents information about contract balances:
|
| | | | | | | | | | | | | | | |
| At June 30, |
| | At January 1, |
| | At June 30, |
| | At January 1, |
|
| 2019 |
| | 2019 |
| | 2018 |
| | 2018 |
|
Contract asset | $ | 1,059 |
| | $ | 1,003 |
| | $ | 1,059 |
| | $ | 1,170 |
|
Contract liability (1) | 4,946 |
| | 4,943 |
| | 4,652 |
| | 4,452 |
|
(1) Revenue recognized related to contract liabilities existing at January 1, 2019 and January 1, 2018 were $194 million and $3.9 billion, for the three and six months ended June 30, 2019, respectively, and $327 million and $3.8 billion, for the three and six months ended June 30, 2018.
The balance of contract assets and contract liabilities recorded in our condensed consolidated balance sheet were as follows:
|
| | | | | | | |
| At June 30, |
| | At December 31, |
|
(dollars in millions) | 2019 |
| | 2018 |
|
Assets | | | |
Prepaid expenses and other | $ | 812 |
| | $ | 757 |
|
Other assets | 247 |
| | 246 |
|
Total | $ | 1,059 |
| | $ | 1,003 |
|
| | | |
Liabilities | | | |
Other current liabilities | $ | 4,323 |
| | $ | 4,207 |
|
Other liabilities | 623 |
| | 736 |
|
Total | $ | 4,946 |
| | $ | 4,943 |
|
Contract Costs
Topic 606 requires the recognition of an asset for incremental costs to obtain a customer contract, which are then amortized to expense over the respective periods of expected benefit. We recognize an asset for incremental commission expenses paid to internal and external sales personnel and agents in conjunction with obtaining customer contracts. We only defer these costs when we have determined the commissions are incremental costs that would not have been incurred absent the customer contract and are expected to be recoverable. Costs to obtain a contract are amortized and recorded ratably as commission expense over the period representing the transfer of goods or services to which the assets relate. Costs to obtain wireless contracts are amortized over both of our Consumer and Business customers' estimated device upgrade cycles, as such costs are typically incurred each time a customer upgrades. Costs to obtain wireline contracts are amortized as expense over the estimated customer relationship period for our Consumer customers. Incremental costs to obtain wireline contracts for our Business customers are insignificant.
We also defer costs incurred to fulfill contracts that: (1) relate directly to the contract; (2) are expected to generate resources that will be used to satisfy our performance obligation under the contract; and (3) are expected to be recovered through revenue generated under the contract. Contract fulfillment costs are expensed as we satisfy our performance obligations and recorded in Cost of services. These costs principally relate to direct costs that enhance our wireline business resources, such as costs incurred to install circuits. Costs to obtain contracts are recorded in Selling, general and administrative expense.
We determine the amortization periods for our costs incurred to obtain or fulfill a customer contract at a portfolio level due to the similarities within these customer contract portfolios.
Other costs, such as general costs or costs related to past performance obligations, are expensed as incurred.
Collectively, costs to obtain a contract and costs to fulfill a contract are referred to as Deferred contract costs, and amortized over a two- to five-year period. Deferred contract costs are classified as current or non-current within Prepaid expenses and other and Other assets, respectively.
The balances of Deferred contract costs included in our condensed consolidated balance sheet were as follows:
|
| | | | | | | |
| At June 30, |
| | At December 31, |
|
(dollars in millions) | 2019 |
| | 2018 |
|
Assets | | | |
Prepaid expenses and other | $ | 2,352 |
| | $ | 2,083 |
|
Other assets | 1,774 |
| | 1,812 |
|
Total | $ | 4,126 |
| | $ | 3,895 |
|
For the three and six months ended June 30, 2019, we recognized expense of $639 million and $1.3 billion, respectively, associated with the amortization of Deferred contract costs, primarily within Selling, general and administrative expense in our condensed consolidated statements of income. For the three and six months ended June 30, 2018, we recognized expense of $471 million and $877 million, respectively, associated with the amortization of Deferred contract costs, primarily within Selling, general and administrative expense in our condensed consolidated statements of income.
We assess our Deferred contract costs for impairment on a quarterly basis. We recognize an impairment charge to the extent the carrying amount of a deferred cost exceeds the remaining amount of consideration we expect to receive in exchange for the goods and services related to the cost, less the expected costs related directly to providing those goods and services that have not yet been recognized as expenses. There have been no impairment charges recognized for the three and six months ended June 30, 2019 or June 30, 2018.
|
|
Note 3. Acquisitions and Divestitures |
Spectrum License Transactions
In 2019, the Federal Communications Commission (FCC) completed two millimeter wave spectrum license auctions. Verizon participated in these auctions and was the high bidder on 9 and 1,066 licenses, respectively, in the 24 Gigahertz (GHz) and 28 GHz bands. We submitted an application to the FCC and paid cash of approximately $521 million for the licenses that will be issued. The deposits related to these spectrum licenses are classified within Other assets in our condensed consolidated balance sheets as of June 30, 2019.
During both the three and six months ended June 30, 2019, we entered into and completed various other wireless license transactions for an insignificant amount of cash consideration.
Other
During both the three and six months ended June 30, 2019, we completed various other acquisitions for an insignificant amount of cash consideration.
|
|
Note 4. Wireless Licenses, Goodwill, and Other Intangible Assets |
Wireless Licenses
The carrying amounts of Wireless licenses are as follows:
|
| | | | | | |
| At June 30, |
| At December 31, |
|
(dollars in millions) | 2019 |
| 2018 |
|
Wireless licenses | $ | 94,333 |
| $ | 94,130 |
|
At June 30, 2019 and 2018, approximately $6.6 billion and $11.5 billion, respectively, of wireless licenses were under development for commercial service for which we were capitalizing interest costs. We recorded approximately $168 million and $269 million of capitalized interest on wireless licenses for the six months ended June 30, 2019 and 2018, respectively.
The average remaining renewal period of our wireless licenses portfolio was 4.3 years as of June 30, 2019.
Goodwill
The Company transitioned into our new reporting structure as of April 1, 2019. The table below shows the reallocation of goodwill from our historical reporting structure to our current reporting structure.
Changes in the carrying amount of Goodwill are as follows:
|
| | | | | | | | | | | | | | | | | | | | | | | |
(dollars in millions) | Consumer |
| | Business |
| | Wireless |
| | Wireline |
| | Other |
| | Total |
|
Balance at January 1, 2019 (1) | $ | — |
| | $ | — |
| | $ | 18,397 |
| | $ | 3,871 |
| | $ | 2,346 |
| | $ | 24,614 |
|
Acquisitions | — |
| | — |
| | — |
| | 20 |
| | — |
| | 20 |
|
Reclassifications, adjustments and other | — |
| | — |
| | — |
| | 1 |
| | — |
| | 1 |
|
Balance at March 31, 2019 | — |
| | — |
| | 18,397 |
| | 3,892 |
| | 2,346 |
| | 24,635 |
|
Reporting Unit reallocation (2) | 17,104 |
| | 7,269 |
| | (18,397 | ) | | (3,892 | ) | | (2,084 | ) | | — |
|
Balance at April 1, 2019 | 17,104 |
| | 7,269 |
| | — |
| | — |
| | 262 |
| | 24,635 |
|
Acquisitions | — |
|
| 1 |
| | — |
| | — |
| | — |
| | 1 |
|
Reclassifications, adjustments and other | — |
| | (4 | ) | | — |
| | — |
| | — |
| | (4 | ) |
Balance at June 30, 2019 | $ | 17,104 |
| | $ | 7,266 |
| | $ | — |
| | $ | — |
| | $ | 262 |
| | $ | 24,632 |
|
(1) Goodwill is net of accumulated impairment charge of $4.6 billion, related to our Media reporting unit (included within Other in the table above), which was recorded in the fourth quarter of 2018.
(2) Represents the reallocation of goodwill as a result of the Company reorganizing its segments as described in Note 1.
Other Intangible Assets
The following table displays the composition of Other intangible assets, net:
|
| | | | | | | | | | | | | | | | | | | | | | | |
| At June 30, 2019 | | | At December 31, 2018 | |
(dollars in millions) | Gross Amount |
| | Accumulated Amortization |
| | Net Amount |
| | Gross Amount |
| | Accumulated Amortization |
| | Net Amount |
|
Customer lists (8 to 13 years) | $ | 3,948 |
| | $ | (1,299 | ) | | $ | 2,649 |
| | $ | 3,951 |
| | $ | (1,121 | ) | | $ | 2,830 |
|
Non-network internal-use software (3 to 7 years) | 19,354 |
| | (13,589 | ) | | 5,765 |
| | 18,603 |
| | (12,785 | ) | | 5,818 |
|
Other (2 to 25 years) | 1,985 |
| | (925 | ) | | 1,060 |
| | 1,988 |
| | (861 | ) | | 1,127 |
|
Total | $ | 25,287 |
| | $ | (15,813 | ) | | $ | 9,474 |
| | $ | 24,542 |
| | $ | (14,767 | ) | | $ | 9,775 |
|
The amortization expense for Other intangible assets was as follows:
|
| | | | | | | |
| Three Months Ended |
| | Six Months Ended |
|
(dollars in millions) | June 30, |
| | June 30, |
|
2019 | $ | 569 |
| | $ | 1,124 |
|
2018 | 557 |
| | 1,091 |
|
The estimated future amortization expense for Other intangible assets for the remainder of the current year and next 5 years is as follows:
|
| | | |
Years | (dollars in millions) |
|
Remainder of 2019 | $ | 1,086 |
|
2020 | 1,903 |
|
2021 | 1,610 |
|
2022 | 1,335 |
|
2023 | 1,049 |
|
2024 | 795 |
|
|
|
Note 5. Leasing Arrangements |
We enter into various lease arrangements for network equipment including towers, distributed antenna systems, small cells, real estate and connectivity mediums including dark fiber, equipment leases, and other various types of assets for use in our operations. Our leases have remaining lease terms ranging from 1 year to 24 years, some of which include options that we can elect to extend the leases term for up to 25 years, and some of which include options to terminate the leases. For the majority of leases entered into during the current period, we have concluded it is not reasonably certain that we would exercise the options to extend the lease or terminate the lease. Therefore, as of the lease commencement date, our lease terms generally do not include these options. We include options to extend the lease when it is reasonably certain that we will exercise that option.
During March 2015, we completed a transaction with American Tower Corporation (American Tower) pursuant to which American Tower acquired the exclusive rights to lease and operate approximately 11,300 of our wireless towers for an upfront payment of $5.0 billion. We have subleased capacity on the towers from American Tower for a minimum of 10 years at current market rates in 2015, with options to renew. We continue to include the towers in Property, plant and equipment, net in our condensed consolidated balance sheets and depreciate them accordingly. In addition to the rights to lease and operate the towers, American Tower assumed the interest in the underlying ground leases related to these towers. While American Tower can renegotiate the terms of and is responsible for paying the ground leases, we are still the primary obligor for these leases and accordingly, the present value of these ground leases are included in our operating lease right-of-use assets and operating lease liabilities. We do not expect to be required to make ground lease payments unless American Tower defaults, which we determined to be remote.
The components of net lease cost were as follows:
|
| | | | | | | | |
| | Three Months Ended |
| | Six Months Ended |
|
| | June 30, |
| | June 30, |
|
(dollars in millions) | Classification | 2019 |
| | 2019 |
|
Operating lease cost (1) | Cost of services Selling, general and administrative expense | $ | 1,178 |
| | $ | 2,348 |
|
Finance lease cost: | | | | |
Amortization of right-of-use assets | Depreciation and amortization expense | 82 |
| | 168 |
|
Interest on lease liabilities | Interest expense | 10 |
| | 19 |
|
Short-term lease cost (1) | Cost of services Selling, general and administrative expense | 8 |
| | 24 |
|
Variable lease cost (1) | Cost of services
Selling, general and administrative expense | 51 |
| | 108 |
|
Sublease income | Service revenues and other | (67 | ) | | (134 | ) |
Total net lease cost | | $ | 1,262 |
| | $ | 2,533 |
|
(1) All operating lease costs, including short-term and variable lease costs, are split between Cost of services and Selling, general and administrative expense in the condensed consolidated statements of income based on the use of the facility that the rent is being paid on. See Note 1 for additional information. Variable lease costs represent payments that are dependent on a rate or index, or on usage of the asset.
Supplemental disclosure for the statement of cash flows related to operating and finance leases were as follows:
|
| | | |
| Six Months Ended |
|
| June 30, |
|
(dollars in millions) | 2019 |
|
Cash Flows from Operating Activities | |
Cash paid for amounts included in the measurement of lease liabilities | |
Operating cash flows for operating leases | $ | (2,089 | ) |
Operating cash flows for finance leases | (19 | ) |
Cash Flows from Financing Activities | |
Financing cash flows for finance leases | (178 | ) |
Supplemental lease cash flow disclosures | |
Operating lease right-of-use assets obtained in exchange for new operating lease liabilities | 1,300 |
|
Right-of-use assets obtained in exchange for new finance lease liabilities | 221 |
|
Supplemental disclosures for the balance sheet related to finance leases were as follows:
|
| | | |
| At June 30, |
|
(dollars in millions) | 2019 |
|
Assets | |
Property, plant and equipment, net | $ | 823 |
|
| |
Liabilities | |
Debt maturing within one year | $ | 321 |
|
Long-term debt | 627 |
|
Total Finance lease liabilities | $ | 948 |
|
The weighted-average remaining lease term and the weighted-average discount rate of our leases were as follows:
|
| | |
| At June 30, |
|
| 2019 |
|
Weighted-average remaining lease term (years) | |
Operating Leases | 9 |
|
Finance Leases | 4 |
|
Weighted-average discount rate | |
Operating Leases | 4.1 | % |
Finance Leases | 4.0 | % |
The Company's maturity analysis of operating and finance lease liabilities as of June 30, 2019 were as follows:
|
| | | | | | | |
(dollars in millions) | Operating Leases |
| | Finance Leases |
|
Remainder of 2019 | $ | 1,996 |
| | $ | 178 |
|
2020 | 3,840 |
| | 291 |
|
2021 | 3,460 |
| | 198 |
|
2022 | 3,067 |
| | 137 |
|
2023 | 2,713 |
| | 88 |
|
Thereafter | 11,094 |
| | 144 |
|
Total lease payments | 26,170 |
| | 1,036 |
|
Less interest | (4,762 | ) | | (88 | ) |
Present value of lease liabilities | 21,408 |
| | 948 |
|
Less current obligation | (3,154 | ) | | (321 | ) |
Long-term obligation at June 30, 2019 | $ | 18,254 |
| | $ | 627 |
|
As of June 30, 2019, we have contractually obligated lease payments amounting to $477 million for an office facility operating lease that has not yet commenced. We have legally obligated lease payments for various other operating leases that have not yet commenced for which the total obligation was not significant. We have certain rights and obligations for these leases, but have not recognized an operating lease right-of-use asset or an operating lease liability since they have not yet commenced.
Real Estate Transaction
On July 23, 2019, Verizon completed a sale-leaseback transaction for buildings and real estate. We received total gross proceeds of $1.0 billion. We lease backed a portion of the buildings and real estate sold and accounted for it as an operating lease. The term of the leaseback is for two years with four options to renew for an additional three months each.
Significant Debt Transactions
The following table shows the transactions that occurred during the six months ended June 30, 2019.
February Exchange Offers |
| | | | | | | |
(dollars in millions) | Principal Amount Exchanged |
| | Principal Amount Issued |
|
Verizon 1.750% - 5.150% notes and floating rate notes, due 2021 - 2025 | $ | 3,892 |
| | $ | — |
|
GTE LLC 8.750% debentures, due 2021 | 21 |
| | — |
|
Verizon 4.016% notes due 2029 (1) | — |
| | 4,000 |
|
Total | $ | 3,913 |
| | $ | 4,000 |
|
(1) Total exchange amount issued in consideration does not include an insignificant amount of cash used to settle.
May Tender Offers |
| | | | | | | |
(dollars in millions) | Principal Amount Purchased |
| | Cash Consideration (1) |
|
Verizon 5.012% notes due 2054 | $ | 3,192 |
| | $ | 3,626 |
|
Verizon 4.672% notes due 2055 | 1,308 |
| | 1,404 |
|
Total | $ | 4,500 |
| | $ | 5,030 |
|
(1) In addition to the purchase price, any accrued and unpaid interest on the purchased notes was paid to the date of purchase.
Debt Redemptions, Repurchases and Repayments |
| | | | | | |
(dollars in millions) | Principal Redeemed / Repaid |
| | Amount Paid as % of Principal (1) |
|
March 2019 | | | |
Verizon 5.900% notes due 2054 | $ | 500 |
| | 100.000 | % |
Verizon 1.375% notes due 2019 | 206 |
| | 100.000 | % |
Verizon 1.750% notes due 2021 | 621 |
| | 100.000 | % |
Verizon 3.000% notes due 2021 | 930 |
| | 101.061 | % |
Verizon 3.500% notes due 2021 | 315 |
| | 102.180 | % |
Open market repurchases of various Verizon notes | 163 |
| | Various |
|
March 2019 total | 2,735 |
| | |
| | | |
June 2019 | | | |
Verizon 2.625% notes due 2020 | 831 |
| | 100.037 | % |
Verizon 3.500% notes due 2021 | 736 |
| | 102.238 | % |
Verizon floating rate (LIBOR + 0.770%) notes due 2019 | 229 |
| | 100.000 | % |
June 2019 total | 1,796 |
| | |
Total | $ | 4,531 |
| | |
(1) Percentages represent price paid to redeem, repurchase and repay.
Debt Issuances |
| | | | | | | |
(amounts in millions) | Principal Amount Issued |
| | Net Proceeds (1) |
|
March 2019 | | | |
Verizon 3.875% notes due 2029 (2) | $ | 1,000 |
| | $ | 994 |
|
Verizon 5.000% notes due 2051 | 510 |
| | 506 |
|
March 2019 total | $ | 1,510 |
| | $ | 1,500 |
|
| | | |
June 2019 | | | |
Verizon 0.875% notes due 2027 | € | 1,250 |
| | 1,391 |
|
Verizon 1.250% notes due 2030 | € | 1,250 |
| | 1,385 |
|
Verizon 2.500% notes due 2031 | £ | 500 |
| | 647 |
|
June 2019 total |
|
| | 3,423 |
|
Total | | | $ | 4,923 |
|
(1) Net proceeds were net of discount and issuance costs.
(2) An amount equal to the net proceeds from this green bond will be used to fund, in whole or in part, "Eligible Green Investments." "Eligible Green Investments" include new and existing investments made by us during the period from two years prior to the issuance of the green bond through the maturity date of the green bond, in the following categories: (1) renewable energy; (2) energy efficiency; (3) green buildings; (4) sustainable water management; and (5) biodiversity and conservation.
Short-Term Borrowing and Commercial Paper Program
During the three months ended June 30, 2019, we repaid $600 million in aggregate from the short term credit facility and there was no outstanding balance as of June 30, 2019.
As of June 30, 2019, we had $200 million of commercial paper outstanding.
Asset-Backed Debt
As of June 30, 2019, the carrying value of our asset-backed debt was $11.3 billion. Our asset-backed debt includes Asset-Backed Notes (ABS Notes) issued to third-party investors (Investors) and loans (ABS Financing Facilities) received from banks and their conduit facilities (collectively, the Banks). Our consolidated asset-backed debt bankruptcy remote legal entities (each, an ABS Entity or collectively, the ABS Entities) issue the debt or are otherwise party to the transaction documentation in connection with our asset-backed debt transactions. Under the terms of our asset-backed debt, Cellco Partnership (Cellco) and certain other affiliates of Verizon (collectively, the Originators) transfer device payment plan agreement receivables to one of the ABS Entities, which in turn transfers such receivables to another ABS Entity that issues the debt. Verizon entities retain the equity interests in the ABS Entities, which represent the rights to all funds not needed to make required payments on the asset-backed debt and other related payments and expenses.
Our asset-backed debt is secured by the transferred device payment plan agreement receivables and future collections on such receivables. The device payment plan agreement receivables transferred to the ABS Entities and related assets, consisting primarily of restricted cash, will only be available for payment of asset-backed debt and expenses related thereto, payments to the Originators in respect of additional transfers of device payment plan agreement receivables, and other obligations arising from our asset-backed debt transactions, and will not be available to pay other obligations or claims of Verizon’s creditors until the associated asset-backed debt and other obligations are satisfied. The Investors or Banks, as applicable, which hold our asset-backed debt have legal recourse to the assets securing the debt, but do not have any recourse to Verizon with respect to the payment of principal and interest on the debt. Under a parent support agreement, Verizon has agreed to guarantee certain of the payment obligations of Cellco and the Originators to the ABS Entities.
Cash collections on the device payment plan agreement receivables collateralizing asset-backed debt securities are required at certain specified times to be placed into segregated accounts. Deposits to the segregated accounts are considered restricted cash and are included in Prepaid expenses and other and Other assets in our condensed consolidated balance sheets.
Proceeds from our asset-backed debt transactions are reflected in Cash flows from financing activities in our condensed consolidated statements of cash flows. The asset-backed debt issued and the assets securing this debt are included in our condensed consolidated balance sheets.
ABS Notes
During the six months ended June 30, 2019, we completed the following ABS Notes transactions:
|
| | | | | | |
(dollars in millions) | Interest Rates % | | Expected Weighted-average Life to Maturity (in years) | Principal Amount Issued |
|
March 2019 | | | | |
A-1a Senior class notes | 2.930 | | 2.50 | $ | 900 |
|
A-1b Senior floating rate class notes | LIBOR + 0.330 | (1) | 2.50 | 100 |
|
B Junior class notes | 3.020 | | 3.22 | 69 |
|
C Junior class notes | 3.220 | | 3.40 | 53 |
|
March 2019 total | | | | 1,122 |
|
| | | | |
June 2019 | | | | |
A-1a Senior class notes | 2.330 | | 2.52 | 855 |
|
A-1b Senior floating rate class notes | LIBOR + 0.450 | (1) | 2.52 | 145 |
|
B Junior class notes | 2.400 | | 3.28 | 69 |
|
C Junior class notes | 2.600 | | 3.47 | 53 |
|
June 2019 total | | | | 1,122 |
|
Total | | | | $ | 2,244 |
|
(1) The one-month London Interbank Offered Rate (LIBOR) rate at June 30, 2019 was 2.398%.
Under the terms of each series of ABS Notes, there is a two year revolving period during which we may transfer additional receivables to the ABS Entity. In April 2019, the two year revolving period of the ABS Notes issued in March 2017 ended and we began to repay principal on the 2017-1 Class A senior ABS Notes. During the three and six months ended June 30, 2019, we made aggregate principal repayments of $794 million and $1.4 billion, respectively, for all ABS Notes.
ABS Financing Facilities
In May 2018, we entered into an ABS financing facility with a number of financial institutions (2018 ABS Financing Facility). One loan agreement was entered into in connection with the 2018 ABS financing facility. During the three months ended June 30, 2019, the remaining $540 million outstanding under the loan agreement was prepaid, and the loan agreement was terminated.
In September 2016, we entered into an ABS Financing Facility with a number of financial institutions, which was amended and restated in May 2019 (2019 ABS Financing Facility). Under the terms of the 2019 ABS Financing Facility, the financial institutions made advances under asset-backed loans backed by device payment plan agreement receivables of both consumer and business customers. Two loan agreements were entered into in connection with the 2019 ABS Financing Facility in September 2016 and May 2017 and a third was entered into in May 2019. The 2016 and 2017 loan agreements had a final maturity date in March 2021 and bore interest at a floating rate. The two year revolving period of the two loan agreements ended in September 2018. The 2019 loan agreement has a final maturity date in May 2023 and bears interest at floating rates. There is a one year revolving period until May 2020, which may be extended with the approval of the financial institutions. Under all of the loan agreements, we have the right to prepay all or a portion of the advances at any time without penalty, but in certain cases, with breakage costs. Subject to certain conditions, we may also remove receivables from the ABS Entity. During the three months ended June 30, 2019, we paid off both the 2016 and 2017 loans for an aggregate of $671 million primarily with proceeds from the 2019 loan agreement. As of June 30, 2019, there was an outstanding balance under the 2019 ABS Financing Facility of $1.8 billion. In August 2019, we prepaid $1.5 billion of the loan made in May 2019 under the 2019 ABS Financing Facility.
Variable Interest Entities (VIEs)
The ABS Entities meet the definition of a VIE for which we have determined that we are the primary beneficiary as we have both the power to direct the activities of the entity that most significantly impact the entity’s performance and the obligation to absorb losses or the right to receive benefits of the entity. Therefore, the assets, liabilities and activities of the ABS Entities are consolidated in our financial results and are included in amounts presented on the face of our condensed consolidated balance sheets.
The assets and liabilities related to our asset-backed debt arrangements included in our condensed consolidated balance sheets were as follows:
|
| | | | | | | |
| At June 30, |
| | At December 31, |
|
(dollars in millions) | 2019 |
| | 2018 |
|
Assets | | | |
Account receivable, net | $ | 10,095 |
| | $ | 8,861 |
|
Prepaid expenses and other | 1,020 |
| | 989 |
|
Other assets | 3,353 |
| | 2,725 |
|
| | | |
Liabilities | | | |
Accounts payable and accrued liabilities | 11 |
| | 7 |
|
Short-term portion of long-term debt | 4,477 |
| | 5,352 |
|
Long-term debt | 6,775 |
| | 4,724 |
|
See Note 7 for additional information on device payment plan agreement receivables used to secure asset-backed debt.
Credit Facilities
As of June 30, 2019, the unused borrowing capacity under our $9.5 billion credit facility was approximately $9.4 billion. The credit facility does not require us to comply with financial covenants or maintain specified credit ratings, and it permits us to borrow even if our business has incurred a material adverse change. We use the credit facility for the issuance of letters of credit and for general corporate purposes.
In March 2016, we entered into a $1.0 billion credit facility insured by Eksportkreditnamnden, an export credit agency with a maturity date of December 2024. As of June 30, 2019, the outstanding balance was $647 million. We used this credit facility to finance network equipment-related purchases. In July 2017, we entered into credit facilities insured by various export credit agencies providing us with the ability to borrow up to $4.0 billion to finance equipment-related purchases with maturity dates ranging from July 2022 to May 2027. The facilities have multiple borrowings available, portions of which extend through October 2019, contingent upon the amount of eligible equipment-related purchases that we make. During the three and six months ended June 30, 2019, we drew down $450 million and $874 million, respectively, from these facilities. During the six months ended June 30, 2018, we drew down $1.7 billion from these facilities. As of June 30, 2019, we had an outstanding balance of $3.5 billion.
Non-Cash Transaction
During the six months ended June 30, 2019 and 2018, we financed, primarily through vendor financing arrangements, the purchase of approximately $221 million and $862 million respectively, of long-lived assets consisting primarily of network equipment. At both June 30, 2019 and 2018, $1.0 billion and $1.4 billion, respectively, relating to these financing arrangements, including those entered into in prior years and liabilities assumed through acquisitions, remained outstanding. These purchases are non-cash financing activities and therefore are not reflected within Capital expenditures in our condensed consolidated statements of cash flows.
Early Debt Redemptions
During both the three and six months ended June 30, 2019, we recorded losses on early debt redemptions of $1.5 billion related to the May tender offers and other insignificant transactions, which were recorded in Other income (expense), net in our condensed consolidated statements of income.
During the six months ended June 30, 2018, we recorded losses on early debt redemptions of $249 million related to the 2018 March tender offers for 13 series of notes issued by Verizon with coupon rates ranging from 1.750% to 5.012% and maturity dates ranging from 2021 to 2055, which were recorded in Other income (expense), net in our condensed consolidated statements of income.
Guarantees
We guarantee the debentures of our operating telephone company subsidiaries. As of June 30, 2019, $796 million aggregate principal amount of these obligations remained outstanding. Each guarantee will remain in place for the life of the obligation unless terminated pursuant to its terms, including the operating telephone company no longer being a wholly-owned subsidiary of Verizon.
We also guarantee the debt obligations of GTE LLC as successor in interest to GTE Corporation that were issued and outstanding prior to July 1, 2003. As of June 30, 2019, $423 million aggregate principal amount of these obligations remained outstanding.
|
|
Note 7. Wireless Device Payment Plans |
Under the Verizon device payment program, our eligible wireless customers purchase wireless devices under a device payment plan agreement. Customers that activate service on devices purchased under the device payment program pay lower service fees as compared to those under our fixed-term service plans, and their device payment plan charge is included on their wireless monthly bill. As of January 2017, we no longer offer Consumer customers new fixed-term, subsidized service plans for phones; however, we continue to offer subsidized plans to our Business
customers. We also continue to service existing plans for customers who have not yet purchased and activated devices under the Verizon device payment program.
Wireless Device Payment Plan Agreement Receivables
The following table displays device payment plan agreement receivables, net, recognized in our condensed consolidated balance sheets:
|
| | | | | | | |
| At June 30, |
| | At December 31, |
|
(dollars in millions) | 2019 |
| | 2018 |
|
Device payment plan agreement receivables, gross | $ | 18,327 |
| | $ | 19,313 |
|
Unamortized imputed interest | (455 | ) | | (546 | ) |
Device payment plan agreement receivables, net of unamortized imputed interest | 17,872 |
| | 18,767 |
|
Allowance for credit losses | (487 | ) | | (597 | ) |
Device payment plan agreement receivables, net | $ | 17,385 |
| | $ | 18,170 |
|
| | | |
Classified in our condensed consolidated balance sheets: | | | |
Accounts receivable, net | $ | 12,486 |
| | $ | 12,624 |
|
Other assets | 4,899 |
| | 5,546 |
|
Device payment plan agreement receivables, net | $ | 17,385 |
| | $ | 18,170 |
|
Included in our device payment plan agreement receivables, net at June 30, 2019 and December 31, 2018, are net device payment plan agreement receivables of $13.4 billion and $11.5 billion, respectively, that have been transferred to ABS Entities and continue to be reported in our condensed consolidated balance sheets. See Note 6 for additional information. We believe the carrying value of our installment loans receivables approximate their fair value using a Level 3 expected cash flow model.
We may offer certain promotions that allow a customer to trade in their owned device in connection with the purchase of a new device. Under these types of promotions, the customer receives a credit for the value of the trade-in device. In addition, we may provide the customer with additional future credits that will be applied against the customer’s monthly bill as long as service is maintained. We recognize a liability for the trade-in device measured at fair value, which is determined by considering several factors, including the weighted-average selling prices obtained in recent resales of similar devices eligible for trade-in. Future credits are recognized when earned by the customer. Device payment plan agreement receivables, net does not reflect the trade-in device liability. At June 30, 2019 and December 31, 2018 the amount of trade-in liability was $60 million and $64 million, respectively.
From time to time, we offer certain marketing promotions that allow our customers to upgrade to a new device after paying down a certain specified portion of the required device payment plan agreement amount as well as trading in their device in good working order. When a customer enters into a device payment plan agreement with the right to upgrade to a new device, we account for this trade-in right as a guarantee obligation.
For indirect channel wireless contracts with customers, we impute risk adjusted interest on the device payment plan agreement receivables. We record the imputed interest as a reduction to the related accounts receivable. Interest income, which is included within Service revenues and other in our condensed consolidated statements of income, is recognized over the financed device payment term.
When originating device payment plan agreements, we use internal and external data sources to create a credit risk score to measure the credit quality of a customer and to determine eligibility for the device payment program. If a customer is either new to Verizon Wireless or has less than 210 days of customer tenure with Verizon Wireless (a new customer), the credit decision process relies more heavily on external data sources. If the customer has 210 days or more of customer tenure with Verizon Wireless (an existing customer), the credit decision process relies on internal data sources. Verizon Wireless’ experience has been that the payment attributes of longer tenured customers are highly predictive for estimating their reliability to make future payments. External data sources include obtaining a credit report from a national consumer credit reporting agency, if available. Verizon Wireless uses its internal data and/or credit data obtained from the credit reporting agencies to create a custom credit risk score. The custom credit risk score is generated automatically (except with respect to a small number of applications where the information needs manual intervention) from the applicant’s credit data using Verizon Wireless’ proprietary custom credit models, which are empirically derived, demonstrably and statistically sound. The credit risk score measures the likelihood that the potential customer will become severely delinquent and be disconnected for non-payment. For a small portion of new customer applications, a traditional credit report is not available from one of the national credit reporting agencies because the potential customer does not have sufficient credit history. In those instances, alternate credit data is used for the risk assessment.
Based on the custom credit risk score, we assign each customer to a credit class, each of which has specified offers of credit including an account level spending limit and either a maximum amount of credit allowed per device or a required down payment percentage. During the fourth quarter of 2018 Verizon Wireless moved all customers, new and existing, from a required down payment percentage, between zero and 100%, to a maximum amount of credit per device.
Subsequent to origination, Verizon Wireless monitors delinquency and write-off experience as key credit quality indicators for its portfolio of device payment plan agreements and fixed-term service plans. The extent of our collection efforts with respect to a particular customer are based on the results of proprietary custom empirically derived internal behavioral scoring models that analyze the customer’s past performance to
predict the likelihood of the customer falling further delinquent. These customer scoring models assess a number of variables, including origination characteristics, customer account history and payment patterns. Based on the score derived from these models, accounts are grouped by risk category to determine the collection strategy to be applied to such accounts. We continuously monitor collection performance results and the credit quality of our device payment plan agreement receivables based on a variety of metrics, including aging. Verizon Wireless considers an account to be delinquent and in default status if there are unpaid charges remaining on the account on the day after the bill’s due date.
The balance and aging of the device payment plan agreement receivables on a gross basis were as follows:
|
| | | | | | | |
| At June 30, |
| | At December 31, |
|
(dollars in millions) | 2019 |
| | 2018 |
|
Unbilled | $ | 17,042 |
| | $ | 18,043 |
|
Billed: | | | |
Current | 1,028 |
| | 986 |
|
Past due | 257 |
| | 284 |
|
Device payment plan agreement receivables, gross | $ | 18,327 |
| | $ | 19,313 |
|
Activity in the allowance for credit losses for the device payment plan agreement receivables was as follows:
|
| | | | | | | |
(dollars in millions) | 2019 |
| | 2018 |
|
Balance at January 1, | $ | 597 |
| | $ | 848 |
|
Bad debt expense | 401 |
| | 237 |
|
Write-offs | (511 | ) | | (331 | ) |
Balance at June 30, | $ | 487 |
| | $ | 754 |
|
|
|
Note 8. Fair Value Measurements |
Recurring Fair Value Measurements
The following table presents the balances of assets and liabilities measured at fair value on a recurring basis as of June 30, 2019:
|
| | | | | | | | | | | | | | | |
(dollars in millions) | Level 1(1) |
| | Level 2(2) |
| | Level 3(3) |
| | Total |
|
Assets: | | | | | | | |
Other assets: | | | | | | | |
Fixed income securities | $ | — |
| | $ | 434 |
| | $ | — |
| | $ | 434 |
|
Interest rate swaps | — |
| | 529 |
| | — |
| | 529 |
|
Cross currency swaps | — |
| | 170 |
| | — |
| | 170 |
|
Interest rate caps | — |
| | 2 |
| | — |
| | 2 |
|
Foreign exchange forwards | — |
| | 5 |
| | — |
| | 5 |
|
Total | $ | — |
| | $ | 1,140 |
| | $ | — |
| | $ | 1,140 |
|
| | | | | | | |
Liabilities: | | | | | | | |
Other liabilities: | | | | | | | |
Interest rate swaps | $ | — |
| | $ | 189 |
| | $ | — |
| | $ | 189 |
|
Cross currency swaps | — |
| | 814 |
| | — |
| | 814 |
|
Forward starting interest rate swaps | — |
| | 536 |
| | — |
| | 536 |
|
Interest rate caps | — |
| | 1 |
| | — |
| | 1 |
|
Total | $ | — |
| | $ | 1,540 |
| | $ | — |
| | $ | 1,540 |
|
The following table presents the balances of assets and liabilities measured at fair value on a recurring basis as of December 31, 2018:
|
| | | | | | | | | | | | | | | |
(dollars in millions) | Level 1(1) |
| | Level 2(2) |
| | Level 3(3) |
| | Total |
|
Assets: | | | | | | | |
Other assets: | | | | | | | |
Fixed income securities | $ | — |
| | $ | 405 |
| | $ | — |
| | $ | 405 |
|
Interest rate swaps | — |
| | 3 |
| | — |
| | 3 |
|
Cross currency swaps | — |
| | 220 |
| | — |
| | 220 |
|
Interest rate caps | — |
| | 14 |
| | — |
| | 14 |
|
Total | $ | — |
| | $ | 642 |
| | $ | — |
| | $ | 642 |
|
| | | | | | | |
Liabilities: | | | | | | | |
Other liabilities: | | | | | | | |
Interest rate swaps | $ | — |
| | $ | 813 |
| | $ | — |
| | $ | 813 |
|
Cross currency swaps | — |
| | 536 |
| | — |
| | 536 |
|
Forward starting interest rate swaps | — |
| | 60 |
| | — |
| | 60 |
|
Interest rate caps | — |
| | 4 |
| | — |
| | 4 |
|
Total | $ | — |
| | $ | 1,413 |
| | $ | — |
| | $ | 1,413 |
|
| |
(1) | Quoted prices in active markets for identical assets or liabilities |
| |
(2) | Observable inputs other than quoted prices in active markets for identical assets and liabilities |
| |
(3) | Unobservable pricing inputs in the market |
Certain of our equity investments do not have readily determinable fair values and are excluded from the tables above. Such investments are measured at cost, less any impairment, plus or minus changes resulting from observable price changes in orderly transactions for an identical or similar investment of the same issuer and are included in Investments in unconsolidated businesses in our condensed consolidated balance sheets. As of June 30, 2019 and December 31, 2018, the carrying amount of our investments without readily determinable fair values were $289 million and $248 million, respectively. During the three and six months ended June 30, 2019, there were insignificant adjustments due to observable price changes and there were no impairment charges. Cumulative adjustments due to observable price changes and impairment charges were $58 million and insignificant, respectively.
Fixed income securities consist primarily of investments in municipal bonds. For fixed income securities that do not have quoted prices in active markets, we use alternative matrix pricing resulting in these debt securities being classified as Level 2.
Derivative contracts are valued using models based on readily observable market parameters for all substantial terms of our derivative contracts and thus are classified within Level 2. We use mid-market pricing for fair value measurements of our derivative instruments. Our derivative instruments are recorded on a gross basis.
We recognize transfers between levels of the fair value hierarchy as of the end of the reporting period. There were no transfers between Level 1 and Level 2 during the six months ended June 30, 2019 and 2018.
Fair Value of Short-term and Long-term Debt
The fair value of our debt is determined using various methods, including quoted prices for identical terms and maturities, which is a Level 1 measurement, as well as quoted prices for similar terms and maturities in inactive markets and future cash flows discounted at current rates, which are Level 2 measurements. The fair value of our short-term and long-term debt, excluding finance leases, was as follows:
|
| | | | | | | | | | | | | | | |
| At June 30, | | | At December 31, | |
| 2019 | | | 2018 | |
(dollars in millions) | Carrying Amount |
| | Fair Value |
| | Carrying Amount |
| | Fair Value |
|
Short- and long-term debt, excluding finance leases | $ | 112,424 |
| | $ | 129,342 |
| | $ | 112,159 |
| | $ | 118,535 |
|
Derivative Instruments
The following table sets forth the notional amounts of our outstanding derivative instruments:
|
| | | | | | | |
| At June 30, |
| | At December 31, |
|
(dollars in millions) | 2019 |
| | 2018 |
|
Interest rate swaps | $ | 19,084 |
| | $ | 19,813 |
|
Cross currency swaps | 20,091 |
| | 16,638 |
|
Forward starting interest rate swaps | 3,000 |
| | 4,000 |
|
Interest rate caps | 1,292 |
| | 2,218 |
|
Foreign exchange forwards | 1,035 |
| | 600 |
|
Interest Rate Swaps
We enter into interest rate swaps to achieve a targeted mix of fixed and variable rate debt. We principally receive fixed rates and pay variable rates based on LIBOR, resulting in a net increase or decrease to Interest expense. These swaps are designated as fair value hedges and hedge against interest rate risk exposure of designated debt issuances. We record the interest rate swaps at fair value in our condensed consolidated balance sheets as assets and liabilities. Changes in the fair value of the interest rate swaps are recorded to Interest expense, which are offset by changes in the fair value of the hedged debt due to changes in interest rates.
During the six months ended June 30, 2019, we entered into interest rate swaps with a total notional value of $510 million and settled interest rate swaps with a total notional value of $1.2 billion.
The ineffective portions of these interest rate swaps for the three and six months ended June 30, 2019 were insignificant and $60 million, respectively, and insignificant for the similar periods in 2018.
The following amounts were recorded in Long-term debt in our condensed consolidated balance sheets related to cumulative basis adjustments for fair value hedges:
|
| | | | | | | |
| At June 30, |
| | At December 31, |
|
(dollars in millions) | 2019 |
| | 2018 |
|
Carrying amount of hedged liabilities | $ | 19,341 |
| | $ | 18,903 |
|
Cumulative amount of fair value hedging adjustment included in the carrying amount of the hedged liabilities | 373 |
| | (785 | ) |
Cross Currency Swaps
We have entered into cross currency swaps designated as cash flow hedges to exchange our British Pound Sterling, Euro, Swiss Franc and Australian Dollar-denominated cash flows into U.S. dollars and to fix our cash payments in U.S. dollars, as well as to mitigate the impact of foreign currency transaction gains or losses.
During the three and six months ended June 30, 2019, we entered into cross currency swaps with a total notional value of $3.5 billion. During the three and six months ended June 30, 2019, pre-tax losses of $340 million and $328 million, respectively, were recognized in Other comprehensive income (loss). During the three and six months ended June 30, 2018, a pre-tax loss of $1.1 billion and an insignificant pretax gain, respectively, were recognized in Other comprehensive income (loss). A portion of the gains recognized in Other comprehensive income (loss) was reclassified to Other income (expense), net to offset the related pre-tax foreign currency transaction gain or loss on the underlying hedged item.
Forward Starting Interest Rate Swaps
We have entered into forward starting interest rate swaps designated as cash flow hedges in order to manage our exposure to interest rate changes on future forecasted transactions.
During the three and six months ended June 30, 2019, we did not enter into any new forward starting interest rate swaps. During the three months ended June 30, 2019, we did not settle any forward starting interest rate swaps and for the six months ended June 30, 2019, we settled swaps with a total notional value of $1.0 billion. During the three and six months ended June 30, 2019, pre-tax losses of $293 million and $497 million, respectively, were recognized in Other comprehensive income (loss).
We hedge our exposure to the variability in future cash flows based on the expected maturities of the related forecasted debt issuance.
Net Investment Hedges
We have designated certain foreign currency debt instruments as net investment hedges to mitigate foreign exchange exposure related to non-U.S. dollar net investments in certain foreign subsidiaries against changes in foreign exchange rates. The notional amount of the Euro-denominated debt as a net investment hedge was €750 million as of both June 30, 2019 and December 31, 2018.
Undesignated Derivatives
We also have the following derivative contracts which we use as economic hedges but for which we have elected not to apply hedge accounting.
Interest Rate Caps
We enter into interest rate caps to mitigate our interest exposure to interest rate increases on our ABS Financing Facilities and ABS Notes. During the three and six months ended June 30, 2019 and 2018, we recognized an insignificant amount in Interest expense.
Foreign Exchange Forwards
We enter into British Pound Sterling and Euro foreign exchange forwards to mitigate our foreign exchange rate risk related to non-functional currency denominated monetary assets and liabilities of international subsidiaries. During the three and six months ended June 30, 2019, we entered into foreign exchange forwards with a total notional value of $3.1 billion and $6.1 billion, respectively, and settled foreign exchange forwards with a total notional value of $3.0 billion and $5.6 billion, respectively. During the three and six months ended June 30, 2019, we recognized an insignificant amount in Other income (expense), net.
Concentrations of Credit Risk
Financial instruments that subject us to concentrations of credit risk consist primarily of temporary cash investments, short-term and long-term investments, trade receivables, including device payment plan agreement receivables, certain notes receivable, including lease receivables, and derivative contracts.
Counterparties to our derivative contracts are major financial institutions with whom we have negotiated derivatives agreements (ISDA master agreements) and credit support annex (CSA) agreements which provide rules for collateral exchange. Negotiations and executions of new ISDA master agreements and CSA agreements with our counterparties continued throughout 2018 and 2019. The newly executed CSA agreements contain rating based thresholds such that we or our counterparties may be required to hold or post collateral based upon changes in outstanding positions as compared to established thresholds and changes in credit ratings. At June 30, 2019 we held approximately $0.1 billion and at December 31, 2018 we posted approximately $0.1 billion of collateral related to derivative contracts under collateral exchange arrangements, which were recorded as Other current liabilities and Prepaid expenses and other, respectively, in our condensed consolidated balance sheets. While we may be exposed to credit losses due to the nonperformance of our counterparties, we consider the risk remote and do not expect that any such nonperformance would result in a significant effect on our results of operations or financial condition due to our diversified pool of counterparties.
|
|
Note 9. Employee Benefits |
We maintain non-contributory defined benefit pension plans for certain employees. In addition, we maintain postretirement health care and life insurance plans for certain retirees and their dependents, which are both contributory and non-contributory, and include a limit on our share of the cost for certain current and future retirees. In accordance with our accounting policy for pension and other postretirement benefits, operating expenses include service costs associated with pension and other postretirement benefits while other credits and/or charges based on actuarial assumptions, including projected discount rates, an estimated return on plan assets, and impact from health care trend rates are reported in Other income (expense), net. These estimates are updated in the fourth quarter to reflect actual return on plan assets and updated actuarial assumptions or upon a remeasurement event. The adjustment is recognized in the income statement during the fourth quarter or upon a remeasurement event pursuant to our accounting policy for the recognition of actuarial gains and losses.
Net Periodic Benefit Cost (Income)
The following table summarizes the components of net periodic benefit cost (income) related to our pension and postretirement health care and life insurance plans:
|
| | | | | | | | | | | | | | | |
| (dollars in millions) | |
| Pension | | Health Care and Life | |
Three Months Ended June 30, | 2019 |
| | 2018 |
| | 2019 |
| | 2018 |
|
Service cost - Cost of services | $ | 50 |
| | $ | 59 |
| | $ | 19 |
| | $ | 26 |
|
Service cost - Selling, general and administrative expense | 12 |
| | 14 |
| | 5 |
| | 6 |
|
Service cost | $ | 62 |
| | $ | 73 |
| | $ | 24 |
| | $ | 32 |
|
| | | | | | | |
Amortization of prior service cost (credit) | $ | 16 |
| | $ | 10 |
| | $ | (243 | ) | | $ | (244 | ) |
Expected return on plan assets | (282 | ) | | (329 | ) | | (10 | ) | | (11 | ) |
Interest cost | 176 |
| | 166 |
| | 158 |
| | 154 |
|
Other components | $ | (90 | ) | | $ | (153 | ) | | $ | (95 | ) | | $ | (101 | ) |
| | | | | | | |
Total | $ | (28 | ) | | $ | (80 | ) | | $ | (71 | ) | | $ | (69 | ) |
|
| | | | | | | | | | | | | | | |
| (dollars in millions) | |
| Pension | | Health Care and Life | |
Six Months Ended June 30, | 2019 |
| | 2018 |
| | 2019 |
| | 2018 |
|
Service cost - Cost of services | $ | 100 |
| | $ | 117 |
| | $ | 39 |
| | $ | 52 |
|
Service cost - Selling, general and administrative expense | 23 |
| | 28 |
| | 9 |
| | 12 |
|
Service cost | $ | 123 |
| | $ | 145 |
| | $ | 48 |
| | $ | 64 |
|
| | | | | | | |
Amortization of prior service cost (credit) | $ | 31 |
| | $ | 20 |
| | $ | (486 | ) | | $ | (488 | ) |
Expected return on plan assets | (564 | ) | | (658 | ) | | (19 | ) | | (22 | ) |
Interest cost | 354 |
| | 332 |
| | 315 |
| | 307 |
|
Remeasurement gain, net | (96 | ) | | — |
| | — |
| | — |
|
Other components | $ | (275 | ) | | $ | (306 | ) | | $ | (190 | ) | | $ | (203 | ) |
| | | | | | | |
Total | $ | (152 | ) | | $ | (161 | ) | | $ | (142 | ) | | $ | (139 | ) |
The service cost component of net periodic benefit cost (income) is recorded in Cost of services and Selling, general and administrative expense in the condensed consolidated statements of income while the other components, including mark-to-market adjustments, if any, are recorded in Other income (expense), net.
2018 Voluntary Separation Program
In September 2018, we announced a Voluntary Separation Program for select U.S.-based management employees. Approximately 10,400 eligible employees separated from the Company under this program as of the end of June 2019. The severance benefits payments to these employees are expected to be substantially completed by the end of September 2019.
Severance Payments
During the three and six months ended June 30, 2019, we paid severance benefits of $643 million and $1.5 billion, respectively. During both the three and six month ended June 30, 2019, we recorded net pre-tax severance charges of an insignificant amount. At June 30, 2019, we had a remaining severance liability of $765 million, a portion of which includes future contractual payments to employees separated as a result of the Voluntary Separation Program.
Employer Contributions
During the six months ended June 30, 2019, we made a discretionary contribution of $300 million to our qualified pension plans. As a result of the $300 million and $1.0 billion discretionary pension contributions during the six months ended June 30, 2019 and 2018, respectively, we do not expect mandatory pension funding through December 31, 2019. There was no contribution made to our nonqualified pension plans during the three and six months ended June 30, 2019. There have been no significant changes with respect to the nonqualified pension and other postretirement benefit plans contributions in 2019.
Remeasurement gain, net
During the six months ended June 30, 2019, we recorded a net pre-tax remeasurement gain of $96 million in our pension plans triggered by the Voluntary Separation Program for select U.S.-based management employees and other headcount reduction initiatives, primarily driven by a $150 million credit due to the difference between our estimated return on assets and our actual return on assets, offset by a $54 million charge due to a change in our discount rate assumption used to determine the current year liabilities of our pension plans.
|
|
Note 10. Equity and Accumulated Other Comprehensive Income |
Equity
Changes in the components of Total equity were as follows:
|
| | | | | | | | | | | | | | |
(dollars in millions, except per share amounts, and shares in thousands) |
Three months ended June 30, | 2019 |
| | | | 2018 |
| | | |
| Shares |
| | Amount |
| | Shares |
| | Amount |
| |
Common Stock | | | | | | | | |
Balance at beginning of period | 4,291,434 |
| | $ | 429 |
| | 4,291,422 |
| | $ | 429 |
| |
Common shares issued | — |
| | — |
| | 12 |
| | — |
| |
Balance at end of period | 4,291,434 |
| | 429 |
| | 4,291,434 |
| | 429 |
| |
| | | | | | | | |
Additional Paid In Capital | | | | | | | | |
Balance at beginning of period | | | 13,418 |
| | | | 13,437 |
| |
Other | | | 1 |
| | | | 1 |
| |
Balance at end of period | | | 13,419 |
| | | | 13,438 |
| |
| | | | | | | | |
Retained Earnings | | | | | | | | |
Balance at beginning of period | | | 46,493 |
| | | | 39,974 |
| |
Net income attributable to Verizon | | | 3,944 |
| | | | 4,120 |
| |
Dividends declared ($0.6025, $0.5900 per share) | | | (2,492 | ) | | | | (2,437 | ) | |
Balance at end of period | | | 47,945 |
| | | | 41,657 |
| |
| | | | | | | | |
Accumulated Other Comprehensive Income | | | | | | | | |
Balance at beginning of period attributable to Verizon | | | 2,216 |
| | | | 3,705 |
| |
Foreign currency translation adjustments | | | (67 | ) | | | | (176 | ) | |
Unrealized loss on cash flow hedges | | | (537 | ) | | | | (152 | ) | |
Unrealized gain on marketable securities | | | 4 |
| | | | 1 |
| |
Defined benefit pension and postretirement plans | | | (169 | ) | | | | (173 | ) | |
Other comprehensive loss | | | (769 | ) | | | | (500 | ) | |
Balance at end of period attributable to Verizon | | | 1,447 |
| | | | 3,205 |
| |
| | | | | | | | |
Treasury Stock | | | | | | | | |
Balance at beginning of period | (155,727 | ) | | (6,825 | ) | | (159,526 | ) | | (6,992 | ) | |
Employee plans | 58 |
| | 2 |
| | 28 |
| | 2 |
| |
Shareholder plans | — |
| | — |
| | — |
| | — |
| |
Balance at end of period | (155,669 | ) | | (6,823 | ) | | (159,498 | ) | | (6,990 | ) | |
| | | | | | | | |
Deferred Compensation-ESOPs and Other | | | | | | | | |
Balance at beginning of period | | | 125 |
| | | | 228 |
| |
Restricted stock equity grant | | | 44 |
| | | | 38 |
| |
Amortization | | | (4 | ) | | | | 19 |
| |
Balance at end of period | | | 165 |
| | | | 285 |
| |
| | | | | | | | |
Noncontrolling Interests | | | | | | | | |
Balance at beginning of period | | | 1,604 |
| | | | 1,564 |
| |
Total comprehensive income | | | 130 |
| | | | 126 |
| |
Distributions and other | | | (369 | ) | | | | (139 | ) | |
Balance at end of period | | | 1,365 |
| | | | 1,551 |
| |
Total Equity | | | $ | 57,947 |
| | | | $ | 53,575 |
| |
|
| | | | | | | | | | | | | | |
| | | | | | | | |
(dollars in millions, except per share amounts, and shares in thousands) |
Six months ended June 30, | 2019 |
| | | | 2018 |
| | | |
| Shares |
| | Amount |
| | Shares |
| | Amount |
| |
Common Stock | | | | | | | | |
Balance at beginning of year | 4,291,434 |
| | $ | 429 |
| | 4,242,374 |
| | $ | 424 |
| |
Common shares issued | — |
| | — |
| | 49,060 |
| | 5 |
| |
Balance at end of period | 4,291,434 |
| | 429 |
| | 4,291,434 |
| | 429 |
| |
| | | | | | | | |
Additional Paid In Capital | | | | | | | | |
Balance at beginning of year | | | 13,437 |
| | | | 11,101 |
| |
Other | | | (18 | ) | | | | 2,337 |
| |
Balance at end of period | | | 13,419 |
| | | | 13,438 |
| |
| | | | | | | | |
Retained Earnings | | | | | | | | |
Balance at beginning of year | | | 43,542 |
| | | | 35,635 |
| |
Opening balance sheet adjustment | | | 410 |
| (1) | | | 2,232 |
| (2) |
Adjusted opening balance | | | 43,952 |
| | | | 37,867 |
| |
Net income attributable to Verizon | | | 8,976 |
| | | | 8,665 |
| |
Dividends declared ($1.205, $1.1800 per share) | | | (4,983 | ) | | | | (4,875 | ) | |
Balance at end of period | | | 47,945 |
| | | | 41,657 |
| |
| | | | | | | | |
Accumulated Other Comprehensive Income | | | | | | | | |
Balance at beginning of year attributable to Verizon | | | 2,370 |
| | | | 2,659 |
| |
Opening balance sheet adjustment | | | — |
| | | | 630 |
| (2) |
Adjusted opening balance | | | 2,370 |
| | | | 3,289 |
| |
Foreign currency translation adjustments | | | (43 | ) | | | | (83 | ) | |
Unrealized gain (loss) on cash flow hedges | | | (550 | ) | | | | 349 |
| |
Unrealized gain (loss) on marketable securities | | | 8 |
| | | | (4 | ) | |
Defined benefit pension and postretirement plans | | | (338 | ) | | | | (346 | ) | |
Other comprehensive loss | | | (923 | ) | | | | (84 | ) | |
Balance at end of period attributable to Verizon | | | 1,447 |
| | | | 3,205 |
| |
| | | | | | | | |
Treasury Stock | | | | | | | | |
Balance at beginning of year | (159,400 | ) | | (6,986 | ) | | (162,898 | ) | | (7,139 | ) | |
Employee plans | 3,726 |
| | 163 |
| | 3,396 |
| | 149 |
| |
Shareholder plans | 5 |
| | — |
| | 4 |
| | — |
| |
Balance at end of period | (155,669 | ) | | (6,823 | ) | | (159,498 | ) | | (6,990 | ) | |
| | | | | | | | |
Deferred Compensation-ESOPs and Other | | | | | | | | |
Balance at beginning of year | | | 353 |
| | | | 416 |
| |
Restricted stock equity grant | | | 79 |
| | | | 91 |
| |
Amortization | | | (267 | ) | | | | (222 | ) | |
Balance at end of period | | | 165 |
| | | | 285 |
| |
| | | | | | | | |
Noncontrolling Interests | | | | | | | | |
Balance at beginning of year | | | 1,565 |
| | | | 1,591 |
| |
Opening balance sheet adjustment | | | 1 |
| (1) | | | 44 |
| (2) |
Adjusted opening balance | | | 1,566 |
| | | | 1,635 |
| |
Total comprehensive income | | | 258 |
| | | | 247 |
| |
Distributions and other | | | (459 | ) | | | | (331 | ) | |
Balance at end of period | | | 1,365 |
| | | | 1,551 |
| |
Total Equity | | | $ | 57,947 |
| | | | $ | 53,575 |
| |
(1) Opening balance sheet adjustments for the six months ended June 30, 2019 are due to the adoption of Topic 842 on January 1, 2019. See Note 1 for additional information.
(2) Opening balance sheet adjustments for the six months ended June 30, 2018 are due to the adoption of multiple ASUs on January 1, 2018. Refer to the consolidated financial statements and notes thereto included in the Company’s Annual Report on Form 10-K for the fiscal year ended December 31, 2018 for additional information.
Common Stock
Verizon did not repurchase any shares of Verizon common stock through its previously authorized share buyback program during the six months ended June 30, 2019. At June 30, 2019, the maximum number of shares that could be purchased by or on behalf of Verizon under our share buyback program was 100 million.
Common stock has been used from time to time to satisfy some of the funding requirements of employee and shareowner plans, including 3.7 million common shares issued from Treasury stock during the six months ended June 30, 2019.
In connection with our acquisition of Straight Path Communications, Inc. in February 2018, we issued approximately 49 million shares of Verizon common stock, valued at approximately $2.4 billion.
Accumulated Other Comprehensive Income
The changes in the balances of Accumulated other comprehensive income by component were as follows:
|
| | | | | | | | | | | | | | | | | | | |
(dollars in millions) | Foreign currency translation adjustments |
| | Unrealized gain (loss) on cash flow hedges |
| | Unrealized gain on marketable securities |
| | Defined benefit pension and postretirement plans |
| | Total |
|
Balance at January 1, 2019 | $ | (600 | ) | | $ | (80 | ) | | $ | 20 |
| | $ | 3,030 |
| | $ | 2,370 |
|
Other comprehensive income (loss) | (43 | ) | | (607 | ) | | 8 |
| | — |
| | (642 | ) |
Amounts reclassified to net income | — |
| | 57 |
| | — |
| | (338 | ) | | (281 | ) |
Net other comprehensive income (loss) | (43 | ) | | (550 | ) | | 8 |
| | (338 | ) | | (923 | ) |
Balance at June 30, 2019 | $ | (643 | ) | | $ | (630 | ) | | $ | 28 |
| | $ | 2,692 |
| | $ | 1,447 |
|
The amounts presented above in net other comprehensive income (loss) are net of taxes. The amounts reclassified to net income related to unrealized gain on cash flow hedges in the table above are included in Other income (expense), net and Interest expense in our condensed consolidated statements of income. See Note 8 for additional information. The amounts reclassified to net income related to defined benefit pension and postretirement plans in the table above are included in Cost of services and Selling, general and administrative expense in our condensed consolidated statements of income. See Note 9 for additional information.
|
|
Note 11. Segment Information |
Reportable Segments
As discussed in Note 1, in November 2018, we announced a strategic reorganization of our business.Under the new structure, effective April 1, 2019, there are two reportable segments that we operate and manage as strategic business units - Consumer and Business. In conjunction with the new reporting structure, we recast our segment disclosures for all periods presented. We measure and evaluate our reportable segments based on segment operating income, consistent with the chief operating decision maker’s assessment of segment performance.
Our segments and their principal activities consist of the following:
|
| | |
Segment | | Description |
Verizon Consumer Group | | Our Consumer segment provides consumer-focused wireless and wireline communications services and products. Our wireless services are provided across one of the most extensive wireless networks in the U.S. under the Verizon Wireless brand and through wholesale and other arrangements. Our wireline services are provided in nine states in the Mid-Atlantic and Northeastern U.S., as well as Washington D.C., over our 100% fiber-optic network under the Fios brand and over a traditional copper-based network to customers who are not served by Fios. |
| | |
Verizon
Business Group | | Our Business segment provides wireless and wireline communications services and products, video and data services, corporate networking solutions, security and managed network services, local and long distance voice services and network access to deliver various IoT services and products. We provide these products and services to businesses, government customers and wireless and wireline carriers across the U.S. and select products and services to customers around the world. |
Our Consumer segment’s wireless and wireline products and services are available to our retail customers, as well as resellers that purchase wireless network access from us on a wholesale basis. Our Business segment’s wireless and wireline products and services are organized by the primary customer groups targeted by these offerings: Global Enterprise, Small and Medium Business, Public Sector and Other, and Wholesale.
Corporate and other includes the results of Verizon Media, and other businesses, investments in unconsolidated businesses, unallocated corporate expenses, certain pension and other employee benefit related costs and interest and financing expenses. Corporate and other also includes the historical results of divested businesses and other adjustments and gains and losses that are not allocated in assessing segment performance due to their nature. Although such transactions are excluded from the segment results, they are included in reported consolidated earnings. Gains and losses from these transactions that are not individually significant are included in segment results as these items are included in the chief operating decision maker’s assessment of segment performance.
The reconciliation of segment operating revenues and expenses to consolidated operating revenues and expenses below includes the effects of special items that the chief operating decision maker does not consider in assessing segment performance, primarily because of their nature.
The following table provides operating financial information for our two reportable segments:
|
| | | | | | | | | | | | | | | |
| Three Months Ended | | | Six Months Ended | |
| June 30, | | | June 30, | |
(dollars in millions) | 2019 |
| | 2018 |
| | 2019 |
| | 2018 |
|
External Operating Revenues | | | | | | | |
Consumer | | | | | | | |
Service | $ | 16,350 |
| | $ | 16,050 |
| | $ | 32,611 |
| | $ | 31,864 |
|
Wireless equipment | 3,904 |
| | 4,251 |
| | 8,070 |
| | 8,521 |
|
Other | 1,680 |
| | 1,650 |
| | 3,350 |
| | 3,130 |
|
Total Consumer | 21,934 |
| | 21,951 |
| | 44,031 |
| | 43,515 |
|
| | | | | | | |
Business | | | | | | | |
Global Enterprise | 2,673 |
| | 2,808 |
| | 5,363 |
| | 5,632 |
|
Small and Medium Business | 2,781 |
| | 2,638 |
| | 5,485 |
| | 5,166 |
|
Public Sector and Other | 1,492 |
| | 1,437 |
| | 2,963 |
| | 2,866 |
|
Wholesale | 810 |
| | 956 |
| | 1,650 |
| | 1,941 |
|
Total Business | 7,756 |
| | 7,839 |
| | 15,461 |
| | 15,605 |
|
Total reportable segments | $ | 29,690 |
| | $ | 29,790 |
| | $ | 59,492 |
| | $ | 59,120 |
|
| | | | | | | |
Intersegment Revenues | | | | | | | |
Consumer | $ | 61 |
| | $ | 52 |
| | $ | 112 |
| | $ | 115 |
|
Business | 12 |
| | 12 |
| | 26 |
| | 29 |
|
Total reportable segments | $ | 73 |
| | $ | 64 |
| | $ | 138 |
| | $ | 144 |
|
| | | | | | | |
Total Operating Revenues | | | | | | | |
Consumer | $ | 21,995 |
| | $ | 22,003 |
| | $ | 44,143 |
| | $ | 43,630 |
|
Business(1) | 7,768 |
| | 7,851 |
| | 15,487 |
| | 15,634 |
|
Total reportable segments | $ | 29,763 |
| | $ | 29,854 |
| | $ | 59,630 |
| | $ | 59,264 |
|
| | | | | | | |
Operating Income | | | | | | | |
Consumer | $ | 7,336 |
| | $ | 7,060 |
| | $ | 14,586 |
| | $ | 13,995 |
|
Business | 1,071 |
| | 1,101 |
| | 2,119 |
| | 2,215 |
|
Total reportable segments | $ | 8,407 |
| | $ | 8,161 |
| | $ | 16,705 |
| | $ | 16,210 |
|
(1) Service and other revenues included in our Business segment amounted to approximately $7.0 billion and $13.9 billion for the three and six months ended June 30, 2019, respectively, and approximately $7.1 billion and $14.0 billion for the three and six months ended June 30, 2018, respectively. Wireless equipment revenues included in our Business segment amounted to approximately $814 million and $1.6 billion for the three and six months ended June 30, 2019, respectively, and approximately $793 million and $1.6 billion for the three and six months ended June 30, 2018, respectively.
The following table provides Fios revenue for our two reportable segments:
|
| | | | | | | | | | | | | | | |
| Three Months Ended | | | Six Months Ended | |
| June 30, | | | June 30, | |
(dollars in millions) | 2019 |
| | 2018 |
| | 2019 |
| | 2018 |
|
Consumer | $ | 2,772 |
| | $ | 2,738 |
| | $ | 5,536 |
| | $ | 5,472 |
|
Business | 239 |
| | 218 |
| | 482 |
| | 435 |
|
Total Fios revenue | $ | 3,011 |
| | $ | 2,956 |
| | $ | 6,018 |
| | $ | 5,907 |
|
The following table provides Wireless service revenue under our current reportable structure and includes intersegment activity:
|
| | | | | | | | | | | | | | | |
| Three Months Ended | | | Six Months Ended | |
| June 30, | | | June 30, | |
(dollars in millions) | 2019 |
| | 2018 |
| | 2019 |
| | 2018 |
|
Consumer | $ | 13,456 |
| | $ | 13,122 |
| | $ | 26,813 |
| | $ | 26,003 |
|
Business | 2,775 |
| | 2,615 |
| | 5,469 |
| | 5,116 |
|
Total Wireless service revenue | $ | 16,231 |
| | $ | 15,737 |
| | $ | 32,282 |
| | $ | 31,119 |
|
Reconciliation to Consolidated Financial Information
A reconciliation of the reportable segment operating revenues to consolidated operating revenues is as follows:
|
| | | | | | | | | | | | | | | |
| Three Months Ended | | | Six Months Ended | |
| June 30, | | | June 30, | |
(dollars in millions) | 2019 |
| | 2018 |
| | 2019 |
| | 2018 |
|
Total reportable segment operating revenues | $ | 29,763 |
| | $ | 29,854 |
| | $ | 59,630 |
| | $ | 59,264 |
|
Corporate and other | 2,412 |
| | 2,429 |
| | 4,747 |
| | 4,891 |
|
Eliminations | (104 | ) | | (80 | ) | | (178 | ) | | (180 | ) |
Total consolidated operating revenues | $ | 32,071 |
| | $ | 32,203 |
| | $ | 64,199 |
| | $ | 63,975 |
|
A reconciliation of total reportable segment operating income to consolidated income before provision for income taxes is as follows:
|
| | | | | | | | | | | | | | | |
| Three Months Ended | | | Six Months Ended | |
| June 30, | | | June 30, | |
(dollars in millions) | 2019 |
| | 2018 |
| | 2019 |
| | 2018 |
|
Total reportable segment operating income | $ | 8,407 |
| | $ | 8,161 |
| | $ | 16,705 |
| | $ | 16,210 |
|
Corporate and other | (354 | ) | | (426 | ) | | (740 | ) | | (811 | ) |
Severance charges (Note 9) | — |
| | (339 | ) | | — |
| | (339 | ) |
Other components of net periodic benefit charges (Note 9) | (203 | ) |
| (208 | ) | | (406 | ) | | (416 | ) |
Acquisition and integration related charges | — |
| | (120 | ) | | — |
| | (227 | ) |
Product realignment charges | — |
| | (451 | ) | | — |
| | (451 | ) |
Total consolidated operating income | 7,850 |
| | 6,617 |
| | 15,559 |
| | 13,966 |
|
| | | | | | | |
Equity in losses of unconsolidated businesses | (13 | ) | | (228 | ) | | (19 | ) | | (247 | ) |
Other income (expense), net | (1,312 | ) | | 360 |
| | (1,017 | ) | | 285 |
|
Interest expense | (1,215 | ) | | (1,222 | ) | | (2,425 | ) | | (2,423 | ) |
Income Before Provision For Income Taxes | $ | 5,310 |
| | $ | 5,527 |
| | $ | 12,098 |
| | $ | 11,581 |
|
No single customer accounted for more than 10% of our total operating revenues during the three and six months ended June 30, 2019 and 2018.
The chief operating decision maker does not review disaggregated assets on a segment basis; therefore, such information is not presented. Depreciation included in the measure of segment profitability is allocated primarily based on proportional usage.
|
|
Note 12. Commitments and Contingencies |
In the ordinary course of business, Verizon is involved in various commercial litigation and regulatory proceedings at the state and federal level. Where it is determined, in consultation with counsel based on litigation and settlement risks, that a loss is probable and estimable in a given matter, the Company establishes an accrual. In none of the currently pending matters is the amount of accrual material. An estimate of the reasonably possible loss or range of loss in excess of the amounts already accrued cannot be made at this time due to various factors typical in contested proceedings, including: (1) uncertain damage theories and demands; (2) a less than complete factual record; (3) uncertainty concerning legal theories and their resolution by courts or regulators; and (4) the unpredictable nature of the opposing party and its demands. We continuously monitor these proceedings as they develop and adjust any accrual or disclosure as needed. We do not expect that the ultimate resolution of any pending regulatory or legal matter in future periods, including the Hicksville matter described below, will have a material effect on our financial condition, but it could have a material effect on our results of operations for a given reporting period.
Reserves have been established to cover environmental matters relating to discontinued businesses and past telecommunications activities. These reserves include funds to address contamination at the site of a former Sylvania facility in Hicksville, NY, which had processed nuclear fuel rods in the 1950s and 1960s. In September 2005, the Army Corps of Engineers (ACE) accepted the site into its Formerly Utilized Sites Remedial Action Program. As a result, the ACE has taken primary responsibility for addressing the contamination at the site. An adjustment to the reserves may be made after a cost allocation is conducted with respect to the past and future expenses of all of the parties. Adjustments to the environmental reserve may also be made based upon the actual conditions found at other sites requiring remediation.
Verizon is currently involved in approximately 30 federal district court actions alleging that Verizon is infringing various patents. Most of these cases are brought by non-practicing entities and effectively seek only monetary damages; a small number are brought by companies that have sold products and could seek injunctive relief as well. These cases have progressed to various stages and a small number may go to trial in the coming 12 months if they are not otherwise resolved.
In connection with the execution of agreements for the sales of businesses and investments, Verizon ordinarily provides representations and warranties to the purchasers pertaining to a variety of nonfinancial matters, such as ownership of the securities being sold, as well as indemnity
from certain financial losses. From time to time, counterparties may make claims under these provisions, and Verizon will seek to defend against those claims and resolve them in the ordinary course of business.
Subsequent to the sale of Verizon Information Services Canada in 2004, we continue to provide a guarantee to publish directories, which was issued when the directory business was purchased in 2001 and had a 30-year term (before extensions). The preexisting guarantee continues, without modification, despite the subsequent sale of Verizon Information Services Canada and the spin-off of our domestic print and Internet yellow pages directories business. The possible financial impact of the guarantee, which is not expected to be adverse, cannot be reasonably estimated as a variety of the potential outcomes available under the guarantee result in costs and revenues or benefits that may offset each other. We do not believe performance under the guarantee is likely.
|
|
Item 2. Management’s Discussion and Analysis of Financial Condition and Results of Operations |
Verizon Communications Inc. (Verizon, or the Company) is a holding company that, acting through its subsidiaries, is one of the world’s leading providers of communications, information and entertainment products and services to consumers, businesses and government entities. With a presence around the world, we offer voice, data and video services and solutions on our networks that are designed to meet customers’ demand for mobility, reliable network connectivity, security and control. We have a highly diverse workforce of approximately 135,900 employees as of June 30, 2019.
To compete effectively in today’s dynamic marketplace, we are focused on transforming around the capabilities of our high-performing networks to drive growth based on delivering what customers want and need in the new digital world. During 2019, we are focused on leveraging our network leadership; retaining and growing our high-quality customer base while balancing profitability; enhancing ecosystems in growth businesses; and driving monetization of our networks and solutions. We are creating business value by earning customers’, employees’ and shareholders’ trust, minimizing our environmental impact, and maximizing customer growth while creating social benefit through our products and services. Our strategy requires significant capital investments primarily to acquire wireless spectrum, put the spectrum into service, provide additional capacity for growth in our networks, invest in the fiber that supports our businesses, evolve and maintain our networks and develop and maintain significant advanced information technology systems and data system capabilities. We believe that steady and consistent investments in our networks and platforms will drive innovative products and services and fuel our growth.
We are consistently deploying new network architecture and technologies to extend our leadership in both fourth-generation (4G) and fifth-generation (5G) wireless networks. We expect that our Intelligent Edge Network design will allow us to realize significant efficiencies by utilizing multi-purpose infrastructure utilizing common architecture within the core and providing flexibility to meet customer demands. In addition, protecting the privacy of our customers’ information and the security of our systems and networks continues to be a priority at Verizon. Our network leadership is the hallmark of our brand and the foundation for the connectivity, platform and solutions upon which we build our competitive advantage.
Highlights of Our Financial Results for the Three Months Ended June 30, 2019 and 2018
(dollars in millions)
Highlights of Our Financial Results for the Six Months Ended June 30, 2019 and 2018
(dollars in millions)
Business Overview
In November 2018, we announced a strategic reorganization of our business. Under the new structure, effective April 1, 2019, there are two reportable segments that we operate and manage as strategic business units - Verizon Consumer Group (Consumer) and Verizon Business Group (Business). In conjunction with the new reporting structure, we recast our segment disclosures for all periods presented.
Revenue by Segment for the Three Months Ended June 30, 2019 and 2018
———
Note: Excludes eliminations.
Revenue by Segment for the Six Months Ended June 30, 2019 and 2018
———
Note: Excludes eliminations.
Verizon Consumer Group
Our Consumer segment provides consumer-focused wireless and wireline communications services and products. Our wireless services are provided across one of the most extensive wireless networks in the United States (U.S.) under the Verizon Wireless brand and through wholesale and other arrangements. Our wireline services are provided in nine states in the Mid-Atlantic and Northeastern U.S., as well as Washington D.C., over our 100% fiber-optic network under the Fios brand and over a traditional copper-based network to customers who are not served by Fios. Our Consumer segment's wireless and wireline products and services are available to our retail customers, as well as resellers that purchase wireless network access from us on a wholesale basis.
Customers can obtain our wireless services on a postpaid or prepaid basis. A retail postpaid connection represents an individual line of service for a wireless device for which a customer is generally billed one month in advance for a monthly access charge in return for access to and usage of network services. Our prepaid service is offered only to Consumer customers and enables individuals to obtain wireless services without credit verification by paying for all services in advance. The Consumer segment also offers several categories of wireless equipment to customers, including a variety of smartphone and other handsets, wireless-enabled Internet devices, such as tablets, laptop computers and netbooks, and other wireless-enabled connected devices, such as smart watches and other wearables.
In addition to the wireless services and equipment discussed above, Consumer sells residential fixed connectivity solutions, including Internet, video and voice services, and wireless network access to resellers on a wholesale basis. The Consumer segment's operating revenues for the three and six months ended June 30, 2019 totaled $22.0 billion and $44.1 billion, respectively, representing a relatively flat change and an increase of 1.2%, respectively, compared to the similar periods in 2018. As of June 30, 2019, Consumer had approximately 94 million wireless retail connections, 6 million broadband connections and 4 million Fios video connections.
Verizon Business Group
Our Business segment provides wireless and wireline communications services and products, video and data services, corporate networking solutions, security and managed network services, local and long distance voice services and network access to deliver various Internet of Things (IoT) services and products, including Verizon Connect’s solutions which support fleet tracking management, compliance management, field service management, asset tracking and other types of mobile resource management. We provide these products and services to businesses, government customers and wireless and wireline carriers across the U.S. and select products and services to customers around the world. The Business segment's operating revenues for the three and six months ended June 30, 2019 totaled $7.8 billion and $15.5 billion, respectively, representing a decrease of 1.1% and 0.9%, respectively, compared to the similar periods in 2018. As of June 30, 2019, Business had approximately 24 million wireless retail postpaid connections and approximately 500 thousand broadband connections.
Corporate and Other
Corporate and other includes the results of our media business, Verizon Media Group (Verizon Media), which operated under the "Oath" brand until January 2019, and other businesses, investments in unconsolidated businesses, unallocated corporate expenses, certain pension and other employee benefit related costs and interest and financing expenses. Corporate and other also includes the historical results of divested businesses and other adjustments and gains and losses that are not allocated in assessing segment performance due to their nature. Although such transactions are excluded from the business segment results, they are included in reported consolidated earnings. Gains and losses from these transactions that are not individually significant are included in segment results as these items are included in the chief operating decision maker’s assessment of segment performance.
Verizon Media includes diverse media and technology brands that serve both consumers and businesses. Verizon Media provides consumers with owned and operated search properties and finance, news, sports and entertainment offerings and provides other businesses and partners access to consumers through digital advertising platforms. Verizon Media's total operating revenues were $1.8 billion and $3.6 billion, respectively for the three and six months ended June 30, 2019, which represents a decrease of 2.9% and 5.1%, respectively, compared to the similar periods in 2018.
Capital Expenditures and Investments
We continue to invest in our wireless networks, high-speed fiber and other advanced technologies to position ourselves at the center of growth trends for the future. During the six months ended June 30, 2019, these investments included $8.0 billion for capital expenditures. See "Cash Flows Used in Investing Activities" for additional information. We believe that our investments aimed at expanding our portfolio of products and services will provide our customers with an efficient, reliable infrastructure for competing in the information economy.
Global Network and Technology
We are focusing our capital spending on adding capacity and density to our 4G Long-Term Evolution (LTE) network, while positioning for 5G. We are densifying our 4G LTE network by utilizing small cell technology, in-building solutions and distributed antenna systems. Network densification not only enables us to add capacity to address increasing mobile video consumption and the growing demand for IoT products and services, but it also positions us for the deployment of 5G technology. Over the past several years, we have been leading the development of 5G wireless technology industry standards and the ecosystems for fixed and mobile 5G wireless services. We believe 5G technology can provide users with eight capabilities, or currencies. The eight currencies are peak data rates, mobile data volumes, mobility, number of connected devices, energy efficiency, service deployment, reduced latency and improved reliability. We expect that 5G technology will provide higher throughput and lower latency than the current 4G LTE technology and enable our networks to handle more traffic as the number of Internet-connected devices grows. During 2018, we commercially launched 5G Home initially on proprietary standards in four U.S. markets: Sacramento, Los Angeles, Houston and Indianapolis. We will shift to the global standards as soon as the compatible devices and equipment become available. In February 2019, we announced that we expect to expand 5G Home coverage to more markets in the second half of 2019. In 2019, we launched our 5G Ultra Wideband Network in Chicago, Minneapolis, Denver, Providence, St. Paul, Washington DC, Atlanta, Detroit and Indianapolis, with a target of the network becoming commercially available in 30 plus markets by year-end. In addition, we launched the first 5G-compatible smartphone in April 2019.
To compensate for the shrinking market for traditional copper-based products, we continue to build our wireline business around fiber-based networks supporting data, video and advanced business services - areas where demand for reliable high-speed connections is growing. We are evolving the architecture of our networks to a next-generation multi-use platform, providing improved efficiency and virtualization, increased automation and opportunities for edge computing services that will support both our fiber-based and radio access network technologies. We call this the Intelligent Edge Network. We expect that this new architecture will simplify operations by eliminating legacy network elements, improve our 4G LTE wireless coverage, speed the deployment of 5G wireless technology, and create new opportunities in the business market.
Operating Environment and Trends
There have been no significant changes to the information related to trends affecting our business that was previously disclosed in the "Management’s Discussion and Analysis of Financial Condition and Results of Operations" included in our Annual Report on Form 10-K for the year ended December 31, 2018, except either as a result of our segment realignment or as discussed below.
We adopted Accounting Standard Update (ASU) 2016-02, ASU 2018-01, ASU 2018-10, ASU 2018-11, ASU 2018-20 and ASU 2019-01, Leases (Topic 842) on January 1, 2019, using the modified retrospective application. This method does not impact the prior periods, which continue to reflect the accounting treatment prior to the adoption of Topic 842. As a result, for items that were affected by our adoption of Topic 842, financial results of periods prior to January 1, 2019 are not comparable to the current period financial results. See Notes 1 and 5 to the condensed consolidated financial statements for additional information.
Recent Developments
In September 2018, we announced a Voluntary Separation Program for select U.S.-based management employees. Approximately 10,400 eligible employees separated from the Company under this program as of the end of June 2019. The severance benefits payments to these employees are expected to be substantially completed by the end of September 2019.
In 2019, the Federal Communications Commission (FCC) completed 2 millimeter wave spectrum license auctions. Verizon participated in these auctions and was the high bidder on 9 and 1,066 licenses, respectively, in the 24 Gigahertz (GHz) and 28 GHz bands. We submitted an application to the FCC and paid cash of approximately $521 million for the licenses that will be issued.
On July 23, 2019, Verizon completed a sale-leaseback transaction for buildings and real estate. We received total gross proceeds of $1.0 billion. We lease backed a portion of the buildings and real estate sold and accounted for it as an operating lease. The term of the leaseback is for two years with 4 options to renew for an additional three months each.
Critical Accounting Estimates
Upon the date of reorganization on April 1, 2019, the goodwill of our historical Wireless reporting unit, historical Wireline reporting unit and historical Verizon Connect reporting unit were reallocated to our new Consumer and Business reporting units. At June 30, 2019, the balance of our goodwill was approximately $24.6 billion, of which $17.1 billion was in our Consumer reporting unit, $7.3 billion was in our Business reporting unit, and $262 million was in Other, which includes our Media reporting unit and other corporate entities. To determine if goodwill is potentially impaired, we have the option to perform a qualitative assessment to determine whether it is more likely than not that the fair value of a reporting unit is less than its carrying value. If we elect not to conduct the qualitative assessment or if indicators of a potential impairment exist, the determination of whether an impairment has occurred requires the determination of the fair value of the reporting unit being assessed.
We performed a quantitative assessment of our current reporting units, Consumer and Business, subsequent to the strategic reorganization. Our impairment assessments indicated that the fair value for each of our Consumer and Business reporting units significantly exceeded their respective carrying values and therefore, did not result in a goodwill impairment. Our Media reporting unit was not impacted by the strategic reorganization and there were no indicators of impairment during the second quarter of 2019.
Under our quantitative assessment, the fair value of the reporting unit is calculated using a market approach and a discounted cash flow method. The market approach includes the use of comparative multiples to corroborate discounted cash flow results. The discounted cash flow method is based on the present value of two components-projected cash flows and a terminal value. The terminal value represents the expected normalized future cash flows of the reporting unit beyond the cash flows from the discrete projection period. The fair value of the reporting unit is calculated based on the sum of the present value of the cash flows from the discrete period and the present value of the terminal value. The discount rate represented our estimate of the weighted-average cost of capital, or expected return, that a marketplace participant would have required as of the valuation date. The application of our goodwill impairment test required key assumptions underlying our valuation model. The discounted cash flow analysis factored in assumptions on discount rates and terminal growth rates to reflect risk profiles of key strategic revenue and cost initiatives, as well as revenue and earnings before interest, taxes, depreciation and amortization expenses (EBITDA) growth relative to history and market trends and expectations. The market multiples approach incorporated significant judgment involved in the selection comparable public company multiples and benchmarks. The selection of companies was influenced by differences in growth and profitability, and volatility in market prices of peer companies. These valuation inputs are inherently uncertain, and a significant adverse change in one or a combination of these inputs could trigger a goodwill impairment loss in the future.
|
|
Consolidated Results of Operations |
In this section, we discuss our overall results of operations and highlight special items that are not included in our segment results. In "Segment Results of Operations," we review the performance of our two reportable segments in more detail.
Consolidated Revenues
|
| | | | | | | | | | | | | | | | | | | | | | | | | | | | | |
| Three Months Ended | | | | | | | Six Months Ended | | | | | |
| June 30, | | | Increase/ | | June 30, | | | Increase/ |
(dollars in millions) | 2019 |
| | 2018 |
| | (Decrease) | | 2019 |
| | 2018 |
| | (Decrease) |
Consumer | $ | 21,995 |
| | $ | 22,003 |
| | $ | (8 | ) | | — | % | | $ | 44,143 |
| | $ | 43,630 |
| | $ | 513 |
| | 1.2 | % |
Business | 7,768 |
| | 7,851 |
| | (83 | ) | | (1.1 | ) | | 15,487 |
| | 15,634 |
| | (147 | ) | | (0.9 | ) |
Corporate and other | 2,412 |
| | 2,429 |
| | (17 | ) | | (0.7 | ) | | 4,747 |
| | 4,891 |
| | (144 | ) | | (2.9 | ) |
Eliminations | (104 | ) | | (80 | ) | | (24 | ) | | 30.0 |
| | (178 | ) | | (180 | ) | | 2 |
| | (1.1 | ) |
Consolidated Revenues | $ | 32,071 |
| | $ | 32,203 |
| | $ | (132 | ) | | (0.4 | ) | | $ | 64,199 |
| | $ | 63,975 |
| | $ | 224 |
| | 0.4 |
|
Consolidated revenues decreased $132 million, or 0.4%, and increased $224 million, or 0.4%, during the three and six months ended June 30, 2019, respectively, compared to the similar periods in 2018. The decrease in revenues during the three months ended June 30, 2019 was due to decreases in revenues at our Business segment and Corporate and other. The increase in revenues during the six months ended June 30, 2019 was due to an increase in revenues at our Consumer segment, partially offset by decreases in revenues at our Business segment and Corporate and other.
Revenues for our segments are discussed separately below under the heading "Segment Results of Operations."
Corporate and other revenues decreased 0.7%, and $144 million, or 2.9%, during the three and six months ended June 30, 2019, respectively, compared to the similar periods in 2018. The decrease in revenues during the three and six months ended June 30, 2019 was primarily due to a decrease of $55 million and $193 million, respectively, in revenues within Verizon Media.
Consolidated Operating Expenses
|
| | | | | | | | | | | | | | | | | | | | | | | | | | | | | |
| Three Months Ended | | | | | | | Six Months Ended | | | | | |
| June 30, | | | Increase/ | | June 30, | | | Increase/ |
(dollars in millions) | 2019 |
| | 2018 |
| | (Decrease) | | 2019 |
| | 2018 |
| | (Decrease) |
Cost of services | $ | 7,702 |
| | $ | 8,234 |
| | $ | (532 | ) | | (6.5 | )% | | $ | 15,494 |
| | $ | 16,180 |
| | $ | (686 | ) | | (4.2 | )% |
Cost of wireless equipment | 5,019 |
| | 5,397 |
| | (378 | ) | | (7.0 | ) | | 10,217 |
| | 10,706 |
| | (489 | ) | | (4.6 | ) |
Selling, general and administrative expense | 7,268 |
| | 7,605 |
| | (337 | ) | | (4.4 | ) | | 14,466 |
| | 14,449 |
| | 17 |
| | 0.1 |
|
Depreciation and amortization expense | 4,232 |
| | 4,350 |
| | (118 | ) | | (2.7 | ) | | 8,463 |
| | 8,674 |
| | (211 | ) | | (2.4 | ) |
Consolidated Operating Expenses | $ | 24,221 |
| | $ | 25,586 |
| | $ | (1,365 | ) | | (5.3 | ) | | $ | 48,640 |
| | $ | 50,009 |
| | $ | (1,369 | ) | | (2.7 | ) |
Cost of Services
Cost of services includes the following costs directly attributable to a service: salaries and wages, benefits, materials and supplies, content costs, contracted services, network access and transport costs, customer provisioning costs, computer systems support, and costs to support our outsourcing contracts and technical facilities. Aggregate customer care costs, which include billing and service provisioning, are allocated between Cost of services and Selling, general and administrative expense.
Cost of services decreased $532 million, or 6.5%, and $686 million, or 4.2%, during the three and six months ended June 30, 2019, respectively, compared to the similar periods in 2018, primarily due to a decrease in employee related costs due to lower headcount, a decrease in network access costs due to reduction in voice connections and a product realignment charge in 2018 (see "Special Items"). The decreases were partially offset by an increase in rent expense as a result of adding capacity to the networks to support increased demand.
Cost of Wireless Equipment
Cost of wireless equipment decreased $378 million, or 7.0%, and $489 million, or 4.6%, during the three and six months ended June 30, 2019, respectively, compared to the similar periods in 2018, primarily as a result of declines in the number of wireless devices sold as a result of an elongation of the handset upgrade cycle, partially offset by shifts to higher priced devices in the mix of devices sold.
Selling, General and Administrative Expense
Selling, general and administrative expense includes: salaries and wages and benefits not directly attributable to a service or product, bad debt charges, taxes other than income taxes, advertising and sales commission costs, call center and information technology costs, regulatory fees, professional service fees, and rent and utilities for administrative space. Also included is a portion of the aggregate customer care costs as discussed above in "Cost of Services".
Selling, general and administrative expense decreased $337 million, or 4.4%, and increased 0.1%, during the three and six months ended June 30, 2019, respectively, compared to the similar periods in 2018. The decrease during the three months ended June 30, 2019 was primarily due to a decrease in employee related costs and the acquisition and integration related charges in 2018 primarily related to the acquisition of Yahoo! Inc.'s (Yahoo) operating business (see "Special items") partially offset by an increase in advertising expenses, sales commission expense and bad debt expense. The increase in sales commission expense is due to a lower net deferral of commission costs in the current year as compared to the prior year, as a result of the adoption of ASU 2014-09, "Revenue from Contracts with Customers" (Topic 606) on January 1, 2018 using a modified retrospective approach. The increase during the six months ended June 30, 2019 was primarily due to increases in advertising expenses, sales commission and bad debt expense. These increases were partially offset by decreases in employee related costs primarily due to the Voluntary Separation Program and the acquisition and integration related charges in 2018 primarily related to the acquisition of Yahoo operating business (see "Special Items").
Depreciation and Amortization Expense
Depreciation and amortization expense decreased $118 million, or 2.7%, and $211 million, or 2.4%, during the three and six months ended June 30, 2019 compared to the similar periods in 2018. This decrease was primarily driven by the change in the mix of net depreciable assets.
Other Consolidated Results
Other Income (Expense), Net
Additional information relating to Other income (expense), net is as follows:
|
| | | | | | | | | | | | | | | | | | | | | | | | | | | | | |
| Three Months Ended | | | | | | | Six Months Ended | | | | | |
| June 30, | | | Increase/ | | June 30, | | | Increase/ |
(dollars in millions) | 2019 |
| | 2018 |
| | (Decrease) | | 2019 |
| | 2018 |
| | (Decrease) |
Interest income | $ | 31 |
| | $ | 20 |
| | $ | 11 |
| | 55.0 | % | | $ | 60 |
| | $ | 36 |
| | $ | 24 |
| | 66.7 | % |
Other components of net periodic benefit cost | 185 |
| | 254 |
| | (69 | ) | | (27.2 | ) | | 465 |
| | 509 |
| | (44 | ) | | (8.6 | ) |
Other, net | (1,528 | ) | | 86 |
| | (1,614 | ) | | nm |
| | (1,542 | ) | | (260 | ) | | (1,282 | ) | | nm |
|
Total | $ | (1,312 | ) | | $ | 360 |
| | $ | (1,672 | ) | | nm |
| | $ | (1,017 | ) | | $ | 285 |
| | $ | (1,302 | ) | | nm |
|
nm - not meaningful
Other income (expense), net, reflects certain items not directly related to our core operations, including interest income, gains and losses from asset dispositions, debt extinguishment costs and components of net periodic pension and postretirement benefit costs. The decrease in Other income (expense), net during the three months ended June 30, 2019, compared to the similar period in 2018, was primarily driven by losses on early debt redemptions of $1.5 billion recorded during 2019. The decrease in Other income (expense), net during the six months ended June 30, 2019, compared to the similar period in 2018, was primarily driven by an increase in early debt redemption costs of $1.3 billion. In addition, we recorded a $96 million benefit, primarily attributable to a pension remeasurement gain, during the six months ended June 30, 2019.
Interest Expense
|
| | | | | | | | | | | | | | | | | | | | | | | | | | | | | |
| Three Months Ended | | | | | | | Six Months Ended | | | | | |
| June 30, | | | Increase/ | | June 30, | | | Increase/ |
(dollars in millions) | 2019 |
| | 2018 |
| | (Decrease) | | 2019 |
| | 2018 |
| | (Decrease) |
Total interest costs on debt balances | $ | 1,377 |
| | $ | 1,421 |
| | $ | (44 | ) | | (3.1 | )% | | $ | 2,744 |
| | $ | 2,798 |
| | $ | (54 | ) | | (1.9 | )% |
Less capitalized interest costs | 162 |
| | 199 |
| | (37 | ) | | (18.6 | ) | | 319 |
| | 375 |
| | (56 | ) | | (14.9 | ) |
Total | $ | 1,215 |
| | $ | 1,222 |
| | $ | (7 | ) | | (0.6 | ) | | $ | 2,425 |
| | $ | 2,423 |
| | $ | 2 |
| | 0.1 |
|
| | | | | | | | | | | | | | | |
Average debt outstanding | $ | 115,163 |
| | $ | 117,800 |
| | | | | | $ | 114,414 |
| | $ | 117,719 |
| | | | |
Effective interest rate | 4.8 | % | | 4.8 | % | | | | | | 4.8 | % | | 4.8 | % | | | | |
Total interest expense decreased during the three months ended June 30, 2019, compared to the similar periods in 2018, primarily due to lower average debt balances, offset by lower capitalized interest costs. Total interest expense increased during the six months ended June 30, 2019, compared to the similar periods in 2018, primarily due to lower capitalized interest costs offsetting lower average debt balances.
Provision for Income Taxes
|
| | | | | | | | | | | | | | | | | | | | | | | | | | | | | |
| Three Months Ended | | | | | Six Months Ended | | | |
| June 30, | | | Increase/ | | June 30, | | | Increase/ |
(dollars in millions) | 2019 |
| | 2018 |
| | (Decrease) | | 2019 |
| | 2018 |
| | (Decrease) |
Provision for income taxes | $ | 1,236 |
| | $ | 1,281 |
| | $ | (45 | ) | | (3.5 | )% | | $ | 2,864 |
| | $ | 2,669 |
| | $ | 195 |
| | 7.3 | % |
Effective income tax rate | 23.3 | % | | 23.2 | % | | | | | | 23.7 | % | | 23.0 | % | | | | |
The effective income tax rate is calculated by dividing the provision for income taxes by income before the provision for income taxes. The effective income tax rate and the provision for income taxes for the three months ended June 30, 2019 is comparable to the similar period in 2018. The increase in the effective income tax rate during the six months ended June 30, 2019, compared to the similar period in 2018, was primarily due to tax benefits from funding employee benefit obligations in the prior period that did not reoccur in the current period. The increase in the provision for income taxes during the six months ended June 30, 2019, compared to the similar period in 2018, was primarily due to the impact of an increase in income before income taxes in the current period.
Unrecognized Tax Benefits
Unrecognized tax benefits were $2.8 billion at June 30, 2019 and $2.9 billion at December 31, 2018. Interest and penalties related to unrecognized tax benefits were $367 million (after-tax) and $348 million (after-tax) at June 30, 2019 and December 31, 2018, respectively.
Verizon and/or its subsidiaries file income tax returns in the U.S. federal jurisdiction, and various state, local and foreign jurisdictions. As a large taxpayer, we are under audit by the Internal Revenue Service and multiple state and foreign jurisdictions for various open tax years. It is reasonably possible that the amount of the liability for unrecognized tax benefits could change by a significant amount in the next twelve months. An estimate of the range of the possible change cannot be made until these tax matters are further developed or resolved.
Consolidated Net Income, Consolidated EBITDA and Consolidated Adjusted EBITDA
Consolidated EBITDA and Consolidated Adjusted EBITDA, which are presented below, are non-generally accepted accounting principles (GAAP) measures that we believe are useful to management, investors and other users of our financial information in evaluating operating profitability on a more variable cost basis as they exclude the depreciation and amortization expense related primarily to capital expenditures and acquisitions that occurred in prior years, as well as in evaluating operating performance in relation to Verizon’s competitors. Consolidated EBITDA is calculated by adding back interest, taxes and depreciation and amortization expenses to net income.
Consolidated Adjusted EBITDA is calculated by excluding from Consolidated EBITDA the effect of the following non-operational items: equity in losses of unconsolidated businesses and other income and expense, net, as well as the effect of special items. We believe that this measure is useful to management, investors and other users of our financial information in evaluating the effectiveness of our operations and underlying business trends in a manner that is consistent with management’s evaluation of business performance. We believe that Consolidated Adjusted EBITDA is widely used by investors to compare a company’s operating performance to its competitors by minimizing impacts caused by differences in capital structure, taxes and depreciation policies. Further, the exclusion of non-operational items and special items enables comparability to prior period performance and trend analysis. See "Special Items" for additional information.
It is management’s intent to provide non-GAAP financial information to enhance the understanding of Verizon’s GAAP financial information, and it should be considered by the reader in addition to, but not instead of, the financial statements prepared in accordance with GAAP. Each non-GAAP financial measure is presented along with the corresponding GAAP measure so as not to imply that more emphasis should be placed on the non-GAAP measure. We believe that non-GAAP measures provide relevant and useful information, which is used by management, investors and other users of our financial information as well as by our management in assessing both consolidated and segment performance. The non-GAAP financial information presented may be determined or calculated differently by other companies and may not be directly comparable to that of other companies.
|
| | | | | | | | | | | | | | | |
| Three Months Ended | | | Six Months Ended | |
| June 30, | | | June 30, | |
(dollars in millions) | 2019 |
| | 2018 |
| | 2019 |
| | 2018 |
|
Consolidated Net Income | $ | 4,074 |
| | $ | 4,246 |
| | $ | 9,234 |
| | $ | 8,912 |
|
Add: |
| | | | | | |
Provision for income taxes | 1,236 |
| | 1,281 |
| | 2,864 |
| | 2,669 |
|
Interest expense | 1,215 |
| | 1,222 |
| | 2,425 |
| | 2,423 |
|
Depreciation and amortization expense | 4,232 |
| | 4,350 |
| | 8,463 |
| | 8,674 |
|
Consolidated EBITDA* | $ | 10,757 |
| | $ | 11,099 |
| | $ | 22,986 |
| | $ | 22,678 |
|
| | | | | | | |
Add (Less): | | | | | | | |
Other (income) expense, net† | $ | 1,312 |
| | $ | (360 | ) | | $ | 1,017 |
| | $ | (285 | ) |
Equity in losses of unconsolidated businesses | 13 |
| | 228 |
| | 19 |
| | 247 |
|
Severance, pension and benefits charges | — |
| | 339 |
| | — |
| | 339 |
|
Acquisition and integration related charges‡ | — |
| | 109 |
| | — |
| | 214 |
|
Product realignment charges‡ | — |
| | 450 |
| | — |
| | 450 |
|
Consolidated Adjusted EBITDA | $ | 12,082 |
| | $ | 11,865 |
| | $ | 24,022 |
| | $ | 23,643 |
|
* Prior period figures have been amended to conform to the current period's calculation of Consolidated EBITDA.
† Includes Pension and benefits mark-to-market adjustments and early debt redemption costs, where applicable.
‡ Excludes depreciation and amortization expense.
The changes in Consolidated Net Income, Consolidated EBITDA and Consolidated Adjusted EBITDA in the table above during the three and six months ended June 30, 2019, compared to the similar period in 2018, were primarily a result of the factors described in connection with operating revenues and operating expenses.
|
|
Segment Results of Operations |
We have two reportable segments that we operate and manage as strategic business units, Consumer and Business. We measure and evaluate our reportable segments based on segment operating income. The use of segment operating income is consistent with the chief operating decision maker’s assessment of segment performance.
To aid in the understanding of segment performance as it relates to segment operating income, we use the following operating statistics to evaluate the overall effectiveness of our segments:
Wireless retail connections are retail customer device postpaid and prepaid connections. Retail connections under an account may include those from smartphones and basic phones (collectively, phones) as well as tablets and other Internet devices, including wearables and retail IoT devices.
Wireless retail postpaid connections are retail postpaid customer device connections. Retail connections under an account may include those from phones, as well as tablets and other Internet devices, including wearables and retail IoT devices.
Fios Internet connections are the total number of connections to the Internet using Fios Internet services.
Fios video connections are the total number of connections to traditional linear video programming using Fios video services.
Broadband connections are the total number of connections to the Internet using Digital Subscriber Line (DSL) and Fios Internet services.
Voice connections are the total number of traditional switched access lines in service and Fios digital voice connections.
Wireless retail connections, net additions are the total number of additional retail customer device postpaid and prepaid connections, less the number of device disconnects within the current period.
Wireless retail postpaid connections, net additions are the total number of additional retail customer device postpaid connections, less the number of device disconnects within the current period.
Wireless retail postpaid phone connections, net additions are the total number of additional retail customer postpaid phone connections, less the number of phone disconnects within the current period.
Churn is the rate at which service to either retail or postpaid retail connections is terminated on a monthly basis.
Wireless retail postpaid ARPA is the calculated average service revenue per account (ARPA) from retail postpaid accounts, which does not include recurring device payment plan billings related to the Verizon device payment program.
Wireless retail postpaid accounts are retail customers that are directly served and managed under the Verizon Wireless brand and use its services. Accounts include unlimited plans, shared data plans and corporate accounts, as well as legacy single connection plans and family plans. A single account may include monthly wireless services for a variety of connected devices.
Wireless retail postpaid connections per account is calculated by dividing the total number of retail postpaid connections by the number of retail postpaid accounts as of the end of the period.
Segment earnings before interest, taxes, depreciation and amortization (Segment EBITDA), which is presented below, is a non-GAAP measure and does not purport to be an alternative to operating income (loss) as a measure of operating performance. We believe this measure is useful to management, investors and other users of our financial information in evaluating operating profitability on a more variable cost basis as it excludes the depreciation and amortization expenses related primarily to capital expenditures and acquisitions that occurred in prior years, as well as in evaluating operating performance in relation to our competitors. Segment EBITDA is calculated by adding back depreciation and amortization expense to segment operating income (loss). Segment EBITDA margin is calculated by dividing Segment EBITDA by total segment operating revenues. You can find additional information about our segments in Note 11 to the condensed consolidated financial statements.
Verizon Consumer Group
Our Consumer segment provides consumer-focused wireless and wireline communications services and products. Our wireless services are provided across one of the most extensive wireless networks in the U.S. under the Verizon Wireless brand and through wholesale and other arrangements. Our wireline services are provided in nine states in the Mid-Atlantic and Northeastern U.S., as well as Washington D.C., over our 100% fiber-optic network under the Fios brand and over a traditional copper-based network to customers who are not served by Fios.
Operating Revenues and Selected Operating Statistics
|
| | | | | | | | | | | | | | | | | | | | | | | | | | | | | |
| Three Months Ended | | | | | Six Months Ended | | | |
| June 30, | | | Increase/ | | June 30, | | | Increase/ |
(dollars in millions, except ARPA) | 2019 |
| | 2018 |
| | (Decrease) | | 2019 |
| | 2018 |
| | (Decrease) |
Service | $ | 16,350 |
| | $ | 16,049 |
| | $ | 301 |
| | 1.9 | % | | $ | 32,609 |
| | $ | 31,873 |
| | $ | 736 |
| | 2.3 | % |
Wireless equipment | 3,903 |
| | 4,251 |
| | (348 | ) | | (8.2 | ) | | 8,069 |
| | 8,521 |
| | (452 | ) | | (5.3 | ) |
Other | 1,742 |
| | 1,703 |
| | 39 |
| | 2.3 |
| | 3,465 |
| | 3,236 |
| | 229 |
| | 7.1 |
|
Total Operating Revenues | $ | 21,995 |
| | $ | 22,003 |
| | $ | (8 | ) | | — |
| | $ | 44,143 |
| | $ | 43,630 |
| | $ | 513 |
| | 1.2 |
|
| | | | | | | | | | | | | | | |
Connections (‘000): (1) | | | | | | | | | | | | | | | |
Wireless retail connections | | | | | | | | | 93,896 |
| | 93,816 |
| | 80 |
| | 0.1 |
|
Wireless retail postpaid connections | | | | | | | | | 89,630 |
| | 88,984 |
| | 646 |
| | 0.7 |
|
Fios Internet connections | | | | | | | | | 5,837 |
| | 5,663 |
| | 174 |
| | 3.1 |
|
Fios video connections | | | | | | | | | 4,270 |
| | 4,487 |
| | (217 | ) | | (4.8 | ) |
Broadband connections | | | | | | | | | 6,474 |
| | 6,447 |
| | 27 |
| | 0.4 |
|
Voice connections | | | | | | | | | 6,058 |
| | 6,631 |
| | (573 | ) | | (8.6 | ) |
| | | | | | | | | | | | | | | |
Net Additions in Period (‘000): (2) | | | | | | | | | | | | | | | |
Wireless retail | (87 | ) | | (89 | ) | | 2 |
| | 2.2 |
| | (464 | ) | | (479 | ) | | 15 |
| | 3.1 |
|
Wireless retail postpaid | 126 |
| | 147 |
| | (21 | ) | | (14.3 | ) | | (75 | ) | | 92 |
| | (167 | ) | | nm |
|
Wireless retail postpaid phones | 73 |
| | 17 |
| | 56 |
| | nm |
| | (90 | ) | | (136 | ) | | 46 |
| | 33.8 |
|
| | | | | | | | | | | | | | | |
Churn Rate: | | | | | | | | | | | | | | | |
Wireless retail | 1.23 | % | | 1.19 | % | | | | | | 1.28 | % | | 1.25 | % | | | | |
Wireless retail postpaid | 0.97 | % | | 0.93 | % | | | | | | 1.03 | % | | 0.97 | % | | | | |
Wireless retail postpaid phones | 0.72 | % | | 0.71 | % | | | | | | 0.76 | % | | 0.74 | % | | | | |
| | | | | | | | | | | | | | | |
Account Statistics: | | | | | | | | | | | | | | | |
Wireless retail postpaid ARPA | $ | 118.15 |
| | $ | 115.53 |
| | $ | 2.62 |
| | 2.3 |
| | $ | 117.80 |
| | $ | 114.49 |
| | $ | 3.31 |
| | 2.9 |
|
Wireless retail postpaid accounts (‘000) (1) | | | | | | | | | 33,924 |
| | 34,045 |
| | (121 | ) | | (0.4 | ) |
Wireless retail postpaid connections per account (1) | | | | | | | | | 2.64 |
| | 2.61 |
| | 0.03 |
| | 1.1 |
|
| |
(2) | Excluding acquisitions and adjustments |
nm - not meaningful
Consumer’s total operating revenues were unchanged and increased $513 million, or 1.2%, during the three and six months ended June 30, 2019, respectively, compared to the similar periods in 2018, primarily as a result of increases in Service and Other revenues, partially offset by decreases in Wireless equipment revenue.
Service Revenue
Service revenue increased $301 million, or 1.9%, and $736 million, or 2.3%, during the three and six months ended June 30, 2019, respectively, compared to the similar periods in 2018. These increases were driven by increases in wireless service and Fios revenues, partially offset by decreases in wireline voice and DSL services.
Wireless service revenue increased 2.5% and 3.1%, during the three and six months ended June 30, 2019, respectively, compared to the similar periods in 2018. These increases were due to increases in wireless access revenue, driven by customers shifting to higher access plans including unlimited plans and increases in the number of devices per account, the declining fixed-term subsidized plan base, and data usage growth from reseller accounts. Wireless retail postpaid ARPA increased 2.3% and 2.9%, during the three and six months ended June 30, 2019, respectively, compared to the similar periods in 2018.
For the three and six months ended June 30, 2019, Fios revenue totaled $2.8 billion and $5.5 billion, respectively, and increased 1.2%, and $64 million, or 1.2%, respectively, compared to the similar periods in 2018. These increases are due to a 3.1% increase in Fios Internet connections, reflecting increased demand in higher broadband speeds, partially offset by a 4.8% decrease in Fios video connections, reflecting the ongoing shift from traditional linear video to over-the-top (OTT) offerings.
Service revenue attributable to wireline voice and DSL broadband services declined during the three and six months ended June 30, 2019, compared to the similar periods in 2018. The declines are primarily due to a decrease of 8.6% in voice connections resulting primarily from competition and technology substitution with wireless and competing Voice over Internet Protocol (VoIP) and cable telephony services.
Wireless Equipment Revenue
Wireless equipment revenue decreased $348 million, or 8.2%, and $452 million, or 5.3%, during the three and six months ended June 30, 2019, respectively, compared to the similar periods in 2018, as a result of overall declines in wireless device sales primarily due to an elongation of the handset upgrade cycle, as well as increased promotions, partially offset by a shift to higher priced units in the mix of wireless devices sold.
Other Revenue
Other revenue includes non-service revenues such as regulatory fees, cost recovery surcharges, revenues associated with our device protection package, leasing and interest on equipment financed under a device payment plan agreement when sold to the customer by an authorized agent.
Other revenue increased 2.3%, and $229 million, or 7.1%, during the three and six months ended June 30, 2019, respectively, compared to the similar periods in 2018, primarily due to volume increases related to our wireless device protection plans. Pricing increases related to our wireless device protection plans also contributed to the increase in Other revenue during the six months ended June 30, 2019.
Operating Expenses
|
| | | | | | | | | | | | | | | | | | | | | | | | | | | | | |
| Three Months Ended | | | | | Six Months Ended | | | |
| June 30, | | | Increase/ | | June 30, | | | Increase/ |
(dollars in millions) | 2019 |
| | 2018 |
| | (Decrease) | | 2019 |
| | 2018 |
| | (Decrease) |
Cost of services | $ | 3,847 |
| | $ | 3,842 |
| | $ | 5 |
| | 0.1 | % | | $ | 7,726 |
| | $ | 7,615 |
| | $ | 111 |
| | 1.5 | % |
Cost of wireless equipment | 3,909 |
| | 4,296 |
| | (387 | ) | | (9.0 | ) | | 8,051 |
| | 8,569 |
| | (518 | ) | | (6.0 | ) |
Selling, general and administrative expense | 4,022 |
| | 3,808 |
| | 214 |
| | 5.6 |
| | 8,005 |
| | 7,479 |
| | 526 |
| | 7.0 |
|
Depreciation and amortization expense | 2,881 |
| | 2,997 |
| | (116 | ) | | (3.9 | ) | | 5,775 |
| | 5,972 |
| | (197 | ) | | (3.3 | ) |
Total Operating Expenses | $ | 14,659 |
| | $ | 14,943 |
| | $ | (284 | ) | | (1.9 | ) | | $ | 29,557 |
| | $ | 29,635 |
| | $ | (78 | ) | | (0.3 | ) |
Cost of Services
Cost of services increased 0.1%, and $111 million, or 1.5%, during the three and six months ended June 30, 2019, respectively, compared to the similar periods in 2018, primarily due to increases in rent expense as a result of adding capacity to the networks to support demand and volume-driven increases in costs related to the device protection package offered to our wireless retail postpaid customers. These increases were partially offset by both decreases in employee related costs as well as decreases in access costs and roaming for the three and six months ended June 30, 2019.
Cost of Wireless Equipment
Cost of wireless equipment decreased $387 million, or 9.0%, and $518 million, or 6.0%, during the three and six months ended June 30, 2019, respectively, compared to the similar periods in 2018, primarily as a result of declines in the number of wireless devices sold as a result of an elongation of the handset upgrade cycle, partially offset by shifts to higher priced devices in the mix of devices sold.
Selling, General and Administrative Expense
Selling, general and administrative expense increased $214 million, or 5.6%, and $526 million, or 7.0%, during the three and six months ended June 30, 2019, respectively, compared to the similar periods in 2018, primarily due to increases in advertising costs, sales commission and bad debt expense. The increase in sales commission expense is due to a lower net deferral of commission costs in the current year as compared to the prior year, as a result of the adoption of Topic 606 on January 1, 2018 using a modified retrospective approach. These increases were partially offset by decreases in employee related costs primarily due to the Voluntary Separation Program.
Depreciation and Amortization Expense
Depreciation and amortization expense decreased $116 million, or 3.9%, and $197 million, or 3.3%, during the three and six months ended June 30, 2019, respectively, compared to the similar periods in 2018, driven by the change in the mix of total Verizon depreciable assets and Consumer's usage of those assets.
Segment Operating Income and EBITDA
|
| | | | | | | | | | | | | | | | | | | | | | | | | | | | | |
| Three Months Ended | | | | | Six Months Ended | | | |
| June 30, | | | Increase/ | | June 30, | | | Increase/ |
(dollars in millions) | 2019 |
| | 2018 |
| | (Decrease) | | 2019 |
| | 2018 |
| | (Decrease) |
Segment Operating Income | $ | 7,336 |
| | $ | 7,060 |
| | $ | 276 |
| | 3.9 | % | | $ | 14,586 |
| | $ | 13,995 |
| | $ | 591 |
| | 4.2 | % |
Add Depreciation and amortization expense | 2,881 |
| | 2,997 |
| | (116 | ) | | (3.9 | ) | | 5,775 |
| | 5,972 |
| | (197 | ) | | (3.3 | ) |
Segment EBITDA | $ | 10,217 |
| | $ | 10,057 |
| | $ | 160 |
| | 1.6 |
| | $ | 20,361 |
| | $ | 19,967 |
| | $ | 394 |
| | 2.0 |
|
Segment operating income margin | 33.4 | % | | 32.1 | % | | | | | | 33.0 | % | | 32.1 | % | | | | |
Segment EBITDA margin | 46.5 | % | | 45.7 | % | | | | | | 46.1 | % | | 45.8 | % | | | | |
The changes in the table above during the three and six months ended June 30, 2019, compared to the similar periods in 2018, were primarily a result of the factors described in connection with operating revenues and operating expenses.
Verizon Business Group
Our Business segment provides wireless and wireline communications services and products, video and data services, corporate networking solutions, security and managed network services, local and long distance voice services and network access to deliver various IoT services and products. We provide these products and services to businesses, government customers and wireless and wireline carriers across the U.S. and select products and services to customers around the world. The Business segment is organized in four customer groups: Global Enterprise, Small and Medium Business, Public Sector and Other, and Wholesale.
Operating Revenues and Selected Operating Statistics
|
| | | | | | | | | | | | | | | | | | | | | | | | | | | | | |
| Three Months Ended | | | | | | | Six Months Ended | | | | | |
| June 30, | | | Increase/ | | June 30, | | | Increase/ |
(dollars in millions) | 2019 |
| | 2018 |
| | (Decrease) | | 2019 |
| | 2018 |
| | (Decrease) |
Global Enterprise | $ | 2,673 |
| | $ | 2,808 |
| | $ | (135 | ) | | (4.8 | )% | | $ | 5,364 |
| | $ | 5,634 |
| | $ | (270 | ) | | (4.8 | )% |
Small and Medium Business | 2,785 |
| | 2,642 |
| | 143 |
| | 5.4 |
| | 5,493 |
| | 5,176 |
| | 317 |
| | 6.1 |
|
Public Sector and Other | 1,492 |
| | 1,437 |
| | 55 |
| | 3.8 |
| | 2,963 |
| | 2,867 |
| | 96 |
| | 3.3 |
|
Wholesale | 818 |
| | 964 |
| | (146 | ) | | (15.1 | ) | | 1,667 |
| | 1,957 |
| | (290 | ) | | (14.8 | ) |
Total Operating Revenues (1) | $ | 7,768 |
| | $ | 7,851 |
| | $ | (83 | ) | | (1.1 | ) | | $ | 15,487 |
| | $ | 15,634 |
| | $ | (147 | ) | | (0.9 | ) |
| | | | | | | | | | | | | | | |
Connections (‘000): (2) | | | | | | | | | | | | | | | |
Wireless retail postpaid connections |
|
| |
|
| |
|
| |
|
| | 24,221 |
| | 22,638 |
| | 1,583 |
| | 7.0 |
|
Fios Internet connections |
| |
| |
| |
| | 316 |
| | 296 |
| | 20 |
| | 6.8 |
|
Fios video connections |
|
| |
|
| |
|
| |
|
| | 76 |
| | 73 |
| | 3 |
| | 4.1 |
|
Broadband connections |
| |
| |
| |
| | 494 |
| | 509 |
| | (15 | ) | | (2.9 | ) |
Voice connections |
|
| |
|
| |
|
| |
|
| | 5,163 |
| | 5,639 |
| | (476 | ) | | (8.4 | ) |
| | | | | | | | | | | | | | | |
Net additions in period (‘000): (3) | | | | | | | | | | | | | | | |
Wireless retail postpaid | 325 |
| | 384 |
| | (59 | ) | | (15.4 | ) | | 587 |
| | 699 |
| | (112 | ) | | (16.0 | ) |
Wireless retail postpaid phones | 172 |
| | 182 |
| | (10 | ) | | (5.5 | ) | | 291 |
| | 311 |
| | (20 | ) | | (6.4 | ) |
| | | | | | | | | | | | | | | |
Churn Rate: | | | | | | | | | | | | | | | |
Wireless retail postpaid | 1.21 | % | | 1.16 | % | | | | | | 1.23 | % | | 1.16 | % | | | | |
Wireless retail postpaid phones | 0.97 | % | | 0.96 | % | | | | | | 0.99 | % | | 0.96 | % | | | | |
| |
(1) | Service and other revenues included in our Business segment amounted to approximately $7.0 billion and $13.9 billion for the three and six months ended June 30, 2019, respectively, and approximately $7.1 billion and $14.0 billion for the three and six months ended June 30, 2018, respectively. Wireless equipment revenues included in our Business segment amounted to approximately $814 million and $1.6 billion for the three and six months ended June 30, 2019, respectively, and approximately $793 million and $1.6 billion for the three and six months ended June 30, 2018, respectively. |
| |
(3) | Excluding acquisitions and adjustments |
Business’s total operating revenues decreased $83 million, or 1.1%, and $147 million, or 0.9%, during the three and six months ended June 30, 2019, compared to the similar periods in 2018. Both periods’ decrease were primarily as a result of decreases in Global Enterprise and Wholesale revenues, partially offset by increases in Small and Medium Business and Public Sector and Other revenues.
Global Enterprise
Global Enterprise offers services to large businesses, which are identified based on their size and volume of business with Verizon, as well as non-U.S. public sector customers.
Global Enterprise revenues decreased $135 million, or 4.8%, and $270 million, or 4.8%, during the three and six months ended June 30, 2019, respectively compared to the similar periods in 2018, primarily due to declines in traditional data and voice communication services as a result of competitive price pressures.
Small and Medium Business
Small and Medium Business offers wireless services and equipment, tailored voice and networking products, Fios services, IP Networking, advanced voice solutions, security, and managed information technology services to our U.S.-based customers that do not meet the requirements to be categorized as Global Enterprise.
Small and Medium Business revenues increased $143 million, or 5.4%, and $317 million, or 6.1%, during the three and six months ended June 30, 2019, respectively compared to the similar periods in 2018, largely due to increases in wireless postpaid service revenue, as a result of an increase in the amount of wireless retail postpaid connections. These increases were further driven by wireless equipment revenue due to the increase in the number of smartphone units sold, as well as increases in revenue related to Fios services. These increases were partially offset by revenue declines related to the loss of voice and DSL service connections. During the six months ended June 30, 2019, there was an increase in other revenue due to volume and rate-driven increases in revenue related to our wireless device protection package.
For the three and six months ended June 30, 2019, Fios revenues totaled $227 million and $456 million, respectively, and increased 14.0% and $61 million or 15.4%, respectively, compared to the similar period in 2018, reflecting the increase in total connections as well as increased demand in higher broadband speeds.
Public Sector and Other
Public Sector and Other offers wireless products and services, as well as wireline connectivity solutions, to U.S. federal, state and local governments and educational institutions. These services include the services offered by Consumer discussed above and business services and connectivity similar to the products and services offered by the Global Enterprise group, in each case, with features and pricing designed to address the needs of governments and educational institutions.
Public Sector and Other revenues increased $55 million, or 3.8%, and $96 million, or 3.3%, during the three and six months ended June 30, 2019, compared to the similar periods in 2018, respectively, due to increases in networking, customer premise equipment, as well as wireless equipment revenue, due to a shift in higher priced units in the mix of devices sold and increases in wireless device sales. The increases were further driven by wireless postpaid service revenue as a result of an increase in wireless retail postpaid connections.
Wholesale
Wholesale offers wireline communications services including data, voice, local dial tone and broadband services primarily to local, long distance, and wireless carriers that use our facilities to provide services to their customers.
Wholesale revenues decreased $146 million, or 15.1%, and $290 million, or 14.8%, during the three and six months ended June 30, 2019, compared to the similar periods in 2018, respectively, due to declines in core data and traditional voice services resulting from the effect of technology substitution and continuing contraction of market rates due to competition.
Operating Expenses
|
| | | | | | | | | | | | | | | | | | | | | | | | | | | | | |
| Three Months Ended | | | | | Six Months Ended | | | |
| June 30, | | | Increase/ | | June 30, | | | Increase/ |
(dollars in millions) | 2019 |
| | 2018 |
| | (Decrease) | | 2019 |
| | 2018 |
| | (Decrease) |
Cost of services | $ | 2,581 |
| | $ | 2,660 |
| | $ | (79 | ) | | (3.0 | )% | | $ | 5,172 |
| | $ | 5,370 |
| | $ | (198 | ) | | (3.7 | )% |
Cost of wireless equipment | 1,109 |
| | 1,101 |
| | 8 |
| | 0.7 |
| | 2,166 |
| | 2,137 |
| | 29 |
| | 1.4 |
|
Selling, general and administrative expense | 1,961 |
| | 1,930 |
| | 31 |
| | 1.6 |
| | 3,942 |
| | 3,794 |
| | 148 |
| | 3.9 |
|
Depreciation and amortization expense | 1,046 |
| | 1,059 |
| | (13 | ) | | (1.2 | ) | | 2,088 |
| | 2,118 |
| | (30 | ) | | (1.4 | ) |
Total Operating Expenses | $ | 6,697 |
| | $ | 6,750 |
| | $ | (53 | ) | | (0.8 | ) | | $ | 13,368 |
| | $ | 13,419 |
| | $ | (51 | ) | | (0.4 | ) |
Cost of Services
Cost of services decreased $79 million, or 3.0%, and $198 million, or 3.7%, during the three and six months ended June 30, 2019, compared to the similar periods in 2018, primarily related to decreases in personnel costs due to a lower headcount primarily as a result of the Voluntary Separation Program and decreases in access costs due to a reduction of voice connections, which were partially offset by increases in wireline equipment costs.
Cost of Wireless Equipment
Cost of wireless equipment increased 0.7%, and 1.4%, during the three and six months ended June 30, 2019, compared to the similar periods in 2018, primarily driven by a shift to higher priced units in the mix of devices sold. During the six months ended, the increases were further driven by the number of smartphone units sold.
Selling, General and Administrative Expense
Selling, general and administrative expense increased 1.6%, and $148 million, or 3.9%, during the three and six months ended June 30, 2019, compared to the similar periods in 2018, primarily driven by increases in advertising expenses and sales commission expense, which were partially offset by decreases in employee related costs primarily due to the Voluntary Separation Program.
Depreciation and Amortization Expense
Depreciation and amortization expense decreased 1.2%, and 1.4%, during the three and six months ended June 30, 2019, compared to the similar periods in 2018, driven by the change in the mix of total Verizon depreciable assets and Business's usage of those assets.
Segment Operating Income and EBITDA
|
| | | | | | | | | | | | | | | | | | | | | | | | | | | | | |
| Three Months Ended | | | | | Six Months Ended | | | |
| June 30, | | | Increase/ | | June 30, | | | Increase/ |
(dollars in millions) | 2019 |
| | 2018 |
| | (Decrease) | | 2019 |
| | 2018 |
| | (Decrease) |
Segment Operating Income | $ | 1,071 |
| | $ | 1,101 |
| | $ | (30 | ) | | (2.7 | )% | | $ | 2,119 |
| | $ | 2,215 |
| | $ | (96 | ) | | (4.3 | )% |
Add Depreciation and amortization expense | 1,046 |
| | 1,059 |
| | (13 | ) | | (1.2 | )% | | 2,088 |
| | 2,118 |
| | (30 | ) | | (1.4 | ) |
Segment EBITDA | $ | 2,117 |
| | $ | 2,160 |
| | $ | (43 | ) | | (2.0 | ) | | $ | 4,207 |
| | $ | 4,333 |
| | $ | (126 | ) | | (2.9 | ) |
| | | | | | | | | | | | | | | |
Segment operating income margin | 13.8 | % | | 14.0 | % | | | | | | 13.7 | % | | 14.2 | % | | | | |
Segment EBITDA margin | 27.3 | % | | 27.5 | % | | | | | | 27.2 | % | | 27.7 | % | | | | |
The changes in the table above during the three and six months ended June 30, 2019, compared to the similar periods in 2018, were primarily a result of the factors described in connection with operating revenues and operating expenses.
|
| | | | | | | | | | | | | | | |
| Three Months Ended | | | Six Months Ended | |
| June 30, | | | June 30, | |
(dollars in millions) | 2019 |
| | 2018 |
| | 2019 |
| | 2018 |
|
Severance, pension and benefits charges | | | | | | | |
Selling, general and administrative expense | $ | — |
| | $ | 339 |
| | $ | — |
| | $ | 339 |
|
Other income (expense), net | — |
| | — |
| | (96 | ) | | — |
|
Acquisition and integration related charges | | | | | | | |
Selling, general and administrative expense | — |
| | 109 |
| | — |
| | 214 |
|
Depreciation and amortization expense | — |
| | 11 |
| | — |
| | 13 |
|
Product realignment charges | | | | | | | |
Cost of services | — |
| | 303 |
| | — |
| | 303 |
|
Selling, general and administrative expense | — |
| | 147 |
| | — |
| | 147 |
|
Equity in losses of unconsolidated businesses | — |
| | 207 |
| | — |
| | 207 |
|
Depreciation and amortization expense | — |
| | 1 |
| | — |
| | 1 |
|
Early debt redemption costs | | | | | | | |
Other income (expense), net | 1,544 |
| | — |
| | 1,544 |
| | 249 |
|
Total | $ | 1,544 |
| | $ | 1,117 |
| | $ | 1,448 |
| | $ | 1,473 |
|
The Consolidated Adjusted EBITDA non-GAAP measure presented in the Consolidated Net Income, Consolidated EBITDA and Consolidated Adjusted EBITDA discussion (see "Consolidated Results of Operations") excludes all of the amounts included above, as described below.
The income and expenses related to special items included in our consolidated results of operations were as follows:
|
| | | | | | | | | | | | | | | |
| Three Months Ended | | | Six Months Ended | |
| June 30, | | | June 30, | |
(dollars in millions) | 2019 |
| | 2018 |
| | 2019 |
| | 2018 |
|
Within Total Operating Expenses | $ | — |
| | $ | 910 |
| | $ | — |
| | $ | 1,017 |
|
Within Equity in losses of unconsolidated businesses | — |
| | 207 |
| | — |
| | 207 |
|
Within Other income (expense), net | 1,544 |
| | — |
| | 1,448 |
| | 249 |
|
Total | $ | 1,544 |
| | $ | 1,117 |
| | $ | 1,448 |
| | $ | 1,473 |
|
Severance, Pension and Benefits Charges
During the six months ended June 30, 2019, we recorded a net pre-tax remeasurement credit of $96 million in our pension plans triggered by the Voluntary Separation Program for select U.S.-based management employees and other headcount reduction initiatives, primarily driven by a $150 million credit due to the difference between our estimated return on assets and our actual return on assets, offset by a $54 million charge due to a change in our discount rate assumption used to determine the current year liabilities of our pension plans. Pension and benefit activity was recorded in accordance with our accounting policy to recognize actuarial gains and losses in the period in which they occur.
During both the three and six months ended June 30, 2018, we recorded a pre-tax severance charge of approximately $339 million, exclusive of acquisition related severance charges.
See Note 9 to the condensed consolidated financial statements for additional information related to our 2019 pension and benefits credits.
Acquisition and Integration Related Charges
Acquisition and integration related charges recorded during the three and six months ended June 30, 2018 primarily related to the acquisition of Yahoo’s operating business in June 2017.
Product Realignment Charges
During the three months ended June 30, 2018, we recorded product realignment charges of $658 million. Product realignment charges primarily relate to the discontinuation of the go90 platform and associated content. These charges were recorded in Selling, general and administrative expense, Cost of services, Equity in losses of unconsolidated businesses, and Depreciation and amortization expense on our condensed consolidated statements of income for the three and six months ended June 30, 2018.
Early Debt Redemption Costs
During both the three and six months ended June 30, 2019, we recorded losses on early debt redemptions of $1.5 billion in connection with the tender offers of notes issued by Verizon with coupon rates ranging from 4.672% to 5.012% and maturity dates ranging from 2054 to 2055. These losses were recorded in Other income (expense), net on our condensed consolidated statement of income.
During the six months ended June 30, 2018, we recorded losses on early debt redemptions of $249 million in connection with the tender offers for 13 series of notes issued by Verizon with coupon rates ranging from 1.750% to 5.012% and maturity dates ranging from 2021 to 2055. These losses were recorded in Other income (expense), net on our condensed consolidated statement of income.
|
|
Consolidated Financial Condition |
|
| | | | | | | | | | | |
| Six Months Ended | | | |
| June 30, | | | |
(dollars in millions) | 2019 |
| | 2018 |
| | Change |
|
Cash Flows Provided By (Used In) | | | | | |
Operating activities | $ | 15,836 |
| | $ | 16,433 |
| | $ | (597 | ) |
Investing activities | (8,589 | ) | | (8,728 | ) | | 139 |
|
Financing activities | (8,043 | ) | | (7,865 | ) | | (178 | ) |
Decrease in cash, cash equivalents and restricted cash | $ | (796 | ) | | $ | (160 | ) | | $ | (636 | ) |
We use the net cash generated from our operations to fund expansion and modernization of our networks, service and repay external financing, pay dividends, invest in new businesses and, when appropriate, buy back shares of our outstanding common stock. Our sources of funds, primarily from operations and, to the extent necessary, from external financing arrangements, are sufficient to meet ongoing operating and investing requirements. We expect that our capital spending requirements will continue to be financed primarily through internally generated funds. Debt or equity financing may be needed to fund additional investments or development activities or to maintain an appropriate capital structure to ensure our financial flexibility. Our cash and cash equivalents are held both domestically and internationally, and are invested to maintain principal and provide liquidity. See "Market Risk" for additional information regarding our foreign currency risk management strategies.
Our available external financing arrangements include an active commercial paper program, credit available under credit facilities and other bank lines of credit, vendor financing arrangements, issuances of registered debt or equity securities, U.S. retail medium-term notes and other capital market securities that are privately-placed or offered overseas. In addition, we monetize our device payment plan agreement receivables through asset-backed debt transactions.
Cash Flows Provided By Operating Activities
Our primary source of funds continues to be cash generated from operations. Net cash provided by operating activities decreased $597 million during the six months ended June 30, 2019, compared to the similar period in 2018, primarily due to an increase in earnings and a decrease in discretionary contributions to qualified employee benefit plans, offset by changes in working capital, which includes an increase in cash income taxes, and severance payments as a result of the Voluntary Separation Program during the six months ended June 30, 2019, compared to the similar period in 2018. We made $300 million and $1.7 billion in discretionary employee benefits contributions during the six months ended June 30, 2019 and 2018, respectively, to our defined benefit pension plan. As a result of the discretionary pension contributions, we expect that there will be no required pension funding until 2024, which will continue to benefit future cash flows. Further, the funded status of our qualified pension plan improved as a result of the contributions.
Cash Flows Used In Investing Activities
Capital Expenditures
Capital expenditures continue to relate primarily to the use of capital resources to facilitate the introduction of new products and services, enhance responsiveness to competitive challenges, maintain the existing infrastructure and increase the operating efficiency and productivity of our networks.
Capital expenditures, including capitalized software, were as follows:
|
| | | | | | | |
| Six Months Ended | |
| June 30, | |
(dollars in millions) | 2019 |
| | 2018 |
|
Capital expenditures (including capitalized software) | $ | 7,967 |
| | $ | 7,838 |
|
Total as a percentage of revenue | 12.4 | % | | 12.3 | % |
Capital expenditures increased, during the six months ended June 30, 2019, primarily due to an increase in investments to support multi-use fiber assets, which support the densification of our 4G LTE network and a continued focus on 5G technology deployment. Our investments are primarily related to network infrastructure to support the business.
Acquisitions
In 2019, the Federal Communications Commission (FCC) completed two millimeter wave spectrum license auctions. Verizon participated in these auctions and was the high bidder on 9 and 1,066 licenses, respectively, in the 24 Gigahertz (GHz) and 28 GHz bands. We submitted an application to the FCC and paid cash of approximately $521 million for the licenses that will be issued. The deposits related to these spectrum licenses are classified within Other assets in our condensed consolidated balance sheets as of June 30, 2019.
During both the three and six months ended June 30, 2019, we completed various other acquisitions for an insignificant amount of cash consideration.
Cash Flows Used In Financing Activities
We seek to maintain a mix of fixed and variable rate debt to lower borrowing costs within reasonable risk parameters and to protect against earnings and cash flow volatility resulting from changes in market conditions. During the six months ended June 30, 2019 and 2018, net cash used in financing activities was $8.0 billion and $7.9 billion, respectively.
During the six months ended June 30, 2019, our net cash used in financing activities of $8.0 billion was primarily driven by repayments, redemptions and repurchases of long-term borrowings and finance lease obligations of $9.6 billion, cash dividends of $5.0 billion, and repayments of asset-backed long-term borrowings of $2.8 billion. These uses of cash were partially offset by proceeds from long-term borrowings of $6.2 billion and proceeds from asset-backed long-term borrowings of $4.0 billion.
At June 30, 2019, our total debt increased to $113.4 billion, compared to $113.1 billion at December 31, 2018. During the six months ended June 30, 2019 and 2018, our effective interest rate was 4.8%. See Note 6 to the condensed consolidated financial statements for additional information regarding our debt activity.
Verizon may continue to acquire debt securities issued by Verizon and its affiliates in the future through open market purchases, privately negotiated transactions, tender offers, exchange offers, or otherwise, upon such terms and at such prices as Verizon may from time to time determine for cash or other consideration.
Asset-Backed Debt
Cash collections on the device payment plan agreement receivables collateralizing asset-backed debt securities are required at certain specified times to be placed into segregated accounts. Deposits to the segregated accounts are considered restricted cash and are included in Prepaid expenses and other and Other assets in our condensed consolidated balance sheets.
Proceeds from our asset-backed debt transactions are reflected in Cash flows from financing activities in our condensed consolidated statements of cash flows. The asset-backed debt issued and the assets securing this debt are included in our condensed consolidated balance sheets.
See Note 6 to the consolidated financial statements for additional information.
Other, net
Other, net financing activities during the six months ended June 30, 2019 includes $526 million premium paid due to early extinguishment of debt.
Credit Facilities
As of June 30, 2019, the unused borrowing capacity under our $9.5 billion credit facility was approximately $9.4 billion. The credit facility does not require us to comply with financial covenants or maintain specified credit ratings, and it permits us to borrow even if our business has incurred a material adverse change. We use the credit facility for the issuance of letters of credit and for general corporate purposes.
In March 2016, we entered into a $1.0 billion credit facility insured by Eksportkreditnamnden, an export credit agency with a maturity date of December 2024. As of June 30, 2019, the outstanding balance was $647 million. We used this credit facility to finance network equipment-related purchases. In July 2017, we entered into credit facilities insured by various export credit agencies providing us with the ability to borrow up to $4.0 billion to finance equipment-related purchases with maturity dates ranging from July 2022 to May 2027. The facilities have multiple borrowings available, portions of which extend through October 2019 contingent upon the amount of eligible equipment-related purchases that we make. During the three and six months ended June 30, 2019, we drew $450 million and $874 million, respectively from these facilities. As of June 30, 2019, we had an outstanding balance of $3.5 billion.
Dividends
As in prior periods, dividend payments were a significant use of capital resources. We paid $5.0 billion and $4.8 billion in cash dividends during the six months ended June 30, 2019 and 2018, respectively.
Covenants
Our credit agreements contain covenants that are typical for large, investment grade companies. These covenants include requirements to pay interest and principal in a timely fashion, pay taxes, maintain insurance with responsible and reputable insurance companies, preserve our corporate existence, keep appropriate books and records of financial transactions, maintain our properties, provide financial and other reports to our lenders, limit pledging and disposition of assets and mergers and consolidations, and other similar covenants.
We and our consolidated subsidiaries are in compliance with all of our restrictive covenants.
Change In Cash, Cash Equivalents and Restricted Cash
Our Cash and cash equivalents at June 30, 2019 totaled $1.9 billion, a $796 million decrease compared to December 31, 2018, primarily as a result of the factors discussed above.
Restricted cash totaled $1.2 billion at both June 30, 2019 and December 31, 2018, primarily related to cash collections on the device payment plan agreement receivables that are required at certain specified times to be placed into segregated accounts.
Free Cash Flow
Free cash flow is a non-GAAP financial measure that reflects an additional way of viewing our liquidity that, when viewed with our GAAP results, provides a more complete understanding of factors and trends affecting our cash flows. Free cash flow is calculated by subtracting capital expenditures from net cash provided by operating activities. We believe it is a more conservative measure of cash flow since purchases of fixed assets are necessary for ongoing operations. Free cash flow has limitations due to the fact that it does not represent the residual cash flow available for discretionary expenditures. For example, free cash flow does not incorporate payments made on finance lease obligations or cash payments for business acquisitions. Therefore, we believe it is important to view free cash flow as a complement to our entire condensed consolidated statements of cash flows.
The following table reconciles net cash provided by operating activities to free cash flow:
|
| | | | | | | | | | | |
| Six Months Ended | | | |
| June 30, | | | |
(dollars in millions) | 2019 |
| | 2018 |
| | Change |
|
Net cash provided by operating activities | $ | 15,836 |
| | $ | 16,433 |
| | $ | (597 | ) |
Less Capital expenditures (including capitalized software) | 7,967 |
| | 7,838 |
| | 129 |
|
Free cash flow | $ | 7,869 |
| | $ | 8,595 |
| | $ | (726 | ) |
The decrease in free cash flow during the six months ended June 30, 2019, compared to the similar period in 2018, is a reflection of the decrease in operating cash flows and increase in capital expenditures discussed above.
We are exposed to various types of market risk in the normal course of business, including the impact of interest rate changes, foreign currency exchange rate fluctuations, changes in investment, equity and commodity prices and changes in corporate tax rates. We employ risk management strategies, which may include the use of a variety of derivatives including, but not limited to, cross currency swaps, forward starting interest rate swaps, interest rate swaps, interest rate caps and foreign exchange forwards. We do not hold derivatives for trading purposes.
It is our general policy to enter into interest rate, foreign currency and other derivative transactions only to the extent necessary to achieve our desired objectives in optimizing exposure to various market risks. Our objectives include maintaining a mix of fixed and variable rate debt to lower borrowing costs within reasonable risk parameters and to protect against earnings and cash flow volatility resulting from changes in market conditions. We do not hedge our market risk exposure in a manner that would completely eliminate the effect of changes in interest rates and foreign exchange rates on our earnings.
Counterparties to our derivative contracts are major financial institutions with whom we have negotiated derivatives agreements (ISDA master agreements) and credit support annex (CSA) agreements which provide rules for collateral exchange. Negotiations and executions of new ISDA master agreements and CSA agreements with our counterparties continued throughout 2018 and 2019. The newly executed CSA agreements contain rating based thresholds such that we or our counterparties may be required to hold or post collateral based upon changes in outstanding positions as compared to established thresholds and changes in credit ratings. At June 30, 2019 we held approximately $0.1 billion and at December 31, 2018 we posted approximately $0.1 billion of collateral related to derivative contracts under collateral exchange arrangements, which were recorded as Other current liabilities and Prepaid expenses and other, respectively, in our condensed consolidated balance sheets. While we may be exposed to credit losses due to the nonperformance of our counterparties, we consider the risk remote and do not expect that any such nonperformance would result in a significant effect on our results of operations or financial condition due to our diversified pool of counterparties. See Note 8 to the condensed consolidated financial statements for additional information regarding the derivative portfolio.
Interest Rate Risk
We are exposed to changes in interest rates, primarily on our short-term debt and the portion of long-term debt that carries floating interest rates. As of June 30, 2019, approximately 78% of the aggregate principal amount of our total debt portfolio consisted of fixed rate indebtedness, including the effect of interest rate swap agreements designated as hedges. The impact of a 100-basis-point change in interest rates affecting our floating rate debt would result in a change in annual interest expense, including our interest rate swap agreements that are designated as hedges, of approximately $258 million. The interest rates on our existing long-term debt obligations are unaffected by changes to our credit ratings.
Interest Rate Swaps
We enter into interest rate swaps to achieve a targeted mix of fixed and variable rate debt. We principally receive fixed rates and pay variable rates based on the London Interbank Offered Rate, resulting in a net increase or decrease to Interest expense. These swaps are designated as fair value hedges and hedge against interest rate risk exposure of designated debt issuances. At June 30, 2019, the fair value of the asset and liability of these contracts were $529 million and $189 million, respectively. At December 31, 2018, the fair value of the asset and liability of these contracts were insignificant and $813 million, respectively. At June 30, 2019 and December 31, 2018, the total notional amount of the interest rate swaps was $19.1 billion and $19.8 billion, respectively.
Forward Starting Interest Rate Swaps
We have entered into forward starting interest rate swaps designated as cash flow hedges in order to manage our exposure to interest rate changes on future forecasted transactions. At June 30, 2019, the fair value of the liability of these contracts was $536 million. At December 31, 2018, the fair value of the liability of these contracts was $60 million. At June 30, 2019 and December 31, 2018, the total notional amount of the forward starting interest rate swaps was $3.0 billion and $4.0 billion, respectively.
Interest Rate Caps
We also have interest rate caps which we use as an economic hedge but for which we have elected not to apply hedge accounting. We enter into interest rate caps to mitigate our interest exposure to interest rate increases on our ABS Financing Facilities and ABS Notes. The fair value of the asset and liability of these contracts were insignificant at both June 30, 2019 and December 31, 2018. At June 30, 2019 and December 31, 2018, the total notional value of these contracts was $1.3 billion and $2.2 billion, respectively.
Foreign Currency Translation
The functional currency for our foreign operations is primarily the local currency. The translation of income statement and balance sheet amounts of our foreign operations into U.S. dollars is recorded as cumulative translation adjustments, which are included in Accumulated other comprehensive income in our condensed consolidated balance sheets. Gains and losses on foreign currency transactions are recorded in the condensed consolidated statements of income in Other income (expense), net. At June 30, 2019, our primary translation exposure was to the British Pound Sterling, Euro, Australian Dollar and Japanese Yen.
Cross Currency Swaps
We have entered into cross currency swaps designated as cash flow hedges to exchange our British Pound Sterling, Euro, Swiss Franc and Australian Dollar-denominated cash flows into U.S. dollars and to fix our cash payments in U.S. dollars, as well as to mitigate the impact of foreign currency transaction gains or losses. The fair value of the asset of these contracts was $170 million at June 30, 2019 and $220 million
at December 31, 2018. At June 30, 2019 and December 31, 2018, the fair value of the liability of these contracts was $814 million and $536 million, respectively. At June 30, 2019 and December 31, 2018, the total notional amount of the cross currency swaps was $20.1 billion and $16.6 billion, respectively.
Foreign Exchange Forwards
We also have foreign exchange forwards which we use as an economic hedge but for which we have elected not to apply hedge accounting. We enter into British Pound Sterling and Euro foreign exchange forwards to mitigate our foreign exchange rate risk related to non-functional currency denominated monetary assets and liabilities of international subsidiaries. At June 30, 2019, the fair value of the asset of these contracts was insignificant. At June 30, 2019 and December 31, 2018, the total notional amount of the foreign exchange forwards was $1.0 billion and $600 million, respectively.
|
|
Acquisitions and Divestitures |
Spectrum License Transactions
From time to time, we enter into agreements to buy, sell or exchange spectrum licenses. We believe these spectrum license transactions have allowed us to continue to enhance the reliability of our wireless network, while also resulting in a more efficient use of spectrum. See Note 3 to the condensed consolidated financial statements for additional information.
Other
From time to time, we enter into strategic agreements to acquire various other businesses and investments. See Note 3 to the condensed consolidated financial statements for additional information.
|
|
Other Factors That May Affect Future Results |
Regulatory and Competitive Trends
There have been no material changes to Regulatory and Competitive Trends as previously disclosed in Part I, Item I. "Business" included in our Annual Report on Form 10-K for the year ended December 31, 2018, except as a result of our segment realignment.
Environmental Matters
Reserves have been established to cover environmental matters relating to discontinued businesses and past telecommunications activities. These reserves include funds to address contamination at the site of a former Sylvania facility in Hicksville, NY, which had processed nuclear fuel rods in the 1950s and 1960s. In September 2005, the Army Corps of Engineers (ACE) accepted the site into its Formerly Utilized Sites Remedial Action Program. As a result, the ACE has taken primary responsibility for addressing the contamination at the site. An adjustment to the reserves may be made after a cost allocation is conducted with respect to the past and future expenses of all of the parties. Adjustments to the environmental reserve may also be made based upon the actual conditions found at other sites requiring remediation.
Recently Issued Accounting Standards
See Note 1 to the condensed consolidated financial statements for a discussion of recently issued accounting standard updates not yet adopted as of June 30, 2019.
|
|
Cautionary Statement Concerning Forward-Looking Statements |
In this report we have made forward-looking statements. These statements are based on our estimates and assumptions and are subject to risks and uncertainties. Forward-looking statements include the information concerning our possible or assumed future results of operations. Forward-looking statements also include those preceded or followed by the words "anticipates," "believes," "estimates," "expects," "hopes" or similar expressions. For those statements, we claim the protection of the safe harbor for forward-looking statements contained in the Private Securities Litigation Reform Act of 1995. We undertake no obligation to revise or publicly release the results of any revision to these forward-looking statements, except as required by law. Given these risks and uncertainties, readers are cautioned not to place undue reliance on such forward-looking statements.
The following important factors, along with those discussed elsewhere in this report and in other filings with the Securities and Exchange Commission (SEC), could affect future results and could cause those results to differ materially from those expressed in the forward-looking statements:
| |
• | adverse conditions in the U.S. and international economies; |
| |
• | the effects of competition in the markets in which we operate; |
| |
• | material changes in technology or technology substitution; |
| |
• | disruption of our key suppliers’ provisioning of products or services; |
| |
• | changes in the regulatory environment in which we operate, including any increase in restrictions on our ability to operate our networks; |
| |
• | breaches of network or information technology security, natural disasters, terrorist attacks or acts of war or significant litigation and any resulting financial impact not covered by insurance; |
| |
• | our high level of indebtedness; |
| |
• | an adverse change in the ratings afforded our debt securities by nationally accredited ratings organizations or adverse conditions in the credit markets affecting the cost, including interest rates, and/or availability of further financing; |
| |
• | material adverse changes in labor matters, including labor negotiations, and any resulting financial and/or operational impact; |
| |
• | significant increases in benefit plan costs or lower investment returns on plan assets; |
| |
• | changes in tax laws or treaties, or in their interpretation; |
| |
• | changes in accounting assumptions that regulatory agencies, including the SEC, may require or that result from changes in the accounting rules or their application, which could result in an impact on earnings; |
| |
• | the inability to implement our business strategies; and |
| |
• | the inability to realize the expected benefits of strategic transactions. |
|
|
Item 3. Quantitative and Qualitative Disclosures About Market Risk |
Information relating to market risk is included in Item 2, Management’s Discussion and Analysis of Financial Condition and Results of Operations under the caption "Market Risk."
|
|
Item 4. Controls and Procedures |
Our Chief Executive Officer and Chief Financial Officer have evaluated the effectiveness of the registrant’s disclosure controls and procedures (as defined in Rules 13a-15(e) and 15d-15(e) of the Securities Exchange Act of 1934), as of the end of the period covered by this quarterly report, that ensure that information relating to the registrant which is required to be disclosed in this report is recorded, processed, summarized and reported within required time periods using the criteria for effective internal control established in Internal Control–Integrated Framework issued by the Committee of Sponsoring Organizations of the Treadway Commission in 2013. Based on this evaluation, our Chief Executive Officer and Chief Financial Officer have concluded that the registrant’s disclosure controls and procedures were effective as of June 30, 2019.
In the ordinary course of business, we routinely review our system of internal control over financial reporting and make changes to our systems and processes that are intended to ensure an effective internal control environment. We modified certain internal controls in connection with the new segment reporting structure, which was effective as of April 1, 2019. Other than the above-noted change, there were no changes in the Company’s internal control over financial reporting during the second quarter of 2019 that have materially affected, or are reasonably likely to materially affect, our internal control over financial reporting.
|
|
Part II – Other Information |
|
|
Item 1. Legal Proceedings |
In October 2013, the California Attorney General’s Office notified certain Verizon companies of potential violations of California state hazardous waste statutes primarily arising from the disposal of electronic components, batteries and aerosol cans at certain California facilities. We are cooperating with this investigation and continue to review our operations relating to the management of hazardous waste. While penalties relating to the alleged violations could exceed $100,000, we do not expect that any penalties ultimately incurred will be material.
See Note 12 to the condensed consolidated financial statements for additional information regarding legal proceedings.
There have been no material changes to our risk factors as previously disclosed in Part I, Item 1A. included in our Annual Report on Form 10‑K for the year ended December 31, 2018.
|
|
Item 2. Unregistered Sales of Equity Securities and Use of Proceeds |
In March 2017, the Verizon Board of Directors authorized a share buyback program to repurchase up to 100 million shares of the Company’s common stock. The program will terminate when the aggregate number of shares purchased reaches 100 million, or at the close of business on February 28, 2020, whichever is sooner. Under the program, shares may be repurchased in privately negotiated transactions and on the open market, including through plans complying with Rule 10b5-1(c) under the Exchange Act. The timing and number of shares purchased under the program, if any, will depend on market conditions and the Company’s capital allocation priorities.
Verizon did not repurchase any shares of Verizon common stock during the three months ended June 30, 2019. At June 30, 2019, the maximum number of shares that could be purchased by or on behalf of Verizon under our share buyback program was 100 million.
|
| | |
Exhibit Number | | Description |
| | |
31.1 | | Certification of Chief Executive Officer pursuant to Section 302 of the Sarbanes-Oxley Act of 2002. |
| | |
31.2 | | Certification of Chief Financial Officer pursuant to Section 302 of the Sarbanes-Oxley Act of 2002. |
| |
32.1 | | Certification of Chief Executive Officer pursuant to Section 906 of the Sarbanes-Oxley Act of 2002. |
| |
32.2 | | Certification of Chief Financial Officer pursuant to Section 906 of the Sarbanes-Oxley Act of 2002. |
| |
101.INS | | XBRL Instance Document - the instance document does not appear in the interactive data file because its XBRL tags are embedded within the inline XBRL document. |
| |
101.SCH | | XBRL Taxonomy Extension Schema Document. |
| |
101.PRE | | XBRL Taxonomy Presentation Linkbase Document. |
| |
101.CAL | | XBRL Taxonomy Calculation Linkbase Document. |
| |
101.LAB | | XBRL Taxonomy Label Linkbase Document. |
| |
101.DEF | | XBRL Taxonomy Extension Definition Linkbase Document. |
| |
104 | | Cover Page Interactive Data File (formatted as inline XBRL with applicable taxonomy extension information contained in Exhibits 101). |
Pursuant to the requirements of the Securities Exchange Act of 1934, the registrant has duly caused this report to be signed on its behalf by the undersigned thereunto duly authorized.
|
| | | | |
| | VERIZON COMMUNICATIONS INC. |
| | |
Date: August 8, 2019 | | By | | /s/ Anthony T. Skiadas |
| | | | Anthony T. Skiadas |
| | | | Senior Vice President and Controller |
| | | | (Principal Accounting Officer) |
|
| | |
Exhibit Number | | Description |
| | |
| | Certification of Chief Executive Officer pursuant to Section 302 of the Sarbanes-Oxley Act of 2002. |
| |
| | Certification of Chief Financial Officer pursuant to Section 302 of the Sarbanes-Oxley Act of 2002. |
| |
| | Certification of Chief Executive Officer pursuant to Section 906 of the Sarbanes-Oxley Act of 2002. |
| |
| | Certification of Chief Financial Officer pursuant to Section 906 of the Sarbanes-Oxley Act of 2002. |
| |
101.INS | | XBRL Instance Document - the instance document does not appear in the interactive data file because its XBRL tags are embedded within the inline XBRL document. |
| |
101.SCH | | XBRL Taxonomy Extension Schema Document. |
| |
101.PRE | | XBRL Taxonomy Presentation Linkbase Document. |
| |
101.CAL | | XBRL Taxonomy Calculation Linkbase Document. |
| |
101.LAB | | XBRL Taxonomy Label Linkbase Document. |
| |
101.DEF | | XBRL Taxonomy Extension Definition Linkbase Document. |
| | |
104 | | Cover Page Interactive Data File (formatted as inline XBRL with applicable taxonomy extension information contained in Exhibits 101). |
| | |