UNITED STATES
SECURITIES AND EXCHANGE COMMISSION
WASHINGTON, DC. 20549
FORM 10-K
For the fiscal year ended December 31, 2019
OR
For the transition period from to
Commission file number 0-17077
(Exact name of registrant as specified in its charter)
(State or other jurisdiction of | (I.R.S. Employer Identification No.) | |
incorporation or organization) | ||
(Address of principal executive offices) | (Zip Code) | |
Registrant’s telephone number, including area code (570 ) 322-1111
Securities registered pursuant to Section 12(b) of the Act:
Title of each class | Trading Symbol(s) | Name of each exchange on which registered | ||
Securities registered pursuant to Section 12(g) of the Act: None
Indicate by check mark if the registrant is a well-known seasoned issuer, as defined in Rule 405 of the Securities Act. ☐ Yes ☒ No
Indicate by check mark if the registrant is not required to file reports pursuant to Section 13 or Section 15(d) of the Act. ☐ Yes ☒ No
Indicate by check mark whether the registrant (1) has filed all reports required to be filed by Section 13 or 15(d) of the Securities Exchange Act of 1934 during the preceding 12 months (or for such shorter period that the registrant was required to file such reports), and (2) has been subject to such filing requirements for the past 90 days. Yes ☒ No ☐
Indicate by check mark whether the registrant has submitted electronically every Interactive Data File required to be submitted and posted pursuant to Rule 405 of Regulation S-T during the preceding 12 months (or for such shorter period that the registrant was required to submit and post such files). Yes ☒ No ☐
Indicate by check mark whether the registrant is a large accelerated filer, an accelerated filer, a non-accelerated filer, or a smaller reporting company, or emerging growth company. See definitions of “large accelerated filer,” “accelerated filer,” “smaller reporting company,” and "emerging growth company" in Rule 12b-2 of the Exchange Act. (Check one):
Large accelerated filer | ☐ | ☒ | |
Non-accelerated filer | ☐ | Smaller reporting company | |
Emerging growth company | |||
If an emerging growth company, indicate by check mark if registrant has elected not to use the extended transition period for complying with any new or revised financial accounting standards provided pursuant to Section 13(a) of the Exchange Act. ☐
Indicate by check mark whether the registrant is a shell company (as defined in Rule 12b-2 of the Exchange Act). ☐ Yes ☒ No
State the aggregate market value of the voting stock held by non-affiliates of the registrant $212,346,847 at June 30, 2019.
Indicate the number of shares outstanding of each of the issuer’s classes of common stock, as of the latest practicable date.
Class | Outstanding at March 2, 2020 | |
Common Stock, $5.55 Par Value | ||
DOCUMENTS INCORPORATED BY REFERENCE
Portions of the registrant’s definitive proxy statement prepared in connection with its annual meeting of shareholders to be held on April 28, 2020 are incorporated by reference in Part III hereof.
INDEX
ITEM | PAGE | |
2
PART I
ITEM 1 | BUSINESS |
A. General Development of Business and History
On January 7, 1983, Penns Woods Bancorp, Inc. (the “Corporation”) was incorporated under the laws of the Commonwealth of Pennsylvania as a bank holding company. In connection with the organization of the Corporation, Jersey Shore State Bank ("JSSB"), a Pennsylvania state-chartered bank, became a wholly owned subsidiary of the Corporation. On June 1, 2013, the Corporation acquired Luzerne Bank ("Luzerne") with Luzerne operating as a subsidiary of the Corporation (JSSB and Luzerne are collectively referred to as the "Banks"). The Corporation’s two other wholly-owned subsidiaries are Woods Real Estate Development Company, Inc. and Woods Investment Company, Inc. The Corporation is also a partner in United Insurance Solutions, LLC. The Corporation’s business has consisted primarily of managing and supervising the Banks, and its principal source of income has been dividends paid by the Banks and Woods Investment Company, Inc.
The Banks are engaged in commercial and retail banking which includes the acceptance of time, savings, and demand deposits, the funding of commercial, consumer, and mortgage loans, and safe deposit services. Utilizing a branch office network, ATMs, Internet, and telephone banking delivery channels, the Banks deliver their products and services to the communities they reside in.
In October 2000, JSSB acquired The M Group, Inc. D/B/A The Comprehensive Financial Group (“The M Group”). The M Group, which operates as a subsidiary of JSSB, offers insurance and securities brokerage services. Securities are offered by The M Group through Voya Financial, a registered broker-dealer.
Neither the Corporation nor the Banks anticipate that compliance with environmental laws and regulations will have any material effect on capital expenditures, earnings, or their competitive position. The Banks are not dependent on a single customer or a few customers, the loss of whom would have a material effect on the business of the Banks.
JSSB employed 252 persons, Luzerne employed 78 persons, and The M Group employed 4 persons as of December 31, 2019 in either a full-time or part-time capacity. The Corporation does not have any employees. The principal officers of the Banks also serve as officers of the Corporation.
Woods Investment Company, Inc., a Delaware holding company, maintains an investment portfolio that is managed for total return and to fund dividend payments by the Corporation.
Woods Real Estate Development Company, Inc. serves the Corporation through its acquisition and ownership of certain properties utilized by the Bank.
United Insurance Solutions, LLC offers property and casualty and auto insurance products within the Corporation's market footprint.
We post publicly available reports required to be filed with the SEC on our website, www.pwod.com, as soon as reasonably practicable after filing such reports with the SEC. The required reports are available free of charge through our website. Information available on our website is not part of or incorporated by reference into this Report or any other report filed by this Corporation with the SEC.
B. Regulation and Supervision
The Corporation is a registered bank holding company and, as such is subject to the provisions of the Bank Holding Company Act of 1956, as amended (the “BHCA”) and to supervision and examination by the Board of Governors of the Federal Reserve System (the “FRB”). During 2017, the Corporation elected to become a financial holding company under the BHCA and the regulations of the FRB. The Banks are also subject to the supervision and examination by the Federal Deposit Insurance Corporation (the “FDIC”), as their primary federal regulator and as the insurer of the Banks' deposits. The Banks are also regulated and examined by the Pennsylvania Department of Banking and Securities (the “Department”).
The insurance activities of The M Group are subject to regulation by the insurance departments of the various states in which The M Group conducts business, including principally the Pennsylvania Department of Insurance. The securities brokerage activities of The M Group are subject to regulation by federal and state securities commissions.
The insurance activities of United Insurance Solutions, LLC are subject to regulation by the Pennsylvania Department of Insurance.
3
The FRB has issued regulations under the BHCA that require a bank holding company to serve as a source of financial and managerial strength to its subsidiary banks. As a result, the FRB, pursuant to such regulations, may require the Corporation to stand ready to use its resources to provide adequate capital funds to the Banks during periods of financial stress or adversity. The BHCA requires the Corporation to secure the prior approval of the FRB before it can acquire all or substantially all of the assets of any bank, or acquire ownership or control of 5% or more of any voting shares of any bank. Such a transaction would also require approval of the Department.
A bank holding company is prohibited under the BHCA from engaging in, or acquiring direct or indirect control of, more than 5% of the voting shares of any company engaged in non-banking activities unless the FRB, by order or regulation, has found such activities to be so closely related to banking or managing or controlling banks as to be a proper incident thereto. Under the BHCA, the FRB has the authority to require a bank holding company to terminate any activity or relinquish control of a non-bank subsidiary (other than a non-bank subsidiary of a bank) upon the FRB’s determination that such activity or control constitutes a serious risk to the financial soundness and stability of any bank subsidiary of the bank holding company.
In July 2013, the federal bank regulatory agencies adopted revisions to the agencies’ capital adequacy guidelines and prompt corrective action rules, which were designed to enhance such requirements and implement the revised standards of the Basel Committee on Banking Supervision, commonly referred to as Basel III. The final rules generally implement higher minimum capital requirements, add a new common equity tier 1 capital requirement, and establish criteria that instruments must meet to be considered common equity tier 1 capital, additional tier 1 capital or tier 2 capital. The current minimum capital requirements are a common equity tier 1 capital ratio of 4.5% (6.5% to be considered “well capitalized”), a tier 1 capital ratio of 6.0%; (8.0% to be considered “well capitalized”), and a total capital ratio of 8.0% (10.0% to be considered “well capitalized”). In order to avoid limitations on capital distributions (including dividend payments and certain discretionary bonus payments to executive officers), as of January 1, 2019, a banking organization must hold a capital conservation buffer comprised of common equity tier 1 capital above its minimum risk-based capital requirements in an amount greater than 2.5% of total risk-weighted assets.
In addition to the risk-based capital guidelines, the FRB requires each bank holding company to comply with the leverage ratio, under which the bank holding company must maintain a minimum level of Tier 1 capital to average total consolidated assets of 4.0% (5.0% to be considered "well capitalized"). The Banks are subject to similar capital requirements adopted by the FDIC.
As noted in the discussion below relating Economic Growth, Regulatory Relief, and Consumer Protection Act, the FRB, effective August 30, 2018, raised the threshold of its "Small Bank Holding Company" exception to the application of consolidated capital requirements for qualifying small bank holding companies from $1 billion to $3 billion of consolidated assets. Consequently, bank holding companies having less than $3 billion of consolidated assets are not subject to the consolidated capital requirements unless otherwise directed by the FRB.
Dividends
Federal and state laws impose limitations on the payment of dividends by the Banks. The Pennsylvania Banking Code and the policies of the FDIC and the Department generally encourage the Banks to pay dividends from current net income and retained earnings. The Pennsylvania Banking Code restricts the availability of capital funds for payment of dividends by the Banks to their additional paid-in capital.
In addition to the dividend restrictions described above, the banking regulators have the authority to prohibit or to limit the payment of dividends by the Banks if, in the banking regulator’s opinion, payment of a dividend would constitute an unsafe or unsound practice in light of the financial condition of the Banks.
Under Pennsylvania law, the Corporation may not pay a dividend, if, after giving effect thereto, it would be unable to pay its debts as they become due in the usual course of business and, after giving effect to the dividend, the total assets of the Corporation would be less than the sum of its total liabilities plus the amount that would be needed, if the Corporation were to be dissolved at the time of distribution, to satisfy the preferential rights upon dissolution of shareholders whose rights are superior to those receiving the dividend.
It is also the policy of the FRB that a bank holding company generally may only pay dividends on common stock out of net income available to common shareholders over the past twelve months and only if the prospective rate of earnings retention appears consistent with a bank holding company’s capital needs, asset quality, and overall financial condition. A bank holding company also should not maintain a dividend level that places undue pressure on the capital of such institution’s subsidiaries, or that may undermine the bank holding company’s ability to serve as a source of strength for such subsidiaries.
4
C. Regulation of the Banks
The Banks are highly regulated by the FDIC and the Department. The laws that such agencies enforce limit the specific types of businesses in which the Banks may engage, and the products and services that the Banks may offer to customers. Generally, these limitations are designed to protect the insurance fund of the FDIC and/or the customers of the Banks, and not the Banks or their shareholders. From time to time, various types of new federal and state legislation have been proposed that could result in additional regulation of, and restrictions on, the business of the Banks. It cannot be predicted whether any such legislation will be adopted or how such legislation would affect business of the Banks. As a consequence of the extensive regulation of commercial banking activities in the United States, the Banks' business is particularly susceptible to being affected by federal legislation and regulations that may increase the costs of doing business. Some of the major regulatory provisions that affect the business of the Banks are discussed briefly below.
Prompt Corrective Action
The FDIC has specified the levels at which an insured institution will be considered “well-capitalized,” “adequately capitalized,” “undercapitalized,” and “critically undercapitalized.” In the event an institution’s capital deteriorates to the “undercapitalized” category or below, the Federal Deposit Insurance Act (the “FDIA”) and FDIC regulations prescribe an increasing amount of regulatory intervention, including: (1) the institution of a capital restoration plan by a bank and a guarantee of the plan by a parent institution and liability for civil money damages for failure to fulfill its commitment on that guarantee; and (2) the placement of a hold on increases in assets, number of branches, or lines of business. If capital has reached the significantly or critically undercapitalized levels, further material restrictions can be imposed, including restrictions on interest payable on accounts, dismissal of management and (in critically undercapitalized situations) appointment of a receiver. For well-capitalized institutions, the FDIA provides authority for regulatory intervention where the institution is deemed to be engaging in unsafe or unsound practices or receives a less than satisfactory examination report rating for asset quality, management, earnings or liquidity.
Deposit Insurance
The FDIC maintains the Deposit Insurance Fund ("DIF") by assessing depository institutions an insurance premium. The FDIC has set the amount of deposits it insures at $250,000.
Under the FDIC's risk-based assessment system, insured institutions were previously assigned one of four risk categories based on supervisory evaluations, regulatory capital levels and certain other factors. An institution's assessment rate depended largely on the category to which it was assigned, with institutions deemed less risky paying lower FDIC deposit insurance premiums. The Dodd-Frank Act required the FDIC to revise its procedures to base deposit insurance assessments on each insured institution's total assets less tangible equity instead of deposits and also mandated that the Deposit Insurance Fund achieve a reserve ratio of 1.35% of insured deposits by September 2020. Effective April 1, 2011, the range of possible base assessments was set between 2.5 and 45 basis points of total assets less tangible equity. Effective July 1, 2016, the FDIC eliminated the previously utilized risk categories and based assessments for most banks on certain financial measures and supervisory ratings derived from statistical modeling estimating the probability of failure over three years, and also set maximum rates for institutions with composite CAMELS ratings of 1 or 2 and minimum rates for other institutions. In connection with the Deposit Insurance Fund reserve ratio achieving 1.5% in July 2016, the total base assessment range (after possible adjustments) was reduced for most banks to 1.5 basis points to 30 basis points. As of the September 2019 assessment date, when the Deposit Insurance Fund reserve ratio reached or exceeded 1.38%, banks with less than $10 billion of total consolidated assets began receiving certain "small bank assessment credits" for the portion of their assessments that contributed to the growth in the FDIC's fund reserve ratio from 1.15% to 1.35%; credits will be applied so long as the Deposit Insurance Fund reserve ratio is at or above 1.35%.
Federal Home Loan Bank System
The Banks are members of the Federal Home Loan Bank of Pittsburgh (the “FHLB”), which is one of 12 regional Federal Home Loan Banks. Each Federal Home Loan Bank serves as a reserve or central bank for its members within its assigned region. It is funded primarily from funds deposited by member institutions and proceeds from the sale of consolidated obligations of the Federal Home Loan Bank System. It makes loans to members (i.e., advances) in accordance with policies and procedures established by the board of directors of the Federal Home Loan Bank. At December 31, 2019, the Banks had $156,333,000 in FHLB advances.
As a member, the Banks are required to purchase and maintain stock in the FHLB. The amount of required stock varies based on the FHLB products utilized by the Banks and the amount of the products utilized. At December 31, 2019, the Banks had $13,023,000 in stock of the FHLB, which was in compliance with this requirement.
5
Economic Growth, Regulatory Relief, and Consumer Protection Act of 2018
In May 2018, the Economic Growth, Regulatory Relief, and Consumer Protection Act (the “Regulatory Relief Act”), amended certain provisions of the Dodd-Frank Act, as well as certain other statutes administered by the federal banking agencies. Some of the key provisions of the Regulatory Relief Act as it relates to community banks and bank holding companies include: (i) designating mortgages held in portfolio as “qualified mortgages” for banks with less than $10 billion in assets, subject to certain documentation and product limitations; (ii) exempting banks with less than $10 billion in assets (and total trading assets and trading liabilities of 5% or less of total assets) from Volcker Rule requirements relating to proprietary trading; (iii) simplifying capital calculations for banks with less than $10 billion in assets by requiring federal banking agencies to establish a community bank leverage ratio of tangible equity to average consolidated assets of not less than 8% or more than 10%, and provide that banks that maintain tangible equity in excess of such ratio will be deemed to be in compliance with risk-based capital and leverage requirements; (iv) assisting smaller banks with obtaining stable funding by providing an exception for reciprocal deposits from FDIC restrictions on acceptance of brokered deposits; (v) raising the eligibility for use of short-form Call Reports from $1 billion to $5 billion in assets; (vi) clarifying definitions pertaining to high volatility commercial real estate loans (HVCRE), which require higher capital allocations, so that only loans with increased risk are subject to higher risk weightings; and (vii) changing the eligibility for use of the small bank holding company policy statement from institutions with under $1 billion in assets to institutions with under $3 billion in assets.
Section 201 of the Regulatory Relief Act directed the federal banking agencies to develop a community bank leverage ratio (“CBLR”) of not less than 8% and not more than 10% for qualifying community banks and bank holding companies with total consolidated assets of less than $10 billion. Qualifying community banking organizations that exceed the CBLR level established by the agencies, and that elect to be covered by the CBLR framework, will be considered to have met: (i) the generally applicable leverage and risk-based capital requirements under the banking agencies’ capital rules; (ii) the capital ratio requirements necessary to be considered “well capitalized” under the banking agencies’ prompt corrective action framework in the case of insured depository institutions; and (iii) any other applicable capital or leverage requirements.
In September 2019, the federal banking agencies approved the final rule to implement the provisions of Section 201 of the Regulatory Relief Act. Under the new rule, which was effective January 1, 2020, a qualifying community banking organization is defined as a depository institution or depository institution holding company with less than $10 billion in assets. A qualifying community banking organization has the option to elect the Community Bank Leverage Ratio ("CBLR") framework if its CBLR is greater than 9% and it has off-balance sheet exposures of 25% or less of consolidated assets, and trading assets and liabilities of 5% or less of total consolidated assets. The leverage ratio for purposes of the CBLR is calculated as Tier I capital divided by average total assets, consistent with the manner banking organizations calculate the leverage ratio under generally applicable capital rules. Qualifying community banking organizations that exceed the CBLR level established by the agencies, and that elect to be covered by the CBLR framework, will be considered to have met: (i) the generally applicable leverage and risk-based capital requirements under the banking agencies’ capital rules; (ii) the capital ratio requirements necessary to be considered “well capitalized” under the banking agencies’ prompt corrective action framework in the case of insured depository institutions; and (iii) any other applicable capital or leverage requirements. For institutions that fall below the 9% capital requirement but remain above 8%, are allowed a two quarter grace period to either meet the qualifying criteria again or to comply with the generally applicable capital rules.
The Corporation continues to analyze the changes implemented by the Regulatory Relief Act, including the CBLR framework included in the recently adopted final rules. The Corporation has not elected at this time to utilize the CBLR framework. The Corporation does not believe, however, that the changes resulting from the Regulatory Relief Act will materially impact the Corporation’s business, operations, or financial results.
Other Legislation
The 2010 Dodd-Frank Act made significant changes to the bank regulatory structure and affects the lending, deposit, investment, trading and operating activities of financial institutions and their holding companies. The Dodd-Frank Act, among other things: (i) expands the authority of the FRB to examine bank holding companies and their subsidiaries, including insured depository institutions; (ii) requires a bank holding company to be well capitalized and well managed to receive approval of an interstate bank acquisition; (iii) provides mortgage reform provisions regarding a customer’s ability to pay and making more loans subject to provisions for higher-cost loans and new disclosures; (iv) creates the Consumer Financial Protection Bureau (the “CFPB”) that has rulemaking authority for a wide range of consumer protection laws that apply to all banks and has broad powers to supervise and enforce consumer protection laws; (v) introduces additional corporate governance and executive compensation requirements on public companies subject to the Securities and Exchange Act of 1934, such as the Corporation; (vi) permits FDIC-insured banks to pay interest on business demand deposits; (vii) requires that holding companies and other companies that directly or indirectly control an insured depository institution serve as a source of financial strength to that institution; (viii) makes permanent the
6
$250,000 limit for federal deposit insurance at all insured depository institutions; and (ix) permits national and state banks to establish interstate branches to the same extent as the branch host state allows establishment of in-state branches.
The Dodd-Frank Act also created a new Consumer Financial Protection Bureau with broad powers to supervise and enforce consumer protection laws. The Consumer Financial Protection Bureau has broad rule-making authority for a wide range of consumer protection laws that apply to all banks and savings institutions, including the authority to prohibit “unfair, deceptive or abusive” acts and practices. The Consumer Financial Protection Bureau has examination and enforcement authority over all banks and savings institutions with more than $10 billion in assets. Banks and savings institutions with $10 billion or less in assets such as the Banks will continue to be examined for compliance with the consumer laws by their primary bank regulators. The Dodd-Frank Act also weakens the federal preemption rules that have been applicable for national banks and federal savings associations, and gives state attorneys general the ability to enforce federal consumer protection laws.
Under the Bank Secrecy Act, a financial institution is required to have systems in place to detect certain types of transactions, based on the size and nature of the transaction. Financial institutions are generally required to report cash transactions involving more than $10,000 to the United States Treasury. In addition, financial institutions are required to file suspicious activity reports for transactions that involve more than $5,000 and that the financial institution knows, suspects or has reason to suspect, involves illegal funds, is designed to evade the requirements of the law, or has no lawful purpose.
Under the Uniting and Strengthening America by Providing Appropriate Tools Required to Intercept and Obstruct Terrorism Act, commonly referred to as the “USA PATRIOT Act,” financial institutions are subject to prohibitions against specified financial transactions and account relationships, as well as enhanced due diligence standards intended to detect, and prevent, the use of the United States financial system for money laundering and terrorist financing activities. The Patriot Act requires financial institutions, including banks, to establish anti-money laundering programs, including employee training and independent audit requirements, meet minimum specified standards, follow minimum standards for customer identification and maintenance of customer identification records.
The Sarbanes-Oxley Act of 2002 was enacted to enhance penalties for accounting and auditing improprieties at publicly traded companies and to protect investors by improving the accuracy and reliability of corporate disclosures under the federal securities laws. The Sarbanes-Oxley Act generally applies to all companies, including the Corporation, that file or are required to file periodic reports with the Securities and Exchange Commission under the Securities Exchange Act of 1934, or the Exchange Act. The legislation includes provisions, among other things, governing the services that can be provided by a public company’s independent auditors and the procedures for approving such services, requiring the chief executive officer and principal accounting officer to certify certain matters relating to the company’s periodic filings under the Exchange Act, requiring expedited filings of reports by insiders of their securities transactions and containing other provisions relating to insider conflicts of interest, increasing disclosure requirements relating to critical financial accounting policies and their application, increasing penalties for securities law violations, and creating a new public accounting oversight board, a regulatory body subject to SEC jurisdiction with broad powers to set auditing, quality control, and ethics standards for accounting firms. In response to the legislation, the national securities exchanges and NASDAQ, adopted new rules relating to certain governance matters, including the independence of members of a company’s audit committee as a condition to listing or continued listing.
Congress is often considering financial industry legislation, and the federal banking agencies routinely propose new regulations. The Corporation cannot predict how any new legislation, or new rules adopted by federal or state banking agencies, may affect the business of the Corporation and its subsidiaries in the future.
Environmental Laws
Environmentally related hazards have become a source of high risk and potential liability for financial institutions relating to their loans. Environmentally contaminated properties owned by an institution’s borrowers may result in a drastic reduction in the value of the collateral securing the institution’s loans to such borrowers, high environmental clean up costs to the borrower affecting its ability to repay the loans, the subordination of any lien in favor of the institution to a state or federal lien securing clean up costs, and liability to the institution for clean up costs if it forecloses on the contaminated property or becomes involved in the management of the borrower. The Corporation is not aware of any borrower who is currently subject to any environmental investigation or clean up proceeding which is likely to have a material adverse effect on the financial condition or results of operations of the Corporation.
7
Effect of Government Monetary Policies
The earnings of the Corporation are and will be affected by domestic economic conditions and the monetary and fiscal policies of the United States Government and its agencies. The monetary policies of the FRB have had, and will likely continue to have, an important impact on the operating results of commercial banks through its power to implement national monetary policy in order, among other things, to curb inflation or combat a recession. The FRB has a major effect upon the levels of bank loans, investments, and deposits through its open market operations in the United States Government securities and through its regulation of, among other things, the discount rate on borrowings by member banks and the reserve requirements against member bank deposits. It is not possible to predict the nature and impact of future changes in monetary and fiscal policies.
DESCRIPTION OF THE BANKS
History and Business
JSSB was incorporated under the laws of the Commonwealth of Pennsylvania as a state bank in 1934 and became a wholly owned subsidiary of the Corporation on July 12, 1983. As of December 31, 2019, JSSB had total assets of $1,231,224,000; total shareholders’ equity of $99,076,000; and total deposits of $942,192,000. JSSB's deposits are insured by the FDIC for the maximum amount provided under current law.
Luzerne was acquired by the Corporation on June 1, 2013. As of December 31, 2019, Luzerne had total assets of $453,131,000; total shareholders’ equity of $53,169,000; and total deposits of $382,260,000. Luzerne's deposits are insured by the FDIC for the maximum amount provided under current law.
The Banks engage in business as commercial banks, doing business at locations in Lycoming, Clinton, Centre, Montour, Union and Luzerne Counties, Pennsylvania. The Banks offer insurance, securities brokerage services, annuity and mutual fund investment products, and financial planning through the M Group.
Services offered by the Banks include accepting time, demand and savings deposits including Super NOW accounts, statement savings accounts, money market accounts, and fixed rate certificates of deposit. Their services also include making secured and unsecured business and consumer loans that include financing commercial transactions as well as construction and residential mortgage loans and revolving credit loans with overdraft protection.
The Banks' loan portfolio mix can be classified into three principal categories: commercial and agricultural, real estate, and consumer. Real estate loans can be further segmented into residential, commercial, and construction. Qualified borrowers are defined by our loan policy and our underwriting standards. Owner provided equity requirements range from 0% to 35%, depending on the collateral offered for the loan. Terms are generally restricted to 30 years or less with the exception of construction and land development, which are generally limited to one and five years, respectively. Real estate appraisals, property construction verifications, and site visitations comply with our loan policy and with industry regulatory standards.
Prospective residential mortgage customer’s repayment ability is determined from information contained in the application and recent income tax returns, or other verified income sources. Emphasis is on credit, employment, income, and residency verification. Broad hazard insurance is always required and flood insurance where applicable. In the case of construction mortgages, builders risk insurance is requested.
Agricultural loans for the purchase or improvement of real estate must meet the Banks' real estate underwriting criteria. Agricultural loans made for the purchase of equipment are usually payable in five years, but never more than ten, depending upon the useful life of the purchased asset. Minimum borrower equity ranges from 0% to 35% depending on the purpose. Livestock financing criteria depends upon the nature of the operation. Agricultural loans are also made for crop production purposes. Such loans are structured to repay within the production cycle and not carried over into a subsequent year.
Commercial loans are made for the acquisition and improvement of real estate, purchase of equipment, and for working capital purposes on a seasonal or revolving basis. General purpose working capital loans are also available with repayment expected within one year. Equipment loans are generally amortized over three to ten years. Insurance coverage with the Banks as loss payee is required, especially in the case where the equipment is rolling stock. It is also a general policy to collateralize non-real estate loans with the asset purchased and, depending upon loan terms, junior liens are filed on other available assets. Financial information required on all commercial mortgages includes the most current three years balance sheets and income statements and projections on income to be developed through the project. In the case of corporations and partnerships, the principals are often asked to personally guaranty the entity’s debt.
8
Seasonal and revolving lines of credit are offered for working capital purposes. Collateral for such a loan may vary but often includes the pledge of inventory and/or receivables. Drawing availability is usually 50% of inventory and 80% of eligible receivables. Eligible receivables are defined as invoices less than 90 days delinquent. Exclusive reliance is very seldom placed on such collateral; therefore, other lienable assets are also taken into the collateral pool. Where reliance is placed on inventory and accounts receivable, the applicant must provide financial information including agings on a specified basis. In addition, the guaranty of the principals is usually obtained.
Letter of credit availability is usually limited to standby or performance letters of credit where the customer is well known to the Banks. The credit criteria is the same as that utilized in making a direct loan. Collateral is obtained in most cases.
Consumer loan products include residential mortgages, home equity loans and lines, automobile financing, personal loans and lines of credit, overdraft and check lines. Our policy includes standards used in the industry on debt service ratios and terms are consistent with prudent underwriting standards and the use of proceeds. Verifications are made of employment and residency, along with credit history.
Second mortgages are confined to equity borrowing and home improvements. Terms are generally fifteen years or less. Loan to collateral value criteria is 90% or less and verifications are made to determine values. Automobile financing is generally restricted to five years and done on both an indirect and direct basis. The Banks, as a practice, do not floor plan and therefore do not discount dealer paper. Small loan requests are to accommodate personal needs such as debt consolidation or the purchase of small appliances. Overdraft check lines are usually limited to $5,000 or less.
The Banks' investment portfolios are analyzed and priced on a monthly basis. Investments are made in U.S. Treasuries, U.S. Agency issues, bank qualified tax-exempt municipal bonds, taxable municipal bonds, corporate bonds, and corporate stocks which consist of Pennsylvania bank stocks. Bonds with BBB or better ratings are used, unless a local issue is purchased that has a lesser or no rating. Factors taken into consideration when investments are purchased include liquidity, the Corporation’s tax position, tax equivalent yield, third party investment ratings, and the policies of the Asset/Liability Committee.
The banking environment in Lycoming, Clinton, Centre, Montour, Union and Luzerne Counties, Pennsylvania is highly competitive. The Banks operate twenty-six full service offices in these markets and compete for loans and deposits with numerous commercial banks, savings and loan associations, and other financial institutions. The economic base of the region is developed around small business, health care, educational facilities (college and public schools), light manufacturing industries, and agriculture.
The Banks have a relatively stable deposit base and no material amount of deposits is obtained from a single depositor or group of depositors, excluding public entities that account for approximately 7% of total deposits. Although the Banks have regular opportunities to bid on pools of funds of $100,000 or more in the hands of municipalities, hospitals, and others, it does not rely on these monies to fund loans or intermediate or longer-term investments.
The Banks have not experienced any significant seasonal fluctuations in the amount of deposits. The Banks have experienced an outflow of deposits related to municipalities and school districts due to the ongoing Commonwealth of Pennsylvania budget impasse.
Supervision and Regulation
As referenced elsewhere, the banking business is highly regulated, and the Banks are only able to engage in business activities, and to provide products and services, that are permitted by applicable law and regulation. In addition, the earnings of the Banks are affected by the policies of regulatory authorities including the FDIC and the FRB. An important function of the FRB is to regulate the money supply and interest rates. Among the instruments used to implement these objectives are open market operations in U.S. Government Securities, changes in reserve requirements against member bank deposits, and limitations on interest rates that member banks may pay on time and savings deposits. These instruments are used in varying combinations to influence overall growth and distribution of bank loans, and their use may also affect interest rates charged on loans or paid for deposits.
The policies and regulations of the FRB have had and will probably continue to have a significant effect on the Banks' deposits, loans and investment growth, as well as the rate of interest earned and paid, and are expected to affect the Banks' operation in the future. The effect of such policies and regulations upon the future business and earnings of the Banks cannot accurately be predicted.
9
ITEM 1A | RISK FACTORS |
The following sets forth several risk factors that may affect the Corporation's financial condition or results of operations.
Changes in interest rates could reduce our income, cash flows and asset values.
Our income and cash flows and the value of our assets depend to a great extent on the difference between the interest rates we earn on interest-earning assets, such as loans and investment securities, and the interest rates we pay on interest-bearing liabilities such as deposits and borrowings. These rates are highly sensitive to many factors which are beyond our control, including general economic conditions and policies of various governmental and regulatory agencies and, in particular, the Board of Governors of the Federal Reserve System. Changes in monetary policy, including changes in interest rates, will influence not only the interest we receive on our loans and investment securities and the amount of interest we pay on deposits and borrowings but will also affect our ability to originate loans and obtain deposits and the value of our investment portfolio. If the rate of interest we pay on our deposits and other borrowings increases more than the rate of interest we earn on our loans and other investments, our net interest income, and therefore our earnings, could be adversely affected. Our earnings also could be adversely affected if the rates on our loans and other investments fall more quickly than those on our deposits and other borrowings.
Uncertainty relating to the expected phase-out of the London Interbank Offered Rate (“LIBOR”) in 2021 may adversely affect us.
LIBOR has been used extensively in the United States as a reference rate for various financial contracts, including adjustable-rate loans, asset-backed securities, and interest rate swaps. In 2017, the Chief Executive of the United Kingdom Financial Conduct Authority, which regulates LIBOR, announced that the FCA will not compel panel banks to submit rates for the calculation of LIBOR after 2021. The announcement means that the continuation of LIBOR on the current basis cannot be guaranteed after 2021. At this time, no consensus exists as to what rate or rates may become acceptable alternatives to LIBOR, and it is impossible to predict the effect of any such alternatives on the value of LIBOR-based variable rate loans and other securities or financial arrangements, given LIBOR's current role in determining market interest rates globally. The uncertainty as to the nature and effect of such reforms and actions relating to the discontinuance of LIBOR may adversely affect the value of and return on certain of our financial assets and liabilities that are based on or are linked to LIBOR, which may adversely affect the Company's results of operations or financial condition. In addition, LIBOR-related reforms may also require changes to the agreements that govern these LIBOR-based products, as well as our internal systems and processes.
Economic conditions either nationally or locally in areas in which our operations are concentrated may adversely affect our business.
Deterioration in local, regional, national, or global economic conditions could cause us to experience a reduction in deposits and new loans, an increase in the number of borrowers who default on their loans, and a reduction in the value of the collateral securing their loans, all of which could adversely affect our performance and financial condition. Unlike larger banks that are more geographically diversified, we provide banking and financial services locally. Therefore, we are particularly vulnerable to adverse local economic conditions.
The outbreak of the recent coronavirus ("COVID-19"), or an outbreak of another highly infectious or contagious disease, could adversely affect the Corporation’s business, financial condition and results of operations.
The Corporation's business is dependent upon the willingness and ability of its customers to conduct banking and other financial transactions. The spread of a highly infectious or contagious disease, such as COVID-19, could cause severe disruptions in the U.S. economy, which could in turn disrupt the business, activities, and operations of the Corporation’s customers, as well the business and operations of the Corporation. Moreover, since the beginning of January 2020, the coronavirus outbreak has caused significant disruption in the financial markets both globally and in the United States. The spread of COVID-19, or an outbreak of another highly infectious or contagious disease, may result in a significant decrease in business and/or cause the Corporation’s customers to be unable to meet existing payment or other obligations to the Corporation, particularly in the event of a spread of COVID-19 or an outbreak of an infectious disease in the Corporation’s market area. Although the Corporation maintains contingency plans for pandemic outbreaks, a spread of COVID-19, or an outbreak of another contagious disease, could also negatively impact the availability of key personnel of the Corporation necessary to conduct the business of the Corporation. Such a spread or outbreak could also negatively impact the business and operations of third-party service providers who perform critical services for the Corporation’s business. If COVID-19, or another highly infectious or contagious disease, spreads or the response to contain COVID-19 is unsuccessful, the Corporation could experience a material adverse effect on its business, financial condition, and results of operations
10
Our financial condition and results of operations would be adversely affected if our allowance for loan losses is not sufficient to absorb actual losses or if we are required to increase our allowance.
Despite our underwriting criteria, we may experience loan delinquencies and losses. In order to absorb losses associated with nonperforming loans, we maintain an allowance for loan losses based on, among other things, historical experience, an evaluation of economic conditions, and regular reviews of delinquencies and loan portfolio quality. Determination of the allowance inherently involves a high degree of subjectivity and requires us to make significant estimates of current credit risks and future trends, all of which may undergo material changes. At any time there are likely to be loans in our portfolio that will result in losses but that have not been identified as nonperforming or potential problem credits. We cannot be sure that we will be able to identify deteriorating credits before they become nonperforming assets or that we will be able to limit losses on those loans that are identified. We may be required to increase our allowance for loan losses for any of several reasons. Federal regulators, in reviewing our loan portfolio as part of a regulatory examination, may request that we increase our allowance for loan losses. Changes in economic conditions affecting borrowers, new information regarding existing loans, identification of additional problem loans and other factors, both within and outside of our control, may require an increase in our allowance. In addition, if charge-offs in future periods exceed our allowance for loan losses, we will need additional increases in our allowance for loan losses. Any increases in our allowance for loan losses will result in a decrease in our net income and, possibly, our capital, and may materially affect our results of operations in the period in which the allowance is increased.
Many of our loans are secured, in whole or in part, with real estate collateral which is subject to declines in value.
In addition to considering the financial strength and cash flow characteristics of a borrower, we often secure our loans with real estate collateral. Real estate values and the real estate market are generally affected by, among other things, changes in local, regional or national economic conditions, fluctuations in interest rates and the availability of loans to potential purchasers, changes in tax laws and other governmental statutes, regulations and policies, and acts of nature. The real estate collateral provides an alternate source of repayment in the event of default by the borrower. If real estate prices in our markets decline, the value of the real estate collateral securing our loans could be reduced. If we are required to liquidate real estate collateral securing loans during a period of reduced real estate values to satisfy the debt, our earnings and capital could be adversely affected.
Our information systems may experience an interruption or breach in security.
We rely heavily on communications and information systems to conduct our business. Any failure, interruption or breach in security of these systems could result in failures or disruptions in our customer-relationship management, general ledger, deposit, loan and other systems. While we have policies and procedures designed to prevent or limit the effect of the failure, interruption or security breach of our information systems, there can be no assurance that any such failures, interruptions or security breaches will not occur; or, if they do occur, that they will be adequately addressed. The occurrence of any failures, interruptions or security breaches of our information systems could damage our reputation, result in a loss of customer business, subject us to additional regulatory scrutiny or expose us to civil litigation and possible financial liability; any of which could have a material adverse effect on our financial condition and results of operations.
We face the risk of cyber-attack to our computer systems.
Our computer systems, software and networks have been and will continue to be vulnerable to unauthorized access, loss or destruction of data (including confidential client information), account takeovers, unavailability of service, computer viruses or other malicious code, cyber-attacks and other events. These threats may derive from human error, fraud or malice on the part of employees or third parties, or may result from accidental technological failure. If one or more of these events occurs, it could result in the disclosure of confidential client information, damage to our reputation with our clients and the market, additional costs to us (such as repairing systems or adding new personnel or protection technologies), regulatory penalties and financial losses, to both us and our clients and customers. Such events could also cause interruptions or malfunctions in our operations (such as the lack of availability of our online banking system), as well as the operations of our clients, customers or other third parties. Although we maintain safeguards to protect against these risks, there can be no assurance that we will not suffer losses in the future that may be material in amount.
11
Competition may decrease our growth or profits.
We face substantial competition in all phases of our operations from a variety of different competitors, including commercial banks, savings and loan associations, mutual savings banks, credit unions, consumer finance companies, factoring companies, leasing companies, insurance companies, and money market mutual funds. There is very strong competition among financial services providers in our principal service area. Our competitors may have greater resources, higher lending limits, or larger branch systems than we do. Accordingly, they may be able to offer a broader range of products and services as well as better pricing for those products and services than we can.
In addition, some of the financial services organizations with which we compete are not subject to the same degree of regulation as is imposed on federally insured financial institutions. As a result, those non-bank competitors may be able to access funding and provide various services more easily or at less cost than we can, adversely affecting our ability to compete effectively.
The value of certain investment securities is volatile and future declines or other-than-temporary impairments could materially adversely affect our future earnings and regulatory capital.
Continued volatility in the market value for certain of our investment securities, whether caused by changes in market perceptions of credit risk, as reflected in the expected market yield of the security, or actual defaults in the portfolio could result in significant fluctuations in the value of the securities. This could have a material adverse impact on our accumulated other comprehensive income/loss and shareholders’ equity depending on the direction of the fluctuations. Furthermore, future downgrades or defaults in these securities could result in future classifications of investment securities as other than temporarily impaired. This could have a material impact on our future earnings.
We may be adversely affected by government regulation.
The banking industry is heavily regulated. Banking regulations are primarily intended to protect the federal deposit insurance funds and depositors, not shareholders. Changes in the laws, regulations, and regulatory practices affecting the banking industry may increase our costs of doing business or otherwise adversely affect us and create competitive advantages for others. Regulations affecting banks and financial services companies undergo continuous change, and we cannot predict the ultimate effect of these changes, which could have a material adverse effect on our profitability or financial condition.
The potential exists for additional federal or state laws and regulations, or changes in policy, affecting many aspects of our operations, including capital levels, lending and funding practices, and liquidity standards. New laws and regulations may increase our costs of regulatory compliance and of doing business and otherwise affect our operations, and may significantly affect the markets in which we do business, the markets for and value of our loans and investments, the fees we can charge and our ongoing operations, costs and profitability.
We rely on our management and other key personnel, and the loss of any of them may adversely affect our operations.
We are and will continue to be dependent upon the services of our executive management team. In addition, we will continue to depend on our ability to retain and recruit key commercial loan officers. The unexpected loss of services of any key management personnel or commercial loan officers could have an adverse effect on our business and financial condition because of their skills, knowledge of our market, years of industry experience, and the difficulty of promptly finding qualified replacement personnel.
Environmental liability associated with lending activities could result in losses.
In the course of our business, we may foreclose on and take title to properties securing our loans. If hazardous substances were discovered on any of these properties, we could be liable to governmental entities or third parties for the costs of remediation of the hazard, as well as for personal injury and property damage. Many environmental laws can impose liability regardless of whether we knew of, or were responsible for, the contamination. In addition, if we arrange for the disposal of hazardous or toxic substances at another site, we may be liable for the costs of cleaning up and removing those substances from the site even if we neither own nor operate the disposal site. Environmental laws may require us to incur substantial expenses and may materially limit use of properties we acquire through foreclosure, reduce their value or limit our ability to sell them in the event of a default on the loans they secure. In addition, future laws or more stringent interpretations or enforcement policies with respect to existing laws may increase our exposure to environmental liability.
12
Failure to implement new technologies in our operations may adversely affect our growth or profits.
The market for financial services, including banking services and consumer finance services, is increasingly affected by advances in technology, including developments in telecommunications, data processing, computers, automation, Internet-based banking, and telebanking. Our ability to compete successfully in our markets may depend on the extent to which we are able to exploit such technological changes. However, we can provide no assurance that we will be able to properly or timely anticipate or implement such technologies or properly train our staff to use such technologies. Any failure to adapt to new technologies could adversely affect our business, financial condition, or operating results.
The Corporation is required to adopt the FASB's accounting standard which requires measurement of certain financial assets (including loans) using the current expected credit losses (CECL) beginning in calendar year 2023.
Current GAAP requires an incurred loss methodology for recognizing credit losses that delays recognition until it is probable a loss has been incurred. The FASB's amendment replaces the current incurred loss methodology with a methodology that reflects expected credit losses and requires consideration of a broader range of reasonableness and supportable information to inform credit loss estimates. The Corporation is in the process of evaluating the impact of the adoption of this guidance on the Corporation's financial statements; however, it is anticipated that the allowance for loan losses will increase upon the adoption of CECL and that the increased allowance level will have the effect of decreasing shareholders' equity and the Corporation's and Bank's regulatory capital ratios.
An investment in our common stock is not an insured deposit.
Our common stock is not a bank deposit and, therefore, is not insured against loss by the FDIC, any other deposit insurance fund, or by any other public or private entity. Investment in our common stock is subject to the same market forces that affect the price of common stock in any company.
ITEM 1B | UNRESOLVED STAFF COMMENTS |
None.
13
ITEM 2 | PROPERTIES |
The Corporation owns or leases its properties. Listed herewith are the locations of properties owned or leased as of December 31, 2019, in which the banking offices are located; all properties are in good condition and adequate for the Corporation's purposes:
Jersey Shore State Bank & Subsidiaries | ||||
Office | Address | Ownership | ||
Main Street | 115 South Main Street, PO Box 5098 | Owned | ||
Jersey Shore, Pennsylvania 17740 | ||||
Bridge Street | 112 Bridge Street | Owned | ||
Jersey Shore, Pennsylvania 17740 | ||||
DuBoistown | 2675 Euclid Avenue | Owned | ||
Williamsport, Pennsylvania 17702 | ||||
Williamsport | 300 Market Street | Owned | ||
P.O. Box 967 | ||||
Williamsport, Pennsylvania 17703-0967 | ||||
Montgomery | 9094 Rt. 405 Highway | Owned | ||
Montgomery, Pennsylvania 17752 | ||||
Lock Haven | 4 West Main Street | Owned | ||
Lock Haven, Pennsylvania 17745 | ||||
Mill Hall | (Inside Wal-Mart), 173 Hogan Boulevard | Under Lease | ||
Mill Hall, Pennsylvania 17751 | ||||
Spring Mills | 3635 Penns Valley Road, P.O. Box 66 | Under Lease | ||
Spring Mills, Pennsylvania 16875 | ||||
Centre Hall | 2842 Earlystown Road | Land Under Lease | ||
Centre Hall, Pennsylvania 16828 | ||||
Zion | 100 Cobblestone Road | Owned | ||
Bellefonte, Pennsylvania 16823 | ||||
State College | 2050 North Atherton Street | Land Under Lease | ||
State College, Pennsylvania 16803 | ||||
Montoursville | 820 Broad Street | Under Lease | ||
Montoursville, Pennsylvania 17754 | ||||
Danville | 150 Continental Boulevard | Under Lease | ||
Danville, Pennsylvania 17821 | ||||
Loyalsock | 1720 East Third Street | Owned | ||
Williamsport, PA 17701 | ||||
Lewisburg | 550 North Derr Drive | Owned | ||
Lewisburg, PA 17837 | ||||
Muncy-Hughesville | 3081 Route 405 Highway | Owned | ||
Muncy, PA 17756 | ||||
Snow Shoe | 493 East Sycamore Road | Under Lease | ||
Snow Shoe, PA 16874 | ||||
Mansfield Mortgage Office | 102 West Wellsboro Street, Suite 2 | Under Lease | ||
Mansfield, PA 16933 | ||||
The M Group, Inc. | 1720 East Third Street | Owned | ||
D/B/A The Comprehensive Financial Group | Williamsport, PA 17701 | |||
14
Luzerne Bank | ||||
Office | Address | Ownership | ||
Dallas | 509 Main Road | Owned | ||
Memorial Highway | ||||
Dallas, PA 18612 | ||||
Lake | Corners of Rt. 118 & 415 | Owned | ||
Dallas, PA 18612 | ||||
Hazle Twp. | 10 Dessen Drive | Owned | ||
Hazle Twp., PA 18202 | ||||
Luzerne | 118 Main Street | Owned | ||
Luzerne, PA 18709 | ||||
Plains | 1077 Hwy. 315 | Under Lease | ||
Wilkes Barre, PA 18702 | ||||
Wilkes-Barre | 67 Public Square | Under Lease | ||
Wilkes-Barre, PA 18701 | ||||
Conyngham Valley | 669 State Route 93 STE 5 | Under Lease | ||
Sugarloaf, PA 18249 | ||||
Pittston | 285 South Main Stret | Under Lease | ||
Pittston, PA 18640 | ||||
Forty Fort | 1320 Wyoming Avenue | Under Lease | ||
Forty Fort, PA 18704 | ||||
ITEM 3 | LEGAL PROCEEDINGS |
The Corporation is subject to lawsuits and claims arising out of its business in the ordinary course. In the opinion of management, after review and consultation with counsel, there are no legal proceedings currently pending or threatened that are reasonably likely to have a material adverse effect on the consolidated financial position or results of operations of the Corporation.
ITEM 4 | MINE SAFETY DISCLOSURES |
Not applicable.
15
PART II
ITEM 5 | MARKET FOR THE REGISTRANT’S COMMON STOCK, RELATED STOCKHOLDER MATTERS, AND ISSUER PURCHASES OF EQUITY SECURITIES |
The Corporation’s common stock is listed on the NASDAQ Global Select Market under the symbol “PWOD”. The following table sets forth (1) the quarterly high and low closing sale prices for a share of the Corporation’s common stock during the periods indicated, and (2) quarterly dividends on a share of the common stock with respect to each quarter since January 1, 2017.
Price Range | Dividends | ||||||||||
High | Low | Declared | |||||||||
2019 | |||||||||||
First quarter | $ | 29.67 | $ | 23.23 | $ | 0.31 | |||||
Second quarter | 30.17 | 26.03 | 0.31 | ||||||||
Third quarter | 30.93 | 26.87 | 0.31 | ||||||||
Fourth quarter | 35.58 | 29.68 | 0.32 | ||||||||
2018 | |||||||||||
First quarter | $ | 30.37 | $ | 26.41 | $ | 0.31 | |||||
Second quarter | 31.28 | 27.53 | 0.31 | ||||||||
Third quarter | 30.85 | 28.81 | 0.31 | ||||||||
Fourth quarter | 29.45 | 25.77 | 0.31 | ||||||||
2017 | |||||||||||
First quarter | $ | 32.97 | $ | 28.85 | $ | 0.31 | |||||
Second quarter | 29.07 | 25.45 | 0.31 | ||||||||
Third quarter | 30.98 | 27.39 | 0.31 | ||||||||
Fourth quarter | 33.19 | 30.43 | 0.31 | ||||||||
The Corporation has paid dividends since the effective date of its formation as a bank holding company. It is the present intention of the Corporation’s board of directors to continue the dividend payment policy; however, further dividends must necessarily depend upon earnings, financial condition, appropriate legal restrictions, and other factors relevant at the time the board of directors of the Corporation considers dividend policy. Cash available for dividend distributions to shareholders of the Corporation primarily comes from dividends paid by Jersey Shore State Bank and Luzerne Bank to the Corporation. Therefore, the restrictions on the Banks' dividend payments are directly applicable to the Corporation. See also the information appearing in Note 20 to “Notes to Consolidated Financial Statements” for additional information related to dividend restrictions.
Under the Pennsylvania Business Corporation Law of 1988 a corporation may not pay a dividend, if after giving effect thereto, the corporation would be unable to pay its debts as they become due in the usual course of business and after giving effect thereto the total assets of the corporation would be less than the sum of its total liabilities plus the amount that would be needed, if the corporation were to be dissolved at the time of the distribution, to satisfy the preferential rights upon dissolution of the shareholders whose preferential rights are superior to those receiving the dividend.
As of March 2, 2020, the Corporation had approximately 1,208 shareholders of record.
Following is a schedule of the shares of the Corporation’s common stock purchased by the Corporation during the fourth quarter of 2019.
Period | Total Number of Shares (or Units) Purchased | Average Price Paid per Share (or Units) Purchased | Total Number of Shares (or Units) Purchased as Part of Publicly Announced Plans or Programs | Maximum Number (or Approximate Dollar Value) of Shares (or Units) that May Yet Be Purchased Under the Plans or Programs | |||||||||
Month #1 (October 1 - October 31, 2019) | — | $ | — | — | 513,669 | ||||||||
Month #2 (November 1 - November 30, 2019) | — | — | — | 513,669 | |||||||||
Month #3 (December 1 - December 31, 2019) | — | — | — | 513,669 | |||||||||
16
Set forth below is a line graph comparing the yearly dollar changes in the cumulative shareholder return on the Corporation’s common stock against the cumulative total return of the S&P 500 Stock Index, NASDAQ Composite, Russell 2000, and SNL U.S. Bank NASDAQ Index for the period of five fiscal years assuming the investment of $100.00 on December 31, 2014 and assuming the reinvestment of dividends. The shareholder return shown on the graph below is not necessarily indicative of future performance.
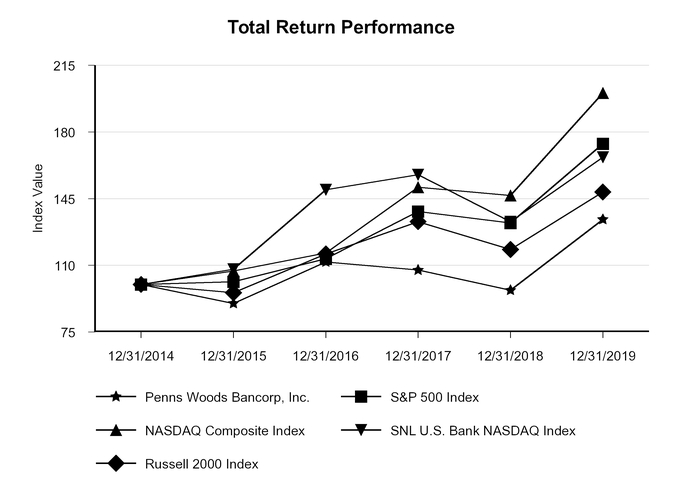
Period Ending | ||||||||||||||||||
Index | 12/31/2014 | 12/31/2015 | 12/31/2016 | 12/31/2017 | 12/31/2018 | 12/31/2019 | ||||||||||||
Penns Woods Bancorp, Inc. | 100.00 | 89.99 | 111.74 | 107.51 | 96.92 | 134.08 | ||||||||||||
S&P 500 | 100.00 | 101.38 | 113.51 | 138.29 | 132.23 | 173.86 | ||||||||||||
NASDAQ Composite | 100.00 | 106.96 | 116.45 | 150.96 | 146.67 | 200.49 | ||||||||||||
SNL U.S. Bank NASDAQ | 100.00 | 107.95 | 149.68 | 157.58 | 132.82 | 166.75 | ||||||||||||
Russell 2000 | 100.00 | 95.59 | 115.95 | 132.94 | 118.30 | 148.49 | ||||||||||||
17
ITEM 6 | SELECTED FINANCIAL DATA |
The following table sets forth certain financial data for each of the years in the five-year period ended December 31, 2019:
(In Thousands, Except Per Share Data Amounts) | 2019 | 2018 | 2017 | 2016 | 2015 | |||||||||||||||
Consolidated Statement of Income Data: | ||||||||||||||||||||
Interest income | $ | 66,774 | $ | 58,746 | $ | 49,977 | $ | 46,813 | $ | 46,124 | ||||||||||
Interest expense | 15,959 | 10,936 | 5,897 | 5,567 | 5,219 | |||||||||||||||
Net interest income | 50,815 | 47,810 | 44,080 | 41,246 | 40,905 | |||||||||||||||
Provision for loan losses | 2,735 | 1,735 | 730 | 1,196 | 2,300 | |||||||||||||||
Net interest income after provision for loan losses | 48,080 | 46,075 | 43,350 | 40,050 | 38,605 | |||||||||||||||
Non-interest income | 10,452 | 9,461 | 10,744 | 12,113 | 12,765 | |||||||||||||||
Non-interest expense | 39,708 | 38,007 | 36,862 | 35,091 | 33,736 | |||||||||||||||
Income before income tax provision | 18,824 | 17,529 | 17,232 | 17,072 | 17,634 | |||||||||||||||
Income tax provision | 3,138 | 2,819 | 7,459 | 4,597 | 3,736 | |||||||||||||||
Consolidated net income | 15,686 | 14,710 | 9,773 | 12,475 | 13,898 | |||||||||||||||
Earnings attributable to noncontrolling interest | 14 | 6 | — | — | — | |||||||||||||||
Net income attributable to Penns Woods Bancorp, Inc. | $ | 15,672 | $ | 14,704 | $ | 9,773 | $ | 12,475 | $ | 13,898 | ||||||||||
Consolidated Balance Sheet at End of Period: | ||||||||||||||||||||
Total assets | $ | 1,665,323 | $ | 1,684,771 | $ | 1,474,492 | $ | 1,348,590 | $ | 1,320,057 | ||||||||||
Loans | 1,355,544 | 1,384,757 | 1,246,614 | 1,093,681 | 1,045,207 | |||||||||||||||
Allowance for loan losses | (11,894 | ) | (13,837 | ) | (12,858 | ) | (12,896 | ) | (12,044 | ) | ||||||||||
Deposits | 1,324,005 | 1,219,903 | 1,146,320 | 1,095,214 | 1,031,880 | |||||||||||||||
Long-term debt | 161,920 | 138,942 | 70,970 | 85,998 | 91,025 | |||||||||||||||
Shareholders’ equity | 154,960 | 143,536 | 138,192 | 138,249 | 136,279 | |||||||||||||||
Per Share Data: | ||||||||||||||||||||
Earnings per share - basic | $ | 2.23 | $ | 2.09 | $ | 1.39 | $ | 1.76 | $ | 1.94 | ||||||||||
Earnings per share - diluted | 2.20 | 2.09 | 1.39 | 1.76 | 1.94 | |||||||||||||||
Cash dividends declared | 1.26 | 1.25 | 1.25 | 1.25 | 1.25 | |||||||||||||||
Book value | 22.01 | 20.39 | 19.65 | 19.47 | 19.14 | |||||||||||||||
Number of shares outstanding, at end of period | 7,040,515 | 7,037,322 | 7,033,784 | 7,101,986 | 7,120,698 | |||||||||||||||
Weighted average number of shares outstanding - basic | 7,038,714 | 7,035,381 | 7,058,403 | 7,103,186 | 7,158,359 | |||||||||||||||
Weighted average number of shares outstanding - diluted | 7,113,339 | 7,035,381 | 7,058,403 | 7,103,186 | 7,158,359 | |||||||||||||||
Selected Financial Ratios: | ||||||||||||||||||||
Return on average shareholders’ equity | 10.54 | % | 10.72 | % | 6.91 | % | 8.96 | % | 10.11 | % | ||||||||||
Return on average total assets | 0.94 | % | 0.94 | % | 0.69 | % | 0.93 | % | 1.08 | % | ||||||||||
Net interest margin | 3.31 | % | 3.31 | % | 3.47 | % | 3.44 | % | 3.61 | % | ||||||||||
Dividend payout ratio | 56.27 | % | 59.97 | % | 90.42 | % | 71.37 | % | 64.52 | % | ||||||||||
Average shareholders’ equity to average total assets | 8.91 | % | 8.77 | % | 10.05 | % | 10.36 | % | 10.68 | % | ||||||||||
Loans to deposits, at end of period | 102.38 | % | 113.51 | % | 108.75 | % | 99.86 | % | 101.29 | % | ||||||||||
18
ITEM 7 | MANAGEMENT’S DISCUSSION AND ANALYSIS OF FINANCIAL CONDITION AND RESULTS OF OPERATIONS |
RESULTS OF OPERATIONS
NET INTEREST INCOME
Net interest income is determined by calculating the difference between the yields earned on interest-earning assets and the rates paid on interest-bearing liabilities. To compare the tax-exempt asset yields to taxable yields, amounts are adjusted to taxable equivalents based on the marginal corporate federal tax rate of 21% for 2019 and 2018 and 34% for 2017. The tax equivalent adjustments to net interest income for 2019, 2018, and 2017 were $489,000, $700,000, and $1,281,000, respectively.
2019 vs. 2018
Reported net interest income increased $3,005,000 to $50,815,000 for the year ended December 31, 2019 compared to the year ended December 31, 2018, as growth in the earning asset portfolio was coupled with the yield on earning assets increasing to 4.33% from 4.06%. Total interest income increased $8,028,000 primarily from the growth in the average balance of the loan portfolio along with an increase in the average balance of the investment portfolio as the investment portfolio is actively managed to reduce interest rate and market risk. Interest income on a tax equivalent basis recognized on the loan portfolio increased $6,341,000 due to a $50,797,000 increase in the average balance in the loan portfolio coupled with a 31 basis point ("bp") increase in the loan portfolio yield . Interest and dividend income generated from the investment portfolio on a tax equivalent basis increased $1,224,000 due to a $23,443,000 increase in the average balance in the investment portfolio and a 30 bp increase in the average rate.
Interest expense increased $5,023,000 to $15,959,000 for the year ended December 31, 2019 compared to 2018. The increase in interest expense was driven by growth in interest bearing deposits, primarily time deposits. The average rate paid on interest-bearing liabilities increased 35 bp to 1.34% for 2019. The average rate paid on time deposits increased 55 bp as the time deposit portfolio was lengthened and utilized to reduce total borrowings. Interest expense paid on super now deposits increased $725,000 due to a $5,931,000 increase in the average balance and a 30 bp increase in the average rate. Money market interest expense increased $970,000 due to an increase in average rate paid of 41 bp.
2018 vs. 2017
Reported net interest income increased $3,730,000 to $47,810,000 for the year ended December 31, 2018 compared to the year ended December 31, 2017, as growth in the earning asset portfolio was coupled with the yield on earning assets increasing to 4.06% from 3.92%. Total interest income increased $8,769,000 primarily from the growth in the average balance of the loan portfolio along with a slight increase in the average balance of the investment portfolio as the investment portfolio is actively managed to reduce interest rate and market risk. Interest income on a tax equivalent basis recognized on the loan portfolio increased $8,188,000 due to a $175,997,000 increase in the average balance in the loan portfolio. Interest and dividend income generated from the investment portfolio on a tax equivalent basis increased $383,000 due to a $2,946,000 increase in the average balance in the investment portfolio and a 20 bp increase in the average rate.
Interest expense increased $5,039,000 to $10,936,000 for the year ended December 31, 2018 compared to 2017. The increase in interest expense was driven by growth in borrowings and total deposits. The average rate paid on interest-bearing liabilities increased 37 bp to 0.99% for 2018. The average rate paid on time deposits increased 35 bp as the time deposit portfolio was lengthened in preparation for a rising rate environment.
19
AVERAGE BALANCES AND INTEREST RATES
The following tables set forth certain information relating to the Corporation’s average balance sheet and reflect the average yield on assets and average cost of liabilities for the periods indicated and the average yields earned and rates paid. Such yields and costs are derived by dividing income or expense by the average balance of assets or liabilities, respectively, for the periods presented.
2019 | 2018 | 2017 | |||||||||||||||||||||||||||||||
(Dollars In Thousands) | Average Balance (1) | Interest | Average Rate | Average Balance (1) | Interest | Average Rate | Average Balance (1) | Interest | Average Rate | ||||||||||||||||||||||||
Assets: | |||||||||||||||||||||||||||||||||
Tax-exempt loans (3) | $ | 66,435 | $ | 2,038 | 3.07 | % | $ | 74,923 | $ | 2,242 | 2.99 | % | $ | 49,982 | $ | 1,924 | 3.85 | % | |||||||||||||||
All other loans (4) | 1,309,806 | 58,774 | 4.49 | % | 1,250,521 | 52,229 | 4.18 | % | 1,099,465 | 44,563 | 4.05 | % | |||||||||||||||||||||
Total loans (2) | 1,376,241 | 60,812 | 4.42 | % | 1,325,444 | 54,471 | 4.11 | % | 1,149,447 | 46,487 | 4.04 | % | |||||||||||||||||||||
Taxable securities | 134,935 | 5,306 | 3.99 | % | 100,915 | 3,828 | 3.79 | % | 84,079 | 2,689 | 3.20 | % | |||||||||||||||||||||
Tax-exempt securities (3) | 25,702 | 835 | 3.29 | % | 36,279 | 1,089 | 3.00 | % | 50,169 | 1,845 | 3.68 | % | |||||||||||||||||||||
Total securities | 160,637 | 6,141 | 3.88 | % | 137,194 | 4,917 | 3.58 | % | 134,248 | 4,534 | 3.38 | % | |||||||||||||||||||||
Interest-bearing deposits | 21,161 | 310 | 2.00 | % | 3,005 | 58 | 1.93 | % | 22,461 | 237 | 1.06 | % | |||||||||||||||||||||
Total interest-earning assets | 1,558,039 | 67,263 | 4.33 | % | 1,465,643 | 59,446 | 4.06 | % | 1,306,156 | 51,258 | 3.92 | % | |||||||||||||||||||||
Other assets | 111,839 | 97,577 | 100,481 | ||||||||||||||||||||||||||||||
Total assets | $ | 1,669,878 | $ | 1,563,220 | $ | 1,406,637 | |||||||||||||||||||||||||||
Liabilities and shareholders’ equity: | |||||||||||||||||||||||||||||||||
Savings | $ | 169,832 | 216 | 0.13 | % | $ | 164,844 | 75 | 0.05 | % | $ | 157,851 | 62 | 0.04 | % | ||||||||||||||||||
Super Now deposits | 231,816 | 1,758 | 0.76 | % | 225,885 | 1,033 | 0.46 | % | 200,436 | 528 | 0.26 | % | |||||||||||||||||||||
Money market deposits | 239,317 | 2,184 | 0.91 | % | 240,541 | 1,214 | 0.50 | % | 274,546 | 949 | 0.35 | % | |||||||||||||||||||||
Time deposits | 345,635 | 7,285 | 2.11 | % | 259,286 | 4,048 | 1.56 | % | 210,608 | 2,544 | 1.21 | % | |||||||||||||||||||||
Total interest-bearing deposits | 986,600 | 11,443 | 1.16 | % | 890,556 | 6,370 | 0.72 | % | 843,441 | 4,083 | 0.48 | % | |||||||||||||||||||||
Short-term borrowings | 34,897 | 793 | 2.27 | % | 85,086 | 1,757 | 2.06 | % | 25,984 | 234 | 0.89 | % | |||||||||||||||||||||
Long-term borrowings | 155,841 | 3,723 | 2.25 | % | 128,127 | 2,809 | 2.19 | % | 78,745 | 1,580 | 1.98 | % | |||||||||||||||||||||
Total borrowings | 190,738 | 4,516 | 2.25 | % | 213,213 | 4,566 | 2.14 | % | 104,729 | 1,814 | 1.71 | % | |||||||||||||||||||||
Total interest-bearing liabilities | 1,177,338 | 15,959 | 1.34 | % | 1,103,769 | 10,936 | 0.99 | % | 948,170 | 5,897 | 0.62 | % | |||||||||||||||||||||
Demand deposits | 321,443 | 303,606 | 302,651 | ||||||||||||||||||||||||||||||
Other liabilities | 22,379 | 18,742 | 14,398 | ||||||||||||||||||||||||||||||
Shareholders’ equity | 148,718 | 137,103 | 141,418 | ||||||||||||||||||||||||||||||
Total liabilities and shareholders’ equity | $ | 1,669,878 | $ | 1,563,220 | $ | 1,406,637 | |||||||||||||||||||||||||||
Interest rate spread | 2.99 | % | 3.07 | % | 3.30 | % | |||||||||||||||||||||||||||
Net interest income/margin | $ | 51,304 | 3.31 | % | $ | 48,510 | 3.31 | % | $ | 45,361 | 3.47 | % | |||||||||||||||||||||
1. | Information on this table has been calculated using average daily balance sheets to obtain average balances. |
2. | Non-accrual loans have been included with loans for the purpose of analyzing net interest earnings. |
3. | Income and rates on a fully taxable equivalent basis include an adjustment for the difference between annual income from tax-exempt obligations and the taxable equivalent of such income at the standard tax rate of 21% for 2019 and 2018 and 34% for 2017 |
4. | Fees on loans are included with interest on loans as follows: 2019 - $775,000; 2018 - $578,000; 2017 - $1,159,000. |
20
Reconciliation of Taxable Equivalent Net Interest Income
(In Thousands) | 2019 | 2018 | 2017 | |||||||||
Total interest income | $ | 66,774 | $ | 58,746 | $ | 49,977 | ||||||
Total interest expense | 15,959 | 10,936 | 5,897 | |||||||||
Net interest income | 50,815 | 47,810 | 44,080 | |||||||||
Tax equivalent adjustment | 489 | 700 | 1,281 | |||||||||
Net interest income (fully taxable equivalent) | $ | 51,304 | $ | 48,510 | $ | 45,361 | ||||||
Rate/Volume Analysis
The table below sets forth certain information regarding changes in our interest income and interest expense for the periods indicated. For interest-earning assets and interest-bearing liabilities, information is provided on changes attributable to (i) changes in volume (changes in average volume multiplied by old rate) and (ii) changes in rates (changes in rate multiplied by old average volume). Increases and decreases due to both interest rate and volume, which cannot be separated, have been allocated proportionally to the change due to volume and the change due to interest rate. Income and interest rates are on a taxable equivalent basis.
Year Ended December 31, | ||||||||||||||||||||||||
2019 vs. 2018 | 2018 vs. 2017 | |||||||||||||||||||||||
Increase (Decrease) Due To | Increase (Decrease) Due To | |||||||||||||||||||||||
(In Thousands) | Volume | Rate | Net | Volume | Rate | Net | ||||||||||||||||||
Interest income: | ||||||||||||||||||||||||
Loans, tax-exempt | $ | (213 | ) | $ | 9 | $ | (204 | ) | $ | 514 | $ | (196 | ) | $ | 318 | |||||||||
Loans | 2,553 | 3,992 | 6,545 | 6,214 | 1,452 | 7,666 | ||||||||||||||||||
Taxable investment securities | 1,278 | 200 | 1,478 | 593 | 546 | 1,139 | ||||||||||||||||||
Tax-exempt investment securities | (269 | ) | 15 | (254 | ) | (453 | ) | (303 | ) | (756 | ) | |||||||||||||
Interest-bearing deposits | 175 | 77 | 252 | (103 | ) | (76 | ) | (179 | ) | |||||||||||||||
Total interest-earning assets | 3,524 | 4,293 | 7,817 | 6,765 | 1,423 | 8,188 | ||||||||||||||||||
Interest expense: | ||||||||||||||||||||||||
Savings deposits | 2 | 139 | 141 | 2 | 11 | 13 | ||||||||||||||||||
Super Now deposits | 27 | 698 | 725 | 74 | 431 | 505 | ||||||||||||||||||
Money market deposits | — | 970 | 970 | (36 | ) | 301 | 265 | |||||||||||||||||
Time deposits | 1,575 | 1,662 | 3,237 | 664 | 840 | 1,504 | ||||||||||||||||||
Short-term borrowings | (973 | ) | 9 | (964 | ) | 965 | 558 | 1,523 | ||||||||||||||||
Long-term borrowings | 812 | 102 | 914 | 1,051 | 178 | 1,229 | ||||||||||||||||||
Total interest-bearing liabilities | 1,443 | 3,580 | 5,023 | 2,720 | 2,319 | 5,039 | ||||||||||||||||||
Change in net interest income | $ | 2,081 | $ | 713 | $ | 2,794 | $ | 4,045 | $ | (896 | ) | $ | 3,149 | |||||||||||
PROVISION FOR LOAN LOSSES
2019 vs. 2018
The provision for loan losses is based upon management’s quarterly review of the loan portfolio. The purpose of the review is to assess loan quality, identify impaired loans, analyze delinquencies, ascertain loan growth, evaluate potential charge-offs and recoveries, and assess general economic conditions in the markets served. An external independent loan review is also performed semi-annually for the Corporation. Management remains committed to an aggressive program of problem loan identification and resolution.
The allowance is calculated by applying loss factors to outstanding loans by type, excluding loans for which a specific allowance has been determined. Loss factors are based on management’s consideration of the nature of the portfolio segments, changes in
21
mix and volume of the loan portfolio, and historical loan loss experience. In addition, management considers industry standards and trends with respect to nonperforming loans and its knowledge and experience with specific lending segments.
Although management believes that it uses the best information available to make such determinations and that the allowance for loan losses is adequate at December 31, 2019, future adjustments could be necessary if circumstances or economic conditions differ substantially from the assumptions used in making the initial determinations. A downturn in the local economy or employment and delays in receiving financial information from borrowers could result in increased levels of nonperforming assets and charge-offs, increased loan loss provisions and reductions in interest income. Additionally, as an integral part of the examination process, bank regulatory agencies periodically review the Banks' loan loss allowance. The banking regulators could require additions to the loan loss allowance based on their judgment of information available to them at the time of their examination.
While determining the appropriate allowance level, management has attributed the allowance for loan losses to various portfolio segments; however, the allowance is available for the entire portfolio as needed.
The allowance for loan losses declined from $13,837,000 at December 31, 2018 to $11,894,000 at December 31, 2019. At December 31, 2019, the allowance for loan losses was 0.88% of total loans compared to 1.00% of total loans at December 31, 2018. This decline is due to a partial charge off of a commercial relationship of $3,700,000 that was incurred during 2019.
The provision for loan losses totaled $2,735,000 for the year ended December 31, 2019 compared to $1,735,000 for the year ended December 31, 2018. The increase in the provision was appropriate when considering the gross loan growth and level of net charge-offs during 2019. Net charge-offs of $4,678,000 represented 0.34% of average loans for the year ended December 31, 2019 compared to net charge-offs of $756,000 or 0.06% of average loans for the year ended December 31, 2018. The growth in the loan portfolio was driven by the indirect auto loan portfolio that has experienced minimal charge-offs. In addition, growth occurred in the home equity segment of the loan portfolio which historically is a lower risk product than commercial loans and requires a lower allowance for loan losses. Nonperforming loans decreased $4,151,000 as a large nonperforming loan was partially charge-off during the fourth quarter of 2019. The majority of the nonperforming loans are centered on several loans that are either in a secured position and have sureties with a strong underlying financial position and/or a specific allowance within the allowance for loan losses. Internal loan review and analysis, level of net charge-offs, and decreased level of nonperforming loans noted previously, dictated a increase in the provision for loan losses. Utilizing both internal and external resources, as noted, senior management has concluded that the allowance for loan losses remains at a level adequate to provide for probable losses inherent in the loan portfolio.
2018 vs. 2017
The allowance for loan losses decreased from $12,858,000 at December 31, 2017 to $13,837,000 at December 31, 2018. At December 31, 2018, the allowance for loan losses was 1.00% of total loans compared to 1.03% of total loans at December 31, 2017.
The provision for loan losses totaled $1,735,000 for the year ended December 31, 2018 compared to $730,000 for the year ended December 31, 2017. The increase in the provision was appropriate when considering the gross loan growth and low level of net charge-offs during 2018. Net charge-offs of $756,000 represented 0.06% of average loans for the year ended December 31, 2018 compared to net charge-offs of $768,000 or 0.07% of average loans for the year ended December 31, 2017. The growth in the loan portfolio was driven by the indirect auto loan portfolio that has experienced minimal charge-offs. In addition, growth occurred in the home equity segment of the loan portfolio which historically is a lower risk product than commercial loans and requires a lower allowance for loan losses. Nonperforming loans increased $9,304,000 as a large nonperforming loan was added during the fourth quarter of 2018. The majority of the nonperforming loans are centered on several loans that are either in a secured position and have sureties with a strong underlying financial position and/or a specific allowance within the allowance for loan losses. Internal loan review and analysis, coupled with the ratios and decreased level of nonperforming loans noted previously, dictated a decrease in the provision for loan losses. Utilizing both internal and external resources, as noted, senior management has concluded that the allowance for loan losses remains at a level adequate to provide for probable losses inherent in the loan portfolio.
NON-INTEREST INCOME
2019 vs. 2018
Total non-interest income increased $991,000 from the year ended December 31, 2018 to December 31, 2019. Excluding net security gains, non-interest income increased $29,000 year over year. Bank owned life insurance income decreased due to a decrease in the earnings rate. Insurance commissions along with brokerage commissions increased due to a shift in product mix.
22
Gain on sale of loans increased due to increased volume. Debit card income decreased to $1,378,000 for 2019, a decrease of $156,000 or 10.17%, from 2018, primarily due to a decline in debit card usage.
2019 | 2018 | Change | |||||||||||||||||||
(In Thousands) | Amount | % Total | Amount | % Total | Amount | % | |||||||||||||||
Service charges | $ | 2,411 | 23.07 | % | $ | 2,460 | 26.00 | % | $ | (49 | ) | (1.99 | )% | ||||||||
Net securities (losses) gains, available for sale | 640 | 6.12 | (47 | ) | (0.50 | ) | 687 | (1,461.70 | ) | ||||||||||||
Net equity securities gains (losses) | 89 | 0.85 | (170 | ) | (1.80 | ) | 259 | n/a | |||||||||||||
Net securities gains, trading | 19 | 0.18 | 3 | 0.03 | 16 | (533.33 | ) | ||||||||||||||
Bank owned life insurance | 574 | 5.49 | 662 | 7.00 | (88 | ) | (13.29 | ) | |||||||||||||
Gain on sale of loans | 1,754 | 16.78 | 1,518 | 16.04 | 236 | 15.55 | |||||||||||||||
Insurance commissions | 433 | 4.14 | 365 | 3.86 | 68 | 18.63 | |||||||||||||||
Brokerage commissions | 1,358 | 12.99 | 1,336 | 14.12 | 22 | 1.65 | |||||||||||||||
Debit card income | 1,378 | 13.18 | 1,534 | 16.21 | (156 | ) | (10.17 | ) | |||||||||||||
Other | 1,796 | 17.20 | 1,800 | 19.04 | (4 | ) | (0.22 | ) | |||||||||||||
Total non-interest income | $ | 10,452 | 100.00 | % | $ | 9,461 | 100.00 | % | $ | 991 | 10.47 | % | |||||||||
2018 vs. 2017
Total non-interest income decreased $1,283,000 from the year ended December 31, 2017 to December 31, 2018. Excluding net security gains, non-interest income decreased $477,000 year over year. Service charges increased due to increased level of overdraft income. Bank owned life insurance income decreased due to a decrease in the earnings rate. Insurance commissions along with brokerage commissions decreased due to a shift in product mix. Gain on sale of loans decreased due to reduced volume. Debit card income decreased to $1,534,000 for 2018 a decrease of $426,000 or 21.73% from 2017.
2018 | 2017 | Change | |||||||||||||||||||
(In Thousands) | Amount | % Total | Amount | % Total | Amount | % | |||||||||||||||
Service charges | $ | 2,460 | 26.00 | % | $ | 2,222 | 20.68 | % | $ | 238 | 10.71 | % | |||||||||
Net securities (losses) gains, available for sale | (47 | ) | (0.50 | ) | 600 | 5.58 | (647 | ) | (107.83 | ) | |||||||||||
Net equity securities losses | (170 | ) | (1.80 | ) | — | n/a | (170 | ) | n/a | ||||||||||||
Net securities gains (losses), trading | 3 | 0.03 | (8 | ) | (0.07 | ) | 11 | 137.50 | |||||||||||||
Bank owned life insurance | 662 | 7.00 | 666 | 6.20 | (4 | ) | (0.60 | ) | |||||||||||||
Gain on sale of loans | 1,518 | 16.04 | 1,674 | 15.58 | (156 | ) | (9.32 | ) | |||||||||||||
Insurance commissions | 365 | 3.86 | 496 | 4.62 | (131 | ) | (26.41 | ) | |||||||||||||
Brokerage commissions | 1,336 | 14.12 | 1,378 | 12.83 | (42 | ) | (3.05 | ) | |||||||||||||
Debit card income | 1,534 | 16.21 | 1,960 | 18.24 | (426 | ) | (21.73 | ) | |||||||||||||
Other | 1,800 | 19.04 | 1,756 | 16.34 | 44 | 2.51 | |||||||||||||||
Total non-interest income | $ | 9,461 | 100.00 | % | $ | 10,744 | 100.00 | % | $ | (1,283 | ) | (11.94 | )% | ||||||||
NON-INTEREST EXPENSE
2019 vs. 2018
Total non-interest expenses increased $1,701,000 from the year ended December 31, 2018 to December 31, 2019. The increase in salaries and employee benefits was attributable to increased primarily due to normal annual wage increases. Furniture and equipment expense and software amortization increased due to the new branch locations opened in 2018 and continued enhancement of systems. Market expenses decreased as targeted marketing has decreased in the localities where branches opened during 2018.
The increase in professional fees of $368,000 is primarily due to increases in legal fees. The decrease in deposit insurance reflects the FDIC assessment credit that was recorded during 2019. Other expenses increased from the year ended December 31, 2018 to December 31, 2019 by $912,000 the main driver of this increase was an increase in data processing expenses.
23
2019 | 2018 | Change | |||||||||||||||||||
(In Thousands) | Amount | % Total | Amount | % Total | Amount | % | |||||||||||||||
Salaries and employee benefits | $ | 21,829 | 54.97 | % | $ | 21,083 | 55.47 | % | $ | 746 | 3.54 | % | |||||||||
Occupancy | 2,712 | 6.83 | 2,702 | 7.11 | 10 | 0.37 | |||||||||||||||
Furniture and equipment | 3,248 | 8.18 | 3,092 | 8.14 | 156 | 5.05 | |||||||||||||||
Software amortization | 871 | 2.19 | 712 | 1.87 | 159 | 22.33 | |||||||||||||||
Pennsylvania shares tax | 1,148 | 2.89 | 1,108 | 2.92 | 40 | 3.61 | |||||||||||||||
Professional fees | 2,474 | 6.23 | 2,106 | 5.54 | 368 | 17.47 | |||||||||||||||
Federal Deposit Insurance Corporation deposit insurance | 578 | 1.46 | 890 | 2.34 | (312 | ) | (35.06 | ) | |||||||||||||
Write down of assets held for sale | 475 | 1.20 | — | — | 475 | n/a | |||||||||||||||
Loss on sale of premises and equipment | 474 | 1.19 | — | — | 474 | n/a | |||||||||||||||
Marketing | 425 | 1.07 | 767 | 2.02 | (342 | ) | (44.59 | ) | |||||||||||||
Intangible amortization | 264 | 0.66 | 300 | 0.79 | (36 | ) | (12.00 | ) | |||||||||||||
Other | 5,210 | 13.13 | 5,247 | 13.80 | (37 | ) | (0.71 | ) | |||||||||||||
Total non-interest expense | $ | 39,708 | 100.00 | % | $ | 38,007 | 100.00 | % | $ | 1,701 | 4.48 | % | |||||||||
2018 vs. 2017
Total non-interest expenses increased $1,145,000 from the year ended December 31, 2017 to December 31, 2018. The increase in salaries and employee benefits was attributable to increased health insurance expense, annual wage increases, and an increase in number of employees. Occupancy expense increased primarily due to the opening of a new branch location. Furniture and equipment expenses increased due to the new branch location and continued enhancement of systems.
2018 | 2017 | Change | |||||||||||||||||||
(In Thousands) | Amount | % Total | Amount | % Total | Amount | % | |||||||||||||||
Salaries and employee benefits | $ | 21,083 | 55.47 | % | $ | 18,999 | 51.54 | % | $ | 2,084 | 10.97 | % | |||||||||
Occupancy | 2,702 | 7.11 | 2,447 | 6.64 | 255 | 10.42 | |||||||||||||||
Furniture and equipment | 3,092 | 8.14 | 2,915 | 7.91 | 177 | 6.07 | |||||||||||||||
Software amortization | 712 | 1.87 | 974 | 2.64 | (262 | ) | (26.90 | ) | |||||||||||||
Pennsylvania shares tax | 1,108 | 2.92 | 925 | 2.51 | 183 | 19.78 | |||||||||||||||
Professional fees | 2,106 | 5.54 | 2,353 | 6.38 | (247 | ) | (10.50 | ) | |||||||||||||
Federal Deposit Insurance Corporation deposit insurance | 890 | 2.34 | 669 | 1.81 | 221 | 33.03 | |||||||||||||||
Marketing | 767 | 2.02 | 958 | 2.60 | (191 | ) | (19.94 | ) | |||||||||||||
Intangible amortization | 300 | 0.79 | 337 | 0.91 | (37 | ) | (10.98 | ) | |||||||||||||
Other | 5,247 | 13.80 | 6,285 | 17.06 | (1,038 | ) | (16.52 | ) | |||||||||||||
Total non-interest expense | $ | 38,007 | 100.00 | % | $ | 36,862 | 100.00 | % | $ | 1,145 | 3.11 | % | |||||||||
INCOME TAXES
2019 vs. 2018
The provision for income taxes for the year ended December 31, 2019 resulted in an effective income tax rate of 16.67% compared to 16.08% for 2018.
2018 vs. 2017
The provision for income taxes for the year ended December 31, 2018 resulted in an effective income tax rate of 16.08% compared to 43.29% for 2017. This decrease is primarily the result of the change in corporate tax rate.
24
FINANCIAL CONDITION
INVESTMENTS
2019
The fair value of the investment portfolio increased $13,834,000 from December 31, 2018 to December 31, 2019. The increase in value is the result of growth in the corporate segment of the portfolio as the investment portfolio continues to be actively managed in order to reduce interest rate and market risk. This strategy is being deployed through selective purchasing of bonds that mature within ten years. The unrealized losses within the debt securities portfolio are the result of market activity, not credit issues/ratings, as approximately 79% of the debt securities portfolio on an amortized cost basis is currently rated A or higher by either S&P or Moody’s.
2018
The fair value of the investment portfolio increased $24,764,000 from December 31, 2017 to December 31, 2018. The increase in value is the result of growth in the municipal segment of the portfolio as the investment portfolio continues to be actively managed in order to reduce interest rate and market risk. This strategy is being deployed through selective purchasing of bonds that mature within ten years. The unrealized losses within the debt securities portfolio are the result of market activity, not credit issues/ratings, as approximately 82% of the debt securities portfolio on an amortized cost basis is currently rated A or higher by either S&P or Moody’s.
The carrying amounts of investment securities are summarized as follows for the years ended December 31, 2019, 2018, and 2017:
2019 | 2018 | 2017 | |||||||||||||||||||
(In Thousands) | Balance | % Portfolio | Balance | % Portfolio | Balance | % Portfolio | |||||||||||||||
Available for sale (AFS): | |||||||||||||||||||||
Mortgage-backed securities | $ | 4,966 | 3.31 | % | $ | 6,153 | 4.52 | % | $ | 4,213 | 3.78 | % | |||||||||
State and political securities (tax-exempt) | 22,575 | 15.06 | % | 27,363 | 20.11 | % | 45,149 | 40.56 | % | ||||||||||||
State and political securities (taxable) | 59,711 | 39.83 | % | 52,178 | 38.34 | % | 11,359 | 10.20 | % | ||||||||||||
Other bonds, notes and debentures | 61,367 | 40.93 | % | 48,591 | 35.70 | % | 47,906 | 43.03 | % | ||||||||||||
Total debt securities | 148,619 | 99.12 | % | 134,285 | 98.67 | % | 108,627 | 97.57 | % | ||||||||||||
Equity securities: | |||||||||||||||||||||
Other investment equity securities | 1,261 | 0.84 | % | 1,776 | 1.30 | % | 2,516 | 2.26 | % | ||||||||||||
Trading securities | 51 | 0.03 | % | 36 | 0.03 | % | 190 | 0.17 | % | ||||||||||||
Total equity securities | 1,312 | 0.88 | % | 1,812 | 1.33 | % | 2,706 | 2.43 | % | ||||||||||||
Total | $ | 149,931 | 100.00 | % | $ | 136,097 | 100.00 | % | $ | 111,333 | 100.00 | % | |||||||||
25
The following table shows the maturities and repricing of investment securities, at amortized cost and the weighted average yields (for tax-exempt obligations on a fully taxable basis assuming a 21% tax rate) at December 31, 2019:
(In Thousands) | Three Months or Less | Over Three Months Through One Year | Over One Year Through Five Years | Over Five Years Through Ten Years | Over Ten Years | Amortized Cost Total | ||||||||||||||||||
Mortgage-backed securities: | ||||||||||||||||||||||||
AFS Amount | $ | — | $ | — | $ | — | $ | — | $ | 4,956 | $ | 4,956 | ||||||||||||
Yield | — | % | — | % | — | % | — | % | 2.91 | % | 2.91 | % | ||||||||||||
State and political securities (tax-exempt): | ||||||||||||||||||||||||
AFS Amount | — | — | 7,951 | 9,570 | 4,557 | 22,078 | ||||||||||||||||||
Yield | — | % | — | % | 2.34 | % | 2.66 | % | 2.89 | % | 2.59 | % | ||||||||||||
State and political securities (taxable): | ||||||||||||||||||||||||
AFS Amount | — | — | 9,853 | 39,715 | 7,418 | 56,986 | ||||||||||||||||||
Yield | — | % | — | % | 3.17 | % | 3.67 | % | 3.07 | % | 3.51 | % | ||||||||||||
Other bonds, notes, and debentures: | ||||||||||||||||||||||||
AFS Amount | 1,105 | 2,827 | 41,557 | 12,003 | 4,000 | 61,492 | ||||||||||||||||||
Yield | 3.52 | % | 2.75 | % | 2.98 | % | 3.77 | % | 3.00 | % | 3.09 | % | ||||||||||||
Total Amount | $ | 1,105 | $ | 2,827 | $ | 59,361 | $ | 61,288 | $ | 20,931 | 145,512 | |||||||||||||
Total Yield | 3.52 | % | 2.74 | % | 2.93 | % | 3.53 | % | 2.98 | % | 3.18 | % | ||||||||||||
Equity Securities | ||||||||||||||||||||||||
Investment Equity Amount | 1,300 | |||||||||||||||||||||||
Trading Amount | 50 | |||||||||||||||||||||||
Total Investment Portfolio Value | $ | 146,862 | ||||||||||||||||||||||
Total Investment Portfolio Yield | 3.15 | % | ||||||||||||||||||||||
All yields represent weighted average yields expressed on a tax equivalent basis. They are calculated on the basis of the cost, adjusted for amortization of premium and accretion of discount, and effective yields weighted for the scheduled maturity of each security. The taxable equivalent adjustment represents the difference between annual income from tax-exempt obligations and the taxable equivalent of such income at the standard 21% tax rate (derived by dividing tax-exempt interest by 79%).
The distribution of credit ratings by amortized cost and estimated fair value for the debt security portfolio at December 31, 2019 follows:
A- to AAA | B- to BBB+ | C to CCC+ | Not Rated | Total | ||||||||||||||||||||||||||||||||||||
(In Thousands) | Amortized Cost | Fair Value | Amortized Cost | Fair Value | Amortized Cost | Fair Value | Amortized Cost | Fair Value | Amortized Cost | Fair Value | ||||||||||||||||||||||||||||||
Available for sale | ||||||||||||||||||||||||||||||||||||||||
Mortgage-backed securities | $ | 4,956 | $ | 4,966 | $ | — | $ | — | $ | — | $ | — | $ | — | $ | — | $ | 4,956 | $ | 4,966 | ||||||||||||||||||||
State and political securities | 77,337 | 80,241 | 1,657 | 1,975 | — | — | 70 | 70 | 79,064 | 82,286 | ||||||||||||||||||||||||||||||
Other debt securities | 32,681 | 32,308 | 19,515 | 19,738 | — | — | 9,296 | 9,321 | 61,492 | 61,367 | ||||||||||||||||||||||||||||||
Total debt securities | $ | 114,974 | $ | 117,515 | $ | 21,172 | $ | 21,713 | $ | — | $ | — | $ | 9,366 | $ | 9,391 | $ | 145,512 | $ | 148,619 | ||||||||||||||||||||
LOAN PORTFOLIO
2019
Gross loans of $1,355,544,000 at December 31, 2019 represented a decrease of $29,213,000 from December 31, 2018. The Commercial, Financial, and Agricultural loan portfolio had the largest decrease from the previous year as emphasis was shifted to other segments of the loan portfolio. Indirect auto lending continued to grow within the portfolio as the product continued to expand in northeast Pennsylvania. Indirect auto lending and home equity lines are part of the overall strategy to shorten the duration of the earning asset portfolio in preparation for a rising interest rate environment. Commercial real estate mortgages decreased $8,434,000 but remained at approximately 27% of the total loan portfolio.
26
2018
Gross loans of $1,384,757,000 at December 31, 2018 represented an increase of $138,143,000 from December 31, 2017. Indirect auto lending remained the primary driver of the growth in the loan portfolio. With a continued emphasis on home equity lines of credit, real estate mortgages also contributed to loan growth. Indirect auto lending and home equity lines are part of the overall strategy to shorten the duration of the earning asset portfolio in preparation for a rising interest rate environment. Commercial real estate mortgages increased $39,676,000 but remained at approximately 27% of the total loan portfolio.
The amounts of loans outstanding at the indicated dates are shown in the following table according to type of loan at December 31, 2019, 2018, 2017, 2016, and 2015:
2019 | 2018 | 2017 | 2016 | 2015 | |||||||||||||||||||||||||||||||
(In Thousands) | Amount | % Total | Amount | % Total | Amount | % Total | Amount | % Total | Amount | % Total | |||||||||||||||||||||||||
Commercial, financial, and agricultural | $ | 156,213 | 11.52 | % | $ | 188,561 | 13.62 | % | $ | 178,885 | 14.35 | % | $ | 146,110 | 13.36 | % | $ | 164,072 | 15.70 | % | |||||||||||||||
Real estate mortgage: | |||||||||||||||||||||||||||||||||||
Residential | 623,256 | 45.98 | 622,379 | 44.94 | 597,077 | 47.90 | 564,740 | 51.63 | 526,183 | 50.34 | |||||||||||||||||||||||||
Commercial | 363,261 | 26.80 | 371,695 | 26.84 | 332,019 | 26.63 | 306,182 | 28.00 | 302,539 | 28.95 | |||||||||||||||||||||||||
Construction | 38,067 | 2.81 | 43,523 | 3.14 | 31,683 | 2.54 | 34,650 | 3.17 | 26,824 | 2.57 | |||||||||||||||||||||||||
Consumer Automobile | 150,517 | 11.10 | 133,183 | 9.63 | 79,714 | 6.40 | 14,826 | 1.36 | — | — | |||||||||||||||||||||||||
Other consumer installment loans | 23,043 | 1.70 | 24,552 | 1.77 | 26,964 | 2.16 | 28,430 | 2.60 | 27,001 | 2.58 | |||||||||||||||||||||||||
Net deferred loan fees and discounts | 1,187 | 0.09 | 864 | 0.06 | 272 | 0.02 | (1,257 | ) | (0.12 | ) | (1,412 | ) | (0.14 | ) | |||||||||||||||||||||
Gross loans | $ | 1,355,544 | 100.00 | % | $ | 1,384,757 | 100.00 | % | $ | 1,246,614 | 100.00 | % | $ | 1,093,681 | 100.00 | % | $ | 1,045,207 | 100.00 | % | |||||||||||||||
The amounts of domestic loans at December 31, 2019 are presented below by category and maturity:
Commercial, financial, and agricultural | Real Estate | Consumer automobile | Other consumer installment | |||||||||||||||||||||||||
(In Thousands) | Residential | Commercial | Construction | Total | ||||||||||||||||||||||||
Loans with variable interest rates: | ||||||||||||||||||||||||||||
1 year or less | $ | 4,351 | $ | 3,762 | $ | 2,083 | $ | 562 | $ | — | $ | 828 | $ | 11,586 | ||||||||||||||
1 through 5 years | 2,506 | 4,990 | 8,501 | 432 | — | — | 16,429 | |||||||||||||||||||||
5 through 10 years | 64,325 | 23,526 | 43,958 | 2,013 | — | — | 133,822 | |||||||||||||||||||||
After 10 years | 41,785 | 570,962 | 281,728 | 28,324 | — | 2,958 | 925,757 | |||||||||||||||||||||
Total floating interest rate loans | 112,967 | 603,240 | 336,270 | 31,331 | — | 3,786 | 1,087,594 | |||||||||||||||||||||
Loans with fixed interest rates: | ||||||||||||||||||||||||||||
1 year or less | 1,352 | 721 | 1,261 | 1,276 | 243 | 1,164 | 6,017 | |||||||||||||||||||||
1 through 5 years | 28,736 | 4,055 | 8,000 | 958 | 75,011 | 13,827 | 130,587 | |||||||||||||||||||||
5 through 10 years | 11,659 | 10,613 | 14,656 | 447 | 75,263 | 2,767 | 115,405 | |||||||||||||||||||||
After 10 years | 1,499 | 4,627 | 3,074 | 4,055 | — | 1,499 | 14,754 | |||||||||||||||||||||
Total fixed interest rate loans | 43,246 | 20,016 | 26,991 | 6,736 | 150,517 | 19,257 | 266,763 | |||||||||||||||||||||
Total | $ | 156,213 | $ | 623,256 | $ | 363,261 | $ | 38,067 | $ | 150,517 | $ | 23,043 | 1,354,357 | |||||||||||||||
Net deferred loan fees and discounts | 1,187 | |||||||||||||||||||||||||||
$ | 1,355,544 | |||||||||||||||||||||||||||
· The loan maturity information is based upon original loan terms and is not adjusted for “rollovers.” In the ordinary course of business, loans maturing within one year may be renewed, in whole or in part, at interest rates prevailing at the date of renewal.
· Scheduled repayments are reported in maturity categories in which the payment is due.
27
The Banks do not make loans that provide for negative amortization, nor do any loans contain conversion features. The Banks did not have any foreign loans outstanding at December 31, 2019.
The following table shows the amount of accrual and nonaccrual TDRs at December 31, 2019, 2018, and 2017:
2019 | 2018 | 2017 | ||||||||||||||||||||||||||||||||||
(In Thousands) | Accrual | Nonaccrual | Total | Accrual | Nonaccrual | Total | Accrual | Nonaccrual | Total | |||||||||||||||||||||||||||
Commercial, financial, and agricultural | $ | — | $ | 2,190 | $ | 2,190 | $ | — | $ | 1,127 | $ | 1,127 | $ | 5 | $ | 114 | $ | 119 | ||||||||||||||||||
Real estate mortgage: | ||||||||||||||||||||||||||||||||||||
Residential | 4,089 | 144 | 4,233 | 2,225 | 159 | 2,384 | 2,151 | 273 | 2,424 | |||||||||||||||||||||||||||
Commercial | 2,127 | 4,732 | 6,859 | 3,959 | 2,129 | 6,088 | 4,429 | 2,076 | 6,505 | |||||||||||||||||||||||||||
Construction | — | — | — | — | — | — | — | — | — | |||||||||||||||||||||||||||
Other consumer installment loans | — | — | — | — | — | — | — | — | — | |||||||||||||||||||||||||||
$ | 6,216 | $ | 7,066 | $ | 13,282 | $ | 6,184 | $ | 3,415 | $ | 9,599 | $ | 6,585 | $ | 2,463 | $ | 9,048 | |||||||||||||||||||
ALLOWANCE FOR LOAN LOSSES
2019
The allowance for loan losses represents the amount which management estimates is adequate to provide for probable losses inherent in its loan portfolio as of the consolidated balance sheet date. All loan losses are charged to the allowance and all recoveries are credited to it per the allowance method of providing for loan losses. The allowance for loan losses is established through a provision for loan losses charged to operations. The provision for loan losses is based upon management’s quarterly review of the loan portfolio. The purpose of the review is to assess loan quality, identify impaired loans, analyze delinquencies, ascertain loan growth, evaluate potential charge-offs and recoveries, and assess general economic conditions in the markets served. An external independent loan review is also performed semi-annually for the Banks. Management remains committed to an aggressive program of problem loan identification and resolution.
The allowance is calculated by applying loss factors to outstanding loans by type, excluding loans for which a specific allowance has been determined. Loss factors are based on management’s consideration of the nature of the portfolio segments, changes in mix and volume of the loan portfolio, and historical loan loss experience. In addition, management considers industry standards and trends with respect to nonperforming loans and its knowledge and experience with specific lending segments.
The allowance for loan losses decreased from $13,837,000 at December 31, 2018 to $11,894,000 at December 31, 2019. At December 31, 2019 and 2018, the allowance for loan losses to total loans was 0.88% and 1.00%, respectively. The growth in the loan portfolio of home equity product historically is a lower risk product than commercial loans and requires a lower allowance for loan losses. In addition, the growth in the indirect auto portfolio has incurred minimal losses. Net loan charge-offs of $4,678,000 or 0.34% of average loans for the year ended December 31, 2019 negated the impact of the provision for loan losses of $2,735,000. The increase in net loan charge-offs is a result of one large charge-off in the commercial, financial, and agricultural portfolio during the fourth quarter of 2019. Management concluded that the allowance for loan losses is adequate to provide for probable losses inherent in its loan portfolio as of the balance sheet date as noted in the provision for loan losses discussion.
Based on management’s loan-by-loan review, the past performance of the borrowers, and current economic conditions, including recent business closures and bankruptcy levels, management does not anticipate any current losses related to nonaccrual, nonperforming, or classified loans above those that have already been considered in its overall judgment of the adequacy of the allowance for loan losses.
2018
The allowance for loan losses increased from $12,858,000 at December 31, 2017 to $13,837,000 at December 31, 2018. At December 31, 2018, the allowance for loan losses was 1.00% of total loans compared to 1.03% of total loans at December 31, 2017. The growth in the loan portfolio of home equity product historically is a lower risk product than commercial loans and requires a lower allowance for loan losses. In addition, the growth in the indirect auto portfolio has incurred minimal losses. Net loan charge-offs of $756,000 or 0.06% of average loans for the year ended December 31, 2018 partially limited the impact of the provision for loan losses of $1,735,000.
28
Allocation of the Allowance For Loan Losses | |||||||||||||||||||||||||||||||||||
December 31, 2019 | December 31, 2018 | December 31, 2017 | December 31, 2016 | December 31, 2015 | |||||||||||||||||||||||||||||||
(In Thousands) | Amount | % Total | Amount | % Total | Amount | % Total | Amount | % Total | Amount | % Total | |||||||||||||||||||||||||
Balance at end of period applicable to: | |||||||||||||||||||||||||||||||||||
Commercial, financial, and agricultural | $ | 1,779 | 11.53 | % | $ | 1,680 | 13.63 | % | $ | 1,177 | 14.35 | % | $ | 1,554 | 13.34 | % | $ | 1,532 | 15.68 | % | |||||||||||||||
Real estate mortgage: | |||||||||||||||||||||||||||||||||||
Residential | 4,306 | 46.02 | 5,616 | 44.97 | 5,679 | 47.91 | 5,383 | 51.58 | 5,116 | 50.27 | |||||||||||||||||||||||||
Commercial | 3,210 | 26.82 | 4,047 | 26.86 | 4,277 | 26.64 | 4,975 | 27.96 | 4,217 | 28.91 | |||||||||||||||||||||||||
Construction | 118 | 2.81 | 143 | 3.14 | 155 | 2.54 | 178 | 3.17 | 160 | 2.56 | |||||||||||||||||||||||||
Consumer automobiles | 1,780 | 11.11 | 1,328 | 9.62 | 804 | 6.40 | 143 | 1.35 | — | — | |||||||||||||||||||||||||
Other consumer installment loans | 278 | 1.71 | 259 | 1.78 | 271 | 2.16 | 273 | 2.60 | 243 | 2.58 | |||||||||||||||||||||||||
Unallocated | 423 | — | 764 | — | 495 | — | 390 | — | 776 | — | |||||||||||||||||||||||||
$ | 11,894 | 100.00 | % | $ | 13,837 | 100.00 | % | $ | 12,858 | 100.00 | % | $ | 12,896 | 100.00 | % | $ | 12,044 | 100.00 | % | ||||||||||||||||
NONPERFORMING LOANS
The decrease in nonperforming loans during 2019 is primarily due to a non-accrual commercial loan that was partially charged-off in the fourth quarter of 2019. The majority of the nonperforming loans are centered on several loans that are either in a secured position and have sureties with a strong underlying financial position and/or a specific allowance within the allowance for loan losses.
The following table presents information concerning nonperforming loans. The accrual of interest will be discontinued when the principal or interest of a loan is in default for 90 days or more, or as soon as payment is questionable, unless the loan is well secured and in the process of collection. Consumer loans and residential real estate loans secured by 1 to 4 family dwellings are not ordinarily subject to those guidelines. The reversal of previously accrued but uncollected interest applicable to any loan placed in a nonaccrual status and the treatment of subsequent payments of either principal or interest is handled in accordance with GAAP. These principles do not require a write-off of previously accrued interest if principal and interest are ultimately protected by sound collateral values. A nonperforming loan may be restored to accruing status when:
1. Principal and interest is no longer due and unpaid;
2. It becomes well secured and in the process of collection; and
3. Prospects for future contractual payments are no longer in doubt.
Total Nonperforming Loans | ||||||||||||
(In Thousands) | 90 Days Past Due | Nonaccrual | Total | |||||||||
2019 | $ | 2,047 | $ | 10,374 | $ | 12,421 | ||||||
2018 | 1,274 | 15,298 | 16,572 | |||||||||
2017 | 509 | 6,759 | 7,268 | |||||||||
2016 | 870 | 10,756 | 11,626 | |||||||||
2015 | 979 | 8,467 | 9,446 | |||||||||
The level of non-accruing loans continues to fluctuate annually and is attributed to the various economic factors experienced both regionally and nationally. Overall, the portfolio is well secured with a majority of the balance making regular payments or scheduled to be satisfied in the near future. Presently, there are no significant loans where serious doubts exist as to the ability of the borrower to comply with the current loan payment terms which are not included in the nonperforming categories as indicated above.
29
Management’s judgment in determining the amount of the additions to the allowance charged to operating expense considers the following factors with no single factor being determinative:
1. Economic conditions and the impact on the loan portfolio;
2. Analysis of past loan charge-offs experienced by category and comparison to outstanding loans;
3. Effect of problem loans on overall portfolio quality; and
4. Reports of examination of the loan portfolio by the Department and the FDIC.
DEPOSITS
2019 vs. 2018
Total average deposits increased $113,881,000 or 9.54% from 2018 to 2019. The time deposit portfolio average balance for 2019 increased $86,349,000 to $345,635,000 as time deposits were utilized as an attraction tool and to lengthen the average maturity of the interest bearing liability portfolio.
2018 vs. 2017
Total average deposits increased $48,070,000 or 4.19% from 2017 to 2018. While deposit gathering efforts have centered on core deposits, the lengthening of the average maturity of the time deposit portfolio continues to move forward as part of the strategy to build balance sheet protection in a rising interest rate environment. Time deposit average balance for 2018 increased $48,678,000 to $259,286,000.
The average amount and the average rate paid on deposits are summarized below for the years ended December 31, 2019, 2018, and 2017:
2019 | 2018 | 2017 | |||||||||||||||||||
(In Thousands) | Average Amount | Rate | Average Amount | Rate | Average Amount | Rate | |||||||||||||||
Noninterest-bearing | $ | 321,443 | 0.00 | % | $ | 303,606 | 0.00 | % | $ | 302,651 | 0.00 | % | |||||||||
Savings | 169,832 | 0.13 | 164,844 | 0.05 | 157,851 | 0.04 | |||||||||||||||
Super Now | 231,816 | 0.76 | 225,885 | 0.46 | 200,436 | 0.26 | |||||||||||||||
Money Market | 239,317 | 0.91 | 240,541 | 0.50 | 274,546 | 0.35 | |||||||||||||||
Time | 345,635 | 2.11 | 259,286 | 1.56 | 210,608 | 1.21 | |||||||||||||||
Total average deposits | $ | 1,308,043 | 0.88 | % | $ | 1,194,162 | 0.53 | % | $ | 1,146,092 | 0.36 | % | |||||||||
SHAREHOLDERS’ EQUITY
2019
Shareholders’ equity increased $11,400,000 to $155.0 million at December 31, 2019 compared to December 31, 2018. The change in accumulated other comprehensive loss from $6.6 million at December 31, 2018 to $2.8 million at December 31, 2019 is a result of an increase in unrealized gains on available for sale securities (from an unrealized loss of $1.4 million at December 31, 2018 to an unrealized gain of $2.5 million at December 31, 2019). The amount of accumulated other comprehensive loss at December 31, 2019 was also impacted by the change in net excess of the projected benefit obligation over the fair value of the plan assets of the defined benefit pension plan, resulting in a decrease in the net loss of $44,000. The current level of shareholders’ equity equates to a book value per share of $22.01 at December 31, 2019 compared to $20.39 at December 31, 2018, and an equity to asset ratio of 9.31% at December 31, 2019 compared to 8.52% at December 31, 2018. Dividends declared for the twelve months ended December 31, 2019 and 2018 were $1.25 per share.
2018
Shareholders’ equity increased $5,344,000 to $143,536,000 at December 31, 2018 compared to December 31, 2017. The change in accumulated other comprehensive loss from $4,974,000 at December 31, 2017 to $6,636,000 at December 31, 2018 is a result of an increase in unrealized losses on available for sale securities from an unrealized loss of $54,000 at December 31, 2017 to an unrealized loss of $1,360,000 at December 31, 2018. The amount of accumulated other comprehensive loss at December 31, 2018 was also impacted by the change in net excess of the projected benefit obligation over the fair value of the plan assets of the defined benefit pension plan resulting in a $356,000 increase in the net loss to $5,276,000 at December 31, 2018. The current level of
30
shareholders’ equity equates to a book value per share of $30.59 at December 31, 2018 compared to $29.47 at December 31, 2017 and an equity to asset ratio of 8.52% at December 31, 2018 compared to 9.37% at December 31, 2017. Excluding goodwill and intangibles, book value per share was $26.70 at December 31, 2018 compared to $25.51 at December 31, 2017. Dividends declared for twelve months ended December 31, 2018 and 2017 were $1.88 per share.
Bank regulators have risk based capital guidelines. Under these guidelines the Corporation and each Bank are required to maintain minimum ratios of core capital and total qualifying capital as a percentage of risk weighted assets and certain off-balance sheet items. At December 31, 2019, both the Corporation’s and each Bank’s required ratios were well above the minimum ratios (and including the current capital conservation buffer where applicable) as follows:
Corporation | Jersey Shore State Bank | Luzerne Bank | Minimum Standards | ||||||||
Common equity tier 1 capital to risk-weighted assets | 10.674 | % | 10.381 | % | 10.577 | % | 7.000 | % | |||
Tier 1 capital to risk-weighted assets | 10.674 | % | 10.381 | % | 10.577 | % | 8.500 | % | |||
Total capital to risk-weighted assets | 11.391 | % | 11.093 | % | 11.295 | % | 10.500 | % | |||
Tier 1 capital to average assets | 8.514 | % | 8.191 | % | 8.653 | % | 4.000 | % | |||
For a more comprehensive discussion of these requirements, see “Regulation and Supervision” in Item 1 of the Annual Report on Form 10-K. Management believes that the Corporation and the Banks will continue to exceed regulatory capital requirements.
RETURN ON EQUITY AND ASSETS
The ratio of net income to average total assets and average shareholders’ equity, and other certain equity ratios are presented as follows:
2019 | 2018 | 2017 | ||||||
Percentage of net income to: | ||||||||
Average total assets | 0.94 | % | 0.94 | % | 0.69 | % | ||
Average shareholders’ equity | 10.54 | % | 10.72 | % | 6.91 | % | ||
Percentage of dividends declared to net income | 56.27 | % | 59.97 | % | 90.42 | % | ||
Percentage of average shareholders’ equity to average total assets | 8.91 | % | 8.77 | % | 10.05 | % | ||
LIQUIDITY, INTEREST RATE SENSITIVITY, AND MARKET RISK
The Asset/Liability Committee addresses the liquidity needs of the Corporation to ensure that sufficient funds are available to meet credit demands and deposit withdrawals as well as to the placement of available funds in the investment portfolio. In assessing liquidity requirements, equal consideration is given to the current position as well as the future outlook.
The following liquidity measures are monitored for compliance and were within the limits cited at December 31, 2019, except for Net Loans to Total Deposits which was at 101.5%:
1. Net Loans to Total Assets, 85% maximum
2. Net Loans to Total Deposits, 100% maximum
3. Cumulative 90 day Maturity GAP %, +/- 20% maximum
4. Cumulative 1 Year Maturity GAP %, +/- 25% maximum
Fundamental objectives of the Corporation’s asset/liability management process are to maintain adequate liquidity while minimizing interest rate risk. The maintenance of adequate liquidity provides the Corporation with the ability to meet its financial obligations to depositors, loan customers, and shareholders. Additionally, it provides funds for normal operating expenditures and business opportunities as they arise. The objective of interest rate sensitivity management is to increase net interest income by managing interest sensitive assets and liabilities in such a way that they can be repriced in response to changes in market interest rates.
The Corporation, like other financial institutions, must have sufficient funds available to meet its liquidity needs for deposit withdrawals, loan commitments, and expenses. In order to control cash flow, the Corporation estimates future flows of cash from deposits and loan payments. The primary sources of funds are deposits, principal and interest payments on loans and mortgage-
31
backed securities, as well as FHLB borrowings. Funds generated are used principally to fund loans and purchase investment securities. Management believes the Corporation has adequate resources to meet its normal funding requirements.
Management monitors the Corporation’s liquidity on both a short and long-term basis, thereby providing management necessary information to react to current balance sheet trends. Cash flow needs are assessed and sources of funds are determined. Funding strategies consider both customer needs and economical cost. Both short and long term funding needs are addressed by maturities and sales of available for sale investment securities, loan repayments and maturities, and liquidating money market investments such as federal funds sold. The use of these resources, in conjunction with access to credit, provides core ingredients to satisfy depositor, borrower, and creditor needs.
Management monitors and determines the desirable level of liquidity. Consideration is given to loan demand, investment opportunities, deposit pricing and growth potential, as well as the current cost of borrowing funds. The Corporation has a current borrowing capacity at the FHLB of $597,509,000 with $156,333,000 utilized, leaving $441,176,000 available. In addition to this credit arrangement, the Corporation has additional lines of credit with correspondent banks of $52,000,000. The Corporation’s management believes that it has sufficient liquidity to satisfy estimated short-term and long-term funding needs.
Interest rate sensitivity, which is closely related to liquidity management, is a function of the repricing characteristics of the Corporation’s portfolio of assets and liabilities. Asset/liability management strives to match maturities and rates between loan and investment security assets with the deposit liabilities and borrowings that fund them. Successful asset/liability management results in a balance sheet structure which can cope effectively with market rate fluctuations. The matching process is affected by segmenting both assets and liabilities into future time periods (usually 12 months or less) based upon when repricing can be effected. Repriceable assets are subtracted from repriceable liabilities for a specific time period to determine the “gap” or difference. Once known, the gap is managed based on predictions about future market interest rates. Intentional mismatching, or gapping, can enhance net interest income if market rates move as predicted. However, if market rates behave in a manner contrary to predictions, net interest income will suffer. Gaps, therefore, contain an element of risk and must be prudently managed. In addition to gap management, the Corporation has an asset liability management policy which incorporates a market value at risk calculation which is used to determine the effects of interest rate movements on shareholders’ equity and a simulation analysis to monitor the effects of interest rate changes on the Corporation’s balance sheet.
The Corporation currently maintains a gap position of being asset sensitive. The Corporation has strategically taken this position as it has decreased the duration of the earning asset portfolio by adding quality short and intermediate term loans such as home equity loans and the selling of long-term municipal bonds. Lengthening of the liability portfolio is being undertaken to build protection in a rising rate environment.
A market value at risk calculation is utilized to monitor the effects of interest rate changes on the Corporation’s balance sheet and more specifically shareholders’ equity. The Corporation does not manage the balance sheet structure in order to maintain compliance with this calculation. The calculation serves as a guideline with greater emphasis placed on interest rate sensitivity. Changes to calculation results from period to period are reviewed as changes in results could be a signal of future events.
INTEREST RATE SENSITIVITY
In this analysis the Corporation examines the result of various changes in market interest rates in 100 basis point increments and their effect on net interest income. It is assumed that the change is instantaneous and that all rates move in a parallel manner. Assumptions are also made concerning prepayment speeds on mortgage loans and mortgage securities.
The following is a rate shock forecast for the twelve month period ending December 31, 2020 assuming a static balance sheet as of December 31, 2019.
Parallel Rate Shock in Basis Points | ||||||||||||||||||||||||||||
(In Thousands) | (200) | (100) | Static | 100 | 200 | 300 | 400 | |||||||||||||||||||||
Net interest income | $ | 45,698 | $ | 48,662 | $ | 51,621 | $ | 53,963 | $ | 56,084 | $ | 58,114 | $ | 60,128 | ||||||||||||||
Change from static | (5,923 | ) | (2,959 | ) | — | 2,342 | 4,463 | 6,493 | 8,507 | |||||||||||||||||||
Percent change from static | -11.47 | % | -5.73 | % | — | 4.54 | % | 8.65 | % | 12.58 | % | 16.48 | % | |||||||||||||||
The model utilized to create the report presented above makes various estimates at each level of interest rate change regarding cash flow from principal repayment on loans and mortgage-backed securities and/or call activity on investment securities. Actual results could differ significantly from these estimates which would result in significant differences in the calculated projected change. In addition, the limits stated above do not necessarily represent the level of change under which management would
32
undertake specific measures to realign its portfolio in order to reduce the projected level of change. Generally, management believes the Corporation is well positioned to respond expeditiously when the market interest rate outlook changes.
INFLATION
The asset and liability structure of a financial institution is primarily monetary in nature; therefore, interest rates rather than inflation have a more significant impact on the Corporation’s performance. Interest rates are not always affected in the same direction or magnitude as prices of other goods and services, but are reflective of fiscal policy initiatives or economic factors that are not measured by a price index.
CRITICAL ACCOUNTING POLICIES
The Corporation’s accounting policies are integral to understanding the results reported. The accounting policies are described in detail in Note 1 of the “Notes to Consolidated Financial Statements” included in Item 8 of this Annual Report on Form 10-K. Our most complex accounting policies require management’s judgment to ascertain the valuation of assets, liabilities, commitments, and contingencies. We have established detailed policies and control procedures that are intended to ensure valuation methods are well controlled and applied consistently from period to period. In addition, the policies and procedures are intended to ensure that the process for changing methodologies occurs in an appropriate manner. The following is a brief description of our current accounting policies involving significant management valuation judgments.
Other Than Temporary Impairment of Debt Securities
Debt securities are evaluated periodically to determine whether a decline in their value is other than temporary. Management utilizes criteria such as the magnitude and duration of the decline, in addition to the reason underlying the decline, to determine whether the loss in value is other than temporary. The term “other than temporary” is not intended to indicate that the decline is permanent. It indicates that the prospects for a near term recovery of value are not necessarily favorable, or that there is a lack of evidence to support fair values equal to, or greater than, the carrying value of the investment. Once a decline in value is determined to be other than temporary, the value of the security is reduced and a corresponding charge to earnings is recognized. For a full discussion of the Corporation’s methodology of assessing impairment, refer to Note 4 of the “Notes to Consolidated Financial Statements” included in Item 8 of this Annual Report on Form 10-K.
Allowance for Loan Losses
Arriving at an appropriate level of allowance for loan losses involves a high degree of judgment. The Corporation’s allowance for loan losses provides for probable losses based upon evaluations of known and inherent risks in the loan portfolio.
Management uses historical information to assess the adequacy of the allowance for loan losses as well as the prevailing business environment; as it is affected by changing economic conditions and various external factors, which may impact the portfolio in ways currently unforeseen. The allowance is increased by provisions for loan losses and by recoveries of loans previously charged-off and reduced by loans charged-off. For a full discussion of the Corporation’s methodology of assessing the adequacy of the reserve for allowance for loan losses, refer to Note 1 of the “Notes to Consolidated Financial Statements” included in Item 8 of this Annual Report on Form 10-K.
Goodwill and Other Intangible Assets
As discussed in Note 8 of the “Notes to Consolidated Financial Statements,” the Corporation must assess goodwill and other intangible assets each year for impairment. This assessment involves estimating cash flows for future periods. If the future cash flows were less than the recorded goodwill and other intangible assets balances, we would be required to take a charge against earnings to write down the assets to the lower value.
Deferred Tax Assets
Management uses an estimate of future earnings to support their position that the benefit of their deferred tax assets will be realized. If future income should prove non-existent or less than the amount of the deferred tax assets within the tax years to which they may be applied, the asset may not be realized and the Corporation’s net income will be reduced. The Corporation’s deferred tax assets are described further in Note 12 of the “Notes to Consolidated Financial Statements” included in Item 8 of this Annual Report on Form 10-K.
33
Pension Benefits
Pension costs and liabilities are dependent on assumptions used in calculating such amounts. These assumptions include discount rates, benefits earned, interest costs, expected return on plan assets, mortality rates, and other factors. In accordance with GAAP, actual results that differ from the assumptions are accumulated and amortized over future periods and, therefore, generally affect recognized expense and the recorded obligation of future periods. While management believes that the assumptions used are appropriate, differences in actual experience or changes in assumptions may affect the Corporation’s pension obligations and future expense. Our pension benefits are described further in Note 13 of the “Notes to Consolidated Financial Statements” included in Item 8 of this Annual Report on Form 10-K.
CONTRACTUAL OBLIGATIONS
The Corporation has various financial obligations, including contractual obligations which may require future cash payments. The following table presents, as of December 31, 2019, significant fixed and determinable contractual obligations to third parties by payment date. Further discussion of the nature of each obligation is included in the “Notes to Consolidated Financial Statements” included in Item 8 of this Annual Report on Form 10-K.
Payments Due In | ||||||||||||||||||||
(In Thousands) | One Year or Less | One to Three Years | Three to Five Years | Over Five Years | Total | |||||||||||||||
Deposits without a stated maturity | $ | 946,121 | $ | — | $ | — | $ | — | $ | 946,121 | ||||||||||
Time deposits | 191,311 | 170,200 | 15,037 | 1,336 | 377,884 | |||||||||||||||
Repurchase agreements | 4,920 | — | — | — | 4,920 | |||||||||||||||
Short-term borrowings | — | — | — | — | — | |||||||||||||||
Long-term borrowings | 43,396 | 53,155 | 60,177 | 5,192 | 161,920 | |||||||||||||||
Operating leases | 382 | 787 | 734 | 3,668 | 5,571 | |||||||||||||||
The Corporation’s operating lease obligations represent short and long-term lease and rental payments for branch facilities and equipment. The Bank leases certain facilities under operating leases which expire on various dates through 2049. Renewal options are available on the majority of these leases.
CAUTIONARY STATEMENT FOR PURPOSES OF THE PRIVATE SECURITIES LITIGATION REFORM ACT OF 1995
This Report contains certain “forward-looking statements” including statements concerning plans, objectives, future events or performance and assumptions and other statements which are other than statements of historical fact. The Corporation wishes to caution readers that the following important factors, among others in addition to the factors discussed in Item 1 - "Business" and in Item 1A - "Risk Factors", may have affected and could in the future affect the Corporation’s actual results and could cause the Corporation’s actual results for subsequent periods to differ materially from those expressed in any forward-looking statement made by or on behalf of the Corporation herein: (i) the effect of changes in laws and regulations, including federal and state banking laws and regulations, with which the Corporation must comply, and the associated costs of compliance with such laws and regulations either currently or in the future as applicable; (ii) the effect of changes in accounting policies and practices, as may be adopted by the regulatory agencies as well as by the Financial Accounting Standards Board; (iii) the effect on the Corporation’s competitive position within its market area of the increasing consolidation within the banking and financial services industries, including the increased competition from larger regional and out-of-state banking organizations as well as non-bank providers of various financial services; (iv) the effect of changes in interest rates; (v) the effect of changes in the business cycle and downturns in the local, regional or national economies; and (vi) the effects of health emergencies, including the spread of infectious diseases or pandemics.
ITEM 7A QUANTITATIVE AND QUALITATIVE DISCLOSURES ABOUT MARKET RISK
Market risk for the Corporation is comprised primarily from interest rate risk exposure and liquidity risk. Interest rate risk and liquidity risk management is performed at the Banks' level as well as the Corporation level. The Corporation’s interest rate sensitivity is monitored by management through selected interest rate risk measures produced internally. Additional information and details are provided in the Interest Sensitivity section of Item 7 - "Management’s Discussion and Analysis of Financial Condition and Results of Operations."
Generally, management believes the Corporation is well positioned to respond expeditiously when the market interest rate outlook changes.
34
ITEM 8 | FINANCIAL STATEMENTS AND SUPPLEMENTARY DATA |

REPORT OF INDEPENDENT REGISTERED PUBLIC ACCOUNTING FIRM
To the Shareholders and the Board of Directors of Penns Woods Bancorp, Inc.
Opinion on the Financial Statements
We have audited the accompanying consolidated balance sheets of Penns Woods Bancorp, Inc. and subsidiaries (the “Company”) as of December 31, 2019 and 2018; the related consolidated statements of income, comprehensive income, changes in shareholders’ equity, and cash flows for each of the three years in the period ended December 31, 2019; and the related notes to the consolidated financial statements (collectively, the financial statements). In our opinion, the financial statements present fairly, in all material respects, the financial position of the Company as of December 31, 2019 and 2018, and the results of its operations and its cash flows for each of the three years in the period ended December 31, 2019, in conformity with accounting principles generally accepted in the United States of America.
We have also audited, in accordance with the standards of the Public Company Accounting Oversight Board (United States) (PCAOB), the Company’s internal control over financial reporting as of December 31, 2019, based on criteria established in Internal Control - Integrated Framework, issued by the Committee of Sponsoring Organizations of the Treadway Commission in 2013, and our report dated March 10, 2020, expressed an unqualified opinion on the effectiveness of the Company’s internal control over financial reporting.
Basis for Opinion
These financial statements are the responsibility of the Company’s management. Our responsibility is to express an opinion on the Company’s financial statements based on our audits. We are a public accounting firm registered with the PCAOB and are required to be independent, with respect to the Company, in accordance with U.S. federal securities laws and the applicable rules and regulations of the Securities and Exchange Commission and the PCAOB.
We conducted our audits in accordance with the standards of the PCAOB. Those standards require that we plan and perform the audit to obtain reasonable assurance about whether the financial statements are free of material misstatement, whether due to error or fraud. Our audits included performing procedures to assess the risks of material misstatement of the financial statements, whether due to error or fraud, and performing procedures that respond to those risks.
Such procedures included examining, on a test basis, evidence regarding the amounts and disclosures in the financial statements. Our audits also included evaluating the accounting principles used and significant estimates made by management, as well as evaluating the overall presentation of the financial statements. We believe that our audits provide a reasonable basis for our opinion.
We have served as the Company’s auditor since 1999.

Cranberry Township, Pennsylvania
March 10, 2020
35
PENNS WOODS BANCORP, INC.
CONSOLIDATED BALANCE SHEET
December 31, | ||||||||
(In Thousands, Except Share Data) | 2019 | 2018 | ||||||
ASSETS: | ||||||||
Noninterest-bearing balances | $ | $ | ||||||
Interest-bearing deposits in other financial institutions | ||||||||
Total cash and cash equivalents | ||||||||
Investment debt securities, available for sale, at fair value | ||||||||
Investment equity securities, at fair value | ||||||||
Investment securities, trading | ||||||||
Restricted investment in bank stock, at fair value | ||||||||
Loans held for sale | ||||||||
Loans | ||||||||
Allowance for loan losses | ( | ) | ( | ) | ||||
Loans, net | ||||||||
Premises and equipment, net | ||||||||
Accrued interest receivable | ||||||||
Bank-owned life insurance | ||||||||
Goodwill | ||||||||
Intangibles | ||||||||
Operating lease right of use asset | ||||||||
Deferred tax asset | ||||||||
Other assets | ||||||||
TOTAL ASSETS | $ | $ | ||||||
LIABILITIES: | ||||||||
Interest-bearing deposits | $ | $ | ||||||
Noninterest-bearing deposits | ||||||||
Total deposits | ||||||||
Short-term borrowings | ||||||||
Long-term borrowings | ||||||||
Accrued interest payable | ||||||||
Operating lease liability | ||||||||
Other liabilities | ||||||||
TOTAL LIABILITIES | ||||||||
SHAREHOLDERS’ EQUITY: | ||||||||
Preferred stock, no par value, 3,000,000 shares authorized; no shares issued | ||||||||
Common stock, par value $5.55, 22,500,000 shares authorized; 7,520,740 and 7,517,546 shares issued; 7,040,515 and 7,037,322 shares outstanding | ||||||||
Additional paid-in capital | ||||||||
Retained earnings | ||||||||
Accumulated other comprehensive loss: | ||||||||
Net unrealized gain (loss) on available for sale securities | ( | ) | ||||||
Defined benefit plan | ( | ) | ( | ) | ||||
Treasury stock at cost, 480,225 shares | ( | ) | ( | ) | ||||
TOTAL PENNS WOODS BANCORP, INC. SHAREHOLDERS’ EQUITY | ||||||||
Non controlling interest | ||||||||
TOTAL SHAREHOLDERS' EQUITY | ||||||||
TOTAL LIABILITIES AND SHAREHOLDERS’ EQUITY | $ | $ | ||||||
See accompanying notes to the consolidated financial statements.
36
PENNS WOODS BANCORP, INC.
CONSOLIDATED STATEMENT OF INCOME
Year Ended December 31, | |||||||||||
(In Thousands, Except Per Share Data) | 2019 | 2018 | 2017 | ||||||||
INTEREST AND DIVIDEND INCOME: | |||||||||||
Loans, including fees | $ | $ | $ | ||||||||
Investment securities: | |||||||||||
Taxable | |||||||||||
Tax-exempt | |||||||||||
Dividend and other interest income | |||||||||||
TOTAL INTEREST AND DIVIDEND INCOME | |||||||||||
INTEREST EXPENSE: | |||||||||||
Deposits | |||||||||||
Short-term borrowings | |||||||||||
Long-term borrowings | |||||||||||
TOTAL INTEREST EXPENSE | |||||||||||
NET INTEREST INCOME | |||||||||||
PROVISION FOR LOAN LOSSES | |||||||||||
NET INTEREST INCOME AFTER PROVISION FOR LOAN LOSSES | |||||||||||
NON-INTEREST INCOME: | |||||||||||
Service charges | |||||||||||
Net debt securities gains (losses), available for sale | ( | ) | |||||||||
Net equity securities gains (losses) | ( | ) | |||||||||
Net securities gains (losses), trading | ( | ) | |||||||||
Bank-owned life insurance | |||||||||||
Gain on sale of loans | |||||||||||
Insurance commissions | |||||||||||
Brokerage commissions | |||||||||||
Debit card income | |||||||||||
Other | |||||||||||
TOTAL NON-INTEREST INCOME | |||||||||||
NON-INTEREST EXPENSE: | |||||||||||
Salaries and employee benefits | |||||||||||
Occupancy | |||||||||||
Furniture and equipment | |||||||||||
Software amortization | |||||||||||
Pennsylvania shares tax | |||||||||||
Professional Fees | |||||||||||
Federal Deposit Insurance Corporation deposit insurance | |||||||||||
Write down of assets held for sale | |||||||||||
Loss on sale of premises and equipment | |||||||||||
Marketing | |||||||||||
Intangible amortization | |||||||||||
Other | |||||||||||
TOTAL NON-INTEREST EXPENSE | |||||||||||
INCOME BEFORE INCOME TAX PROVISION | |||||||||||
INCOME TAX PROVISION | |||||||||||
CONSOLIDATED NET INCOME | $ | $ | $ | ||||||||
Earnings attributable to noncontrolling interest | |||||||||||
NET INCOME ATTRIBUTABLE TO PENNS WOODS BANCORP, INC. | $ | $ | $ | ||||||||
EARNINGS PER SHARE - BASIC | $ | $ | $ | ||||||||
EARNINGS PER SHARE - DILUTED | $ | $ | $ | ||||||||
WEIGHTED AVERAGE SHARES OUTSTANDING - BASIC | |||||||||||
WEIGHTED AVERAGE SHARES OUTSTANDING - DILUTED | |||||||||||
DIVIDENDS PER SHARE | $ | $ | $ | ||||||||
See accompanying notes to the consolidated financial statements.
37
PENNS WOODS BANCORP, INC.
CONSOLIDATED STATEMENT OF COMPREHENSIVE INCOME
Year Ended December 31, | ||||||||||||
(In Thousands) | 2019 | 2018 | 2017 | |||||||||
Net Income | $ | $ | $ | |||||||||
Other comprehensive income (loss): | ||||||||||||
Change in unrealized gain (loss) on available for sale securities | ( | ) | ||||||||||
Tax effect | ( | ) | ( | ) | ||||||||
Net realized (gain) loss included in net income | ( | ) | ( | ) | ||||||||
Tax effect | ( | ) | ||||||||||
Amortization (accretion) of unrecognized pension and post-retirement items | ( | ) | ||||||||||
Tax effect | ( | ) | ( | ) | ||||||||
Total other comprehensive income (loss) | ( | ) | ||||||||||
Comprehensive income | $ | $ | $ | |||||||||
See accompanying notes to the consolidated financial statements.
38
PENNS WOODS BANCORP, INC.
CONSOLIDATED STATEMENT OF CHANGES IN SHAREHOLDERS’ EQUITY
(In Thousands, Except Per Share Data) | COMMON STOCK | ADDITIONAL PAID-IN CAPITAL | RETAINED EARNINGS | ACCUMULATED OTHER COMPREHENSIVE LOSS | TREASURY STOCK | NON-CONTROLLING INTEREST | TOTAL SHAREHOLDERS’ EQUITY | ||||||||||||||||||||||||
SHARES | AMOUNT | ||||||||||||||||||||||||||||||
Balance, December 31, 2016 | $ | $ | $ | $ | ( | ) | $ | ( | ) | $ | $ | ||||||||||||||||||||
Net income | |||||||||||||||||||||||||||||||
Reclassification of certain income tax effects from accumulated other comprehensive loss | ( | ) | — | ||||||||||||||||||||||||||||
Other comprehensive income | |||||||||||||||||||||||||||||||
Stock-based compensation recognized in earnings | |||||||||||||||||||||||||||||||
Dividends declared, ($1.25 per share) | ( | ) | ( | ) | |||||||||||||||||||||||||||
Noncontrolling investment in joint venture | |||||||||||||||||||||||||||||||
Common shares issued for employee stock purchase plan | |||||||||||||||||||||||||||||||
Purchase of treasury stock (47,698 shares) | ( | ) | ( | ) | |||||||||||||||||||||||||||
Balance, December 31, 2017 | ( | ) | ( | ) | |||||||||||||||||||||||||||
Net income | |||||||||||||||||||||||||||||||
Adoption of ASU 2016-01 | ( | ) | — | ||||||||||||||||||||||||||||
Other comprehensive loss | ( | ) | ( | ) | |||||||||||||||||||||||||||
Stock-based compensation recognized in earnings | |||||||||||||||||||||||||||||||
Dividends declared, ($1.25 per share) | ( | ) | ( | ) | |||||||||||||||||||||||||||
Common shares issued for employee stock purchase plan | |||||||||||||||||||||||||||||||
Balance, December 31, 2018 | ( | ) | ( | ) | |||||||||||||||||||||||||||
Net income | |||||||||||||||||||||||||||||||
Other comprehensive income | |||||||||||||||||||||||||||||||
Stock-based compensation recognized in earnings | |||||||||||||||||||||||||||||||
Dividends declared, ($1.26 per share) | ( | ) | ( | ) | |||||||||||||||||||||||||||
Common shares issued for employee stock purchase plan | |||||||||||||||||||||||||||||||
Stock split fractional shares | ( | ) | |||||||||||||||||||||||||||||
Balance, December 31, 2019 | $ | $ | $ | $ | ( | ) | $ | ( | ) | $ | $ | ||||||||||||||||||||
See accompanying notes to the consolidated financial statements.
39
PENNS WOODS BANCORP, INC.
CONSOLIDATED STATEMENT OF CASH FLOWS
Year Ended December 31, | ||||||||||||
(In Thousands) | 2019 | 2018 | 2017 | |||||||||
OPERATING ACTIVITIES: | ||||||||||||
Net Income | $ | $ | $ | |||||||||
Adjustments to reconcile net income to net cash provided by operating activities: | ||||||||||||
Depreciation and amortization | ||||||||||||
Write down of assets held for sale | ||||||||||||
Loss on sale of premises and equipment | ||||||||||||
Amortization of intangible assets | ||||||||||||
Provision for loan losses | ||||||||||||
Stock based compensation | ||||||||||||
Amortization of investment security discounts and premiums, net | ||||||||||||
Securities (gains) losses, available for sale | ( | ) | ( | ) | ||||||||
Originations of loans held for sale | ( | ) | ( | ) | ( | ) | ||||||
Proceeds of loans held for sale | ||||||||||||
Gain on sale of loans | ( | ) | ( | ) | ( | ) | ||||||
Net equity securities (gains) losses | ( | ) | ||||||||||
Net securities (gains) losses, trading | ( | ) | ( | ) | ||||||||
Proceeds from sales of trading securities | ||||||||||||
Purchases of trading securities | ( | ) | ( | ) | ( | ) | ||||||
Security trades receivable | ( | ) | ||||||||||
Earnings on bank-owned life insurance | ( | ) | ( | ) | ( | ) | ||||||
Decrease (increase) in deferred tax asset | ( | ) | ||||||||||
Other, net | ( | ) | ( | ) | ||||||||
Net cash provided by operating activities | ||||||||||||
INVESTING ACTIVITIES: | ||||||||||||
Investment debt securities available for sale: | ||||||||||||
Proceeds from sales | ||||||||||||
Proceeds from calls, maturities and repayments | ||||||||||||
Purchases | ( | ) | ( | ) | ( | ) | ||||||
Proceeds from sales of equity securities | ||||||||||||
Net decrease (increase) in loans | ( | ) | ( | ) | ||||||||
Acquisition of premises and equipment | ( | ) | ( | ) | ( | ) | ||||||
Proceeds from sale of premises and equipment | ||||||||||||
Proceeds from the sale of foreclosed assets | ||||||||||||
Purchase of bank-owned life insurance | ( | ) | ( | ) | ( | ) | ||||||
Capital contribution from non-controlling interest | ||||||||||||
Proceeds from redemption of regulatory stock | ||||||||||||
Purchases of regulatory stock | ( | ) | ( | ) | ( | ) | ||||||
Net cash provided by (used for) investing activities | ( | ) | ( | ) | ||||||||
FINANCING ACTIVITIES: | ||||||||||||
Net increase in interest-bearing deposits | ||||||||||||
Net increase in noninterest-bearing deposits | ||||||||||||
Proceeds from long-term borrowings | ||||||||||||
Repayment of long-term borrowings | ( | ) | ( | ) | ( | ) | ||||||
Net (decrease) increase in short-term borrowings | ( | ) | ||||||||||
Finance lease principal payments | ( | ) | ||||||||||
Dividends paid | ( | ) | ( | ) | ( | ) | ||||||
Issuance of common stock | ||||||||||||
Purchase of treasury stock | ( | ) | ||||||||||
Net cash (used for) provided by financing activities | ( | ) | ||||||||||
NET (DECREASE) INCREASE IN CASH AND CASH EQUIVALENTS | ( | ) | ( | ) | ||||||||
CASH AND CASH EQUIVALENTS, BEGINNING | ||||||||||||
CASH AND CASH EQUIVALENTS, ENDING | $ | $ | $ | |||||||||
See accompanying notes to the consolidated financial statements.
Year Ended December 31, | ||||||||||||
(In Thousands) | 2019 | 2018 | 2017 | |||||||||
SUPPLEMENTAL DISCLOSURES OF CASH FLOW INFORMATION: | ||||||||||||
Interest paid | $ | $ | $ | |||||||||
Income taxes paid | ||||||||||||
Transfer of loans to foreclosed real estate | ||||||||||||
Transfer due to adoption of ASU 2016-01, equity securities fair value adjust, reclassification from AOCI to Retained Earnings, net of tax | ||||||||||||
Transfer due to adoption of ASU 2018-02, income statement - reporting comprehensive income, reclassification of certain tax effects from accumulated other comprehensive income | ||||||||||||
Right of use lease assets obtained in exchange for lessee finance lease liabilities | ||||||||||||
Right of use lease assets obtained in exchange for lessee operations lease liabilities | ||||||||||||
See accompanying notes to the consolidated financial statements.
40
PENNS WOODS BANCORP, INC.
NOTES TO CONSOLIDATED FINANCIAL STATEMENTS
NOTE 1 — OPERATIONS AND SUMMARY OF SIGNIFICANT ACCOUNTING POLICIES
Principles of Consolidation
The accompanying consolidated financial statements include the accounts of Penns Woods Bancorp, Inc. and its wholly owned subsidiaries, Jersey Shore State Bank (“JSSB”), Luzerne Bank ("Luzerne" and collectively with JSSB , the "Banks"), Woods Real Estate Development Co., Inc., Woods Investment Company, Inc., The M Group Inc. D/B/A The Comprehensive Financial Group (“The M Group”), a wholly owned subsidiary of JSSB and an eighty percent owned subsidiary, United Insurance Solutions, LLC, (collectively, the “Corporation”). All significant intercompany balances and transactions have been eliminated.
Nature of Business
The Banks engage in a full-service commercial banking business, making available to the community a wide range of financial services including, but not limited to, installment loans, credit cards, mortgage and home equity loans, lines of credit, construction financing, farm loans, community development loans, loans to non-profit entities and local government, and various types of demand and time deposits including, but not limited to, checking accounts, savings accounts, money market deposit accounts, certificates of deposit, and IRAs. Deposits are insured by the Federal Deposit Insurance Corporation (“FDIC”) to the extent provided by law.
The financial services are provided by the Banks to individuals, partnerships, non-profit organizations, and corporations through their twenty-six offices located in Clinton, Lycoming, Centre, Montour, Union, and Luzerne Counties, Pennsylvania.
Woods Real Estate Development Co., Inc. engages in real estate transactions on behalf of Penns Woods Bancorp, Inc. and the Banks.
Woods Investment Company, Inc., a Delaware holding company, is engaged in investing activities.
The M Group engages in securities brokerage and financial planning services, which include the sale of life insurance products, annuities, and estate planning services.
United Insurance Solutions, LLC offers property and casualty and auto insurance products within the Corporation's market footprint.
Operations are managed and financial performance is evaluated on a corporate-wide basis. Accordingly, all financial service operations are considered by management to be aggregated in one reportable operating segment.
Use of Estimates
The preparation of financial statements requires management to make estimates and assumptions that affect the reported amounts of assets and liabilities and disclosure of contingent assets and liabilities at the date of the Consolidated Financial Statements and the reported amounts of revenues and expenses during the reporting period. Actual results may differ from those estimates.
Material estimates that are particularly susceptible to significant change relate to the determination of the allowance for loan losses, valuation of net deferred tax assets, impairment of goodwill, other than temporary impairment of debt and equity securities, fair value of financial instruments, and the valuation of real estate acquired through, or in lieu of, foreclosure on settlement of debt.
Cash and Cash Equivalents
Cash and cash equivalents include cash on hand and in banks and federal funds sold. Interest-earning deposits mature within 90 days and are carried at cost. Net cash flows are reported for loan, deposit, and short-term borrowing transactions.
Restrictions on Cash and Cash Equivalents
Based on deposit levels, the Banks must maintain cash and other reserves with the Federal Reserve Bank of Philadelphia ("FRB").
41
Investment Securities
Investment securities are classified at the time of purchase, based on management’s intention and ability, as securities held to maturity, securities available for sale, or securities held for trading. Debt securities acquired with the intent and ability to hold to maturity are stated at cost, adjusted for amortization of premium and accretion of discount, which are computed using the interest method and recognized as adjustments of interest income. Certain other debt securities have been classified as available for sale to serve principally as a source of liquidity. Unrealized holding gains and losses for available for sale securities are reported as a separate component of shareholders’ equity, net of tax, until realized. Equity securities are carried at fair value. Unrealized holding gains and losses for equity securities are recognized as a separate component within the income statement. Realized security gains and losses are computed using the specific identification method for debt securities and the average cost method for marketable equity securities. Interest and dividends on investment securities are recognized as income when earned.
Securities are periodically reviewed for other-than-temporary impairment based upon a number of factors, including, but not limited to, the length of time and extent to which the fair value has been less than cost, the financial condition of the underlying issuer, the ability of the issuer to meet contractual obligations, the likelihood of the security’s ability to recover any decline in its fair value, whether it is more likely than not that the Corporation would be required to sell the security before its anticipated recovery in fair value, and a review of the Corporation’s capital adequacy, interest rate risk position, and liquidity. The assessment of a security’s ability to recover any decline in fair value, the ability of the issuer to meet contractual obligations, and management’s intent and ability requires considerable judgment. A decline in value that is considered to be other-than-temporary is recorded as a loss within non-interest income in the Consolidated Statement of Income.
Fair values of investment securities are based on observed market prices. Certain investment securities do not have observed bid prices and their fair value is based on instruments with similar risk elements. Since regulatory stock is redeemable at par, the Corporation carries it at cost.
Loans
Loans that management has the intent and ability to hold for the foreseeable future or until maturity or payoff generally are stated at the principal amount outstanding, net of deferred fees and discounts, unamortized loan fees and costs, and the allowance for loan losses. Interest on loans is recognized as income when earned on the accrual method. The Corporation’s general policy has been to stop accruing interest on loans when it is determined a reasonable doubt exists as to the collectability of additional interest. Income is subsequently recognized only to the extent that cash payments are received provided the loan is not delinquent in payment and, in management’s judgment, the borrower has the ability and intent to make future principal payments. Otherwise, payments are applied to the unpaid principal balance of the loan. Loans are restored to accrual status if certain conditions are met, including but not limited to, the repayment of all unpaid interest and scheduled principal due, ongoing performance consistent with the contractual agreement, and the future expectation of continued, timely payments.
Loan origination and commitment fees as well as certain direct loan origination costs are being deferred and amortized as an adjustment to the related loan’s yield over the contractual lives of the related loans.
Allowance for Loan Losses
The allowance for loan losses represents the amount which management estimates is adequate to provide for probable losses inherent in its loan portfolio as of the Consolidated Balance Sheet date. The allowance method is used in providing for loan losses. Accordingly, all loan losses are charged to the allowance and all recoveries are credited to it. The allowance for loan losses is established through a provision for loan losses charged to operations. The provision for loan losses is based upon management’s quarterly review of the loan portfolio. The purpose of the review is to assess loan quality, identify impaired loans, analyze delinquencies, ascertain loan growth, evaluate potential charge-offs and recoveries, and assess general economic conditions in the markets served. An external independent loan review is also performed semi-annually for the Bank. Management remains committed to an aggressive program of problem loan identification and resolution.
The allowance is calculated by applying loss factors to outstanding loans by type, excluding loans for which a specific allowance has been determined. Loss factors are based on management’s consideration of the nature of the portfolio segments, changes in mix and volume of the loan portfolio, historical loan loss experience, and general economic conditions. In addition, management considers industry standards and trends with respect to nonperforming loans and its knowledge and experience with specific lending segments.
Although management believes that it uses the best information available to make such determinations and that the allowance for loan losses is adequate at December 31, 2019, future adjustments could be necessary if circumstances or economic conditions
42
differ substantially from the assumptions used in making the initial determinations. A downturn in the local economy, rising unemployment, or negative performance trends in financial information from borrowers could be indicators of subsequent increased levels of nonperforming assets and possible charge-offs, which would normally require increased loan loss provisions. An integral part of the periodic regulatory examination process is the review of the adequacy of the Banks' loan loss allowance. The regulatory agencies could require the Banks, based on their evaluation of information available at the time of their examination, to provide additional loan loss provisions to further supplement the allowance.
Impaired loans are commercial and commercial real estate loans for which it is probable the Banks will not be able to collect all amounts due according to the contractual terms of the loan agreement. The Banks individually evaluate such loans for impairment and do not aggregate loans by major risk classifications. The definition of “impaired loans” is not the same as the definition of “nonaccrual loans,” although the two categories overlap. The Banks may choose to place a loan on nonaccrual status due to payment delinquency or uncertain collectability, while not classifying the loan as impaired if the loan is not a commercial or commercial real estate loan. Factors considered by management in determining impairment include payment status and collateral value. The amount of impairment for these types of loans is determined by the difference between the present value of the expected cash flows related to the loan, using the original interest rate, and its recorded value, or as a practical expedient in the case of collateralized loans, the difference between the fair value of the collateral and the recorded amount of the loans. When foreclosure is probable, impairment is measured based on the fair value of the collateral.
Mortgage loans on one-to-four family properties and all consumer loans are large groups of smaller-balance homogeneous loans and are measured for impairment collectively. Loans that experience insignificant payment delays, which are defined as 90 days or less, generally are not classified as impaired. Management determines the significance of payment delays on a case-by-case basis taking into consideration all circumstances surrounding the loan and the borrower including the length of the delay, the borrower’s prior payment record, and the amount of shortfall in relation to the principal and interest owed.
Loan Charge-off Policies
Loans are generally fully or partially charged down to the fair value of collateral securing the asset when:
• | management judges the asset to be uncollectible; |
• | repayment is deemed to be protracted beyond reasonable time frames; |
• | the asset has been classified as a loss by either the internal loan review process or external examiners; |
• | the borrower has filed bankruptcy and the loss becomes evident due to a lack of assets; or |
• | the loan is |
Troubled Debt Restructurings
In situations where, for economic or legal reasons related to a borrower’s financial difficulties, management may grant a concession for other than an insignificant period of time to the borrower that would not otherwise be considered, the related loan is classified as a troubled debt restructuring ("TDR"). Management strives to identify borrowers in financial difficulty early and work with them to modify to more affordable terms before their loan reaches nonaccrual status. These modified terms may include rate reductions, principal forgiveness, payment forbearance, and other actions intended to minimize the economic loss and to avoid foreclosure or repossession of the collateral. In cases where borrowers are granted new terms that provide for a reduction of either interest or principal, management measures any impairment on the restructuring as noted above for impaired loans.
In addition to the allowance for the pooled portfolios, management has developed a separate allowance for loans that are identified as impaired through a TDR. These loans are excluded from pooled loss forecasts and a separate reserve is provided under the accounting guidance for loan impairment. Consumer loans whose terms have been modified in a TDR are also individually analyzed for estimated impairment.
Loans Held for Sale
In general, fixed rate residential mortgage loans originated by the Banks are held for sale and are carried at cost due to their short holding period, which can range from less than two weeks to a maximum of thirty days. Sold loans are not serviced by the Banks. Proceeds from the sale of loans in excess of the carrying value are accounted for as a gain. Total gains on the sale of loans are shown as a component of non-interest income within the Consolidated Statement of Income.
43
Foreclosed Assets
Foreclosed assets are carried at the lower of cost or fair value less estimated selling costs. Prior to foreclosure, the value of the underlying loan is written down to the fair value of the real estate to be acquired by a charge to the allowance for loan losses, if necessary. Any subsequent write-downs are charged against operating expenses. Net operating expenses and gains and losses realized from disposition are included in non-interest expense and income, respectively, within the Consolidated Statement of Income.
Premises and Equipment
Land is carried at cost. Premises and equipment are stated at cost less accumulated depreciation. Depreciation is computed using straight-line and accelerated methods over the estimated useful lives of the related assets, which range from five to ten years for furniture, fixtures, and equipment and fifteen to forty years for buildings and improvements. Costs incurred for routine maintenance and repairs are charged to operations as incurred. Costs of major additions and improvements are capitalized.
Bank-Owned Life Insurance
The Corporation has purchased life insurance policies on certain officers and directors. Bank-owned life insurance is recorded at its cash surrender value, or the amount that can be realized. Increases in the cash surrender value are recognized as a component of non-interest income within the Consolidated Statement of Income.
Goodwill
Intangible Assets
At December 31, 2019, the Corporation had intangible assets of $281,000 as a result of the acquisition of Luzerne National Bank Corporation, which is net of accumulated amortization of $1,733,000 . These intangible assets will continue to be amortized using the sum-of-the-years digits method of amortization over ten years . The Corporation also had intangible assets of $617,000 , which is net of accumulated amortization of $403,000 , as a result of the purchase of two books of business related to investment product sales. The book of business intangible is being amortized using the straight-line method over a period of ten years .
Investments in Limited Partnerships
Off-Balance Sheet Financial Instruments
In the ordinary course of business, the Corporation enters into off-balance sheet financial instruments. Those instruments consist of commitments to extend credit and standby letters of credit. When those instruments are funded or become payable, the Corporation reports the amounts in its financial statements.
Marketing Cost
Marketing costs are generally expensed as incurred.
Income Taxes
The Corporation prescribes a recognition threshold and a measurement attribute for the financial statement recognition and measurement of a tax position taken or expected to be taken in a tax return. Benefits from tax positions should be recognized in the financial statements only when it is more likely than not that the tax position will be sustained upon examination by the
44
appropriate taxing authority that would have full knowledge of all relevant information. A tax position that meets the more-likely-than-not recognition threshold is measured at the largest amount of benefit that is greater than fifty percent likely of being realized upon ultimate settlement. Tax positions that previously failed to meet the more-likely-than-not recognition threshold should be recognized in the first subsequent financial reporting period in which that threshold is met. Previously recognized tax positions that no longer meet the more-likely-than-not recognition threshold should be derecognized in the first subsequent financial reporting period in which that threshold is no longer met.
Deferred tax assets and liabilities result from temporary differences in financial and income tax methods of accounting, and are reflected at currently enacted income tax rates applicable to the period in which the deferred tax assets or liabilities are expected to be realized or settled. As changes in tax laws or rates are enacted, deferred tax assets and liabilities are adjusted through the provision for income taxes. The Corporation analyzed its deferred tax asset position and determined that there was not a need for a valuation allowance due to the Corporation’s ability to generate future ordinary and capital taxable income.
On December 22, 2017 the Tax Cut and Jobs Act was signed into law. ASC 740 (Income Taxes) requires the recognition of the effect of changes in tax laws or rates in the period in which the legislation is enacted. The changes in the deferred tax assets and liabilities remeasured at the new 21% federal tax rate are reflected in income tax expense for fiscal year 2017.
The Corporation when applicable recognizes interest and penalties on income taxes as a component of income tax provision.
Earnings Per Share
The Corporation provides dual presentation of basic and diluted earnings per share. Basic earnings per share is calculated utilizing net income as reported in the numerator and weighted average shares outstanding in the denominator. The computation of diluted earnings per share differs in that the dilutive effects of any stock options are adjusted in the denominator.
Employee Benefits
Pension and employee benefits include contributions, determined actuarially, to a defined benefit retirement plan covering the eligible employees of JSSB. The plan is funded on a current basis to the extent that it is deductible under existing federal tax regulations. Pension and other employee benefits also include contributions to a defined contribution Section 401(k) plan covering eligible employees. Contributions matching those made by eligible employees are funded throughout the year. In addition, an elective contribution may be made annually at the discretion of the board of directors for the employees of JSSB with no contributions made since 2015.
The M Group Products and Income Recognition
The M Group product line is comprised primarily of annuities, life insurance, and mutual funds. The revenues generated from life insurance sales are commission only, as The M Group does not underwrite the policies. Life insurance sales include permanent and term policies with the majority of the policies written being permanent. Term life insurance policies are written for 10 , 15 , 20 , and 30 year terms with the majority of the policies being written for 20 years. None of these products are offered as an integral part of lending activities.
Commissions from the sale of annuities are recognized at the time notice is received from the third party broker/dealer or an insurance company that the transaction has been accepted and approved, which is also the time when commission income is received.
Life insurance commissions are recognized at varying points based on the payment option chosen by the customer. Commissions from monthly and annual payment plans are recognized at the start of each annual period for the life insurance, while quarterly and semi-annual premium payments are recognized quarterly and semi-annually when the earnings process is complete. For example, semi-annual payments on the first of January and July would result in commission income recognition on the first of January and July, while payments on the first of January, April, July, and October would result in commission income recognition on those dates. The potential for chargebacks only exists for those policies on a monthly payment plan since income is recognized at the beginning of the annual coverage period versus at the time of each monthly payment. No liability is maintained for chargebacks as these are removed from income at the time of the occurrence.
Accumulated Other Comprehensive Income (Loss)
The Corporation is required to present accumulated other comprehensive income (loss) in a full set of general-purpose financial statements for all periods presented. Accumulated other comprehensive income (loss) is comprised of unrealized holding gains
45
(losses) on the available for sale securities portfolio and the unrecognized components of net periodic benefit costs of the defined benefit pension plan.
Segment Reporting
The Corporation has determined that its only reportable segment is Community Banking.
Reclassification of Comparative Amounts
Certain items previously reported have been reclassified to conform to the current year’s reporting format. Such reclassifications did not affect net income or shareholders’ equity.
Adopted Accounting Pronouncements
In February 2016, the FASB issued the Leasing Standard, which is codified in ASC 842, Leases, and is intended to increase transparency and comparability among organizations and require lessees to record a right-of-use (ROU) asset and a liability representing the obligation to make lease payments for long-term leases. Accounting by lessors remains largely unchanged. The Company adopted the Standard on January 1, 2019, using the modified retrospective transition under the option to apply the Leasing Standard at its effective date without adjusting the prior period comparative financial statements. Among other things, these updates require lessees to recognize a lease liability, measured on a discounted basis, related to the lessee's obligation to make lease payments arising under a lease contract; and a right-of-use asset related to the lessee’s right to use, or control the use of, a specified asset for the lease term. On January 1, 2019, the Company recorded operating lease liabilities and ROU asset of $4,300,000 and finance lease liabilities and ROU asset of $6,000,000 million upon adoption of the Standard. The balance sheet effects of the new lease accounting standard also impacted regulatory capital ratios, performance ratios and other measures which are dependent upon asset or liability balances. For additional information and required disclosures related to ASC 842, see Note 25, “Leases.”
Recent Accounting Pronouncements Not Yet Adopted
In January 2017, the FASB issued ASU 2017-04, Simplifying the Test for Goodwill Impairment. To simplify the subsequent measurement of goodwill, the FASB eliminated Step 2 from the goodwill impairment test. In computing the implied fair value of goodwill under Step 2, an entity had to perform procedures to determine the fair value at the impairment testing date of its assets and liabilities (including unrecognized assets and liabilities) following the procedure that would be required in determining the fair value of assets acquired and liabilities assumed in a business combination. Instead, under the amendments in this Update, an entity should perform its annual, or interim, goodwill impairment test by comparing the fair value of a reporting unit with its carrying amount. An entity should recognize an impairment charge for the amount by which the carrying amount exceeds the reporting units fair value; however, the loss recognized should not exceed the total amount of goodwill allocated to that reporting unit. A public business entity that is a U.S. Securities and Exchange Commission (SEC) filer should adopt the amendments in this Update for its annual or any interim goodwill impairment tests in fiscal years beginning after December 15, 2019. A public business entity that is not an SEC filer should adopt the amendments in this Update for its annual or any interim goodwill impairment tests in fiscal years beginning after December 15, 2020. All other entities, including not-for-profit entities, that are adopting the amendments in this Update should do so for their annual or any interim goodwill impairment tests in fiscal years beginning after
46
December 15, 2021. On October 16, 2019, the FASB voted to defer the effective date for ASC 350, Intangibles - Goodwill and Other, for smaller reporting companies to fiscal years beginning after December 15, 2022, and interim periods within those fiscal years. This Update is not expected to have a significant impact on the Company’s financial statements.
In August 2018, the FASB issued ASU 2018-13, Fair Value Measurement (Topic 820): Disclosure Framework - Changes the Disclosure Requirements for Fair Value Measurements. The Update removes the requirement to disclose the amount of and reasons for transfers between Level I and Level II of the fair value hierarchy; the policy for timing of transfers between levels; and the valuation processes for Level III fair value measurements. The Update requires disclosure of changes in unrealized gains and losses for the period included in other comprehensive income (loss) for recurring Level III fair value measurements held at the end of the reporting period and the range and weighted average of significant unobservable inputs used to develop Level III fair value measurements. This Update is effective for all entities for fiscal years, and interim periods within those fiscal years, beginning after December 15, 2019. This Update is not expected to have a significant impact on the Company’s financial statements.
In August 2018, the FASB issued ASU 2018-14, Compensation - Retirement Benefits (Topic 715-20). This Update amends ASC 715 to add, remove and clarify disclosure requirements related to defined benefit pension and other postretirement plans. The Update eliminates the requirement to disclose the amounts in accumulated other comprehensive income expected to be recognized as part of net periodic benefit cost over the next year. The Update also removes the disclosure requirements for the effects of a one-percentage-point change on the assumed health care costs and the effect of this change in rates on service cost, interest cost and the benefit obligation for postretirement health care benefits. This Update is effective for public business entities for fiscal years ending after December 15, 2020, and must be applied on a retrospective basis. For all other entities, this Update is effective for fiscal years ending after December 15, 2021. This Update is not expected to have a significant impact on the Company’s financial statements.
In August 2018, the FASB issued ASU 2018-15, Intangibles - Goodwill and Other - Internal-Use Software (Subtopic 350-40). This Update addresses customers’ accounting for implementation costs incurred in a cloud computing arrangement that is a service contract and also adds certain disclosure requirements related to implementation costs incurred for internal-use software and cloud computing arrangements. The amendment aligns the requirements for capitalizing implementation costs incurred in a hosting arrangement that is a service contract with the requirements for capitalizing implementation costs incurred to develop or obtain internal-use software (and hosting arrangements that include an internal-use software license). This Update is effective for public business entities for fiscal years beginning after December 15, 2019, and interim periods within those fiscal years, with early adoption permitted. For all other entities, the amendments are effective for fiscal years beginning after December 15, 2020, and interim periods within fiscal years beginning after December 15, 2021. The amendments in this Update can be applied either retrospectively or prospectively to all implementation costs incurred after the date of adoption. On October 16, 2019, the FASB voted to defer the effective date for ASC 350, Intangibles - Goodwill and Other, for smaller reporting companies to fiscal years beginning after December 15, 2022, and interim periods within those fiscal years. This Update is not expected to have a significant impact on the Company’s financial statements.
In October 2018, the FASB issued ASU 2018-16, Derivatives and Hedging (Topic 815). The amendments in this Update permit use of the Overnight Index Swap (OIS) rate based on the Secured Overnight Financing Rate (SOFR) as a U.S. benchmark interest rate for hedge accounting purposes under Topic 815, in addition to the interest rates on direct Treasury obligations of the U.S. government, the London Interbank Offered Rate (LIBOR) swap rate, the OIS rate based on the Fed Funds Effective Rate, and the Securities Industry and Financial Markets Association (SIFMA) Municipal Swap Rate. For entities that have not already adopted Update 2017-12, the amendments in this Update are required to be adopted concurrently with the amendments in Update 2017-12. For public business entities that already have adopted the amendments in Update 2017-12, the amendments are effective for fiscal years beginning after December 15, 2018, and interim periods within those fiscal years. For all other entities that already have adopted the amendments in Update 2017-12, the amendments are effective for fiscal years beginning after December 15, 2019, and interim periods within those fiscal years. Early adoption is permitted in any interim period upon issuance of this Update if an entity already has adopted Update 2017-12. This Update is not expected to have a significant impact on the Company’s financial statements.
In November 2018, the FASB issued ASU 018-18, Collaborative Arrangements (Topic 808), which made the following targeted improvements to generally accepted accounting principles (GAAP) for collaborative arrangements (1) clarified that certain transactions between collaborative arrangement participants should be accounted for as revenue under Topic 606 when the collaborative arrangement participant is a customer in the context of a unit of account, (2) add unit-of-account guidance in Topic 808 to align with the guidance in Topic 606 (that is, a distinct good or service) when an entity is assessing whether the collaborative arrangement or a part of the arrangement is within the scope of Topic 606, and (3) require that in a transaction with a collaborative arrangement participant that is not directly related to sales to third parties, presenting the transaction together with revenue recognized under Topic 606 is precluded if the collaborative arrangement participant is not a customer. For public business entities, the amendments in this Update are effective for fiscal years beginning after December 15, 2019, and interim periods within those
47
fiscal years. For all other entities, the amendments are effective for fiscal years beginning after December 15, 2020, and interim periods within fiscal years beginning after December 15, 2021. This Update is not expected to have a significant impact on the Company’s financial statements.
In March 2019, the FASB issued ASU 2019-01, Leases (Topic 842): Codification Improvements, which addressed issues lessors sometimes encounter. Specifically addressed in this Update were issues related to (1) determining the fair value of the underlying asset by the lessor that are not manufacturers or dealers (generally financial institutions and captive finance companies), and 2) lessors that are depository and lending institutions should classify principal and payments received under sales-type and direct financing leases within investing activities in the cash flow statement. The ASU also exempts both lessees and lessors from having to provide the interim disclosures required by ASC 250-10-50-3 in the fiscal year in which a company adopts the new leases standard. The amendments addressing the two lessor accounting issues are effective for public business entities for fiscal years beginning after December 15, 2019, and interim periods within those fiscal years. For all other entities, the effective date is for fiscal years beginning after December 15, 2019, and interim periods within fiscal years beginning after December 15, 2020. This Update is not expected to have a significant impact on the Company’s financial statements.
In April 2019, the FASB issued ASU 2019-04, Codification Improvements to Topic 326, Financial Instruments - Credit Losses, Topic 815, Derivatives and Hedging, and Topic 825, Financial Instruments, which affects a variety of topics in the Codification and applies to all reporting entities within the scope of the affected accounting guidance. Topic 326, Financial Instruments - Credit Losses amendments are effective for SEC registrants for fiscal years beginning after December 15, 2019, and interim periods within those fiscal years. For all other public business entities, the effective date is for fiscal years beginning after December 15, 2020, and for all other entities, the effective date is for fiscal years beginning after December 15, 2021.On October 16, 2019, the FASB voted to defer the effective date for ASC 326, Financial Instruments - Credit Losses, for smaller reporting companies to fiscal years beginning after December 15, 2022, and interim periods within those fiscal years. The final ASU is expected to be issued in mid-November. Topic 815, Derivatives and Hedging amendments are effective for public business entities for fiscal years beginning after December 15, 2018, and interim periods within those fiscal years. For all other entities, the amendments are effective for fiscal years beginning after December 15, 2019, and interim periods beginning after December 15, 2020. For entities that have adopted the amendments in Update 2017- 12, the effective date is as of the beginning of the first annual period beginning after the issuance of this Update. Topic 825, Financial Instruments amendments are effective for fiscal years beginning after December 15, 2019, and interim periods within fiscal years. This Update is not expected to have a significant impact on the Company’s financial statements.
In May 2019, the FASB issued ASU 2019-05, Financial Instruments - Credit Losses, Topic 326, which allows entities to irrevocably elect the fair value option for certain financial assets previously measured at amortized cost upon adoption of the new credit losses standard. To be eligible for the transition election, the existing financial asset must otherwise be both within the scope of the new credit losses standard and eligible for the applying the fair value option in ASC 825-10.3. The election must be applied on an instrument-by-instrument basis and is not available for either available-for-sale or held-to-maturity debt securities. For entities that elect the fair value option, the difference between the carrying amount and the fair value of the financial asset would be recognized through a cumulative-effect adjustment to opening retained earnings as of the date an entity adopted ASU 2016-13. Changes in fair value of that financial asset would subsequently be reported in current earnings. For entities that have not yet adopted ASU 2016-13, the effective dates and transition requirements are the same as those in ASU 2016-13. For entities that have adopted ASU 2016-13, ASU 2019-05 is effective for fiscal years beginning after December 15, 2019, including interim periods within those fiscal years. Early adoption is permitted once ASU 2016-13 has been adopted. On October 16, 2019, the FASB voted to defer the effective date for ASC 326, Financial Instruments - Credit Losses, for smaller reporting companies to fiscal years beginning after December 15, 2022, and interim periods within those fiscal years. This Update is not expected to have a significant impact on the Company’s financial statements.
In July 2019, the FASB issued ASU 2019-07, Codification Updates to SEC Sections, Amendments to SEC Paragraphs Pursuant to SEC Final Rule Releases No. 33-10532, Disclosure Update and Simplification, and Nos. 33-10231 and 33-10442, Investment Company Reporting Modernization, and Miscellaneous Updates. This ASU amends various SEC paragraphs pursuant to the issuance of SEC Final Rule Releases No. 33-10532, Disclosure Update and Simplification, and Nos. 33-10231 and 33-10442, Investment Company Reporting Modernization. Other miscellaneous updates to agree to the electronic Code of Federal Regulations also have been incorporated.
In November 2019, the FASB issued ASU 2019-09, Financial Services - Insurance (Topic 944), which defers the effective date of the amendments in Update 2018-12, Financial Services - Insurance (Topic 944): Targeted Improvements to the Accounting for Long-Duration Contracts. For public business entities that meet the definition of an SEC filer, excluding entities eligible to be smaller reporting companies, as defined by the SEC, the amendments in Update 2018-12 are effective for fiscal years beginning after December 15, 2021, and interim periods within those fiscal years. Early application of the amendments in Update 2018-12 is permitted. For all other entities, the amendments in Update 2018-12 are effective for fiscal years beginning after December 15,
48
2023, and interim periods within fiscal years beginning after December 15, 2024. Early application of the amendments in Update 2018-12 is permitted. This Update is not expected to have a significant impact on the Company’s financial statements.
In November 2019, the FASB issued ASU 2019-10, Financial Instruments - Credit Losses (Topic 326), Derivatives and Hedging (Topic 815), and Leases (Topic 842). The Update defers the effective dates of ASU 2016-13 for SEC filers that are eligible to be smaller reporting companies, non-SEC filers, and all other companies to fiscal years beginning after December 15, 2022, including interim periods within those fiscal years. This Update also amends the mandatory effective date for the elimination of Step 2 from the goodwill impairment test under ASU No. 2017-04, Intangibles - Goodwill and Other (Topic 350): Simplifying the Test for Goodwill Impairment (Goodwill), to align with those used for credit losses. Furthermore, the ASU provides a one-year deferral of the effective dates of the ASUs on derivatives and hedging and leases for companies that are not public business entities. The Company qualifies as a smaller reporting company and does not expect to early adopt these ASUs.
In November 2019, the FASB issued ASU 2019-11, Codification Improvements to Topic 326, Financial Instruments - Credit Losses, to clarify its new credit impairment guidance in ASC 326, based on implementation issues raised by stakeholders. This Update clarified, among other things, that expected recoveries are to be included in the allowance for credit losses for these financial assets; an accounting policy election can be made to adjust the effective interest rate for existing troubled debt restructurings based on the prepayment assumptions instead of the prepayment assumptions applicable immediately prior to the restructuring event; and extends the practical expedient to exclude accrued interest receivable from all additional relevant disclosures involving amortized cost basis. The effective dates in this Update are the same as those applicable for ASU 2019-10. This Update is not expected to have a significant impact on the Company’s financial statements.
In December 2019, the FASB issued ASU 2019-12, Income Taxes (Topic 740), to simplify the accounting for income taxes, change the accounting for certain tax transactions, and make minor improvements to the codification. This Update provides a policy election to not allocate consolidated income taxes when a member of a consolidated tax return is not subject to income tax and provides guidance to evaluate whether a step-up in tax basis of goodwill relates to a business combination in which book goodwill was recognized or a separate transaction. The Update also changes current guidance for making an intraperiod allocation, if there is a loss in continuing operations and gains outside of continuing operations; determining when a deferred tax liability is recognized after an investor in a foreign entity transitions to or from the equity method of accounting; accounting for tax law changes and year-to-date losses in interim periods; and determining how to apply the income tax guidance to franchise taxes that are partially based on income. For public business entities, the amendments in this Update are effective for fiscal years and interim periods within those fiscal years, beginning after December 15, 2020. For all other entities, the amendments are effective for fiscal years beginning after December 15, 2021, and interim periods within fiscal years beginning after December 15, 2022. This Update is not expected to have a significant impact on the Company’s financial statements.
In January 2020, the FASB issued ASU 2020-1, Investments - Equity Securities (Topic 321), Investments - Equity Method and Joint Ventures (Topic 323), and Derivatives and Hedging (Topic 815), to clarify that an entity should consider observable transactions that require it to either apply or discontinue the equity method of accounting for the purposes of applying the measurement alternative in accordance with Topic 321 immediately before applying or upon discontinuing the equity method. The amendments also clarify that, for the purpose of applying paragraph 815-10-15-141(a) an entity should not consider whether, upon the settlement of the forward contract or exercise of the purchased option, individually or with existing investments, the underlying securities would be accounted for under the equity method in Topic 323 or the fair value option, in accordance with the financial instruments guidance in Topic 825. An entity also would evaluate the remaining characteristics in paragraph 815-10-15-141 to determine the accounting for those forward contracts and purchased options. For public business entities, the amendments in this Update are effective for fiscal years beginning after December 15, 2020, and interim periods within those fiscal years. For all other entities, the amendments are effective for fiscal years beginning after December 15, 2021, and interim periods within those fiscal years. This Update is not expected to have a significant impact on the Company’s financial statements.
Stock Split
On September 30, 2019, the Company completed a three-for-two stock split (the “Stock Split”) of the Company’s common stock. As a result of the Stock Split, on September 30, 2019, each share of the Company’s common stock issued at that time was changed into one and one-half shares of the Company’s common stock with a stated par value of $5.55 per share. All share and per share amounts in this release, including in the accompanying financial statements and information, have been restated for all periods presented to give retroactive effect to the Stock Split.
49
NOTE 2 - ACCUMULATED OTHER COMPREHENSIVE INCOME (LOSS)
The changes in accumulated other comprehensive income (loss) by component shown, net of tax and parenthesis indicating debits to net income, as of December 31, 2019, 2018, and 2017 were as follows:
Twelve Months Ended December 31, 2019 | Twelve Months Ended December 31, 2018 | Twelve Months Ended December 31, 2017 | ||||||||||||||||||||||||||||||||||
(In Thousands) | Net Unrealized Gain (Loss) on Available for Sale Securities* | Defined Benefit Plan* | Total* | Net Unrealized Gain (Loss) on Available for Sale Securities* | Defined Benefit Plan* | Total* | Net Unrealized Gain (Loss) on Available for Sale Securities* | Defined Benefit Plan* | Total* | |||||||||||||||||||||||||||
Beginning balance | $ | ( | ) | $ | ( | ) | $ | ( | ) | $ | ( | ) | $ | ( | ) | $ | ( | ) | $ | ( | ) | $ | ( | ) | $ | ( | ) | |||||||||
Other comprehensive income (loss) before reclassifications | ( | ) | ( | ) | ( | ) | ( | ) | ||||||||||||||||||||||||||||
Amounts reclassified from accumulated other comprehensive (loss) income | ( | ) | ( | ) | ( | ) | ( | ) | ||||||||||||||||||||||||||||
Net current-period other comprehensive income (loss) | ( | ) | ( | ) | ( | ) | ||||||||||||||||||||||||||||||
Reclassification of certain income tax effects from accumulated other comprehensive loss | ( | ) | ( | ) | ( | ) | ||||||||||||||||||||||||||||||
Reclassification from adoption of 2016-01 | ( | ) | ( | ) | ||||||||||||||||||||||||||||||||
Ending balance | $ | $ | ( | ) | $ | ( | ) | $ | ( | ) | $ | ( | ) | $ | ( | ) | $ | ( | ) | $ | ( | ) | $ | ( | ) | |||||||||||
The adoption of ASU 2016-01, Financial Instruments - Overall (Subtopic 825-10): Recognition and Measurement of Financial Assets and Financial Liabilities requires equity securities to run through the income statement and therefore the reclassification of prior accumulated losses are reflected above.
The reclassifications out of accumulated other comprehensive income shown, net of tax and parenthesis indicating debits to net income, as of December 31, 2019, 2018, and 2017 were as follows:
(In Thousands) | Amount Reclassified from Accumulated Other Comprehensive Income | |||||||||||||
Details about Accumulated Other Comprehensive Income Components | Twelve Months Ended | Affected Line Item in the Consolidated Statement of Income | ||||||||||||
December 31, 2019 | December 31, 2018 | December 31, 2017 | ||||||||||||
Net realized gain (loss) on available for sale securities | $ | $ | ( | ) | $ | Securities gains (losses), net | ||||||||
Income tax effect | ( | ) | ( | ) | Income tax provision | |||||||||
$ | $ | ( | ) | $ | ||||||||||
Net unrecognized pension (expense) income | $ | ( | ) | $ | ( | ) | $ | ( | ) | Salaries and employee benefits | ||||
Income tax effect | Income tax provision | |||||||||||||
$ | ( | ) | $ | ( | ) | $ | ( | ) | ||||||
50
NOTE 3 - PER SHARE DATA
There are no convertible securities which would affect the denominator in calculating basic and dilutive earnings per share; therefore, net income as presented on the consolidated statement of income will be used as the numerator. The following table sets forth the composition of the weighted average common shares (denominator) used in the basic and dilutive per share computation.
Year Ended December 31, | |||||||||
2019 | 2018 | 2017 | |||||||
Weighted average common shares issued | |||||||||
Average treasury stock shares | ( | ) | ( | ) | ( | ) | |||
Weighted average common shares outstanding - basic | |||||||||
Dilutive effect of outstanding stock options | |||||||||
Weighted average common shares outstanding - diluted | |||||||||
There were a total of 625,800 non-qualified employee stock options (Note 14) outstanding on December 31, 2019 that had a weighted average strike price of $29.29 . Options on December 31, 2018 had an average strike price of $30.08 with a total of 395,550 options outstanding. Grants outstanding at year-end 2017 totaled to 140,250 options with an average strike price of $29.06 .
Grants were included, on a weighted average basis, in the computation of diluted earnings per share for the 2019 period for grants where the average market price of common shares exceeded the strike price of the options. These options were excluded, on a weighted average basis, in the computation of diluted earnings per share for the 2018 and 2017 periods presented due to the average market price of common shares being less than the strike price of the options.
NOTE 4 - INVESTMENT SECURITIES
The amortized cost, gross gains and losses, and fair values of investment securities at December 31, 2019 and 2018 are as follows:
2019 | ||||||||||||||||
(In Thousands) | Amortized Cost | Gross Unrealized Gains | Gross Unrealized Losses | Fair Value | ||||||||||||
Available for sale (AFS): | ||||||||||||||||
Mortgage-backed securities | $ | $ | $ | ( | ) | $ | ||||||||||
State and political securities | ( | ) | ||||||||||||||
Other debt securities | ( | ) | ||||||||||||||
Total debt securities | $ | $ | $ | ( | ) | $ | ||||||||||
Investment equity securities: | ||||||||||||||||
Financial institution equity securities | $ | $ | $ | $ | ||||||||||||
Other equity securities | ( | ) | ||||||||||||||
Total equity securities | $ | $ | $ | ( | ) | $ | ||||||||||
Trading: | ||||||||||||||||
Other equity securities | $ | $ | $ | ( | ) | $ | ||||||||||
Trading investment equity securities | $ | $ | $ | ( | ) | $ | ||||||||||
51
2018 | ||||||||||||||||
(In Thousands) | Amortized Cost | Gross Unrealized Gains | Gross Unrealized Losses | Fair Value | ||||||||||||
Available for sale (AFS): | ||||||||||||||||
Mortgage-backed securities | $ | $ | $ | ( | ) | $ | ||||||||||
State and political securities | ( | ) | ||||||||||||||
Other debt securities | ( | ) | ||||||||||||||
Total debt securities | $ | $ | $ | ( | ) | $ | ||||||||||
Investment equity securities: | ||||||||||||||||
Financial institution equity securities | $ | $ | $ | $ | ||||||||||||
Other equity securities | ( | ) | ||||||||||||||
Total equity securities | $ | $ | $ | ( | ) | $ | ||||||||||
Trading: | ||||||||||||||||
Other equity securities | $ | $ | $ | ( | ) | $ | ||||||||||
Trading investment equity securities | $ | $ | $ | ( | ) | $ | ||||||||||
The following tables show the Corporation’s gross unrealized losses and fair value, aggregated by investment category and length of time that the individual securities have been in a continuous unrealized loss position, at December 31, 2019 and 2018.
2019 | ||||||||||||||||||||||||
Less than Twelve Months | Twelve Months or Greater | Total | ||||||||||||||||||||||
Gross | Gross | Gross | ||||||||||||||||||||||
Fair | Unrealized | Fair | Unrealized | Fair | Unrealized | |||||||||||||||||||
(In Thousands) | Value | Losses | Value | Losses | Value | Losses | ||||||||||||||||||
Available for Sale (AFS) | ||||||||||||||||||||||||
Mortgage-backed securities | $ | $ | $ | $ | ( | ) | $ | $ | ( | ) | ||||||||||||||
State and political securities | ( | ) | ( | ) | ( | ) | ||||||||||||||||||
Other debt securities | ( | ) | ( | ) | ( | ) | ||||||||||||||||||
Total Debt Securities AFS | $ | $ | ( | ) | $ | $ | ( | ) | $ | $ | ( | ) | ||||||||||||
2018 | ||||||||||||||||||||||||
Less than Twelve Months | Twelve Months or Greater | Total | ||||||||||||||||||||||
Gross | Gross | Gross | ||||||||||||||||||||||
Fair | Unrealized | Fair | Unrealized | Fair | Unrealized | |||||||||||||||||||
(In Thousands) | Value | Losses | Value | Losses | Value | Losses | ||||||||||||||||||
Available for Sale (AFS) | ||||||||||||||||||||||||
Mortgage-backed securities | $ | $ | ( | ) | $ | $ | ( | ) | $ | $ | ( | ) | ||||||||||||
State and political securities | ( | ) | ( | ) | ( | ) | ||||||||||||||||||
Other debt securities | ( | ) | ( | ) | ( | ) | ||||||||||||||||||
Total Debt Securities AFS | $ | $ | ( | ) | $ | $ | ( | ) | $ | $ | ( | ) | ||||||||||||
At December 31, 2019 there were 18 individual securities in a continuous unrealized loss position for less than twelve months and 14 individual securities in a continuous unrealized loss position for greater than twelve months.
The Corporation reviews its position quarterly and has asserted that at December 31, 2019 and 2018, the declines outlined in the above table represent temporary declines and the Corporation does not intend to sell and does not believe they will be required to sell these securities before recovery of their cost basis, which may be at maturity. The Corporation has concluded that any impairment of its investment securities portfolio is not other than temporary but is the result of interest rate changes that are not expected to result in the non-collection of principal and interest during the period.
52
The amortized cost and fair value of debt securities at December 31, 2019, by contractual maturity, are shown below. Expected maturities may differ from contractual maturities since borrowers may have the right to call or prepay obligations with or without call or prepayment penalties.
(In Thousands) | Amortized Cost | Fair Value | ||||||
Due in one year or less | $ | $ | ||||||
Due after one year to five years | ||||||||
Due after five years to ten years | ||||||||
Due after ten years | ||||||||
Total | $ | $ | ||||||
Total gross proceeds from sales of securities available for sale were $23,799,000 , $19,296,000 , and $25,528,000 for 2019, 2018, and 2017, respectively. The following table represents gross realized gains and losses on those transactions:
Year Ended December 31, | ||||||||||||
(In Thousands) | 2019 | 2018 | 2017 | |||||||||
Gross realized gains: | ||||||||||||
U.S. Government and agency securities | $ | $ | $ | |||||||||
Mortgage-backed securities | ||||||||||||
State and political securities | ||||||||||||
Other debt securities | ||||||||||||
Total gross realized gains | $ | $ | $ | |||||||||
Gross realized losses: | ||||||||||||
U.S. Government and agency securities | $ | $ | $ | |||||||||
Mortgage-backed securities | ||||||||||||
State and political securities | ||||||||||||
Other debt securities | ||||||||||||
Total gross realized losses | $ | $ | $ | |||||||||
Gross realized gains: | ||||||||||||
Financial institution equity securities | $ | $ | $ | |||||||||
Other equity securities | ||||||||||||
Total gross realized gains | $ | $ | $ | |||||||||
Gross realized losses: | ||||||||||||
Financial institution equity securities | $ | $ | $ | |||||||||
Other equity securities | ||||||||||||
Total gross realized losses | $ | $ | $ | |||||||||
There were no impairment charges included in gross realized losses for the years ended December 31, 2019, 2018, and 2017.
Investment securities with a carrying value of approximately $74,163,000 and $73,327,000 at December 31, 2019 and 2018, respectively, were pledged to secure certain deposits, repurchase agreements, and for other purposes as required by law.
53
Equity securities consist of Community Reinvestment Act funds along with other smaller investments in other financial institutions. At December 31, 2019 and December 31, 2018, we had $1,261,000 and $1,776,000 , respectively, in equity securities recorded at fair value. Prior to January 1, 2018, equity securities were stated at fair value with unrealized gains and losses reported as a separate component of AOCI, net of tax. At December 31, 2017, net unrealized gains of $679,000 had been recognized in AOCI. On January 1, 2018, these unrealized gains and losses were reclassified out of AOCI and into retained earnings with subsequent changes in fair value being recognized in net equity securities gains (losses). The following is a summary of unrealized and realized gains and losses recognized in net income on equity securities during the year ended December 31, 2019:
(In Thousands) | 2019 | 2018 | |||||||
Net gain (loss) recognized in equity securities during the period | $ | $ | ( | ) | |||||
Less: Net gains realized on the sale of equity securities during the period | |||||||||
Unrealized gain (loss) recognized in equity securities held at reporting date | $ | $ | ( | ) | |||||
Net gains and losses on trading account securities are as follows for the for the years ended December 31, 2019, 2018, and 2017.
(In Thousands) | 2019 | 2018 | 2017 | |||||||||
Net gain (losses) on sales transaction | $ | $ | ( | ) | $ | |||||||
Net mark-to-market gains (losses) | ( | ) | ||||||||||
Net gain (loss) on trading account securities | $ | $ | $ | ( | ) | |||||||
There is no concentration of investments that exceed ten percent of shareholders’ equity for any individual issuer, excluding those guaranteed by the U.S. Government.
NOTE 5 - FEDERAL HOME LOAN BANK STOCK
The Banks are members of the Federal Home Loan Bank (“FHLB”) of Pittsburgh and as such, are required to maintain a minimum investment in stock of the FHLB that varies with the level of advances outstanding with the FHLB. The stock is bought from and sold to the FHLB based upon its $100 par value. The stock does not have a readily determinable fair value and as such is classified as restricted stock, carried at cost and evaluated for impairment as necessary. The stock’s value is determined by the ultimate recoverability of the par value rather than by recognizing temporary declines. The determination of whether the par value will ultimately be recovered is influenced by criteria such as the following: (a) the significance of the decline in net assets of the FHLB as compared to the capital stock amount and the length of time this situation has persisted (b) commitments by the FHLB to make payments required by law or regulation and the level of such payments in relation to the operating performance (c) the impact of legislative and regulatory changes on the customer base of the FHLB and (d) the liquidity position of the FHLB.
Management evaluated the stock and concluded that the stock was not impaired for the periods presented herein. Management considered that the FHLB maintains regulatory capital ratios in excess of all regulatory capital requirements, liquidity appears adequate, new shares of FHLB stock continue to change hands at the $100 par value, and the payment of dividends.
54
NOTE 6 - LOAN CREDIT QUALITY AND RELATED ALLOWANCE FOR LOAN LOSSES
Management segments the Banks' loan portfolio to a level that enables risk and performance monitoring according to similar risk characteristics. Loans are segmented based on the underlying collateral characteristics. Categories include commercial, financial,
and agricultural, real estate, consumer automobile, and other consumer installment loans. Real estate loans are further segmented into three categories: residential, commercial, and construction.
The following table presents the related aging categories of loans, by segment, as of December 31, 2019 and 2018:
2019 | ||||||||||||||||||||
(In Thousands) | Current | Past Due 30 To 89 Days | Past Due 90 Days Or More & Still Accruing | Non-Accrual | Total | |||||||||||||||
Commercial, financial, and agricultural | $ | $ | $ | $ | $ | |||||||||||||||
Real estate mortgage: | ||||||||||||||||||||
Residential | ||||||||||||||||||||
Commercial | ||||||||||||||||||||
Construction | ||||||||||||||||||||
Consumer automobile loans | ||||||||||||||||||||
Other consumer installment loans | ||||||||||||||||||||
$ | $ | $ | ||||||||||||||||||
Net deferred loan fees and discounts | ||||||||||||||||||||
Allowance for loan losses | ( | ) | ( | ) | ||||||||||||||||
Loans, net | $ | $ | ||||||||||||||||||
2018 | ||||||||||||||||||||
(In Thousands) | Current | Past Due 30 To 89 Days | Past Due 90 Days Or More & Still Accruing | Non-Accrual | Total | |||||||||||||||
Commercial, financial, and agricultural | $ | $ | $ | $ | $ | |||||||||||||||
Real estate mortgage: | ||||||||||||||||||||
Residential | ||||||||||||||||||||
Commercial | ||||||||||||||||||||
Construction | ||||||||||||||||||||
Consumer automobile loans | ||||||||||||||||||||
Other consumer installment loans | ||||||||||||||||||||
$ | $ | $ | ||||||||||||||||||
Net deferred loan fees and discounts | ||||||||||||||||||||
Allowance for loan losses | ( | ) | ( | ) | ||||||||||||||||
Loans, net | $ | $ | ||||||||||||||||||
55
The following table presents the interest income if interest had been recorded based on the original loan agreement terms and rate of interest for non-accrual loans and interest income recognized on a cash basis for non-accrual loans as of December 31, 2019, 2018, and 2017:
Year Ended December 31, | ||||||||||||||||||||||||
2019 | 2018 | 2017 | ||||||||||||||||||||||
(In Thousands) | Interest Income That Would Have Been Recorded Based on Original Term and Rate | Interest Income Recorded on a Cash Basis | Interest Income That Would Have Been Recorded Based on Original Term and Rate | Interest Income Recorded on a Cash Basis | Interest Income That Would Have Been Recorded Based on Original Term and Rate | Interest Income Recorded on a Cash Basis | ||||||||||||||||||
Commercial, financial, and agricultural | $ | $ | $ | $ | $ | $ | ||||||||||||||||||
Real estate mortgage: | ||||||||||||||||||||||||
Residential | ||||||||||||||||||||||||
Commercial | ||||||||||||||||||||||||
Construction | ||||||||||||||||||||||||
Consumer automobile loans | ||||||||||||||||||||||||
Other consumer installment loans | ||||||||||||||||||||||||
$ | $ | $ | $ | $ | $ | |||||||||||||||||||
Impaired Loans
Impaired loans are loans for which it is probable the Banks will not be able to collect all amounts due according to the contractual terms of the loan agreement. The Banks individually evaluate such loans for impairment and do not aggregate loans by major risk classifications. The definition of “impaired loans” is not the same as the definition of “non-accrual loans,” although the two categories overlap. The Banks may choose to place a loan on non-accrual status due to payment delinquency or uncertain collectability, while not classifying the loan as impaired. Factors considered by management in determining impairment include payment status and collateral value. The amount of impairment for these types of loans is determined by the difference between the present value of the expected cash flows related to the loan, using the original interest rate, and its recorded value, or as a practical expedient in the case of collateralized loans, the difference between the fair value of the collateral and the recorded amount of the loan. When foreclosure is probable, impairment is measured based on the fair value of the collateral.
Management evaluates individual loans in all of the commercial segments for possible impairment if the loan is greater than $100,000 and if the loan is either on non-accrual status or has a risk rating of substandard or worse. Management may also elect to measure an individual loan for impairment if less than $100,000 on a case by case basis.
Mortgage loans on one-to-four family properties and all consumer loans are large groups of smaller-balance homogeneous loans and are measured for impairment collectively with the exception of loans identified as troubled debt restructurings. Loans that experience insignificant payment delays, which are defined as 90 days or less, generally are not classified as impaired. Management determines the significance of payment delays on a case-by-case basis taking into consideration all circumstances surrounding the loan and the borrower including the length of the delay, the borrower’s prior payment record, and the amount of shortfall in relation to the principal and interest owed. Interest income for impaired loans is recorded consistent to the Banks' policy.
56
The following table presents the recorded investment, unpaid principal balance, and related allowance of impaired loans by segment as of December 31, 2019 and 2018:
2019 | ||||||||||||
(In Thousands) | Recorded Investment | Unpaid Principal Balance | Related Allowance | |||||||||
With no related allowance recorded: | ||||||||||||
Commercial, financial, and agricultural | $ | $ | $ | — | ||||||||
Real estate mortgage: | ||||||||||||
Residential | — | |||||||||||
Commercial | — | |||||||||||
Construction | — | |||||||||||
Consumer automobile loans | — | |||||||||||
Other consumer installment loans | — | |||||||||||
— | ||||||||||||
With an allowance recorded: | ||||||||||||
Commercial, financial, and agricultural | ||||||||||||
Real estate mortgage: | ||||||||||||
Residential | ||||||||||||
Commercial | ||||||||||||
Construction | ||||||||||||
Consumer automobile loans | ||||||||||||
Other consumer installment loans | ||||||||||||
Total: | ||||||||||||
Commercial, financial, and agricultural | ||||||||||||
Real estate mortgage: | ||||||||||||
Residential | ||||||||||||
Commercial | ||||||||||||
Construction | ||||||||||||
Consumer automobile loans | ||||||||||||
Other consumer installment loans | ||||||||||||
$ | $ | $ | ||||||||||
57
2018 | ||||||||||||
(In Thousands) | Recorded Investment | Unpaid Principal Balance | Related Allowance | |||||||||
With no related allowance recorded: | ||||||||||||
Commercial, financial, and agricultural | $ | $ | $ | — | ||||||||
Real estate mortgage: | ||||||||||||
Residential | — | |||||||||||
Commercial | — | |||||||||||
Construction | — | |||||||||||
Consumer automobile loans | — | |||||||||||
Other consumer installment loans | — | |||||||||||
— | ||||||||||||
With an allowance recorded: | ||||||||||||
Commercial, financial, and agricultural | ||||||||||||
Real estate mortgage: | ||||||||||||
Residential | ||||||||||||
Commercial | ||||||||||||
Construction | ||||||||||||
Consumer automobile loans | ||||||||||||
Other consumer installment loans | ||||||||||||
Total: | ||||||||||||
Commercial, financial, and agricultural | ||||||||||||
Real estate mortgage: | ||||||||||||
Residential | ||||||||||||
Commercial | ||||||||||||
Construction | ||||||||||||
Consumer automobile loans | ||||||||||||
Other consumer installment loans | ||||||||||||
$ | $ | $ | ||||||||||
The following table presents the average recorded investment in impaired loans and related interest income recognized for December 31, 2019, 2018, and 2017:
2019 | ||||||||||||
(In Thousands) | Average Investment in Impaired Loans | Interest Income Recognized on an Accrual Basis on Impaired Loans | Interest Income Recognized on a Cash Basis on Impaired Loans | |||||||||
Commercial, financial, and agricultural | $ | $ | $ | |||||||||
Real estate mortgage: | ||||||||||||
Residential | ||||||||||||
Commercial | ||||||||||||
Construction | ||||||||||||
Consumer automobile loans | ||||||||||||
Other consumer installment loans | ||||||||||||
$ | $ | $ | ||||||||||
58
2018 | ||||||||||||
(In Thousands) | Average Investment in Impaired Loans | Interest Income Recognized on an Accrual Basis on Impaired Loans | Interest Income Recognized on a Cash Basis on Impaired Loans | |||||||||
Commercial, financial, and agricultural | $ | $ | $ | |||||||||
Real estate mortgage: | ||||||||||||
Residential | ||||||||||||
Commercial | ||||||||||||
Construction | ||||||||||||
Consumer automobile loans | ||||||||||||
Other consumer installment loans | ||||||||||||
$ | $ | $ | ||||||||||
2017 | ||||||||||||
(In Thousands) | Average Investment in Impaired Loans | Interest Income Recognized on an Accrual Basis on Impaired Loans | Interest Income Recognized on a Cash Basis on Impaired Loans | |||||||||
Commercial, financial, and agricultural | $ | $ | $ | |||||||||
Real estate mortgage: | ||||||||||||
Residential | ||||||||||||
Commercial | ||||||||||||
Construction | ||||||||||||
Consumer automobile loans | ||||||||||||
Other consumer installment loans | ||||||||||||
$ | $ | $ | ||||||||||
Modifications
The loan portfolio also includes certain loans that have been modified in a Troubled Debt Restructuring ("TDR"), where economic concessions have been granted to borrowers who have experienced or are expected to experience financial difficulties. These concessions typically result from loss mitigation activities and could include reductions in the interest rate, payment extensions, forgiveness of principal, forbearance, or other actions. Certain TDRs are classified as nonperforming at the time of restructure and may only be returned to performing status after considering the borrower’s sustained repayment performance for a reasonable period, generally six months .
Loan modifications that are considered TDRs completed during the twelve months ended December 31, 2019 and 2018 were as follows:
Year Ended December 31, | ||||||||||||||||||||||
2019 | 2018 | |||||||||||||||||||||
(In Thousands, Except Number of Contracts) | Number of Contracts | Pre-Modification Outstanding Recorded Investment | Post-Modification Outstanding Recorded Investment | Number of Contracts | Pre-Modification Outstanding Recorded Investment | Post-Modification Outstanding Recorded Investment | ||||||||||||||||
Commercial, financial, and agricultural | $ | $ | $ | $ | ||||||||||||||||||
Real estate mortgage: | ||||||||||||||||||||||
Residential | ||||||||||||||||||||||
Commercial | ||||||||||||||||||||||
Construction | ||||||||||||||||||||||
Other consumer installment loans | ||||||||||||||||||||||
Total | $ | $ | $ | $ | ||||||||||||||||||
59
Of the five new troubled debt restructurings that were granted for the year ended December 31, 2019, four loans totaling $$4,062,000 were granted rate concessions and one loan totaling $$2,167,000 was granted a payment concession.
Of the five new troubled debt restructurings that were granted for the year ended December 31, 2018, four loans totaling $1,546,000 were granted payment concessions and one loan totaling $6,000 was granted a term concession.
Loan modifications considered troubled debt restructurings made during the twelve months previous to December 31, 2019 and December 31, 2018, that have defaulted during the corresponding twelve month period were as follows:
Year Ended December 31, 2019 | Year Ended December 31, 2018 | |||||||||||||
(In Thousands, Except Number of Contracts) | Number of Contracts | Recorded Investment | Number of Contracts | Recorded Investment | ||||||||||
Commercial, financial, and agricultural | $ | $ | ||||||||||||
Real estate mortgage: | ||||||||||||||
Residential | ||||||||||||||
Commercial | ||||||||||||||
Total | $ | $ | ||||||||||||
Internal Risk Ratings
Management uses a ten point internal risk rating system to monitor the credit quality of the overall loan portfolio. The first six categories are considered not criticized, and are aggregated as “Pass” rated. The criticized rating categories utilized by management generally follow bank regulatory definitions. The Special Mention category includes assets that are currently protected but are potentially weak, resulting in an undue and unwarranted credit risk, but not to the point of justifying a Substandard classification. Loans in the Substandard category have well-defined weaknesses that jeopardize the liquidation of the debt, and have a distinct possibility that some loss will be sustained if the weaknesses are not corrected. All loans greater than 90 days past due are evaluated for Substandard classification. Loans in the Doubtful category exhibit the same weaknesses found in the Substandard loans, however, the weaknesses are more pronounced. Such loans are static and collection in full is improbable. However, these loans are not yet rated as loss because certain events may occur which would salvage the debt. Loans classified Loss are considered uncollectible and charge-off is imminent.
To help ensure that risk ratings are accurate and reflect the present and future capacity of borrowers to repay a loan as agreed, the Banks have a structured loan rating process with several layers of internal and external oversight. Generally, consumer and residential mortgage loans are included in the pass category unless a specific action, such as bankruptcy, repossession, or death occurs to raise awareness of a possible credit event. An external semi-annual loan review of large commercial relationships is performed, as well as a sample of smaller transactions. During 2019, the threshold for the annual loan review was commercial relationships $1,750,000 or greater for JSSB and $1,500,000 or greater for Luzerne. Confirmation of the appropriate risk category is included in the review. Detailed reviews, including plans for resolution, are performed on loans classified as Substandard, Doubtful, or Loss on a quarterly basis.
The following table presents the credit quality categories identified above as of December 31, 2019 and 2018:
2019 | ||||||||||||||||||||||||||||
Commercial, Finance, and Agricultural | Real Estate Mortgages | Consumer automobile | Other consumer installment | |||||||||||||||||||||||||
(In Thousands) | Residential | Commercial | Construction | Totals | ||||||||||||||||||||||||
Pass | $ | $ | $ | $ | $ | $ | $ | |||||||||||||||||||||
Special Mention | ||||||||||||||||||||||||||||
Substandard | ||||||||||||||||||||||||||||
Total | $ | $ | $ | $ | $ | $ | $ | |||||||||||||||||||||
60
2018 | ||||||||||||||||||||||||||||
Commercial, Finance, and Agricultural | Real Estate Mortgages | Consumer automobile | Other consumer installment | |||||||||||||||||||||||||
(In Thousands) | Residential | Commercial | Construction | Totals | ||||||||||||||||||||||||
Pass | $ | $ | $ | $ | $ | $ | $ | |||||||||||||||||||||
Special Mention | ||||||||||||||||||||||||||||
Substandard | ||||||||||||||||||||||||||||
Total | $ | $ | $ | $ | $ | $ | $ | |||||||||||||||||||||
Allowance for Loan Losses
An allowance for loan losses (“ALL”) is maintained to absorb losses from the loan portfolio. The ALL is based on management’s continuing evaluation of the risk characteristics and credit quality of the loan portfolio, assessment of current economic conditions, diversification and size of the portfolio, adequacy of collateral, past and anticipated future loss experience, and the amount of non-performing loans.
The Banks' methodology for determining the ALL is based on the requirements of ASC Section 310-10-35 for loans individually evaluated for impairment (previously discussed) and ASC Subtopic 450-20 for loans collectively evaluated for impairment, as well as the Interagency Policy Statements on the Allowance for Loan and Lease Losses and other bank regulatory guidance. The total of the two components represents the Banks' ALL.
Loans that are collectively evaluated for impairment are analyzed with general allowances being made as appropriate. Allowances are segmented based on collateral characteristics previously disclosed, and consistent with credit quality monitoring. Loans that are collectively evaluated for impairment are grouped into two classes for evaluation. A general allowance is determined for “Pass” rated credits, while a separate pool allowance is provided for “Criticized” rated credits that are not individually evaluated for impairment.
For the general allowances historical loss trends are used in the estimation of losses in the current portfolio. These historical loss amounts are modified by other qualitative factors. A historical charge-off factor is calculated utilizing a twelve quarter moving average. However, management may adjust the moving average time frame by up to four quarters to adjust for variances in the economic cycle. Management has identified a number of additional qualitative factors which it uses to supplement the historical charge-off factor because these factors are likely to cause estimated credit losses associated with the existing loan pools to differ from historical loss experience. The additional factors that are evaluated quarterly and updated using information obtained from internal, regulatory, and governmental sources are: levels of and trends in delinquency rates and non-accrual loans; trends in volumes and terms of loans; effects of changes in lending policies; experience, ability, and depth of lending staff; national and economic trends and conditions; concentrations of credit from a loan type, industry, and/or geographic standpoint; value of underlying collateral on collateral depended loans; effect of other external factors; and the quality of the loan review system. The installment loans qualitative factor was decreased by 5 basis points due to the leveling off of indirect loan volume. The qualitative factor for constructions loans was elevated in previous years due to losses in this category. This has not been the case for some time, thus this factor was decreased by 10 basis points. Additionally, our overall lender experience and abilities are stable, which justifies a decrease in our experience factor.
Loans in the criticized pools, which possess certain qualities or characteristics that may lead to collection and loss issues, are closely monitored by management and subject to additional qualitative factors. Management also monitors industry loss factors by loan segment for applicable adjustments to actual loss experience.
Management reviews the loan portfolio on a quarterly basis in order to make appropriate and timely adjustments to the ALL. When information confirms all or part of specific loans to be uncollectible, these amounts are promptly charged off against the ALL.
Over the last three years, various quantitative and qualitative factors indicate changes in our provision for loan losses. The provision for commercial and agricultural loans increased due to levels and trends of delinquencies in our portfolio. The change in the provision for residential real estate loans vary based on our observations of industry trends during 2019 in national and market area foreclosure rates. The provision for this loan type is adjusted by national indices as well as our historical losses. The provision for commercial and construction real estate loans declined as losses have been minimal and there has been improved trends in delinquency rates.The provision for consumer automobiles decreased due to leveling off of indirect loan volume. The provision for other consumer installment loans has increased based on national and economic trends.
61
Activity in the allowance is presented for the twelve months ended December 31, 2019, 2018, and 2017:
2019 | ||||||||||||||||||||||||||||||||
Commercial, Finance, and Agricultural | Real Estate Mortgages | Consumer automobile | Other consumer installment | |||||||||||||||||||||||||||||
(In Thousands) | Residential | Commercial | Construction | Unallocated | Totals | |||||||||||||||||||||||||||
Beginning Balance | $ | $ | $ | $ | $ | $ | $ | $ | ||||||||||||||||||||||||
Charge-offs | ( | ) | ( | ) | ( | ) | ( | ) | ( | ) | ( | ) | ||||||||||||||||||||
Recoveries | ||||||||||||||||||||||||||||||||
Provision | ( | ) | ( | ) | ( | ) | ( | ) | ||||||||||||||||||||||||
Ending Balance | $ | $ | $ | $ | $ | $ | $ | $ | ||||||||||||||||||||||||
2018 | ||||||||||||||||||||||||||||||||
Commercial, Finance, and Agricultural | Real Estate Mortgages | Consumer automobile | Other consumer installment | |||||||||||||||||||||||||||||
(In Thousands) | Residential | Commercial | Construction | Unallocated | Totals | |||||||||||||||||||||||||||
Beginning Balance | $ | $ | $ | $ | $ | $ | $ | $ | ||||||||||||||||||||||||
Charge-offs | ( | ) | ( | ) | ( | ) | ( | ) | ( | ) | ( | ) | ||||||||||||||||||||
Recoveries | ||||||||||||||||||||||||||||||||
Provision | ( | ) | ( | ) | ||||||||||||||||||||||||||||
Ending Balance | $ | $ | $ | $ | $ | $ | $ | $ | ||||||||||||||||||||||||
2017 | ||||||||||||||||||||||||||||||||
Commercial, Finance, and Agricultural | Real Estate Mortgages | Consumer automobile | Other consumer installment | |||||||||||||||||||||||||||||
(In Thousands) | Residential | Commercial | Construction | Unallocated | Totals | |||||||||||||||||||||||||||
Beginning Balance | $ | $ | $ | $ | $ | $ | $ | $ | ||||||||||||||||||||||||
Charge-offs | ( | ) | ( | ) | ( | ) | ( | ) | ( | ) | ( | ) | ||||||||||||||||||||
Recoveries | ||||||||||||||||||||||||||||||||
Provision | ( | ) | ( | ) | ( | ) | ||||||||||||||||||||||||||
Ending Balance | $ | $ | $ | $ | $ | $ | $ | $ | ||||||||||||||||||||||||
The Corporation grants commercial, industrial, residential, and installment loans to customers throughout north-central and north-eastern Pennsylvania. Although the Corporation has a diversified loan portfolio at December 31, 2019 and 2018, a substantial portion of its debtors’ ability to honor their contracts is dependent on the economic conditions within this region.
The amount of foreclosed residential real estate held at December 31, 2019 and December 31, 2018, totaled $493,000 and $624,000 , respectively. Consumer mortgage loans secured by residential real estate properties for which formal foreclosure proceedings are in process at December 31, 2019 and December 31, 2018, totaled $32,000 and $167,000 , respectively.
The Corporation has a concentration of loans at December 31, 2019 and 2018 as follows:
2019 | 2018 | |||||
Owners of residential rental properties | % | % | ||||
Owners of commercial rental properties | % | % | ||||
62
The following table presents the balance in the allowance for loan losses and the recorded investment in loans by portfolio segment and based on impairment method as of December 31, 2019 and 2018:
2019 | ||||||||||||||||||||||||||||||||
Commercial, Finance, and Agricultural | Real Estate Mortgages | Consumer automobile | Other consumer installment | Unallocated | Totals | |||||||||||||||||||||||||||
(In Thousands) | Residential | Commercial | Construction | |||||||||||||||||||||||||||||
Allowance for Loan Losses: | ||||||||||||||||||||||||||||||||
Ending allowance balance attributable to loans: | ||||||||||||||||||||||||||||||||
Individually evaluated for impairment | $ | $ | $ | $ | $ | $ | $ | $ | ||||||||||||||||||||||||
Collectively evaluated for impairment | ||||||||||||||||||||||||||||||||
Total ending allowance balance | $ | $ | $ | $ | $ | $ | $ | $ | ||||||||||||||||||||||||
Loans: | ||||||||||||||||||||||||||||||||
Individually evaluated for impairment | $ | $ | $ | $ | $ | $ | $ | |||||||||||||||||||||||||
Collectively evaluated for impairment | ||||||||||||||||||||||||||||||||
Total ending loans balance | $ | $ | $ | $ | $ | $ | $ | |||||||||||||||||||||||||
2018 | ||||||||||||||||||||||||||||||||
Commercial, Finance, and Agricultural | Real Estate Mortgages | Consumer automobile | Other consumer installment | Unallocated | Totals | |||||||||||||||||||||||||||
(In Thousands) | Residential | Commercial | Construction | |||||||||||||||||||||||||||||
Allowance for Loan Losses: | ||||||||||||||||||||||||||||||||
Ending allowance balance attributable to loans: | ||||||||||||||||||||||||||||||||
Individually evaluated for impairment | $ | $ | $ | $ | $ | $ | $ | $ | ||||||||||||||||||||||||
Collectively evaluated for impairment | ||||||||||||||||||||||||||||||||
Total ending allowance balance | $ | $ | $ | $ | $ | $ | $ | $ | ||||||||||||||||||||||||
Loans: | ||||||||||||||||||||||||||||||||
Individually evaluated for impairment | $ | $ | $ | $ | $ | $ | $ | |||||||||||||||||||||||||
Collectively evaluated for impairment | ||||||||||||||||||||||||||||||||
Total ending loans balance | $ | $ | $ | $ | $ | $ | $ | |||||||||||||||||||||||||
NOTE 7 - PREMISES AND EQUIPMENT
Major classifications of premises and equipment are summarized as follows at December 31, 2019 and 2018:
(In Thousands) | 2019 | 2018 | ||||||
Land | $ | $ | ||||||
Premises | ||||||||
Furniture and equipment | ||||||||
Leasehold improvements | ||||||||
Finance lease right-of-use assets | — | |||||||
Total | ||||||||
Less accumulated depreciation and amortization | ||||||||
Net premises and equipment | $ | $ | ||||||
Depreciation and amortization related to premises and equipment for the years ended 2019, 2018, and 2017 was $2,053,000 $1,789,000 , and $1,659,000 , respectively.
63
NOTE 8 - GOODWILL AND OTHER INTANGIBLES
As of December 31, 2019 and 2018, goodwill had a gross carrying value of $17,380,000 and accumulated amortization of $276,000 resulting in a net carrying amount of $17,104,000 .
The gross carrying amount of goodwill is tested for impairment in the third quarter of each fiscal year. Based on the fair value of the reporting unit, estimated using the expected present value of future cash flows, there was no evidence of impairment of the carrying amount at December 31, 2019 or 2018.
Identifiable intangibles are amortized to their estimated residual values over the expected useful lives. Such lives are also periodically reassessed to determine if any amortization period adjustments are required. Since the acquisition, no such adjustments were recorded. The identifiable intangible assets consist of a core deposit intangible and a trade name intangible which are being amortized on an accelerated basis, and also book of business intangible that is being amortized on a straight-line basis over the useful life of such assets. The net carrying amount of the core deposit intangible, the trade name intangible, and the book of business intangible at December 31, 2019 was $262,000 , $19,000 , and $617,000 respectively, with $1,619,000 , $114,000 , and $403,000 accumulated amortization as of that date.
As of December 31, 2019, the estimated future amortization expense for the core deposit and trade name intangible was:
(In Thousands) | Core Deposit Intangible | Trade Name Intangible | Book of Business Intangible | Total | ||||||||||||
2020 | $ | $ | $ | $ | ||||||||||||
2021 | ||||||||||||||||
2022 | ||||||||||||||||
2023 | ||||||||||||||||
2024 | ||||||||||||||||
2025 | ||||||||||||||||
2026 | ||||||||||||||||
$ | $ | $ | $ | |||||||||||||
NOTE 9 - TIME DEPOSITS
Time deposits of $250,000 or more totaled approximately $70,962,000 on December 31, 2019 and $49,826,000 on December 31, 2018. Interest expense on time deposits of $100,000 or more was approximately $4,159,000 , $2,238,000 , and $1,479,000 , for the years ended December 31, 2019, 2018, and 2017, respectively.
At December 31, 2019, the scheduled maturities on time deposits of $100,000 or more are as follows:
(In Thousands) | 2019 | |||
Three months or less | $ | |||
Three months to six months | ||||
Six months to twelve months | ||||
Over twelve months | ||||
Total | $ | |||
64
Total time deposit maturities are as follows at December 31, 2019:
(In Thousands) | 2019 | |||
2020 | $ | |||
2021 | ||||
2022 | ||||
2023 | ||||
2024 | ||||
Thereafter | ||||
Total | $ | |||
NOTE 10 - SHORT-TERM BORROWINGS
Short-term borrowings consist of securities sold under agreements to repurchase and primarily FHLB advances, which generally represent overnight or less than six month borrowings. In addition to the outstanding balances noted below, the Banks also have additional lines of credit totaling $57,000,000 available from correspondent banks other than the FHLB. The outstanding balances and related information for short-term borrowings are summarized as follows at December 31, 2019, 2018, and 2017:
(In Thousands) | 2019 | 2018 | 2017 | |||||||||
Repurchase Agreements: | ||||||||||||
Balance at year end | $ | $ | $ | |||||||||
Maximum amount outstanding at any month end | ||||||||||||
Average balance outstanding during the year | ||||||||||||
Weighted-average interest rate: | ||||||||||||
At year end | % | % | % | |||||||||
Paid during the year | % | % | % | |||||||||
Overnight: | ||||||||||||
Balance at year end | $ | $ | $ | |||||||||
Maximum amount outstanding at any month end | ||||||||||||
Average balance outstanding during the year | ||||||||||||
Weighted-average interest rate: | ||||||||||||
At year end | % | % | % | |||||||||
Paid during the year | % | % | % | |||||||||
We utilize securities sold under agreements to repurchase to facilitate the needs of our customers and to facilitate secured short-term funding needs. Securities sold under agreements to repurchase are stated at the amount of cash received in connection with the transaction. We monitor collateral levels on a continuous basis. We may be required to provide additional collateral based on the fair value of the underlying securities. Securities pledged as collateral under repurchase agreements are maintained with our safekeeping agents.The remaining contractual maturity of repurchase agreements in the consolidated balance sheets as of December 31, 2019 and December 31, 2018 is presented in the following tables.
2019 | 2018 | |||||||
Remaining Contractual Maturity of the Agreements | ||||||||
(In Thousands) | Overnight and Continuous | Overnight and Continuous | ||||||
Repurchase Agreements: | ||||||||
Mortgage-backed securities | $ | $ | ||||||
State and political securities | ||||||||
Other debt securities | ||||||||
Total carrying value of collateral pledged | $ | $ | ||||||
Total liability recognized for repurchase agreements | $ | $ | ||||||
65
NOTE 11 - LONG-TERM BORROWINGS
The following represents outstanding long-term borrowings with the FHLB by contractual maturities at December 31, 2019 and 2018:
(In Thousands) | Weighted Average Interest Rate | Stated Interest Rate Range | ||||||||||||||||||||
Description | Maturity | 2019 | 2018 | From | To | 2019 | 2018 | |||||||||||||||
Fixed | 2019 | % | % | % | % | $ | $ | |||||||||||||||
Fixed | 2020 | % | % | % | % | |||||||||||||||||
Fixed | 2021 | % | % | % | % | |||||||||||||||||
Fixed | 2022 | % | % | % | % | |||||||||||||||||
Fixed | 2023 | % | % | % | % | |||||||||||||||||
Fixed | 2024 | % | % | % | % | |||||||||||||||||
Total Fixed | % | % | ||||||||||||||||||||
Total | % | % | $ | $ | ||||||||||||||||||
(In Thousands) Year Ending December 31, | Amount | Weighted Average Rate | |||||
2020 | $ | % | |||||
2021 | % | ||||||
2022 | % | ||||||
2023 | % | ||||||
2024 | % | ||||||
$ | % | ||||||
The Banks maintain a credit arrangement which includes a revolving line of credit with the FHLB. Under this credit arrangement, at December 31, 2019, JSSB has a remaining borrowing capacity of $261,836,000 and Luzerne has a remaining capacity of $176,121,000 , which are subject to annual renewal and typically incur no service charges. Under terms of a blanket agreement, collateral for the FHLB borrowings must be secured by certain qualifying assets of each Bank which consist principally of first mortgage loans and state and political securities, along with other securities. Total outstanding letters of credit at December 31, 2019 with the FHLB for JSSB are $28,550,000 while Luzerne has $582,000 outstanding.
66
NOTE 12 - INCOME TAXES
The following temporary differences gave rise to the net deferred tax asset position at December 31, 2019 and 2018:
(In Thousands) | 2019 | 2018 | ||||||
Deferred tax assets: | ||||||||
Allowance for loan losses | $ | $ | ||||||
Deferred compensation | ||||||||
Lease liability | ||||||||
Defined pension | ||||||||
Deferred loan fees and discounts | ||||||||
Investment securities allowance | ||||||||
Unrealized loss on available for sale securities | ||||||||
Other | ||||||||
Total | ||||||||
Deferred tax liabilities: | ||||||||
Lease right of use asset | ||||||||
Unrealized gain on available for sale securities | ||||||||
Investment security accretion | ||||||||
Deferred loan fees and discounts | ||||||||
Depreciation | ||||||||
Amortization | ||||||||
Total | ||||||||
Deferred tax asset, net | $ | $ | ||||||
The provision or benefit for income taxes is comprised of the following for the year ended December 31, 2019, 2018, and 2017:
(In Thousands) | 2019 | 2018 | 2017 | |||||||||
Currently payable | $ | $ | $ | |||||||||
Deferred expense (benefit) | ( | ) | ( | ) | ||||||||
Change in corporate tax rate | ||||||||||||
Total provision | $ | $ | $ | |||||||||
A reconciliation between the expected income tax or benefit and the effective income tax rate on income before income tax provision or benefit follows for the year ended December 31, 2019, 2018, and 2017:
2019 | 2018 | 2017 | |||||||||||||||||||
(In Thousands) | Amount | % | Amount | % | Amount | % | |||||||||||||||
Provision at expected rate | $ | % | $ | % | $ | % | |||||||||||||||
(Decrease) increase in tax resulting from: | |||||||||||||||||||||
Tax-exempt income | ( | ) | ( | ) | ( | ) | ( | ) | ( | ) | ( | ) | |||||||||
Tax credits | ( | ) | ( | ) | ( | ) | ( | ) | ( | ) | ( | ) | |||||||||
Change in corporate tax rate | |||||||||||||||||||||
Other, net | ( | ) | ( | ) | ( | ) | ( | ) | ( | ) | ( | ) | |||||||||
Effective income tax provision and rate | $ | % | $ | % | $ | % | |||||||||||||||
67
NOTE 13 - EMPLOYEE BENEFIT PLANS
Defined Benefit Pension Plan
The Corporation has a noncontributory defined benefit pension plan (the “Plan”) for all employees meeting certain age and length of service requirements that were hired prior to January 1, 2004, at which time entrance into the Plan was frozen. The benefit accrual for the Plan was subsequently frozen at December 31, 2014. Benefits are based primarily on years of service and the average annual compensation during the highest five consecutive years within the final ten years of employment, until December 31, 2014 when the benefit accrual was frozen.
The following table sets forth the obligation and funded status as of December 31, 2019 and 2018:
(In Thousands) | 2019 | 2018 | ||||||
Change in benefit obligation: | ||||||||
Benefit obligation at beginning of year | $ | $ | ||||||
Interest cost | ||||||||
Actuarial loss | ||||||||
Benefits paid | ( | ) | ( | ) | ||||
Change in actuarial assumptions | ( | ) | ||||||
Benefit obligation at end of year | $ | $ | ||||||
Change in plan assets: | ||||||||
Fair value of plan assets at beginning of year | $ | $ | ||||||
Actual return on plan assets | ( | ) | ||||||
Employer contribution | ||||||||
Benefits paid | ( | ) | ( | ) | ||||
Adjustment to fair value of plan assets | ||||||||
Fair value of plan assets at end of year | ||||||||
Funded status | $ | ( | ) | $ | ( | ) | ||
Accounts recognized on balance sheet as: | ||||||||
Total liabilities | $ | ( | ) | $ | ( | ) | ||
Amounts not yet recognized as a component of net periodic pension cost: | ||||||||
Amounts recognized in accumulated other comprehensive income (loss) consist of: | ||||||||
Net loss | $ | $ | ||||||
The accumulated benefit obligation for the Plan was $21,456,000 and $19,022,000 at December 31, 2019 and 2018, respectively.
Components of Net Periodic Cost and Other Amounts Recognized in Other Comprehensive Income (Loss) as of December 31, 2019, 2018, and 2017 are as follows:
(In Thousands) | 2019 | 2018 | 2017 | |||||||||
Net periodic pension cost: | ||||||||||||
Service cost | $ | $ | $ | |||||||||
Interest cost | ||||||||||||
Expected return on plan assets | ( | ) | ( | ) | ( | ) | ||||||
Amortization of unrecognized net loss | ||||||||||||
Net periodic (benefit) cost | $ | ( | ) | $ | ( | ) | $ | |||||
68
Assumptions
Weighted-average assumptions used to determine benefit obligations at December 31, 2019, 2018, and 2017:
2019 | 2018 | 2017 | ||||||
Discount rate | % | % | % | |||||
Rate of compensation increase | N/A | N/A | N/A | |||||
Weighted-average assumptions used to determine net periodic cost for years ended December 31, 2019, 2018, and 2017:
2019 | 2018 | 2017 | ||||||
Discount rate | % | % | % | |||||
Expected long-term return on plan assets | % | % | % | |||||
The expected long-term rate of return was estimated using market benchmarks by which the plan assets would outperform the market value in the future, based on historical experience adjusted for changes in asset allocation and expectations for overall lower future returns on similar investments compared to past periods.
Plan Assets
The Plan’s weighted-average asset allocations at December 31, 2019 and 2018 by asset category are as follows:
Asset Category | 2019 | 2018 | ||||
Cash | % | % | ||||
Fixed income securities | % | % | ||||
Equity | % | % | ||||
Inflation Hedges/Real Assets | % | % | ||||
Hedged Strategies | % | % | ||||
Total | % | % | ||||
The investment objective for the Plan is to maximize total return with tolerance for slightly above average risk, meaning the fund is able to tolerate short-term volatility to achieve above-average returns over the long term.
Asset allocation favors equities, with target allocation of approximately 62 % equity securities, 15.0 % fixed income securities, 10 % inflation hedges/real assets, 10 % hedged strategies, and 3 % cash. Due to volatility in the market, the target allocation is not always desirable and asset allocations will fluctuate between the acceptable ranges. The equity portfolio’s exposure is primarily in mid and large capitalization domestic equities with limited exposure to small capitalization and international stocks.
It is management’s intent to give the investment managers flexibility, within the overall guidelines, with respect to investment decisions and their timing. However, certain investments require specific review and approval by management. Management is also informed of anticipated, significant modifications of any previously approved investment, or anticipated use of derivatives to execute investment strategies.
69
The following table sets forth by level, within the fair value hierarchy detailed in Note 21 - Fair Value Measurements, the Plan’s assets at fair value as of December 31, 2019 and 2018:
2019 | ||||||||||||||||
(In Thousands) | Level I | Level II | Level III | Total | ||||||||||||
Assets: | ||||||||||||||||
Cash and cash equivalents | $ | $ | $ | $ | ||||||||||||
Mutual funds - taxable fixed income | ||||||||||||||||
Mutual funds - domestic equity | ||||||||||||||||
Mutual funds - international equity | ||||||||||||||||
Inflation Hedges/Real Assets | ||||||||||||||||
Hedged Strategies | ||||||||||||||||
Total assets at fair value | $ | $ | $ | $ | ||||||||||||
2018 | ||||||||||||||||
(In Thousands) | Level I | Level II | Level III | Total | ||||||||||||
Assets: | ||||||||||||||||
Cash and cash equivalents | $ | $ | $ | $ | ||||||||||||
Mutual funds - taxable fixed income | ||||||||||||||||
Mutual funds - domestic equity | ||||||||||||||||
Mutual funds - international equity | ||||||||||||||||
Inflation Hedges/Real Assets | ||||||||||||||||
Hedged Strategies | ||||||||||||||||
Total assets at fair value | $ | $ | $ | $ | ||||||||||||
The following future benefit payments are expected to be paid:
(In Thousands) | |||
2020 | $ | ||
2021 | |||
2022 | |||
2023 | |||
2024 | |||
2025-2029 | |||
$ | |||
The Corporation expects to contribute a minimum of $500,000 to its Pension Plan in 2020.
401(k) Savings Plan
The Corporation also offers a 401(k) savings plan in which eligible participating employees may elect to contribute up to a maximum percentage allowable not to exceed the limits of Code Sections 401(k), 404, and 415. The Corporation may make matching contributions equal to a discretionary percentage that is determined by the Board of Directors. Participants are at all times fully vested in their contributions and vest over a period of five years regarding the employer contribution. Contribution expense was approximately $490,000 , $428,000 , and $369,000 for the years ended December 31, 2019, 2018, and 2017, respectively.
70
Deferred Compensation Plan
The Corporation has a deferred compensation plan whereby participating directors elect to forego directors’ fees paid in cash. Under this plan, the Corporation will make payments for a ten-year period beginning at the later of age 65 or ceasing to be a director in most cases or at death, if earlier, at which time payments would be made to their designated beneficiaries.
To fund benefits under the deferred compensation plan, the Corporation has acquired bank-owned life insurance policies on the lives of the participating directors for which insurance benefits are payable to the Corporation. The Corporation incurred expenses related to the plan of $408,000 , $370,000 , and $330,000 for the years ended December 31, 2019, 2018, and 2017, respectively. Benefits paid under the plan were approximately $57,000 , $59,000 , and $79,000 in 2019, 2018, and 2017, respectively.
NOTE 14 - STOCK OPTIONS
In 2014, the Corporation adopted the 2014 Equity Incentive Plan designed to help the Corporation attract, retain, and motivate employees and non-employee directors. Incentive stock options, non-qualified stock options, and restricted stock may be granted as part of the plan.
On March 24, 2017, the Corporation issued 105,000 stock options with a strike price of $29.47 to employees. The options granted in 2017 all expire ten years from the grant date; however, of the 105,000 grants awarded, 69,375 of the options have a three year vesting period while the remaining 35,625 options vest in five years . The Corporation issued a total of 262,050 stock options during 2018 that expire ten years from the grant date. On January 5, 2018 a total of 37,500 options were issued with an additional 224,550 options issued on August 24, 2018. Of the 262,050 options issued during 2018, 94,050 have a vesting period of three years and the remaining 168,000 options vest in five years . On March 15, 2019, the Corporation issued 240,000 stock options with a strike price of $28.01 . Of the options issued during 2019, 120,900 have a three year vesting period while the remaining 119,100 have a five year vesting period and all options expire ten years after issuance.
A summary of stock option activity for the year ended December 31, 2019 is presented below:
Shares | Weighted Average Exercise Price | Weighted Average Remaining Contractual Term | Aggregate Intrinsic Value | |||||||||||
Outstanding at December 31, 2016 | $ | |||||||||||||
Granted | ||||||||||||||
Exercised | ||||||||||||||
Forfeited | ( | ) | ||||||||||||
Expired | ||||||||||||||
Outstanding at December 31, 2017 | ||||||||||||||
Granted | ||||||||||||||
Exercised | ||||||||||||||
Forfeited | ( | ) | ||||||||||||
Expired | ||||||||||||||
Outstanding at December 31, 2018 | ||||||||||||||
Granted | ||||||||||||||
Exercised | ||||||||||||||
Forfeited | ( | ) | ||||||||||||
Expired | ||||||||||||||
Outstanding at December 31, 2019 | $ | $ | ||||||||||||
Options exercisable at December 31, 2019 | $ | — | $ | — | ||||||||||
71
On December 31, 2019, a total of 625,800 options were outstanding. Outstanding options at December 31, 2019 and the related vesting schedules are summarized below:
Stock Options Granted | |||||||||||||||||
Date | Shares | Forfeited | Outstanding | Strike Price | Vesting Period | Expiration | |||||||||||
March 15, 2019 | ( | ) | $ | ||||||||||||||
March 15, 2019 | ( | ) | |||||||||||||||
August 24, 2018 | ( | ) | |||||||||||||||
August 24, 2018 | ( | ) | |||||||||||||||
January 5, 2018 | |||||||||||||||||
January 5, 2018 | |||||||||||||||||
March 24, 2017 | ( | ) | |||||||||||||||
March 24, 2017 | |||||||||||||||||
August 27, 2015 | ( | ) | |||||||||||||||
The fair value of stock options is estimated using the Black-Scholes option pricing model. The following is a summary of the assumptions used in this model for the stock options granted during 2019, 2018, and 2017:
2019 | 2018 | 2017 | |||||||||
Risk-free interest rate | % | % | % | ||||||||
Expected volatility | % | % | % | ||||||||
Expected dividend yield | % | % | % | ||||||||
Expected life | |||||||||||
Weighted average grant date fair value per option | $ | $ | $ | ||||||||
The estimated fair value of options, including the effect of estimated forfeitures, is recognized as expense on a straightline basis over the options’ vesting periods while ensuring that the cumulative amount of compensation cost recognized at least equals the value of the vested portion of the award at that date. The Corporation determines the fair value of options granted using the Black-Scholes option-pricing model. The risk-free interest rate is based on the United States Treasury bond with a similar term to the expected life of the options at the grant date. Expected volatility was estimated based on the adjusted historic volatility of the Corporation’s shares. The expected life was estimated to equal the contractual life of the options. The dividend yield rate was based upon recent historical dividends paid on shares.
For the years ended December 31, 2019, 2018, and 2017 there was $680,000 , $486,000 , and $29,000 in total share-based compensation expense, respectively. The compensation expense is recorded as part of the non-interest expenses in the Consolidated Statement of Income.
As of December 31, 2019, total unrecognized compensation costs related to non-vested options was $1,935,000 which is expected to be recognized over a period of 2.54 years.
NOTE 15 - EMPLOYEE STOCK PURCHASE PLAN
The Corporation maintains the Penns Woods Bancorp, Inc. Employee Stock Purchase Plan (“Plan”). The Plan is intended to encourage employee participation in the ownership and economic progress of the Corporation. The Plan allows for up to 1,500,000 shares to be purchased by employees. The purchase price of the shares is 95 % of fair value with an employee eligible to purchase up to the lesser of 15 % of base compensation or $12,000 in fair value annually. There were 3,414 and 3,538 shares issued under the plan for the years ended December 31, 2019 and 2018, respectively.
72
NOTE 16 - RELATED PARTY TRANSACTIONS
Certain directors and executive officers of the Corporation and the Banks, including their immediate families and companies in which they are principal owners (more than ten percent), are indebted to the Corporation. Such indebtedness was incurred in the ordinary course of business on the same terms and at those rates prevailing at the time for comparable transactions with others.
A summary of loan activity with executive officers, directors, principal shareholders, and associates of such persons is listed below for the years ended December 31, 2019 and 2018:
(In Thousands) | Beginning Balance | New Loans | Repayments | Ending Balance | ||||||||||||
2018 | $ | $ | $ | ( | ) | $ | ||||||||||
2019 | ( | ) | ||||||||||||||
Deposits from related parties held by the Banks amounted to $18,121,000 at December 31, 2019 and $16,836,000 at December 31, 2018.
NOTE 17 - OFF-BALANCE SHEET RISK
The Corporation is a party to financial instruments with off-balance sheet risk in the normal course of business to meet the financing needs of its customers. These financial instruments include commitments to extend credit and standby letters of credit. These instruments involve, to varying degrees, elements of credit, interest rate, or liquidity risk in excess of the amount recognized in the Consolidated Balance Sheet. The contract amounts of these instruments express the extent of involvement the Corporation has in particular classes of financial instruments.
The Corporation’s exposure to credit loss from nonperformance by the other party to the financial instruments for commitments to extend credit and standby letters of credit is represented by the contractual amount of these instruments. The Corporation uses the same credit policies in making commitments and conditional obligations as it does for on-balance sheet instruments. The Corporation may require collateral or other security to support financial instruments with off-balance sheet credit risk.
Financial instruments whose contract amounts represent credit risk are as follows at December 31, 2019 and 2018:
(In Thousands) | 2019 | 2018 | ||||||
Commitments to extend credit | $ | $ | ||||||
Standby letters of credit | ||||||||
Credit exposure from the sale of assets with recourse | ||||||||
Commitments to extend credit are legally binding agreements to lend to customers. Commitments generally have fixed expiration dates or other termination clauses and may require payment of fees. Since many of the commitments are expected to expire without being drawn upon, the total commitment amounts do not necessarily represent future liquidity requirements. The Corporation evaluates each customer’s credit worthiness on a case-by-case basis. The amount of collateral obtained, if deemed necessary by the Corporation, on an extension of credit is based on management’s credit assessment of the counterparty.
Standby letters of credit represent conditional commitments issued by the Corporation to guarantee the performance of a customer to a third party. These instruments are issued primarily to support bid or performance related contracts. The coverage period for these instruments is typically a one year period with an annual renewal option subject to prior approval by management. Fees earned from the issuance of these letters are recognized upon expiration of the coverage period. For secured letters of credit, the collateral is typically Bank deposit instruments or customer business assets.
73
NOTE 18 - CAPITAL REQUIREMENTS
Federal regulations require the Corporation and the Banks to maintain minimum amounts of capital. Specifically, each is required to maintain certain minimum dollar amounts and ratios of Common Equity Tier 1, Total, and Tier 1 capital to risk-weighted assets and of Tier 1 capital to average total assets.
In addition to the capital requirements, the Federal Deposit Insurance Corporation Improvement Act (“FDICIA”) established five capital categories ranging from “well capitalized” to “critically undercapitalized.” Should any institution fail to meet the requirements to be considered “adequately capitalized,” it would become subject to a series of increasingly restrictive regulatory actions.
As of December 31, 2019 and 2018, the FDIC categorized the Banks as well capitalized under the regulatory framework for prompt corrective action. To be classified as a well capitalized financial institution, common equity tier I risk-based, tier I risked-based, total risk-based, and tier I leverage capital ratios must be at least 6.5 %, 8 %, 10 %, and 5 %, respectively.
The Corporation’s and the Banks' actual capital ratios (using the definitions from the prompt corrective action rules) are presented in the following tables, which shows that the Corporation and both Banks met all regulatory capital requirements.
Consolidated Corporation | ||||||||||||||
2019 | 2018 | |||||||||||||
(In Thousands) | Amount | Ratio | Amount | Ratio | ||||||||||
Common Equity Tier I Capital (to Risk-weighted Assets) | ||||||||||||||
Actual | $ | % | $ | % | ||||||||||
For Capital Adequacy Purposes | % | % | ||||||||||||
Minimum To Maintain Capital Conservation Buffer | % | % | ||||||||||||
To Be Well Capitalized | % | % | ||||||||||||
Total Capital (to Risk-weighted Assets) | ||||||||||||||
Actual | $ | % | $ | % | ||||||||||
For Capital Adequacy Purposes | % | % | ||||||||||||
Minimum To Maintain Capital Conservation Buffer | % | % | ||||||||||||
To Be Well Capitalized | % | % | ||||||||||||
Tier I Capital (to Risk-weighted Assets) | ||||||||||||||
Actual | $ | % | $ | % | ||||||||||
For Capital Adequacy Purposes | % | % | ||||||||||||
Minimum To Maintain Capital Conservation Buffer | % | % | ||||||||||||
To Be Well Capitalized | % | % | ||||||||||||
Tier I Capital (to Average Assets) | ||||||||||||||
Actual | $ | % | $ | % | ||||||||||
For Capital Adequacy Purposes | % | % | ||||||||||||
To Be Well Capitalized | % | % | ||||||||||||
74
Jersey Shore State Bank | ||||||||||||||
2019 | 2018 | |||||||||||||
(In Thousands) | Amount | Ratio | Amount | Ratio | ||||||||||
Common Equity Tier I Capital (to Risk-weighted Assets) | ||||||||||||||
Actual | $ | % | $ | % | ||||||||||
For Capital Adequacy Purposes | % | % | ||||||||||||
Minimum To Maintain Capital Conservation Buffer | % | % | ||||||||||||
To Be Well Capitalized | % | % | ||||||||||||
Total Capital (to Risk-weighted Assets) | ||||||||||||||
Actual | $ | % | $ | % | ||||||||||
For Capital Adequacy Purposes | % | % | ||||||||||||
Minimum To Maintain Capital Conservation Buffer | % | % | ||||||||||||
To Be Well Capitalized | % | % | ||||||||||||
Tier I Capital (to Risk-weighted Assets) | ||||||||||||||
Actual | $ | % | $ | % | ||||||||||
For Capital Adequacy Purposes | % | % | ||||||||||||
Minimum To Maintain Capital Conservation Buffer | % | % | ||||||||||||
To Be Well Capitalized | % | % | ||||||||||||
Tier I Capital (to Average Assets) | ||||||||||||||
Actual | $ | % | $ | % | ||||||||||
For Capital Adequacy Purposes | % | % | ||||||||||||
To Be Well Capitalized | % | % | ||||||||||||
Luzerne Bank | ||||||||||||||
2019 | 2018 | |||||||||||||
(In Thousands) | Amount | Ratio | Amount | Ratio | ||||||||||
Common Equity Tier I Capital (to Risk-weighted Assets) | ||||||||||||||
Actual | $ | % | $ | % | ||||||||||
For Capital Adequacy Purposes | % | % | ||||||||||||
Minimum To Maintain Capital Conservation Buffer | % | % | ||||||||||||
To Be Well Capitalized | % | % | ||||||||||||
Total Capital (to Risk-weighted Assets) | ||||||||||||||
Actual | $ | % | $ | % | ||||||||||
For Capital Adequacy Purposes | % | % | ||||||||||||
Minimum To Maintain Capital Conservation Buffer | % | % | ||||||||||||
To Be Well Capitalized | % | % | ||||||||||||
Tier I Capital (to Risk-weighted Assets) | ||||||||||||||
Actual | $ | % | $ | % | ||||||||||
For Capital Adequacy Purposes | % | % | ||||||||||||
Minimum To Maintain Capital Conservation Buffer | % | % | ||||||||||||
To Be Well Capitalized | % | % | ||||||||||||
Tier I Capital (to Average Assets) | ||||||||||||||
Actual | $ | % | $ | % | ||||||||||
For Capital Adequacy Purposes | % | % | ||||||||||||
To Be Well Capitalized | % | % | ||||||||||||
75
NOTE 19 - REGULATORY RESTRICTIONS
The Pennsylvania Banking Code restricts the availability of capital funds for payment of dividends by all state-chartered banks. Accordingly, at December 31, 2019, the balance in the additional paid in capital account totaling $11,657,000 for JSSB and $42,214,000 for Luzerne is unavailable for dividends.
The Banks are subject to regulatory restrictions, which limit the ability to loan funds to Penns Woods Bancorp, Inc. At December 31, 2019, the regulatory lending limit amounted to approximately $20,267,000 .
Cash and Due from Banks
JSSB and Luzerne had no reserve requirements by the district Federal Reserve Bank at December 31, 2019 or 2018; however, if they did they would be reported with cash and due from banks. The required reserves are computed by applying prescribed ratios to the classes of average deposit balances. These are held in the form of cash on hand and a balance maintained directly with the Federal Reserve Bank.
NOTE 20 - FAIR VALUE MEASUREMENTS
The following disclosures show the hierarchal disclosure framework associated with the level of pricing observations utilized in measuring assets and liabilities at fair value. The three broad levels of pricing observations are as follows:
Level I: | Quoted prices are available in active markets for identical assets or liabilities as of the reported date. | |
Level II: | Pricing inputs are other than quoted prices in active markets, which are either directly or indirectly observable as of the reported date. The nature of these assets and liabilities includes items for which quoted prices are available but traded less frequently, and items that are fair valued using other financial instruments, the parameters of which can be directly observed. | |
Level III: | Valuations derived from valuation techniques in which one or more significant inputs or significant value drivers are unobservable. | |
This hierarchy requires the use of observable market data when available.
The following table presents the assets reported on the balance sheet at their fair value on a recurring basis as of December 31, 2019 and 2018, by level within the fair value hierarchy. Financial assets and liabilities are classified in their entirety based on the lowest level of input that is significant to the fair value measurement.
2019 | ||||||||||||||||
(In Thousands) | Level I | Level II | Level III | Total | ||||||||||||
Assets measured on a recurring basis: | ||||||||||||||||
Investment securities, available for sale: | ||||||||||||||||
Mortgage-backed securities | $ | $ | $ | $ | ||||||||||||
State and political securities | ||||||||||||||||
Other debt securities | ||||||||||||||||
Investment equity securities: | ||||||||||||||||
Financial institution equity securities | ||||||||||||||||
Other equity securities | ||||||||||||||||
Investment securities, trading: | ||||||||||||||||
Other equity securities | ||||||||||||||||
76
2018 | ||||||||||||||||
(In Thousands) | Level I | Level II | Level III | Total | ||||||||||||
Assets measured on a recurring basis: | ||||||||||||||||
Investment securities, available for sale: | ||||||||||||||||
Mortgage-backed securities | $ | $ | $ | $ | ||||||||||||
State and political securities | ||||||||||||||||
Other debt securities | ||||||||||||||||
Investment equity securities: | ||||||||||||||||
Financial institution equity securities | ||||||||||||||||
Other equity securities | ||||||||||||||||
Investment securities, trading: | ||||||||||||||||
Other equity securities | ||||||||||||||||
The following table presents the assets reported on the balance sheet at their fair value on a non-recurring basis as of December 31, 2019 and 2018, by level within the fair value hierarchy. Financial assets and liabilities are classified in their entirety based on the lowest level of input that is significant to the fair value measurement.
2019 | ||||||||||||||||
(In Thousands) | Level I | Level II | Level III | Total | ||||||||||||
Assets measured on a non-recurring basis: | ||||||||||||||||
Impaired loans | $ | $ | $ | $ | ||||||||||||
Other real estate owned | ||||||||||||||||
2018 | ||||||||||||||||
(In Thousands) | Level I | Level II | Level III | Total | ||||||||||||
Assets measured on a non-recurring basis: | ||||||||||||||||
Impaired loans | $ | $ | $ | $ | ||||||||||||
Other real estate owned | ||||||||||||||||
The following table provides a listing of significant unobservable inputs used in the fair value measurement process for items valued utilizing level III techniques as of December 31, 2019 and 2018:
2019 | ||||||||||||
Quantitative Information About Level III Fair Value Measurements | ||||||||||||
(In Thousands) | Fair Value | Valuation Technique(s) | Unobservable Inputs | Range | Weighted Average | |||||||
Impaired loans | $ | Discounted cash flow | Temporary reduction in payment amount | 17% to (59)% | ( | |||||||
Probability of default | ||||||||||||
Appraisal of collateral (1) | Appraisal adjustments (1) | 0 to (30)% | ( | |||||||||
Other real estate owned | $ | Appraisal of collateral (1) | Appraisal adjustments (1) | ( | ( | |||||||
2018 | ||||||||||||
Quantitative Information About Level III Fair Value Measurements | ||||||||||||
(In Thousands) | Fair Value | Valuation Technique(s) | Unobservable Inputs | Range | Weighted Average | |||||||
Impaired loans | $ | Discounted cash flow | Temporary reduction in payment amount | 7% to (70)% | ( | |||||||
Probability of default | ||||||||||||
Appraisal of collateral (1) | Appraisal adjustments (1) | 0 to (90)% | ( | |||||||||
Other real estate owned | $ | Appraisal of collateral (1) | Appraisal adjustments (1) | ( | ( | |||||||
(1) Appraisals may be adjusted by management for qualitative factors such as economic conditions and estimated liquidation expenses.
77
The significant unobservable inputs used in the fair value measurement of the Corporation’s impaired loans using the discounted cash flow valuation technique include temporary changes in payment amounts and the probability of default. Significant increases (decreases) in payment amounts would result in significantly higher (lower) fair value measurements. The probability of default is 0 % for impaired loans using the discounted cash flow valuation technique because all defaulted impaired loans are valued using the appraisal of collateral valuation technique.
The significant unobservable input used in the fair value measurement of the Corporation’s impaired loans using the appraisal of collateral valuation technique include appraisal adjustments, which are adjustments to appraisals by management for qualitative factors such as economic conditions and estimated liquidation expenses. The significant unobservable input used in the fair value measurement of the Corporation’s other real estate owned are the same inputs used to value impaired loans using the appraisal of collateral valuation technique.
NOTE 21 - FAIR VALUE OF FINANCIAL INSTRUMENTS
The Corporation is required to disclose fair values for its financial instruments. Fair values are made at a specific point in time, based on relevant market information and information about the financial instrument. These fair values do not reflect any premium or discount that could result from offering for sale at one time the Corporation’s entire holdings of a particular financial instrument. Also, it is the Corporation’s general practice and intention to hold most of its financial instruments to maturity and not to engage in trading or sales activities. Because no market exists for a significant portion of the Corporation’s financial instruments, fair values are based on judgments regarding future expected loss experience, current economic conditions, risk characteristics of various financial instruments, and other factors. These fair values are subjective in nature and involve uncertainties and matters of significant judgment and therefore cannot be determined with precision. Changes in assumptions can significantly affect the fair values.
Fair values have been determined by the Corporation using historical data and an estimation methodology suitable for each category of financial instruments. The Corporation’s fair values, methods, and assumptions are set forth below for the Corporation’s other financial instruments.
As certain assets and liabilities, such as deferred tax assets, premises and equipment, and many other operational elements of the Corporation, are not considered financial instruments but have value, the fair value of financial instruments would not represent the full fair value of the Corporation.
The fair values of the Corporation’s financial instruments not required to be measured or reported at fair value are as follows at December 31, 2019 and 2018:
Fair Value Measurements at December 31, 2019 | ||||||||||||||||||||
(In Thousands) | Carrying Value | Fair Value | Quoted Prices in Active Markets for Identical Assets (Level I) | Significant Other Observable Inputs (Level II) | Significant Unobservable Inputs (Level III) | |||||||||||||||
Financial assets: | ||||||||||||||||||||
Cash and cash equivalents (1) | $ | $ | $ | $ | $ | |||||||||||||||
Restricted investment in bank stock (1) | ||||||||||||||||||||
Loans held for sale (1) | ||||||||||||||||||||
Loans, net | ||||||||||||||||||||
Bank-owned life insurance (1) | ||||||||||||||||||||
Accrued interest receivable (1) | ||||||||||||||||||||
Financial liabilities: | ||||||||||||||||||||
Interest-bearing deposits | $ | $ | $ | $ | $ | |||||||||||||||
Noninterest-bearing deposits (1) | ||||||||||||||||||||
Short-term borrowings (1) | ||||||||||||||||||||
Long-term borrowings | ||||||||||||||||||||
Accrued interest payable (1) | ||||||||||||||||||||
78
Fair Value Measurements at December 31, 2018 | ||||||||||||||||||||
(In Thousands) | Carrying Value | Fair Value | Quoted Prices in Active Markets for Identical Assets (Level I) | Significant Other Observable Inputs (Level II) | Significant Unobservable Inputs (Level III) | |||||||||||||||
Financial assets: | ||||||||||||||||||||
Cash and cash equivalents (1) | $ | $ | $ | $ | $ | |||||||||||||||
Investment equity securities | ||||||||||||||||||||
Trading | ||||||||||||||||||||
Restricted investment in bank stock (1) | ||||||||||||||||||||
Loans held for sale (1) | ||||||||||||||||||||
Loans, net | ||||||||||||||||||||
Bank-owned life insurance (1) | ||||||||||||||||||||
Accrued interest receivable (1) | ||||||||||||||||||||
Financial liabilities: | ||||||||||||||||||||
Interest-bearing deposits | $ | $ | $ | $ | $ | |||||||||||||||
Noninterest-bearing deposits (1) | ||||||||||||||||||||
Short-term borrowings (1) | ||||||||||||||||||||
Long-term borrowings | ||||||||||||||||||||
Accrued interest payable (1) | ||||||||||||||||||||
(1) The financial instrument is carried at cost at December 31, 2018, which approximate the fair value of the instruments
NOTE 22 - PARENT COMPANY ONLY FINANCIAL STATEMENTS
Condensed financial information for Penns Woods Bancorp, Inc. follows:
CONDENSED BALANCE SHEET, DECEMBER 31,
(In Thousands) | 2019 | 2018 | ||||||
ASSETS: | ||||||||
Cash | $ | $ | ||||||
Investment in subsidiaries: | ||||||||
Bank | ||||||||
Non-bank | ||||||||
Other assets | ||||||||
Total Assets | $ | $ | ||||||
LIABILITIES AND SHAREHOLDERS’ EQUITY: | ||||||||
Other liabilities | $ | $ | ||||||
Shareholders’ equity | ||||||||
Total liability and shareholders’ equity | $ | $ | ||||||
CONDENSED STATEMENT OF INCOME FOR THE YEARS ENDED DECEMBER 31,
(In Thousands) | 2019 | 2018 | 2017 | |||||||||
Operating income: | ||||||||||||
Dividends from subsidiaries | $ | $ | $ | |||||||||
Equity in undistributed earnings of subsidiaries | ( | ) | ||||||||||
Operating expenses | ( | ) | ( | ) | ( | ) | ||||||
Net income | $ | $ | $ | |||||||||
Comprehensive income | $ | $ | $ | |||||||||
79
CONDENSED STATEMENT OF CASH FLOWS FOR THE YEARS ENDED DECEMBER 31,
(In Thousands) | 2019 | 2018 | 2017 | |||||||||
OPERATING ACTIVITIES: | ||||||||||||
Net income | $ | $ | $ | |||||||||
Adjustments to reconcile net income to net cash provided by operating activities: | ||||||||||||
Equity in undistributed earnings of subsidiaries | ( | ) | ( | ) | ||||||||
Other, net | ( | ) | ( | ) | ||||||||
Net cash provided by operating activities | ||||||||||||
INVESTING ACTIVITIES: | ||||||||||||
Investments in subsidiaries | ( | ) | ||||||||||
FINANCING ACTIVITIES: | ||||||||||||
Dividends paid | ( | ) | ( | ) | ( | ) | ||||||
Issuance of common stock | ||||||||||||
Purchase of treasury stock | ( | ) | ||||||||||
Net cash used for financing activities | ( | ) | ( | ) | ( | ) | ||||||
NET INCREASE (DECREASE) IN CASH | ( | ) | ||||||||||
CASH, BEGINNING OF YEAR | ||||||||||||
CASH, END OF YEAR | $ | $ | $ | |||||||||
NOTE 23 - CONSOLIDATED QUARTERLY FINANCIAL DATA (UNAUDITED)
(In Thousands, Except Per Share Data) | For the Three Months Ended | |||||||||||||||
2019 | March 31, | June 30, | Sept. 30, | Dec. 31, | ||||||||||||
Interest income | $ | $ | $ | $ | ||||||||||||
Interest expense | ||||||||||||||||
Net interest income | ||||||||||||||||
Provision for loan losses | ||||||||||||||||
Non-interest income, excluding securities gains | ||||||||||||||||
Securities gains (losses), net | ( | ) | ||||||||||||||
Non-interest expense | ||||||||||||||||
Income before income tax provision | ||||||||||||||||
Income tax provision | ||||||||||||||||
Consolidated net income | $ | $ | $ | $ | ||||||||||||
Earnings per share - basic | $ | $ | $ | $ | ||||||||||||
Earnings per share - diluted | $ | $ | $ | $ | ||||||||||||
80
(In Thousands, Except Per Share Data) | For the Three Months Ended | |||||||||||||||
2018 | March 31, | June 30, | Sept. 30, | Dec. 31, | ||||||||||||
Interest income | $ | $ | $ | $ | ||||||||||||
Interest expense | ||||||||||||||||
Net interest income | ||||||||||||||||
Provision for loan losses | ||||||||||||||||
Non-interest income, excluding securities gains | ||||||||||||||||
Securities gains, net | ( | ) | ( | ) | ( | ) | ||||||||||
Non-interest expense | ||||||||||||||||
Income before income tax provision | ||||||||||||||||
Income tax provision | ||||||||||||||||
Consolidated net income | $ | $ | $ | $ | ||||||||||||
Earnings per share - basic | $ | $ | $ | $ | ||||||||||||
Earnings per share - diluted | $ | $ | $ | $ | ||||||||||||
NOTE 24 - REVENUE RECOGNITION
On January 1, 2018, the Corporation adopted ASU No. 2014-09 “Revenue from Contracts with Customers” (Topic 606) and all subsequent ASUs that modified Topic 606 using the modified retrospective method, and applied the guidance to all contracts in scope that were not completed as of January 1, 2018. Results for reporting periods beginning after January 1, 2018 are presented under Topic 606, while prior period amounts were not adjusted and continue to be reported in accordance with our historic accounting under Topic 605.
The core principle of Topic 606, Revenue from Contracts with Customers, is that an entity recognize revenue at an amount that reflects the consideration to which the entity expects to be entitled in exchange for transferring goods or services to a customer. Topic 606 requires entities to exercise more judgment when considering the terms of a contract than under Topic 605, Revenue Recognition. Topic 606 applies to all contracts with customers to provide goods or services in the ordinary course of business, except for contracts that are specifically excluded from its scope.
Topic 606 does not apply to revenue associated with interest income on financial instruments, including loans and securities. Additionally, certain noninterest income streams such as certain credit and debit card fees, income from bank owned life insurance, and gain and losses on sales of investment securities are out of scope of Topic 606.
Topic 606 is applicable to noninterest revenue streams such as service charges on deposit accounts, merchant income, wire transfer income, check cashing fees, check printing fees, safe deposit box rental fees, life insurance and brokerage commissions. These revenue streams are largely transactional based and revenue is recognized upon completion of transaction.
Principal versus Agent Considerations
When more than one party is involved in providing goods or services to a customer, Topic 606 requires the Corporation to determine whether it is the principal or an agent in these transactions by evaluating the nature of its promise to the customer. An entity is a principal and therefore records revenue on a gross basis if it controls a promised good or service before transferring that good or service to the customer. An entity is an agent and records as revenue the net amount it retains for its agency services if its role is to arrange for another entity to provide the goods or services. The Corporation most commonly acts as a principal and records revenue on a gross basis, except in certain circumstances. As an example, revenues earned from interchange fees, in which the Corporation acts as an agent, are recorded as non-interest income, net of the related expenses paid to the principal. Brokerage and insurance commissions are recognized when The M Group's services to the broker dealer and investment representative are complete.
Debit Card Fees
Interchange fees are one source of debit and credit card income that is comprised of an amount merchants pay card-issuing banks for the processing of their electronic transactions as a form of payment. ATM service charges, check card usage, and POS debit card transactions generate interchange and debit card income. Per Topic 606 interchange and debit card transaction fees are reported net of related network costs. See Note 1 - Recent Accounting Pronouncements. Prior to the adoption of Topic 606, non-
81
interest expense included network costs. Interchange and debit card transaction fees at December 31, 2019 and 2018 are reported on a net basis of $1,378,000 and $1,534,000 ; for the corresponding periods of 2018 and 2017 such amount was $1,312,000 , respectively. The below table compares gross interchange and debit card transaction fees net network costs for 2019, 2018 and 2017:
(In Thousands) | 2019 | 2018 | 2017 | |||||||||
Debit card transaction fees | $ | $ | $ | |||||||||
Other processing service fees | ||||||||||||
Gross interchange and card based transaction fees | ||||||||||||
Network costs | ||||||||||||
Net interchange and card based transaction fees | $ | $ | $ | |||||||||
NOTE 25 - LEASES
The following table shows finance lease right of use assets and finance lease liabilities as of December 31, 2019:
(In Thousands) | Statement of Financial Condition classification | December 31, 2019 | ||||
Finance lease right of use assets | Premises and equipment, net | $ | ||||
Finance lease liabilities | Long-term borrowings | |||||
The following table shows the components of finance and operating lease expense for the year ended December 31, 2019.
(In Thousands) | 2019 | |||
Finance Lease Cost: | ||||
Amortization of right-of-use asset | $ | |||
Interest expense | ||||
Operating lease cost | ||||
Total Lease Cost | $ | |||
Gross rental expense for the twelve months ended December 31, 2018 was $541,000 .
A maturity analysis of operating and finance lease liabilities and reconciliation of the undiscounted cash flows to the total operating lease liability is as follows:
(In Thousands) | Operating | Finance | ||||||
2020 | $ | $ | ||||||
2021 | ||||||||
2022 | ||||||||
2023 | ||||||||
2024 | ||||||||
2025 and thereafter | ||||||||
Total undiscounted cash flows | ||||||||
Discount on cash flows | ( | ) | ( | ) | ||||
Total lease liability | $ | $ | ||||||
The following table shows the weighted average remaining lease term and weighted average discount rate for both operating and finance leases outstanding as of December 31, 2019.
Operating | Finance | |||||
Weighted-average term (years) | ||||||
Weighted-average discount rate | % | % | ||||
82
ITEM 9 | CHANGES IN AND DISAGREEMENTS WITH ACCOUNTANTS ON ACCOUNTING AND FINANCIAL DISCLOSURE |
None.
ITEM 9A | CONTROLS AND PROCEDURES |
The Corporation, under the supervision and with the participation of the Corporation’s management, including the Corporation’s Chief Executive Officer along with the Corporation’s President and Chief Financial Officer, conducted an evaluation of the effectiveness as of December 31, 2019 of the design and operation of the Corporation’s disclosure controls and procedures, as such term is defined under Rule 13a-15(e) promulgated under the Exchange Act. Based upon that evaluation, the Corporation’s President and Chief Executive Officer along with the Corporation’s Chief Financial Officer concluded that the Corporation’s disclosure controls and procedures were effective as of December 31, 2019.
There have been no changes in the Corporation’s internal control over financial reporting during the fourth quarter of 2019 that have materially affected, or are reasonably likely to materially affect, the Corporation’s internal control over financial reporting.
Management’s Report on Internal Control Over Financial Reporting
Management of the Corporation is responsible for establishing and maintaining adequate internal control over financial reporting as defined in Rules 13a-15(f) and 15d-15(f) under the Exchange Act. The Corporation’s internal control over financial reporting is designed to provide reasonable assurance regarding the reliability of financial reporting and the preparation of financial statements for external purposes in accordance with generally accepted accounting principles.
Because of its inherent limitations, internal control over financial reporting may not prevent or detect misstatements. Also, projections of any evaluation of effectiveness to future periods are subject to the risk that controls may become inadequate because of changes in conditions, or that the degree of compliance with the policies or procedures may deteriorate.
A material weakness is a significant deficiency (as defined in Public Company Accounting Oversight Board Auditing Standard No. 2), or a combination of significant deficiencies, that results in there being more than a remote likelihood that a material misstatement of the annual or interim financial statements will not be prevented or detected on a timely basis by management or employees in the normal course of performing their assigned functions.
Management assessed the effectiveness of the Corporation’s internal control over financial reporting as of December 31, 2019. Management’s assessment did not identify any material weaknesses in the Corporation’s internal control over financial reporting.
In making this assessment, management used the criteria set forth by the Committee of Sponsoring Organizations of the Treadway Commission ("COSO") in "Internal Control-Integrated Framework" issued by COSO in May 2013. Because there were no material weaknesses discovered, management believes that, as of December 31, 2019, the Corporation’s internal control over financial reporting was effective.
S.R. Snodgrass, P.C. an independent registered public accounting firm, has audited the consolidated financial statements included in this Annual Report on Form 10-K, and, as part of the audit, has issued a report, which appears below, on the effectiveness of the Corporation’s internal control over financial reporting as of December 31, 2019.
Date: | March 10, 2020 | /s/ Richard A. Grafmyre | /s/ Brian L. Knepp | |
Chief Executive Officer | President and Chief Financial Officer | |||
(Principal Financial Officer) | ||||
83
REPORT OF INDEPENDENT REGISTERED PUBLIC ACCOUNTING FIRM
To the Shareholders and the Board of Directors of Penns Woods Bancorp, Inc.
Opinion on Internal Control over Financial Reporting
We have audited Penns Woods Bancorp, Inc. and subsidiaries’ (the “Company”) internal control over financial reporting as of December 31, 2019, based on criteria established in Internal Control - Integrated Framework, issued by the Committee of Sponsoring Organizations of the Treadway Commission in 2013. In our opinion, the Company maintained, in all material respects, effective internal control over financial reporting as of December 31, 2019, based on criteria established in Internal Control - Integrated Framework, issued by the Committee of Sponsoring Organizations of the Treadway Commission in 2013.
We have also audited, in accordance with the standards of the Public Company Accounting Oversight Board (United States) (PCAOB), the consolidated balance sheets of the Company as of December 31, 2019 and 2018; the related consolidated statements of income, comprehensive income, changes in shareholders’ equity, and cash flows for each of the three years in the period ended December 31, 2019, of the Company; and our report dated March 10, 2020, expressed an unqualified opinion.
Basis for Opinion
The Company’s management is responsible for maintaining effective internal control over financial reporting and for its assessment of the effectiveness of internal control over financial reporting in the accompanying Management’s Report on Internal Control over Financial Reporting. Our responsibility is to express an opinion on the Company’s internal control over financial reporting based on our audit. We are a public accounting firm registered with the PCAOB and are required to be independent, with respect to the Company, in accordance with U.S. federal securities laws and the applicable rules and regulations of the Securities and Exchange Commission and the PCAOB.
We conducted our audit in accordance with the standards of the PCAOB. Those standards require that we plan and perform the audit to obtain reasonable assurance about whether effective internal control over financial reporting was maintained in all material respects. Our audit included obtaining an understanding of internal control over financial reporting, assessing the risk that a material weakness exists, and testing and evaluating the design and operating effectiveness of internal control based on the assessed risk. Our audit also included performing such other procedures as we considered necessary in the circumstances. We believe that our audit provides a reasonable basis for our opinion.
Definition and Limitations of Internal Control over Financial Reporting
A company’s internal control over financial reporting is a process designed to provide reasonable assurance regarding the reliability of financial reporting and the preparation of financial statements for external purposes in accordance with generally accepted accounting principles. A company’s internal control over financial reporting includes those policies and procedures that (1) pertain to the maintenance of records that, in reasonable detail, accurately and fairly reflect the transactions and dispositions of the assets of the company; (2) provide reasonable assurance that transactions are recorded as necessary to permit preparation of financial statements in accordance with generally accepted accounting principles, and that receipts and expenditures of the company are being made only in accordance with authorizations of management and directors of the company; and (3) provide reasonable assurance regarding prevention or timely detection of unauthorized acquisition, use, or disposition of the company’s assets that could have a material effect on the financial statements.
84
Because of its inherent limitations, internal control over financial reporting may not prevent or detect misstatements. Also, projections of any evaluation of effectiveness to future periods are subject to the risk that controls may become inadequate because of changes in conditions or that the degree of compliance with the policies or procedures may deteriorate.
Cranberry Township, Pennsylvania
March 10, 2020
85
ITEM 9B | OTHER INFORMATION |
None.
PART III
ITEM 10 | DIRECTORS, EXECUTIVE OFFICERS, AND CORPORATE GOVERNANCE |
The information appearing under the captions “The Board of Directors and its Committees,” “Election of Directors,” “Information as to Nominees and Directors,” “Delinquent Section 16(a) Reports,” “Principal Officers of the Corporation,” and “Certain Transactions” in the Corporation’s Proxy Statement for the Corporation’s 2020 annual meeting of shareholders (the “Proxy Statement”) is incorporated herein by reference.
ITEM 11 | EXECUTIVE COMPENSATION |
Information appearing under the captions “Compensation of Directors," “Compensation Discussion and Analysis,” “Compensation Committee Report,” “Executive Compensation,” “Grants of Plan-Based Awards,” “Outstanding Equity Awards,” “Option Exercises and Stock Vested,” “Nonqualified Deferred Compensation,” “Retirement Plan,” “Potential Post-Employment Payments,” and "Compensation Committee Interlocks and Insider Participation" in the Proxy Statement is incorporated herein by reference.
ITEM 12 | SECURITY OWNERSHIP OF CERTAIN BENEFICIAL OWNERS AND MANAGEMENT AND RELATED STOCKHOLDER MATTERS |
The information appearing under the caption “Beneficial Ownership and Other Information Regarding Directors, Executive Officers, and Certain Beneficial Owners” in the Proxy Statement is incorporated herein by reference.
Securities Authorized for Issuance Under Equity Compensation Plans
The following tables provide certain information regarding securities issued or issuable under the Corporation’s equity compensation plan as of December 31, 2019:
Number of Securities to be issued upon exercise of outstanding options, warrants and rights | Weighted average exercise price of outstanding options, warrants and rights | Number of securities remaining available for issuance under equity plans (excluding securities reflected in first column) | ||||||||
Equity compensation plan approved by security holders | 625,800 | $ | 29.29 | 238,575 | ||||||
Equity compensation plan not approved by security holders | — | — | — | |||||||
Total | 625,800 | $ | 29.29 | 238,575 | ||||||
ITEM 13 | CERTAIN RELATIONSHIPS AND RELATED TRANSACTIONS, AND DIRECTOR INDEPENDENCE |
The information appearing under the captions “Election of Directors” and “Certain Transactions” in the Proxy Statement is incorporated herein by reference.
ITEM 14 | PRINCIPAL ACCOUNTING FEES AND SERVICES |
The information appearing in the Proxy Statement under the captions, “Audit Fees,” “Audit-Related Fees,” “Tax Fees,” “Other Fees,” and “Pre-Approval of Audit and Permissible Non-Audit Services” is incorporated herein by reference.
86
PART IV
ITEM 15 | EXHIBITS AND FINANCIAL STATEMENT SCHEDULES |
(a)1. Financial Statements
The following consolidated financial statements and reports are set forth in Item 8:
87
2. Financial Statement Schedules
Financial statement schedules are omitted because the required information is either not applicable, not required or is shown in the respective financial statements or in the notes thereto.
(b) Exhibits:
Articles of Incorporation of the Registrant, as presently in effect (incorporated by reference to Exhibit 3(i) of the Registrant's Annual Report on Form 10-K for the year ended December 31, 2018). | |
Bylaws of the Registrant (incorporated by reference to Exhibit 3(ii) of the Registrant’s Annual Report on Form 10-K for the year ended December 31, 2011). | |
Description of Capital Securities | |
Form of First Amendment to the Jersey Shore State Bank Amendment and Restatement of the Director Fee Agreement, dated as of October 1, 2004 (incorporated by reference to Exhibit 10.7 of the Registrant’s Current Report on Form 8-K filed on June 29, 2006). | |
Employment Agreement, dated December 31, 2018, among Penns Woods Bancorp, Inc. and Brian L. Knepp (incorporated by reference to Exhibit 10.1 of the Registrant’s Current Report on Form 8-K filed on December 31, 2018).* | |
Amended and Restated Employment Agreement, dated September 27, 2018, among Penns Woods Bancorp, Inc., Jersey Shore State Bank and Richard A. Grafmyre (incorporated by reference to Exhibit 10.1 of the Registrant’s Current Report on Form 8-K filed on September 28, 2018).* | |
Amendment No. 1, dated May 31, 2019, to Amended and Restated Employment Agreement among Penns Woods Bancorp, Inc., Jersey Shore State Ban, and Richard A. Grafmyre (incorporated by reference to Exhibit 10.1 of the Registrant's Current Report on Form 8-K filed on May 31, 2019).* | |
Employment Agreement, dated February 1, 2014, among Penns Woods Bancorp, Inc., Jersey Shore State Bank and Aron M. Carter (incorporated by reference to Exhibit 10.5 of the Registrant's Annual Report on Form 10-K for the year ended December 31, 2016).* | |
Employment Agreement, dated February 1, 2014, among Penns Woods Bancorp, Inc., Jersey Shore State Bank and Michelle M. Karas (incorporated by reference to Exhibit 10.6 of the Registrant's Annual Report on Form 10-K for the year ended December 31, 2016).* | |
Subsidiaries of the Registrant. | |
Consent of Independent Certified Public Accountants. | |
Rule 13a-14(a)/Rule 15d-14(a) Certification of Chief Executive Officer. | |
Rule 13a-14(a)/Rule 15d-14(a) Certification of Principal Financial Officer. | |
Section 1350 Certification of Chief Executive Officer. | |
Section 1350 Certification of Principal Financial Officer. | |
Exhibit 101 | Interactive data file containing the following financial statements formatted in XBRL (Extensible Business Reporting Language): (i) the Consolidated Balance Sheet at December 31, 2019 and December 31, 2018; (ii) the Consolidated Statement of Income for the years ended December 31, 2019, 2018 and 2017; (iii) the Consolidated Statements of Shareholders’ Equity for the years ended December 31, 2019, 2018, and 2017; (iv) the Consolidated Statement of Comprehensive Income for the years ended December 31, 2019, 2018 and 2017; (v) the Consolidated Statement of Cash Flows for the years ended December 31, 2019, 2018, and 2017; and (vi) the Notes to Consolidated Financial Statements, tagged as blocks of text. As provided in Rule 406T of Regulation S-T, this interactive data file shall not be deemed to be “filed” for purposes of Section 18 of the Securities Exchange Act of 1934, and shall not be deemed “filed” or part of any registration statement or prospectus for purposes of Section 11 or 12 under the Securities Act of 1933, or otherwise subject to liability under those sections. |
* Denotes compensatory plan or arrangement. |
88
EXHIBIT INDEX
(4) (i) | Description of Capital Securities | |
(21) | Subsidiaries of the Registrant. | |
(23) | Consent of Independent Certified Public Accountants. | |
(31) (i) | Rule 13a-14(a)/Rule 15d-14(a) Certification of Chief Executive Officer. | |
(31) (ii) | Rule 13a-14(a)/Rule 15d-14(a) Certification of Principal Financial Officer. | |
(32) (i) | Section 1350 Certification of Chief Executive Officer. | |
(32) (ii) | Section 1350 Certification of Principal Financial Officer. | |
Exhibit 101 | Interactive data file containing the following financial statements formatted in XBRL (Extensible Business Reporting Language): (i) the Consolidated Balance Sheet at December 31, 2019 and December 31, 2018; (ii) the Consolidated Statement of Income for the years ended December 31, 2019, 2018 and 2017; (iii) the Consolidated Statements of Shareholders’ Equity for the years ended December 31, 2019, 2018, and 2017; (iv) the Consolidated Statement of Comprehensive Income for the years ended December 31, 2019, 2018 and 2017; (v) the Consolidated Statement of Cash Flows for the years ended December 31, 2019, 2018, and 2017; and (vi) the Notes to Consolidated Financial Statements, tagged as blocks of text. As provided in Rule 406T of Regulation S-T, this interactive data file shall not be deemed to be “filed” for purposes of Section 18 of the Securities Exchange Act of 1934, and shall not be deemed “filed” or part of any registration statement or prospectus for purposes of Section 11 or 12 under the Securities Act of 1933, or otherwise subject to liability under those sections. | |
89
SIGNATURES
Pursuant to the requirements of Section 13 or 15(d) of the Securities Exchange Act of 1934, the Registrant has duly caused this report to be signed on its behalf by the undersigned, thereunto duly authorized.
March 10, 2020 | PENNS WOODS BANCORP, INC. |
/s/ Richard A. Grafmyre | |
Chief Executive Officer | |
90
Pursuant to the requirements of the Securities and Exchange Act of 1934, this report has been signed below by the following persons on behalf of the Registrant and in the capacities and on the dates indicated:
/s/ Richard A. Grafmyre | ||
Richard A. Grafmyre, Chief Executive Officer and Director | March 10, 2020 | |
(Principal Executive Officer) | ||
/s/ Brian L. Knepp | ||
Brian L. Knepp, President and Chief Financial Officer and Director (Principal Financial and Accounting Officer) | March 10, 2020 | |
/s/ R. Edward Nestlerode, Jr. | ||
R. Edward Nestlerode, Jr., Chairman of the Board | March 10, 2020 | |
/s/ Daniel K. Brewer | ||
Daniel K. Brewer, Director | March 10, 2020 | |
/s/ Michael J. Casale, Jr. | ||
Michael J. Casale, Jr., Director | March 10, 2020 | |
/s/ William J. Edwards | ||
William J. Edwards, Director | March 10, 2020 | |
/s/ James M. Furey, II | ||
James M. Furey, II, Director | March 10, 2020 | |
/s/ D. Michael Hawbaker | ||
D. Michael Hawbaker, Director | March 10, 2020 | |
/s/ Cameron W. Kephart | ||
Cameron W. Kephart, Director | March 10, 2020 | |
/s/ Leroy H. Keiler, III | ||
Leroy H. Keiler, III, Director | March 10, 2020 | |
/s/ Joseph E. Kluger | ||
Joseph E. Kluger, Director | March 10, 2020 | |
/s/ Charles E. Kranich, III | ||
Charles E. Kranich, III, Director | March 10, 2020 | |
/s/ Robert Q, Miller | ||
Robert Q, Miller, Director | March 10, 2020 | |
/s/ John G. Nackley | ||
John G. Nackley, Director | March 10, 2020 | |
/s/ Jill F. Schwartz | ||
Jill F. Schwartz, Director | March 10, 2020 | |
/s/ William H. Rockey | ||
William H. Rockey, Director | March 10, 2020 | |
/s/ Ronald A. Walko | ||
Ronald A. Walko, Director | March 10, 2020 | |
91