UNITED STATES
SECURITIES AND EXCHANGE COMMISSION
WASHINGTON, D.C. 20549
_____________________________________________________
FORM 10-K
(Mark One)
ý | ANNUAL REPORT PURSUANT TO SECTION 13 OR 15(d) OF THE SECURITIES EXCHANGE ACT OF 1934 for the fiscal year ended December 31, 2013 | |
or
¨ | TRANSITION REPORT PURSUANT TO SECTION 13 OR 15(d) OF THE SECURITIES EXCHANGE ACT OF 1934 For the transition period from to | |
Commission File No. 1-3157
INTERNATIONAL PAPER COMPANY
(Exact name of registrant as specified in its charter)
New York | 13-0872805 | |
(State or other jurisdiction of incorporation or organization) | (I.R.S. Employer Identification No.) | |
6400 Poplar Avenue
Memphis, Tennessee
(Address of principal executive offices)
38197
(Zip Code)
Registrant’s telephone number, including area code: (901) 419-7000
_____________________________________________________
Securities registered pursuant to Section 12(b) of the Act:
Title of each class | Name of each exchange on which registered | |
Common Stock, $1 per share par value | New York Stock Exchange | |
_____________________________________________________
Securities Registered Pursuant to Section 12(g) of the Act: None
Indicate by check mark if the registrant is a well-known seasoned issuer, as defined in Rule 405 of the Securities Act.
Yes ý No ¨
Indicate by check mark if the registrant is not required to file reports pursuant to Section 13 or Section 15(d) of the Act.
Yes ¨ No ý
Indicate by check mark whether the registrant (1) has filed all reports required to be filed by Section 13 or 15(d) of the Securities Exchange Act of 1934 during the preceding 12 months (or for such shorter period that the registrant was required to file such reports), and (2) has been subject to such filing requirements for the past 90 days. Yes ý No ¨
Indicate by check mark whether the registrant has submitted electronically and posted on its corporate Website, if any, every Interactive Data File required to be submitted and posted pursuant to Rule 405 of Regulation S-T (section 232.405 of this chapter) during the preceding 12 months (or for such shorter period that the registrant was required to submit and post such files). Yes ý No ¨
Indicate by check mark if disclosure of delinquent filers pursuant to Item 405 of Regulation S-K (section 229.405) is not contained herein, and will not be contained, to the best of registrant’s knowledge, in definitive proxy or information statements incorporated by reference in Part III of this Form 10-K or any amendment to this Form 10-K. ý
Indicate by check mark whether the registrant is a large accelerated filer, an accelerated filer, a non-accelerated filer or a smaller reporting company. See definitions of “large accelerated filer,” “accelerated filer” and “smaller reporting company” in Rule 12b-2 of the Exchange Act. (Check one):
Large accelerated filer x | Accelerated filer | Non-accelerated filer | Smaller reporting company | |||
(Do not check if a smaller reporting company) | ||||||
Indicate by check mark whether the registrant is a shell company (as defined in Rule 12b-2 of the Act). Yes ¨ No ý
The aggregate market value of the Company’s outstanding common stock held by non-affiliates of the registrant, computed by reference to the closing price as reported on the New York Stock Exchange, as of the last business day of the registrant’s most recently completed second fiscal quarter (June 30, 2013) was approximately $19,567,052,215.
The number of shares outstanding of the Company’s common stock as of February 19, 2014 was 438,800,916.
Documents incorporated by reference:
Portions of the registrant’s proxy statement filed within 120 days of the close of the registrant’s fiscal year in connection with registrant’s 2014 annual meeting of shareholders are incorporated by reference into Part III of this Form 10-K.
1
INTERNATIONAL PAPER COMPANY
INDEX TO ANNUAL REPORT ON FORM 10-K
FOR THE YEAR ENDED DECEMBER 31, 2013
PART I. | ||
ITEM 1. | ||
ITEM 1A. | ||
ITEM 1B. | ||
ITEM 2. | ||
ITEM 3. | ||
ITEM 4. | ||
PART II. | ||
ITEM 5. | ||
ITEM 6. | ||
ITEM 7. | ||
INTERNATIONAL PAPER COMPANY
INDEX TO ANNUAL REPORT ON FORM 10-K
FOR THE YEAR ENDED DECEMBER 31, 2013
ITEM 7A. | ||
ITEM 8. | ||
ITEM 9. | ||
ITEM 9A. | ||
ITEM 9B. | ||
PART III. | ||
ITEM 10. | ||
ITEM 11. | ||
ITEM 12. | ||
ITEM 13. | ||
ITEM 14. | ||
PART IV. | ||
ITEM 15. | ||
APPENDIX I | ||
APPENDIX II | ||
International Paper Company (the “Company” or “International Paper,” which may also be referred to as “we” or “us”) is a global paper and packaging company that is complemented by an extensive North American merchant distribution system, with primary markets and manufacturing operations in North America, Europe, Latin America, Russia, Asia, Africa and the Middle East. We are a New York corporation, incorporated in 1941 as the successor to the New York corporation of the same name organized in 1898. Our home page on the Internet is www.internationalpaper.com. You can learn more about us by visiting that site.
In the United States, at December 31, 2013, the Company operated 25 pulp, paper and packaging mills, 181 converting and packaging plants, 18 recycling plants and three bag facilities. Production facilities at December 31, 2013 in Europe, Asia, Africa, India, Latin America and South America included 16 pulp, paper and packaging mills, 72 converting and packaging plants, and two recycling plants. We distribute printing, packaging, graphic arts, maintenance and industrial products principally through over 81 distribution branches in the United States and 17 distribution branches located in Mexico and Asia. At December 31, 2013, we owned or managed approximately 332,000 acres of forestland in Brazil and had, through licenses and forest management agreements, harvesting rights on government-owned forestlands in Russia. Substantially all of our businesses have experienced, and are likely to continue to experience, cycles relating to industry capacity and general economic conditions.
For management and financial reporting purposes, our businesses are separated into four segments: Industrial Packaging; Printing Papers; Consumer Packaging; and Distribution. A description of these business segments can be found on pages 27 through 29 of Item 7. Management’s Discussion and Analysis of Financial Condition and Results of Operations. The Company’s 50% equity interest in Ilim Holding S.A. is also a separate reportable industry segment.
On January 28, 2014, we announced that International Paper, xpedx Holding Company (“SpinCo”), a company we recently formed to hold xpedx, the business of which comprises our Distribution segment, UWW Holdings, Inc. (“Unisource”) and related entities had entered into a merger agreement, a contribution and distribution agreement and related agreements, providing for the pro rata, tax-free, spin-off distribution of shares of common stock of SpinCo to International Paper’s shareholders and the merger of Unisource with and into SpinCo with SpinCo as the surviving company in the
merger. As a result of the spin-off distribution and the merger, International Paper’s shareholders will own approximately 51%, and the sole shareholder of Unisource will own approximately 49%, of the shares of common stock of SpinCo on a fully diluted basis. We anticipate that the spin-off distribution and the merger will be completed in mid-2014. You can find discussions of the transaction in Item 1A. Risk Factors - Risks Relating to Our Operations and Item 7. Management’s Discussion and Analysis of Financial Condition and Results of Operations - Description of Industry Segments.
From 2009 through 2013, International Paper’s capital expenditures approximated $5.0 billion, excluding mergers and acquisitions. These expenditures reflect our continuing efforts to improve product quality and environmental performance, as well as lower costs, maintain reliability of operations and improve forestlands. Capital spending for continuing operations in 2013 was approximately $1.2 billion and is expected to be approximately $1.4 billion in 2014. You can find more information about capital expenditures on page 35 of Item 7. Management’s Discussion and Analysis of Financial Condition and Results of Operations.
Discussions of acquisitions can be found on pages 35 through 37 of Item 7. Management’s Discussion and Analysis of Financial Condition and Results of Operations.
You can find discussions of restructuring charges and other special items on pages 25 through 27 of Item 7. Management’s Discussion and Analysis of Financial Condition and Results of Operations.
Throughout this Annual Report on Form 10-K, we “incorporate by reference” certain information in parts of other documents filed with the Securities and Exchange Commission (SEC). The SEC permits us to disclose important information by referring to it in that manner. Please refer to such information. Our annual reports on Form 10-K, quarterly reports on Form 10-Q and current reports on Form 8-K, along with all other reports and any amendments thereto filed with or furnished to the SEC, are publicly available free of charge on the Investor Relations section of our Internet Web site at www.internationalpaper.com as soon as reasonably practicable after we electronically file such material with, or furnish it to, the SEC. The information contained on or connected to our Web site is not incorporated by reference into this Form 10-K and should not be considered part of this or any other report that we filed with or furnished to the SEC.
The financial information concerning segments is set forth in Note 19 Financial Information by Industry
1
Segment and Geographic Area on pages 89 through 91 of Item 8. Financial Statements and Supplementary Data.
The financial information concerning international and U.S. operations and export sales is set forth in Note 19 Financial Information by Industry Segment and Geographic Area on page 91 of Item 8. Financial Statements and Supplementary Data.
The markets in the pulp, paper and packaging product lines are large and fragmented. The major markets, both U.S. and non-U.S., in which the Company sells its principal products are very competitive. Our products compete with similar products produced by other forest products companies. We also compete, in some instances, with companies in other industries and against substitutes for wood and wood-fiber products.
Many factors influence the Company’s competitive position, including price, cost, product quality and services. You can find more information about the impact of these factors on operating profits on pages 20 through 34 of Item 7. Management’s Discussion and Analysis of Financial Condition and Results of Operations. You can find information about the Company’s manufacturing capacities on page A-4 of Appendix II.
The Company sells paper, packaging products and other products directly to end users and converters, as well as through agents, resellers and paper distributors. We own a large merchant distribution business that sells products made both by International Paper and by other companies making paper, paperboard, packaging, graphic arts supplies and maintenance and industrial products. Sales offices are located throughout the United States as well as internationally.
The Company’s principal products are described on pages 27 through 29 of Item 7. Management’s Discussion and Analysis of Financial Condition and Results of Operations.
2
Sales volumes of major products for 2013, 2012 and 2011 were as follows:
Sales Volumes by Product (1)
In thousands of short tons | 2013 | 2012 | 2011 | |||
Industrial Packaging | ||||||
North American Corrugated Packaging (2) | 10,393 | 10,523 | 7,424 | |||
North American Containerboard (2) | 3,273 | 3,228 | 2,371 | |||
North American Recycling | 2,379 | 2,349 | 2,435 | |||
North American Saturated Kraft | 176 | 166 | 161 | |||
North American Gypsum/Release Kraft (2) | 157 | 135 | — | |||
North American Bleached Kraft | 132 | 114 | 95 | |||
EMEA Industrial Packaging (3) | 1,342 | 1,032 | 1,047 | |||
Asian Box | 416 | 410 | 444 | |||
Brazilian Packaging (4) | 297 | — | — | |||
Industrial Packaging | 18,565 | 17,957 | 13,977 | |||
Printing Papers | ||||||
U.S. Uncoated Papers | 2,508 | 2,617 | 2,616 | |||
European and Russian Uncoated Papers | 1,413 | 1,286 | 1,218 | |||
Brazilian Uncoated Papers | 1,150 | 1,165 | 1,141 | |||
Indian Uncoated Papers | 232 | 246 | 49 | |||
Uncoated Papers | 5,303 | 5,314 | 5,024 | |||
Market Pulp (5) | 1,711 | 1,593 | 1,410 | |||
Consumer Packaging | ||||||
North American Consumer Packaging | 1,556 | 1,507 | 1,560 | |||
European and Russian Coated Paperboard | 355 | 372 | 332 | |||
Asian Coated Paperboard | 1,430 | 1,059 | 998 | |||
Consumer Packaging | 3,341 | 2,938 | 2,890 | |||
(1) | Includes third-party and inter-segment sales and excludes sales of equity investees. |
(2) | Includes Temple-Inland volumes from date of acquisition in February 2012. |
(3) | Includes Turkish box plants beginning in Q1 2013 when a majority ownership was acquired. |
(4) | Includes Brazil Packaging from date of acquisition in mid- January 2013. |
(5) | Includes internal sales to mills. |
3
The Company operates its primary research and development center in Loveland, Ohio, as well as several product laboratories. Additionally, the Company has an interest in ArborGen, Inc., a joint venture with certain other forest products companies.
We direct research and development activities to short-term, long-term and technical assistance needs of customers and operating divisions, and to process, equipment and product innovations. Activities include product development within the operating divisions; studies on innovation and improvement of pulping, bleaching, chemical recovery, papermaking, converting and coating processes; packaging design and materials development; mechanical packaging systems, environmentally sensitive printing inks and reduction of environmental discharges; re-use of raw materials in manufacturing processes; recycling of consumer and packaging paper products; energy conservation; applications of computer controls to manufacturing operations; innovations and improvement of products; and development of various new products. Our development efforts specifically address product safety as well as the minimization of solid waste. The cost to the Company of its research and development operations was $18 million in 2013, $13 million in 2012 and $13 million in 2011.
We own numerous patents, copyrights, trademarks, trade secrets and other intellectual property rights relating to our products and to the processes for their production. We also license intellectual property rights to and from others where necessary. Many of the manufacturing processes are among our trade secrets. Some of our products are covered by U.S. and non-U.S. patents and are sold under well known trademarks. We derive a competitive advantage by protecting our trade secrets, patents, trademarks and other intellectual property rights, and by using them as required to support our businesses.
International Paper is subject to extensive federal and state environmental regulation as well as similar regulations internationally. Our continuing objectives include: (1) controlling emissions and discharges from our facilities into the air, water and groundwater to avoid adverse impacts on the environment, and (2) maintaining compliance with applicable laws and regulations. The Company spent $61 million in 2013 for capital projects to control environmental releases into the air and water, and to assure environmentally sound management and disposal of waste. We expect to spend approximately $140 million in 2014 for similar capital projects, including expenditures associated with the U.S. Environmental Protection Agency's (EPA) Boiler MACT (maximum achievable control technology)
regulations. Capital expenditures for 2015 environmental capital projects are anticipated to be approximately $160 million, including Boiler MACT costs. Capital expenditures for 2016 environmental capital projects are estimated to be $110 million, including Boiler MACT costs. On January 31, 2013, the EPA issued the final Boiler MACT suite of regulations. These regulations require owners of specified boilers to meet revised air emissions standards for certain substances. Several lawsuits have been filed to challenge all or portions of the Boiler MACT regulations. As such, the projected capital expenditures for environmental capital projects represent our current best estimate of future expenditures with the recognition that the Boiler MACT regulations are subject to change.
In the U.S., air quality regulations finalized by the EPA during 2013 are not expected to have a material impact on the Company. To date, revisions to National Ambient Air Quality Standards (NAAQS) for sulfur dioxide (SO2), nitrogen dioxide (NO2), and fine particulate (PM2.5) finalized between 2010 and 2012 have not had a material impact on the Company. Regulations addressing specific implementation issues related to the SO2 NAAQS are being developed by the EPA and are expected to be finalized during the next two years. Potentially material capital investment might be required in response to these emerging requirements.
Climate change refers to any significant change in the measure of the earth’s climatic conditions such as temperature, precipitation, or winds that persist for decades or longer. Climate change can be caused by natural factors, such as changes in the sun’s intensity and ocean circulation, and human activities can also affect the composition of the earth’s atmosphere, such as from the burning of fossil fuels. In an effort to mitigate the potential of climate change impacts from human activities, various international, national and sub-national (regional, state and local) governmental actions have been undertaken. Presently, these efforts have not materially impacted International Paper, but such efforts might have a material impact on the Company in the future.
International Efforts
In 1997, the Kyoto Protocol established emission reduction obligations for certain countries where the Company had and continues to have operations. Though the Kyoto Protocol expired in 2012, several countries, and most notably the European Union (EU), extended their emissions commitments until 2020. A successor program to the Kyoto Protocol is the subject of on-going international negotiations. It is not yet clear if these negotiations will result in a new International
4
Climate Change Agreement and, if so, what form it will take. Due to this uncertainty, it is not possible at this time to estimate the potential impacts of future international agreements on the Company.
To assist member countries in meeting obligations under the Kyoto Protocol, the EU established and continues to operate an Emissions Trading System (EU ETS). Currently, we have two sites directly subject to regulation under Phase III of the EU ETS, one in Poland and one in France. Other sites that we operate in the EU experience indirect impacts of the EU ETS through purchased power pricing. Neither the direct nor indirect impacts of the EU ETS have been material to the company, but they could be material to the company in the future depending on how allocation of and market prices for greenhouse gas (GHG) credits evolve over the coming years.
National Efforts
In the U.S., the Kyoto Protocol was not ratified and Congress has not passed GHG legislation. The U.S. EPA has acted regulatorily to control GHGs from mobile sources (through transportation fuel efficiency standards) and requires reporting of GHGs from sources of GHGs greater than 25,000 tons per year. In 2013, the Company reported to EPA the GHG emissions from 23 of our U.S. manufacturing sites and 7 landfills. In 2010, EPA issued GHG regulations for new and modified sources under the New Source Review and Title V Operating Permit programs. However, EPA deferred the applicability of these GHGs regulations to biomass emissions until the summer of 2014 to allow a Science Advisory Board (SAB) to provide input to EPA on how to incorporate the concept of carbon neutrality for biomass into their regulatory processes. Before EPA could act on the SAB report, the U.S. Court of Appeals for the District of Columbia ruled that the EPA could not administratively defer regulation of biomass GHG emissions. The mandate for the biomass deferral vacature has yet to be acted upon and thus it is unclear how EPA will incorporate the decision into climate change regulations.
EPA has also issued final regulations establishing New Source Performance Standards (NSPS) for new Electrical Generating Units (EGUs). This regulation is the first of several expected NSPSs that EPA will implement over the coming years. Currently, the EPA has not identified the pulp and paper industry in the first phase of sectors to be covered by the new standards. However, we anticipate that at some future time pulp and paper sources will be subject to new GHG NSPS rules. It is unclear what impacts, if any, future GHG NSPS rules will have on the Company’s operations.
State, Regional and Local Measures
A few U.S. states have enacted or are considering legal measures to require the reduction of emissions of greenhouse gases by companies and public utilities, primarily through the development of greenhouse gas emission inventories or regional GHG cap-and-trade programs. One such state is California. The Company does not have any sites currently subject to California's GHG regulatory plan. There may be indirect impacts from changing input costs (such as electricity) at some of our California converting operations but these have yet to manifest themselves in material impacts. Although we are monitoring proposed programs in other states, it is unclear what impacts, if any, state level GHG rules will have on the Company’s operations.
Summary
Regulation of greenhouse gases continues to evolve in various countries in which we do business. While it is likely that there will be increased governmental action regarding greenhouse gases and climate change, at this time it is not reasonably possible to estimate either a timetable for the implementation of any new regulations or our costs of compliance. In addition to possible direct impacts, future legislation and regulation could have indirect impacts on International Paper, such as higher prices for transportation, energy and other inputs, as well as more protracted air permitting processes, causing delays and higher costs to implement capital projects. International Paper has controls and procedures in place to stay adequately informed about developments concerning possible climate change legislation and regulation in the U.S. and in other countries where we operate. We regularly assess whether such legislation or regulation may have a material effect on the Company, its operations or financial condition, and whether we have any related disclosure obligations.
Additional information regarding climate change and International Paper, including our emissions for 2013, are available in our Sustainability Report found at http://www.internationalpaper.com/US/EN/Company/Sustainability/SustainabilityReport.html, though this information is not incorporated by reference into this Form 10-K and should not be considered part of this or any other report that we file with or furnish to the SEC.
As of December 31, 2013, we had approximately 69,000 employees, 39,000 of whom were located in the United States. Of the U.S. employees, approximately 26,000 are hourly, with unions representing approximately 15,500 employees. Approximately 12,000 of the union employees are represented by the United Steel Workers (USW).
5
International Paper and the USW have negotiated two master agreements covering our USW represented mills and converting facilities, respectively. These master agreements cover several specific items, including wages, select benefit programs, successorship, employment security, and health and safety. Individual facilities continue to have local agreements for other subjects not covered by the master agreements. If local facility agreements are not successfully negotiated at the time of expiration, under the terms of the master agreements the local contracts will automatically renew with the same terms in effect. The mill master agreement covers 18 of our U. S. pulp, paper, and packaging mills; the converting agreement includes 63 of our converting facilities. In addition, International Paper is party to a master agreement with District Council 2, International Brotherhood of Teamsters, covering 16 additional converting facilities.
During 2013, 36 local labor agreements were negotiated at 13 mills, 21 converting facilities and two distribution facilities. In 2014, 50 labor agreements are scheduled to be negotiated, including seven mills, 30 converting facilities and 13 distribution facilities. Thirty-one of these agreements will automatically renew under the terms of the applicable master agreement if new agreements are not reached.
John V. Faraci, 64, chairman and chief executive officer since 2003. Mr. Faraci joined International Paper in 1974.
C. Cato Ealy, 57, senior vice president - corporate development since 2003. Mr. Ealy is a director of Ilim Holding S.A., a Swiss holding company in which International Paper holds a 50% interest, and of its subsidiary, Ilim Group. Mr. Ealy joined International Paper in 1992.
William P. Hoel, 57, senior vice president, Container The Americas, since February 2012. Mr. Hoel previously served as vice president, Container The Americas, from 2005 until 2012, senior vice president, corporate sales and marketing, from 2004 until 2005, and vice president, Wood Products, from 2000 until 2004. Mr. Hoel joined International Paper in 1983.
Tommy S. Joseph, 54, senior vice president - manufacturing, technology, EHS&S and global sourcing since January 2010. Mr. Joseph previously served as senior vice president - manufacturing, technology, EHS&S from February 2009 until December 2009, and vice president - technology from 2005 until February 2009. Mr. Joseph is a director of Ilim Holding S.A., a Swiss Holding Company in which International Paper holds a 50% interest, and of its subsidiary, Ilim Group. Mr. Joseph joined International Paper in 1983.
Thomas G. Kadien, 57, senior vice president - consumer packaging and IP Asia since January 2010. Mr. Kadien previously served as senior vice president and president - xpedx from 2005 until 2009. Mr. Kadien joined International Paper in 1978. Mr. Kadien serves on the board of directors of The Sherwin-Williams Company.
Paul J. Karre, 61, senior vice president - human resources and communications since May 2009. Mr. Karre previously served as vice president - human resources from 2000 until 2009. Mr. Karre joined International Paper in 1974.
Mary A. Laschinger, 53, senior vice president since 2007 and president - xpedx since January 2010. Ms. Laschinger previously served as president - IP Europe, Middle East, Africa and Russia from 2005 until 2010. Ms. Laschinger joined International Paper in 1992. Ms. Laschinger serves on the board of directors of the Kellogg Company.
Tim S. Nicholls, 52, senior vice president - printing and communications papers of the Americas since November 2011. Mr. Nicholls previously served as senior vice president and chief financial officer from 2007 until 2011 and vice president and executive project leader of IP Europe during 2007. Mr. Nicholls served as vice president and chief financial officer - IP Europe from 2005 until 2007. Mr. Nicholls joined International Paper in 1991.
Jean-Michel Ribieras, 51, senior vice president and president - IP Europe, Middle East, Africa and Russia since June 2013. Mr. Ribieras previously served as president - IP Latin America from 2009 until 2013. Mr. Ribieras is a director of Ilim Holding S.A., a Swiss holding company in which International Paper holds a 50% interest, and of its subsidiary, Ilim Group. Mr. Ribieras joined International Paper in 1993.
Carol L. Roberts, 54, senior vice president and chief financial officer since November 2011. Ms. Roberts previously served as senior vice president - industrial packaging from 2008 until 2011 and senior vice president - IP packaging solutions from 2005 until 2008. Ms. Roberts serves on the board of directors of Alcoa Inc. and Ilim Holding S.A., a Swiss holding company in which International Paper holds a 50% interest, and of its subsidiary, Ilim Group. Ms. Roberts joined International Paper in 1981.
Sharon R. Ryan, 54, senior vice president, general counsel and corporate secretary since November 2011. Ms. Ryan previously served as senior vice president, acting general counsel and corporate secretary from May 2011 until November 2011, and as vice president from March 2011 until May 2011. Ms. Ryan served as associate general counsel, chief ethics and compliance officer from 2009 until 2011,
6
and as associate general counsel from 2006 until 2011. Ms. Ryan joined International Paper in 1988.
Mark S. Sutton, 52, senior vice president - industrial packaging since November 2011. Mr. Sutton previously served as senior vice president - printing and communications papers of the Americas from 2010 until 2011, senior vice president - supply chain from 2008 to 2009, and vice president - supply chain from 2007 until 2008. Mr. Sutton served as vice president - strategic planning from 2005 until 2007. Mr. Sutton joined International Paper in 1984.
Raw materials essential to our businesses include wood fiber, purchased in the form of pulpwood, wood chips and old corrugated containers (OCC), and certain chemicals, including caustic soda and starch. Information concerning fiber supply purchase agreements that were entered into in connection with the Company’s 2006 Transformation Plan and the CBPR acquisition in 2008 is presented in Note 11 Commitments and Contingent Liabilities on page 68 and 69 of Item 8. Financial Statements and Supplementary Data.
Certain statements in this Annual Report on Form 10-K that are not historical in nature may be considered “forward-looking” statements within the meaning of the Private Securities Litigation Reform Act of 1995. These statements are often identified by the words, “will,” “may,” “should,” “continue,” “anticipate,” “believe,” “expect,” “plan,” “appear,” “project,” “estimate,” “intend,” and words of a similar nature. These statements are not guarantees of future performance and reflect management’s current views with respect to future events, which are subject to risks and uncertainties that could cause actual results to differ materially from those expressed or implied in these statements. Factors which could cause actual results to differ include but are not limited to: (i) the level of our indebtedness and increases in interest rates; (ii) industry conditions, including but not limited to changes in the cost or availability of raw materials, energy and transportation costs, competition we face, cyclicality and changes in consumer preferences, demand and pricing for our products; (iii) global economic conditions and political changes, including but not limited to the impairment of financial institutions, changes in currency exchange rates, credit ratings issued by recognized credit rating organizations, the amount of our future pension funding obligation, changes in tax laws and pension and health care costs; (iv) unanticipated expenditures related to the cost of compliance with existing and new environmental and other governmental regulations and to actual or potential litigation; (v) whether we
experience a material disruption at one of our manufacturing facilities; (vi) risks inherent in conducting business through a joint venture; (vii) the receipt of governmental and other approvals and favorable rulings associated with the agreed-upon transaction combining xpedx with Unisource, the successful fulfillment or waiver of all other closing conditions for the transaction without unexpected delays or conditions, and the successful closing of the transaction within the estimated timeframe; and (viii) our ability to achieve the benefits we expect from all strategic acquisitions, divestitures and restructurings. These and other factors that could cause or contribute to actual results differing materially from such forward looking statements are discussed in greater detail below in “Item 1A. Risk Factors.” We undertake no obligation to publicly update any forward-looking statements, whether as a result of new information, future events or otherwise.
All financial information and statistical measures regarding our 50/50 Ilim joint venture in Russia (“Ilim”), other than historical International Paper Equity Earnings and dividends received by International Paper, have been prepared by the management of Ilim. Ilim management has indicated that the financial information was prepared in accordance with International Financial Reporting Standards and extracted from Ilim’s financial statements, but International Paper has not verified or audited any of this information. Any projected financial information and statistical measures reflect the current views of Ilim management and are subject to risks and uncertainties that could cause actual results to differ materially from those expressed or implied by such projections.
In addition to the risks and uncertainties discussed elsewhere in this Annual Report on Form 10-K (particularly in Item 7. Management’s Discussion and Analysis of Financial Condition and Results of Operations), or in the Company’s other filings with the Securities and Exchange Commission, the following are some important factors that could cause the Company’s actual results to differ materially from those projected in any forward-looking statement.
RISKS RELATING TO INDUSTRY CONDITIONS
CHANGES IN THE COST OR AVAILABILITY OF RAW MATERIALS, ENERGY AND TRANSPORTATION COULD AFFECT OUR PROFITABILITY. We rely heavily on the use of certain raw materials (principally virgin wood fiber, recycled fiber, caustic soda and starch), energy sources (principally natural gas, coal and fuel oil) and third-party companies that transport our goods. The market price of virgin wood fiber varies based upon availability and source. Increased demand
7
for biomass to meet a growing number of government mandates and incentives to promote the use of biomass for renewable electrical energy generation may also impact pricing and availability of virgin wood fiber. In addition, the increase in demand of products manufactured, in whole or in part, from recycled fiber, on a global basis, may cause an occasional tightening in the supply of recycled fiber. Energy prices, in particular prices for oil and natural gas, have fluctuated dramatically in the past and may continue to fluctuate in the future.
Our profitability has been, and will continue to be, affected by changes in the costs and availability of such raw materials, energy sources and transportation sources.
THE INDUSTRIES IN WHICH WE OPERATE EXPERIENCE BOTH ECONOMIC CYCLICALITY AND CHANGES IN CONSUMER PREFERENCES. FLUCTUATIONS IN THE PRICES OF, AND THE DEMAND FOR, OUR PRODUCTS COULD MATERIALLY AFFECT OUR FINANCIAL CONDITION, RESULTS OF OPERATIONS AND CASH FLOWS. Substantially all of our businesses have experienced, and are likely to continue to experience, cycles relating to industry capacity and general economic conditions. The length and magnitude of these cycles have varied over time and by product. In addition, changes in consumer preferences may increase or decrease the demand for our fiber-based products and non-fiber substitutes. These consumer preferences affect the prices of our products. Consequently, our operating cash flow is sensitive to changes in the pricing and demand for our products.
COMPETITION IN THE UNITED STATES AND INTERNATIONALLY COULD NEGATIVELY IMPACT OUR FINANCIAL RESULTS. We operate in a competitive environment, both in the United States and internationally, in all of our operating segments. Product innovations, manufacturing and operating efficiencies, and marketing, distribution and pricing strategies pursued or achieved by competitors could negatively impact our financial results.
RISKS RELATING TO MARKET AND ECONOMIC FACTORS
ADVERSE DEVELOPMENTS IN GENERAL BUSINESS AND ECONOMIC CONDITIONS COULD HAVE AN ADVERSE EFFECT ON THE DEMAND FOR OUR PRODUCTS AND OUR FINANCIAL CONDITION AND RESULTS OF OPERATIONS. General economic conditions may adversely affect industrial non-durable goods production, consumer spending, commercial printing and advertising activity, white-collar employment levels and consumer confidence, all of which impact demand for our
products. In addition, volatility in the capital and credit markets, which impacts interest rates, currency exchange rates and the availability of credit, could have a material adverse effect on our business, financial condition and our results of operations.
THE LEVEL OF OUR INDEBTEDNESS COULD ADVERSELY AFFECT OUR FINANCIAL CON-
DITION AND IMPAIR OUR ABILITY TO OPERATE OUR BUSINESS. As of December 31, 2013, International Paper had approximately $9.5 billion of outstanding indebtedness, including $0 of indebtedness outstanding under our credit facilities and $8.8 billion of indebtedness outstanding under our floating and fixed rate notes. The level of our indebtedness could have important consequences to our financial condition, operating results and business, including the following:
• | it may limit our ability to obtain additional debt or equity financing for working capital, capital expenditures, product development, dividends, share repurchases, debt service requirements, acquisitions and general corporate or other purposes; |
• | a portion of our cash flows from operations will be dedicated to payments on indebtedness and will not be available for other purposes, including operations, capital expenditures and future business opportunities; |
• | the debt service requirements of our indebtedness could make it more difficult for us to satisfy other obligations; |
• | our indebtedness that is subject to variable rates of interest exposes us to increased debt service obligations in the event of increased interest rates; |
• | it may limit our ability to adjust to changing market conditions and place us at a competitive disadvantage compared to our competitors that have less debt; and |
• | it may increase our vulnerability to a downturn in general economic conditions or in our business, and may make us unable to carry out capital spending that is important to our growth. |
In addition, we are subject to agreements that require meeting and maintaining certain financial ratios and covenants. A significant or prolonged downturn in general business and economic conditions may affect our ability to comply with these covenants or meet those financial ratios and tests and could require us to take action to reduce our debt or to act in a manner contrary to our current business objectives.
CHANGES IN CREDIT RATINGS ISSUED BY NATIONALLY RECOGNIZED STATISTICAL RATING
8
ORGANIZATIONS COULD ADVERSELY AFFECT OUR COST OF FINANCING AND HAVE AN ADVERSE EFFECT ON THE MARKET PRICE OF OUR SECURITIES. Maintaining an investment-grade credit rating is an important element of our financial strategy, and a downgrade of the Company’s ratings below investment grade may limit our access to the capital markets, have an adverse effect on the market price of our securities, increase our cost of borrowing and require us to post collateral for derivatives in a net liability position. The Company’s desire to maintain its investment grade rating may cause the Company to take certain actions designed to improve its cash flow, including sale of assets, suspension or reduction of our dividend and reductions in capital expenditures and working capital.
Under the terms of the agreements governing approximately $4.3 billion of our debt as of December 31, 2013, the applicable interest rate on such debt may increase upon each downgrade in our credit rating. As a result, a downgrade in our credit rating may lead to an increase in our interest expense. There can be no assurance that such credit ratings will remain in effect for any given period of time or that such ratings will not be lowered, suspended or withdrawn entirely by the rating agencies, if, in each rating agency’s judgment, circumstances so warrant. Any such downgrade of our credit ratings could adversely affect our cost of borrowing, limit our access to the capital markets or result in more restrictive covenants in agreements governing the terms of any future indebtedness that we may incur.
DOWNGRADES IN THE CREDIT RATINGS OF BANKS ISSUING CERTAIN LETTERS OF CREDIT WILL INCREASE OUR COST OF MAINTAINING CERTAIN INDEBTEDNESS AND MAY RESULT IN THE ACCELERATION OF DEFERRED TAXES. We are subject to the risk that a bank with currently issued irrevocable letters of credit supporting installment notes delivered to the Company in connection with our 2006 and Temple-Inland's 2007 sales of forestlands may be downgraded below a required rating. Since 2006, certain banks have fallen below the required ratings threshold and were successfully replaced, or waivers were obtained regarding their replacement. As a result of continuing uncertainty in the banking environment, a number of the letter-of-credit banks currently in place remain subject to risk of downgrade and the number of qualified replacement banks remains limited. The downgrade of one or more of these banks may subject the Company to additional costs of securing a replacement letter-of-credit bank or could result in an acceleration of deferred taxes if a replacement bank cannot be obtained. See Note 12 Variable Interest Entities and Preferred Securities of Subsidiaries on pages 72 through 75 of Item 8. Financial Statements and Supplementary Data for further information.
OUR PENSION AND HEALTH CARE COSTS ARE SUBJECT TO NUMEROUS FACTORS WHICH COULD CAUSE THESE COSTS TO CHANGE. We have defined benefit pension plans covering substantially all U.S. salaried employees hired prior to July 1, 2004 and substantially all hourly and union employees regardless of hire date. We provide retiree health care benefits to certain of our U.S. salaried and certain hourly employees. Our pension costs are dependent upon numerous factors resulting from actual plan experience and assumptions of future experience. Pension plan assets are primarily made up of equity and fixed income investments. Fluctuations in actual equity market returns, changes in general interest rates and changes in the number of retirees may result in increased pension costs in future periods. Likewise, changes in assumptions regarding current discount rates and expected rates of return on plan assets and health care reform could also increase pension and health care costs. Significant changes in any of these factors may adversely impact our cash flows, financial condition and results of operations.
OUR PENSION PLANS ARE CURRENTLY UNDERFUNDED, AND OVER TIME WE MAY BE REQUIRED TO MAKE CASH PAYMENTS TO THE PLANS, REDUCING THE CASH AVAILABLE FOR OUR BUSINESS. We record a liability associated with our pension plans equal to the excess of the benefit obligation over the fair value of plan assets. The benefit liability recorded under the provisions of Accounting Standards Codification (ASC) 715, “Compensation – Retirement Benefits,” at December 31, 2013 was $2.2 billion. This includes liability for the International Paper Company pension plans as well as the Temple-Inland Retirement Plan, for which we have responsibility in connection with the Temple-Inland acquisition. The amount and timing of future contributions will depend upon a number of factors, principally the actual earnings and changes in values of plan assets and changes in interest rates.
CHANGES IN INTERNATIONAL CONDITIONS COULD ADVERSELY AFFECT OUR BUSINESS AND RESULTS OF OPERATIONS. Our operating results and business prospects could be substantially affected by risks related to the countries outside the United States in which we have manufacturing facilities or sell our products. Specifically, Brazil, Russia, Poland, China, India, and Turkey where we have substantial manufacturing facilities, are countries that are exposed to economic and political instability in their respective regions of the world. Downturns in economic activity, adverse tax consequences, fluctuations in the value of local currency versus the U.S. dollar, nationalization or any change in social, political or labor conditions in any of these countries or regions could negatively affect our financial results. Trade protection measures in favor of local producers of competing products, including
9
governmental subsidies, tax benefits and other measures giving local producers a competitive advantage over International Paper, may also adversely impact our operating results and business prospects in these countries. In addition, our international operations are subject to regulation under U.S. law and other laws related to operations in foreign jurisdictions. For example, the Foreign Corrupt Practices Act prohibits U.S. companies and their representatives from offering, promising, authorizing or making payments to foreign officials for the purpose of obtaining or retaining business abroad. Failure to comply with domestic or foreign laws could result in various adverse consequences, including the imposition of civil or criminal sanctions and the prosecution of executives overseeing our international operations.
RISKS RELATING TO LEGAL PROCEEDINGS AND COMPLIANCE COSTS
WE ARE SUBJECT TO A WIDE VARIETY OF LAWS, REGULATIONS AND OTHER GOVERNMENT REQUIREMENTS THAT MAY CHANGE IN SIGNIFICANT WAYS, AND THE COST OF COMPLIANCE WITH SUCH REQUIREMENTS COULD IMPACT OUR BUSINESS AND RESULTS OF OPERATIONS. Our operations are subject to regulation under a wide variety of U.S. federal and state and non-U.S. laws, regulations and other government requirements -- including, among others, those relating to the environment, health and safety and to labor and employment. There can be no assurance that laws, regulations and government requirements will not be changed, applied or interpreted in ways that will require us to modify our operations and objectives or affect our returns on investments by restricting existing activities and products, subjecting them to escalating costs. For example, we have incurred, and expect that we will continue to incur, significant capital, operating and other expenditures complying with applicable environmental laws and regulations. There can be no assurance that future remediation requirements and compliance with existing and new laws and requirements, including with global climate change laws and regulations, Boiler MACT and NAAQSs, will not require significant expenditures, or that existing reserves for specific matters will be adequate to cover future costs. We could also incur substantial fines or sanctions, enforcement actions (including orders limiting our operations or requiring corrective measures), natural resource damages claims, cleanup and closure costs, and third-party claims for property damage and personal injury as a result of violations of, or liabilities under, environmental laws, regulations, codes and common law. The amount and timing of environmental expenditures is difficult to predict, and, in some cases, liability may be imposed without regard to contribution or to whether we knew of, or caused, the release of
hazardous substances. As another example, we are subject to a number of labor and employment laws and regulations that could significantly increase our operating costs and reduce our operational flexibility.
RESULTS OF LEGAL PROCEEDINGS COULD HAVE A MATERIAL EFFECT ON OUR CONSOLIDATED FINANCIAL STATEMENTS. The costs and other effects of pending litigation against us cannot be determined with certainty. Although we believe that the outcome of any pending or threatened lawsuits or claims, or all of them combined, will not have a material effect on our business or consolidated financial statements, there can be no assurance that the outcome of any lawsuit or claim will be as expected.
RISKS RELATING TO OUR OPERATIONS
MATERIAL DISRUPTIONS AT ONE OF OUR MANUFACTURING FACILITIES COULD NEGATIVELY IMPACT OUR FINANCIAL RESULTS. We operate our facilities in compliance with applicable rules and regulations and take measures to minimize the risks of disruption at our facilities. A material disruption at our corporate headquarters or one of our manufacturing facilities could prevent us from meeting customer demand, reduce our sales and/or negatively impact our financial condition. Any of our manufacturing facilities, or any of our machines within an otherwise operational facility, could cease operations unexpectedly due to a number of events, including:
• | fires, floods, earthquakes, hurricanes or other catastrophes; |
• | the effect of a drought or reduced rainfall on its water supply; |
• | the effect of other severe weather conditions on equipment and facilities; |
• | terrorism or threats of terrorism; |
• | domestic and international laws and regulations applicable to our Company and our business partners, including joint venture partners, around the world; |
• | unscheduled maintenance outages; |
• | prolonged power failures; |
• | an equipment failure; |
• | a chemical spill or release; |
• | explosion of a boiler; |
• | damage or disruptions caused by third parties operating on or adjacent to one of our manufacturing facilities; |
10
• | disruptions in the transportation infrastructure, including roads, bridges, railroad tracks and tunnels; |
• | labor difficulties; and |
• | other operational problems. |
Any such downtime or facility damage could prevent us from meeting customer demand for our products and/or require us to make unplanned expenditures. If one of these machines or facilities were to incur significant downtime, our ability to meet our production targets and satisfy customer requirements could be impaired, resulting in lower sales and having a negative effect on our business and financial results.
WE ARE SUBJECT TO CYBER-SECURITY RISKS RELATED TO BREACHES OF SECURITY PERTAINING TO SENSITIVE COMPANY, CUSTOMER, EMPLOYEE AND VENDOR INFORMATION AS WELL AS BREACHES IN THE TECHNOLOGY THAT MANAGES OPERATIONS AND OTHER BUSINESS PROCESSES. International Paper business operations rely upon secure information technology systems for data capture, processing, storage and reporting. Despite careful security and controls design, implementation, updating and independent third party verification, our information technology systems, and those of our third party providers, could become subject to cyber attacks. Network, system, application and data breaches could result in operational disruptions or information misappropriation including, but not limited to interruption to systems availability, denial of access to and misuse of applications required by our customers to conduct business with International Paper. Access to internal applications required to plan our operations, source materials, manufacture and ship finished goods and account for orders could be denied or misused. Theft of intellectual property or trade secrets, and inappropriate disclosure of confidential company, employee, customer or vendor information, could stem from such incidents. Any of these operational disruptions and/or misappropriation of information could result in lost sales, business delays, negative publicity and could have a material effect on our business.
SEVERAL OPERATIONS ARE CONDUCTED BY JOINT VENTURES THAT WE CANNOT OPERATE SOLELY FOR OUR BENEFIT. Several operations, particularly in emerging markets, are carried on by joint ventures such as the Ilim joint venture in Russia. In joint ventures, we share ownership and management of a company with one or more parties who may or may not have the same goals, strategies, priorities or resources as we do. In general, joint ventures are intended to be operated for the benefit of all co-owners, rather than for our exclusive benefit. Operating a business as a joint
venture often requires additional organizational formalities as well as time-consuming procedures for sharing information and making decisions. In joint ventures, we are required to pay more attention to our relationship with our co-owners as well as with the joint venture, and if a co-owner changes, our relationship may be adversely affected. In addition, the benefits from a successful joint venture are shared among the co-owners, so that we do not receive all the benefits from our successful joint ventures.
THE AGREED-UPON TRANSACTION COMBINING XPEDX WITH UNISOURCE MAY NOT BE COMPLETED WITHIN THE EXPECTED TIMEFRAME, OR AT ALL, AND WE MAY NOT ACHIEVE THE EXPECTED BENEFITS FROM THIS DIVESTITURE OR FROM OTHER STRATEGIC ACQUISITIONS, JOINT VENTURES AND DIVESTITURES. On January 28, 2014, we announced that xpedx Holding Company (SpinCo) and Unisource will merge under the terms of a definitive agreement that will result in the creation of a new publicly traded company. The transaction will be accomplished through a Reverse Morris Trust structure in which International Paper will indirectly contribute the assets of xpedx to a newly formed wholly owned subsidiary, SpinCo, in exchange for shares of common stock of SpinCo, a special payment of $400 million, subject to adjustments, expected to be financed with new debt in SpinCo's capital structure, as well as the potential for an additional cash payment pursuant to an "earn-out" provision. International Paper will distribute shares of SpinCo to International Paper shareholders on a pro rata basis in a manner intended to be tax-free to International Paper and its shareholders. The transaction is expected to be completed in mid-2014. Completion of the transaction is subject to the satisfaction (or waiver) of a number of important conditions that are beyond our control and may prevent, delay or otherwise negatively affect its completion.
The success of the transaction will depend, in part, on the ability of the combined company to realize anticipated growth opportunities, cost savings and other synergies. SpinCo's success in realizing these growth opportunities, cost savings and other synergies, and the timing of this realization, depends on the successful integration of xpedx’s business and operations with Unisource’s business and operations. Even if the combined company is able to integrate the xpedx and Unisource businesses and operations successfully, this integration may not result in the realization of the full benefits of the growth opportunities, cost savings and other synergies currently expected from this integration within the anticipated time frame or at all. Moreover, substantial expenses will be incurred in connection with the transaction and with the integration of xpedx’s business
11
with Unisource’s business. Such expenses are difficult to estimate accurately and may exceed current estimates. Accordingly, the benefits from the transaction may be offset by costs or delays incurred in integrating the businesses.
More broadly, our strategy for long-term growth, productivity and profitability depends, in part, on our ability to accomplish prudent strategic acquisitions, joint ventures and divestitures and to realize the benefits we expect from such transactions, and we are subject to the risk that we may not achieve the expected benefits. Among the benefits we expect from potential as well as recently completed acquisitions and joint ventures are synergies, cost savings, growth opportunities or access to new markets (or a combination thereof), and in the case of divestitures, the realization of proceeds from the sale of businesses and assets to purchasers placing higher strategic value on such businesses and assets than does International Paper.
IF THE SPIN-OFF DOES NOT QUALIFY AS A TAX-FREE SPIN-OFF UNDER SECTION 355 OF THE INTERNAL REVENUE CODE OF 1986, AS AMENDED, INCLUDING AS A RESULT OF SUBSEQUENT ACQUISITIONS OF STOCK OF INTERNATIONAL PAPER OR SPINCO, THEN INTERNATIONAL PAPER AND/OR THE INTERNATIONAL PAPER SHAREHOLDERS MAY BE REQUIRED TO PAY SUBSTANTIAL U.S. FEDERAL INCOME TAXES.
The spin-off and the merger are conditioned upon International Paper’s receipt of a private letter ruling from the U.S. Internal Revenue Service (“IRS”) to the effect that the spin-off and certain related transactions will qualify as tax-free to International Paper and the International Paper shareholders for U.S. federal income tax purposes. Although a private letter ruling from the IRS generally is binding on the IRS, the IRS ruling does not rule that the spin-off satisfies every requirement for a tax-free spin-off under Section 355 of the Code, and the parties will rely solely on the opinion of counsel for comfort that such additional requirements are satisfied.
If the spin-off does not qualify as a tax-free spin-off under Section 355 of the Code, then the receipt of SpinCo common stock would be taxable to the International Paper shareholders, International Paper might recognize a substantial gain on the spin-off, and SpinCo may be required to indemnify International Paper for the tax on such gain pursuant to a tax matters agreement. There can be no assurance that SpinCo would have the resources or liquidity required to indemnify International Paper for any such taxable gain.
In addition, the spin-off will be taxable to International Paper pursuant to Section 355(e) of the Code if there is a 50% or more change in ownership of either International Paper or SpinCo, directly or indirectly, as part of a plan or series of related transactions that include the spin-off. Because the International Paper shareholders will collectively own more than 50% of our common stock following the merger, the merger alone will not cause the spin-off to be taxable to International Paper under Section 355(e) of the Code. However, Section 355(e) of the Code might apply if other acquisitions of stock of International Paper before or after the merger, or of SpinCo after the merger, are considered to be part of a plan or series of related transactions that include the spin-off.
None.
As of December 31, 2013, the Company owned or managed approximately 332,000 acres of forestlands in Brazil, and had, through licenses and forest management agreements, harvesting rights on government-owned forestlands in Russia. All owned lands in Brazil are independently third-party certified for sustainable forestry under CERFLOR and FSC.
A listing of our production facilities by segment, the vast majority of which we own, can be found in Appendix I hereto, which is incorporated herein by reference.
The Company’s facilities are in good operating condition and are suited for the purposes for which they are presently being used. We continue to study the economics of modernization or adopting other alternatives for higher cost facilities.
Given the size, scope and complexity of our business interests, we continually examine and evaluate a wide variety of business opportunities and planning alternatives, including possible acquisitions and sales or other dispositions of properties. You can find a discussion about the level of planned capital investments for 2014 on page 38, and dispositions and restructuring activities as of December 31, 2013, on pages 25 through 27 of Item 7. Management’s Discussion and Analysis of Financial Condition and Results of Operations, and on pages 59 and 60 and pages 63 and 64 of Item 8. Financial Statements and Supplementary Data.
12
Information concerning the Company’s legal proceedings is set forth in Note 11 Commitments and Contingencies on pages 68 through 72 of Item 8. Financial Statements and Supplementary Data.
Not applicable.
13
Dividend per share data on the Company’s common stock and the high and low sales prices for the Company’s common stock for each of the four quarters in 2013 and 2012 are set forth on page 92 of Item 8. Financial Statements and Supplementary Data. As of
the filing of this Annual Report on Form 10-K, the Company’s common shares are traded on the New York Stock Exchange. International Paper options are traded on the Chicago Board of Options Exchange. As of February 19, 2014, there were approximately 14,041 record holders of common stock of the Company.
The table below presents information regarding the Company’s purchase of its equity securities for the time periods presented.
PURCHASES OF EQUITY SECURITIES BY THE ISSUER AND AFFILIATED PURCHASERS.
Period | Total Number of Shares Purchased (a) | Average Price Paid per Share | Total Number of Shares (or Units) Purchased as Part of Publicly Announced Programs | Maximum Number (or Approximate Dollar Value) of Shares that May Yet Be Purchased Under the Plans or Programs (in billions) | |||||
October 1, 2013 - October 31, 2013 | 2,718,467 | $44.54 | 2,717,984 | $1.36 | |||||
November 1, 2013 - November 30, 2013 | 4,855,900 | 44.67 | 4,855,900 | 1.14 | |||||
December 1, 2013 - December 31, 2013 | 2,230,207 | 46.93 | 2,228,534 | 1.04 | |||||
Total | 9,804,574 | ||||||||
(a) | 2,156 shares were acquired from employees from share withholdings to pay income taxes under the Company’s restricted stock programs. The remainder were purchased under the Company's $1.5 Billion Share Repurchase Program announced on September 10, 2013. |
14
PERFORMANCE GRAPH
The performance graph shall not be deemed to be “soliciting material” or to be “filed” with the Commission or subject to Regulation 14A or 14C, or to the liabilities of Section 18 of the Exchange Act of 1934, as amended.
The following graph compares a $100 investment in Company stock on December 30, 2008 with a $100 investment in our Return on Invested Capital (ROIC) Peer Group and the S&P 500 also made at market close on December 30, 2008. The graph portrays total return, 2008–2013, assuming reinvestment of dividends.
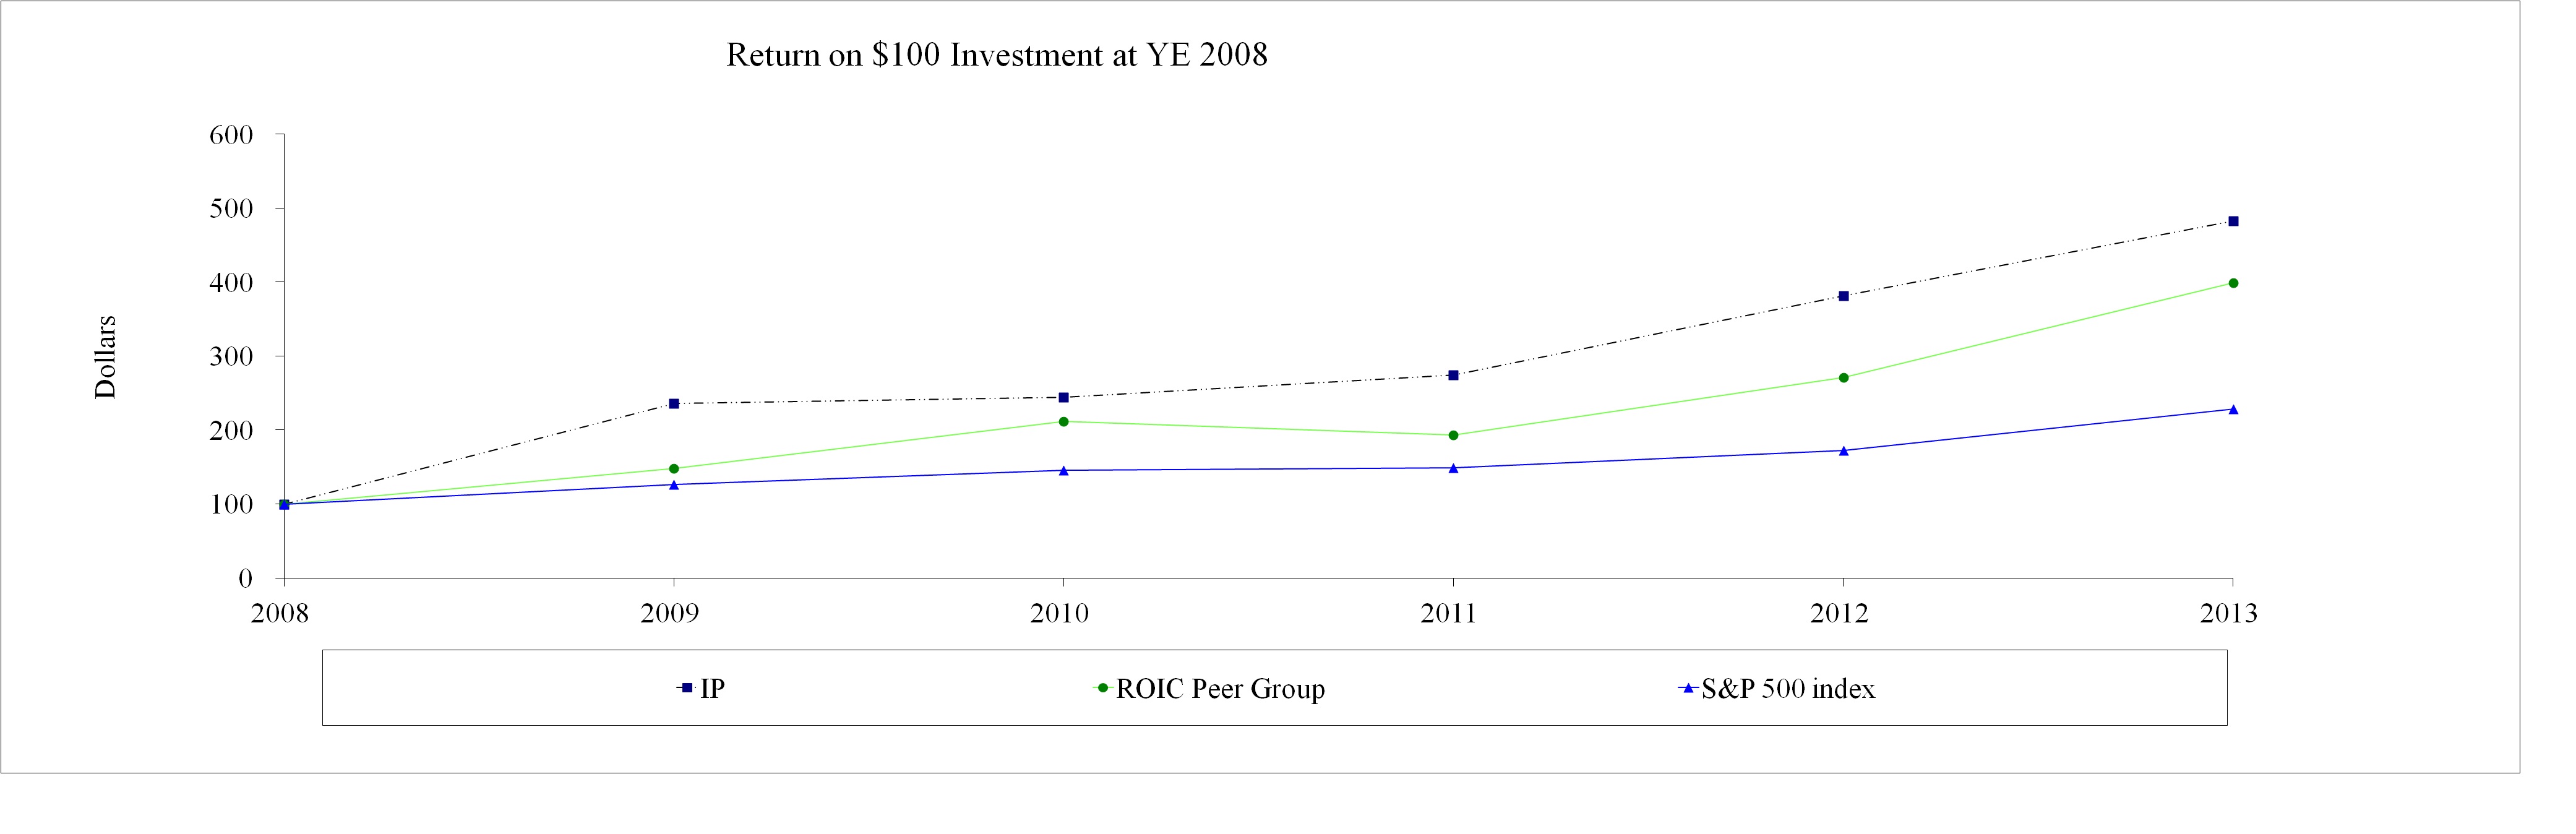
Note: The companies included in the ROIC Peer Group are Domtar Inc., Fibria Celulose S.A., Klabin S.A., MeadWestvaco Corp., Metsa Board Corporate, Mondi Group, Packaging Corporation of America, Rock-Tenn Company, Smurfit Kappa Group, Stora Enso Group, and UPM-Kymmene Corp.
15
FIVE-YEAR FINANCIAL SUMMARY (a)
Dollar amounts in millions, except per share amounts and stock prices | 2013 | 2012 | 2011 | 2010 | 2009 | |||||||||||||||
RESULTS OF OPERATIONS | ||||||||||||||||||||
Net sales | $ | 29,080 | $ | 27,833 | $ | 26,034 | $ | 25,179 | $ | 23,366 | ||||||||||
Costs and expenses, excluding interest | 27,619 | 26,137 | 24,035 | 23,749 | 21,498 | |||||||||||||||
Earnings (loss) from continuing operations before income taxes and equity earnings | 849 | (b) | 1,024 | (e) | 1,458 | (h) | 822 | (k) | 1,199 | (m) | ||||||||||
Equity earnings (loss), net of taxes | (39 | ) | 61 | 140 | 111 | (26 | ) | |||||||||||||
Discontinued operations, net of taxes | 45 | (c) | 45 | (f) | 49 | (i) | — | — | ||||||||||||
Net earnings (loss) | 1,378 | (b-d) | 799 | (e-g) | 1,336 | (h-j) | 712 | (k-l) | 704 | (m-n) | ||||||||||
Noncontrolling interests, net of taxes | (17 | ) | 5 | 14 | 21 | 18 | ||||||||||||||
Net earnings (loss) attributable to International Paper Company | 1,395 | (b-d) | 794 | (e-g) | 1,322 | (h-j) | 691 | (k-l) | 686 | (m-n) | ||||||||||
FINANCIAL POSITION | ||||||||||||||||||||
Working capital | $ | 3,898 | $ | 3,907 | $ | 5,718 | $ | 3,525 | $ | 3,539 | ||||||||||
Plants, properties and equipment, net | 13,672 | 13,949 | 11,817 | 12,002 | 12,688 | |||||||||||||||
Forestlands | 557 | 622 | 660 | 747 | 757 | |||||||||||||||
Total assets | 31,528 | 32,153 | 27,018 | 25,409 | 25,543 | |||||||||||||||
Notes payable and current maturities of long-term debt | 661 | 444 | 719 | 313 | 304 | |||||||||||||||
Long-term debt | 8,827 | 9,696 | 9,189 | 8,358 | 8,729 | |||||||||||||||
Total shareholders’ equity | 8,105 | 6,304 | 6,645 | 6,875 | 6,018 | |||||||||||||||
BASIC EARNINGS PER SHARE ATTRIBUTABLE TO INTERNATIONAL PAPER COMPANY COMMON SHAREHOLDERS | ||||||||||||||||||||
Earnings (loss) from continuing operations | $ | 3.05 | $ | 1.72 | $ | 2.95 | $ | 1.61 | $ | 1.61 | ||||||||||
Discontinued operations | 0.10 | 0.10 | 0.11 | — | — | |||||||||||||||
Net earnings (loss) | 3.15 | 1.82 | 3.06 | 1.61 | 1.61 | |||||||||||||||
DILUTED EARNINGS PER SHARE ATTRIBUTABLE TO INTERNATIONAL PAPER COMPANY COMMON SHAREHOLDERS | ||||||||||||||||||||
Earnings (loss) from continuing operations | $ | 3.01 | $ | 1.70 | $ | 2.92 | $ | 1.59 | $ | 1.61 | ||||||||||
Discontinued operations | 0.10 | 0.10 | 0.11 | — | — | |||||||||||||||
Net earnings (loss) | 3.11 | 1.80 | 3.03 | 1.59 | 1.61 | |||||||||||||||
Cash dividends | 1.2500 | 1.0875 | 0.975 | 0.400 | 0.33 | |||||||||||||||
Total shareholders’ equity | 18.57 | 14.33 | 15.21 | 15.71 | 13.90 | |||||||||||||||
COMMON STOCK PRICES | ||||||||||||||||||||
High | $ | 50.33 | $ | 39.88 | $ | 33.01 | $ | 29.25 | $ | 27.79 | ||||||||||
Low | 39.47 | 27.29 | 21.55 | 19.33 | 3.93 | |||||||||||||||
Year-end | 49.03 | 39.84 | 29.60 | 27.24 | 26.78 | |||||||||||||||
FINANCIAL RATIOS | ||||||||||||||||||||
Current ratio | 1.8 | 1.8 | 2.2 | 1.8 | 1.9 | |||||||||||||||
Total debt to capital ratio | 0.54 | 0.62 | 0.60 | 0.56 | 0.60 | |||||||||||||||
Return on shareholders’ equity | 20.2 | % | (b-d) | 11.6 | % | (e-g) | 17.9 | % | (h-j) | 11.4 | % | (k-l) | 14.1 | % | (m-n) | |||||
Return on capital employed from continuing operations attributable to International Paper Company | 7.2 | % | (b-d) | 4.8 | % | (e-g) | 7.5 | % | (h-j) | 5.3 | % | (k-l) | 5.1 | % | (m-n) | |||||
CAPITAL EXPENDITURES | $ | 1,198 | $ | 1,383 | $ | 1,159 | $775 | $534 | ||||||||||||
NUMBER OF EMPLOYEES | 69,000 | 70,000 | 61,500 | 59,500 | 56,100 | |||||||||||||||
16
FINANCIAL GLOSSARY
Current ratio—
current assets divided by current liabilities.
Total debt to capital ratio—
long-term debt plus notes payable and current maturities of long-term debt divided by long-term debt, notes payable and current maturities of long-term debt and total shareholders’ equity.
Return on shareholders’ equity—
net earnings attributable to International Paper Company divided by average shareholders’ equity (computed monthly).
Return on capital employed—
the after-tax amount of earnings from continuing operations before interest divided by the average of total assets minus accounts payable and accrued liabilities (computed monthly).
FOOTNOTES TO FIVE-YEAR FINANCIAL SUMMARY
(a) | All periods presented have been restated to reflect the Temple-Inland Building Products business as discontinued operations, if applicable. |
2013:
(b) | Includes restructuring and other charges of $210 million before taxes ($131 million after taxes) including pre-tax charges of $25 million ($16 million after taxes) for early debt extinguishment costs, pre-tax charges of $32 million ($19 million after taxes) for costs associated with the restructuring of the Company's xpedx operations, pre-tax charges of $118 million ($72 million after taxes) for costs associated with the announced shutdown of our Courtland, Alabama mill, a pre-tax gain of $30 million ($19 million after taxes) for insurance reimbursements related to the 2012 Guaranty Bank legal settlement, a pre-tax charge of $45 million ($28 million after taxes) for costs associated with the permanent shutdown of a paper machine at our Augusta, Georgia mill, pre-tax charges of $22 million ($14 million after taxes) for costs associated with the spin-off of our xpedx operations and a net pre-tax gain of $2 million (a loss of $1 million after taxes) for other items. Also included are a pre-tax goodwill impairment charge of $400 million ($366 million after taxes) related to our xpedx business, a pre-tax goodwill and trade name intangible asset impairment of $127 million ($122 million after taxes) related to our India Papers business, pre-tax charges of $9 million ($5 million ) to adjust the value of two Company airplanes to fair value, pre-tax charges of $62 million ($38 million after taxes) for integration costs associated with the acquisition of Temple-Inland, pre-tax charges of $6 |
million ($4 million after taxes) for an environmental reserve related to the Company's property in Cass Lake, Minnesota, and a gain of $13 million (before and after taxes) related to a bargain purchase adjustment on the acquisition of a majority share of our operations in Turkey.
(c) | Includes the operating results of the Temple-Inland Building Products business through the date of sale in July 2013 and pre-tax charges of $24 million ($19 million after taxes) for expenses associated with the divestiture of the Temple-Inland Building Products business. |
(d) | Includes a tax benefit of $744 million associated with the closings of U.S. federal tax audits, a tax benefit of $31 million for an income tax reserve release and a net tax loss of $1 million for other items. |
2012:
(e) | Includes restructuring and other charges of $109 million before taxes ($70 million after taxes) including pre-tax charges of $48 million ($30 million after taxes) for early debt extinguishment costs, pre-tax charges of $44 million ($28 million after taxes) for costs associated with the restructuring of the Company's xpedx operations, and pre-tax charges of $17 million ($12 million after taxes) for costs associated with the restructuring of the Company's Packaging business in EMEA. Also included are a pre-tax charge of $20 million ($12 million after taxes) related to the write-up of the Temple-Inland inventories to fair value, pre-tax charges of $164 million ($108 million after taxes) for integration costs associated with the acquisition of Temple-Inland, a pre-tax charge of $62 million ($38 million after taxes) to adjust the long-lived assets of the Hueneme mill in Oxnard, California to their fair value in anticipation of its divestiture, and pre-tax charges of $29 million ($55 million after taxes) for costs associated with the divestiture of three containerboard mills. |
(f) | Includes pre-tax charges of $15 million ($9 million after taxes) for expenses associated with pursuing the divestiture of the Temple-Inland Building Products business and the operating results of the Temple-Inland Building Products business. |
(g) | Includes a net tax expense of $14 million related to internal restructurings and a $5 million expense to adjust deferred tax assets related to post-retirement prescription drug coverage (Medicare Part D reimbursement). |
17
2011:
(h) | Includes restructuring and other charges of $102 million before taxes ($90 million after taxes) including pre-tax charges of $49 million ($34 million after taxes) for costs associated with the restructuring of the Company’s xpedx operations, pre-tax charges of $32 million ($19 million after taxes) for early debt extinguishment costs, pre-tax charges of $18 million ($12 million after taxes) for costs associated with the acquisition of a majority share of Andhra Pradesh Paper Mills Limited in India, pre-tax charges of $20 million ($12 million after taxes) for costs associated with signing an agreement to acquire Temple-Inland, and a pre-tax gain of $24 million ($15 million after taxes) related to the reversal of environmental and other reserves due to the announced repurposing of a portion of the Franklin mill. Also included are a pre-tax charge of $27 million ($17 million after taxes) for an environmental reserve related to the Company’s property in Cass Lake, Minnesota, a pre-tax charge of $129 million ($104 million after taxes) for a fixed-asset impairment of the North American Shorewood business, pre-tax charges of $78 million (a gain of $143 million after taxes) to reduce the carrying value of the Shorewood business based on the terms of the definitive agreement to sell this business, and a charge of $11 million (before and after taxes) for asset impairment costs associated with the Inverurie, Scotland mill which was closed in 2009. |
(i) | Includes a pre-tax gain of $50 million ($30 million after taxes) for an earnout provision related to the sale of the Company’s Kraft Papers business completed in January 2007. Also, the Company sold its Brazilian Coated Paper business in the third quarter 2006. Local country tax contingency reserves were included in the business’ operating results in 2005 and 2006 for which the related statute of limitations has expired. The reserves were reversed and a tax benefit of $15 million plus associated interest income of $6 million ($4 million after taxes) was recorded. |
(j) | Includes a tax benefit of $222 million related to the reduction of the carrying value of the Shorewood business and the write-off of a deferred tax liability associated with Shorewood, a $24 million tax expense related to internal restructurings, a $9 million tax expense for costs associated with our acquisition of a majority share of Andhra Pradesh Paper Mills Limited in India, a $13 million tax benefit related to the release of a deferred tax asset valuation allowance, and a $2 million tax expense for other items. |
2010:
(k) | Includes restructuring and other charges of $394 million before taxes ($242 million after taxes) including pre-tax charges of $315 million ($192 million after taxes) for shutdown costs related to the Franklin, Virginia mill, a pre-tax charge of $35 million ($21 million after taxes) for early debt extinguishment costs, pre-tax charges of $7 million ($4 million after taxes) for closure costs related to the Bellevue, Washington container plant, a pre-tax charge of $11 million ($7 million after taxes) for an Ohio Commercial Activity tax adjustment, a pre-tax charge of $6 million ($4 million after taxes) for severance and benefit costs associated with the Company’s S&A reduction initiative, and a pre-tax charge of $8 million ($5 million after taxes) for costs associated with the reorganization of the Company’s Shorewood operations. Also included are a pre-tax charge of $18 million ($11 million after taxes) for an environmental reserve related to the Company’s property in Cass Lake, Minnesota, and a pre-tax gain of $25 million ($15 million after taxes) related to the partial redemption of the Company’s interests in Arizona Chemical. |
(l) | Includes tax expense of $14 million and $32 million for tax adjustments related to incentive compensation and Medicare Part D deferred tax write-offs, respectively, and a $40 million tax benefit related to cellulosic bio-fuel tax credits. |
2009:
(m) | Includes restructuring and other charges of $1.4 billion before taxes ($853 million after taxes), including pre-tax charges of $469 million ($286 million after taxes), $290 million ($177 million after taxes), and $102 million ($62 million after taxes) for shutdown costs for the Albany, Oregon, Franklin, Virginia and Pineville, Louisiana mills, respectively, a pre-tax charge of $82 million ($50 million after taxes) for costs related to the shutdown of a paper machine at the Valliant, Oklahoma mill, a pre-tax charge of $148 million ($92 million after taxes) for severance and benefit costs associated with the Company’s 2008 overhead cost reduction initiative, a pre-tax charge of $185 million ($113 million after taxes) for early debt extinguishment costs, a pre-tax charge of $23 million ($28 million after taxes) for closure costs associated with the Inverurie, Scotland mill, and a charge of $31 million, before and after taxes, for severance and other costs associated with the planned closure of the Etienne mill in France, and a pre-tax charge of $23 million ($14 million after taxes) for other items. Also included are a pre-tax gain of $2.1 billion ($1.4 billion after taxes) related to alternative fuel mixture credits, a pre-tax charge of $87 million ($54 million |
18
after taxes) for integration costs associated with the CBPR acquisition, and a charge of $56 million to write down the assets at the Etienne mill in France to estimated fair value.
(n) | Includes a $156 million tax expense for the write-off of deferred tax assets in France, a $15 million tax expense for the write-off of a deferred tax asset for a recycling credit in the state of Louisiana and a $26 million tax benefit related to the settlement of the 2004 and 2005 U.S. federal income tax audit and related state income tax effects. |
19
Operating Earnings (a non-GAAP measure) is defined as net earnings from continuing operations (a GAAP measure) excluding special items and non-operating pension expense. International Paper generated Operating Earnings per diluted share attributable to common shareholders of $3.16 in 2013, compared with $2.65 in 2012, and $3.12 in 2011. Diluted earnings (loss) per share attributable to common shareholders were $3.11 in 2013, compared with $1.80 in 2012 and $3.03 in 2011.
International Paper delivered strong results during 2013, driven by margin expansion across many of our businesses. Year-over-year revenues grew despite a challenging economic environment. We generated record cash flow from operations of $3 billion. Strong free cash flow enabled the Company to return cash to our shareholders in the form of a share buy-back program instituted during the 2013 third quarter and a 17% increase in the quarterly dividend beginning with the 2013 fourth quarter dividend payment.
Our 2013 results reflect the significant progress we made on the pricing front particularly in our North American Industrial Packaging business along with solid manufacturing operations. Year-over-year sales volumes were down but we managed to offset some of this decline as the year progressed, mainly through our North American Industrial Packaging business. Input costs were a headwind in 2013, as expected, largely driven by increased fiber costs in the second half of the year. We made decisions during 2013 to rationalize capacity in our Consumer Packaging and North American Printing Papers businesses through the shutdown of a paper machine at our Augusta facility and initiating the closure of our Courtland mill, respectively. Also during the year, we finalized acquisitions in Turkey and Brazil and completed the sale of the Temple-Inland Building Products business. There was steady progress in the ramp-ups of the two capital projects at our Ilim joint venture in Russia but the operational benefits were offset by higher costs of the start-ups and unfavorable foreign currency movements driven by Ilim’s U.S. dollar denominated debt. Finally, we made significant progress during 2013 towards the spin-off of the xpedx distribution business to our shareholders culminating in the signing of a definitive merger agreement in January 2014.
Overall, 2013 reflects our successful efforts to drive margin growth through greater price realizations coupled with solid operational performance. We generated returns in excess of our cost of capital while further strengthening our balance sheet through debt pay downs and favorable
movements in our net pension liability. We exited 2013 with significant momentum with the expectation that we will continue to generate a stronger performance in the business in 2014.
Looking ahead to the 2014 first quarter, seasonally lower sales volumes in the Brazilian and European Printing Papers businesses combined with the impact from the full shutdown at Courtland and the coated paperboard project at our Kwidzyn will more than offset the volume benefits from two additional shipping days in our North American Industrial Packaging business. Additionally, the severe weather events impacting much of the U.S. in early 2014 will further negatively impact volumes. The full implementation of the cutsize price increase in the 2013 fourth quarter will improve pricing for our North American Printing Papers business. Sales margins in the North American and Brazilian Industrial Packaging businesses are expected to reflect more favorable mix and pricing. The negative impact from input costs in the 2014 first quarter will be significant due in large part to the extreme temperatures affecting much of the U.S. both in terms of unit cost pressure and higher consumption. Planned maintenance downtime costs should increase in North America as we pull more outages into the 2014 first quarter while costs in our European Printing Papers business should be lower. Equity earnings from our Ilim joint venture are expected to be relatively flat with 2013 fourth quarter results absent any negative impact from foreign currency movements driven by Ilim’s U.S. dollar denominated debt.
For the 2014 full year, we do not anticipate macroeconomic conditions significantly better than those experienced during 2013. Even in light of this, we expect a meaningful increase in year-over-year earnings. There are significant optimization opportunities in our North American Industrial Packaging business which we expect to further realize during 2014. Additionally, the Ilim project and cost synergy projects at Orsa will provide opportunities to increase earnings during 2014. We expect input cost inflation similar to that experienced during 2013. The 2014 tax rate should return to a more normal level due to the non-repeat of benefits recognized in 2013. Finally, free cash flow generation should continue to grow which will enable us to continue a balanced approach to cash allocation and to return a significant amount of cash to our shareholders.
Free cash flow (a non-GAAP measure) of $1.8 billion generated in 2013 was higher than the $1.6 billion generated in 2012 and the $1.7 billion generated in 2011 (see reconciliation on page 35).
Operating Earnings per share attributable to common shareholders of $0.83 in the fourth quarter of 2013 were lower than the $1.05 in the 2013 third quarter and higher than the $0.69 in the 2012 fourth quarter. Diluted earnings (loss) per share attributable to common shareholders
20
were $0.98 in the fourth quarter of 2013, compared with $0.85 in the third quarter of 2013 and $0.53 in the fourth quarter of 2012.
Free cash flow of $595 million generated in the 2013 fourth quarter was higher than the $454 million generated in the 2013 third quarter and the $384 million generated in the 2012 fourth quarter (see reconciliation on page 35).
Operating Earnings is a non-GAAP measure. Diluted earnings (loss) per share attributable to International Paper Company common shareholders is the most direct comparable GAAP measure. The Company calculates Operating Earnings by excluding the after-tax effect of items considered by management to be unusual from the earnings reported under GAAP, non-operating pension expense and discontinue operations. Management uses this measure to focus on on-going operations, and believes that it is useful to investors because it enables them to perform meaningful comparisons of past and present operating results. The Company believes that using this information, along with the most direct comparable GAAP measure, provides for a more complete analysis of the results of operations. The following are reconciliations of Operating Earnings per share attributable to International Paper Company common shareholders to diluted earnings (loss) per share attributable to International Paper Company common shareholders.
2013 | 2012 | 2011 | |||||||
Operating Earnings (Loss) Per Share Attributable to Shareholders | $ | 3.16 | $ | 2.65 | $ | 3.12 | |||
Non-operating pension expense | (0.44 | ) | (0.26 | ) | (0.06 | ) | |||
Special items | 0.29 | (0.69 | ) | (0.14 | ) | ||||
Diluted Earnings (Loss) Per Share from Continuing Operations | 3.01 | 1.70 | 2.92 | ||||||
Discontinued operations | 0.10 | 0.10 | 0.11 | ||||||
Diluted Earnings (Loss)Per Share Attributable to Shareholders | $ | 3.11 | $ | 1.80 | $ | 3.03 | |||
Three Months Ended December 31, 2013 | Three Months Ended September 30, 2013 | Three Months Ended December 31, 2012 | ||||||||||
Operating Earnings (Loss) Per Share Attributable to Shareholders | $ | 0.83 | $ | 1.05 | $ | 0.69 | ||||||
Non-operating pension expense | (0.11 | ) | (0.11 | ) | (0.07 | ) | ||||||
Special items | 0.25 | (0.07 | ) | (0.11 | ) | |||||||
Diluted Earnings (Loss) Per Share from Continuing Operations | 0.97 | 0.87 | 0.51 | |||||||||
Discontinued operations | 0.01 | (0.02 | ) | 0.02 | ||||||||
Diluted Earnings (Loss) Per Share Attributable to Shareholders | $ | 0.98 | $ | 0.85 | $ | 0.53 | ||||||
Results of Operations
Industry segment operating profits are used by International Paper’s management to measure the earnings performance of its businesses. Management believes that this measure allows a better understanding of trends in costs, operating efficiencies, prices and volumes. Industry segment operating profits are defined as earnings before taxes, equity earnings, noncontrolling interests, interest expense, corporate items and corporate special items. Industry segment operating profits are defined by the Securities and Exchange Commission as a non-GAAP financial measure, and are not GAAP alternatives to net income or any other operating measure prescribed by accounting principles generally accepted in the United States.
International Paper operates in four segments: Industrial Packaging, Printing Papers, Consumer Packaging and Distribution.
21
The following table presents a reconciliation of net earnings (loss) attributable to International Paper Company to its total industry segment operating profit:
In millions | 2013 | 2012 | 2011 | ||||||
Net Earnings (Loss) Attributable to International Paper Company | $ | 1,395 | $ | 794 | $ | 1,322 | |||
Deduct – Discontinued operations: | |||||||||
(Earnings) from operations | (64 | ) | (54 | ) | — | ||||
(Gain) loss on sales or impairment | 19 | 9 | (49 | ) | |||||
Earnings (Loss) From Continuing Operations Attributable to International Paper Company | 1,350 | 749 | 1,273 | ||||||
Add back (deduct): | |||||||||
Income tax provision | (523 | ) | 331 | 311 | |||||
Equity (earnings) loss, net of taxes | 39 | (61 | ) | (140 | ) | ||||
Net earnings attributable to noncontrolling interests | (17 | ) | 5 | 14 | |||||
Earnings (Loss) From Continuing Operations Before Income Taxes and Equity Earnings | 849 | 1,024 | 1,458 | ||||||
Interest expense, net | 612 | 672 | 541 | ||||||
Noncontrolling interests / equity earnings included in operations | (1 | ) | — | (10 | ) | ||||
Corporate items | 29 | 51 | 102 | ||||||
Special items: | |||||||||
Restructuring and other charges | 32 | 51 | 82 | ||||||
Net losses (gains) on sales and impairments of businesses | — | (2 | ) | — | |||||
Non-Operating Pension Expense | 323 | 159 | 43 | ||||||
$ | 1,844 | $ | 1,955 | $ | 2,216 | ||||
Industry Segment Operating Profit | |||||||||
Industrial Packaging | $ | 1,801 | $ | 1,066 | $ | 1,147 | |||
Printing Papers | 271 | 599 | 872 | ||||||
Consumer Packaging | 161 | 268 | 163 | ||||||
Distribution | (389 | ) | 22 | 34 | |||||
Total Industry Segment Operating Profit | $ | 1,844 | $ | 1,955 | $ | 2,216 | |||
Industry segment operating profits in 2013 included a net loss from special items of $772 million compared with $335 million in 2012 and $253 million in 2011. Operationally, compared with 2012, the net benefit of higher average sales price realizations and an unfavorable mix ($653 million) were offset by lower sales volumes ($76 million), higher operating costs ($16 million), higher input costs ($207 million), and higher other costs ($28 million).
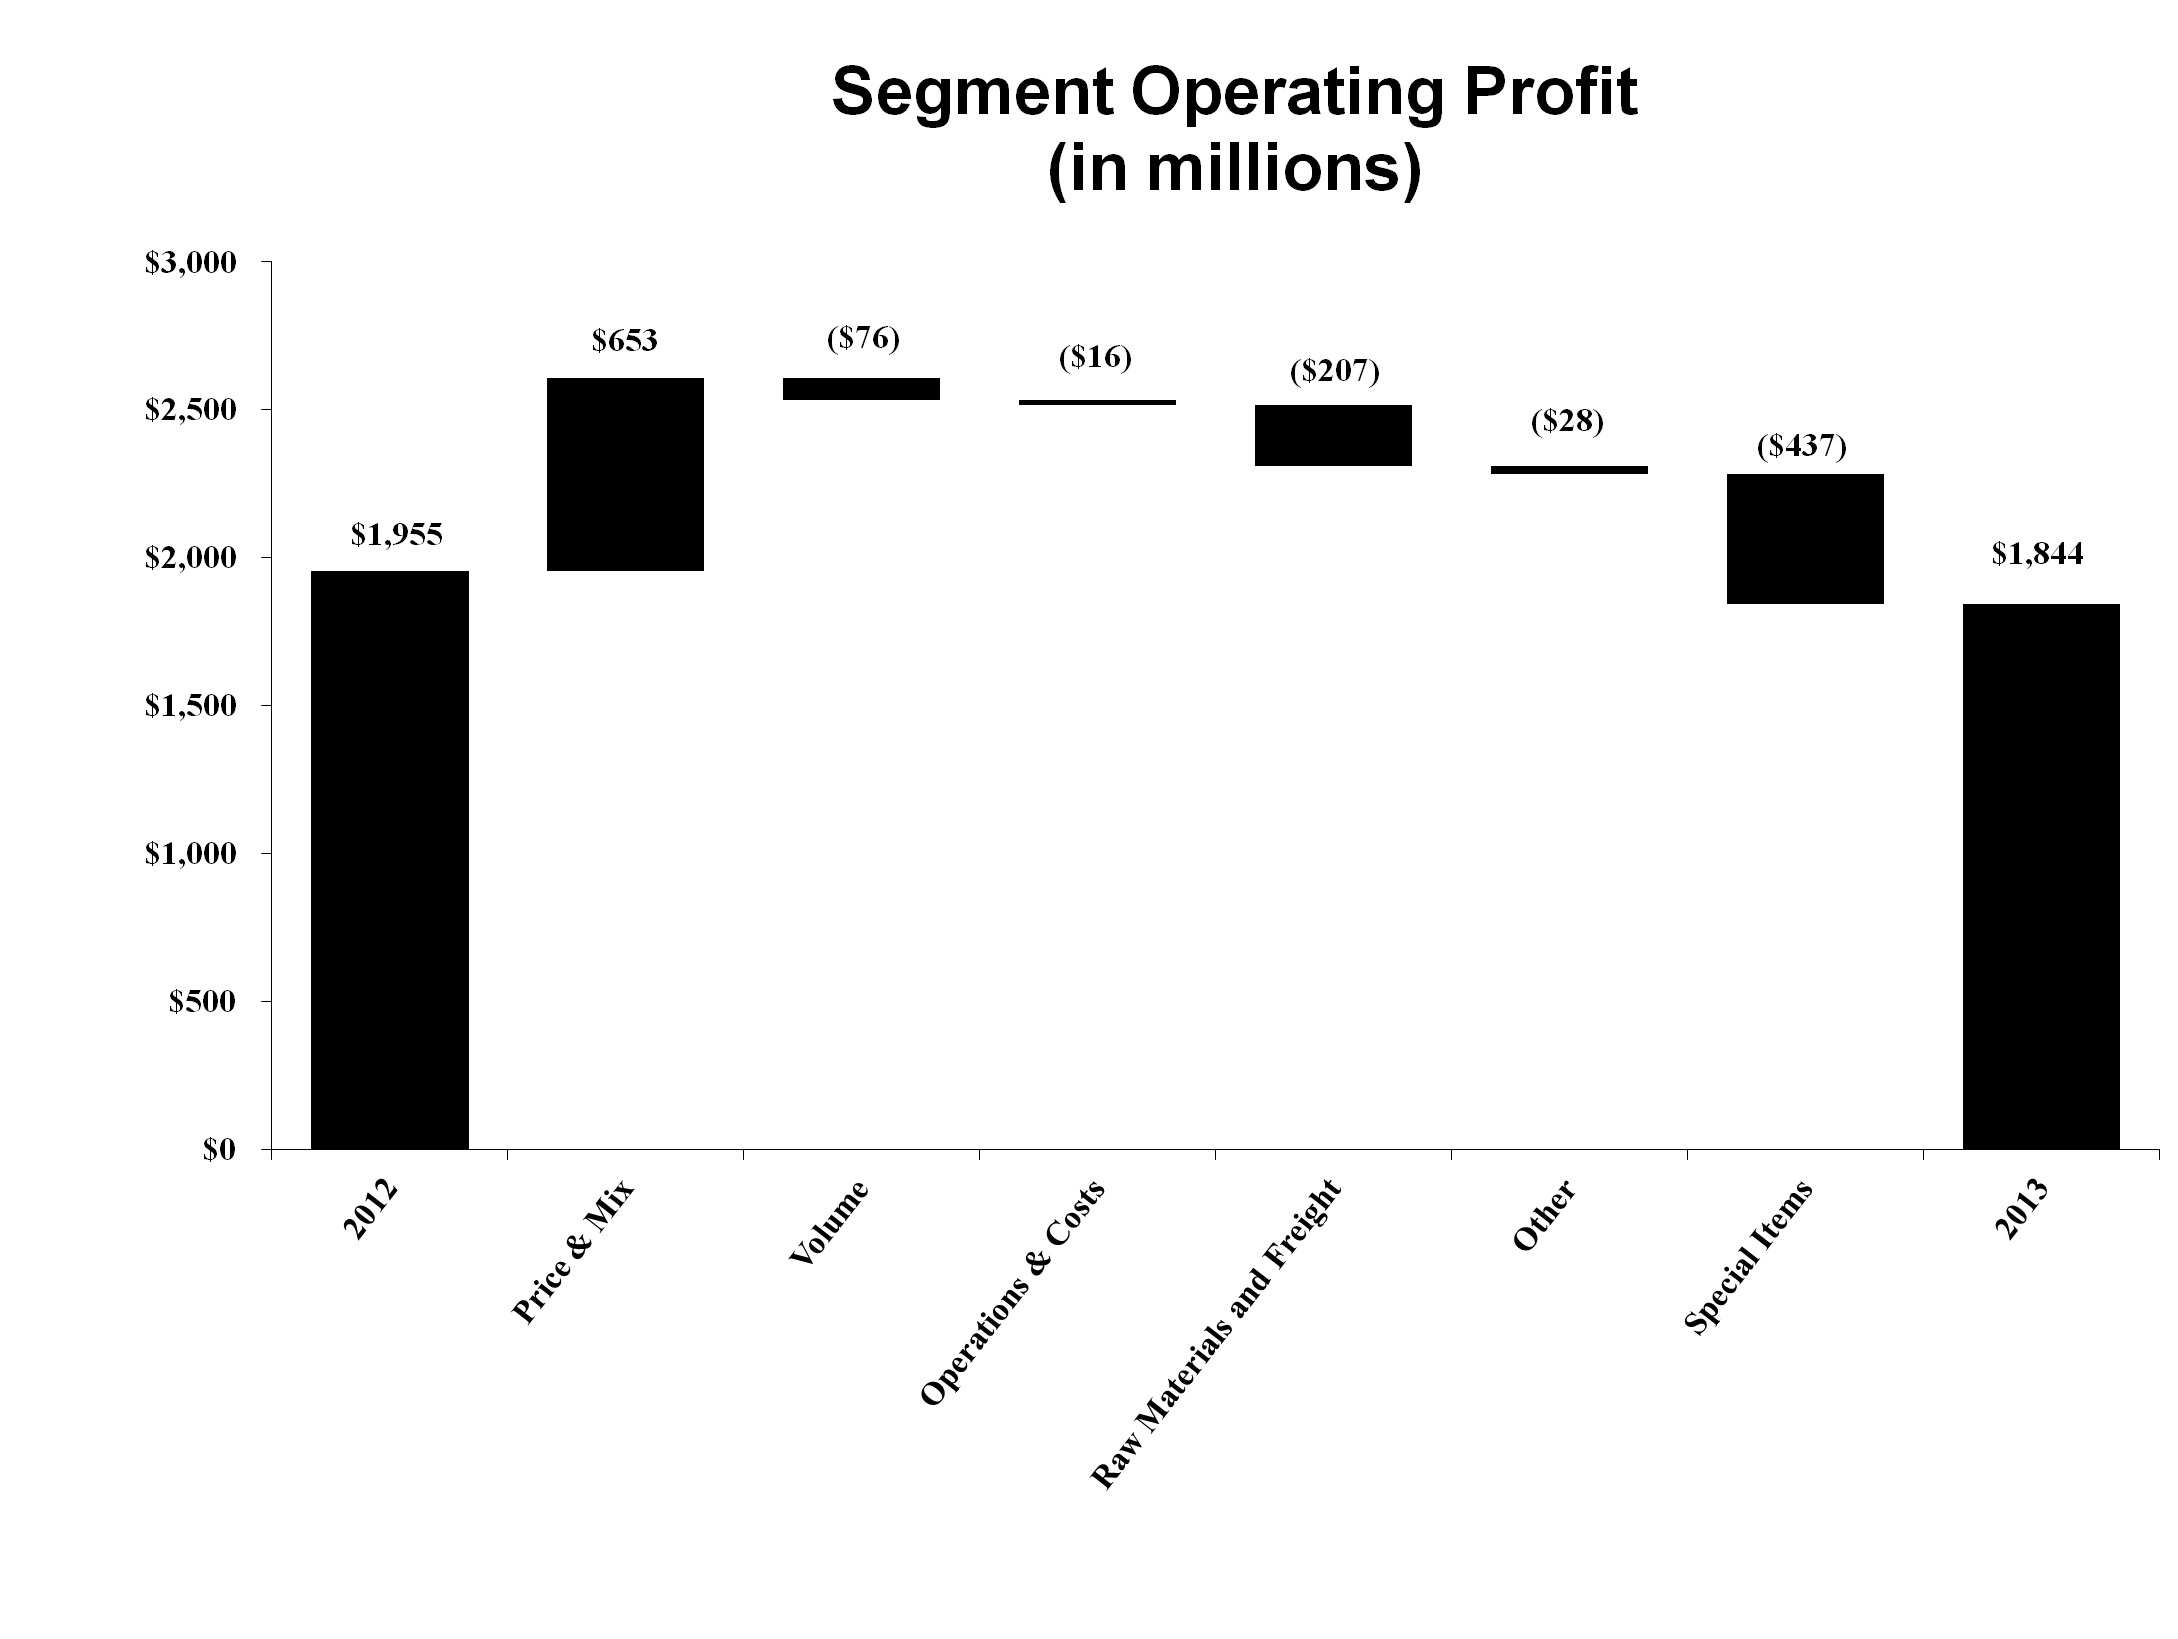
The principal changes in operating profit by segment were as follows:
• | Industrial Packaging’s profits of $1.8 billion were $735 million higher than in 2012 as the net benefit of higher average sales price realizations and unfavorable mix were partially offset by lower sales volumes, higher operating costs and higher maintenance outage costs. In addition, 2013 operating profits included $62 million of costs associated with the integration of Temple-Inland and a $13 million gain for a bargain purchase adjustment on the acquisition of a majority share of our operations in Turkey. Operating profits in 2012 included $184 million of costs associated with the integration of Temple-Inland, a $62 million charge to adjust the long-lived assets of the Hueneme mill to their fair value, and $29 million of costs associated with the divestiture of three containerboard mills. |
• | Printing Papers’ profits of $271 million were $328 million lower than in 2012. The benefits of lower operating costs and maintenance outage costs were more than offset by lower average sales price realizations, lower sales volumes, higher input costs and higher other costs. Operating profits in 2013 included $118 million of costs associated with the announced shutdown of our Courtland, Alabama mill and net charges of $123 million for the impairment of the goodwill and a trade name intangible asset of the Company's India Papers business. |
• | Consumer Packaging’s profits of $161 million were $107 million lower than in 2012. The benefits from higher sales volumes were more than offset by lower average sales price realizations, an unfavorable mix, higher operating costs and higher input costs. Operating profits in 2013 included costs of $45 million associated with the permanent shutdown of a paper machine at our Augusta, Georgia mill. |
22
• | Distribution’s loss of $389 million was lower than the operating profit of $22 million in 2012. The benefits from lower operating costs were more than offset by lower sales volumes and lower average sales price realizations. Operating profits in 2013 included a $400 million charge for the impairment of goodwill in the Company's xpedx business. In addition, reorganization expenses were $32 million in 2013 and $49 million in 2012. |
Corporate items, net, of $29 million of expense in 2013 were lower than the $51 million of expense in 2012 due to lower supply chain initiative expenses. The decrease in 2012 from the expense of $102 million in 2011 primarily reflects lower supply chain initiative expenses.
Corporate special items, including restructuring and other items and net losses on sales and impairments of businesses were a loss of $32 million in 2013 compared with a loss of $49 million in 2012 and a loss of $76 million in 2011.
Interest expense, net, was $612 million in 2013 compared with $672 million in 2012 and $541 million in 2011. The decrease in 2013 compared with 2012 reflects lower average debt levels and the reversal of interest reserves related to U.S. federal income tax audits. The increase in 2012 compared with 2011 is due to interest expense associated with the Temple-Inland acquisitions.
A net income tax benefit of $523 million was recorded for 2013, including a tax benefit of $770 million associated with the settlement of tax audits and a net tax benefit of $4 million for other items. The 2012 income tax provision of $331 million includes a net expense of $14 million related to internal restructurings and an expense of $5 million to adjust deferred tax assets related to post-retirement prescription drug coverage (Medicare Part D reimbursements). The 2011 income tax provision of $311 million includes a tax benefit of $222 million related to the reduction of the carrying value of the Shorewood business and the write-off of a deferred tax liability associated with Shorewood, a $24 million expense related to internal restructurings, a $9 million expense for costs associated with our acquisition of a majority interest in Andhra Pradesh Paper Mills Limited, a $13 million benefit related to the release of a deferred tax asset valuation allowance and a $2 million expense for other items.
Discontinued Operations
In 2013, $64 million of operating profits for the Temple-Inland Building Products business were recorded in discontinued operations. In addition, $19 million of after-tax expenses associated with the divestiture of this business were included.
In 2012, $54 million of operating profits for the Temple-Inland Building Products business were recorded in discontinued operations. In addition, $9 million of after-
tax expenses associated with pursuing the divestiture of this business were included.
In 2011, $49 million of net income adjustments were recorded relating to prior sales of discontinued businesses.
Liquidity and Capital Resources
For the year ended December 31, 2013, International Paper generated $3.0 billion of cash flow from continuing operations compared with $3.0 billion in 2012. Capital spending for 2013 totaled $1.2 billion, or 77% of depreciation and amortization expense. Cash expenditures for acquisitions totaled $505 million, while net decreases in debt totaled $604 million. Our liquidity position remains strong, supported by approximately $2.0 billion of credit facilities that we believe are adequate to meet future liquidity requirements. Maintaining an investment-grade credit rating for our long-term debt continues to be an important element in our overall financial strategy.
We expect to generate strong free cash flow again in 2014 and will continue our balanced use of cash through investments in capital projects, the reduction of total debt, including the Company’s unfunded pension obligation, returning value to shareholders and strengthening our businesses through acquisitions, as appropriate.
Capital spending for 2014 is targeted at $1.4 billion, or about 95% of depreciation and amortization.
Critical Accounting Policies and Significant Accounting Estimates
Accounting policies that may have a significant effect on our reported results of operations and financial position, and that can require judgments by management in their application, include accounting for contingent liabilities, impairments of long-lived assets and goodwill, pension and postretirement benefit obligations, stock options and income taxes. See pages 39 through 42 for a discussion of the Company’s critical accounting policies and significant accounting estimates.
Legal
See Note 11 Commitments and Contingent Liabilities on pages 68 through 72 of Item 8. Financial Statements and Supplementary Data for a discussion of legal matters.
While the operating results for International Paper’s various business segments are driven by a number of business-specific factors, changes in International Paper’s operating results are closely tied to changes in general economic conditions in North America, Europe, Russia, Latin America, Asia, Africa and the Middle East. Factors that impact the demand for our products include
23
industrial non-durable goods production, consumer spending, commercial printing and advertising activity, white-collar employment levels, and movements in currency exchange rates.
Product prices are affected by general economic trends, inventory levels, currency movements and worldwide capacity utilization. In addition to these revenue-related factors, net earnings are impacted by various cost drivers, the more significant of which include changes in raw material costs, principally wood, recycled fiber and chemical costs; energy costs; freight costs; salary and benefits costs, including pensions; and manufacturing conversion costs.
The following is a discussion of International Paper’s results of operations for the year ended December 31, 2013, and the major factors affecting these results compared to 2012 and 2011.
For the year ended December 31, 2013, International Paper reported net sales of $29.1 billion, compared with $27.8 billion in 2012 and $26.0 billion in 2011. International net sales (including U.S. exports) totaled $9.6 billion or 33% of total sales in 2013. This compares with international net sales of $8.5 billion in 2012 and $8.7 billion in 2011.
Full year 2013 net earnings attributable to International Paper Company totaled $1.4 billion ($3.11 per share), compared with net earnings of $794 million ($1.80 per share) in 2012 and $1.3 billion ($3.03 per share) in 2011. Amounts in all periods include the results of discontinued operations.
Earnings from continuing operations attributable to International Paper Company after taxes in 2013 were $1.4 billion, including $129 million of net special items gains and $197 million of non-operating pension expense compared with income of $749 million, including $305 million of net special items charges and $113 million of non-operating pension expense in 2012, and $1.3 billion, including $63 million of net special items charges and $29 million of non-operating pension expense in 2011. Compared with 2012, the net benefit from higher average sales price realizations and unfavorable mix, lower corporate and other costs, lower interest expense, and lower tax expense were offset by lower sales volumes, higher operating costs and higher input costs In addition, 2013 results included lower equity earnings, net of taxes, relating to the Company’s investment in Ilim Holdings, SA.
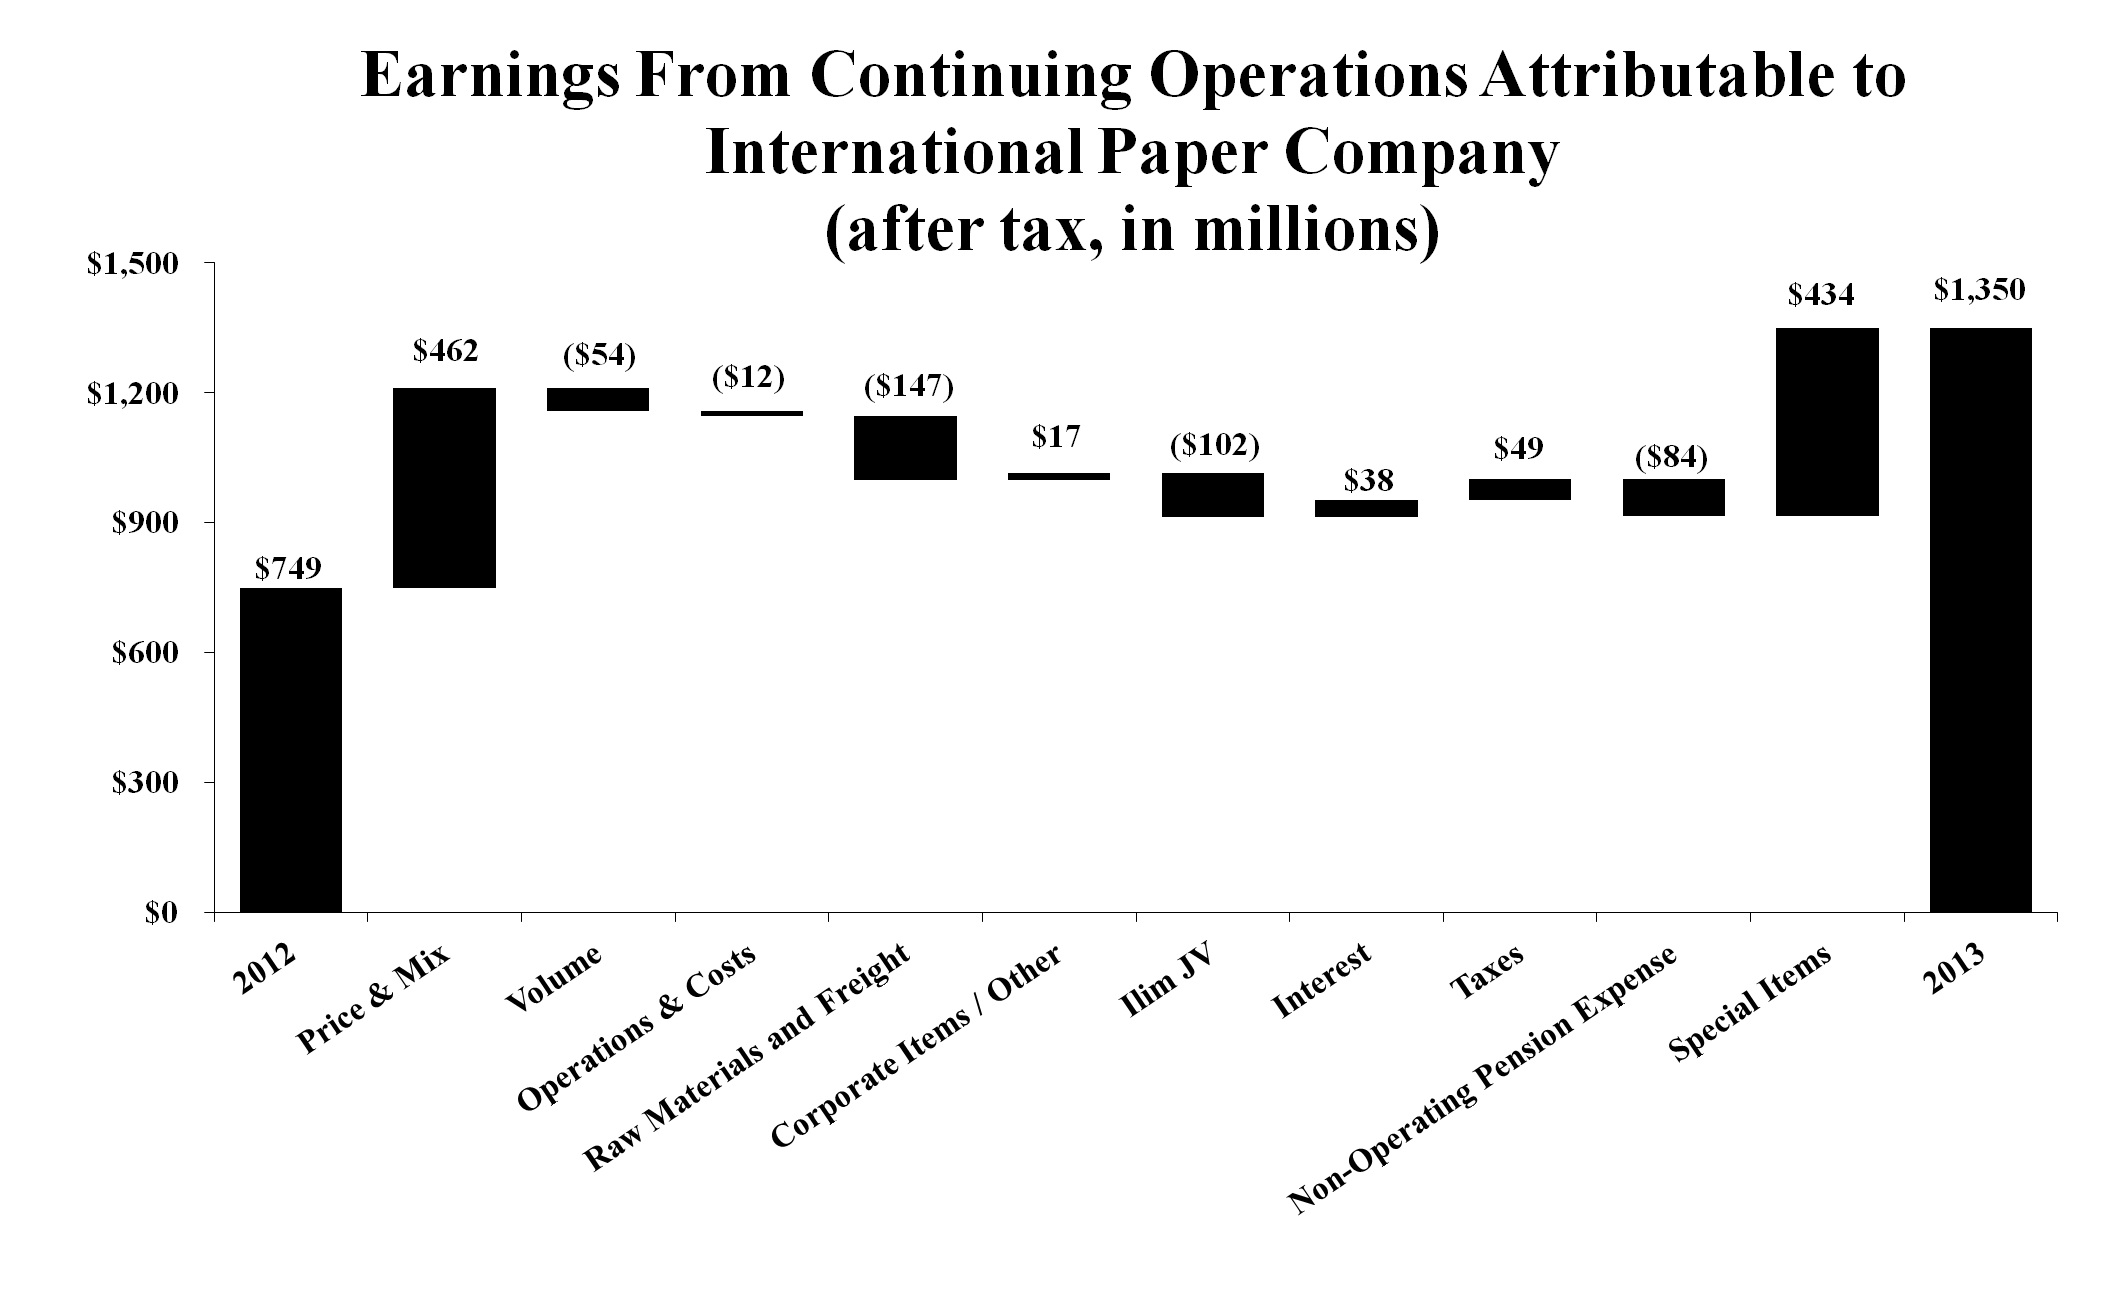
See Industry Segment Results on pages 29 through 34 for a discussion of the impact of these factors by segment.
Discontinued Operations
2013:
In 2013, $45 million of net income adjustments were recorded relating to discontinued businesses, including $19 million of costs associated with the sale of the Temple-Inland Building Products business. Also included are the operating profits for the Temple-Inland Building Products business through the date of sale of July 19, 2013.
2012:
In 2012, $45 million of net income adjustments were recorded relating to discontinued businesses, including $9 million of costs associated with the announced agreement to sell the Temple-Inland Building Products business. Also included are the operating profits for the Temple-Inland Building Products business.
2011:
In 2011, $49 million of net income adjustments were recorded relating to prior sales of discontinued businesses, including a $30 million earnout payment received by the Company in 2011 associated with the sale of the Kraft Papers businesses in 2007 and a $15 million tax benefit for the reversal of local country tax contingency reserves, for which the related statute of limitations has now expired, plus associated interest income of $4 million recorded in 2011 related to the 2006 sale of the Brazilian Coated Papers business.
Income Taxes
A net income tax benefit of $523 million was recorded for 2013, including a tax benefit of $770 million related to the settlement of tax audits and a net benefit of $4 million for other items. Excluding these items, a $150 million net tax benefit for other special items and a $126 million tax benefit related to non-operating pension expense, the tax provision was $527 million, or 27% of pre-tax earnings before equity earnings.
24
A net income tax provision of $331 million was recorded for 2012, including a net tax expense of $14 million related to internal restructurings and a $5 million expense to adjust deferred tax assets related to post-retirement prescription drug coverage (Medicare Part D reimbursements). Excluding these items, a $98 million net tax benefit for other special items and a $46 million tax benefit related to non-operating pension expense, the tax provision was $456 million, or 29% of pre-tax earnings before equity earnings.
A net income tax provision of $311 million was recorded for 2011, including a tax benefit of $222 million related to the reduction of the carrying value of the Shorewood business and the write-off of a deferred tax liability associated with Shorewood, a $24 million expense related to internal restructurings, a $9 million expense for costs associated with our acquisition of a majority share of Andhra Pradesh Paper Mills Limited in India, a $13 million benefit related to the release of a deferred tax asset valuation allowance and a $2 million expense for other items. Excluding these items, a $66 million net tax benefit for other special items and $14 million tax benefit related to non-operating pension expense, the tax provision was $591 million, or 32% of pre-tax earnings before equity earnings.
Equity Earnings, Net of Taxes
Equity earnings, net of taxes in 2013, 2012 and 2011 consisted principally of the Company’s share of earnings from its 50% investment in Ilim Holding S.A. in Russia (see pages 34).
Corporate Items and Interest Expense
Corporate items totaled $29 million of expense for the year ended December 31, 2013 compared with $51 million in 2012 and $102 million in 2011. The decrease in 2013 from 2012 reflects lower supply chain initiative expenses, partially offset by higher pension expense. The decrease in 2012 from 2011 reflects lower supply chain initiative expenses.
Net interest expense totaled $612 million in 2013, $672 million in 2012 and $541 million in 2011. The decrease in 2013 compared with 2012 reflects lower average debt levels and the reversal of interest reserves related to U.S. federal income tax audits. The increase in 2012 compared with 2011 is due to interest expense associated with the Temple-Inland acquisition.
Net earnings attributable to noncontrolling interests totaled a loss of $17 million in 2013 compared with earnings of $5 million in 2012 and $14 million in 2011. The decrease in 2013 primarily reflects lower earnings for the Shandong IP & Sun Food Packaging Co., Ltd. joint venture in China due to competitive pressures on sales prices and higher pulp costs. In addition, 2013 includes a $15 million pre-tax charge for the impairment
of a tradename intangible asset related to our India Papers business which has a net $3 million impact on noncontrolling interest. The decrease in 2012 primarily reflects lower earnings for the Shandong IP & Sun Food Packaging Co., Ltd. joint venture in China due to start-up costs associated with a new paper machine.
Special Items
Restructuring and Other Charges
International Paper continually evaluates its operations for improvement opportunities targeted to (a) focus our portfolio on our core businesses, (b) rationalize and realign capacity to operate fewer facilities with the same revenue capability and close high cost facilities, and (c) reduce costs. Annually, strategic operating plans are developed by each of our businesses. If it subsequently becomes apparent that a facility’s plan will not be achieved, a decision is then made to (a) invest additional capital to upgrade the facility, (b) shut down the facility and record the corresponding charge, or (c) evaluate the expected recovery of the carrying value of the facility to determine if an impairment of the asset value of the facility has occurred. In recent years, this policy has led to the shutdown of a number of facilities and the recording of significant asset impairment charges and severance costs. It is possible that additional charges and costs will be incurred in future periods in our core businesses should such triggering events occur.
2013: During 2013, corporate restructuring and other charges totaling $17 million before taxes ($11 million after taxes) were recorded. These charges included:
• | a $25 million charge before taxes ($16 million after taxes) for costs related to the early extinguishment of debt (see Note 13 Debt and Lines of Credit on pages 75 and 76 of Item 8. Financial Statements and Supplementary Data), |
• | a $22 million charge before taxes ($14 million after taxes) for costs associated with the evaluation of the spin-off of our xpedx operations, and |
• | a $30 million gain before taxes ($19 million after taxes) for insurance reimbursements related to the Guaranty Bank legal settlement. |
In addition, restructuring and other charges totaling $193 million before taxes ($120 million after taxes) were recorded in the Industrial Packaging, Printing Papers, Consumer Packaging and Distribution industry segments including:
• | a $118 million charge before taxes ($72 million after taxes) for costs related to the shutdown of the Courtland, Alabama mill, |
25
• | a $32 million charge before taxes ($19 million after taxes) for restructuring costs related to the Company's xpedx business, |
• | a $45 million charge before taxes ($28 million after taxes) for costs related to the shutdown of a paper machine at the Augusta, Georgia mill, and |
• | a $2 million gain before taxes (loss of $1 million after taxes) for other items. |
2012: During 2012, corporate restructuring and other charges totaling $51 million before taxes ($35 million after taxes) were recorded. These charges included:
• | a $48 million charge before taxes ($30 million after taxes) for costs related to the early extinguishment of debt (see Note 13 Debt and Lines of Credit on pages 75 and 76 of Item 8. Financial Statements and Supplementary Data), and |
• | a $3 million charge before taxes ($5 million after taxes) for other items. |
In addition, restructuring and other charges totaling $58 million before taxes ($39 million after taxes) were recorded in the Industrial Packaging. Consumer Packaging and Distribution industry segments including:
• | a $17 million charge before taxes ($12 million after taxes) related to the restructuring of our Packaging business in EMEA, |
• | a $44 million charge before taxes ($28 million after taxes) for restructuring costs related to the Company's xpedx business, and |
• | a $3 million gain before taxes ($1 million after taxes) for other items. |
2011: During 2011, corporate restructuring and other charges totaling $55 million before taxes ($33 million after taxes) were recorded. These charges included:
• | a $32 million charge before taxes ($19 million after taxes) for costs related to the early extinguishment of debt (see Note 13 Debt and Lines of Credit on pages 75 and 76 of Item 8. Financial Statements and Supplementary Data), |
• | an $18 million charge before taxes ($12 million after taxes) related to International Paper's acquisition of a majority share of APPM in India, and |
• | a $5 million charge before taxes ($2 million after taxes) for other items. |
In addition, restructuring and other charges totaling $47 million before taxes ($33 million after taxes) were recorded in the Industrial Packaging, Printing Papers, Consumer Packaging and Distribution industry segments including:
• | a $20 million charge before taxes ($12 million after taxes) for costs associated with the signing of an agreement to acquire Temple-Inland, |
• | a $24 million gain before taxes ($15 million after taxes) related to a change in the estimate of closure costs related to the Franklin, Virginia mill due to the Company’s decision to repurpose a portion of the mill to produce fluff pulp, |
• | a $49 million charge before taxes ($34 million after taxes) for restructuring costs related to the Company’s xpedx business, and |
• | a $2 million charge before taxes ($2 million after taxes) for other items. |
Impairments of Goodwill
In the fourth quarter of 2013, in conjunction with the annual testing of its reporting units for possible goodwill impairments, the Company calculated the estimated fair value of its India Papers business using expected discounted future cash flows and determined that due to a change in the strategic outlook, all of the goodwill of this business, totaling $112 million, should be written off.
Also in the fourth quarter of 2013, the Company calculated the estimated fair value of its xpedx business using the discounted future cash flows and wrote off all of the goodwill of its xpedx business, totaling $400 million. The decline in fair value of the xpedx reporting unit and resulting impairment charge was due to a significant decline in earnings and a change in the strategic outlook for the xpedx operations.
As a result, during the fourth quarter of 2013, the Company recorded a total goodwill impairment charge of $512 million, representing all of the recorded goodwill of the xpedx business and the India Papers business.
Also during 2013, the Company recorded a pre-tax charge of $15 million ($7 million after taxes and noncontrolling interest) for the impairment of a trade name intangible asset related to our India Papers business.
No goodwill impairment charges were recorded in 2012 or 2011.
26
Net Losses (Gains) on Sales and Impairments of Businesses
Net losses (gains) on sales and impairments of businesses included in special items totaled a pre-tax loss of $3 million ($1 million after taxes) in 2013, a pre-tax loss of $86 million ($87 million after taxes) in 2012 and a pre-tax loss of $218 million (a gain of $36 million after taxes and noncontrolling interest) in 2011. The principal components of these gains/losses were:
2013: During 2013, the Company recorded net pre-tax charges of $3 million ($1 million after taxes) for adjustments related to the divestiture of three containerboard mills in 2012 and the sale of the Shorewood business.
2012: As referenced in Note 6 Acquisitions and Joint Ventures on pages 60 through 63 in Item. 8 Financial Statements and Supplementary Data, on July 2, 2012, International Paper finalized the sales of its Ontario and Oxnard (Hueneme), California containerboard mills to New-Indy Containerboard LLC, and its New Johnsonville, Tennessee containerboard mill to Hood Container Corporation. During 2012, the Company recorded pre-tax charges of $29 million ($55 million after taxes) for costs associated with the divestitures of these mills. Also during 2012, in anticipation of the divestiture of the Hueneme mill, a pre-tax charge of $62 million ($38 million after taxes) was recorded to adjust the long-lived assets of the mill to their fair value.
2011: On August 22, 2011, International Paper announced that it had signed an agreement to sell its Shorewood business to Atlas Holdings. As a result, during 2011, net pre-tax charges of $207 million (after a $246 million tax benefit and a gain of $8 million related to a noncontrolling interest, a net gain of $47 million) were recorded to reduce the carrying value of the Shorewood business to fair market value. As part of the transaction, International Paper retained a minority interest of approximately 40% in the newly combined AGI-Shorewood business outside the U.S. Since the interest retained represents significant continuing involvement in the operations of the business, the operating results of the Shorewood business were included in continuing operations in the accompanying consolidated statement of operations instead of Discontinued operations. The sale of the U.S. portion of the Shorewood business to Atlas Holdings closed on December 31, 2011. The sale of the remainder of the Shorewood business occurred during January 2012.
Also during 2011, the Company recorded charges totaling $11 million (before and after taxes) to further write down the long-lived assets of its Inverurie, Scotland mill to their estimated fair value.
Industry Segment Operating Profits
Industry segment operating profits of $1.8 billion in 2013 decreased from $2.0 billion in 2012. The net benefit from higher average sales price realizations and an unfavorable mix ($653 million) were offset by lower sales volumes ($76 million), higher operating costs ($16 million), higher input costs ($207 million) and higher other costs ($28 million). Special items were a $772 million net loss in 2013 compared with a net loss of $335 million in 2012.
Market-related downtime in 2013 decreased to approximately 484,000 tons from approximately 692,000 tons in 2012.
Looking ahead to the first quarter of 2014, sales volumes are expected to improve for North American packaging due to two additional shipping days for boxes. North American paper sales volumes should decline as a result of the repositioning related to the shutdown of our Courtland mill. Demand is expected to be seasonally lower in EMEA and Brazil, but stable in Asia. Average sales price realizations in North America are expected to increase in the domestic paper market, and sales margins in the packaging markets are expected to reflect a more favorable mix. Average sales prices in Europe are likely to be steady for both paper and packaging. In Brazil, paper prices are expected to increase in both the Brazilian domestic and the Latin American export markets, while packaging prices should be stable. Input costs in North America are expected to increase for energy and to reflect the impact of the unusually cold weather. Planned maintenance downtime costs should increase in North America, while costs in Europe and Brazil should be lower. Earnings from our xpedx distribution business are expected to be flat despite seasonally lower sales volumes. Equity earnings from our Ilim joint venture are expected to be stable.
International Paper’s industry segments discussed below are consistent with the internal structure used to manage these businesses. All segments are differentiated on a common product, common customer basis consistent with the business segmentation generally used in the forest products industry.
Industrial Packaging
International Paper is the largest manufacturer of containerboard in the United States. Our production capacity is about 13 million tons annually. Our products include linerboard, medium, whitetop, recycled linerboard, recycled medium and saturating kraft. About 80% of our production is converted domestically into corrugated boxes and other packaging by our 172 U.S. container plants. Additionally, we recycle approximately
27
one million tons of OCC and mixed and white paper through our 20 recycling plants. In EMEA, our operations include three recycled fiber containerboard mills in Morocco and Turkey and 28 container plants in France, Italy, Spain, Morocco and Turkey. In Brazil our operations include three containerboard mills and four box plants. In Asia, our operations include 17 container plants in China and additional container plants in Indonesia, Malaysia, Singapore, and Thailand. Our container plants are supported by regional design centers, which offer total packaging solutions and supply chain initiatives.
Printing Papers
International Paper is one of the world’s leading producers of printing and writing papers. Products in this segment include uncoated and coated papers, uncoated bristols and pulp.
Uncoated Papers: This business produces papers for use in copiers, desktop and laser printers and digital imaging. End use applications include advertising and promotional materials such as brochures, pamphlets, greeting cards, books, annual reports and direct mail. Uncoated papers also produces a variety of grades that are converted by our customers into envelopes, tablets, business forms and file folders. Uncoated papers are sold under private label and International Paper brand names that include Hammermill, Springhill, Williamsburg, Postmark, Accent, Great White, Chamex, Ballet, Rey, Pol, and Svetocopy. The mills producing uncoated papers are located in the United States, France, Poland, Russia, Brazil and India. The mills have uncoated paper production capacity of approximately 5 million tons annually. Brazilian operations function through International Paper do Brasil, Ltda, which owns or manages approximately 332,000 acres of forestlands in Brazil.
Pulp: Pulp is used in the manufacture of printing, writing and specialty papers, towel and tissue products and filtration products. Pulp is also converted into products such as diapers and sanitary napkins. Pulp products include fluff, and southern softwood pulp, as well as southern and birch hardwood paper pulps. These products are produced in the United States, France, Poland, Russia, and Brazil and are sold around the world. International Paper facilities have annual dried pulp capacity of about 1.7 million tons.
Consumer Packaging
International Paper is the world’s largest producer of solid bleached sulfate board with annual U.S. production capacity of about 1.6 million tons. Our coated paperboard business produces high quality coated paperboard for a variety of packaging and commercial printing end uses. Our Everest®, Fortress®, and Starcote® brands are used in packaging
applications for everyday products such as food, cosmetics, pharmaceuticals, computer software and tobacco products. Our Carolina® brand is used in commercial printing end uses such as greeting cards, paperback book covers, lottery tickets, direct mail and point-of-purchase advertising. Our U.S. capacity is supplemented by about 371,000 tons of capacity at our mills producing coated board in Poland and Russia and by our International Paper & Sun Cartonboard Co., Ltd. joint venture in China which has annual capacity of 1.4 million tons.
Our Foodservice business produces cups, lids, food containers and plates through three domestic plants and four international facilities.
Distribution
xpedx, our North American merchant distribution business, distributes products and services to a number of customer markets including: commercial printers with printing papers and graphic pre-press, printing presses and post-press equipment; building services and away-from-home markets with facility supplies; manufacturers with packaging supplies and equipment; and to a growing number of customers, we exclusively provide distribution capabilities including warehousing and delivery services. xpedx is a leading wholesale distribution marketer in these customer and product segments in North America, operating 86 distribution centers in the U.S. and Mexico.
On January 28, 2014, International Paper, SpinCo, a company we recently formed to hold xpedx, Unisource and related entities entered into a merger agreement, a contribution and distribution agreement and related agreements, providing for the pro rata, tax-free, spin-off distribution of shares of common stock of SpinCo to International Paper’s shareholders and the merger of Unisource with and into SpinCo with SpinCo as the surviving company in the merger. As a result of the spin-off distribution and the merger, International Paper’s shareholders will own approximately 51%, and the sole shareholder of Unisource will own approximately 49%, of the shares of common stock of SpinCo on a fully diluted basis. We anticipate that the spin-off distribution and the merger will be completed in mid-2014. You can find discussions of the transaction in Item 1A, Risk Factors - Risks Relating to Our Operations.
Ilim Holding S.A.
In October 2007, International Paper and Ilim Holding S.A. (Ilim) completed a 50:50 joint venture to operate a pulp and paper business located in Russia. Ilim’s facilities include three paper mills located in Bratsk, Ust-Ilimsk, and Koryazhma, Russia, with combined total pulp and paper capacity of over 2.6 million tons. Ilim has exclusive harvesting rights on timberland and forest
28
areas exceeding 14.1 million acres (5.7 million hectares).
Products and brand designations appearing in italics are trademarks of International Paper or a related company.
Industrial Packaging
Demand for Industrial Packaging products is closely correlated with non-durable industrial goods production, as well as with demand for processed foods, poultry, meat and agricultural products. In addition to prices and volumes, major factors affecting the profitability of Industrial Packaging are raw material and energy costs, freight costs, manufacturing efficiency and product mix.
Industrial Packaging net sales and operating profits include the results of the Temple-Inland packaging operations from the date of acquisition in February 2012 and the results of the Brazil Packaging business from the date of acquisition in January 2013. In addition, due to the acquisition of a majority share of Olmuksa International Paper Sabanci Ambalaj Sanayi Ve Ticaret A.S., (now called Olmuksan International Paper or Olmuksan) net sales for our corrugated packaging business in Turkey are included in the business segment totals beginning in the first quarter of 2013 and the operating profits reflect a higher ownership percentage than in previous years. Net sales for 2013 increased 12% to $14.8 billion compared with $13.3 billion in 2012, and 42% compared with $10.4 billion in 2011. Operating profits were 69% higher in 2013 than in 2012 and 57% higher than in 2011. Excluding costs associated with the acquisition and integration of Temple-Inland, the divestiture of three containerboard mills and other special items, operating profits in 2013 were 36% higher than in 2012 and 59% higher than in 2011. Benefits from the net impact of higher average sales price realizations and an unfavorable mix ($749 million) were offset by lower sales volumes ($73 million), higher operating costs ($64 million), higher maintenance outage costs ($16 million) and higher input costs ($102 million). Additionally, operating profits in 2013 include costs of $62 million associated with the integration of Temple-Inland, a gain of $13 million related to a bargain purchase adjustment on the acquisition of a majority share of our operations in Turkey, and a net gain of $1 million for other items, while operating profits in 2012 included costs of $184 million associated with the acquisition and integration of Temple-Inland, mill divestiture costs of $91 million, costs associated with the restructuring of our European Packaging business of $17 million and a $3 million gain for other items.
Industrial Packaging | |||||||||
In millions | 2013 | 2012 | 2011 | ||||||
Sales | $ | 14,810 | $ | 13,280 | $ | 10,430 | |||
Operating Profit | 1,801 | 1,066 | 1,147 | ||||||
North American Industrial Packaging net sales were $12.5 billion in 2013 compared with $11.6 billion in 2012 and $8.6 billion in 2011. Operating profits in 2013 were $1.8 billion (both including and excluding costs associated with the integration of Temple-Inland and other special items) compared with $1.0 billion ($1.3 billion excluding costs associated with the acquisition and integration of Temple-Inland and mill divestiture costs) in 2012 and $1.1 billion (both including and excluding costs associated with signing an agreement to acquire Temple-Inland) in 2011.
Sales volumes decreased in 2013 compared with 2012 reflecting flat demand for boxes and the impact of commercial decisions. Average sales price realizations were significantly higher mainly due to the realization of price increases for domestic containerboard and boxes. Input costs were higher for wood, energy and recycled fiber. Freight costs also increased. Planned maintenance downtime costs were higher than in 2012. Manufacturing operating costs decreased, but were offset by inflation and higher overhead and distribution costs. The business took about 850,000 tons of total downtime in 2013 of which about 450,000 were market-related and 400,000 were maintenance downtime. In 2012, the business took about 945,000 tons of total downtime of which about 580,000 were market-related and about 365,000 were maintenance downtime. Operating profits in 2013 included $62 million of costs associated with the integration of Temple-Inland. Operating profits in 2012 included $184 million of costs associated with the acquisition and integration of Temple-Inland and $91 million of costs associated with the divestiture of three containerboard mills.
Looking ahead to 2014, compared with the fourth quarter of 2013, sales volumes in the first quarter are expected to increase for boxes due to a higher number of shipping days offset by the impact from the severe winter weather events impacting much of the U.S. Input costs are expected to be higher for energy, recycled fiber, wood and starch. Planned maintenance downtime spending is expected to be about $51 million higher with outages scheduled at six mills compared with four mills in the 2013 fourth quarter. Manufacturing operating costs are expected to be lower. However, operating profits will be negatively impacted by the adverse winter weather in the first quarter of 2014.
EMEA Industrial Packaging net sales in 2013 include the sales of our packaging operations in Turkey which are now fully consolidated. Net sales were $1.3 billion in 2013 compared with $1.0 billion in 2012 and $1.1 billion in 2011. Operating profits in 2013 were $43 million ($32
29
million excluding a gain on a bargain purchase price adjustment on the acquisition of a majority share of our operations in Turkey and restructuring costs) compared with $53 million ($72 million excluding restructuring costs) in 2012 and $66 million ($61 million excluding a gain for a bargain purchase price adjustment on an acquisition by our then joint venture in Turkey and costs associated with the closure of our Etienne mill in France in 2009) in 2011.
Sales volumes in 2013 were higher than in 2012 reflecting strong demand for packaging in the agricultural markets in Morocco and Turkey. In Europe, sales volumes decreased slightly due to continuing weak demand for packaging in the industrial markets, and lower demand for packaging in the agricultural markets resulting from poor weather conditions. Average sales margins were significantly lower due to input costs for containerboard rising ahead of box sales price increases. Other input costs were also higher, primarily for energy. Operating profits in 2013 and 2012 included net gains of $13 million and $10 million, respectively, for insurance settlements and Italian government grants, partially offset by additional operating costs, related to the earthquakes in Northern Italy in May 2012 which affected our San Felice box plant.
Entering the first quarter of 2014, sales volumes are expected to increase slightly reflecting higher demand for packaging in the industrial markets. Average sales margins are expected to gradually improve as a result of slight reductions in material costs and planned box price increases. Other input costs should be about flat.
Brazilian Industrial Packaging includes the results of Orsa International Paper Embalagens S.A., a corrugated packaging producer in which International Paper acquired a 75% share in January 2013. Net sales were $335 million in 2013. Operating profits in 2013 were a loss of $2 million (a gain of $2 million excluding acquisition and integration costs).
Looking ahead to the first quarter of 2014, sales volumes are expected to be seasonally lower than in the fourth quarter of 2013. Average sales margins should improve reflecting the partial implementation of an announced sales price increase and a more favorable product mix. Operating costs and input costs are expected to be lower.
Asian Industrial Packaging net sales were $400 million in 2013 compared with $400 million in 2012 and $410 million in 2011. Operating profits for the packaging operations were a loss of $5 million in 2013 (a loss of $1 million excluding restructuring costs) compared with gains of $2 million in 2012 and $2 million in 2011. Operating profits were favorably impacted in 2013 by higher average sales margins and slightly higher sales volumes compared with 2012, but these benefits were
offset by higher operating costs. Looking ahead to the first quarter of 2014, sales volumes and average sales margins are expected to be seasonally soft.
Net sales for the distribution operations were $285 million in 2013 compared with $260 million in 2012 and $285 million in 2011. Operating profits were $3 million in 2013, 2012 and 2011.
Printing Papers
Demand for Printing Papers products is closely correlated with changes in commercial printing and advertising activity, direct mail volumes and, for uncoated cut-size products, with changes in white-collar employment levels that affect the usage of copy and laser printer paper. Pulp is further affected by changes in currency rates that can enhance or disadvantage producers in different geographic regions. Principal cost drivers include manufacturing efficiency, raw material and energy costs and freight costs.
Printing Papers net sales for 2013 were about flat with both 2012 and 2011. Operating profits in 2013 were 55% lower than in 2012 and 69% lower than in 2011. Excluding facility closure costs and impairment costs, operating profits in 2013 were 15% lower than in 2012 and 40% lower than in 2011. Benefits from lower operating costs ($81 million) and lower maintenance outage costs ($17 million) were more than offset by lower average sales price realizations ($38 million), lower sales volumes ($14 million), higher input costs ($99 million) and higher other costs ($34 million). In addition, operating profits in 2013 included costs of $118 million associated with the announced closure of our Courtland, Alabama mill. During 2013, the Company accelerated depreciation for certain Courtland assets, and diligently evaluated certain other assets for possible alternative uses by one of our other businesses. The net book value of these assets at December 31, 2013 was approximately $470 million. During 2014, we have continued our evaluation and expect to conclude as to any uses for these assets during the first quarter of 2014. Operating profits also included a $123 million impairment charge associated with goodwill and a trade name intangible asset in our India Papers business. Operating profits in 2011 included a $24 million gain related to the announced repurposing of our Franklin, Virginia mill to produce fluff pulp and an $11 million impairment charge related to our Inverurie, Scotland mill that was closed in 2009.
Printing Papers | |||||||||
In millions | 2013 | 2012 | 2011 | ||||||
Sales | $ | 6,205 | $ | 6,230 | $ | 6,215 | |||
Operating Profit | 271 | 599 | 872 | ||||||
North American Printing Papers net sales were $2.6 billion in 2013, $2.7 billion in 2012 and $2.8 billion in 2011.
30
Operating profits in 2013 were $36 million ($154 million excluding costs associated with the announced shutdown of our Courtland, Alabama mill) compared with $331 million in 2012 and $423 million ($399 million excluding a gain associated with the repurposing of our Franklin, Virginia mill) in 2011.
Sales volumes in 2013 decreased compared with 2012. Average sales margins were lower, reflecting lower sales prices in both domestic and export markets. Input costs increased, primarily for wood and chemicals. Planned maintenance downtime costs were lower in 2013. Operating profits in 2013 were also negatively impacted by costs associated with the partial shutdown of our Courtland, Alabama mill.
Entering the first quarter of 2014, sales volumes are expected to decrease compared with the fourth quarter of 2013 due to the repositioning of the business related to the Courtland shutdown. Average sales price realizations are expected to be higher as sales price increases announced in the fall of 2013 are fully realized. Input costs should increase for energy and chemicals, but will be partially offset by lower wood costs. Planned maintenance downtime costs are expected to be about $11 million higher with outages scheduled at our Georgetown, Eastover and Riverdale mills. In addition, the severe winter weather in the first quarter of 2014 will adversely impact operating profits.
Brazilian Papers net sales for 2013 were $1.1 billion compared with $1.1 billion in 2012 and $1.2 billion in 2011. Operating profits for 2013 were $210 million compared with $163 million in 2012 and $169 million in 2011. Sales volumes in 2013 increased in Brazil and across Latin America resulting in reduced exposure to foreign export markets. Average sales price realizations improved for domestic uncoated freesheet paper, but the benefit was partially offset by declining prices for exported paper. Margins were favorably affected by an increased proportion of sales to the higher-margin domestic market. Raw material costs increased for wood, purchased pulp and chemicals, but costs for energy decreased due to the start-up and operation of the biomass boiler in Mogi Guacu. Operating costs and planned maintenance downtime costs were lower than in 2012.
Looking ahead to 2014, sales volumes in the first quarter are expected to decrease due to seasonally weaker customer demand for uncoated freesheet paper. Average sales price realizations are expected to increase in the Brazilian domestic market due to the realization of announced sales price increases for uncoated freesheet paper. Input costs are expected to be about flat with higher wood costs offset by lower purchased pulp costs. Planned maintenance outage costs should be $4 million lower with no outages scheduled in the first quarter.
European Papers net sales in 2013 were $1.5 billion compared with $1.4 billion in 2012 and $1.4 billion in 2011. Operating profits in 2013 were $167 million compared with $179 million in 2012 and $196 million ($207 million excluding asset impairment charges related to our Inverurie, Scotland mill which was closed in 2009) in 2011.
Compared with 2012, sales volumes for uncoated freesheet paper in 2013 were higher in Russia, but slightly lower in Europe. Average sales price realizations for uncoated freesheet paper decreased in both Europe and Russia, reflecting weak economic conditions and soft market demand. Input costs for wood and energy were lower in Europe, but higher in Russia. Planned maintenance downtime costs were lower in 2013 because 2012 included an extra once-every-ten-years maintenance outage at the Saillat mill. Manufacturing operating costs were favorable.
Entering 2014, sales volumes in the first quarter are expected to be seasonally weaker in Russia, and slightly lower, primarily for pulp, in Europe. Average sales price realizations for uncoated freesheet paper are expected to decrease in Russia, but be about flat in Europe. Input costs should be higher for energy and chemicals. Mill maintenance outage costs should be $14 million lower in the first quarter of 2014.
Indian Papers includes the results of Andhra Pradesh Paper Mills (APPM) of which a 75% interest was acquired on October 14, 2011. Net sales were $185 million in 2013, $185 million in 2012 and $35 million in 2011. Operating profits were a loss of $145 million (a loss of $22 million excluding the goodwill and trade name impairment charges) in 2013, a loss of $16 million in 2012 and a loss of $3 million in 2011.
Average sales price realizations improved significantly in 2013 compared with 2012, although sales volumes decreased. Input costs were higher, primarily for wood. Operating costs and planned maintenance downtime costs were higher in 2013. Looking ahead to the first quarter of 2014, sales volumes are expected to be seasonally higher. Average sales price realizations should continue to increase due to the further realization of price increases announced in the fourth quarter of 2013.
Asian Printing Papers net sales were $90 million in 2013, $85 million in 2012 and $75 million in 2011. Operating profits were $1 million in both 2013 and 2012 and breakeven in 2011.
U.S. Pulp net sales were $815 million in 2013 compared with $725 million in 2012 and $725 million in 2011. Operating profits were $2 million in 2013 compared with a loss of $59 million in 2012 and a gain of $87 million in 2011.
31
Sales volumes in 2013 increased from 2012, primarily for fluff pulp, reflecting improved market demand and a change in our product mix with a full year of fluff pulp production at our Franklin, Virginia mill. Average sales price realizations were lower for fluff pulp while prices for market pulp increased. Input costs for wood, fuels and chemicals were higher. Mill operating costs were significantly lower largely due to the absence of costs associated with the start-up of the Franklin mill in 2012. Planned maintenance downtime costs were higher.
In the first quarter of 2014, sales volumes are expected to be slightly lower compared with the fourth quarter of 2013. Average sales price realizations are expected to improve, reflecting the further realization of previously announced sales price increases for softwood pulp and fluff pulp. Input costs should be flat. Planned maintenance downtime costs should be about $11 million higher than in the fourth quarter of 2013. Operating profits will also be negatively impacted by the severe winter weather in the first quarter of 2014.
Consumer Packaging
Demand and pricing for Consumer Packaging products correlate closely with consumer spending and general economic activity. In addition to prices and volumes, major factors affecting the profitability of Consumer Packaging are raw material and energy costs, freight costs, manufacturing efficiency and product mix.
Consumer Packaging net sales in 2013 increased 8% from 2012, but decreased 7% from 2011. Operating profits decreased 40% from 2012 and 1% from 2011. Net sales and operating profits include the Shorewood business in 2011. Excluding costs associated with the permanent shutdown of a paper machine at our Augusta, Georgia mill and costs associated with the sale of the Shorewood business, 2013 operating profits were 22% lower than in 2012, and 43% lower than in 2011.
Benefits from higher sales volumes ($45 million) were offset by lower average sales price realizations and an unfavorable mix ($50 million), higher operating costs including incremental costs resulting from the shutdown of a paper machine at our Augusta, Georgia mill ($46 million) and higher input costs ($6 million). In addition, operating profits in 2013 included restructuring costs of $45 million related to the permanent shutdown of a paper machine at our Augusta, Georgia mill and $2 million of costs associated with the sale of the Shorewood business. Operating profits in 2012 included a gain of $3 million related to the sale of the Shorewood business, while operating profits in 2011 included a $129 million fixed asset impairment charge for the North American Shorewood business and $72 million for other charges associated with the sale of the Shorewood business.
Consumer Packaging | |||||||||
In millions | 2013 | 2012 | 2011 | ||||||
Sales | $ | 3,435 | $ | 3,170 | $ | 3,710 | |||
Operating Profit | 161 | 268 | 163 | ||||||
North American Consumer Packaging net sales were $2.0 billion in 2013 compared with $2.0 billion in 2012 and $2.5 billion in 2011. Operating profits were $63 million ($110 million excluding paper machine shutdown costs and costs related to the sale of the Shorewood business) in 2013 compared with $165 million ($162 million excluding charges associated with the sale of the Shorewood business) in 2012 and $35 million ($236 million excluding asset impairment charges and other costs associated with the sale of the Shorewood business) in 2011.
Coated Paperboard sales volumes in 2013 were higher than in 2012 reflecting stronger market demand. Average sales price realizations were lower year-over-year despite the realization of price increases in the second half of 2013. Input costs for wood and energy increased, but were partially offset by lower costs for chemicals. Planned maintenance downtime costs were slightly lower. Market-related downtime was about 24,000 tons in 2013 compared with about 113,000 tons in 2012. The permanent shutdown of a paper machine at our Augusta, Georgia mill in the first quarter of 2013 reduced capacity by 140,000 tons in 2013 compared with 2012.
Foodservice sales volumes increased slightly in 2013 compared with 2012 despite softer market demand. Average sales margins were higher reflecting lower input costs for board and resins and a more favorable product mix. Operating costs and distribution costs were both higher.
The U.S.Shorewood business was sold December 31, 2011 and the non-U.S. business was sold in January 2012.
Looking ahead to the first quarter of 2014, Coated Paperboard sales volumes are expected to be seasonally weaker than in the fourth quarter of 2013. Average sales price realizations are expected to be slightly higher, and margins should also benefit from a more favorable product mix. Input costs are expected to be higher for energy, chemicals and wood. Planned maintenance downtime costs should be $8 million lower with a planned maintenance outage scheduled at the Augusta mill in the first quarter. The severe winter weather in the first quarter of 2014 will negatively impact operating profits. Foodservice sales volumes are expected to be seasonally lower. Average sales margins are expected to improve due to the realization of sales price increases effective with our January contract openers and a more favorable product mix.
32
Input costs for board and resin are expected to be flat and operating costs are expected to decrease.
European Consumer Packaging net sales in 2013 were $380 million compared with $380 million in 2012 and $375 million in 2011. Operating profits in 2013 were $100 million compared with $99 million in 2012 and $93 million in 2011. Sales volumes in 2013 decreased from 2012 in both the European and Russian markets. Average sales price realizations were significantly higher in the Russian market, but were lower in Europe. Input costs were flat year-over-year. Planned maintenance downtime costs were higher in 2013 than in 2012.
Looking forward to the first quarter of 2014, sales volumes compared with the fourth quarter of 2013 are expected to be about flat. Average sales price realizations are expected to be higher in both Russia and Europe. Input costs are expected to increase for wood and energy, but decrease for purchased pulp. There are no maintenance outages scheduled for the first quarter, however the Kwidzyn mill will have additional costs associated with the rebuild of a coated board machine.
Asian Consumer Packaging net sales were $1.1 billion in 2013 compared with $830 million in 2012 and $855 million in 2011. Operating profits in 2013 were a loss of $2 million compared with gains of $4 million in 2012 and $35 million in 2011. Sales volumes increased in 2013 compared with 2012, reflecting the ramp-up of a new coated paperboard machine installed in 2012. However, average sales price realizations were significantly lower, reflecting competitive pressure on sales prices which squeezed margins and created an unfavorable product mix. Lower input costs were offset by higher freight costs. In 2012, start-up costs for the new coated paperboard machine adversely impacted operating profits.
In the first quarter of 2014, sales volumes are expected to increase slightly. Average sales price realizations are expected to be flat reflecting continuing competitive pressures. Input costs are expected be higher for pulp, energy and chemicals. The business will drive margin improvement through operational excellence and better mix.
Distribution
xpedx, our distribution business, is one of North America’s leading business-to-business distributors to manufacturers, facility managers and printers, providing customized solutions that are designed to improve efficiency, reduce costs and deliver results. Customer demand is generally sensitive to changes in economic conditions and consumer behavior, along with segment specific activity including corporate advertising and promotional spending, government spending and domestic manufacturing activity. Distribution’s margins are relatively stable across an economic cycle. Providing customers with the best choice for value in both products and supply chain services is a key competitive factor. Additionally, efficient customer service, cost-effective logistics and focused working capital management are key factors in this segment’s profitability.
Distribution | |||||||||
In millions | 2013 | 2012 | 2011 | ||||||
Sales | $ | 5,650 | $ | 6,040 | $ | 6,630 | |||
Operating Profit | (389 | ) | 22 | 34 | |||||
Distribution’s 2013 annual sales decreased 6% from 2012, and decreased 15% from 2011. Operating profits in 2013 were a loss of $389 million (a gain of $43 million excluding goodwill impairment charges and reorganization costs) compared with $22 million ($71 million excluding reorganization costs) in 2012 and $34 million ($86 million excluding reorganization costs) in 2011.
Annual sales of printing papers and graphic arts supplies and equipment totaled $3.2 billion in 2013 compared with $3.5 billion in 2012 and $4.0 billion in 2011 reflecting declining demand and the discontinuation of a distribution agreement with a large manufacturer of graphic supplies. Trade margins as a percent of sales for printing papers were down from both 2012 and 2011. Revenue from packaging products was flat at $1.6 billion in 2013, 2012 and 2011 despite the significant decline of a large high-tech customer's business. Packaging margins remained flat to the 2012 level, and up from 2011. Facility supplies annual revenue was $845 million in 2013, down from $944 million in 2012 and $981 million in 2011.
Operating profits in 2013 included a goodwill impairment charge of $400 million and reorganization costs for severance, professional services and asset write-downs of $32 million. Operating profits in 2012 and 2011 included reorganization costs of $49 million and $52 million, respectively.
Looking ahead to the 2014 first quarter, operating profits will be seasonally lower, but will continue to reflect the benefits of strategic and other cost reduction initiatives.
33
The severe winter weather in the first quarter of 2014 will have a negative impact on operating profits.
Equity Earnings, Net of Taxes – Ilim Holding S.A.
International Paper accounts for its investment in Ilim Holding S.A. (Ilim), a separate reportable industry segment, using the equity method of accounting. Prior to 2012, due to the complex organizational structure of Ilim’s operations, and the extended time required to prepare consolidated financial information in accordance with accounting principles generally accepted in the United States, the Company reported its share of Ilim’s operating results on a one-quarter lag basis. In 2012, the Company determined that the elimination of the one-quarter lag was preferable because the same period-end reporting date improves overall financial reporting as the impact of current events, economic conditions and global trends are consistently reflected in the financial statements. Beginning January 1, 2012, the Company has applied this change in accounting principle retrospectively to all prior financial reporting periods presented.
The elimination of the one-quarter reporting lag for Ilim had the following impact:
Consolidated Statement of Operations
In millions | 2011 | |||
Equity earnings (loss), net of taxes | $ | (19 | ) | |
Earnings (loss) from continuing operations | (19 | ) | ||
Net earnings (loss) attributable to International Paper Company | (19 | ) | ||
Basic earnings (loss) per share from continuing operations | (0.04 | ) | ||
Basic net earnings (loss) per share | (0.04 | ) | ||
Diluted earnings (loss) per share from continuing operations | (0.04 | ) | ||
Diluted net earnings (loss) per share | (0.04 | ) | ||
The Company recorded equity earnings, net of taxes, related to Ilim of a loss of $46 million in 2013 compared with gains of $56 million in 2012 and $134 million in 2011. Operating results recorded in 2013 included an after-tax foreign exchange loss of $32 million compared with an after-tax foreign exchange gain of $16 million in 2012 on the remeasurement of U.S. dollar-denominated debt.
Sales volumes for the joint venture decreased year-over-year for shipments to China as a slight increase for softwood pulp was more than offset by decreases for hardwood pulp and linerboard. Sales volumes in the domestic Russian market also decreased for softwood and hardwood pulp and linerboard. Average sales price realizations were slightly higher in 2013 for pulp and linerboard in the domestic market and considerably higher for pulp and linerboard sales to China. Input costs increased for wood and energy year-over-year.
Freight costs also increased. Operating profits were negatively impacted by costs associated with the ramp-up of a new pulp line at the Bratsk mill and a coated and uncoated woodfree paper machine at the Koryazhma mill which were placed in service and began commercial production during 2013. The Company received cash dividends from the joint venture of $86 million in 2011. No dividends were paid in 2013 and 2012.
Entering the first quarter of 2014, sales volumes are expected to be higher than in the fourth quarter of 2013 due to increased production from the continuing ramp-up of the new equipment. Average sales price realizations are expected to be higher, primarily for softwood pulp. Input costs should be flat.
Overview
A major factor in International Paper’s liquidity and capital resource planning is its generation of operating cash flow, which is highly sensitive to changes in the pricing and demand for our major products. While changes in key cash operating costs, such as energy, raw material and transportation costs, do have an effect on operating cash generation, we believe that our focus on pricing and cost controls has improved our cash flow generation over an operating cycle.
Cash uses during 2013 were primarily focused on working capital requirements, capital spending, strategic acquisitions, debt reductions and returning cash to shareholders.
Cash Provided by Operating Activities
Cash provided by continuing operations totaled $3.0 billion in 2013 compared with $3.0 billion for 2012 and $2.7 billion for 2011.
The major components of cash provided by continuing operations are earnings from continuing operations adjusted for non-cash income and expense items and changes in working capital. Earnings from continuing operations, adjusted for non-cash income and expense items, increased by $608 million in 2013 versus 2012 driven mainly by the release of tax reserves, partially offset by the impairment of goodwill and other intangible assets. Cash used for working capital components, accounts receivable and inventory less accounts payable and accrued liabilities, interest payable and other totaled $486 million in 2013, compared with cash provided of $84 million in 2012 and a cash use of $505 million in 2011.
The Company generated free cash flow of approximately $1.8 billion, $1.6 billion and $1.7 billion in 2013, 2012 and 2011, respectively. Free cash flow is a non-GAAP measure and the most comparable GAAP
34
measure is cash provided by operations. Management uses free cash flow as a liquidity metric because it measures the amount of cash generated that is available to maintain our assets, make investments or acquisitions, pay dividends and reduce debt. The following are reconciliations of free cash flow to cash provided by operations:
In millions | 2013 | 2012 | 2011 | ||||||
Cash provided by operations | $ | 2,998 | $ | 2,960 | $ | 2,675 | |||
(Less)/Add: | |||||||||
Cash invested in capital projects | (1,198 | ) | (1,383 | ) | (1,159 | ) | |||
Cash contribution to pension plan, net of tax refunds | 31 | 44 | 300 | ||||||
Cash (received from) used for European accounts receivable securitization program | — | — | 209 | ||||||
Tax receivable collected related to pension contributions | — | — | (123 | ) | |||||
Cash received from unwinding a timber monetization | — | (251 | ) | (175 | ) | ||||
Change in control payments related to Temple-Inland acquisition | — | 120 | — | ||||||
Insurance reimbursement for Guaranty Bank settlement | (30 | ) | 80 | — | |||||
Free Cash Flow | $ | 1,801 | $ | 1,570 | $ | 1,727 | |||
In millions | Three Months Ended December 31, 2013 | Three Months Ended September 30, 2013 | Three Months Ended December 31, 2012 | ||||||
Cash provided by operations | $ | 1,034 | $ | 725 | $ | 686 | |||
(Less)/Add: | |||||||||
Cash invested in capital projects | (439 | ) | (271 | ) | (382 | ) | |||
Cash paid for Guaranty Bank settlement | — | — | 80 | ||||||
Free Cash Flow | $ | 595 | $ | 454 | $ | 384 | |||
Alternative Fuel Mixture Credit
On July 19, 2011 the Company filed an amended 2009 tax return claiming alternative fuel mixture tax credits as non-taxable income. The amended position has been accepted by the Internal Revenue Service (IRS) in the closing of the IRS tax audit for the years 2006 - 2009. As a result, during 2013, the Company recognized an income tax benefit of $753 million related to the non-taxability of the alternative fuel mixture tax credits.
During 2009, the Company produced 64 million gallons of black liquor that were not eligible for the alternative fuel mixture credit. The Company claimed these gallons for the cellulosic bio-fuel credit by amending the Company’s 2009 tax return. The impact of this amendment was included in the Company’s 2010 fourth quarter Income tax provision (benefit), resulting in a $40 million net credit to tax expense. Temple-Inland, Inc. also recognized an income tax benefit of $83 million in 2010 related to cellulosic bio-fuel credits.
Investment Activities
Investment activities in 2013 were down from 2012 reflecting a decrease in capital spending, increased divestiture proceeds following the completion of the Building Products sale in July 2013, and the 2012 acquisition of Temple-Inland. The Company maintains an average capital spending target of $1.0 billion per year over the course of an economic cycle. Capital spending for continuing operations was $1.2 billion in 2013, or 77% of depreciation and amortization, compared with $1.4 billion in 2012, or 93% of depreciation and amortization, and $1.2 billion, or 87% of depreciation and amortization in 2011. Across our businesses, capital spending as a percentage of depreciation and amortization ranged from 56% to 82% in 2013.
The following table shows capital spending for continuing operations by business segment for the years ended December 31, 2013, 2012 and 2011.
In millions | 2013 | 2012 | 2011 | ||||||
Industrial Packaging | $ | 629 | $ | 565 | $ | 426 | |||
Printing Papers | 294 | 449 | 364 | ||||||
Consumer Packaging | 208 | 296 | 310 | ||||||
Distribution | 9 | 10 | 8 | ||||||
Subtotal | 1,140 | 1,320 | 1,108 | ||||||
Corporate and other | 58 | 63 | 51 | ||||||
Total from Continuing Operations | $ | 1,198 | $ | 1,383 | $ | 1,159 | |||
Capital expenditures in 2014 are currently expected to be about $1.4 billion, or 95% of depreciation and amortization.
Acquisitions
2013: On January 3, 2013, International Paper completed the acquisition (effective date of acquisition on January 1, 2013) of the shares of its joint venture partner, Sabanci Holding, in the Turkish corrugated packaging company, Olmuksa International Paper Sabanci Ambalaj Sanayi ve Ticaret A.S. (now called Olmuksan International Paper or Olmuksan), for a purchase price of $56 million. The acquired shares represent 43.7% of Olmuksan's shares. Prior to this acquisition, International Paper held a 43.7% equity interest in Olmuksan.
Because the transaction resulted in International Paper becoming the majority shareholder, owning 87.4% of Olmuksan's outstanding and issued shares its completion triggered a mandatory call for tender of the remaining public shares which began in March 2013 and ended in April 2013, with no shares tendered. As a result, the 12.6% owned by other parties are considered non-controlling interests. Olmuksan's financial results have been consolidated with the Company's Industrial Packaging segment beginning
35
January 1, 2013, the effective date which International Paper obtained majority control of the entity.
Following the transaction, the Company's previously held 43.7% equity interest in Olmuksan was remeasured to a fair value of $75 million, resulting in a gain of $9 million. The fair value was estimated by applying the discounted cash flow approach, using a 13% discount rate, long-term sustainable growth rates ranging from 6% to 9% and a corporate tax rate of 20%. In addition, the cumulative translation adjustment balance of $17 million relating to the previously held equity interest was reclassified, as expense, from accumulated other comprehensive income.
The final purchase price allocation indicates that the sum of the cash consideration paid, the fair value of the noncontrolling interest and the fair value of the previously held interest is less than the fair value of the underlying assets by $21 million, resulting in a bargain purchase price gain being recorded on this transaction. The aforementioned remeasurement of equity interest gain, the cumulative translation adjustment to expense, and the bargain purchase gain are included in the Net bargain purchase gain on acquisition of business in the accompanying consolidated statement of operations.
2012: On February 13, 2012, International Paper completed the acquisition of Temple-Inland, Inc. (Temple-Inland). International Paper acquired all of the outstanding common stock of Temple-Inland for $32.00 per share in cash, totaling approximately $3.7 billion, and assumed approximately $700 million of Temple-Inland’s debt. As a condition to allowing the transaction to proceed, the Company entered into an agreement on a Final Judgment with the Antitrust Division of the U.S. Department of Justice (DOJ) that required the Company to divest three containerboard mills, with approximately 970,000 tons of aggregate containerboard capacity. On July 2, 2012, International Paper sold its Ontario and Oxnard (Hueneme), California containerboard mills to New-Indy Containerboard LLC, and its New Johnsonville, Tennessee containerboard mill to Hood Container Corporation. By completing these transactions, the Company satisfied its divestiture obligations under the Final Judgment. See Note 7 for further details of these divestitures.
Temple-Inland's results of operations are included in the consolidated financial statements from the date of acquisition on February 13, 2012.
2011: On October 14, 2011, International Paper completed the acquisition of a 75% stake in Andhra Pradesh Paper Mills Limited (APPM). The Company purchased 53.5% of APPM for a purchase price of $226 million in cash plus assumed debt from private investors. These sellers also entered into a covenant
not to compete for which they received a cash payment of $58 million. Additionally, the Company purchased a 21.5% stake of APPM in a public tender offer completed on October 8, 2011 for $105 million in cash. International Paper recognized an unfavorable currency transaction loss of $9 million due to strengthening of the dollar against the Indian Rupee prior to the closing date, resulting from cash balances deposited in Indian Rupee denominated escrow accounts.
In November 2011, International Paper appealed a directive from the Securities and Exchange Board of India (SEBI) that would require us to pay to the tendering shareholders the equivalent per share value of the non-compete payment that was paid to the previous controlling shareholders. The Company has deposited approximately $25 million into an escrow account to fund the additional non-compete payments in the event SEBI’s direction is upheld. By an order dated September 12, 2012, the Indian Securities Appellate Tribunal (SAT) upheld the SEBI directive. As a result of this initial unfavorable ruling, International Paper included the $25 million escrowed cash amount in the final purchase price consideration of APPM. On October 8, 2012, International Paper appealed the SAT's decision to the Indian Supreme Court.
APPM's results of operations are included in the consolidated financial statements from the date of acquisition on October 14, 2011.
Joint Ventures
2013: On January 14, 2013, International Paper and Brazilian corrugated packaging producer, Jari Celulose Papel e Embalagens S.A (Jari), a Grupo Orsa company, formed Orsa International Paper Embalagens S.A. (Orsa IP). The new entity, in which International Paper holds a 75% stake, includes three containerboard mills and four box plants, which make up Jari's former industrial packaging assets. This acquisition supports the Company's strategy of growing its global packaging presence and better serving its global customer base.
The value of International Paper's investment in Orsa IP is approximately $471 million. Because International paper acquired a majority control of the joint venture, Orsa IP's financial results have been consolidated with our Industrial Packaging segment from the date of formation on January 14, 2013.
2011: On April 15, 2011, International Paper and Sun Paper Industry Co. Ltd. entered into a Cooperative Joint Venture agreement to establish Shandong IP & Sun Food Packaging Co., Ltd. in China. During December 2011, the business license was obtained and International Paper contributed $55 million in cash for a 55% interest in the joint venture and Sun Paper
36
Industry Co. Ltd. contributed land-use rights valued at approximately $28 million, representing a 45% interest. The purpose of the joint venture is to build and operate a new production line to manufacture coated paperboard for food packaging with a designed annual production capacity of 500,000 tons. The financial position and results of operations of this joint venture have been included in International Paper’s consolidated financial statements from the date of formation in December 2011.
Additionally, during 2011 the Company recorded a gain of $7 million (before and after taxes) related to a bargain purchase price adjustment on an acquisition by our joint venture in Turkey. This gain is included in Equity earnings (losses), net of taxes in the accompanying consolidated statement of operations.
Financing Activities
Amounts related to early debt extinguishment during the years ended December 31, 2013, 2012 and 2011 were as follows:
In millions | 2013 | 2012 | 2011 | ||||||
Debt reductions (a) | $ | 574 | $ | 1,272 | $ | 129 | |||
Pre-tax early debt extinguishment costs (b) | 25 | 48 | 32 | ||||||
(a) | Reductions related to notes with interest rates ranging from 1.625% to 9.375% with original maturities from 2012 to 2041 for the years ended December 31, 2013, 2012 and 2011. |
(b) | Amounts are included in Restructuring and other charges in the accompanying consolidated statements of operations. |
2013: Financing activities during 2013 included debt issuances of $241 million and retirements of $845 million, for a net decrease of $604 million.
International Paper utilizes interest rate swaps to change the mix of fixed and variable rate debt and manage interest expense. At December 31, 2013, International Paper had interest rate swaps with a total notional amount of $175 million and maturities in 2018 (see Note 14 Derivatives and Hedging Activities on pages 76 through 80 of Item 8. Financial Statements and Supplementary Data). During 2013, existing swaps and the amortization of deferred gains on previously terminated swaps decreased the weighted average cost of debt from 6.7% to an effective rate of 6.5%. The inclusion of the offsetting interest income from short-term investments reduced this effective rate to 6.2%.
Other financing activities during 2013 included the net repurchase of approximately 10.9 million shares of treasury stock, including restricted stock withholding, and 7.3 million shares of common stock for various plans, including stock options exercises that generated approximately $298 million of cash. Repurchases of common stock and payments of restricted stock withholding taxes totaled $512 million, including $461
million related to shares repurchased under the Company's share repurchase program.
In September 2013, International Paper announced that the quarterly dividend would be increased from $0.30 per share to $0.35 per share, effective for the 2013 fourth quarter.
2012: Financing activities during 2012 included debt issuances of $2.1 billion and retirements of $2.5 billion, for a net decrease of $356 million.
In February 2012, International Paper issued a $1.2 billion term loan with an initial interest rate of LIBOR plus a margin of 138 basis points that varies depending on the credit rating of the Company and a $200 million term loan with an interest rate of LIBOR plus a margin of 175 basis points, both with maturity dates in 2017. The proceeds from these borrowings were used, along with available cash, to fund the acquisition of Temple-Inland. During 2012, International Paper fully repaid the $1.2 billion term loan.
International Paper utilizes interest rate swaps to change the mix of fixed and variable rate debt and manage interest expense. At December 31, 2012, International Paper had interest rate swaps with a total notional amount of $150 million and maturities in 2013 (see Note 14 Derivatives and Hedging Activities on pages 76 through 80 of Item 8. Financial Statements and Supplementary Data). During 2012, existing swaps and the amortization of deferred gains on previously terminated swaps decreased the weighted average cost of debt from 6.8% to an effective rate of 6.6%. The inclusion of the offsetting interest income from short-term investments reduced this effective rate to 6.2%.
Other financing activities during 2012 included the issuance of approximately 1.9 million shares of treasury stock, net of restricted stock withholding, and 1.0 million shared of common stock for various incentive plans, including stock options exercises that generated approximately $108 million of cash. Payment of restricted stock withholding taxes totaled $35 million.
2011: Financing activities during 2011 included debt issuances of $1.8 billion and retirements of $517 million, for a net increase of $1.3 billion.
In November 2011, International Paper issued $900 million of 4.75% senior unsecured notes with a maturity date in February 2022 and $600 million of 6% senior unsecured notes with a maturity date in November 2041.
At December 31, 2011, International Paper had interest rate swaps with a total notional amount of $150 million and maturities in 2013 (see Note 14 Derivatives and Hedging Activities on pages 76 through 80 of Item 8. Financial Statements and Supplementary Data). During 2011, existing swaps decreased the weighted
37
average cost of debt from 7.1% to an effective rate of 6.9%. The inclusion of the offsetting interest income from short-term investments reduced this effective rate to 6.26%.
Other financing activities during 2011 included the issuance of approximately 0.3 million shares of treasury stock for various incentive plans and the acquisition of 1.0 million shares of treasury stock primarily related to restricted stock withholding taxes. Payments of restricted stock withholding taxes totaled $30 million.
Off-Balance Sheet Variable Interest Entities
Information concerning off-balance sheet variable interest entities is set forth in Note 12 Variable Interest Entities and Preferred Securities of Subsidiaries on pages 72 through 75 of Item 8. Financial Statements and Supplementary Data for discussion.
Liquidity and Capital Resources Outlook for 2014
Capital Expenditures and Long-Term Debt
International Paper expects to be able to meet projected capital expenditures, service existing debt and meet working capital and dividend requirements during 2014 through current cash balances and cash from operations. Additionally, the Company has existing credit facilities totaling $2.0 billion.
The Company was in compliance with all its debt covenants at December 31, 2013. The Company’s financial covenants require the maintenance of a minimum net worth of $9 billion and a total debt-to-capital ratio of less than 60%. Net worth is defined as the sum of common stock, paid-in capital and retained earnings, less treasury stock plus any cumulative goodwill impairment charges. The calculation also excludes accumulated other comprehensive income/loss and Nonrecourse Financial Liabilities of Special Purpose Entities. The total debt-to-capital ratio is defined as total debt divided by the sum of total debt plus net worth. At December 31, 2013, International Paper’s net worth was $15.1 billion, and the total-debt-to-capital ratio was 39%.
The Company will continue to rely upon debt and capital markets for the majority of any necessary long-term funding not provided by operating cash flows. Funding decisions will be guided by our capital structure planning objectives. The primary goals of the Company’s capital structure planning are to maximize financial flexibility and preserve liquidity while reducing interest expense. The majority of International Paper’s debt is accessed through global public capital markets where we have a wide base of investors.
Maintaining an investment grade credit rating is an important element of International Paper’s financing strategy. At December 31, 2013, the Company held
long-term credit ratings of BBB (stable outlook) and Baa3 (stable outlook) by S&P and Moody’s, respectively.
Contractual obligations for future payments under existing debt and lease commitments and purchase obligations at December 31, 2013, were as follows:
In millions | 2014 | 2015 | 2016 | 2017 | 2018 | Thereafter | ||||||||||||
Maturities of long-term debt (a) | $ | 661 | $ | 498 | $ | 571 | $ | 285 | $ | 1,837 | $ | 5,636 | ||||||
Debt obligations with right of offset (b) | — | — | 5,185 | — | — | — | ||||||||||||
Lease obligations | 171 | 133 | 97 | 74 | 59 | 162 | ||||||||||||
Purchase obligations (c) | 3,170 | 770 | 642 | 529 | 453 | 2,404 | ||||||||||||
Total (d) | $ | 4,002 | $ | 1,401 | $ | 6,495 | $ | 888 | $ | 2,349 | $ | 8,202 | ||||||
(a) | Total debt includes scheduled principal payments only. |
(b) | Represents debt obligations borrowed from non-consolidated variable interest entities for which International Paper has, and intends to effect, a legal right to offset these obligations with investments held in the entities. Accordingly, in its consolidated balance sheet at December 31, 2013, International Paper has offset approximately $5.2 billion of interests in the entities against this $5.2 billion of debt obligations held by the entities (see Note 12 Variable Interest Entities and Preferred Securities of Subsidiaries on pages 72 through 75 in Item 8. Financial Statements and Supplementary Data). |
(c) | Includes $3.3 billion relating to fiber supply agreements entered into at the time of the 2006 Transformation Plan forestland sales and in conjunction with the 2008 acquisition of Weyerhaeuser Company’s Containerboard, Packaging and Recycling business. |
(d) | Not included in the above table due to the uncertainty as to the amount and timing of the payment are unrecognized tax benefits of approximately $146 million. |
We consider the undistributed earnings of our foreign subsidiaries as of December 31, 2013, to be indefinitely reinvested and, accordingly, no U.S. income taxes have been provided thereon. As of December 31, 2013, the amount of cash associated with indefinitely reinvested foreign earnings was approximately $900 million. We do not anticipate the need to repatriate funds to the United States to satisfy domestic liquidity needs arising in the ordinary course of business, including liquidity needs associated with our domestic debt service requirements.
Pension Obligations and Funding
At December 31, 2013, the projected benefit obligation for the Company’s U.S. defined benefit plans determined under U.S. GAAP was approximately $2.2 billion higher than the fair value of plan assets. Approximately $1.8 billion of this amount relates to plans that are subject to minimum funding requirements. Under current IRS funding rules, the calculation of minimum funding requirements differs from the calculation of the present value of plan benefits(the projected benefit obligation) for accounting purposes. In December 2008, the Worker, Retiree and Employer Recovery Act of 2008 (WERA) was passed by the U.S. Congress which provided for pension funding relief and technical corrections. Funding
38
contributions depend on the funding method selected by the Company, and the timing of its implementation, as well as on actual demographic data and the targeted funding level. The Company continually reassesses the amount and timing of any discretionary contributions and elected to make contributions totaling $31 million and $44 million for the years ended December 31, 2013 and 2012, respectively. At this time, we expect that required contributions to its plans in 2014 will be approximately $443 million, although the Company may elect to make future voluntary contributions. The timing and amount of future contributions, which could be material, will depend on a number of factors, including the actual earnings and changes in values of plan assets and changes in interest rates.
Ilim Holding S.A. Shareholder’s Agreement
In October 2007, in connection with the formation of the Ilim Holding S.A. joint venture, International Paper entered into a shareholder’s agreement that includes provisions relating to the reconciliation of disputes among the partners. This agreement provides that either the Company or its partners may commence procedures specified under the deadlock provisions. In prior years, had certain procedures been commenced under the deadlock provisions, the Company would have been required to purchase its partners’ 50% interest in Ilim, but those provisions have expired. If deadlock procedures are commenced today, although it is not obligated to do so, the Company may in certain situations, choose to purchase its partners' 50% interest in Ilim. Any such transaction would be subject to review and approval by Russian and other relevant anti-trust authorities. Based on the provisions of the agreement, International Paper estimates that the current purchase price for its partners’ 50% interests would not be material and could be satisfied by payment of cash or International Paper common stock, or some combination of the two, at the Company’s option. Any such purchase by International Paper would result in the consolidation of Ilim’s financial position and results of operations in all subsequent periods. The parties have informed each other that they have no current intention to commence procedures specified under the deadlock provision of the shareholders’ agreement, although they have the right to do so.
The preparation of financial statements in conformity with accounting principles generally accepted in the United States requires International Paper to establish accounting policies and to make estimates that affect both the amounts and timing of the recording of assets, liabilities, revenues and expenses. Some of these estimates require judgments about matters that are inherently uncertain.
Accounting policies whose application may have a significant effect on the reported results of operations and financial position of International Paper, and that can require judgments by management that affect their application, include the accounting for contingencies, impairment or disposal of long-lived assets and goodwill, pensions and postretirement benefit obligations, stock options and income taxes. The Company has discussed the selection of critical accounting policies and the effect of significant estimates with the Audit Committee of the Company’s Board of Directors.
Contingent Liabilities
Accruals for contingent liabilities, including legal and environmental matters, are recorded when it is probable that a liability has been incurred or an asset impaired and the amount of the loss can be reasonably estimated. Liabilities accrued for legal matters require judgments regarding projected outcomes and range of loss based on historical experience and recommendations of legal counsel. Liabilities for environmental matters require evaluations of relevant environmental regulations and estimates of future remediation alternatives and costs. International Paper determines these estimates after a detailed evaluation of each site.
Impairment of Long-Lived Assets and Goodwill
An impairment of a long-lived asset exists when the asset’s carrying amount exceeds its fair value, and is recorded when the carrying amount is not recoverable through cash flows from future operations. A goodwill impairment exists when the carrying amount of goodwill exceeds its fair value. Assessments of possible impairments of long-lived assets and goodwill are made when events or changes in circumstances indicate that the carrying value of the asset may not be recoverable through future operations. Additionally, testing for possible impairment of goodwill and intangible asset balances is required annually. The amount and timing of any impairment charges based on these assessments require the estimation of future cash flows and the fair market value of the related assets based on management’s best estimates of certain key factors, including future selling prices and volumes, operating, raw material, energy and freight costs, and various other projected operating economic factors. As these key factors change in future periods, the Company will update its impairment analyses to reflect its latest estimates and projections.
Under the provisions of Accounting Standards Codification (ASC) 350, “Intangibles – Goodwill and Other,” the testing of goodwill for possible impairment is a two-step process. In the first step, the fair value of the Company’s reporting units is compared with their carrying value, including goodwill. If fair value exceeds
39
the carrying value, goodwill is not considered to be impaired. If the fair value of a reporting unit is below the carrying value, then step two is performed to measure the amount of the goodwill impairment loss for the reporting unit. This analysis requires the determination of the fair value of all of the individual assets and liabilities of the reporting unit, including any currently unrecognized intangible assets, as if the reporting unit had been purchased on the analysis date. Once these fair values have been determined, the implied fair value of the unit’s goodwill is calculated as the excess, if any, of the fair value of the reporting unit determined in step one over the fair value of the net assets determined in step two. The carrying value of goodwill is then reduced to this implied value, or to zero if the fair value of the assets exceeds the fair value of the reporting unit, through a goodwill impairment charge.
The impairment analysis requires a number of judgments by management. In calculating the estimated fair value of its reporting units in step one, the Company uses the projected future cash flows to be generated by each unit over the estimated remaining useful operating lives of the unit’s assets, discounted using the estimated cost-of-capital discount rate for each reporting unit. These calculations require many estimates, including discount rates, future growth rates, and cost and pricing trends for each reporting unit. Subsequent changes in economic and operating conditions can affect these assumptions and could result in additional interim testing and goodwill impairment charges in future periods. Upon completion, the resulting estimated fair values are then analyzed for reasonableness by comparing them to earnings multiples for historic industry business transactions, and by comparing the sum of the reporting unit fair values and other corporate assets and liabilities divided by diluted common shares outstanding to the Company’s market price per share on the analysis date.
In the fourth quarter of 2013, in conjunction with the annual testing of its reporting units for possible goodwill impairments, the Company calculated the estimated fair value of its India Papers business using the discounted future cash flows and determined that all of the goodwill of this business, totaling $112 million, should be written off. The decline in the fair value of the India Papers reporting unit and resulting impairment charge was due to a change in the strategic outlook for the India Papers operations.
Also in the fourth quarter of 2013, the Company calculated the estimated fair value of its xpedx business using the discounted future cash flows and wrote off all of the goodwill of its xpedx business, totaling $400 million. The decline in fair value of the xpedx reporting unit and resulting impairment charge was due to a significant decline in earnings and a change in the strategic outlook for the xpedx operations.
As a result, during the fourth quarter of 2013, the Company recorded a total goodwill impairment charge of $512 million ($485 million after taxes and a gain of $3 million related to noncontrolling interest), representing all of the recorded goodwill of the xpedx business and the India Papers business.
Also during 2013, the Company recorded a pre-tax charge of $15 million ($7 million after taxes and noncontrolling interest) for the impairment of a trade name intangible asset related to our India Papers business.
No goodwill impairment charges were recorded in 2012 or 2011.
Pension and Postretirement Benefit Obligations
The charges recorded for pension and other postretirement benefit obligations are determined annually in conjunction with International Paper’s consulting actuary, and are dependent upon various assumptions including the expected long-term rate of return on plan assets, discount rates, projected future compensation increases, health care cost trend rates and mortality rates.
The calculations of pension and postretirement benefit obligations and expenses require decisions about a number of key assumptions that can significantly affect liability and expense amounts, including the expected long-term rate of return on plan assets, the discount rate used to calculate plan liabilities, the projected rate of future compensation increases and health care cost trend rates.
Benefit obligations and fair values of plan assets as of December 31, 2013, for International Paper’s pension and postretirement plans were as follows:
In millions | Benefit Obligation | Fair Value of Plan Assets | ||||
U.S. qualified pension | $ | 12,496 | $ | 10,706 | ||
U.S. nonqualified pension | 407 | — | ||||
U.S. postretirement | 322 | — | ||||
Non-U.S. pension | 228 | 181 | ||||
Non-U.S. postretirement | 72 | — | ||||
The table below shows assumptions used by International Paper to calculate U.S. pension obligations for the years shown:
2013 | 2012 | 2011 | ||||
Discount rate | 4.90 | % | 4.10 | % | 5.10 | % |
Rate of compensation increase | 3.75 | % | 3.75 | % | 3.75 | % |
40
Additionally, health care cost trend rates used in the calculation of U.S. postretirement obligations for the years shown were:
2013 | 2012 | |||
Health care cost trend rate assumed for next year | 7.00 | % | 7.50 | % |
Rate that the cost trend rate gradually declines to | 5.00 | % | 5.00 | % |
Year that the rate reaches the rate it is assumed to remain | 2017 | 2017 | ||
International Paper determines these actuarial assumptions, after consultation with our actuaries, on December 31 of each year to calculate liability information as of that date and pension and postretirement expense for the following year. The expected long-term rate of return on plan assets is based on projected rates of return for current and planned asset classes in the plan’s investment portfolio. The discount rate assumption was determined based on a hypothetical settlement portfolio selected from a universe of high quality corporate bonds.
Increasing (decreasing) the expected long-term rate of return on U.S. plan assets by an additional 0.25% would decrease (increase) 2014 pension expense by approximately $25 million, while a (decrease) increase of 0.25% in the discount rate would (increase) decrease pension expense by approximately $35 million. The effect on net postretirement benefit cost from a 1% increase or decrease in the annual health care cost trend rate would be approximately $1 million.
Actual rates of return earned on U.S. pension plan assets for each of the last 10 years were:
Year | Return | Year | Return | ||
2013 | 14.1 | % | 2008 | (23.6 | )% |
2012 | 14.1 | % | 2007 | 9.6 | % |
2011 | 2.5 | % | 2006 | 14.9 | % |
2010 | 15.1 | % | 2005 | 11.7 | % |
2009 | 23.8 | % | 2004 | 14.1 | % |
The 2012 and 2013 returns above represent weighted averages of International Paper and Temple-Inland asset returns. The annualized time-weighted rate of return earned on U.S. pension plan assets was 13.7% and 8.8% for the past five and ten years, respectively. The following graph shows the growth of a $1,000 investment in International Paper’s U.S. Pension Plan Master Trust. The graph portrays the time-weighted rate of return from 2003 – 2013.
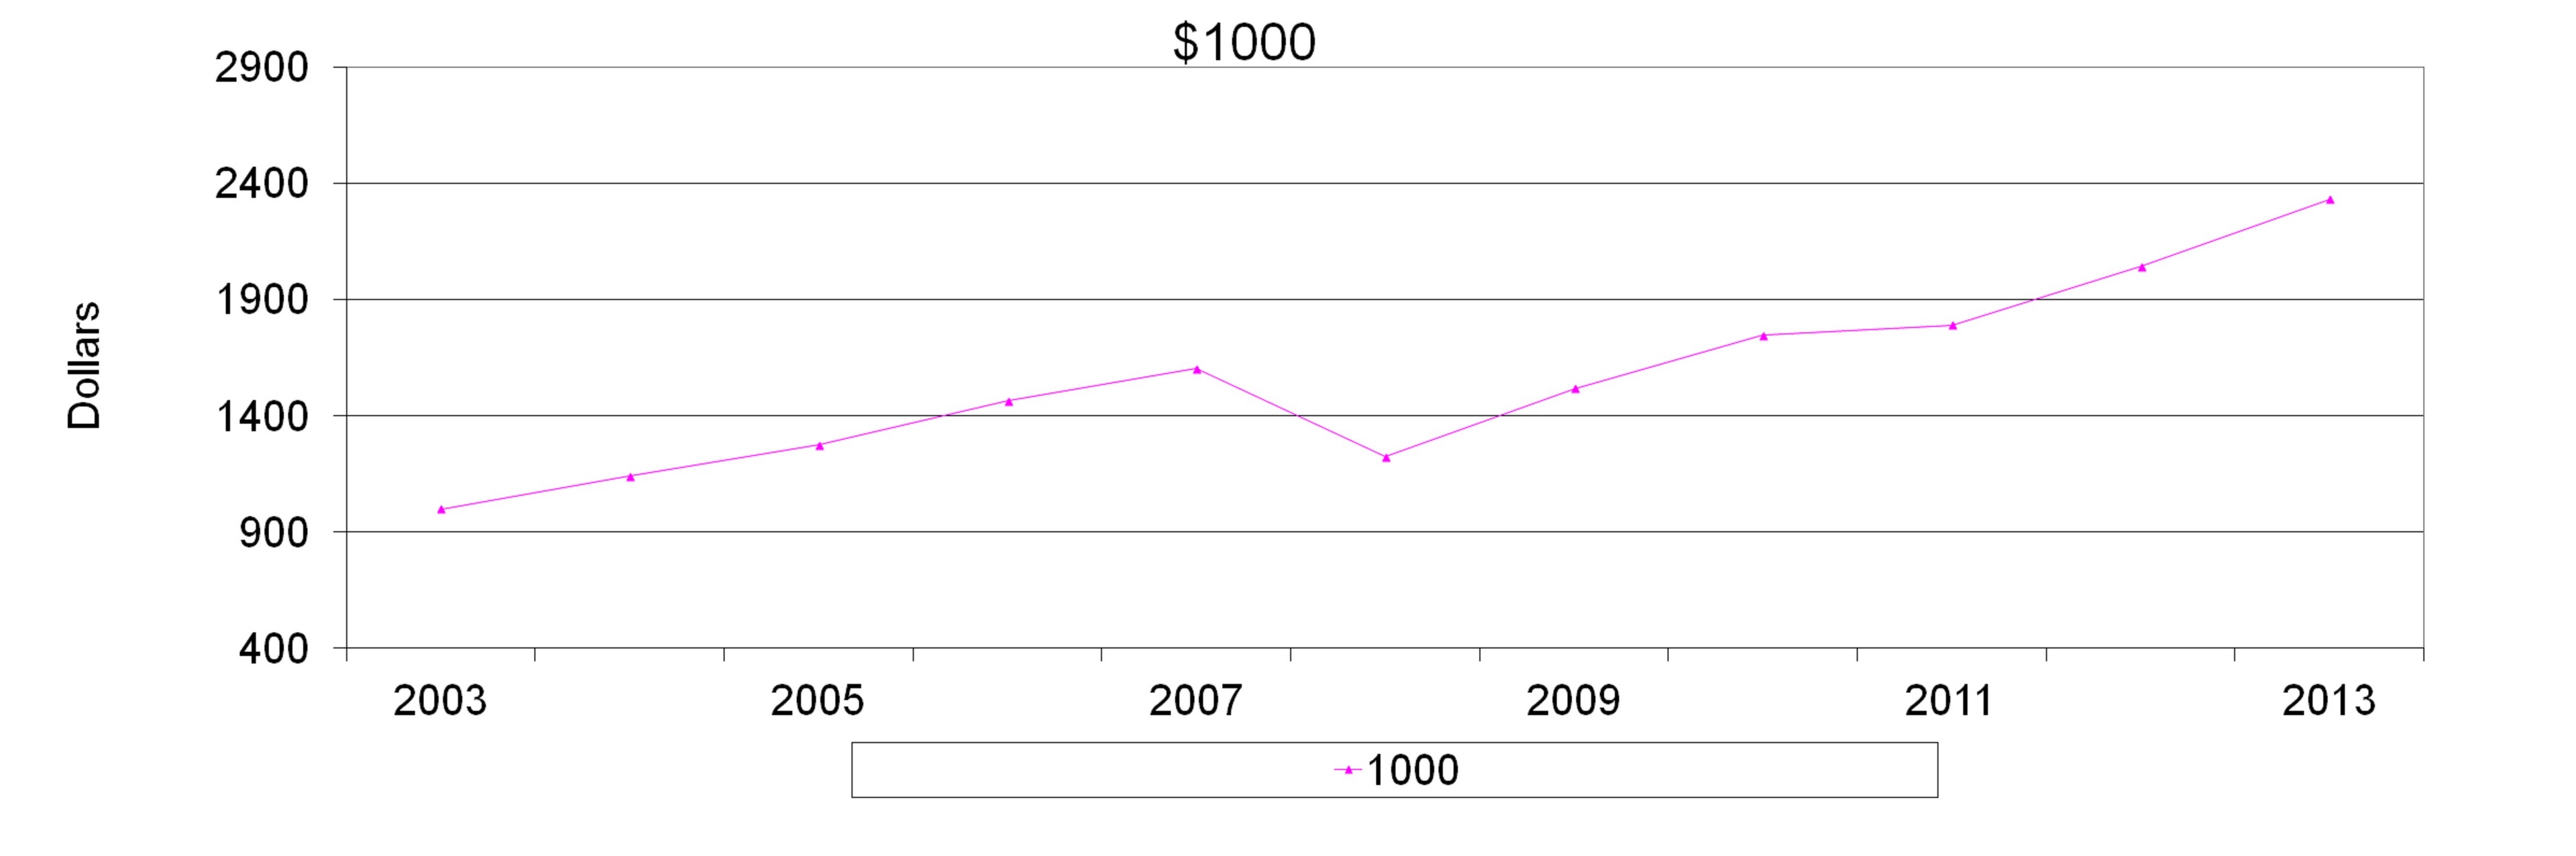
ASC 715, “Compensation – Retirement Benefits,” provides for delayed recognition of actuarial gains and losses, including amounts arising from changes in the estimated projected plan benefit obligation due to changes in the assumed discount rate, differences between the actual and expected return on plan assets, and other assumption changes. These net gains and losses are recognized in pension expense prospectively over a period that approximates the average remaining service period of active employees expected to receive benefits under the plans to the extent that they are not offset by gains and losses in subsequent years. The estimated net loss and prior service cost that will be amortized from accumulated other comprehensive income into net periodic pension cost for the U.S. pension plans over the next fiscal year are $316 million and $30 million, respectively.
Net periodic pension and postretirement plan expenses, calculated for all of International Paper’s plans, were as follows:
In millions | 2013 | 2012 | 2011 | 2010 | 2009 | ||||||||||
Pension expense | |||||||||||||||
U.S. plans (non-cash) | $ | 545 | $ | 342 | $ | 195 | $ | 231 | $ | 213 | |||||
Non-U.S. plans | 5 | 3 | 1 | — | 3 | ||||||||||
Postretirement expense | |||||||||||||||
U.S. plans | (1 | ) | (4 | ) | 7 | 6 | 27 | ||||||||
Non-U.S. plans | 7 | 1 | 2 | 1 | 3 | ||||||||||
Net expense | $ | 556 | $ | 342 | $ | 205 | $ | 238 | $ | 246 | |||||
The increase in 2013 U.S. pension expense principally reflects a decrease in the discount rate and higher amortization of unrecognized actuarial losses. The increase in 2013 U.S. postretirement expense is principally due to a curtailment gain in 2012 related to the remeasurement of the Temple-Inland Plan.
Assuming that discount rates, expected long-term returns on plan assets and rates of future compensation increases remain the same as in 2013, projected future net periodic pension and postretirement plan expenses would be as follows:
In millions | 2015 (1) | 2014 (1) | ||||
Pension expense | ||||||
U.S. plans (non-cash) | $ | 304 | $ | 366 | ||
Non-U.S. plans | 3 | 3 | ||||
Postretirement expense | ||||||
U.S. plans | 8 | 7 | ||||
Non-U.S. plans | 12 | 11 | ||||
Net expense | $ | 327 | $ | 387 | ||
(1) | Based on assumptions at December 31, 2013. |
The Company estimates that it will record net pension expense of approximately $366 million for its U.S.
41
defined benefit plans in 2014, with the decrease from expense of $545 million in 2013 reflecting an increase in the assumed discount rate to 4.90% in 2014 from 4.10% in 2013, lower unrecognized losses, a higher expected return on assets assumption of 7.00% for Temple-Inland plan assets offset by a lower return on assets assumption of 7.75% for International Paper plan assets.
The market value of plan assets for International Paper’s U.S. qualified pension plan at December 31, 2013 totaled approximately $10.7 billion, consisting of approximately 49% equity securities, 32% debt securities, 10% real estate and 9% other assets. Plan assets include an immaterial amount of International Paper common stock.
The Company’s funding policy for its qualified pension plans is to contribute amounts sufficient to meet legal funding requirements, plus any additional amounts that the Company may determine to be appropriate considering the funded status of the plan, tax deductibility, the cash flows generated by the Company, and other factors. The Company continually reassesses the amount and timing of any discretionary contributions and could elect to make voluntary contributions in the future. The required contribution for the U.S. qualified pension plans in 2014 is approximately $443 million. The nonqualified defined benefit plans are funded to the extent of benefit payments, which totaled $28 million for the year ended December 31, 2013.
Accounting for Stock Options
International Paper follows ASC 718, “Compensation – Stock Compensation,” in accounting for stock options. Under this guidance, expense for stock options is recorded over the related service period based on the grant-date fair market value.
During each reporting period, diluted earnings per share is calculated by assuming that “in-the-money” options are exercised and the exercise proceeds are used to repurchase shares in the marketplace. When options are actually exercised, option proceeds are credited to equity and issued shares are included in the computation of earnings per common share, with no effect on reported earnings. Equity is also increased by the tax benefit that International Paper will receive in its tax return for income reported by the optionees in their individual tax returns.
At December 31, 2013 and 2012, 1.8 million options, and 9.1 million options, respectively, were outstanding with exercise prices ranging from $38.41 to $48.19 per share for 2013 and $33.74 to $41.26 per share for 2012.
Income Taxes
International Paper records its global tax provision based on the respective tax rules and regulations for the jurisdictions in which it operates. Where the Company believes that a tax position is supportable for income tax purposes, the item is included in its income tax returns. Where treatment of a position is uncertain, liabilities are recorded based upon the Company’s evaluation of the “more likely than not” outcome considering technical merits of the position based on specific tax regulations and facts of each matter. Changes to recorded liabilities are only made when an identifiable event occurs that changes the likely outcome, such as settlement with the relevant tax authority, the expiration of statutes of limitation for the subject tax year, change in tax laws, or a recent court case that addresses the matter.
Valuation allowances are recorded to reduce deferred tax assets when it is more likely than not that a tax benefit will not be realized. Significant judgment is required in evaluating the need for and magnitude of appropriate valuation allowances against deferred tax assets. The realization of these assets is dependent on generating future taxable income, as well as successful implementation of various tax planning strategies.
While International Paper believes that these judgments and estimates are appropriate and reasonable under the circumstances, actual resolution of these matters may differ from recorded estimated amounts.
The Company’s effective income tax rates, before equity earnings and discontinued operations, were (62)%, 32% and 21% for 2013, 2012 and 2011, respectively. These effective tax rates include the tax effects of certain special items that can significantly affect the effective income tax rate in a given year, but may not recur in subsequent years. Management believes that the effective tax rate computed after excluding these special items may provide a better estimate of the rate that might be expected in future years if no additional special items were to occur in those years. Excluding these special items, the effective income tax rate for 2013 was 27% of pre-tax earnings compared with 29% in 2012 and 32% in 2011. We estimate that the 2014 effective income tax rate will be approximately 33% based on expected earnings and business conditions.
There were no new accounting pronouncements issued or effective during the fiscal year which have had or are expected to have a material impact on the Company’s consolidated financial statements. See Note 2 Recent Accounting Developments on pages 56 and 57 of
42
Item 8. Financial Statements and Supplementary Data for a discussion of new accounting pronouncements.
Information concerning the Company’s environmental and legal proceedings is set forth in Note 11 Commitments and Contingencies on pages 68 through 72 of Item 8. Financial Statements and Supplementary Data.
While inflationary increases in certain input costs, such as energy, wood fiber and chemical costs, have an impact on the Company’s operating results, changes in general inflation have had minimal impact on our operating results in each of the last three years. Sales prices and volumes are more strongly influenced by economic supply and demand factors in specific markets and by exchange rate fluctuations than by inflationary factors.
International Paper has operations in a number of countries. Its operations in those countries also export to, and compete with, imports from other regions. As such, currency movements can have a number of direct and indirect impacts on the Company’s financial statements. Direct impacts include the translation of international operations’ local currency financial statements into U.S. dollars. Indirect impacts include the change in competitiveness of imports into, and exports out of, the United States (and the impact on local currency pricing of products that are traded internationally). In general, a weaker U.S. dollar and stronger local currency is beneficial to International Paper. The currencies that have the most impact are the Euro, the Brazilian real, the Polish zloty and the Russian ruble.
We use financial instruments, including fixed and variable rate debt, to finance operations, for capital spending programs and for general corporate purposes. Additionally, financial instruments, including various derivative contracts, are used to hedge exposures to interest rate, commodity and foreign currency risks. We do not use financial instruments for trading purposes. Information related to International Paper’s debt obligations is included in Note 13 Debt and Lines of Credit on pages 75 and 76 of Item 8. Financial Statements and Supplementary Data. A discussion of derivatives and hedging activities is included in Note 14 Derivatives and Hedging Activities on pages 76 through 80 of Item 8. Financial Statements and Supplementary Data.
The fair value of our debt and financial instruments varies due to changes in market interest and foreign currency rates and commodity prices since the inception of the related instruments. We assess this market risk utilizing a sensitivity analysis. The sensitivity analysis measures the potential loss in earnings, fair values and cash flows based on a hypothetical 10% change (increase and decrease) in interest and currency rates and commodity prices.
Interest Rate Risk
Our exposure to market risk for changes in interest rates relates primarily to short- and long-term debt obligations and investments in marketable securities. We invest in investment-grade securities of financial institutions and money market mutual funds with a minimum rating of AAA and limit exposure to any one issuer or fund. Our investments in marketable securities at December 31, 2013 and 2012 are stated at cost, which approximates market due to their short-term nature. Our interest rate risk exposure related to these investments was not material.
We issue fixed and floating rate debt in a proportion consistent with International Paper’s targeted capital structure, while at the same time taking advantage of market opportunities to reduce interest expense as appropriate. Derivative instruments, such as interest rate swaps, may be used to implement this capital structure. At December 31, 2013 and 2012, the net fair value liability of financial instruments with exposure to interest rate risk was approximately $10.1 billion and $11.8 billion, respectively. The potential loss in fair value resulting from a 10% adverse shift in quoted interest rates would have been approximately $480 million and $642 million at December 31, 2013 and 2012, respectively.
Commodity Price Risk
The objective of our commodity exposure management is to minimize volatility in earnings due to large fluctuations in the price of commodities. Commodity swap and option contracts have been used to manage risks associated with market fluctuations in energy prices. The net fair value of such outstanding energy hedge contracts at December 31, 2013 and 2012 was approximately a $2 million asset and a $1 million liability, respectively. The potential loss in fair value resulting from a 10% adverse change in the underlying commodity prices would have been approximately $2 million and $1 million at December 31, 2013 and 2012, respectively.
Foreign Currency Risk
International Paper transacts business in many currencies and is also subject to currency exchange rate risk through investments and businesses owned
43
and operated in foreign countries. Our objective in managing the associated foreign currency risks is to minimize the effect of adverse exchange rate fluctuations on our after-tax cash flows. We address these risks on a limited basis by financing a portion of our investments in overseas operations with borrowings denominated in the same currency as the operation’s functional currency, or by entering into cross-currency and interest rate swaps, or foreign exchange contracts. At December 31, 2013 and 2012, the net fair value of financial instruments with exposure to foreign currency risk was approximately a $4 million asset and a $13 million liability, respectively. The potential loss in fair value for such financial instruments from a 10% adverse change in quoted foreign currency exchange rates would have been approximately $88 million and $49 million at December 31, 2013 and 2012, respectively.
See the preceding discussion and Note 14 Derivatives and Hedging Activities on pages 76 through 80 of Item 8. Financial Statements and Supplementary Data.
44
REPORT OF MANAGEMENT ON:
Financial Statements
The management of International Paper Company is responsible for the preparation of the consolidated financial statements in this annual report and for establishing and maintaining adequate internal controls over financial reporting. The consolidated financial statements have been prepared using accounting principles generally accepted in the United States of America considered appropriate in the circumstances to present fairly the Company’s consolidated financial position, results of operations and cash flows on a consistent basis. Management has also prepared the other information in this annual report and is responsible for its accuracy and consistency with the consolidated financial statements.
As can be expected in a complex and dynamic business environment, some financial statement amounts are based on estimates and judgments. Even though estimates and judgments are used, measures have been taken to provide reasonable assurance of the integrity and reliability of the financial information contained in this annual report. We have formed a Disclosure Committee to oversee this process.
The accompanying consolidated financial statements have been audited by the independent registered public accounting firm, Deloitte & Touche LLP. During its audits, Deloitte & Touche LLP was given unrestricted access to all financial records and related data, including minutes of all meetings of stockholders and the board of directors and all committees of the board. Management believes that all representations made to the independent auditors during their audits were valid and appropriate.
Internal Control Over Financial Reporting
The management of International Paper Company is also responsible for establishing and maintaining adequate internal control over financial reporting. Internal control over financial reporting is the process designed by, or under the supervision of, our principal executive officer and principal financial officer, and effected by our Board of Directors, management and other personnel to provide reasonable assurance regarding the reliability of financial reporting and the preparation of financial statements for external purposes. All internal control systems have inherent limitations, including the possibility of circumvention and overriding of controls, and therefore can provide only reasonable assurance of achieving the designed control objectives. The Company’s internal control
system is supported by written policies and procedures, contains self-monitoring mechanisms, and is audited by the internal audit function. Appropriate actions are taken by management to correct deficiencies as they are identified.
The Company has assessed the effectiveness of its internal control over financial reporting as of December 31, 2013. In making this assessment, it used the criteria described in “Internal Control – Integrated Framework (1992)” issued by the Committee of Sponsoring Organizations of the Treadway Commission (COSO). Based on this assessment, management believes that, as of December 31, 2013, the Company’s internal control over financial reporting was effective.
The Company completed the acquisitions of Olmuksan and Orsa IP, both in January 2013. Due to the timing of these acquisitions we have excluded Olmuksan and Orsa IP from our evaluation of the effectiveness of internal control over financial reporting. For the period ended December 31, 2013, net sales and assets of both Olmuksan and Orsa IP represented approximately 2% of total net sales and 2% of total assets. The Company’s independent registered public accounting firm, Deloitte & Touche LLP, has issued its report on the effectiveness of the Company’s internal control over financial reporting. The report appears on pages 47 and 48.
Internal Control Environment And Board Of Directors Oversight
Our internal control environment includes an enterprise-wide attitude of integrity and control consciousness that establishes a positive “tone at the top.” This is exemplified by our ethics program that includes long-standing principles and policies on ethical business conduct that require employees to maintain the highest ethical and legal standards in the conduct of International Paper business, which have been distributed to all employees; a toll-free telephone helpline whereby any employee may anonymously report suspected violations of law or International Paper’s policy; and an office of ethics and business practice. The internal control system further includes careful selection and training of supervisory and management personnel, appropriate delegation of authority and division of responsibility, dissemination of accounting and business policies throughout International Paper, and an extensive program of internal audits with management follow-up.
The Board of Directors, assisted by the Audit and Finance Committee (Committee), monitors the integrity of the Company’s financial statements and financial reporting procedures, the performance of the Company’s internal audit function and independent
45
auditors, and other matters set forth in its charter. The Committee, which currently consists of five independent directors, meets regularly with representatives of management, and with the independent auditors and the Internal Auditor, with and without management representatives in attendance, to review their activities. The Committee’s Charter takes into account the New York Stock Exchange rules relating to Audit Committees and the SEC rules and regulations promulgated as a result of the Sarbanes-Oxley Act of 2002. The Committee has reviewed and discussed the consolidated financial statements for the year ended December 31, 2013, including critical accounting policies and significant management judgments, with management and the independent auditors. The Committee’s report recommending the inclusion of such financial statements in this Annual Report on Form 10-K will be set forth in our Proxy Statement.

JOHN V. FARACI
CHAIRMAN AND CHIEF EXECUTIVE OFFICER

CAROL L. ROBERTS
SENIOR VICE PRESIDENT AND CHIEF FINANCIAL OFFICER
46
To the Board of Directors and Shareholders of International Paper Company:
We have audited the accompanying consolidated balance sheets of International Paper Company and subsidiaries (the “Company”) as of December 31, 2013 and 2012, and the related consolidated statements of operations, comprehensive income, changes in equity, and cash flows for each of the three years in the period ended December 31, 2013. Our audits also included the financial statement schedule listed in the Index at Item 15(2). These financial statements and the financial statement schedule are the responsibility of the Company's management. Our responsibility is to express an opinion on the financial statements and the financial statement schedule based on our audits.
We conducted our audits in accordance with the standards of the Public Company Accounting Oversight Board (United States). Those standards require that we plan and perform the audit to obtain reasonable assurance about whether the financial statements are free of material misstatement. An audit includes examining, on a test basis, evidence supporting the amounts and disclosures in the financial statements. An audit also includes assessing the accounting principles used and significant estimates made by management, as well as evaluating the overall financial statement presentation. We believe that our audits provide a reasonable basis for our opinion.
In our opinion, such consolidated financial statements present fairly, in all material respects, the financial position of International Paper Company and subsidiaries as of December 31, 2013 and 2012, and the results of their operations and their cash flows for each of the three years in the period ended December 31, 2013, in conformity with accounting principles generally accepted in the United States of America. Also, in our opinion, such financial statement schedule, when considered in relation to the basic consolidated financial statements taken as a whole, presents fairly, in all material respects, the information set forth therein.
We have also audited, in accordance with the standards of the Public Company Accounting Oversight Board (United States), the Company's internal control over financial reporting as of December 31, 2013, based on the criteria established in Internal Control - Integrated Framework (1992) issued by the Committee of Sponsoring Organizations of the Treadway Commission, and our report dated February 27, 2014 expressed an unqualified opinion on the Company's internal control over financial reporting.
Memphis, Tennessee
February 27, 2014
To the Board of Directors and Shareholders of International Paper Company:
We have audited the internal control over financial reporting of International Paper Company and subsidiaries (the "Company") as of December 31, 2013, based on criteria established in Internal Control - Integrated Framework (1992) issued by the Committee of Sponsoring Organizations of the Treadway Commission. As described in the Report of Management on Internal Control Over Financial Reporting, management excluded from its assessment the internal control over financial reporting at Olmuksa International Paper Sabanci Ambalaj Sanayi ve Ticaret A.S. and subsidiaries (“Olmuksan”) and Orsa International Paper Embalagens S.A. and subsidiaries (“Orsa IP”) which were acquired on January 3, 2013 and January 14, 2013, respectively. Both entities constitute approximately 2% of total net sales and 2% of total assets of the consolidated financial statements as of and for the year ended December 31, 2013. Accordingly our audit did not include internal control over financial reporting at Olmuksan or Orsa IP. The Company's management is responsible for maintaining effective internal control over financial reporting and for its assessment of the effectiveness of internal control over financial reporting, included in the accompanying Report of Management on Internal Control over Financial Reporting. Our responsibility is to express an opinion on the Company's internal control over financial reporting based on our audit.
We conducted our audit in accordance with the standards of the Public Company Accounting Oversight
47
Board (United States). Those standards require that we plan and perform the audit to obtain reasonable assurance about whether effective internal control over financial reporting was maintained in all material respects. Our audit included obtaining an understanding of internal control over financial reporting, assessing the risk that a material weakness exists, testing and evaluating the design and operating effectiveness of internal control based on the assessed risk, and performing such other procedures as we considered necessary in the circumstances. We believe that our audit provides a reasonable basis for our opinion.
A company's internal control over financial reporting is a process designed by, or under the supervision of, the company's principal executive and principal financial officers, or persons performing similar functions, and effected by the company's board of directors, management, and other personnel to provide reasonable assurance regarding the reliability of financial reporting and the preparation of financial statements for external purposes in accordance with generally accepted accounting principles. A company's internal control over financial reporting includes those policies and procedures that (1) pertain to the maintenance of records that, in reasonable detail, accurately and fairly reflect the transactions and dispositions of the assets of the company; (2) provide reasonable assurance that transactions are recorded as necessary to permit preparation of financial statements in accordance with generally accepted accounting principles, and that receipts and expenditures of the company are being made only in accordance with authorizations of management and directors of the company; and (3) provide reasonable assurance regarding prevention or timely detection of unauthorized acquisition, use, or disposition of the company's assets that could have a material effect on the financial statements.
Because of the inherent limitations of internal control over financial reporting, including the possibility of collusion or improper management override of controls, material misstatements due to error or fraud may not be prevented or detected on a timely basis. Also, projections of any evaluation of the effectiveness of the internal control over financial reporting to future periods are subject to the risk that the controls may become inadequate because of changes in conditions, or that the degree of compliance with the policies or procedures may deteriorate.
In our opinion, the Company maintained, in all material respects, effective internal control over financial reporting as of December 31, 2013, based on the criteria established in Internal Control - Integrated Framework (1992) issued by the Committee of
Sponsoring Organizations of the Treadway Commission.
We have also audited, in accordance with the standards of the Public Company Accounting Oversight Board (United States), the consolidated financial statements and financial statement schedule as of and for the year ended December 31, 2013 of the Company and our report dated February 27, 2014 expressed an unqualified opinion on those financial statements and financial statement schedule.
Memphis, Tennessee
February 27, 2014
48
In millions, except per share amounts, for the years ended December 31 | 2013 | 2012 | 2011 | ||||||
NET SALES | $ | 29,080 | $ | 27,833 | $ | 26,034 | |||
COSTS AND EXPENSES | |||||||||
Cost of products sold | 21,223 | 20,587 | 18,960 | ||||||
Selling and administrative expenses | 2,205 | 2,092 | 1,887 | ||||||
Depreciation, amortization and cost of timber harvested | 1,547 | 1,486 | 1,332 | ||||||
Distribution expenses | 1,732 | 1,611 | 1,390 | ||||||
Taxes other than payroll and income taxes | 185 | 166 | 146 | ||||||
Restructuring and other charges | 210 | 109 | 102 | ||||||
Impairment of goodwill and other intangibles | 527 | — | — | ||||||
Net (gains) losses on sales and impairments of businesses | 3 | 86 | 218 | ||||||
Net bargain purchase gain on acquisition of business | (13 | ) | — | — | |||||
Interest expense, net | 612 | 672 | 541 | ||||||
EARNINGS (LOSS) FROM CONTINUING OPERATIONS BEFORE INCOME TAXES AND EQUITY EARNINGS | 849 | 1,024 | 1,458 | ||||||
Income tax provision (benefit) | (523 | ) | 331 | 311 | |||||
Equity earnings (loss), net of taxes | (39 | ) | 61 | 140 | |||||
EARNINGS (LOSS) FROM CONTINUING OPERATIONS | 1,333 | 754 | 1,287 | ||||||
Discontinued operations, net of taxes | 45 | 45 | 49 | ||||||
NET EARNINGS (LOSS) | 1,378 | 799 | 1,336 | ||||||
Less: Net earnings (loss) attributable to noncontrolling interests | (17 | ) | 5 | 14 | |||||
NET EARNINGS (LOSS) ATTRIBUTABLE TO INTERNATIONAL PAPER COMPANY | $ | 1,395 | $ | 794 | $ | 1,322 | |||
BASIC EARNINGS (LOSS) PER SHARE ATTRIBUTABLE TO INTERNATIONAL PAPER COMPANY COMMON SHAREHOLDERS | |||||||||
Earnings (loss) from continuing operations | $ | 3.05 | $ | 1.72 | $ | 2.95 | |||
Discontinued operations, net of taxes | 0.10 | 0.10 | 0.11 | ||||||
Net earnings (loss) | $ | 3.15 | $ | 1.82 | $ | 3.06 | |||
DILUTED EARNINGS (LOSS) PER SHARE ATTRIBUTABLE TO INTERNATIONAL PAPER COMPANY COMMON SHAREHOLDERS | |||||||||
Earnings (loss) from continuing operations | $ | 3.01 | $ | 1.70 | $ | 2.92 | |||
Discontinued operations, net of taxes | 0.10 | 0.10 | 0.11 | ||||||
Net earnings (loss) | $ | 3.11 | $ | 1.80 | $ | 3.03 | |||
AMOUNTS ATTRIBUTABLE TO INTERNATIONAL PAPER COMPANY COMMON SHAREHOLDERS | |||||||||
Earnings (loss) from continuing operations | $ | 1,350 | $ | 749 | $ | 1,273 | |||
Discontinued operations, net of taxes | 45 | 45 | 49 | ||||||
Net earnings (loss) | $ | 1,395 | $ | 794 | $ | 1,322 | |||
The accompanying notes are an integral part of these financial statements.
49
In millions for the years ended December 31 | 2013 | 2012 | 2011 | ||||||
NET EARNINGS (LOSS) | $ | 1,378 | $ | 799 | $ | 1,336 | |||
OTHER COMPREHENSIVE INCOME (LOSS), NET OF TAX | |||||||||
Amortization of pension and post-retirement prior service costs and net loss: | |||||||||
U.S. plans (less tax of $195, $124 and $88) | 307 | 195 | 139 | ||||||
Pension and postretirement liability adjustments: | |||||||||
U.S. plans (less tax of $756, $583 and $498) | 1,188 | (914 | ) | (783 | ) | ||||
Non-U.S. plans (less tax of $3, $9 and $3) | (4 | ) | (25 | ) | (5 | ) | |||
Change in cumulative foreign currency translation adjustment | (426 | ) | (131 | ) | (492 | ) | |||
Net gains/losses on cash flow hedging derivatives: | |||||||||
Net gains (losses) arising during the period (less tax of $2, $1 and $17) | — | 15 | (43 | ) | |||||
Reclassification adjustment for (gains) losses included in net earnings (less tax of $3, $13 and $8) | (7 | ) | 22 | 8 | |||||
TOTAL OTHER COMPREHENSIVE INCOME (LOSS), NET OF TAX | 1,058 | (838 | ) | (1,176 | ) | ||||
Comprehensive Income (Loss) | 2,436 | (39 | ) | 160 | |||||
Net (Earnings) Loss Attributable to Noncontrolling Interests | 17 | (5 | ) | (14 | ) | ||||
Other Comprehensive (Income) Loss Attributable to Noncontrolling Interests | 23 | 3 | (4 | ) | |||||
COMPREHENSIVE INCOME (LOSS) ATTRIBUTABLE TO INTERNATIONAL PAPER COMPANY | $ | 2,476 | $ | (41 | ) | $ | 142 | ||
The accompanying notes are an integral part of these financial statements.
50
In millions, except per share amounts, at December 31 | 2013 | 2012 | ||||
ASSETS | ||||||
Current Assets | ||||||
Cash and temporary investments | $ | 1,802 | $ | 1,302 | ||
Accounts and notes receivable, less allowances of $109 in 2013 and $119 in 2012 | 3,756 | 3,562 | ||||
Inventories | 2,825 | 2,730 | ||||
Deferred income tax assets | 302 | 323 | ||||
Assets of businesses held for sale | — | 759 | ||||
Other current assets | 340 | 229 | ||||
Total Current Assets | 9,025 | 8,905 | ||||
Plants, Properties and Equipment, net | 13,672 | 13,949 | ||||
Forestlands | 557 | 622 | ||||
Investments | 733 | 887 | ||||
Financial Assets of Special Purpose Entities (Note 12) | 2,127 | 2,108 | ||||
Goodwill | 3,987 | 4,315 | ||||
Deferred Charges and Other Assets | 1,427 | 1,367 | ||||
TOTAL ASSETS | $ | 31,528 | $ | 32,153 | ||
LIABILITIES AND EQUITY | ||||||
Current Liabilities | ||||||
Notes payable and current maturities of long-term debt | $ | 661 | $ | 444 | ||
Accounts payable | 2,900 | 2,775 | ||||
Accrued payroll and benefits | 511 | 508 | ||||
Liabilities of businesses held for sale | — | 44 | ||||
Other accrued liabilities | 1,055 | 1,227 | ||||
Total Current Liabilities | 5,127 | 4,998 | ||||
Long-Term Debt | 8,827 | 9,696 | ||||
Nonrecourse Financial Liabilities of Special Purpose Entities (Note 12) | 2,043 | 2,036 | ||||
Deferred Income Taxes | 3,765 | 3,026 | ||||
Pension Benefit Obligation | 2,205 | 4,112 | ||||
Postretirement and Postemployment Benefit Obligation | 412 | 473 | ||||
Other Liabilities | 702 | 1,176 | ||||
Redeemable Noncontrolling Interest | 163 | — | ||||
Commitments and Contingent Liabilities (Note 11) | ||||||
Equity | ||||||
Common stock $1 par value, 2013 – 447.2 shares and 2012 – 439.9 shares | 447 | 440 | ||||
Paid-in capital | 6,463 | 6,042 | ||||
Retained earnings | 4,446 | 3,662 | ||||
Accumulated other comprehensive loss | (2,759 | ) | (3,840 | ) | ||
8,597 | 6,304 | |||||
Less: Common stock held in treasury, at cost, 2013 – 10.868 shares and 2012 – 0.013 shares | 492 | — | ||||
Total Shareholders’ Equity | 8,105 | 6,304 | ||||
Noncontrolling interests | 179 | 332 | ||||
Total Equity | 8,284 | 6,636 | ||||
TOTAL LIABILITIES AND EQUITY | $ | 31,528 | $ | 32,153 | ||
The accompanying notes are an integral part of these financial statements.
51
In millions for the years ended December 31 | 2013 | 2012 | 2011 | ||||||
OPERATING ACTIVITIES | |||||||||
Net earnings (loss) | $ | 1,378 | $ | 799 | $ | 1,336 | |||
Discontinued operations, net of taxes | (45 | ) | (45 | ) | (49 | ) | |||
Earnings (loss) from continuing operations | 1,333 | 754 | 1,287 | ||||||
Depreciation, amortization, and cost of timber harvested | 1,547 | 1,486 | 1,332 | ||||||
Deferred income tax provision (benefit), net | 146 | 204 | 317 | ||||||
Restructuring and other charges | 210 | 109 | 102 | ||||||
Pension plan contribution | (31 | ) | (44 | ) | (300 | ) | |||
Net bargain purchase gain on acquisition of business | (13 | ) | — | — | |||||
Periodic pension expense, net | 545 | 342 | 195 | ||||||
Net (gains) losses on sales and impairments of businesses | 3 | 86 | 218 | ||||||
Equity (earnings) losses, net of taxes | 39 | (61 | ) | (140 | ) | ||||
Release of tax reserves | (775 | ) | — | — | |||||
Impairment of goodwill and other intangible assets | 527 | — | — | ||||||
Other, net | (47 | ) | — | 169 | |||||
Changes in current assets and liabilities | |||||||||
Accounts and notes receivable | (134 | ) | 377 | (128 | ) | ||||
Inventories | (114 | ) | (28 | ) | (56 | ) | |||
Accounts payable and accrued liabilities | (110 | ) | (273 | ) | (389 | ) | |||
Interest payable | (57 | ) | 30 | 6 | |||||
Other | (71 | ) | (22 | ) | 62 | ||||
Cash provided by (used for) operating activities - continuing operations | 2,998 | 2,960 | 2,675 | ||||||
Cash provided by (used for) operating activities - discontinued operations | 30 | 7 | — | ||||||
CASH PROVIDED BY (USED FOR) OPERATING ACTIVITIES | 3,028 | 2,967 | 2,675 | ||||||
INVESTMENT ACTIVITIES | |||||||||
Invested in capital projects | (1,198 | ) | (1,383 | ) | (1,159 | ) | |||
Acquisitions, net of cash acquired | (505 | ) | (3,734 | ) | (379 | ) | |||
Proceeds from divestitures | 726 | 474 | 50 | ||||||
Equity investment in Ilim | — | (45 | ) | — | |||||
Proceeds from sale of fixed assets | 65 | — | — | ||||||
Escrow arrangement | — | — | (25 | ) | |||||
Other | 84 | (80 | ) | 26 | |||||
Cash provided by (used for) investment activities - continuing operations | (828 | ) | (4,768 | ) | (1,487 | ) | |||
Cash provided by (used for) investment activities - discontinued operations | 1 | (90 | ) | — | |||||
CASH PROVIDED BY (USED FOR) INVESTMENT ACTIVITIES | (827 | ) | (4,858 | ) | (1,487 | ) | |||
FINANCING ACTIVITIES | |||||||||
Repurchase of common stock and payments of restricted stock tax withholding | (512 | ) | (35 | ) | (30 | ) | |||
Issuance of common stock | 298 | 108 | — | ||||||
Issuance of debt | 241 | 2,132 | 1,766 | ||||||
Reduction of debt | (845 | ) | (2,488 | ) | (517 | ) | |||
Change in book overdrafts | (123 | ) | 11 | (29 | ) | ||||
Dividends paid | (554 | ) | (476 | ) | (427 | ) | |||
Redemption of securities | (150 | ) | — | — | |||||
Other | (43 | ) | (47 | ) | (21 | ) | |||
CASH PROVIDED BY (USED FOR) FINANCING ACTIVITIES | (1,688 | ) | (795 | ) | 742 | ||||
Effect of Exchange Rate Changes on Cash | (13 | ) | (6 | ) | (9 | ) | |||
Change in Cash and Temporary Investments | 500 | (2,692 | ) | 1,921 | |||||
Cash and Temporary Investments | |||||||||
Beginning of the period | 1,302 | 3,994 | 2,073 | ||||||
End of the period | $ | 1,802 | $ | 1,302 | $ | 3,994 | |||
The accompanying notes are an integral part of these financial statements.
52
In millions | Common Stock Issued | Paid-in Capital | Retained Earnings | Accumulated Other Comprehensive Income (Loss) | Treasury Stock | Total International Paper Shareholders’ Equity | Noncontrolling Interests | Total Equity | ||||||||||||||||
BALANCE, JANUARY 1, 2011 | $ | 439 | $ | 5,829 | $ | 2,460 | $ | (1,825 | ) | $ | 28 | $ | 6,875 | $ | 250 | $ | 7,125 | |||||||
Issuance of stock for various plans, net | — | 79 | — | — | (6 | ) | 85 | — | 85 | |||||||||||||||
Repurchase of stock | — | — | — | — | 30 | (30 | ) | — | (30 | ) | ||||||||||||||
Dividends | — | — | (427 | ) | — | — | (427 | ) | — | (427 | ) | |||||||||||||
Dividends paid to noncontrolling interests by subsidiary | — | — | — | — | — | — | (5 | ) | (5 | ) | ||||||||||||||
Noncontrolling interests of acquired entities | — | — | — | — | — | — | 37 | 37 | ||||||||||||||||
Acquisition of noncontrolling interests | — | — | — | — | — | — | 40 | 40 | ||||||||||||||||
Comprehensive income (loss) | — | — | 1,322 | (1,180 | ) | — | 142 | 18 | 160 | |||||||||||||||
BALANCE, DECEMBER 31, 2011 | 439 | 5,908 | 3,355 | (3,005 | ) | 52 | 6,645 | 340 | 6,985 | |||||||||||||||
Issuance of stock for various plans, net | 1 | 134 | — | — | (87 | ) | 222 | — | 222 | |||||||||||||||
Repurchase of stock | — | — | — | — | 35 | (35 | ) | — | (35 | ) | ||||||||||||||
Dividends | — | — | (487 | ) | — | — | (487 | ) | — | (487 | ) | |||||||||||||
Dividends paid to noncontrolling interests by subsidiary | — | — | — | — | — | — | (6 | ) | (6 | ) | ||||||||||||||
Noncontrolling interests of acquired entities | — | — | — | — | — | — | (4 | ) | (4 | ) | ||||||||||||||
Comprehensive income (loss) | — | — | 794 | (835 | ) | — | (41 | ) | 2 | (39 | ) | |||||||||||||
BALANCE, DECEMBER 31, 2012 | 440 | 6,042 | 3,662 | (3,840 | ) | — | 6,304 | 332 | 6,636 | |||||||||||||||
Issuance of stock for various plans, net | 7 | 421 | — | — | (20 | ) | 448 | — | 448 | |||||||||||||||
Repurchase of stock | — | — | — | — | 512 | (512 | ) | — | (512 | ) | ||||||||||||||
Dividends | — | — | (567 | ) | — | — | (567 | ) | — | (567 | ) | |||||||||||||
Dividends paid to noncontrolling interests by subsidiary | — | — | — | — | — | — | (1 | ) | (1 | ) | ||||||||||||||
Noncontrolling interests of acquired entities | — | — | (44 | ) | — | — | (44 | ) | (112 | ) | (156 | ) | ||||||||||||
Comprehensive income (loss) | — | — | 1,395 | 1,081 | — | 2,476 | (40 | ) | 2,436 | |||||||||||||||
BALANCE, DECEMBER 31, 2013 | $ | 447 | $ | 6,463 | $ | 4,446 | $ | (2,759 | ) | $ | 492 | $ | 8,105 | $ | 179 | $ | 8,284 | |||||||
The accompanying notes are an integral part of these financial statements.
53
NATURE OF BUSINESS
International Paper (the Company) is a global paper and packaging company that is complemented by an extensive North American merchant distribution system, with primary markets and manufacturing operations in North America, Europe, Latin America, Russia, Asia, Africa and the Middle East. Substantially all of our businesses have experienced, and are likely to continue to experience, cycles relating to available industry capacity and general economic conditions.
FINANCIAL STATEMENTS
These consolidated financial statements have been prepared in conformity with accounting principles generally accepted in the United States that require the use of management’s estimates. Actual results could differ from management’s estimates.
CONSOLIDATION
The consolidated financial statements include the accounts of International Paper and its wholly-owned, controlled majority-owned and financially controlled subsidiaries. All significant intercompany balances and transactions are eliminated.
International Paper accounts for its investment in Ilim Holding S.A. (Ilim), a separate reportable industry segment, using the equity method of accounting. Prior to 2012, due to the complex organizational structure of Ilim’s operations, and the extended time required to prepare consolidated financial information in accordance with accounting principles generally accepted in the United States, the Company reported its share of Ilim’s operating results on a one-quarter lag basis. In 2012, the Company determined that the elimination of the one-quarter lag was preferable because the same period-end reporting date improves overall financial reporting as the impact of current events, economic conditions and global trends are consistently reflected in the financial statements. Beginning January 1, 2012, the Company has applied this change in accounting principle retrospectively to all prior financial reporting periods presented.
The elimination of the one-quarter reporting lag for Ilim had the following impact:
Consolidated Statement of Operations
In millions | 2011 | |||
Equity earnings (loss), net of taxes | $ | (19 | ) | |
Earnings (loss) from continuing operations | (19 | ) | ||
Net earnings (loss) attributable to International Paper Company | (19 | ) | ||
Basic earnings (loss) per share from continuing operations | (0.04 | ) | ||
Basic net earnings (loss) per share | (0.04 | ) | ||
Diluted earnings (loss) per share from continuing operations | (0.04 | ) | ||
Diluted net earnings (loss) per share | (0.04 | ) | ||
Investments in affiliated companies where the Company has significant influence over their operations are accounted for by the equity method. International Paper’s share of affiliates’ results of operations totaled earnings (loss) of $(39) million, $61 million and $140 million in 2013, 2012 and 2011, respectively.
REVENUE RECOGNITION
Revenue is recognized when the customer takes title and assumes the risks and rewards of ownership. Revenue is recorded at the time of shipment for terms designated f.o.b. (free on board) shipping point. For sales transactions designated f.o.b. destination, revenue is recorded when the product is delivered to the customer’s delivery site, when title and risk of loss are transferred. Timber and forestland sales revenue is generally recognized when title and risk of loss pass to the buyer.
SHIPPING AND HANDLING COSTS
Shipping and handling costs, such as freight to our customers’ destinations, are included in distribution expenses in the consolidated statement of operations. When shipping and handling costs are included in the sales price charged for our products, they are recognized in net sales.
ANNUAL MAINTENANCE COSTS
Costs for repair and maintenance activities are expensed in the month that the related activity is performed under the direct expense method of accounting.
TEMPORARY INVESTMENTS
Temporary investments with an original maturity of three months or less are treated as cash equivalents and are stated at cost, which approximates market.
54
INVENTORIES
Inventories are valued at the lower of cost or market and include all costs directly associated with manufacturing products: materials, labor and manufacturing overhead. In the United States, costs of raw materials and finished pulp and paper products, are generally determined using the last-in, first-out method. Other inventories are valued using the first-in, first-out or average cost methods.
PLANTS, PROPERTIES AND EQUIPMENT
Plants, properties and equipment are stated at cost, less accumulated depreciation. Expenditures for betterments are capitalized, whereas normal repairs and maintenance are expensed as incurred. The units-of-production method of depreciation is used for major pulp and paper mills, and the straight-line method is used for other plants and equipment. Annual straight-line depreciation rates are, for buildings — 2.50% to 8.50%, and for machinery and equipment — 5% to 33%.
FORESTLANDS
At December 31, 2013, International Paper and its subsidiaries owned or managed approximately 332,000 acres of forestlands in Brazil, and through licenses and forest management agreements, had harvesting rights on government-owned forestlands in Russia. Costs attributable to timber are charged against income as trees are cut. The rate charged is determined annually based on the relationship of incurred costs to estimated current merchantable volume.
GOODWILL
Goodwill relating to a single business reporting unit is included as an asset of the applicable segment, while goodwill arising from major acquisitions that involve multiple business segments is classified as a corporate asset for segment reporting purposes. For goodwill impairment testing, this goodwill is allocated to reporting units. Annual testing for possible goodwill impairment is performed as of the beginning of the fourth quarter of each year, with additional interim testing performed when management believes that it is more likely than not events or circumstances have occurred that would result in the impairment of a reporting unit’s goodwill.
In performing this testing, the Company estimates the fair value of its reporting units using the projected future cash flows to be generated by each unit over the estimated remaining useful operating lives of the unit’s assets, discounted using the estimated cost of capital for each reporting unit. These estimated fair values are then analyzed for reasonableness by comparing them to historic market transactions for businesses in the industry, and by comparing the sum of the reporting unit
fair values and other corporate assets and liabilities divided by diluted common shares outstanding to the Company’s traded stock price on the testing date. For reporting units whose recorded value of net assets plus goodwill is in excess of their estimated fair values, the fair values of the individual assets and liabilities of the respective reporting units are then determined to calculate the amount of any goodwill impairment charge required. See Note 9 for further discussion.
IMPAIRMENT OF LONG-LIVED ASSETS
Long-lived assets are reviewed for impairment upon the occurrence of events or changes in circumstances that indicate that the carrying value of the assets may not be recoverable, measured by comparing their net book value to the undiscounted projected future cash flows generated by their use. Impaired assets are recorded at their estimated fair value. See Note 7 for further discussion.
INCOME TAXES
International Paper uses the asset and liability method of accounting for income taxes whereby deferred income taxes are recorded for the future tax consequences attributable to differences between the financial statement and tax bases of assets and liabilities. Deferred tax assets and liabilities are measured using enacted tax rates expected to apply to taxable income in the years in which those temporary differences are expected to be recovered or settled. Deferred tax assets and liabilities are remeasured to reflect new tax rates in the periods rate changes are enacted.
International Paper records its worldwide tax provision based on the respective tax rules and regulations for the jurisdictions in which it operates. Where the Company believes that a tax position is supportable for income tax purposes, the item is included in its income tax returns. Where treatment of a position is uncertain, liabilities are recorded based upon the Company’s evaluation of the “more likely than not” outcome considering the technical merits of the position based on specific tax regulations and the facts of each matter. Changes to recorded liabilities are made only when an identifiable event occurs that changes the likely outcome, such as settlement with the relevant tax authority, the expiration of statutes of limitation for the subject tax year, a change in tax laws, or a recent court case that addresses the matter.
While the judgments and estimates made by the Company are based on management’s evaluation of the technical merits of a matter, assisted as necessary by consultation with outside consultants, historical experience and other assumptions that management believes are appropriate and reasonable under current
55
circumstances, actual resolution of these matters may differ from recorded estimated amounts, resulting in charges or credits that could materially affect future financial statements.
STOCK-BASED COMPENSATION
Compensation costs resulting from all stock-based compensation transactions are measured and recorded in the consolidated financial statements based on the grant-date fair value of the equity or liability instruments issued. In addition, liability awards are remeasured each reporting period. Compensation cost is recognized over the period that an employee provides service in exchange for the award.
ENVIRONMENTAL REMEDIATION COSTS
Costs associated with environmental remediation obligations are accrued when such costs are probable and reasonably estimable. Such accruals are adjusted as further information develops or circumstances change. Costs of future expenditures for environmental remediation obligations are discounted to their present value when the amount and timing of expected cash payments are reliably determinable.
ASSET RETIREMENT OBLIGATIONS
A liability and an asset are recorded equal to the present value of the estimated costs associated with the retirement of long-lived assets where a legal or contractual obligation exists and the liability can be reasonably estimated. The liability is accreted over time and the asset is depreciated over the life of the related equipment or facility. International Paper’s asset retirement obligations principally relate to closure costs for landfills. Revisions to the liability could occur due to changes in the estimated costs or timing of closures, or possible new federal or state regulations affecting these closures.
In connection with potential future closures or redesigns of certain production facilities, it is possible that the Company may be required to take steps to remove certain materials from these facilities. Applicable regulations and standards provide that the removal of certain materials would only be required if the facility were to be demolished or underwent major renovations. At this time, any such obligations have an indeterminate settlement date, and the Company believes that adequate information does not exist to apply an expected-present-value technique to estimate any such potential obligations. Accordingly, the Company does not record a liability for such remediation until a decision is made that allows reasonable estimation of the timing of such remediation.
TRANSLATION OF FINANCIAL STATEMENTS
Balance sheets of international operations are translated into U.S. dollars at year-end exchange rates, while statements of operations are translated at average rates. Adjustments resulting from financial statement translations are included as cumulative translation adjustments in Accumulated other comprehensive loss.
Other than as described below, no new accounting pronouncement issued or effective during the fiscal year has had or is expected to have a material impact on the consolidated financial statements.
DISCLOSURES ABOUT OFFSETTING ASSETS AND LIABILITIES
In December 2011, the Financial Accounting Standards Board (FASB) issued ASU No. 2011-11, “Disclosures about Offsetting Assets and Liabilities”, which amends ASC 210, “Balance Sheet”. This ASU requires entities to disclose gross and net information about both instruments and transactions eligible for offset in the statement of financial position and those subject to an agreement similar to a master netting arrangement. This would include derivatives and other financial securities arrangements. This guidance was effective for fiscal years, and interim periods within those years, beginning on or after January 1, 2013. The application of the requirements of this guidance did not have a material effect on the Company's consolidated financial statements.
INTANGIBLES – GOODWILL AND OTHER
In July 2012, the FASB issued ASU 2012-02, "Testing Indefinite-Lived Intangible Assets for Impairment," which amends ASC 350, "Intangibles - Goodwill and Other." This ASU gives an entity the option to first assess qualitative factors if it is more likely than not that the fair value of indefinite-lived intangible assets are less than their carrying amount. If that assessment indicates no impairment, the quantitative impairment test is not required. This amendment was effective for annual and interim impairment tests performed for fiscal years beginning after September 15, 2012. The adoption of the provisions of this guidance did not have a material effect on the Company's consolidated financial statements.
COMPREHENSIVE INCOME
In February 2013, the FASB issued ASU 2013-02, "Reporting of Amounts Reclassified Out of Accumulated Other Comprehensive Income," which adds new disclosure requirements for items reclassified out of accumulated other comprehensive income. This guidance was effective for fiscal years, and interim
56
periods within those years, beginning after December 15, 2012. The Company adopted the provisions of this guidance in the first quarter of 2013.
HEDGE ACCOUNTING
In July 2013, the FASB issued ASU 2013-10, "Inclusion of the Fed Funds Effective Swap Rate (or Overnight Index Swap Rate) as a Benchmark Interest Rate for Hedge Accounting Purposes," which amends ASC 815, "Derivatives and Hedging," to allow entities to use the Fed Funds Effective Swap Rate, in addition to U.S. Treasury rates and LIBOR, as a benchmark interest rate in accounting for fair value and cash flow hedges in the United States. The ASU also eliminates the provision that prohibits the use of different benchmark rates for similar hedges except in rare and justifiable circumstances. The ASU was effective prospectively for qualifying new hedging relationships entered into on or after July 17, 2013 and for hedging relationships redesignated on or after that date. The adoption of the provisions of this guidance did not have a material effect on the Company's consolidated financial statements.
INCOME TAXES
In July 2013, the FASB also issued ASU 2013-11, "Presentation of an Unrecognized Tax Benefit When a Net Operating Loss Carryforward, a Similar Tax Loss, or a Tax Credit Carryforward Exists," which provides guidance on financial statement presentation of an unrecognized tax benefit when a net operating loss carryforward, a similar tax loss, or a tax credit carryforward exists. This guidance should be applied to all unrecognized tax benefits that exist as of the effective date which is fiscal years beginning after December 15, 2013, and interim periods within those years. The Company is currently evaluating the provisions of this guidance.
Basic earnings per share is computed by dividing earnings by the weighted average number of common shares outstanding. Diluted earnings per share is computed assuming that all potentially dilutive securities, including “in-the-money” stock options, were converted into common shares.
A reconciliation of the amounts included in the computation of basic earnings (loss) per share from continuing operations, and diluted earnings (loss) per share from continuing operations is as follows:
In millions, except per share amounts | 2013 | 2012 | 2011 | ||||||||
Earnings (loss) from continuing operations | $ | 1,350 | $ | 749 | $ | 1,273 | |||||
Effect of dilutive securities (a) | — | — | — | ||||||||
Earnings (loss) from continuing operations –assuming dilution | $ | 1,350 | $ | 749 | $ | 1,273 | |||||
Average common shares outstanding | 443.3 | 435.2 | 432.2 | ||||||||
Effect of dilutive securities (a): | |||||||||||
Restricted performance share plan | 4.5 | 5.0 | 4.8 | ||||||||
Stock options (b) | 0.3 | — | — | ||||||||
Average common shares outstanding – assuming dilution | 448.1 | 440.2 | 437.0 | ||||||||
Basic earnings (loss) per share from continuing operations | $ | 3.05 | $ | 1.72 | $ | 2.95 | |||||
Diluted earnings (loss) per share from continuing operations | $ | 3.01 | $ | 1.70 | $ | 2.92 | |||||
(a) | Securities are not included in the table in periods when antidilutive. |
(b) | Options to purchase 0.0 million, 9.1 million and 15.6 million shares for the years ended December 31,2013, 2012 and 2011, respectively, were not included in the computation of diluted common shares outstanding because their exercise price exceeded the average market price of the Company’s common stock for each respective reporting date. |
The following table presents changes in AOCI for the year ended December 31, 2013:
In millions | Defined Benefit Pension and Postretirement Items (a) | Change in Cumulative Foreign Currency Translation Adjustments (a) | Net Gains and Losses on Cash Flow Hedging Derivatives (a) | Total (a) | ||||||||
Balance as of January 1, 2013 | $ | (3,596 | ) | $ | (246 | ) | $ | 2 | $ | (3,840 | ) | |
Other comprehensive income (loss) before reclassifications | 1,184 | (443 | ) | — | 741 | |||||||
Amounts reclassified from accumulated other comprehensive income | 307 | 17 | (7 | ) | 317 | |||||||
Net Current Period Other Comprehensive Income | 1,491 | (426 | ) | (7 | ) | 1,058 | ||||||
Other Comprehensive Income (Loss) Attributable to Noncontrolling Interest | — | 23 | — | 23 | ||||||||
Balance as of December 31, 2013 | $ | (2,105 | ) | $ | (649 | ) | $ | (5 | ) | $ | (2,759 | ) |
(a) All amounts are net of tax. Amounts in parentheses indicate debits to AOCI.
57
The following table presents changes in AOCI for the year ended December 31, 2012:
In millions | Defined Benefit Pension and Postretirement Items (a) | Change in Cumulative Foreign Currency Translation Adjustments (a) | Net Gains and Losses on Cash Flow Hedging Derivatives (a) | Total (a) | ||||||||
Balance as of January 1, 2012 | $ | (2,852 | ) | $ | (118 | ) | $ | (35 | ) | $ | (3,005 | ) |
Other comprehensive income (loss) before reclassifications | (939 | ) | (96 | ) | 15 | (1,020 | ) | |||||
Amounts reclassified from accumulated other comprehensive income | 195 | (35 | ) | 22 | 182 | |||||||
Net Current Period Other Comprehensive Income | (744 | ) | (131 | ) | 37 | (838 | ) | |||||
Other Comprehensive Income (Loss) Attributable to Noncontrolling Interest | — | 3 | — | 3 | ||||||||
Balance as of December 31, 2012 | $ | (3,596 | ) | $ | (246 | ) | $ | 2 | $ | (3,840 | ) | |
(a) All amounts are net of tax. Amounts in parentheses indicate debits to AOCI.
The following table presents changes in AOCI for the year ended December 31, 2011:
In millions | Defined Benefit Pension and Postretirement Items (a) | Change in Cumulative Foreign Currency Translation Adjustments (a) | Net Gains and Losses on Cash Flow Hedging Derivatives (a) | Total (a) | ||||||||
Balance as of January 1, 2011 | $ | (2,203 | ) | $ | 378 | $ | — | $ | (1,825 | ) | ||
Other comprehensive income (loss) before reclassifications | (788 | ) | (492 | ) | (43 | ) | (1,323 | ) | ||||
Amounts reclassified from accumulated other comprehensive income | 139 | — | 8 | 147 | ||||||||
Net Current Period Other Comprehensive Income | (649 | ) | (492 | ) | (35 | ) | (1,176 | ) | ||||
Other Comprehensive Income (Loss) Attributable to Noncontrolling Interest | — | (4 | ) | — | (4 | ) | ||||||
Balance as of December 31, 2011 | $ | (2,852 | ) | $ | (118 | ) | $ | (35 | ) | $ | (3,005 | ) |
(a) All amounts are net of tax. Amounts in parentheses indicate debits to AOCI.
The following table presents details of the reclassifications out of AOCI for the three years ended:
Details About Accumulated Other Comprehensive Income Components | Amount Reclassified from Accumulated Other Comprehensive Income (a) | Location of Amount Reclassified from AOCI | |||||||||
2013 | 2012 | 2011 | |||||||||
In millions | |||||||||||
Defined benefit pension and postretirement items: | |||||||||||
Prior-service costs | $ | (9 | ) | $ | (2 | ) | $ | (6 | ) | (b) | Cost of products sold |
Actuarial gains/(losses) | (493 | ) | (317 | ) | (221 | ) | (b) | Cost of products sold | |||
Total pre-tax amount | (502 | ) | (319 | ) | (227 | ) | |||||
Tax (expense)/benefit | 195 | 124 | 88 | ||||||||
Net of tax | (307 | ) | (195 | ) | (139 | ) | |||||
Change in cumulative foreign currency translation adjustments: | |||||||||||
Business acquisition/divestiture | (17 | ) | 48 | — | Net (gains) losses on sales and impairments of businesses | ||||||
Tax (expense)/benefit | — | (13 | ) | — | |||||||
Net of tax | (17 | ) | 35 | — | |||||||
Net gains and losses on cash flow hedging derivatives: | |||||||||||
Foreign exchange contracts | 10 | (24 | ) | 10 | (c) | Cost of products sold | |||||
Fuel oil contracts | — | — | 6 | (c) | Cost of products sold | ||||||
Natural gas contracts | — | (11 | ) | (32 | ) | (c) | Cost of products sold | ||||
Total pre-tax amount | 10 | (35 | ) | (16 | ) | ||||||
Tax (expense)/benefit | (3 | ) | 13 | 8 | |||||||
Net of tax | 7 | (22 | ) | (8 | ) | ||||||
Total reclassifications for the period | $ | (317 | ) | $ | (182 | ) | $ | (147 | ) | ||
(a) Amounts in parentheses indicate debits to earnings/loss.
(b) These accumulated other comprehensive income components are included in the computation of net periodic pension cost (see Note 16 for additional details).
(c) This accumulated other comprehensive income component is included in our derivatives and hedging activities (see Note 14 for additional details).
58
2013: During 2013, total restructuring and other charges of $210 million before taxes ($131 million after taxes) were recorded. These charges included:
In millions | Before-Tax Charges | After-Tax Charges | ||||||
Early debt extinguishment costs (see Note 13) | $ | 25 | $ | 16 | ||||
xpedx restructuring (a) | 32 | 19 | ||||||
xpedx transaction costs | 22 | 14 | ||||||
Courtland mill shutdown (b) | 118 | 72 | ||||||
Box plant closures | (13 | ) | (8 | ) | ||||
Augusta paper machine shutdown (c) | 45 | 28 | ||||||
Insurance reimbursements | (30 | ) | (19 | ) | ||||
Other (d) | 11 | 9 | ||||||
Total | $ | 210 | $ | 131 | ||||
(a) Includes $17 million of severance charges.
(b) Includes $73 million of accelerated depreciation and other non-cash charges, $42 million of severance charges and $3 million of other charges which are recorded in the Printing Papers segment. During 2013, the Company accelerated depreciation for certain Courtland assets, and diligently evaluated certain other assets for possible alternative uses by one of our other businesses. The net book value of these assets at December 31, 2013 was approximately $470 million. During 2014, we have continued our evaluation and expect to conclude as to any uses for these assets during the first quarter of 2014.
(c) Includes $39 million of accelerated depreciation charges, $2 million of severance charges and $4 million of other charges which are recorded in the Consumer Packaging segment.
(d) Includes $2 million of severance charges.
Included in the $210 million of organization restructuring and other charges is $63 million of severance charges.
The following table presents a rollforward of the severance and other costs for approximately 1,686 employees included in the 2013 restructuring charges.
In millions | Severance and Other | |||
Additions and adjustments | $ | 63 | ||
Cash charges in 2013 | (21 | ) | ||
Balance, December 31, 2013 | $ | 42 | ||
As of December 31, 2013, 624 employees had left the Company under these programs.
2012: During 2012, total restructuring and other charges of $109 million before taxes ($74 million after taxes) were recorded. These charges included:
In millions | Before-Tax Charges | After-Tax Charges | ||||||
Early debt extinguishment costs (see Note 13) | $ | 48 | $ | 30 | ||||
xpedx restructuring (a) | 44 | 28 | ||||||
EMEA packaging restructuring (b) | 17 | 12 | ||||||
Other | — | 4 | ||||||
Total | $ | 109 | $ | 74 | ||||
(a) Includes $14 million of severance charges.
(b) Includes $17 million of severance charges.
Included in the $109 million of organizational restructuring and other charges is $31 million of severance charges.
The following table presents a rollforward of the severance and other costs for approximately 811 employees included in the 2012 restructuring charges:
In millions | Severance and Other | |||
Additions and adjustments | $ | 31 | ||
Cash charges in 2012 | (15 | ) | ||
Cash charges in 2013 | (6 | ) | ||
Balance, December 31, 2013 | $ | 10 | ||
As of December 31, 2013, 680 employees had left the Company under these programs.
2011: During 2011, total restructuring and other charges of $102 million before taxes ($66 million after taxes) were recorded. These charges included:
In millions | Before-Tax Charges | After-Tax Charges | ||||||
xpedx restructuring (a) | $ | 49 | $ | 34 | ||||
Early debt extinguishment costs (see Note 13) | 32 | 19 | ||||||
Temple-Inland merger agreement | 20 | 12 | ||||||
APPM acquisition | 18 | 12 | ||||||
Franklin, Virginia mill – closure costs (b) | (24 | ) | (15 | ) | ||||
Other | 7 | 4 | ||||||
Total | $ | 102 | $ | 66 | ||||
(a) | Includes $19 million of severance charges. |
(b) | Includes a $21 million credit related to the reversal of an environmental reserve. |
Included in the $102 million of organizational restructuring and other charges is $25 million of severance charges.
59
The following table presents a rollforward of the severance and other costs for approximately 629 employees included in the 2011 restructuring charges. As of December 31, 2013, all of these employees had left the Company under these programs.
In millions | Severance and Other | |||
Additions and adjustments | $ | 25 | ||
Cash charges in 2011 | (16 | ) | ||
Cash charges in 2012 | (8 | ) | ||
Cash charges in 2013 | (1 | ) | ||
Balance, December 31, 2013 | $ | — | ||
ALTERNATIVE FUEL MIXTURE TAX CREDIT
On July 19, 2011 the Company filed an amended 2009 tax return claiming alternative fuel mixture tax credits as non-taxable income. The amended position has been accepted by the Internal Revenue Service (IRS) in the closing of the IRS tax audit for the years 2006 - 2009. As a result, during 2013, the Company recognized an income tax benefit of $753 million related to the non-taxability of the alternative fuel mixture tax credits.
During 2009, the Company produced 64 million gallons of black liquor that were not eligible for the alternative fuel mixture credit. The Company claimed these gallons for the cellulosic bio-fuel credit by amending the Company’s 2009 tax return. The impact of this amendment was included in the Company’s 2010 fourth quarter Income tax provision (benefit), resulting in a $40 million net credit to tax expense. Temple-Inland, Inc. also recognized an income tax benefit of $83 million in 2010 related to cellulosic bio-fuel credits.
2013: On January 3, 2013, International Paper completed the acquisition (effective date of acquisition on January 1, 2013) of the shares of its joint venture partner, Sabanci Holding, in the Turkish corrugated packaging company, Olmuksa International Paper Sabanci Ambalaj Sanayi ve Ticaret A.S. (now called Olmuksan International Paper or Olmuksan), for a purchase price of $56 million. The acquired shares represent 43.7% of Olmuksan's shares. Prior to this acquisition, International Paper held a 43.7% equity interest in Olmuksan.
Because the transaction resulted in International Paper becoming the majority shareholder, owning 87.4% of Olmuksan's outstanding and issued shares its completion triggered a mandatory call for tender of the remaining public shares which began in March 2013 and ended in April 2013, with no shares tendered. As a result, the 12.6% owned by other parties are considered non-controlling interests. Olmuksan's
financial results have been consolidated with the Company's Industrial Packaging segment beginning January 1, 2013, the effective date which International Paper obtained majority control of the entity.
Following the transaction, the Company's previously held 43.7% equity interest in Olmuksan was remeasured to a fair value of $75 million, resulting in a gain of $9 million. The fair value was estimated by applying the discounted cash flow approach, using a 13% discount rate, long-term sustainable growth rates ranging from 6% to 9% and a corporate tax rate of 20%. In addition, the cumulative translation adjustment balance of $17 million relating to the previously held equity interest was reclassified, as expense, from accumulated other comprehensive income.
The final purchase price allocation indicates that the sum of the cash consideration paid, the fair value of the noncontrolling interest and the fair value of the previously held interest is less than the fair value of the underlying assets by $21 million, resulting in a bargain purchase price gain being recorded on this transaction. The aforementioned remeasurement of equity interest gain, the cumulative translation adjustment to expense, and the bargain purchase gain are included in the Net bargain purchase gain on acquisition of business in the accompanying consolidated statement of operations.
The following table summarizes the final allocation of the purchase price to the fair value of assets and liabilities acquired as of January 1, 2013, which was completed in the fourth quarter of 2013.
In millions | ||||
Cash and temporary investments | $ | 5 | ||
Accounts and notes receivable | 72 | |||
Inventory | 31 | |||
Other current assets | 2 | |||
Plants, properties and equipment | 106 | |||
Investments | 11 | |||
Total assets acquired | 227 | |||
Notes payable and current maturities of long-term debt | 17 | |||
Accounts payable and accrued liabilities | 27 | |||
Deferred income tax liability | 4 | |||
Postretirement and postemployment benefit obligation | 6 | |||
Total liabilities assumed | 54 | |||
Noncontrolling interest | 18 | |||
Net assets acquired | $ | 155 | ||
Pro forma information related to the acquisition of Olmuksan has not been included as it does not have a material effect on the Company's consolidated results of operations.
60
2012: On February 13, 2012, International Paper completed the acquisition of Temple-Inland, Inc. (Temple-Inland). International Paper acquired all of the outstanding common stock of Temple-Inland for $32.00 per share in cash, totaling approximately $3.7 billion, and assumed approximately $700 million of Temple-Inland’s debt. As a condition to allowing the transaction to proceed, the Company entered into an agreement on a Final Judgment with the Antitrust Division of the U.S. Department of Justice (DOJ) that required the Company to divest three containerboard mills, with approximately 970,000 tons of aggregate containerboard capacity. On July 2, 2012, International Paper sold its Ontario and Oxnard (Hueneme), California containerboard mills to New-Indy Containerboard LLC, and its New Johnsonville, Tennessee containerboard mill to Hood Container Corporation. By completing these transactions, the Company satisfied its divestiture obligations under the Final Judgment. See Note 7 for further details of these divestitures.
Temple-Inland's results of operations are included in the consolidated financial statements from the date of acquisition on February 13, 2012.
The following table summarizes the allocation of the purchase price to the fair value of assets and liabilities acquired as of February 13, 2012, which was finalized in the fourth quarter of 2012.
In millions | ||||
Accounts and notes receivable | $ | 466 | ||
Inventory | 484 | |||
Deferred income tax assets – current | 140 | |||
Other current assets | 57 | |||
Plants, properties and equipment | 2,911 | |||
Financial assets of special purpose entities | 2,091 | |||
Goodwill | 2,139 | |||
Other intangible assets | 693 | |||
Deferred charges and other assets | 54 | |||
Total assets acquired | 9,035 | |||
Notes payable and current maturities of long-term debt | 130 | |||
Accounts payable and accrued liabilities | 704 | |||
Long-term debt | 527 | |||
Nonrecourse financial liabilities of special purpose entities | 2,030 | |||
Deferred income tax liability | 1,252 | |||
Pension benefit obligation | 338 | |||
Postretirement and postemployment benefit obligation | 99 | |||
Other liabilities | 221 | |||
Total liabilities assumed | 5,301 | |||
Net assets acquired | $ | 3,734 | ||
The identifiable intangible assets acquired in connection with the Temple-Inland acquisition included the following:
In millions | Estimated Fair Value | Average Remaining Useful Life | |||
Asset Class: | (at acquisition date) | ||||
Customer relationships | $ | 536 | 12-17 years | ||
Developed technology | 8 | 5-10 years | |||
Tradenames | 109 | Indefinite | |||
Favorable contracts | 14 | 4-7 years | |||
Non-compete agreement | 26 | 2 years | |||
Total | $ | 693 | |||
In connection with the purchase price allocation, inventories were written up by approximately $20 million before taxes ($12 million after taxes) to their estimated fair value. As the related inventories were sold in the 2012 first quarter, this amount was expensed in Cost of products sold for the quarter.
Additionally, Selling and administrative expenses for the years ended December 31, 2013 and 2012 included $62 million before taxes ($38 million after taxes) and $164 million before taxes ($105 million after taxes), respectively, in charges for integration costs associated with the acquisition.
The following unaudited pro forma information for the year ended December 31, 2012 represents the results of operations of International Paper as if the Temple-Inland acquisition had occurred on January 1, 2012. This information is based on historical results of operations, adjusted for certain acquisition accounting adjustments and does not purport to represent International Paper’s actual results of operations as if the transaction described above would have occurred as of January 1, 2012, nor is it necessarily indicative of future results.
In millions, except per share amounts | 2012 | ||
Net sales | $ | 28,125 | |
Earnings (loss) from continuing operations (a) | 805 | ||
Net earnings (loss) (a) | 845 | ||
Diluted earnings (loss) from continuing operations per share (a) | 1.82 | ||
Diluted net earnings (loss) per share (a) | 1.92 | ||
(a) Attributable to International Paper Company common shareholders.
2011: On October 14, 2011, International Paper completed the acquisition of a 75% stake in Andhra Pradesh Paper Mills Limited (APPM). The Company purchased 53.5% of APPM for a purchase price of $226 million in cash plus assumed debt from private investors. These sellers also entered into a covenant
61
not to compete for which they received a cash payment of $58 million. Additionally, the Company purchased a 21.5% stake of APPM in a public tender offer completed on October 8, 2011 for $105 million in cash. International Paper recognized an unfavorable currency transaction loss of $9 million due to strengthening of the dollar against the Indian Rupee prior to the closing date, resulting from cash balances deposited in Indian Rupee denominated escrow accounts.
In November 2011, International Paper appealed a directive from the Securities and Exchange Board of India (SEBI) that would require us to pay to the tendering shareholders the equivalent per share value of the non-compete payment that was paid to the previous controlling shareholders. The Company has deposited approximately $25 million into an escrow account to fund the additional non-compete payments in the event SEBI’s direction is upheld. By an order dated September 12, 2012, the Indian Securities Appellate Tribunal (SAT) upheld the SEBI directive. As a result of this initial unfavorable ruling, International Paper included the $25 million escrowed cash amount in the final purchase price consideration of APPM. On October 8, 2012, International Paper appealed the SAT's decision to the Indian Supreme Court.
APPM's results of operations are included in the consolidated financial statements from the date of acquisition on October 14, 2011.
The following table summarizes the final allocation of the purchase price to the fair value of assets and liabilities acquired as of October 14, 2011.
In millions | ||||
Cash and temporary investments | $ | 3 | ||
Accounts and notes receivable | 7 | |||
Inventory | 43 | |||
Other current assets | 13 | |||
Plants, properties and equipment | 352 | |||
Goodwill | 138 | |||
Deferred income tax asset | 4 | |||
Other intangible assets | 91 | |||
Other long-term assets | 1 | |||
Total assets acquired | 652 | |||
Accounts payable and accrued liabilities | 67 | |||
Long-term debt | 47 | |||
Other liabilities | 11 | |||
Deferred income tax liability | 90 | |||
Total liabilities assumed | 215 | |||
Noncontrolling interest | 37 | |||
Net assets acquired | $ | 400 | ||
The identifiable intangible assets acquired in connection with the APPM acquisition included the following:
In millions | Estimated Fair Value | Average Remaining Useful Life | |||
Asset Class: | (at acquisition date) | ||||
Non-compete agreement | $ | 58 | 6 years | ||
Tradenames | 20 | Indefinite | |||
Fuel supply agreements | 5 | 2 years | |||
Power purchase arrangements | 5 | 5 years | |||
Wholesale distribution network | 3 | 18 years | |||
Total | $ | 91 | |||
Pro forma information related to the acquisition of APPM has not been included as it does not have a material effect on the Company’s consolidated results of operations.
JOINT VENTURES
2013: On January 14, 2013, International Paper and Brazilian corrugated packaging producer, Jari Celulose Papel e Embalagens S.A (Jari), a Grupo Orsa company, formed Orsa International Paper Embalagens S.A. (Orsa IP). The new entity, in which International Paper holds a 75% stake, includes three containerboard mills and four box plants, which make up Jari's former industrial packaging assets. This acquisition supports the Company's strategy of growing its global packaging presence and better serving its global customer base.
The value of International Paper's investment in Orsa IP is approximately $471 million. Because International Paper acquired a majority control of the joint venture, Orsa IP's financial results have been consolidated with our Industrial Packaging segment from the date of formation on January 14, 2013. The 25% owned by Jari is considered noncontrolling interest.
International Paper follows the guidance issued by the FASB regarding the classification and measurement of redeemable securities. The Share Purchase Agreement related to Orsa IP joint venture contained both a put and a call option that would allow Jari, at the third anniversary of the joint venture formation, to put its remaining shares to IP or allow IP, at the sixth anniversary of the joint venture formation, to call the remaining noncontrolling shares from Jari. Accordingly, the noncontrolling common stock held by Jari would be considered a redeemable noncontrolling interest and meet the requirements to be classified outside of permanent equity and is therefore classified as redeemable noncontrolling interest in the accompanying consolidated balance sheets. The value of redeemable noncontrolling interest is reported at the greater of the redemption value or historical cost at the end of each reporting period. As of December 31, 2013,
62
the Company reported the redeemable noncontrolling interest at the redemption value of $163 million.
The following table summarizes the final allocation of the purchase price to the fair value of assets and liabilities acquired as of January 14, 2013, which was completed in the fourth quarter of 2013.
In millions | ||||
Cash and temporary investments | $ | 16 | ||
Accounts and notes receivable | 5 | |||
Inventory | 27 | |||
Plants, properties and equipment | 290 | |||
Goodwill | 260 | |||
Other intangible assets | 110 | |||
Other long-term assets | 2 | |||
Total assets acquired | 710 | |||
Accounts payable and accrued liabilities | 68 | |||
Deferred income tax liability | 37 | |||
Total liabilities assumed | 105 | |||
Noncontrolling interest | 134 | |||
Net assets acquired | $ | 471 | ||
The identifiable intangible assets acquired in connection with the Orsa IP acquisition included the following:
In millions | Estimated Fair Value | Average Remaining Useful Life | |||
Asset Class: | (at acquisition date) | ||||
Customer relationships | $ | 88 | 12 years | ||
Trademark | 3 | 6 years | |||
Wood supply agreement | 19 | 25 years | |||
Total | $ | 110 | |||
Pro forma information related to the acquisition of Orsa IP has not been included as it does not have a material effect on the Company's consolidated results of operations.
Due to the complex organizational structure of Orsa IP's operations, and the extended time required to prepare consolidated financial information in accordance with accounting principles generally accepted in the United States, the Company reports its share of Orsa IP's operating results on a one-month lag basis.
2011: On April 15, 2011, International Paper and Sun Paper Industry Co. Ltd. entered into a Cooperative Joint Venture agreement to establish Shandong IP & Sun Food Packaging Co., Ltd. in China. During December 2011, the business license was obtained and International Paper contributed $55 million in cash for a 55% interest in the joint venture and Sun Paper Industry Co. Ltd. contributed land-use rights valued at approximately $28 million, representing a 45% interest.
The purpose of the joint venture is to build and operate a new production line to manufacture coated paperboard for food packaging with a designed annual production capacity of 500,000 tons. The financial position and results of operations of this joint venture have been included in International Paper’s consolidated financial statements from the date of formation in December 2011.
Additionally, during 2011 the Company recorded a gain of $7 million (before and after taxes) related to a bargain purchase price adjustment on an acquisition by our joint venture in Turkey. This gain is included in Equity earnings (losses), net of taxes in the accompanying consolidated statement of operations.
DISCONTINUED OPERATIONS
2013: On April 1, 2013, the Company finalized the sale of Temple-Inland's 50% interest in Del-Tin Fiber L.L.C. (Del-Tin) to joint venture partner Deltic Timber Corporation (Deltic) for $20 million in assumed liabilities and cash.
On July 19, 2013 the Company finalized the sale of its Temple-Inland Building Products division, which ultimately included 15 manufacturing facilities, to Georgia-Pacific Building Products, LLC for approximately $733 million in cash and amounts to be received for preliminary customary closing adjustments.
2012: Upon the acquisition of Temple-Inland, management committed to a plan to sell the Temple-Inland Building Products business, and on December 12, 2012, International Paper reached an agreement to sell the business (including Del-Tin Fiber L.L.C. (Del-Tin)) to Georgia-Pacific for $750 million in cash, subject to satisfaction of customary closing conditions, including satisfactory review by the DOJ, and to certain pre-and post-closing purchase price adjustments. The assets to be sold were to include 16 manufacturing facilities.
The operating results of the Temple-Inland Building Products business have been included in Discontinued operations from the date of acquisition. The assets of this business, totaling $759 million at December 31, 2012, are included in Assets of businesses held for sale in current assets in the accompanying consolidated balance sheet at December 31, 2012. Included in this amount are $26 million and $153 million related to goodwill and intangibles, respectively. The liabilities of this business, totaling $44 million at December 31, 2012, are included in Liabilities of businesses held for
63
sale in the accompanying consolidated balance sheet at December 31, 2012.
2011: The sale of the Company’s Kraft Papers business that closed in January 2007 contained an earnout provision that could have required KapStone to make an additional payment to International Paper in 2012. Based on the results through the first four years of the earnout period, KapStone concluded that the threshold would be attained and the full earnout payment would be due to International Paper in 2012. On January 3, 2011, International Paper signed an agreement with KapStone to allow KapStone to pay the Company on January 4, 2011, the discounted amount of $50 million before taxes ($30 million after taxes) that otherwise would have been owed in full under the agreement in 2012. This amount has been included in Discontinued operations, net of taxes in the accompanying consolidated statement of operations.
In the third quarter of 2006, the Company completed the sale of its Brazilian Coated Papers business and restated its financial statements to reflect this business as a discontinued operation. Included in the results for this business in 2005 and 2006 were local country tax contingency reserves for which the related statute of limitations has now expired. A $15 million tax benefit for the reversal of these reserves plus associated interest income of $6 million before taxes ($4 million after taxes) was recorded in March 2011, and is included in Discontinued operations, net of taxes in the accompanying consolidated statement of operations.
OTHER DIVESTITURES AND IMPAIRMENTS
2013: During 2013, the Company recorded net pre-tax charges of $3 million ($1 million after taxes) for adjustments related to the divestiture of three containerboard mills in 2012 and the sale of the Shorewood business. This loss is included in Net (gains) losses on sales and impairments of businesses in the accompanying consolidated statement of operations.
2012: As referenced in Note 6, on July 2, 2012, International Paper finalized the sales of its Ontario and Oxnard (Hueneme), California containerboard mills to New-Indy Containerboard LLC, and its New Johnsonville, Tennessee containerboard mill to Hood Container Corporation. During 2012, the Company recorded pre-tax charges of $29 million ($55 million after taxes) for costs associated with the divestitures of these mills. Also during 2012, in anticipation of the divestiture of the Hueneme mill, a pre-tax charge of $62 million ($38 million after taxes) was recorded to adjust the long-lived assets of the mill to their fair value.
The net 2012 loss totaling $86 million related to other divestitures and impairments is included in Net (gains)
losses on sales and impairments of businesses in the accompanying consolidated statement of operations.
2011: On August 22, 2011, International Paper announced that it had signed an agreement to sell its Shorewood business to Atlas Holdings. As a result, during 2011, net pre-tax charges of $207 million (after a $246 million tax benefit and a gain of $8 million related to a noncontrolling interest, a net gain of $47 million) were recorded to reduce the carrying value of the Shorewood business to fair market value. As part of the transaction, International Paper retained a minority interest of approximately 40% in the newly combined AGI-Shorewood business outside the U.S. Since the interest retained represents significant continuing involvement in the operations of the business, the operating results of the Shorewood business were included in continuing operations in the accompanying consolidated statement of operations instead of Discontinued operations. The sale of the U.S. portion of the Shorewood business to Atlas Holdings closed on December 31, 2011. The sale of the remainder of the Shorewood business occurred during January 2012.
Also during 2011, the Company recorded charges totaling $11 million (before and after taxes) to further write down the long-lived assets of its Inverurie, Scotland mill to their estimated fair value.
The net 2011 loss totaling $218 million related to other divestitures and impairments is included in Net (gains) losses on sales and impairments of businesses in the accompanying consolidated statement of operations.
TEMPORARY INVESTMENTS
In millions at December 31 | 2013 | 2012 | ||||
Temporary Investments | $ | 1,398 | $ | 934 | ||
ACCOUNTS AND NOTES RECEIVABLE
Accounts and notes receivable, net of allowances, by classification were:
In millions at December 31 | 2013 | 2012 | ||||
Accounts and notes receivable: | ||||||
Trade | $ | 3,497 | $ | 3,316 | ||
Other | 259 | 246 | ||||
Total | $ | 3,756 | $ | 3,562 | ||
64
INVENTORIES
In millions at December 31 | 2013 | 2012 | ||||
Raw materials | $ | 372 | $ | 360 | ||
Finished pulp, paper and packaging products | 1,834 | 1,728 | ||||
Operating supplies | 572 | 588 | ||||
Other | 47 | 54 | ||||
Inventories | $ | 2,825 | $ | 2,730 | ||
The last-in, first-out inventory method is used to value most of International Paper’s U.S. inventories. Approximately 75% of total raw materials and finished products inventories were valued using this method. If the first-in, first-out method had been used, it would have increased total inventory balances by approximately $417 million and $381 million at December 31, 2013 and 2012, respectively.
PLANTS, PROPERTIES AND EQUIPMENT
In millions at December 31 | 2013 | 2012 | ||||
Pulp, paper and packaging facilities | ||||||
Mills | $ | 22,105 | $ | 23,625 | ||
Packaging plants | 10,163 | 7,184 | ||||
Other plants, properties and equipment | 1,478 | 2,074 | ||||
Gross cost | 33,746 | 32,883 | ||||
Less: Accumulated depreciation | 20,074 | 18,934 | ||||
Plants, properties and equipment, net | $ | 13,672 | $ | 13,949 | ||
In millions | 2013 | 2012 | 2011 | ||||||
Depreciation expense | $ | 1,423 | $ | 1,399 | $ | 1,263 | |||
INTEREST
Cash payments related to interest were as follows:
In millions | 2013 | 2012 | 2011 | ||||||
Interest payments | $ | 751 | $ | 740 | $ | 629 | |||
Amounts related to interest were as follows:
In millions | 2013 | 2012 | 2011 | ||||||
Interest expense (a) | $ | 669 | $ | 743 | $ | 596 | |||
Interest income (a) | 57 | 71 | 55 | ||||||
Capitalized interest costs | 17 | 37 | 22 | ||||||
(a) | Interest expense and interest income exclude approximately $45 million, $49 million and $49 million in 2013, 2012 and 2011, respectively, related to investments in and borrowings from variable interest entities for which the Company has a legal right of offset (see Note 12). |
GOODWILL
The following tables present changes in the goodwill balances as allocated to each business segment for the years ended December 31, 2013 and 2012:
In millions | Industrial Packaging | Printing Papers | Consumer Packaging | Distribution | Total | ||||||||||||||
Balance as of January 1, 2013 | |||||||||||||||||||
Goodwill | $ | 3,165 | $ | 2,396 | $ | 1,783 | $ | 400 | $ | 7,744 | |||||||||
Accumulated impairment losses (a) | — | (1,765 | ) | (1,664 | ) | — | (3,429 | ) | |||||||||||
3,165 | 631 | 119 | 400 | 4,315 | |||||||||||||||
Reclassifications and other (b) | (28 | ) | (63 | ) | 3 | — | (88 | ) | |||||||||||
Additions/reductions | 293 | (c) | (22 | ) | (d) | 1 | — | 272 | |||||||||||
Impairment loss | — | (112 | ) | (e) | — | (400 | ) | (e) | (512 | ) | |||||||||
Balance as of December 31, 2013 | |||||||||||||||||||
Goodwill | 3,430 | 2,311 | 1,787 | 400 | 7,928 | ||||||||||||||
Accumulated impairment losses (a) | — | (1,877 | ) | (1,664 | ) | (400 | ) | (3,941 | ) | ||||||||||
Total | $ | 3,430 | $ | 434 | $ | 123 | $ | — | $ | 3,987 | |||||||||
(a) | Represents accumulated goodwill impairment charges since the adoption of ASC 350, “Intangibles – Goodwill and Other” in 2002. |
(b) | Represents the effects of foreign currency translations and reclassifications. |
(c) | Reflects $260 million for Orsa IP, the newly formed joint venture in Brazil and the adjustment of $54 million ($33 million after-tax) previously included as a trade name intangible asset in Deferred Charges and Other Assets on the balance sheet. |
(d) | Reflects a reduction from tax benefits generated by the deduction of goodwill amortization for tax purposes in Brazil. |
(e) | Represents the impairment of goodwill for the India Papers business and xpedx. |
In millions | Industrial Packaging | Printing Papers | Consumer Packaging | Distribution | Total | |||||||||||||
Balance as of January 1, 2012 | ||||||||||||||||||
Goodwill | $ | 1,157 | $ | 2,439 | $ | 1,779 | $ | 400 | $ | 5,775 | ||||||||
Accumulated impairment losses (a) | — | (1,765 | ) | (1,664 | ) | — | (3,429 | ) | ||||||||||
1,157 | 674 | 115 | 400 | 2,346 | ||||||||||||||
Reclassifications and other (b) | 1 | (40 | ) | 1 | — | (38 | ) | |||||||||||
Additions/reductions | 2,007 | (c) | (3 | ) | (d) | 3 | (e) | — | 2,007 | |||||||||
Balance as of December 31, 2012 | ||||||||||||||||||
Goodwill | 3,165 | 2,396 | 1,783 | 400 | 7,744 | |||||||||||||
Accumulated impairment losses (a) | — | (1,765 | ) | (1,664 | ) | — | (3,429 | ) | ||||||||||
Total | $ | 3,165 | $ | 631 | $ | 119 | $ | 400 | $ | 4,315 | ||||||||
(a) | Represents accumulated goodwill impairment charges since the adoption of ASC 350, “Intangibles – Goodwill and Other” in 2002. |
(b) | Represents the effects of foreign currency translations and reclassifications. |
(c) | Reflects the acquisition of Temple-Inland, net of amounts written off related to the divestiture of two Temple-Inland mills (Ontario, California and New Johnsonville, Tennessee) and one International Paper mill (Oxnard, (Hueneme), California). Also excludes the goodwill for Building Products which was reclassified to Businesses Held for Sale. |
(d) | Reflects an increase related to a purchase price adjustment of Andhra Pradesh Paper Mills in India partially offset by a reduction from tax benefits generated by the deduction of goodwill amortization for tax purposes in Brazil. |
(e) | Represents the impact of the change in estimate of the contributed land in the Shandong IP & Sun Food Packaging Co., Ltd. joint venture in China entered into in 2011. |
In the fourth quarter of 2013, in conjunction with the annual testing of its reporting units for possible goodwill impairments, the Company calculated the estimated fair value of its India Papers business using the discounted
65
future cash flows and determined that all of the goodwill of this business, totaling $112 million, should be written off. The decline in the fair value of the India Papers reporting unit and resulting impairment charge was due to a change in the strategic outlook for the India Papers operations.
Also in the fourth quarter of 2013, the Company calculated the estimated fair value of its xpedx business using the discounted future cash flows and wrote off all of the goodwill of its xpedx business, totaling $400 million. The decline in fair value of the xpedx reporting unit and resulting impairment charge was due to a significant decline in earnings and a change in the strategic outlook for the xpedx operations.
As a result, during the fourth quarter of 2013, the Company recorded a total goodwill impairment charge of $512 million, representing all of the recorded goodwill of the xpedx business and the India Papers business.
No goodwill impairment charges were recorded in 2012 or 2011.
OTHER INTANGIBLES
Identifiable intangible assets comprised the following:
2013 | 2012 | ||||||||||||
In millions at December 31 | Gross Carrying Amount | Accumulated Amortization | Gross Carrying Amount | Accumulated Amortization | |||||||||
Customer relationships and lists | $ | 602 | $ | 139 | $ | 644 | $ | 112 | |||||
Non-compete agreements | 76 | 46 | 83 | 30 | |||||||||
Tradenames, patents and trademarks | 67 | (a) | 33 | 144 | 16 | ||||||||
Land and water rights | 76 | 5 | 87 | 6 | |||||||||
Fuel and power agreements | 7 | 2 | 17 | 12 | |||||||||
Software | 17 | 15 | 22 | 19 | |||||||||
Other | 75 | 32 | 83 | 19 | |||||||||
Total | $ | 920 | $ | 272 | $ | 1,080 | $ | 214 | |||||
(a) | Includes $15 million recorded to write-off a tradename intangible asset of the Company's India Papers business. This amount is included in Impairment of goodwill and other intangibles in the accompanying consolidated statement of operations. |
The Company recognized the following amounts as amortization expense related to intangible assets:
In millions | 2013 | 2012 | 2011 | ||||||
Amortization expense related to intangible assets | $ | 87 | $ | 58 | $ | 32 | |||
Based on current intangibles subject to amortization, estimated amortization expense for each of the succeeding years is as follows: 2014 – $60 million, 2015 – $59 million, 2016 – $58 million, 2017 – $56 million, 2018 – $50 million, and cumulatively thereafter – $365 million.
The components of International Paper’s earnings from continuing operations before income taxes and equity earnings by taxing jurisdiction were as follows:
In millions | 2013 | 2012 | 2011 | ||||||
Earnings (loss) | |||||||||
U.S. | $ | 394 | $ | 478 | $ | 874 | |||
Non-U.S. | 455 | 546 | 584 | ||||||
Earnings (loss) from continuing operations before income taxes and equity earnings | $ | 849 | $ | 1,024 | $ | 1,458 | |||
The provision (benefit) for income taxes (excluding noncontrolling interests) by taxing jurisdiction was as follows:
In millions | 2013 | 2012 | 2011 | ||||||
Current tax provision (benefit) | |||||||||
U.S. federal | $ | (697 | ) | $ | 14 | $ | (78 | ) | |
U.S. state and local | (95 | ) | 11 | (19 | ) | ||||
Non-U.S. | 123 | 102 | 91 | ||||||
$ | (669 | ) | $ | 127 | $ | (6 | ) | ||
Deferred tax provision (benefit) | |||||||||
U.S. federal | $ | 186 | $ | 226 | $ | 207 | |||
U.S. state and local | (21 | ) | 6 | 46 | |||||
Non-U.S. | (19 | ) | (28 | ) | 64 | ||||
$ | 146 | $ | 204 | $ | 317 | ||||
Income tax provision | $ | (523 | ) | $ | 331 | $ | 311 | ||
The Company’s deferred income tax provision (benefit) includes a $7 million provision, a $25 million provision and a $8 million benefit for 2013, 2012 and 2011, respectively, for the effect of changes in non-U.S. and U.S. state tax rates.
International Paper made income tax payments, net of refunds, of $291 million, $95 million and $44 million in 2013, 2012 and 2011, respectively.
66
A reconciliation of income tax expense using the statutory U.S. income tax rate compared with the actual income tax provision follows:
In millions | 2013 | 2012 | 2011 | ||||||
Earnings (loss) from continuing operations before income taxes and equity earnings | $ | 849 | $ | 1,024 | $ | 1,458 | |||
Statutory U.S. income tax rate | 35 | % | 35 | % | 35 | % | |||
Tax expense (benefit) using statutory U.S. income tax rate | 297 | 358 | 510 | ||||||
State and local income taxes | (4 | ) | 11 | 16 | |||||
Tax rate and permanent differences on non-U.S. earnings | (90 | ) | (116 | ) | (34 | ) | |||
Net U.S. tax on non-U.S. dividends | (15 | ) | 48 | 23 | |||||
Tax benefit on manufacturing activities | (27 | ) | (15 | ) | (8 | ) | |||
Non-deductible business expenses | 4 | 7 | 6 | ||||||
Non-deductible goodwill | 147 | 34 | — | ||||||
Tax Audits | (770 | ) | — | — | |||||
Sales of non-strategic businesses | — | — | (195 | ) | |||||
Retirement plan dividends | (5 | ) | (5 | ) | (5 | ) | |||
Tax basis adjustments | (33 | ) | — | — | |||||
Tax credits | (23 | ) | — | (7 | ) | ||||
Medicare subsidy | — | 5 | — | ||||||
Other, net | (4 | ) | 4 | 5 | |||||
Income tax provision | $ | (523 | ) | $ | 331 | $ | 311 | ||
Effective income tax rate | (62 | )% | 32 | % | 21 | % | |||
The tax effects of significant temporary differences, representing deferred income tax assets and liabilities at December 31, 2013 and 2012, were as follows:
In millions | 2013 | 2012 | ||||
Deferred income tax assets: | ||||||
Postretirement benefit accruals | $ | 193 | $ | 229 | ||
Pension obligations | 725 | 1,620 | ||||
Alternative minimum and other tax credits | 515 | 752 | ||||
Net operating loss carryforwards | 610 | 579 | ||||
Compensation reserves | 281 | 242 | ||||
Other | 284 | 406 | ||||
Gross deferred income tax assets | 2,608 | 3,828 | ||||
Less: valuation allowance | (413 | ) | (400 | ) | ||
Net deferred income tax asset | $ | 2,195 | $ | 3,428 | ||
Deferred income tax liabilities: | ||||||
Intangibles | $ | (304 | ) | $ | (378 | ) |
Plants, properties and equipment | (2,919 | ) | (3,126 | ) | ||
Forestlands and related installment sales | (2,307 | ) | (2,511 | ) | ||
Gross deferred income tax liabilities | $ | (5,530 | ) | $ | (6,015 | ) |
Net deferred income tax liability | $ | (3,335 | ) | $ | (2,587 | ) |
Deferred income tax assets and liabilities are recorded in the accompanying consolidated balance sheet under the captions Deferred income tax assets, Deferred charges and other assets, Other accrued liabilities, and Deferred income taxes. The acquisition of Temple-Inland in 2012 resulted in additional deferred tax assets of $600 million and deferred income tax liabilities of $1.8 billion. In addition, there is a decrease in deferred income tax assets principally relating to the tax impact of changes in qualified pension liabilities. Deferred tax liabilities decreased primarily due to the recognition of an installment sale and book depreciation in excess of tax depreciation. Certain tax attributes reflected on our tax returns as filed differ significantly from those reflected in the deferred income tax accounts due to uncertain tax benefits.
The valuation allowance for deferred income tax assets as of December 31, 2013 was $413 million. The net change in the total valuation allowance for the year ended December 31, 2013 was an increase of $13 million. The increase is primarily attributable to non-U.S. net operating losses that the Company currently does not foresee utilizing within the statutory carryforward period.
A reconciliation of the beginning and ending amount of unrecognized tax benefits for the years ended December 31, 2013, 2012 and 2011 is as follows:
In millions | 2013 | 2012 | 2011 | ||||||
Balance at January 1 | $ | (972 | ) | $ | (857 | ) | $ | (199 | ) |
(Additions) reductions based on tax positions related to current year | (22 | ) | 12 | (2 | ) | ||||
Additions for tax positions of prior years | (29 | ) | (140 | ) | (719 | ) | |||
Reductions for tax positions of prior years | 824 | 6 | 29 | ||||||
Settlements | 26 | 2 | 2 | ||||||
Expiration of statutes of limitations | 11 | 7 | 25 | ||||||
Currency translation adjustment | 1 | (2 | ) | 7 | |||||
Balance at December 31 | $ | (161 | ) | $ | (972 | ) | $ | (857 | ) |
Included in the balance at December 31, 2013, 2012 and 2011 are $1 million, $14 million and $9 million, respectively, for tax positions for which the ultimate benefits are highly certain, but for which there is uncertainty about the timing of such benefits. However, except for the possible effect of any penalties, any disallowance that would change the timing of these benefits would not affect the annual effective tax rate, but would accelerate the payment of cash to the taxing authority to an earlier period.
The Company accrues interest on unrecognized tax benefits as a component of interest expense. Penalties, if incurred, are recognized as a component of income tax expense. The Company had approximately $54
67
million and $104 million accrued for the payment of estimated interest and penalties associated with unrecognized tax benefits at December 31, 2013 and 2012, respectively.
The major jurisdictions where the Company files income tax returns are the United States, Brazil, France, Poland and Russia. Generally, tax years 2002 through 2012 remain open and subject to examination by the relevant tax authorities. The Company is typically engaged in various tax examinations at any given time, both in the United States and overseas. In 2013, the Company concluded its examination with the U.S. Internal Revenue Service for the tax years 2006 through 2009 for both International Paper Company and Temple-Inland. As a result of the completion of the examinations, the Company reduced its unrecognized tax benefits by approximately $844 million. Other pending audit settlements and the expiration of statute of limitations could further reduce the uncertain tax positions by $4 million during the next twelve months. While the Company believes that it is adequately accrued for possible audit adjustments, the final resolution of these examinations cannot be determined at this time and could result in final settlements that differ from current estimates.
Included in the Company’s 2013, 2012 and 2011 income tax provision (benefit) are $(924) million, $(85) million and $(266) million, respectively, related to special items. The components of the net provisions related to special items were as follows:
In millions | 2013 | 2012 | 2011 | ||||||
Special items | $ | (151 | ) | $ | (104 | ) | $ | (293 | ) |
Tax-related adjustments: | |||||||||
Internal restructurings | (4 | ) | 14 | 24 | |||||
India deal costs | — | — | 9 | ||||||
IP UK valuation allowance release | — | — | (13 | ) | |||||
Settlement of tax audits and legislative changes | (770 | ) | — | 5 | |||||
Medicare D deferred income tax write-off | — | 5 | — | ||||||
Other tax adjustments | 1 | — | 2 | ||||||
Income tax provision (benefit) related to special items | $ | (924 | ) | $ | (85 | ) | $ | (266 | ) |
Excluding the impact of special items and nonoperating pension expense, the 2013, 2012 and 2011 income tax provisions were $527 million, $456 million and $591 million, respectively, or 27%, 29% and 32%, respectively, of pre-tax earnings before equity earnings.
The following details the scheduled expiration dates of the Company’s net operating loss and income tax credit carryforwards:
In millions | 2014 Through 2023 | 2024 Through 2033 | Indefinite | Total | ||||||||
U.S. federal and non-U.S. NOLs | $ | 21 | $ | 3 | $ | 400 | $ | 424 | ||||
State taxing jurisdiction NOLs | 152 | 120 | — | 272 | ||||||||
U.S. federal, non- U.S. and state tax credit carryforwards | 117 | 31 | 454 | 602 | ||||||||
State capital loss carryforwards | 23 | — | — | 23 | ||||||||
Total | $ | 313 | $ | 154 | $ | 854 | $ | 1,321 | ||||
Deferred income taxes are not provided for temporary differences of approximately $5.1 billion, $4.7 billion and $4.5 billion as of December 31, 2013, 2012 and 2011, respectively, representing earnings of non-U.S. subsidiaries intended to be permanently reinvested. Computation of the potential deferred tax liability associated with these undistributed earnings and other basis differences is not practicable.
The American Taxpayer Relief Act of 2012 (the “Act”) was signed into law on January 2, 2013. The Act retroactively restored several expired business tax provisions, including the research and experimentation credit and the Subpart F controlled foreign corporation look-through exception. Because a change in tax law is accounted for in the period of enactment, the retroactive effect of the Act on the Company's U.S. federal taxes for 2012 of a benefit of approximately $32 million was recognized in the first quarter of 2013.
PURCHASE COMMITMENTS AND OPERATING LEASES
Certain property, machinery and equipment are leased under cancelable and non-cancelable agreements.
Unconditional purchase obligations have been entered into in the ordinary course of business, principally for capital projects and the purchase of certain pulpwood, logs, wood chips, raw materials, energy and services, including fiber supply agreements to purchase pulpwood that were entered into concurrently with the Company’s 2006 Transformation Plan forestland sales and in conjunction with the 2008 acquisition of Weyerhaeuser Company’s Containerboard, Packaging and Recycling business.
68
At December 31, 2013, total future minimum commitments under existing non-cancelable operating leases and purchase obligations were as follows:
In millions | 2014 | 2015 | 2016 | 2017 | 2018 | Thereafter | ||||||||||||
Lease obligations | $ | 171 | $ | 133 | $ | 97 | $ | 74 | $ | 59 | $ | 162 | ||||||
Purchase obligations (a) | 3,170 | 770 | 642 | 529 | 453 | 2,404 | ||||||||||||
Total | $ | 3,341 | $ | 903 | $ | 739 | $ | 603 | $ | 512 | $ | 2,566 | ||||||
(a) | Includes $3.3 billion relating to fiber supply agreements entered into at the time of the Company’s 2006 Transformation Plan forestland sales and in conjunction with the 2008 acquisition of Weyerhaeuser Company’s Containerboard, Packaging and Recycling business. |
Rent expense was $215 million, $231 million and $205 million for 2013, 2012 and 2011, respectively.
GUARANTEES
In connection with sales of businesses, property, equipment, forestlands and other assets, International Paper commonly makes representations and warranties relating to such businesses or assets, and may agree to indemnify buyers with respect to tax and environmental liabilities, breaches of representations and warranties, and other matters. Where liabilities for such matters are determined to be probable and subject to reasonable estimation, accrued liabilities are recorded at the time of sale as a cost of the transaction.
ENVIRONMENTAL PROCEEDINGS
International Paper has been named as a potentially responsible party in environmental remediation actions under various federal and state laws, including the Comprehensive Environmental Response, Compensation and Liability Act (CERCLA). Many of these proceedings involve the cleanup of hazardous substances at large commercial landfills that received waste from many different sources. While joint and several liability is authorized under CERCLA and equivalent state laws, as a practical matter, liability for CERCLA cleanups is typically allocated among the many potential responsible parties. Remedial costs are recorded in the consolidated financial statements when they become probable and reasonably estimable. International Paper has estimated the probable liability associated with these matters to be approximately $94 million in the aggregate at December 31, 2013.
Cass Lake: One of the matters referenced above is a closed wood treating facility located in Cass Lake, Minnesota. During 2009, in connection with an environmental site remediation action under CERCLA, International Paper submitted to the EPA a site remediation feasibility study. In June 2011, the EPA selected and published a proposed soil remedy at the site with an estimated cost of $46 million. The overall
remediation reserve for the site is currently $51 million to address this selection of an alternative for the soil remediation component of the overall site remedy. In October 2011, the EPA released a public statement indicating that the final soil remedy decision would be delayed. In the unlikely event that the EPA changes its proposed soil remedy and approves instead a more expensive clean-up alternative, the remediation costs could be material, and significantly higher than amounts currently recorded. In October 2012, the Natural Resource Trustees for this site provided notice to International Paper and other potentially responsible parties of their intent to perform a Natural Resource Damage Assessment. It is premature to predict the outcome of the assessment or to estimate a loss or range of loss, if any, which may be incurred.
Other: In addition to the above matters, other remediation costs typically associated with the cleanup of hazardous substances at the Company’s current, closed or formerly-owned facilities, and recorded as liabilities in the balance sheet, totaled approximately $42 million at December 31, 2013. Other than as described above, completion of required remedial actions is not expected to have a material effect on our consolidated financial statements.
Kalamazoo River: The Company is a potentially responsible party with respect to the Allied Paper, Inc./Portage Creek/Kalamazoo River Superfund Site (Kalamazoo River Superfund Site) in Michigan. The EPA asserts that the site is contaminated primarily by PCBs as a result of discharges from various paper mills located along the Kalamazoo river, including a paper mill formerly owned by St. Regis Paper Company (St. Regis). The Company is a successor in interest to St. Regis. The Company has not received any orders from the EPA with respect to the site and continues to collect information from the EPA and other parties relative to the site to evaluate the extent of its liability, if any, with respect to the site. Accordingly, it is premature to estimate a loss or range of loss with respect to this site.
Also in connection with the Kalamazoo River Superfund Site, the Company was named as a defendant by Georgia-Pacific Consumer Products LP, Fort James Corporation and Georgia Pacific LLC in a contribution and cost recovery action for alleged pollution at the site. The suit seeks contribution under CERCLA for $79 million in costs purportedly expended by plaintiffs as of the filing of the complaint and for future remediation costs. The suit alleges that a mill, during the time it was allegedly owned and operated by St. Regis, discharged PCB contaminated solids and paper residuals resulting from paper de-inking and recycling. Also named as defendants in the suit are NCR Corporation and Weyerhaeuser Company. In mid-2011, the suit was transferred from the District Court for the Eastern District of Wisconsin to the District Court for the Western
69
District of Michigan. The trial of the initial liability phase took place in February 2013. Weyerhaeuser conceded prior to trial that it was a liable party with respect to the site. In September 2013, an opinion and order was issued in the suit. The order concluded that the Company (as the successor to St. Regis) was not an “operator,” but was an “owner,” of the mill at issue during a portion of the relevant period and is therefore liable under CERCLA. The order also determined that NCR is a liable party as an "arranger for disposal" of PCBs in waste paper that was de-inked and recycled by mills along the Kalamazoo River. The order did not address the Company's responsibility, if any, for costs for which plaintiffs in the suit are seeking recovery. This will be the subject of a separate trial, which has been set for July 2015. The Company thus believes it is premature to predict the outcome or to estimate a loss or range of loss, if any, which may be incurred.
Harris County: International Paper and McGinnis Industrial Maintenance Corporation, a subsidiary of Waste Management, Inc., are potentially responsible parties at the San Jacinto River Waste Pits Superfund Site (San Jacinto Superfund Site) in Harris County, Texas, and have been actively participating in investigation and remediation activities at this Superfund Site. In December 2011, Harris County, Texas filed a suit against the Company in Harris County District Court seeking civil penalties with regard to the alleged discharge of dioxin into the San Jacinto River since 1965 from waste impoundments that are part of the San Jacinto River Superfund Site. Also named as defendants in this action are McGinnis Industrial Maintenance Corporation, Waste Management, Inc. and Waste Management of Texas, Inc. Harris County is seeking civil penalties pursuant to the Texas Water Code, which provides for the imposition of civil penalties between $50 and $25,000 per day. The case is in the discovery phase and it is therefore premature to predict the outcome or to estimate our maximum reasonably possible loss. However, we do not believe that any material loss is probable.
In October 2012, a civil lawsuit was filed against the same defendants, including the Company, in the District Court of Harris County by what are now in excess of 500 plaintiffs seeking medical monitoring and damages with regard to the alleged discharge of dioxin into the San Jacinto River since 1965 from waste impoundments that are a part of the San Jacinto Superfund Site. This case is in the discovery phase and it is therefore premature to predict the outcome or to estimate a loss or range of loss, if any, which may be incurred. In December 2012, residents of an up-river neighborhood filed a civil action against the same defendants, including the Company, in the District Court of Harris County alleging property damage and personal injury from the alleged discharge of dioxin into the San Jacinto River from the San Jacinto Superfund
Site. This case is in the discovery phase and it is therefore premature to predict the outcome or to estimate a loss or range of loss, if any, which may be incurred.
Bogalusa: In August 2011, Temple-Inland's Bogalusa, Louisiana paper mill experienced an upset condition that resulted in fish kill on the Pearl River (the Bogalusa Incident). Louisiana and Mississippi state regulatory agencies and the U.S. Department of Justice (the DOJ) initiated enforcement actions against Temple-Inland as a result of the Bogalusa Incident. We have resolved the Louisiana and Mississippi enforcement matters and paid approximately $3 million in penalties.
The DOJ investigation into the Bogalusa Incident was resolved in the second quarter of 2013 upon federal court approval of a criminal plea agreement between Temple-Inland subsidiary, TIN Inc., and the DOJ. Under the plea agreement, TIN Inc. pleaded guilty to two misdemeanor environmental offenses, paid a $3.3 million financial penalty, and agreed to a two-year corporate probation period.
In late 2013, the Louisiana Department of Environmental Quality (LDEQ) and TIN Inc. reached a settlement, subject to State Attorney General approval, to resolve a LDEQ enforcement arising from (1) alleged environmental violations identified in an LDEQ environmental audit conducted immediately after the Bogalusa Incident, and (2) air permit deviations self-disclosed by the mill in 2012. Pursuant to the settlement, TIN Inc. will pay $125,000 to fund a beneficial improvement project.
In December 2013, the district attorney for Washington Parish, in which Bogalusa is located, filed a lawsuit alleging that there are additional damages that were not resolved by a November 2011 settlement between TIN Inc. and the Louisiana Fish and Wildlife Department (LDWF). That settlement resolved a LDWF claim for wildlife injury damages arising from the Bogalusa Incidents and the validity of the settlement was upheld by the Louisiana Supreme Court. We believe that the new suit is without merit and we are vigorously defending our position.
Temple-Inland (or its affiliates) was a defendant in 28 civil lawsuits in Louisiana and Mississippi related to the Bogalusa Incident. Fifteen of these civil cases were filed in Louisiana state court shortly after the incident and were removed and consolidated in an action pending in the U.S. District Court for the Eastern District of Louisiana along with a civil case originally filed in that court. During August 2012, an additional 13 causes of action were filed in federal or state court in Mississippi and Louisiana. In October 2012, International Paper and the Plaintiffs' Steering Committee, the group of attorneys appointed by the Louisiana federal court to
70
organize and coordinate the efforts of all the plaintiffs in this litigation, reached a tentative understanding on key structural terms and an amount for resolution of the litigation. The court granted preliminary approval for the proposed class action settlement on December 26, 2012. There were no opt-outs and four objections which were all later withdrawn. The Fairness Hearing was held July 10, 2013, and the court issued its Final Order and Judgment Approving Class Action Settlement the same day. Under the terms of the settlement agreement, the class action settlement was deemed final on August 9, 2013. We funded the settlement in September 2013. This settlement did not have a material effect on the Company's consolidated financial statements.
LEGAL PROCEEEDINGS
Antitrust: In September 2010, eight containerboard producers, including International Paper and Temple-Inland, were named as defendants in a purported class action complaint that alleged a civil violation of Section 1 of the Sherman Act. The suit is captioned Kleen Products LLC v. Packaging Corp. of America (N.D. Ill.). The complaint alleges that the defendants, beginning in August 2005 through November 2010, conspired to limit the supply and thereby increase prices of containerboard products. The alleged class is all persons who purchased containerboard products directly from any defendant for use or delivery in the United States during the period August 2005 to the present. The complaint seeks to recover an unspecified amount of treble actual damages and attorney’s fees on behalf of the purported class. Four similar complaints were filed and have been consolidated in the Northern District of Illinois. Moreover, in January 2011, International Paper was named as a defendant in a lawsuit filed in state court in Cocke County, Tennessee alleging that International Paper violated Tennessee law by conspiring to limit the supply and fix the prices of containerboard from mid-2005 to the present. Plaintiffs in the state court action seek certification of a class of Tennessee indirect purchasers of containerboard products, damages and costs, including attorneys’ fees. The Company disputes the allegations made and intends to vigorously defend each action. However, because both actions are in the preliminary stages, we are unable to predict an outcome or estimate a range of reasonably possible loss.
Beginning in late December 2012, certain purchasers of gypsum board filed a number of purported class action complaints alleging civil violations of Section 1 of the Sherman Act against Temple-Inland and a number of other gypsum manufacturers. The complaints were similar and alleged that the gypsum manufacturers conspired or otherwise reached agreements to: (1) raise prices of gypsum board either from 2008 or 2011 through the present; (2) avoid price erosion by ceasing the practice of issuing job quotes;
and (3) restrict supply through downtime and limit order fulfillment. The alleged classes are all persons who purchased gypsum board and/or gypsum finishing products directly or indirectly from any defendant. The complainants seek to recover unspecified treble actual damages and attorneys' fees on behalf of the purported classes. On April 8, 2013, the Judicial Panel on Multidistrict Litigation ordered transfer of all pending cases to the U.S. District Court for the Eastern District of Pennsylvania for coordinated and consolidated pretrial proceedings, and the direct purchaser plaintiffs and indirect purchaser plaintiffs filed their respective amended consolidated complaints in June 2013. The amended consolidated complaints allege a conspiracy or agreement beginning in or before September 2011. The Company disputes the allegations made and intends to vigorously defend the consolidated actions. In addition, in September 2013, purported class actions were filed in courts in Quebec, Canada and Ontario, Canada, with each suit alleging violations of the Canadian Competition Act and seeking damages and injunctive relief. The Company intends to dispute the allegations made and to vigorously defend the litigation. Because the U.S. cases are in the discovery phase and the Canadian cases are in a preliminary stage, we are unable to predict an outcome or estimate our maximum reasonably possible loss. However, we do not believe that any material loss is probable.
Guaranty Bank: As we have previously disclosed, Temple-Inland was named as a defendant in a lawsuit captioned North Port Firefighters’ Pension v. Temple-Inland Inc., filed in November 2011 in the United States District Court for the Northern District of Texas and subsequently amended. The lawsuit alleges a class action against Temple-Inland and certain individual defendants contending that Temple-Inland misrepresented the financial condition of Guaranty Financial Group during the period December 12, 2007 through August 24, 2009. On June 20, 2012, all defendants in the lawsuit filed motions to dismiss the amended complaint. On March 28, 2013, the district court granted Temple-Inland's and the individual defendants' motions to dismiss without prejudice. On April 26, 2013, the plaintiff filed a Second Amended Complaint that asserted claims against the individual defendants, but did not assert any claims against Temple-Inland. On July 30, 2013, the district court dismissed the Second Amended Complaint filed against the individual defendants with prejudice, also noting that since the plaintiff did not seek the court's leave to amend its complaint with respect to the claims against Temple-Inland, all claims against Temple-Inland were dismissed with prejudice. On August 27, 2013, the plaintiff filed a notice of appeal of the district court's ruling.
Certain of the individual defendants in the North Port litigation have requested advancement of their costs of
71
defense from Temple-Inland and have asserted a right to indemnification by Temple-Inland. We believe that all or part of these defense costs would be covered losses under Temple-Inland's directors and officers insurance. The carriers under the applicable policies have been notified of the claims and each has responded with a reservations of rights letter.
Tax: The Company is currently being challenged by Brazilian tax authorities concerning the statute of limitations related to the use of certain tax credits. The Company is appealing an unfavorable March 2012 administrative court ruling. The potential loss to the Company in the event of a final unfavorable outcome is approximately $29 million.
General: The Company is involved in various other inquiries, administrative proceedings and litigation relating to environmental and safety matters, contracts, sales of property, intellectual property, personal injury, labor and employment and other matters, some of which allege substantial monetary damages. While any proceeding or litigation has the element of uncertainty, the Company believes that the outcome of any of the lawsuits or claims that are pending or threatened or all of them combined (other than those that cannot be assessed due to their preliminary nature) will not have a material effect on its consolidated financial statements.
VARIABLE INTEREST ENTITIES
In connection with the 2006 sale of approximately 5.6 million acres of forestlands, International Paper received installment notes (the Timber Notes) totaling approximately $4.8 billion. The Timber Notes, which do not require principal payments prior to their August 2016 maturity, are supported by irrevocable letters of credit obtained by the buyers of the forestlands.
During 2006, International Paper contributed the Timber Notes to newly formed entities (the Borrower Entities) in exchange for Class A and Class B interests in these entities. Subsequently, International Paper contributed its $200 million Class A interests in the Borrower Entities, along with approximately $400 million of International Paper promissory notes, to other newly formed entities (the Investor Entities, and together with the Borrower Entities, the Entities) in exchange for Class A and Class B interests in these entities, and simultaneously sold its Class A interest in the Investor Entities to a third party investor. As a result, at December 31, 2006, International Paper held Class B interests in the Borrower Entities and Class B interests in the Investor Entities valued at approximately $5.0 billion. International Paper did not provide any
financial support that was not previously contractually required for the years ended December 31, 2013, 2012 or 2011.
Following the 2006 sale of forestlands and creation of the Entities discussed above, the Timber Notes were used as collateral for borrowings from third party lenders, which effectively monetized the Timber Notes. Provisions of certain loan agreements require any bank issuing letters of credit supporting the Timber Notes to maintain a credit rating above a specified threshold. In the event the credit rating of a letter of credit bank is downgraded below the specified threshold, the letters of credit must be replaced within 60 days by letters of credit from a qualifying institution, or for one letter of credit bank, collateral must be posted. The Company, retained to provide management services for the third-party entities that hold the Timber Notes, has, as required by the loan agreements, successfully replaced banks that fell below the specified threshold or obtained a waiver as further discussed below.
Also during 2006, the Entities acquired approximately $4.8 billion of International Paper debt obligations for cash, resulting in a total of approximately $5.2 billion of International Paper debt obligations held by the Entities at December 31, 2006. The various agreements entered into in connection with these transactions provide that International Paper has, and intends to effect, a legal right to offset its obligation under these debt instruments with its investments in the Entities. Accordingly, for financial reporting purposes, International Paper has offset approximately $5.2 billion of Class B interests in the Entities against $5.3 billion of International Paper debt obligations held by these Entities at December 31, 2013 and 2012. Despite the offset treatment, these remain debt obligations of International Paper. Remaining borrowings of $67 million and $79 million at December 31, 2013 and 2012, respectively, are included in floating rate notes due 2013 – 2017 in the summary of long-term debt in Note 13. Additional debt related to the above transaction of $79 million is included in short-term notes in the summary of long-term debt in Note 13 at December 31, 2013 and 2012.
On October 7, 2011, Moody’s Investor Services reduced its credit rating of senior unsecured long-term debt of the Royal Bank of Scotland Group Plc, which issued letters of credit that support $1.6 billion of the Timber Notes, below the specified threshold. Letters of credit worth $842 million were successfully replaced by other qualifying institutions. Fees of $5 million were incurred in connection with these replacements. The Company and third-party managing member instituted a replacement waiver for the remaining $797 million. On July 25, 2012, these letters of credit were successfully replaced by another qualifying institution. In the event the credit rating of the letter of credit bank
72
is downgraded below a specified threshold, the new bank is required to provide credit support for its obligation. Fees of $5 million were incurred in connection with this replacement.
On November 29, 2011, Standard and Poor's reduced its credit rating of senior unsecured long-term debt of Lloyds TSB Bank Plc, which issued letters of credit that support $1.2 billion of the Timber Notes, below the specified threshold. The letters of credit were successfully replaced by another qualifying institution. Fees of $4 million were incurred in connection with this replacement.
On January 23, 2012, Standard and Poor's reduced its credit rating of senior unsecured long-term debt of Société Générale SA, which issued letters of credit that support $666 million of the Timber Notes, below the specified threshold. The letters of credit were successfully replaced by another qualifying institution. Fees of $5 million were incurred in connection with this replacement.
On June 21, 2012, Moody's Investor Services reduced its credit rating of senior unsecured long-term debt of BNP Paribas, which issued letters of credit that support $707 million of Timber Notes, below the specified threshold. On December 19, 2012, the Company and the third-party managing member agreed to a continuing replacement waiver for these letters of credit, terminable upon 30 days notice.
Activity between the Company and the Entities was as follows:
In millions | 2013 | 2012 | 2011 | ||||||
Revenue (loss) (a) | $ | 45 | $ | 49 | $ | 49 | |||
Expense (a) | 79 | 90 | 79 | ||||||
Cash receipts (b) | 33 | 36 | 28 | ||||||
Cash payments (c) | 84 | 87 | 79 | ||||||
(a) | The net expense related to the Company’s interest in the Entities is included in Interest expense, net in the accompanying consolidated statement of operations, as International Paper has and intends to effect its legal right to offset as discussed above. |
(b) | The cash receipts are equity distributions from the Entities to International Paper. |
(c) | The semi-annual payments are related to interest on the associated debt obligations discussed above. |
Based on an analysis of the Entities discussed above under guidance that considers the potential magnitude of the variability in the structures and which party has a controlling financial interest, International Paper determined that it is not the primary beneficiary of the Entities, and therefore, should not consolidate its investments in these entities. It was also determined that the source of variability in the structure is the value of the Timber Notes, the assets most significantly impacting the structure’s economic performance. The
credit quality of the Timber Notes is supported by irrevocable letters of credit obtained by third-party buyers which are 100% cash collateralized. International Paper analyzed which party has control over the economic performance of each entity, and concluded International Paper does not have control over significant decisions surrounding the Timber Notes and letters of credit and therefore is not the primary beneficiary. The Company’s maximum exposure to loss equals the value of the Timber Notes; however, an analysis performed by the Company concluded the likelihood of this exposure is remote.
International Paper also held variable interests in two financing entities that were used to monetize long-term notes received from the sale of forestlands in 2001 and 2002. International Paper transferred notes (the Monetized Notes, with an original maturity of 10 years from inception) and cash of approximately $1.0 billion to these entities in exchange for preferred interests, and accounted for the transfers as a sale of the notes with no associated gain or loss. In the same period, the entities acquired approximately $1.0 billion of International Paper debt obligations for cash. International Paper has no obligation to make any further capital contributions to these entities and did not provide any financial support that was not previously contractually required during the years ended December 31, 2013, 2012 or 2011.
The 2001 Monetized Notes of $499 million matured on March 16, 2011. Following their maturity, International Paper purchased the Class A preferred interest in the 2001 financing entities from an external third-party for $21 million. As a result of the purchase, effective March 16, 2011, International Paper owned 100% of the 2001 financing entities. Based on an analysis performed by the Company after the purchase, under guidance that considers the potential magnitude of the variability in the structure and which party has a controlling financial interest, International Paper determined that it was the primary beneficiary of the 2001 financing entities and thus consolidated the entities effective March 16, 2011. Effective April 30, 2011, International Paper liquidated its interest in the 2001 financing entities. Activity between the Company and the 2001 financing entities during 2011 was immaterial.
73
Activity between the Company and the 2002 financing entities was as follows:
In millions | 2013 | 2012 | 2011 | ||||||
Revenue (loss) (a) | $ | — | $ | — | $ | 2 | |||
Expense (b) | — | — | 3 | ||||||
Cash receipts (c) | — | 252 | 192 | ||||||
Cash payments (d) | — | 159 | 244 | ||||||
(a) | The revenue is included in Equity earnings (loss), net of tax in the accompanying consolidated statement of operations. |
(b) | The expense is included in Interest expense, net in the accompanying consolidated statement of operations. |
(c) | The cash receipts are equity distributions from the 2002 financing entities to International Paper and cash receipts from the maturity of the 2002 Monetized Notes. |
(d) | The cash payments include both interest and principal on the associated debt obligations. |
On May 31, 2011, the third-party equity holder of the 2002 financing entities retired its Class A interest in the entities for $51 million. As a result of the retirement, effective May 31, 2011, International Paper owned 100% of the 2002 financing entities. Based on an analysis performed by the Company after the retirement, under guidance that considers the potential magnitude of the variability in the structure and which party has controlling financial interest, International Paper determined that it was the primary beneficiary of the 2002 financing entities and thus consolidated the entities effective May 31, 2011.
During 2011, $191 million of the 2002 Monetized Notes matured. During 2012, $252 million of the 2002 Monetized Notes matured. Cash receipts upon maturity were used to pay the associated debt obligations. Effective June 1, 2012, International Paper liquidated its interest in the 2002 financing entities.
The use of the above entities facilitated the monetization of the credit enhanced Timber and Monetized Notes in a cost effective manner by increasing the borrowing capacity and lowering the interest rate while continuing to preserve the tax deferral that resulted from the forestlands installment sales and the offset accounting treatment described above.
In connection with the acquisition of Temple-Inland in February 2012, two special purpose entities became wholly-owned subsidiaries of International Paper.
In October 2007, Temple-Inland sold 1.55 million acres of timberlands for $2.38 billion. The total consideration consisted almost entirely of notes due in 2027 issued by the buyer of the timberlands, which Temple-Inland contributed to two wholly-owned, bankruptcy-remote special purpose entities. The notes are shown in Financial assets of special purpose entities in the accompanying consolidated balance sheet and are supported by $2.38 billion of irrevocable letters of credit issued by three banks, which are required to maintain
minimum credit ratings on their long-term debt. In the third quarter of 2012, International Paper completed its preliminary analysis of the acquisition date fair value of the notes and determined it to be $2.09 billion. As of December 31, 2013 and 2012, the fair value of the notes was $2.62 billion and $2.21 billion, respectively.
In December 2007, Temple-Inland's two wholly-owned special purpose entities borrowed $2.14 billion shown in Nonrecourse financial liabilities of special purpose entities in the accompanying consolidated balance sheet. The loans are repayable in 2027 and are secured only by the $2.38 billion of notes and the irrevocable letters of credit securing the notes and are nonrecourse to the Company. The loan agreements provide that if a credit rating of any of the banks issuing the letters of credit is downgraded below the specified threshold, the letters of credit issued by that bank must be replaced within 30 days with letters of credit from another qualifying financial institution. In the third quarter of 2012, International Paper completed its preliminary analysis of the acquisition date fair value of the borrowings and determined it to be $2.03 billion. As of December 31, 2013 and 2012, the fair value of this debt was $2.49 billion and $2.12 billion, respectively.
On January 23, 2012, Standard and Poor's reduced its credit rating of senior unsecured long-term debt of Société Générale SA, which issued letters of credit that support $506 million of the 2007 Monetized Notes, below the specific threshold. These letters of credit were successfully replaced by another qualifying institution. Fees of $2 million were incurred in connection with this replacement.
On June 21, 2012, Moody's Investor Services reduced its credit rating of senior unsecured long-term debt of Barclays Bank PLC, which issued letters of credit that support approximately $500 million of the 2007 Monetized Notes, below the specified threshold. These letters of credit were successfully replaced by another qualifying institution. Fees of $6 million were incurred in connection with this replacement.
Activity between the Company and the 2007 financing entities was as follows:
In millions | 2013 | 2012 | 2011 | ||||||
Revenue (loss) (a) | $ | 27 | $ | 28 | $ | — | |||
Expense (b) | 29 | 28 | — | ||||||
Cash receipts (c) | 8 | 12 | — | ||||||
Cash payments (d) | 21 | 22 | — | ||||||
(a) | The revenue is included in Interest expense, net in the accompanying consolidated statement of operations and includes approximately $19 million and $17 million for the years ended December 31, 2013 and 2012, respectively, of accretion income for the amortization of the purchase accounting adjustment of the Financial assets of special purpose entities. |
74
(b) | The expense is included in Interest expense, net in the accompanying consolidated statement of operations and includes $7 million and $6 million for the years ended December 31, 2013 and 2012, respectively, of accretion expense for the amortization of the purchase accounting adjustment on the Nonrecourse financial liabilities of special purpose entities. |
(c) | The cash receipts are interest received on the Financial assets of special purpose entities. |
(d) | The cash payments are interest paid on Nonrecourse financial liabilities of special purpose entities. |
PREFERRED SECURITIES OF SUBSIDIARIES
In March 2003, Southeast Timber, Inc. (Southeast Timber), a consolidated subsidiary of International Paper, issued $150 million of preferred securities to a private investor with future dividend payments based on LIBOR. Southeast Timber, which through a subsidiary initially held approximately 1.50 million acres of forestlands in the southern United States, was International Paper’s primary vehicle for sales of southern forestlands. As of December 31, 2013, substantially all of these forestlands have been sold. On March 27, 2013, Southeast Timber redeemed its Class A common shares owned by the private investor for $150 million. As a result, Noncontrolling interests decreased by $150 million in the accompanying consolidated balance sheet. Distributions paid to the third-party investor were $1 million, $6 million and $5 million in 2013, 2012 and 2011, respectively. The expense related to these preferred securities is shown in Net earnings (loss) attributable to noncontrolling interests in the accompanying consolidated statement of operations.
In February 2012, International Paper issued a $1.2 billion term loan with an initial interest rate of LIBOR plus a margin of 138 basis points that varies depending on the credit rating of the Company and a $200 million term loan with an interest rate of LIBOR plus a margin of 175 basis points, both with maturity dates in 2017. The proceeds from these borrowings were used, along with available cash, to fund the acquisition of Temple-Inland. During 2012, International Paper fully repaid the $1.2 billion term loan.
Amounts related to early debt extinguishment during the years ended December 31, 2013, 2012 and 2011 were as follows:
In millions | 2013 | 2012 | 2011 | ||||||
Debt reductions (a) | $ | 574 | $ | 1,272 | $ | 129 | |||
Pre-tax early debt extinguishment costs (b) | 25 | 48 | 32 | ||||||
(a) | Reductions related to notes with interest rates ranging from 1.625% to 9.375% with original maturities from 2012 to 2041 for the years ended December 31, 2013, 2012 and 2011. |
(b) | Amounts are included in Restructuring and other charges in the accompanying consolidated statements of operations. |
A summary of long-term debt follows:
In millions at December 31 | 2013 | 2012 | ||||
8.7% note – due 2038 | $ | 264 | $ | 263 | ||
9 3/8% note – due 2019 | 848 | 846 | ||||
7.95% debentures – due 2018 | 1,429 | 1,462 | ||||
7.5% note – due 2021 | 999 | 999 | ||||
7.4% debentures – due 2014 | — | 303 | ||||
7.3% notes – due 2039 | 721 | 721 | ||||
6 7/8% notes – due 2023 – 2029 | 130 | 130 | ||||
6.65% note – due 2037 | 4 | 4 | ||||
6.4% to 7.75% debentures due 2025 – 2027 | 142 | 142 | ||||
6 3/8% to 6 5/8% notes – due 2016 – 2018 | 364 | 373 | ||||
6.0% notes – due 2041 | 585 | 585 | ||||
5.25% to 5.5% notes – due 2014 – 2016 | 657 | 701 | ||||
4.75% notes – due 2022 | 899 | 899 | ||||
Floating rate notes – due 2013 – 2017 (a) | 269 | 314 | ||||
Environmental and industrial development bonds – due 2013 – 2035 (b) | 1,487 | 1,812 | ||||
Short-term notes (c) | 386 | 255 | ||||
Other (d) | 304 | 331 | ||||
Total (e) | 9,488 | 10,140 | ||||
Less: current maturities | 661 | 444 | ||||
Long-term debt | $ | 8,827 | $ | 9,696 | ||
(a) | The weighted average interest rate on these notes was 2.6% in 2013 and 2.6% in 2012. |
(b) | The weighted average interest rate on these bonds was 5.5% in 2013 and 5.6% in 2012. |
(c) | The weighted average interest rate was 2.8% in 2013 and 2.2% in 2012. Includes $93 million at December 31, 2013 and $29 million at December 31, 2012 related to non-U.S. denominated borrowings with a weighted average interest rate of 5.8% in 2013 and 5.6% in 2012. |
(d) | Includes $41 million at December 31, 2013 and $61 million at December 31, 2012, related to the unamortized gain on interest rate swap unwinds (see Note 14). |
(e) | The fair market value was approximately $10.7 billion at December 31, 2013 and $12.3 billion at December 31, 2012. |
In addition to the long-term debt obligations shown above, International Paper has $5.3 billion of debt obligations payable to non-consolidated variable interest entities having principal payments of $5.3 billion due in 2016, for which International Paper has, and intends to effect, a legal right to offset these obligations with Class B interests held in the entities. Accordingly, in the accompanying consolidated balance sheet, International Paper has offset the $5.3 billion of debt obligations with $5.2 billion of Class B interests in these entities as of December 31, 2013 (see Note 12). Total maturities of long-term debt over the next five years are 2014 – $661 million; 2015 – $498 million; 2016 – $571 million; 2017 – $285 million; and 2018 – $2 billion.
At December 31, 2013, International Paper’s contractually committed credit facilities (the Agreements) totaled $2.5 billion. The Agreements
75
generally provide for interest rates at a floating rate index plus a pre-determined margin dependent upon International Paper’s credit rating. The Agreements include a $1.5 billion contractually committed bank facility that expires in August 2016 and has a facility fee of 0.175% payable quarterly. The Agreements also include up to $1.0 billion of commercial paper-based financings based on eligible receivables balances ($958 million available as of December 31, 2013) under a receivables securitization program. On January 8, 2014, the Company amended the receivables securitization program to extend the maturity date from January 2014 to December 2014. The amended Agreement includes up to $500 million of uncommitted commercial paper-based financings. At December 31, 2013, there were no borrowings under either the bank facility or receivables securitization program.
Maintaining an investment grade credit rating is an important element of International Paper’s financing strategy. At December 31, 2013, the Company held long-term credit ratings of BBB (stable outlook) and Baa3 (stable outlook) by S&P and Moody’s, respectively.
International Paper periodically uses derivatives and other financial instruments to hedge exposures to interest rate, commodity and currency risks. International Paper does not hold or issue financial instruments for trading purposes. For hedges that meet the hedge accounting criteria, International Paper, at inception, formally designates and documents the instrument as a fair value hedge, a cash flow hedge or a net investment hedge of a specific underlying exposure.
INTEREST RATE RISK MANAGEMENT
Our policy is to manage interest cost using a mixture of fixed-rate and variable-rate debt. To manage this risk in a cost-efficient manner, we enter into interest rate swaps whereby we agree to exchange with the counterparty, at specified intervals, the difference between fixed and variable interest amounts calculated by reference to a notional amount.
Interest rate swaps that meet specific accounting criteria are accounted for as fair value or cash flow hedges. For fair value hedges, the changes in the fair value of both the hedging instruments and the underlying debt obligations are immediately recognized in interest expense. For cash flow hedges, the effective portion of the changes in the fair value of the hedging instrument is reported in Accumulated other comprehensive income (“AOCI”) and reclassified into interest expense over the life of the underlying debt.
The ineffective portion for both cash flow and fair value hedges, which is not material for any year presented, is immediately recognized in earnings.
FOREIGN CURRENCY RISK MANAGEMENT
We manufacture and sell our products and finance operations in a number of countries throughout the world and, as a result, are exposed to movements in foreign currency exchange rates. The purpose of our foreign currency hedging program is to manage the volatility associated with the changes in exchange rates.
To manage this exchange rate risk, we have historically utilized a combination of forward contracts, options and currency swaps. Contracts that qualify are designated as cash flow hedges of certain forecasted transactions denominated in foreign currencies. The effective portion of the changes in fair value of these instruments is reported in AOCI and reclassified into earnings in the same financial statement line item and in the same period or periods during which the related hedged transactions affect earnings. The ineffective portion, which is not material for any year presented, is immediately recognized in earnings.
In the second quarter of 2012, the Company added zero-cost collar option contracts to its portfolio to manage its exposure to U.S. dollar / Brazilian real exchange rates. These zero-cost collar instruments qualify as cash flow hedges of certain forecasted transactions denominated in U.S. dollars. The effective portion of the changes in fair value of these instruments is reported in AOCI and reclassified into earnings in the same financial statement line item and in the same period or periods during which the related hedged transactions affect earnings. The ineffective portion is immediately recognized in earnings.
The change in value of certain non-qualifying instruments used to manage foreign exchange exposure of intercompany financing transactions and certain balance sheet items subject to revaluation is immediately recognized in earnings, substantially offsetting the foreign currency mark-to-market impact of the related exposure.
COMMODITY RISK MANAGEMENT
Certain raw materials used in our production processes are subject to price volatility caused by weather, supply conditions, political and economic variables and other unpredictable factors. To manage the volatility in earnings due to price fluctuations, we may utilize swap contracts. These contracts are designated as cash flow hedges of forecasted commodity purchases. The effective portion of the changes in fair value for these instruments is reported in AOCI and reclassified into earnings in the same financial statement line item and
76
in the same period or periods during which the hedged transactions affect earnings. The ineffective and non-qualifying portions, which are not material for any year presented, are immediately recognized in earnings.
The notional amounts of qualifying and non-qualifying instruments used in hedging transactions were as follows:
In millions | December 31, 2013 | December 31, 2012 | |||
Derivatives in Cash Flow Hedging Relationships: | |||||
Foreign exchange contracts (Sell / Buy; denominated in sell notional): (a) | |||||
Brazilian real / U.S. dollar - Forward | 502 | — | |||
British pounds / Brazilian real - Forward | 17 | 13 | |||
European euro / Brazilian real - Forward | 27 | 13 | |||
European euro / Polish zloty - Forward | 252 | 149 | |||
U.S. dollar / Brazilian real - Forward | 290 | 238 | |||
U.S. dollar / Brazilian real - Zero-cost collar | 18 | 18 | |||
Derivatives in Fair Value Hedging Relationships: | |||||
Interest rate contracts (in USD) | 175 | — | |||
Derivatives Not Designated as Hedging Instruments: | |||||
Embedded derivative (in USD) | — | 150 | |||
Foreign exchange contracts (Sell / Buy; denominated in sell notional): | |||||
Indian rupee / U.S. dollar | 157 | 140 | |||
Thai baht / U.S. dollar | — | 261 | |||
U.S. dollar / Turkish lira | — | 56 | |||
Interest rate contracts (in USD) | — | 150 | (b) | ||
(a) | These contracts had maturities of three years or less as of December 31, 2013. |
(b) | Includes $150 million floating-to-fixed interest rate swap notional to offset the embedded derivative. |
The following table shows gains or losses recognized in AOCI, net of tax, related to derivative instruments:
Gain (Loss) Recognized in AOCI on Derivatives (Effective Portion) | |||||||||
In millions | 2013 | 2012 | 2011 | ||||||
Foreign exchange contracts | $ | — | $ | 16 | $ | (39 | ) | ||
Fuel oil contracts | — | — | 2 | ||||||
Natural gas contracts | — | (1 | ) | (6 | ) | ||||
Total | $ | — | $ | 15 | $ | (43 | ) | ||
During the next 12 months, the amount of the December 31, 2013 AOCI balance, after tax, that is expected to be reclassified to earnings is a gain of $2 million.
The amounts of gains and losses recognized in the consolidated statement of operations on qualifying and non-qualifying financial instruments used in hedging transactions were as follows:
Gain (Loss) Reclassified from AOCI into Income (Effective Portion) | Location of Gain (Loss) Reclassified from AOCI into Income (Effective Portion) | ||||||||||
In millions | 2013 | 2012 | 2011 | ||||||||
Derivatives in Cash Flow Hedging Relationships: | |||||||||||
Foreign exchange contracts | $ | 7 | $ | (15 | ) | $ | 8 | Cost of products sold | |||
Fuel oil contracts | — | — | 4 | Cost of products sold | |||||||
Natural gas contracts | — | (7 | ) | (20 | ) | Cost of products sold | |||||
Total | $ | 7 | $ | (22 | ) | $ | (8 | ) | |||
77
Gain (Loss) Recognized in Income | Location of Gain (Loss) in Consolidated Statement of Operations | |||||||||||||||
In millions | 2013 | 2012 | 2011 | |||||||||||||
Derivatives in Fair Value Hedging Relationships: | ||||||||||||||||
Interest rate contracts | $ | (1 | ) | $ | — | $ | (10 | ) | Interest expense, net | |||||||
Debt | 1 | — | 10 | Interest expense, net | ||||||||||||
Total | $ | — | $ | — | $ | — | ||||||||||
Derivatives Not Designated as Hedging Instruments: | ||||||||||||||||
Electricity Contracts | $ | 4 | $ | (4 | ) | $ | — | Cost of products sold | ||||||||
Embedded derivatives | (1 | ) | (4 | ) | (3 | ) | Interest expense, net | |||||||||
Foreign exchange contracts | (5 | ) | — | (14 | ) | (a) | Cost of products sold | |||||||||
Interest rate contracts | 21 | 22 | 3 | Interest expense, net | ||||||||||||
Total | $ | 19 | $ | 14 | $ | (14 | ) | |||||||||
(a) Premium costs of $5 million in connection with the acquisition of APPM are included in Restructuring and other charges in the accompanying consolidated statement of operations.
The following activity is related to fully effective interest rate swaps designated as fair value hedges:
2013 | 2012 | |||||||||||||||||||||||
In millions | Issued | Terminated | Undesignated | Issued | Terminated | Undesignated | ||||||||||||||||||
Fourth Quarter | $ | 175 | $ | — | $ | — | $ | — | $ | — | $ | — | ||||||||||||
Total | $ | 175 | $ | — | $ | — | $ | — | $ | — | $ | — | ||||||||||||
Fair Value Measurements
International Paper’s financial assets and liabilities that are recorded at fair value consist of derivative contracts, including interest rate swaps, foreign currency forward contracts, and other financial instruments that are used to hedge exposures to interest rate, commodity and currency risks. In addition, a consolidated subsidiary of International Paper has an embedded derivative. For these financial instruments and the embedded derivative, fair value is determined at each balance sheet date using an income approach.
The guidance for fair value measurements and disclosures sets out a fair value hierarchy that groups fair value measurement inputs into the following three classifications:
Level 1: Quoted market prices in active markets for identical assets or liabilities.
Level 2: Observable market-based inputs other than quoted prices included within Level 1 that are observable for the asset or liability, either directly or indirectly.
Level 3: Unobservable inputs for the asset or liability reflecting the reporting entity’s own assumptions or external inputs from inactive markets.
Transfers between levels are recognized at the end of the reporting period. All of International Paper’s derivative fair value measurements use Level 2 inputs.
Below is a description of the valuation calculation and the inputs used for each class of contract:
Interest Rate Contracts
Interest rate contracts are valued using swap curves obtained from an independent market data provider. The market value of each contract is the sum of the fair value of all future interest payments between the contract counterparties, discounted to present value. The fair value of the future interest payments is determined by comparing the contract rate to the derived forward interest rate and present valued using the appropriate derived interest rate curve.
Fuel Oil Contracts
Fuel oil contracts are valued using the average of two forward fuel oil curves as quoted by third parties. The fair value of each contract is determined by comparing the strike price to the forward price of the corresponding fuel oil contract and present valued using the appropriate interest rate curve.
Natural Gas Contracts
Natural gas contracts are traded over-the-counter and settled using the NYMEX last day settle price; therefore,
78
forward contracts are valued using the closing prices of the NYMEX natural gas future contracts. The fair value of each contract is determined by comparing the strike price to the closing price of the corresponding natural gas future contract and present valued using the appropriate interest rate curve.
Foreign Exchange Contracts
Foreign currency forward contracts are valued using foreign currency forward and interest rate curves obtained from an independent market data provider. The fair value of each contract is determined by comparing the contract rate to the forward rate. The fair value is present valued using the applicable interest rate from an independent market data provider.
Embedded Derivative
Embedded derivatives are valued using a hypothetical interest rate derivative with identical terms. The hypothetical interest rate derivative contracts are fair valued as described above under Interest Rate Contracts.
Since the volume and level of activity of the markets that each of the above contracts are traded in has been normal, the fair value calculations have not been adjusted for inactive markets or disorderly transactions.
The following table provides a summary of the impact of our derivative instruments in the consolidated balance sheet:
Fair Value Measurements
Level 2 – Significant Other Observable Inputs
Assets | Liabilities | |||||||||||||||
In millions | December 31, 2013 | December 31, 2012 | December 31, 2013 | December 31, 2012 | ||||||||||||
Derivatives designated as hedging instruments | ||||||||||||||||
Foreign exchange contracts – cash flow | $ | 37 | (a) | $ | 7 | (c) | $ | 33 | (d) | $ | 21 | (f) | ||||
Interest rate contracts - fair value | — | — | 1 | (e) | — | |||||||||||
Total derivatives designated as hedging instruments | $ | 37 | $ | 7 | $ | 34 | $ | 21 | ||||||||
Derivatives not designated as hedging instruments | ||||||||||||||||
Electricity contract | $ | 2 | (b) | $ | — | $ | — | $ | 1 | (g) | ||||||
Embedded derivatives | — | 1 | (b) | — | — | |||||||||||
Foreign exchange contracts | — | 1 | (b) | — | — | |||||||||||
Interest rate contracts | — | — | — | 1 | (g) | |||||||||||
Total derivatives not designated as hedging instruments | $ | 2 | $ | 2 | $ | — | $ | 2 | ||||||||
Total derivatives | $ | 39 | $ | 9 | $ | 34 | $ | 23 | ||||||||
(a) | Includes $23 million recorded in Other current assets and $14 million recorded in Deferred charges and other assets in the accompanying consolidated balance sheet. |
(b) | Included in Other current assets in the accompanying consolidated balance sheet. |
(c) | Includes $3 million recorded in Other current assets and $4 million recorded in Deferred charges and other assets in the accompanying consolidated balance sheet. |
(d) | Includes $24 million recorded in Other accrued liabilities and $9 million recorded in Other liabilities in the accompanying consolidated balance sheet. |
(e) | Included in Other liabilities in the accompanying consolidated balance sheet. |
(f) | Includes $20 million recorded in Other accrued liabilities and $1 million recorded in Other liabilities in the accompanying consolidated balance sheet. |
(g) | Included in Other accrued liabilities in the accompanying consolidated balance sheet. |
The above contracts are subject to enforceable master netting arrangements that provide rights of offset with each counterparty when amounts are payable on the same date in the same currency or in the case of certain specified defaults. Management has made an accounting policy election to not offset the fair value of recognized derivative assets and derivative liabilities in the consolidated balance sheet. The amounts owed to the counterparties and owed to the Company are
considered immaterial with respect to each counterparty and in the aggregate with all counterparties.
Credit-Risk-Related Contingent Features
International Paper evaluates credit risk by monitoring its exposure with each counterparty to ensure that exposure stays within acceptable policy limits. Credit
79
risk is also mitigated by contractual provisions with the majority of our banks. Certain of the contracts include a credit support annex that requires the posting of collateral by the counterparty or International Paper based on each party’s rating and level of exposure. Based on the Company’s current credit rating, the collateral threshold is generally $10 million.
If the lower of the Company’s credit rating by Moody’s or S&P were to drop below investment grade, the Company would be required to post collateral for all of its derivatives in a net liability position, although no derivatives would terminate. The fair values of derivative instruments containing credit-risk-related contingent features in a net liability position were $3 million as of December 31, 2013 and $18 million as of December 31, 2012. The Company was not required to post any collateral as of December 31, 2013 or 2012.
The authorized capital stock at both December 31, 2013 and 2012, consisted of 990,850,000 shares of common stock, $1 par value; 400,000 shares of cumulative $4 preferred stock, without par value (stated value $100 per share); and 8,750,000 shares of serial preferred stock, $1 par value. The serial preferred stock is issuable in one or more series by the Board of Directors without further shareholder action.
The following is a rollforward of shares of common stock for the three years ended December 31, 2013, 2012 and 2011:
Common Stock | ||||
In thousands | Issued | Treasury | ||
Balance at January 1, 2011 | 438,871 | 1,234 | ||
Issuance of stock for various plans, net | 1 | (326 | ) | |
Repurchase of stock | — | 1,013 | ||
Balance at December 31, 2011 | 438,872 | 1,921 | ||
Issuance of stock for various plans, net | 1,022 | (2,994 | ) | |
Repurchase of stock | — | 1,086 | ||
Balance at December 31, 2012 | 439,894 | 13 | ||
Issuance of stock for various plans, net | 7,328 | (533 | ) | |
Repurchase of stock | — | 11,388 | ||
Balance at December 31, 2013 | 447,222 | 10,868 | ||
International Paper sponsors and maintains the Retirement Plan of International Paper Company (the “Pension Plan”), a tax-qualified defined benefit pension plan that provides retirement benefits to substantially all U.S. salaried employees and hourly employees (receiving salaried benefits) hired prior to July 1, 2004, and substantially all other U.S. hourly and union employees who work at a participating business unit regardless of hire date. These employees generally are eligible to participate in the Pension Plan upon attaining
21 years of age and completing one year of eligibility service. U.S. salaried employees and hourly employees (receiving salaried benefits) hired after June 30, 2004 are not eligible to participate in the Pension Plan, but receive a company contribution to their individual savings plan accounts (see Other U.S. Plans). The Pension Plan provides defined pension benefits based on years of credited service and either final average earnings (salaried employees and hourly employees receiving salaried benefits), hourly job rates or specified benefit rates (hourly and union employees).
In connection with the Temple-Inland acquisition in February 2012, International Paper assumed administrative responsibility for the Temple-Inland Retirement Plan, a defined benefit plan which covers substantially all employees of Temple-Inland.
The Company also has three unfunded nonqualified defined benefit pension plans: a Pension Restoration Plan available to employees hired prior to July 1, 2004 that provides retirement benefits based on eligible compensation in excess of limits set by the Internal Revenue Service, and two supplemental retirement plans for senior managers (SERP), which is an alternative retirement plan for salaried employees who are senior vice presidents and above or who are designated by the chief executive officer as participants. These nonqualified plans are only funded to the extent of benefits paid, which totaled $28 million, $95 million and $19 million in 2013, 2012 and 2011, respectively, and which are expected to be $46 million in 2014.
The Company will freeze participation, including credited service and compensation, for salaried employees under the Pension Plan, the Pension Restoration Plan and the SERP for all service on or after January 1, 2019. In addition, compensation under the Temple-Inland Retirement Plan and the Temple-Inland Supplemental Executive Retirement Plan (collectively, the “Temple Retirement Plans”) will also be frozen beginning January 1, 2019. Credited service was previously frozen for the Temple Retirement Plans. This change will not affect benefits accrued through December 31, 2018. For service after this date, employees affected by the freeze will receive Retirement Savings Account contributions as described later in this Note 16.
Many non-U.S. employees are covered by various retirement benefit arrangements, some of which are considered to be defined benefit pension plans for accounting purposes.
OBLIGATIONS AND FUNDED STATUS
The following table shows the changes in the benefit obligation and plan assets for 2013 and 2012, and the
80
plans’ funded status. The U.S. combined benefit obligation as of December 31, 2013 decreased by $1.3 billion, as a result of an increase in the discount rate assumption used in computing the estimated benefit obligation. U.S. plan assets increased by $595 million, reflecting favorable investment results and a $31 million required contribution in 2013 offset by benefit payments.
2013 | 2012 | |||||||||||
In millions | U.S. Plans | Non- U.S. Plans | U.S. Plans | Non- U.S. Plans | ||||||||
Change in projected benefit obligation: | ||||||||||||
Benefit obligation, January 1 | $ | 14,201 | $ | 223 | $ | 10,555 | $ | 183 | ||||
Service cost | 188 | 4 | 152 | 3 | ||||||||
Interest cost | 576 | 11 | 604 | 12 | ||||||||
Curtailments | (14 | ) | — | — | — | |||||||
Settlements | (5 | ) | (4 | ) | — | (3 | ) | |||||
Actuarial loss (gain) | (1,309 | ) | — | 1,923 | 30 | |||||||
Acquisitions | — | 3 | 1,749 | 3 | ||||||||
Plan amendments | — | — | 20 | — | ||||||||
Special termination benefits | 8 | — | — | — | ||||||||
Benefits paid | (742 | ) | (8 | ) | (802 | ) | (8 | ) | ||||
Effect of foreign currency exchange rate movements | — | (1 | ) | — | 3 | |||||||
Benefit obligation, December 31 | $ | 12,903 | $ | 228 | $ | 14,201 | $ | 223 | ||||
Change in plan assets: | ||||||||||||
Fair value of plan assets | $ | 10,111 | $ | 171 | $ | 8,185 | $ | 155 | ||||
Actual return on plan assets | 1,283 | 15 | 1,183 | 18 | ||||||||
Company contributions | 59 | 8 | 139 | 8 | ||||||||
Benefits paid | (742 | ) | (8 | ) | (802 | ) | (8 | ) | ||||
Settlements | (5 | ) | (4 | ) | — | (3 | ) | |||||
Acquisitions | — | — | 1,406 | — | ||||||||
Effect of foreign currency exchange rate movements | — | (1 | ) | — | 1 | |||||||
Fair value of plan assets, December 31 | $ | 10,706 | $ | 181 | $ | 10,111 | $ | 171 | ||||
Funded status, December 31 | $ | (2,197 | ) | $ | (47 | ) | $ | (4,090 | ) | $ | (52 | ) |
Amounts recognized in the consolidated balance sheet: | ||||||||||||
Non-current asset | $ | — | $ | 9 | $ | — | $ | 4 | ||||
Current liability | (46 | ) | (2 | ) | (32 | ) | (2 | ) | ||||
Non-current liability | (2,151 | ) | (54 | ) | (4,058 | ) | (54 | ) | ||||
$ | (2,197 | ) | $ | (47 | ) | $ | (4,090 | ) | $ | (52 | ) | |
Amounts recognized in accumulated other comprehensive income under ASC 715 (pre-tax): | ||||||||||||
Prior service cost | $ | 107 | $ | — | $ | 144 | $ | — | ||||
Net actuarial loss | 3,285 | 29 | 5,640 | 34 | ||||||||
$ | 3,392 | $ | 29 | $ | 5,784 | $ | 34 | |||||
The components of the $2.4 billion and $5 million decrease related to U.S. plans and non-U.S. plans, respectively, in the amounts recognized in OCI during 2013 consisted of:
In millions | U.S. Plans | Non- U.S. Plans | ||||
Current year actuarial (gain) loss | $ | (1,854 | ) | $ | (4 | ) |
Amortization of actuarial loss | (485 | ) | (1 | ) | ||
Current year prior service cost | — | — | ||||
Amortization of prior service cost | (34 | ) | — | |||
Curtailments | (19 | ) | — | |||
$ | (2,392 | ) | $ | (5 | ) | |
The accumulated benefit obligation at December 31, 2013 and 2012 was $12.6 billion and $13.8 billion, respectively, for our U.S. defined benefit plans and $208 million and $206 million, respectively, at December 31, 2013 and 2012 for our non-U.S. defined benefit plans.
The following table summarizes information for pension plans with an accumulated benefit obligation in excess of plan assets at December 31, 2013 and 2012:
2013 | 2012 | |||||||||||
In millions | U.S. Plans | Non-U.S. Plans | U.S. Plans | Non-U.S. Plans | ||||||||
Projected benefit obligation | $ | 12,903 | $ | 181 | $ | 14,201 | $ | 200 | ||||
Accumulated benefit obligation | 12,560 | 168 | 13,772 | 188 | ||||||||
Fair value of plan assets | 10,706 | 125 | 10,111 | 143 | ||||||||
ASC 715, “Compensation – Retirement Benefits” provides for delayed recognition of actuarial gains and losses, including amounts arising from changes in the estimated projected plan benefit obligation due to changes in the assumed discount rate, differences between the actual and expected return on plan assets and other assumption changes. These net gains and losses are recognized prospectively over a period that approximates the average remaining service period of active employees expected to receive benefits under the plans to the extent that they are not offset by gains in subsequent years. The estimated net loss and prior service cost that will be amortized from AOCI into net periodic pension cost for the U.S. plans during the next fiscal year are expected to be $316 million and $30 million, respectively.
81
NET PERIODIC PENSION EXPENSE
Service cost is the actuarial present value of benefits attributed by the plans’ benefit formula to services rendered by employees during the year. Interest cost represents the increase in the projected benefit obligation, which is a discounted amount, due to the passage of time. The expected return on plan assets reflects the computed amount of current-year earnings from the investment of plan assets using an estimated long-term rate of return.
Net periodic pension expense for qualified and nonqualified U.S. and non-U.S. defined benefit plans comprised the following:
2013 | 2012 | 2011 | ||||||||||||||||
In millions | U.S. Plans | Non- U.S. Plans | U.S. Plans | Non- U.S. Plans | U.S. Plans | Non- U.S. Plans | ||||||||||||
Service cost | $ | 188 | $ | 4 | $ | 152 | $ | 3 | $ | 121 | $ | 2 | ||||||
Interest cost | 576 | 11 | 604 | 12 | 544 | 12 | ||||||||||||
Expected return on plan assets | (738 | ) | (11 | ) | (753 | ) | (12 | ) | (713 | ) | (12 | ) | ||||||
Actuarial loss / (gain) | 485 | 1 | 307 | — | 212 | — | ||||||||||||
Amortization of prior service cost | 34 | — | 32 | — | 31 | — | ||||||||||||
Settlement gain | — | — | — | — | — | (1 | ) | |||||||||||
Net periodic pension expense | $ | 545 | $ | 5 | $ | 342 | $ | 3 | $ | 195 | $ | 1 | ||||||
The increase in 2013 pension expense reflects a decrease in the discount rate from 5.10% in 2012 to 4.10% in 2013 and higher amortization of unrecognized actuarial losses.
ASSUMPTIONS
International Paper evaluates its actuarial assumptions annually as of December 31 (the measurement date) and considers changes in these long-term factors based upon market conditions and the requirements for employers’ accounting for pensions. These assumptions are used to calculate benefit obligations as of December 31 of the current year and pension expense to be recorded in the following year (i.e., the discount rate used to determine the benefit obligation as of December 31, 2013 was also the discount rate used to determine net pension expense for the 2014 year).
Major actuarial assumptions used in determining the benefit obligations and net periodic pension cost for our defined benefit plans are presented in the following table:
2013 | 2012 | 2011 | ||||||||||
U.S. Plans | Non- U.S. Plans | U.S. Plans | Non- U.S. Plans | U.S. Plans | Non- U.S. Plans | |||||||
Actuarial assumptions used to determine benefit obligations as of December 31: | ||||||||||||
Discount rate | 4.90 | % | 5.07 | % | 4.10 | % | 4.96 | % | 5.10 | % | 5.98 | % |
Rate of compensation increase | 3.75 | % | 4.13 | % | 3.75 | % | 3.17 | % | 3.75 | % | 3.12 | % |
Actuarial assumptions used to determine net periodic pension cost for years ended December 31: | ||||||||||||
Discount rate | 4.10 | % | 4.96 | % | 5.10 | % | 5.98 | % | 5.60 | % | 6.01 | % |
Expected long-term rate of return on plan assets (a) | 8.00 | % | 7.04 | % | 8.00 | % | 7.62 | % | 8.25 | % | 7.79 | % |
Rate of compensation increase | 3.75 | % | 3.17 | % | 3.75 | % | 3.12 | % | 3.75 | % | 3.07 | % |
(a) | Represents the expected rate of return for International Paper's qualified pension plan. The weighted average rate for the Temple-Inland Retirement Plan was 6.16% and 5.70% for 2013 and 2012, respectively. |
The expected long-term rate of return on plan assets is based on projected rates of return for current and planned asset classes in the plan’s investment portfolio. Projected rates of return are developed through an asset/liability study in which projected returns for each of the plan’s asset classes are determined after analyzing historical experience and future expectations of returns and volatility of the various asset classes.
Based on the target asset allocation for each asset class, the overall expected rate of return for the portfolio
is developed considering the effects of active portfolio management and expenses paid from plan assets. The discount rate assumption was determined from a universe of high quality corporate bonds. A settlement portfolio is selected and matched to the present value of the plan’s projected benefit payments. To calculate pension expense for 2014, the Company will use an
82
expected long-term rate of return on plan assets of 7.75% for the Retirement Plan of International Paper,
an expected long-term rate of return on plan assets of 7.00% for the Temple-Inland Retirement Plan, a discount rate of 4.90% and an assumed rate of compensation increase of 3.75%. The Company estimates that it will record net pension expense of approximately $366 million for its U.S. defined benefit plans in 2014, with the decrease from expense of $545 million in 2013 reflecting lower amortization of unrecognized losses, an increase in the discount rate to 4.90% in 2014 from 4.10% in 2013, partially offset by a lower return on asset assumption for International Paper plan assets, and a higher return on asset assumption for Temple-Inland plan assets.
For non-U.S. pension plans, assumptions reflect economic assumptions applicable to each country.
The following illustrates the effect on pension expense for 2014 of a 25 basis point decrease in the above assumptions:
In millions | 2014 | ||
Expense/(Income): | |||
Discount rate | $ | 35 | |
Expected long-term rate of return on plan assets | 25 | ||
Rate of compensation increase | (5 | ) | |
PLAN ASSETS
International Paper’s Board of Directors has appointed a Fiduciary Review Committee that is responsible for fiduciary oversight of the U.S. Pension Plan, approving investment policy and reviewing the management and control of plan assets. Pension Plan assets are invested to maximize returns within prudent levels of risk. The
The Pension Plan maintains a strategic asset allocation policy that designates target allocations by asset class. Investments are diversified across classes and within each class to minimize the risk of large losses. Derivatives, including swaps, forward and futures contracts, may be used as asset class substitutes or for hedging or other risk management purposes. Periodic reviews are made of investment policy objectives and investment manager performance. For non-U.S. plans, assets consist principally of common stock and fixed income securities.
International Paper’s U.S. pension allocations by type of fund at December 31, and target allocations were as follows:
Asset Class | 2013 | 2012 | Target Allocations | ||
Equity accounts | 49 | % | 41 | % | 42% - 53% |
Fixed income accounts | 32 | % | 38 | % | 30% - 40% |
Real estate accounts | 10 | % | 10 | % | 6% - 12% |
Other | 9 | % | 11 | % | 3% - 15% |
Total | 100 | % | 100 | % | |
The 2013 and 2012 actual and target allocations shown represent a weighted average of International Paper and Temple-Inland plan assets.
The fair values of International Paper’s pension plan assets at December 31, 2013 and 2012 by asset class are shown below. Plan assets included an immaterial amount of International Paper common stock at December 31, 2013 and 2012. Hedge funds disclosed in the following table are allocated equally between equity and fixed income accounts for target allocation purposes. Cash and cash equivalent portfolios are allocated to the types of account from which they originated.
Fair Value Measurement at December 31, 2013 | ||||||||||||
Asset Class | Total | Quoted Prices in Active Markets For Identical Assets (Level 1) | Significant Observable Inputs (Level 2) | Significant Unobservable Inputs (Level 3) | ||||||||
In millions | ||||||||||||
Equities – domestic | $ | 2,466 | $ | 1,175 | $ | 1,290 | $ | 1 | ||||
Equities – international | 2,313 | 1,470 | 843 | — | ||||||||
Corporate bonds | 1,248 | — | 1,248 | — | ||||||||
Government securities | 1,097 | — | 1,097 | — | ||||||||
Mortgage backed securities | 143 | — | 143 | — | ||||||||
Other fixed income | 74 | (1 | ) | 65 | 10 | |||||||
Commodities | 193 | — | 193 | — | ||||||||
Hedge funds | 831 | — | — | 831 | ||||||||
Private equity | 484 | — | — | 484 | ||||||||
Real estate | 1,038 | — | — | 1,038 | ||||||||
Derivatives | 313 | — | — | 313 | ||||||||
Cash and cash equivalents | 506 | (10 | ) | 516 | — | |||||||
Total Investments | $ | 10,706 | $ | 2,634 | $ | 5,395 | $ | 2,677 | ||||
83
Fair Value Measurement at December 31, 2012 | ||||||||||||
Asset Class | Total | Quoted Prices in Active Markets For Identical Assets (Level 1) | Significant Observable Inputs (Level 2) | Significant Unobservable Inputs (Level 3) | ||||||||
In millions | ||||||||||||
Equities – domestic | $ | 2,171 | $ | 1,241 | $ | 927 | $ | 3 | ||||
Equities – international | 1,513 | 1,145 | 368 | — | ||||||||
Common collective funds – fixed income | 180 | — | 180 | — | ||||||||
Corporate bonds | 1,539 | — | 1,539 | — | ||||||||
Government securities | 1,593 | — | 1,593 | — | ||||||||
Mortgage backed securities | 127 | — | 127 | — | ||||||||
Other fixed income | 75 | — | 67 | 8 | ||||||||
Commodities | 216 | — | 216 | — | ||||||||
Hedge funds | 492 | — | — | 492 | ||||||||
Private equity | 503 | — | — | 503 | ||||||||
Real estate | 1,037 | — | — | 1,037 | ||||||||
Derivatives | 354 | — | — | 354 | ||||||||
Cash and cash equivalents | 311 | (15 | ) | 326 | — | |||||||
Total Investments | $ | 10,111 | $ | 2,371 | $ | 5,343 | $ | 2,397 | ||||
Equity securities consist primarily of publicly traded U.S. companies and international companies. Publicly traded equities are valued at the closing prices reported in the active market in which the individual securities are traded.
Fixed income consists of government securities, mortgage-backed securities, corporate bonds and common collective funds. Government securities are valued by third-party pricing sources. Mortgage-backed security holdings consist primarily of agency-rated holdings. The fair value estimates for mortgage securities are calculated by third-party pricing sources chosen by the custodian’s price matrix. Corporate bonds are valued using either the yields currently available on comparable securities of issuers with similar credit ratings or using a discounted cash flows approach that utilizes observable inputs, such as current yields of similar instruments, but includes adjustments for certain risks that may not be observable, such as credit and liquidity risks. Common collective funds are valued at the net asset value per share multiplied by the number of shares held as of the measurement date.
Commodities consist of commodity-linked notes and commodity-linked derivatives. Commodities are valued at closing prices determined by calculation agents for outstanding transactions.
Hedge funds are investment structures for managing private, loosely-regulated investment pools that can pursue a diverse array of investment strategies with a wide range of different securities and derivative instruments. These investments are made through funds-of-funds (commingled, multi-manager fund structures) and through direct investments in individual hedge funds. Hedge funds are primarily valued by each fund’s third-party administrator based upon the valuation of the underlying securities and instruments and primarily by applying a market or income valuation methodology as appropriate depending on the specific type of security or instrument held. Funds-of-funds are valued based upon the net asset values of the underlying investments in hedge funds.
Private equity consists of interests in partnerships that invest in U.S. and non-U.S. debt and equity securities. Partnership interests are valued using the most recent general partner statement of fair value, updated for any subsequent partnership interest cash flows.
Real estate includes commercial properties, land and timberland, and generally includes, but is not limited to, retail, office, industrial, multifamily and hotel properties. Real estate fund values are primarily reported by the fund manager and are based on valuation of the underlying investments which include inputs such as cost, discounted cash flows, independent appraisals and market based comparable data.
Derivative investments such as futures, forward contracts, options, and swaps are used to help manage risks. Derivatives are generally employed as asset class substitutes (such as when employed within a portable alpha strategy), for managing asset/liability mismatches, or bona fide hedging or other appropriate risk management purposes. Derivative instruments are generally valued by the investment managers or in certain instances by third-party pricing sources.
84
The fair value measurements using significant unobservable inputs (Level 3) at December 31, 2013 were as follows:
Fair Value Measurements Using Significant Unobservable Inputs (Level 3)
In millions | Equities- Domestic | Other Fixed Income | Hedge Funds | Private Equity | Real Estate | Derivatives | Total | ||||||||||||||
Beginning balance at December 31, 2012 | $ | 3 | $ | 8 | $ | 492 | $ | 503 | $ | 1,037 | $ | 354 | $ | 2,397 | |||||||
Actual return on plan assets: | |||||||||||||||||||||
Relating to assets still held at the reporting date | (1 | ) | 1 | 11 | 41 | 62 | (20 | ) | 94 | ||||||||||||
Relating to assets sold during the period | 2 | — | 47 | 1 | 32 | 137 | 219 | ||||||||||||||
Purchases, sales and settlements | (3 | ) | — | 281 | (61 | ) | (93 | ) | (158 | ) | (34 | ) | |||||||||
Transfers in and/or out of Level 3 | — | 1 | — | — | — | — | 1 | ||||||||||||||
Ending balance at December 31, 2013 | $ | 1 | $ | 10 | $ | 831 | $ | 484 | $ | 1,038 | $ | 313 | $ | 2,677 | |||||||
FUNDING AND CASH FLOWS
The Company’s funding policy for the Pension Plan is to contribute amounts sufficient to meet legal funding requirements, plus any additional amounts that the Company may determine to be appropriate considering the funded status of the plans, tax deductibility, cash flow generated by the Company, and other factors. The Company continually reassesses the amount and timing of any discretionary contributions. Contributions to the qualified plan totaling $31 million , $44 million and $300 million were made by the Company in 2013, 2012 and 2011, respectively. Generally, International Paper’s non-U.S. pension plans are funded using the projected benefit as a target, except in certain countries where funding of benefit plans is not required.
At December 31, 2013, projected future pension benefit payments, excluding any termination benefits, were as follows:
In millions | |||
2014 | $ | 767 | |
2015 | 759 | ||
2016 | 767 | ||
2017 | 779 | ||
2018 | 791 | ||
2019 – 2023 | 4,165 | ||
OTHER U.S. PLANS
International Paper sponsors the International Paper Company Salaried Savings Plan and the International Paper Company Hourly Savings Plan, both of which are tax-qualified defined contribution 401(k) savings plans. Substantially all U.S. salaried and certain hourly employees are eligible to participate and may make elective deferrals to such plans to save for retirement. International Paper makes matching contributions to participant accounts on a specified percentage of employee deferrals as determined by the provisions of each plan. For eligible employees hired after June 30,
2004, the Company makes Retirement Savings Account contributions equal to a percentage of an eligible employee’s pay.
In connection with the Temple-Inland acquisition, International Paper acquired two savings plans which were merged into the International Paper savings plans on December 31, 2012.
The Company also sponsors the International Paper Company Deferred Compensation Savings Plan, which is an unfunded nonqualified defined contribution plan. This plan permits eligible employees to continue to make deferrals and receive company matching contributions when their contributions to the International Paper Salaried Savings Plan are stopped due to limitations under U.S. tax law. Participant deferrals and company matching contributions are not invested in a separate trust, but are paid directly from International Paper’s general assets at the time benefits become due and payable.
Company matching contributions to the plans totaled approximately $120 million, $122 million and $83 million for the plan years ending in 2013, 2012 and 2011, respectively.
U.S. POSTRETIREMENT BENEFITS
International Paper provides certain retiree health care and life insurance benefits covering certain U.S. salaried and hourly employees. These employees are generally eligible for benefits upon retirement and completion of a specified number of years of creditable service. Excluded from company-provided medical benefits are salaried employees whose age plus years of employment with the Company totaled less than 60 as of January 1, 2004. International Paper does not fund these benefits prior to payment and has the right
85
to modify or terminate certain of these plans in the future.
In addition to the U.S. plan, certain Brazilian and Moroccan employees are eligible for retiree health care and life insurance benefits.
The components of U.S. postretirement benefit expense in 2013, 2012 and 2011 were as follows:
In millions | 2013 | 2012 | 2011 | |||||||||||||||
U.S. Plans | Non- U.S. Plans | U.S. Plans | Non- U.S. Plans | U.S. Plans | Non- U.S. Plans | |||||||||||||
Service cost | $ | 2 | $ | 2 | $ | 3 | $ | — | $ | 2 | $ | — | ||||||
Interest cost | 14 | 5 | 20 | 1 | 21 | 2 | ||||||||||||
Actuarial loss | 7 | — | 10 | — | 9 | — | ||||||||||||
Amortization of prior service credits | (24 | ) | — | (30 | ) | — | (25 | ) | — | |||||||||
Curtailment gain | — | — | (7 | ) | — | — | — | |||||||||||
Net postretirement (benefit) expense (a) | $ | (1 | ) | $ | 7 | $ | (4 | ) | $ | 1 | $ | 7 | $ | 2 | ||||
(a) Excludes $7 million of curtailment gains in 2013 related to the sale of Building Products that were recorded in Net (gains) losses on sales and impairments of businesses in the consolidated statement of operations.
International Paper evaluates its actuarial assumptions annually as of December 31 (the measurement date) and considers changes in these long-term factors based upon market conditions and the requirements of employers’ accounting for postretirement benefits other than pensions. Temple-Inland's postretirement plan was remeasured on July 19, 2013 due to the sale of Building Products which reduced the obligation by $6 million International Paper's postretirement plan was remeasured on January 31, 2012 due to a negative plan amendment which reduced our obligation by $29 million and reduced the 2012 expected benefit cost by $11 million. Temple-Inland's postretirement plan was remeasured on July 31, 2012 due to a negative plan amendment which reduced the obligation by $6 million and reduced 2012 expense by $1 million.
The discount rates used to determine net U.S. and non-U.S. postretirement benefit cost for the years ended December 31, 2013, 2012 and 2011 were as follows:
2013 | 2012 | 2011 | |||||||||||
U.S. Plans | Non- U.S. Plans | U.S. Plans | Non- U.S. Plans | U.S. Plans | Non- U.S. Plans | ||||||||
Discount rate | 3.70 | % | 8.43 | % | 4.40 | % | (a) | 7.73 | % | 5.30 | % | 7.72 | % |
(a) | Represents the weighted average rate for the IP plan for 2012 due to the remeasurement. The weighted average rate used for Temple-Inland in 2012 was 4.19%. |
The weighted average assumptions used to determine the benefit obligation at December 31, 2013 and 2012 were as follows:
2013 | 2012 | |||||||
U.S. Plans | Non- U.S. Plans | U.S. Plans | Non- U.S. Plans | |||||
Discount rate | 4.50 | % | 11.94 | % | 3.70 | % | 8.43 | % |
Health care cost trend rate assumed for next year | 7.00 | % | 11.43 | % | 7.50 | % | 7.18 | % |
Rate that the cost trend rate gradually declines to | 5.00 | % | 6.12 | % | 5.00 | % | 7.18 | % |
Year that the rate reaches the rate it is assumed to remain | 2017 | 2024 | 2017 | 2013 | ||||
A 1% increase in the assumed annual health care cost trend rate would have increased the U.S. and non-U.S. accumulated postretirement benefit obligations at December 31, 2013 by approximately $13 million and $12 million, respectively. A 1% decrease in the annual trend rate would have decreased the U.S. and non-U.S. accumulated postretirement benefit obligation at December 31, 2013 by approximately $11 million and $10 million, respectively. The effect on net postretirement benefit cost from a 1% increase or decrease would be approximately $1 million for both U.S. and non-U.S. plans.
86
The plan is only funded in an amount equal to benefits paid. The following table presents the changes in benefit obligation and plan assets for 2013 and 2012:
In millions | 2013 | 2012 | ||||||||||
U.S. Plans | Non- U.S. Plans | U.S. Plans | Non- U.S. Plans | |||||||||
Change in projected benefit obligation: | ||||||||||||
Benefit obligation, January 1 | $ | 449 | $ | 22 | $ | 425 | $ | 23 | ||||
Service cost | 2 | 2 | 3 | — | ||||||||
Interest cost | 14 | 5 | 20 | 1 | ||||||||
Participants’ contributions | 19 | — | 34 | 1 | ||||||||
Actuarial (gain) loss | (80 | ) | 12 | 44 | 10 | |||||||
Acquisitions | — | 38 | 108 | — | ||||||||
Plan amendments | — | — | (63 | ) | — | |||||||
Benefits paid | (82 | ) | (1 | ) | (107 | ) | (2 | ) | ||||
Less: Federal subsidy | 2 | — | 7 | — | ||||||||
Restructuring | — | — | (17 | ) | — | |||||||
Curtailment | (2 | ) | — | (5 | ) | (11 | ) | |||||
Currency Impact | — | (6 | ) | — | — | |||||||
Benefit obligation, December 31 | $ | 322 | $ | 72 | $ | 449 | $ | 22 | ||||
Change in plan assets: | ||||||||||||
Fair value of plan assets, January 1 | $ | — | $ | — | $ | — | $ | — | ||||
Company contributions | 63 | 1 | 73 | 1 | ||||||||
Participants’ contributions | 19 | — | 34 | 1 | ||||||||
Benefits paid | (82 | ) | (1 | ) | (107 | ) | (2 | ) | ||||
Fair value of plan assets, December 31 | $ | — | $ | — | $ | — | $ | — | ||||
Funded status, December 31 | $ | (322 | ) | $ | (72 | ) | $ | (449 | ) | $ | (22 | ) |
Amounts recognized in the consolidated balance sheet under ASC 715: | ||||||||||||
Current liability | $ | (39 | ) | $ | (2 | ) | $ | (59 | ) | $ | (2 | ) |
Non-current liability | (283 | ) | (70 | ) | (390 | ) | (20 | ) | ||||
$ | (322 | ) | $ | (72 | ) | $ | (449 | ) | $ | (22 | ) | |
Amounts recognized in accumulated other comprehensive income under ASC 715 (pre-tax): | ||||||||||||
Net actuarial loss (gain) | $ | 31 | $ | 11 | $ | 115 | $ | (1 | ) | |||
Prior service credit | (35 | ) | — | (65 | ) | — | ||||||
$ | (4 | ) | $ | 11 | $ | 50 | $ | (1 | ) | |||
The non-current portion of the liability is included with the postemployment liability in the accompanying consolidated balance sheet under Postretirement and postemployment benefit obligation.
The components of the $54 million decrease and $12 million increase in the amounts recognized in OCI during 2013 for U.S. and non-U.S. plans, respectively, consisted of:
In millions | U.S. Plans | Non- U.S. Plans | ||||
Curtailment | $ | 5 | $ | — | ||
Current year actuarial gain | (76 | ) | — | |||
Amortization of actuarial (loss) gain | (7 | ) | 12 | |||
Amortization of prior service credit | 24 | — | ||||
$ | (54 | ) | $ | 12 | ||
The portion of the change in the funded status that was recognized in either net periodic benefit cost or OCI for the U.S. plans was $63 million, $0 million and $47 million in 2013, 2012 and 2011, respectively. The portion of the change in funded status for the non-U.S. plans was $19 million, $2 million, and $3 million in 2013, 2012 and 2011, respectively.
The estimated amounts of net loss and prior service credit that will be amortized from OCI into net U.S. postretirement benefit cost in 2014 are expected to be $4 million and $(13) million, respectively. The estimated amounts for non-U.S. plans in 2014 are expected to be $1 million and $0 million, respectively.
At December 31, 2013, estimated total future postretirement benefit payments, net of participant contributions and estimated future Medicare Part D subsidy receipts, were as follows:
In millions | Benefit Payments | Subsidy Receipts | Benefit Payments | ||||||
U.S. Plans | U.S. Plans | Non- U.S. Plans | |||||||
2014 | $ | 42 | $ | 3 | $ | 2 | |||
2015 | 35 | 3 | 3 | ||||||
2016 | 32 | 3 | 3 | ||||||
2017 | 30 | 3 | 4 | ||||||
2018 | 28 | 3 | 4 | ||||||
2019 – 2023 | 120 | 11 | 31 | ||||||
International Paper currently has an Incentive Compensation Plan (ICP) which, upon the approval by the Company’s shareholders in May 2009, replaced the Company’s Long-Term Incentive Compensation Plan (LTICP). The ICP authorizes grants of restricted stock, restricted or deferred stock units, performance awards payable in cash or stock upon the attainment of specified performance goals, dividend equivalents, stock options, stock appreciation rights, other stock-based awards, and cash-based awards at the discretion of the Management Development and Compensation
87
Committee of the Board of Directors (the Committee) that administers the ICP. Additionally, restricted stock, which may be deferred into RSU’s, may be awarded under a Restricted Stock and Deferred Compensation Plan for Non-Employee Directors.
STOCK OPTION PROGRAM
International Paper accounts for stock options in accordance with guidance under ASC 718, “Compensation – Stock Compensation.” Compensation expense is recorded over the related service period based on the grant-date fair market value. Since all outstanding options were vested as of July 14, 2005, only replacement option grants are expensed. No replacement options were granted in 2011.
During each reporting period, diluted earnings per share is calculated by assuming that “in-the-money” options are exercised and the exercise proceeds are used to repurchase shares in the marketplace. When options are actually exercised, option proceeds are credited to equity and issued shares are included in the computation of earnings per common share, with no effect on reported earnings. Equity is also increased by the tax benefit that International Paper will receive in its tax return for income reported by the employees in their individual tax returns.
Under the program, upon exercise of an option, a replacement option may be granted under certain circumstances with an exercise price equal to the market price at the time of exercise and with a term extending to the expiration date of the original option.
The Company has discontinued the issuance of stock options for all eligible U.S. and non-U.S. employees. In the United States, the stock option program was replaced with a performance-based restricted share program to more closely tie long-term incentive compensation to Company performance on two key performance drivers: return on investment (ROI) and total shareholder return (TSR).
The following summarizes the status of the Stock Option Program and the changes during the three years ending December 31, 2013:
Options (a,b) | Weighted Average Exercise Price | Weighted Average Remaining Life (years) | Aggregate Intrinsic Value (thousands) | ||||||
Outstanding at December 31, 2010 | 18,245,253 | $37.73 | 2.30 | $— | |||||
Exercised | (1,850 | ) | 32.54 | ||||||
Forfeited | (21,070 | ) | 35.21 | ||||||
Expired | (2,665,547 | ) | 35.45 | ||||||
Outstanding at December 31, 2011 | 15,556,786 | 38.13 | 1.55 | — | |||||
Granted | 2,513 | 35.94 | |||||||
Exercised | (3,200,642 | ) | 33.62 | ||||||
Expired | (3,222,597 | ) | 40.71 | ||||||
Outstanding at December 31, 2012 | 9,136,060 | 38.79 | 1.15 | 1,077 | |||||
Granted | 4,744 | 48.11 | |||||||
Exercised | (7,317,825 | ) | 38.57 | ||||||
Expired | (70,190 | ) | 37.15 | ||||||
Outstanding at December 31, 2013 | 1,752,789 | $39.80 | 0.67 | $16,175 | |||||
(a) | The table does not include Continuity Award tandem stock options described below. No fair market value is assigned to these options under ASC 718. The tandem restricted shares accompanying these options are expensed over their vesting period. |
(b) | The table includes options outstanding under an acquired company plan under which options may no longer be granted. |
PERFORMANCE SHARE PLAN
Under the Performance Share Plan (PSP), contingent awards of International Paper common stock are granted by the Committee. The PSP awards are earned over a three-year period. For the 2011 grant, one-fourth of the award is earned during each twelve-month period, with the final one-fourth segment earned over the full three-year period. Beginning with the 2012 grant, the award is earned evenly over a thirty-six-month period. PSP awards are earned based on the achievement of defined performance rankings of ROI and TSR compared to ROI and TSR peer groups of companies. Awards are weighted 75% for ROI and 25% for TSR for all participants except for officers for whom the awards are weighted 50% for ROI and 50% for TSR. The ROI component of the PSP awards is valued at the closing stock price on the day prior to the grant date. As the ROI component contains a performance condition, compensation expense, net of estimated forfeitures, is recorded over the requisite service period based on the most probable number of awards expected to vest. The TSR component of the PSP awards is valued using a Monte Carlo simulation as the TSR component contains a market condition. The Monte Carlo simulation estimates the fair value of the TSR component based on the expected term of the award, a risk-free rate, expected dividends, and the expected volatility for the Company and its competitors. The expected term is estimated based on the vesting period of the awards, the risk-free rate is based on the
88
yield on U.S. Treasury securities matching the vesting period, and the volatility is based on the Company’s historical volatility over the expected term.
PSP grants are made in performance-based restricted stock units (PSU’s). PSP awards issued to certain members of senior management are accounted for as liability awards, which are remeasured at fair value at each balance sheet date. The valuation of these PSP liability awards is computed based on the same methodology as the PSP equity awards.
The following table sets forth the assumptions used to determine compensation cost for the market condition component of the PSP plan:
Twelve Months Ended December 31, 2013 | |
Expected volatility | 25.30%-62.58% |
Risk-free interest rate | 0.13% - 0.99% |
The following summarizes PSP activity for the three years ending December 31, 2013:
Share/Units | Weighted Average Grant Date Fair Value | ||||
Outstanding at December 31, 2010 | 6,812,594 | $23.31 | |||
Granted | 4,314,376 | 28.04 | |||
Shares issued | (2,565,971 | ) | 32.43 | ||
Forfeited | (500,940 | ) | 25.07 | ||
Outstanding at December 31, 2011 | 8,060,059 | 22.83 | |||
Granted | 3,641,911 | 31.57 | |||
Shares issued | (2,871,367 | ) | 16.83 | ||
Forfeited | (169,748 | ) | 28.89 | ||
Outstanding at December 31, 2012 | 8,660,855 | 28.37 | |||
Granted | 3,148,445 | 40.76 | |||
Shares issued (a) | (3,262,760 | ) | 32.48 | ||
Forfeited | (429,051 | ) | 34.58 | ||
Outstanding at December 31, 2013 | 8,117,489 | $31.20 | |||
(a) | Includes 356,542 units related to retirements or terminations that are held for payout until the end of the performance period. |
EXECUTIVE CONTINUITY AND RESTRICTED STOCK AWARD PROGRAMS
The Executive Continuity Award program provides for the granting of tandem awards of restricted stock and/or nonqualified stock options to key executives. Grants are restricted and awards conditioned on attainment of a specified age. The awarding of a tandem stock option results in the cancellation of the related restricted shares.
The service-based Restricted Stock Award program (RSA), designed for recruitment, retention and special recognition purposes, also provides for awards of restricted stock to key employees.
The following summarizes the activity of the Executive Continuity Award program and RSA program for the three years ending December 31, 2013:
Shares | Weighted Average Grant Date Fair Value | ||||
Outstanding at December 31, 2010 | 167,500 | $26.95 | |||
Granted | 21,500 | 27.01 | |||
Shares issued | (55,083 | ) | 24.84 | ||
Forfeited | (5,000 | ) | 26.78 | ||
Outstanding at December 31, 2011 | 128,917 | 27.86 | |||
Granted | 88,715 | 31.91 | |||
Shares issued | (61,083 | ) | 27.13 | ||
Forfeited | (5,000 | ) | 28.91 | ||
Outstanding at December 31, 2012 | 151,549 | 30.49 | |||
Granted | 67,100 | 44.41 | |||
Shares issued | (88,775 | ) | 32.30 | ||
Forfeited | (17,500 | ) | 37.75 | ||
Outstanding at December 31, 2013 | 112,374 | $36.24 | |||
At December 31, 2013, 2012 and 2011 a total of 17.8 million, 19.3 million and 18.6 million shares, respectively, were available for grant under the ICP.
Stock-based compensation expense and related income tax benefits were as follows:
In millions | 2013 | 2012 | 2011 | ||||||
Total stock-based compensation expense (included in selling and administrative expense) | $ | 137 | $ | 116 | $ | 84 | |||
Income tax benefits related to stock-based compensation | 74 | 48 | 34 | ||||||
At December 31, 2013, $116 million of compensation cost, net of estimated forfeitures, related to unvested
restricted performance shares, executive continuity awards and restricted stock attributable to future performance had not yet been recognized. This amount will be recognized in expense over a weighted-average period of 1.7 years.
International Paper’s industry segments, Industrial Packaging, Printing Papers, Consumer Packaging and Distribution Businesses, are consistent with the internal structure used to manage these businesses. All segments are differentiated on a common product, common customer basis consistent with the business segmentation generally used in the Forest Products industry.
For management purposes, International Paper reports the operating performance of each business based on earnings before interest and income taxes (EBIT). Intersegment sales and transfers are recorded at current market prices.
89
External sales by major product is determined by aggregating sales from each segment based on similar products or services. External sales are defined as those that are made to parties outside International Paper’s consolidated group, whereas sales by segment in the Net Sales table are determined using a management approach and include intersegment sales.
The Company also holds a 50% interest in Ilim that is a separate reportable industry segment. The Company recorded equity earnings (losses), net of taxes, of $(46) million, $56 million and $134 million in 2013, 2012, and 2011, respectively, for Ilim.
INFORMATION BY INDUSTRY SEGMENT
Net Sales
In millions | 2013 | 2012 | 2011 | ||||||||
Industrial Packaging | $ | 14,810 | $ | 13,280 | $ | 10,430 | |||||
Printing Papers | 6,205 | 6,230 | 6,215 | ||||||||
Consumer Packaging | 3,435 | 3,170 | 3,710 | ||||||||
Distribution | 5,650 | 6,040 | 6,630 | ||||||||
Corporate and Intersegment Sales | (1,020 | ) | (887 | ) | (951 | ) | |||||
Net Sales | $ | 29,080 | $ | 27,833 | $ | 26,034 | |||||
Operating Profit
In millions | 2013 | 2012 | 2011 | ||||||||
Industrial Packaging | $ | 1,801 | $ | 1,066 | $ | 1,147 | |||||
Printing Papers | 271 | 599 | 872 | ||||||||
Consumer Packaging | 161 | 268 | 163 | ||||||||
Distribution | (389 | ) | 22 | 34 | |||||||
Operating Profit | 1,844 | 1,955 | 2,216 | ||||||||
Interest expense, net | (612 | ) | (672 | ) | (541 | ) | |||||
Noncontrolling interests / equity earnings adjustment (a) | 1 | — | 10 | ||||||||
Corporate items, net | (29 | ) | (51 | ) | (102 | ) | |||||
Restructuring and other charges | (32 | ) | (51 | ) | (82 | ) | |||||
Net gains (losses) on sales and impairments of businesses | — | 2 | — | ||||||||
Non-operating pension expense | (323 | ) | (159 | ) | (43 | ) | |||||
Earnings (Loss) From Continuing Operations Before Income Taxes and Equity Earnings | $ | 849 | $ | 1,024 | $ | 1,458 | |||||
Restructuring and Other Charges
In millions | 2013 | 2012 | 2011 | ||||||||
Industrial Packaging | $ | (2 | ) | $ | 14 | $ | 20 | ||||
Printing Papers | 118 | — | (24 | ) | |||||||
Consumer Packaging | 45 | — | 2 | ||||||||
Distribution | 32 | 44 | 49 | ||||||||
Corporate | 17 | 51 | 55 | ||||||||
Restructuring and Other Charges | $ | 210 | $ | 109 | $ | 102 | |||||
Assets
In millions | 2013 | 2012 | |||||
Industrial Packaging | $ | 15,083 | $ | 13,353 | |||
Printing Papers | 6,574 | 7,198 | |||||
Consumer Packaging | 3,222 | 3,123 | |||||
Distribution | 1,186 | 1,639 | |||||
Corporate and other (b) | 5,463 | 6,840 | |||||
Assets | $ | 31,528 | $ | 32,153 | |||
Capital Spending
In millions | 2013 | 2012 | 2011 | ||||||||
Industrial Packaging | $ | 629 | $ | 565 | $ | 426 | |||||
Printing Papers | 294 | 449 | 364 | ||||||||
Consumer Packaging | 208 | 296 | 310 | ||||||||
Distribution | 9 | 10 | 8 | ||||||||
Subtotal | 1,140 | 1,320 | 1,108 | ||||||||
Corporate and other | 58 | 63 | 51 | ||||||||
Total from Continuing Operations | $ | 1,198 | $ | 1,383 | $ | 1,159 | |||||
Depreciation, Amortization and Cost of Timber Harvested (c)
In millions | 2013 | 2012 | 2011 | ||||||||
Industrial Packaging | $ | 805 | $ | 755 | $ | 513 | |||||
Printing Papers | 446 | 450 | 486 | ||||||||
Consumer Packaging | 206 | 196 | 217 | ||||||||
Distribution | 16 | 13 | 14 | ||||||||
Corporate | 74 | 72 | 102 | ||||||||
Depreciation and Amortization | $ | 1,547 | $ | 1,486 | $ | 1,332 | |||||
External Sales By Major Product
In millions | 2013 | 2012 | 2011 | ||||||||
Industrial Packaging | $ | 14,729 | $ | 13,223 | $ | 10,376 | |||||
Printing Papers | 5,443 | 5,483 | 5,510 | ||||||||
Consumer Packaging | 3,311 | 3,146 | 3,577 | ||||||||
Distribution | 5,597 | 5,981 | 6,571 | ||||||||
Net Sales | $ | 29,080 | $ | 27,833 | $ | 26,034 | |||||
90
INFORMATION BY GEOGRAPHIC AREA
Net Sales (d)
In millions | 2013 | 2012 | 2011 | ||||||||
United States (e) | $ | 21,854 | $ | 21,523 | $ | 19,434 | |||||
EMEA | 3,284 | 2,935 | 3,183 | ||||||||
Pacific Rim and Asia | 2,112 | 1,816 | 1,807 | ||||||||
Americas, other than U.S. | 1,830 | 1,559 | 1,610 | ||||||||
Net Sales | $ | 29,080 | $ | 27,833 | $ | 26,034 | |||||
Long-Lived Assets (f)
In millions | 2013 | 2012 | |||||
United States | $ | 10,056 | $ | 10,484 | |||
EMEA | 1,126 | 1,022 | |||||
Pacific Rim and Asia | 946 | 982 | |||||
Americas, other than U.S. | 1,772 | 1,773 | |||||
Corporate | 329 | 310 | |||||
Long-Lived Assets | $ | 14,229 | $ | 14,571 | |||
(a) | Operating profits for industry segments include each segment’s percentage share of the profits of subsidiaries included in that segment that are less than wholly-owned. The pre-tax noncontrolling interests and equity earnings for these subsidiaries is added here to present consolidated earnings from continuing operations before income taxes and equity earnings. |
(b) | Includes corporate assets and assets of businesses held for sale. |
(c) | Excludes accelerated depreciation related to closure of mills. |
(d) | Net sales are attributed to countries based on the location of the seller. |
(e) | Export sales to unaffiliated customers were $2.4 billion in 2013, $2.2 billion in 2012 and $2.1 billion in 2011. |
(f) | Long-Lived Assets includes Forestlands and Plants, Properties and Equipment, net. |
On January 28, 2014, International Paper announced that its distribution solutions businesses xpedx and Unisource Worldwide, Inc. will merge under the terms of a definitive agreement that will result in the creation of a new publicly-traded company.
The transaction will be accomplished through a Reverse Morris Trust structure in which International Paper will indirectly contribute the assets of xpedx to a newly formed wholly-owned subsidiary, SpinCo, in exchange for shares of common stock of SpinCo, a special payment of $400 million, subject to adjustments, expected to be financed with new debt in SpinCo's capital structure, as well as the potential for an additional cash payment pursuant to an "earn-out" provision. International Paper will distribute shares of SpinCo to International Paper shareholders on a pro rata basis in a manner intended to be tax-free to International Paper and its shareholders.
91
In millions, except per share amounts and stock prices | 1st Quarter | 2nd Quarter | 3rd Quarter | 4th Quarter | Year | |||||||||||||||
2013 | ||||||||||||||||||||
Net sales | $ | 7,090 | $ | 7,335 | $ | 7,406 | $ | 7,249 | $ | 29,080 | ||||||||||
Gross margin (a) | 1,870 | 1,921 | 2,093 | 1,973 | 7,857 | |||||||||||||||
Earnings (loss) from continuing operations before income taxes and equity earnings | 230 | (b) | 363 | (d) | 411 | (e) | (155 | ) | (g) | 849 | (b,d,e,g) | |||||||||
Gain (loss) from discontinued operations | 26 | 24 | (10 | ) | 5 | 45 | ||||||||||||||
Net earnings (loss) attributable to International Paper Company | 318 | (b,c) | 259 | (d) | 382 | (e,f) | 436 | (g,h,i) | 1,395 | (b-i) | ||||||||||
Basic earnings (loss) per share attributable to International Paper Company common shareholders: | ||||||||||||||||||||
Earnings (loss) from continuing operations | $ | 0.66 | (b) | $ | 0.53 | (d) | $ | 0.88 | (e) | $ | 0.98 | (g) | $ | 3.05 | (b,d,e,g) | |||||
Gain (loss) from discontinued operations | 0.06 | 0.05 | (0.02 | ) | 0.01 | 0.10 | ||||||||||||||
Net earnings (loss) | 0.72 | (b,c) | 0.58 | (d) | 0.86 | (e,f) | 0.99 | (g,h,i) | 3.15 | (b-i) | ||||||||||
Diluted earnings (loss) per share attributable to International Paper Company common shareholders: | ||||||||||||||||||||
Earnings (loss) from continuing operations | 0.65 | (b) | 0.52 | (d) | 0.87 | (e) | 0.97 | (g) | 3.01 | (b,d,e,g) | ||||||||||
Gain (loss) from discontinued operations | 0.06 | 0.05 | (0.02 | ) | 0.01 | 0.10 | ||||||||||||||
Net earnings (loss) | 0.71 | (b,c) | 0.57 | (d) | 0.85 | (e,f) | 0.98 | (g,h, i) | 3.11 | (b-i) | ||||||||||
Dividends per share of common stock | 0.3000 | 0.3000 | 0.3000 | 0.3500 | 1.2500 | |||||||||||||||
Common stock prices | ||||||||||||||||||||
High | $ | 47.25 | $ | 49.10 | $ | 50.33 | $ | 49.52 | $ | 50.33 | ||||||||||
Low | 39.47 | 42.36 | 43.95 | 42.92 | 39.47 | |||||||||||||||
2012 | ||||||||||||||||||||
Net sales | $ | 6,655 | $ | 7,077 | $ | 7,026 | $ | 7,075 | $ | 27,833 | ||||||||||
Gross margin (a) | 1,671 | 1,807 | 1,886 | 1,882 | 7,246 | |||||||||||||||
Earnings (loss) from continuing operations before income taxes and equity earnings | 213 | (j) | 204 | (k) | 320 | (l) | 287 | (m) | 1,024 | (j-m) | ||||||||||
Gain from discontinued operations | 5 | 16 | 14 | 10 | 45 | |||||||||||||||
Net earnings (loss) attributable to International Paper Company | 188 | (j) | 134 | (k) | 237 | (l) | 235 | (m,n) | 794 | (j-n) | ||||||||||
Basic earnings (loss) per share attributable to International Paper Company common shareholders: | ||||||||||||||||||||
Earnings (loss) from continuing operations | $ | 0.42 | (j) | $ | 0.27 | (k) | $ | 0.51 | (l) | $ | 0.52 | (m) | $ | 1.72 | (j-m) | |||||
Gain from discontinued operations | 0.01 | 0.04 | 0.03 | 0.02 | 0.10 | |||||||||||||||
Net earnings (loss) | 0.43 | (j) | 0.31 | (k) | 0.54 | (l) | 0.54 | (m,n) | 1.82 | (j-n) | ||||||||||
Diluted earnings (loss) per share attributable to International Paper Company common shareholders: | ||||||||||||||||||||
Earnings (loss) from continuing operations | 0.42 | (j) | 0.27 | (k) | 0.51 | (l) | 0.51 | (m) | 1.70 | (j-m) | ||||||||||
Gain from discontinued operations | 0.01 | 0.04 | 0.03 | 0.02 | 0.10 | |||||||||||||||
Net earnings (loss) | 0.43 | (j) | 0.31 | (k) | 0.54 | (l) | 0.53 | (m,n) | 1.80 | (j-n) | ||||||||||
Dividends per share of common stock | 0.2625 | 0.2625 | 0.2625 | 0.3000 | 1.0875 | |||||||||||||||
Common stock prices | ||||||||||||||||||||
High | $ | 36.50 | $ | 35.59 | $ | 37.25 | $ | 39.88 | $ | 39.88 | ||||||||||
Low | 29.45 | 27.29 | 28.29 | 32.95 | 27.29 | |||||||||||||||
92
Note: Since basic and diluted earnings per share are computed independently for each period and category, full year per share amounts may not equal the sum of the four quarters.
Footnotes to Interim Financial Results
(a) | Gross margin represents net sales less cost of products sold, excluding depreciation, amortization and cost of timber harvested. |
(b) | Includes a pre-tax charge of $12 million ($8 million after taxes) for integration costs associated with the acquisition of Temple-Inland, a pre-tax charge of $44 million ($27 million after taxes) for costs associated with the permanent shutdown of a paper machine at our Augusta mill, a pre-tax charge of $6 million ($4 million after taxes) for debt extinguishment costs, a pre-tax charge of $7 million ($4 million after taxes) for costs associated with the restructuring of our xpedx operations, interest income of $6 million ($4 million after taxes) related to the closing of a U.S. federal income tax audit, and pre-tax charges of $2 million ($1 million after taxes) for other items. |
(c) | Includes a tax benefit of $93 million associated with the closing of a U.S. federal income tax audit and a net tax expense of $2 million related to internal restructurings. In addition, the first quarter tax rate includes a benefit of approximately $35 million related to the enactment into law of The American Taxpayer Relief Act of 2012 in January 2013. |
(d) | Includes a pre-tax charge of $6 million ($4 million after taxes) for an environmental reserve related to the Company's property in Cass Lake, Minnesota, a pre-tax charge of $14 million ($8 million after taxes) for integration costs associated with the acquisition of Temple-Inland, a pre-tax charge of $9 million ($5 million after taxes) to adjust the value of two Company airplanes to market value, a pre-tax gain of $30 million ($19 million after taxes) for insurance reimbursements related to the 2012 Guaranty Bank legal settlement, a pre-tax charge of $3 million ($2 million after taxes) for debt extinguishment costs, a pre-tax charge of $17 million ($10 million after taxes) for costs associated with the restructuring of our xpedx operations, a pre-tax charge of $3 million ($2 million after taxes) for costs associated with the spin-off of the xpedx operations, a gain of $13 million (before and after taxes) related to a bargain purchase adjustment on the first-quarter 2013 acquisition of a majority share of our operations in Turkey, and charges of $3 million (before and after taxes) for other items. |
(e) | Includes a pre-tax charge of $24 million ($15 million after taxes) for integration costs associated with the acquisition of Temple-Inland, a pre-tax charge of $51 million ($31 million after taxes) for costs associated with the announced shutdown of our Courtland mill, a pre-tax charge of $15 million ($9 million after taxes) for debt extinguishment costs, a pre-tax charge of $6 million ($4 million after taxes for costs associated with the restructuring of our xpedx operations, a pre-tax charge of $11 million ($7 million after taxes) for costs associated with the spin-off of the xpedx operations, a pre-tax gain of $9 million ($6 million after taxes) associated with the sale of the Bellevue box plant facility which was closed in 2010, a pre-tax charge of $1 million ($0 million after taxes) for costs associated with the divestiture of three containerboard mills in 2012 and charges of $2 million (before and after taxes) for other items. |
(f) | Includes a tax benefit of $31 million for an income tax reserve release. In addition, the third quarter tax rate includes a $30 million benefit related to the adjustment of the tax basis in certain of the Company's fixed assets. |
(g) | Includes a pre-tax charge of $12 million ($7 million after taxes) for integration costs associated with the acquisition of Temple-Inland, a pre-tax charge of $67 million ($41 million after taxes) for costs associated with the announced shutdown of our Courtland mill, a pre-tax charge of $8 million ($5 million after taxes) for costs associated with the spin-off of the xpedx operations, a pre-tax charge of $4 million ($3 million after taxes) for costs associated with the restructuring of the Asia Box operations, a pre-tax charge of $400 million ($366 million after taxes) for the impairment of goodwill in the Company's xpedx business, a pre-tax charge of $127 million ($122 million after taxes) for the impairment of goodwill and a trade name intangible asset of the Company's India Papers business, a pre- tax charge of $2 million ($1 million after taxes) for an adjustment associated with the Company's divestiture of the Shorewood operations, and a net pre-tax loss of $0 million ($1 million after taxes) for other items. |
(h) | Includes a tax benefit of $651 million associated with the closing of a U.S. federal tax audit and a net tax benefit of $3 million for other items. |
(i) | Includes pre-tax noncontrolling interest income of $4 million ($3 million after taxes) associated with the write-off of a trade name intangible asset in our India Papers business. |
93
(j) Includes a pre-tax charge of $20 million ($12 million after taxes) related to the write-up of the Temple-Inland inventories to fair value, a pre-tax charge of $21 million ($16 million after taxes) for an inventory write-off, severance and other charges related to the restructuring of the Company's xpedx operations, a pre-tax charge of $43 million ($33 million after taxes) for integration costs associated with the acquisition of Temple-Inland, a pre-tax charge of $16 million ($10 million after taxes) for early debt extinguishment costs, a pre-tax gain of $7 million ($6 million after taxes) for adjustments related to the sale of the Shorewood business, and a gain of $1 million (before and after taxes) for other items.
(k) Includes a pre-tax charge of $12 million ($8 million after taxes) for an inventory write-off, severance and other charges related to the restructuring of the Company's xpedx operations, a pre-tax charge of $35 million ($22 million after taxes) for integration costs associated with the acquisition of Temple-Inland, a pre-tax charge of $10 million ($6 million after taxes) for debt extinguishment costs, a pre-tax charge of $62 million ($38 million after taxes) to adjust the long-lived assets of the Hueneme mill in Oxnard, California to their fair value in anticipation of its divestiture, a pre-tax charge of $9 million ($5 million after taxes) for costs associated with the third-quarter 2012 divestiture of the Hueneme mill and two other containerboard mills, a pre-tax charge of $6 million ($4 million after taxes) for an adjustment related to the sale of Shorewood, and charges of $2 million (before and after taxes) for other items.
(l) | Includes a pre-tax charge of $9 million ($5 million after taxes) for an inventory write-off, severance and other charges related to the restructuring of the Company's xpedx operations, a pre-tax charge of $58 million ($34 million after taxes) for integration costs associated with the acquisition of Temple-Inland, a pre-tax charge of $13 million ($8 million after taxes) for debt extinguishment costs, a pre-tax charge of $16 million ($11 million after taxes) for costs associated with the restructuring of the Company's Packaging business in EMEA, a pre-tax charge of $19 million ($49 million after taxes) for costs associated with the containerboard mill divestitures and a pre-tax gain of $5 million ($0 million after taxes) for other items. |
(m) Includes a pre-tax charge of $28 million ($19 million after taxes) for integration costs
associated with the acquisition of Temple-Inland, a pre-tax charge of $9 million ($6 million after taxes) for debt extinguishment costs, a pre-tax charge of $7 million ($4 million after taxes) for costs associated with the restructuring of our xpedx operations, a gain of $2 million (before and after taxes) for proceeds associated with the 2010 sale of the Arizona Chemical business, a gain of $2 million (before and after taxes) for adjustments related to the sale of the Company's Shorewood operations, a charge of $1 million (before and after taxes) for costs associated with the containerboard mill divestitures, and pre-tax charges of $5 million ($4 million after taxes) for other items.
(n) Includes a net expense of $14 million related to internal restructurings and a $5 million expense to adjust deferred tax assets related to post-retirement prescription drug coverage (Medicare Part D reimbursements).
94
None.
EVALUATION OF CONTROLS AND PROCEDURES
We maintain disclosure controls and procedures that are designed to ensure that information required to be disclosed by us in the reports we file or submit under the Securities and Exchange Act of 1934, as amended (the “Exchange Act”), is recorded, processed, summarized and reported within the time periods specified in the SEC’s rules and forms, and that such information is accumulated and communicated to management, including our principal executive officer and principal financial officer, as appropriate, to allow timely decisions regarding required disclosure. As of December 31, 2013, an evaluation was carried out under the supervision and with the participation of the Company’s management, including our principal executive officer and principal financial officer, of the effectiveness of our disclosure controls and procedures, as defined by Rule 13a-15 under the Exchange Act. Based upon this evaluation, our principal executive officer and principal financial officer have concluded that the Company’s disclosure controls and procedures were effective as of December 31, 2013.
MANAGEMENT’S REPORT ON INTERNAL CONTROL OVER FINANCIAL REPORTING
Our management is responsible for establishing and maintaining adequate internal control over our financial reporting. Internal control over financial reporting is the process designed by, or under the supervision of, our principal executive officer and principal financial officer, and effected by our Board of Directors, management and other personnel, to provide reasonable assurance regarding the reliability of financial reporting and the preparation of financial statements for external purposes in accordance with accounting principles generally accepted in the United States (GAAP). Our internal control over financial reporting includes those policies and procedures that:
• | pertain to the maintenance of records that, in reasonable detail, accurately and fairly reflect the transactions and dispositions of our assets; |
• | provide reasonable assurance that transactions are recorded as necessary to allow for the preparation of financial statements in accordance with GAAP, and that our receipts and expenditures are being made only in accordance with authorizations of our management and directors; |
• | provide reasonable assurance regarding prevention or timely detection of unauthorized acquisition, use or disposition of our assets that could have a material effect on our consolidated financial statements; and |
• | provide reasonable assurance as to the detection of fraud. |
All internal control systems have inherent limitations, including the possibility of circumvention and overriding of controls, and therefore can provide only reasonable assurance of achieving the designed control objectives. The Company’s internal control system is supported by written policies and procedures, contains self-monitoring mechanisms, and is audited by the internal audit function. Appropriate actions are taken by management to correct deficiencies as they are identified.
As of December 31, 2013, management has assessed the effectiveness of the Company’s internal control over financial reporting. In a report included on pages 45 and 46, management concluded that the Company’s internal control over financial reporting was effective as of December 31, 2013.
In making this assessment, we used the criteria described in “Internal Control – Integrated Framework (1992)” issued by the Committee of Sponsoring Organizations of the Treadway Commission.
Our independent registered public accounting firm, Deloitte & Touche LLP, with direct access to our Board of Directors through our Audit and Finance Committee, has audited the consolidated financial statements prepared by us. Their report on the consolidated financial statements is included in Part II, Item 8 of this Annual Report under the heading “Financial Statements and Supplementary Data”. Deloitte & Touche LLP has issued an attestation report on our internal control over financial reporting.
95
MANAGEMENT’S PROCESS TO ASSESS THE EFFECTIVENESS OF INTERNAL CONTROL OVER FINANCIAL REPORTING
To comply with the requirements of Section 404 of the Sarbanes-Oxley Act of 2002, we followed a comprehensive compliance process across the enterprise to evaluate our internal control over financial reporting, engaging employees at all levels of the organization. Our internal control environment includes an enterprise-wide attitude of integrity and control consciousness that establishes a positive “tone at the top.” This is exemplified by our ethics program that includes long-standing principles and policies on ethical business conduct that require employees to maintain the highest ethical and legal standards in the conduct of our business, which have been distributed to all employees; a toll-free telephone helpline whereby any employee may report suspected violations of law or our policy; and an office of ethics and business practice. The internal control system further includes careful selection and training of supervisory and management personnel, appropriate delegation of authority and division of responsibility, dissemination of accounting and business policies throughout the Company, and an extensive program of internal audits with management follow-up. Our Board of Directors, assisted by the Audit and Finance Committee, monitors the integrity of our financial statements and financial reporting procedures, the performance of our internal audit function and independent auditors, and other matters set forth in its charter. The Committee, which currently consists of four independent directors, meets regularly with representatives of management, and with the independent auditors and the Internal Auditor, with and without management representatives in attendance, to review their activities.
CHANGES IN INTERNAL CONTROL OVER FINANCIAL REPORTING
There have been no changes in our internal control over financial reporting during the quarter ended December 31, 2013 that have materially affected, or are reasonably likely to materially affect, our internal control over financial reporting.
The Company completed the acquisitions of Olmuksan and Orsa IP, both in January 2013. Due to the timing of these acquisitions we have excluded Olmuksan and Orsa IP from our evaluation of the effectiveness of internal control over financial reporting. For the period ended December 31, 2013, net sales and assets of both Olmuksan and Orsa IP represented approximately 2% of total net sales and 2% of total assets.
On February 27, 2014, the Management Development and Compensation Committee (the “Committee”) of the
Board of Directors of International Paper Company approved certain changes to the Company’s retirement plans in which the Company’s named executive officers participate: the Retirement Plan of International Paper Company, as amended and restated January 1, 2010, the International Paper Company Pension Restoration Plan for Salaried Employees, as amended and restated effective January 1, 2009, and the International Paper Company Unfunded Supplemental Retirement Plan for Senior Managers, as amended and restated effective January 1, 2008 (collectively, the “Retirement Plans”). In particular, credited service and compensation will be capped under the Retirement Plans for salaried employees, including the named executive officers, beginning January 1, 2019.
Information concerning our directors is hereby incorporated by reference to our definitive proxy statement that will be filed with the Securities and Exchange Commission (SEC) within 120 days of the close of our fiscal year. The Audit and Finance Committee of the Board of Directors has at least one member who is a financial expert, as that term is defined in Item 401(d)(5) of Regulation S-K. Further information concerning the composition of the Audit and Finance Committee and our audit committee financial experts is hereby incorporated by reference to our definitive proxy statement that will be filed with the SEC within 120 days of the close of our fiscal year. Information with respect to our executive officers is set forth on pages 6 and 7 in Part I of this Form 10-K under the caption, “Executive Officers of the Registrant.”
Executive officers of International Paper are elected to hold office until the next annual meeting of the Board of Directors following the annual meeting of shareholders and, until the election of successors, subject to removal by the Board.
The Company’s Code of Business Ethics (Code) is applicable to all employees of the Company, including the chief executive officer and senior financial officers, as well as the Board of Directors. We disclose any amendments to our Code and any waivers from a provision of our Code granted to our directors, chief executive officer and senior financial officers on our Internet Web site within four business days following such amendment or waiver. To date, no waivers of the Code have been granted.
We make available free of charge on our Internet Web site at www.internationalpaper.com, and in print to any shareholder who requests them, our Corporate Governance Principles, our Code of Business Ethics and the Charters of our Audit and Finance Committee, Management Development and Compensation
96
Committee, Governance Committee and Public Policy and Environment Committee. Requests for copies may be directed to the corporate secretary at our corporate headquarters.
Information with respect to compliance with Section 16(a) of the Securities and Exchange Act and our corporate governance is hereby incorporated by reference to our definitive proxy statement that will be filed with the SEC within 120 days of the close of our fiscal year.
Information with respect to the compensation of executives and directors of the Company is hereby incorporated by reference to our definitive proxy statement that will be filed with the SEC within 120 days of the close of our fiscal year.
A description of the security ownership of certain beneficial owners and management and equity compensation plan information is hereby incorporated by reference to our definitive proxy statement that will be filed with the SEC within 120 days of the close of our fiscal year.
A description of certain relationships and related transactions is hereby incorporated by reference to our definitive proxy statement that will be filed with the SEC within 120 days of the close of our fiscal year.
Information with respect to fees paid to, and services rendered by, our principal accountant, and our policies and procedures for pre-approving those services, is hereby incorporated by reference to our definitive proxy statement that will be filed with the SEC within 120 days of the close of our fiscal year.
(1) | Financial Statements – See Item 8. Financial Statements and Supplementary Data. |
(2) | Financial Statement Schedules – The following additional financial data should be read in conjunction with the consolidated financial |
statements in Item 8. Schedules not included with this additional financial data have been omitted because they are not applicable, or the required information is shown in the consolidated financial statements or the notes thereto.
2013, 2012 and 2011
Consolidated Schedule: II-Valuation and Qualifying Accounts. | 101 | |
(2.1 | ) | Agreement and Plan of Merger, dated as of January 28, 2014, among International Paper Company, xpedx Holding Company, xpedx Intermediate, LLC, xpedx, LLC, UWW Holdings, LLC, UWW Holdings, Inc. and Unisource Worldwide, Inc. (incorporated by reference to Exhibit 2.1 to the Company's Current Report on Form 8-K dated February 3, 2014). |
(2.2 | ) | Contribution and Distribution Agreement, dated as of January 28, 2014, among International Paper Company, xpedx Holding Company, UWW Holdings, Inc. and solely for purposes of Article VI and Article X, UWW Holdings, LLC (incorporated by reference to Exhibit 2.2 to the Company's Current Report on Form 8-K dated February 3, 2014). |
(3.1 | ) | Restated Certificate of Incorporation of International Paper Company (incorporated by reference to Exhibit 3.1 to the Company’s Current Report on Form 8-K dated May 13, 2013). |
(3.2 | ) | By-laws of International Paper Company, as amended through May 17, 2013 (incorporated by reference to Exhibit 3.2 to the Company’s Current Report on Form 8-K dated May 13, 2013). |
(4.1 | ) | Indenture, dated as of April 12, 1999, between International Paper and The Bank of New York, as Trustee (incorporated by reference to Exhibit 4.1 to the Company’s Current Report on Form 8-K dated June 29, 2000). |
(4.2 | ) | Supplemental Indenture (including the form of Notes), dated as of June 4, 2008, between International Paper Company and The Bank of New York, as Trustee (incorporated by reference to Exhibit 4.1 to the Company’s Current Report on Form 8-K dated June 4, 2008). |
(4.3 | ) | Supplemental Indenture (including the form of Notes), dated as of May 11, 2009, between International Paper Company and The Bank of New York Mellon, as trustee (incorporated by reference to Exhibit 4.1 to the Company's Current Report on Form 8-K dated May 11, 2009). |
97
(4.4 | ) | Supplemental Indenture (including the form of Notes), dated as of August 10, 2009, between International Paper Company and The Bank of New York Mellon, as trustee (incorporated by reference to Exhibit 4.1 to the Company's Current Report on Form 8-K dated August 10, 2009). |
(4.5 | ) | Supplemental Indenture (including the form of Notes), dated as of December 7, 2009, between International Paper Company and The Bank of New York Mellon Trust Company, N.A., as trustee (incorporated by reference to Exhibit 4.1 to the Company's Current Report on Form 8-K dated December 7, 2009). |
(4.6 | ) | Supplemental Indenture (including the form of Notes), dated as of November 16, 2011, between the Company and The Bank of New York Mellon Trust Company, N.A., as trustee (incorporated by reference to Exhibit 4.1 to the Company's Current Report on Form 8-K dated November 16, 2011). |
(4.7 | ) | In accordance with Item 601 (b) (4) (iii) (A) of Regulation S-K, certain instruments respecting long-term debt of the Company have been omitted but will be furnished to the Commission upon request. |
(10.1 | ) | Amended and Restated 2009 Incentive Compensation Plan (the "LTICP") (incorporated by reference to Exhibit 99.1 to the Company's Current Report on Form 8-K dated February 10, 2014). + |
(10.2 | ) | 2013 Management Incentive Plan (incorporated by reference to Exhibit 10.3 to the Company’s Annual Report on Form 10-K for the fiscal year ended December 31, 2012). + |
(10.3 | ) | 2014 Management Incentive Plan. * + |
(10.4 | ) | 2009 Executive Management Incentive Plan (incorporated by reference to Exhibit 10.2 to the Company's Current Report on Form 8-K dated May 12, 2009). + |
(10.5 | ) | 2013 Exhibits to the 2009 Executive Management Incentive Plan (incorporated by reference to Exhibit 10.6 to the Company’s Annual Report on Form 10-K for the fiscal year ended December 31, 2012). + |
(10.6 | ) | 2014 Exhibits to the 2009 Executive Management Incentive Plan.*+ |
(10.7 | ) | Restricted Stock and Deferred Compensation Plan for Non-Employee Directors, Amended and Restated as of May 10, 2010 (incorporated by reference to Exhibit 10.1 to the Company’s Quarterly Report on Form 10-Q for the quarter ended June 30, 2010). + |
(10.08 | ) | Form of Restricted Stock Award Agreement. * + |
(10.09 | ) | Form of Restricted Stock Unit Award Agreement (cash settled). * + |
(10.10 | ) | Form of Restricted Stock Unit Award Agreement (stock settled). * + |
(10.11 | ) | Form of Performance Share Plan award certificate. * + |
(10.12 | ) | Pension Restoration Plan for Salaried Employees (incorporated by reference to Exhibit 10.1 to the Company’s Quarterly Report on Form 10-Q for the quarter ended March 31, 2009). + |
(10.13 | ) | Unfunded Supplemental Retirement Plan for Senior Managers, as amended and restated effective January 1, 2008 (incorporated by reference to Exhibit 10.21 to the Company’s Annual Report on Form 10-K for the fiscal year ended December 31, 2007). + |
(10.14 | ) | Amendment No. 1 to the International Paper Company Unfunded Supplemental Retirement Plan for Senior Managers, effective October 13, 2008 (incorporated by reference to Exhibit 10.3 to the Company’s Current Report on Form 8-K dated October 17, 2008). + |
(10.15 | ) | Amendment No. 2 to the International Paper Company Unfunded Supplemental Retirement Plan for Senior Managers, effective October 14, 2008 (incorporated by reference to Exhibit 10.5 to the Company’s Current Report on Form 8-K dated October 17, 2008). + |
(10.16 | ) | Amendment No. 3 to the International Paper Company Unfunded Supplemental Retirement Plan for Senior Managers, effective December 8, 2008 (incorporated by reference to Exhibit 10.20 to the Company’s Annual Report on Form 10-K for the fiscal year ended December 31, 2008). + |
(10.17 | ) | Amendment No. 4 to the International Paper Company Unfunded Supplemental Retirement Plan for Senior Managers, effective January 1, 2009 (incorporated by reference to Exhibit 10.1 to the Company’s Quarterly Report on Form 10-Q for the quarter ended September 30, 2009). + |
98
(10.18 | ) | Amendment No. 5 to the International Paper Company Unfunded Supplemental Retirement Plan for Senior Managers, effective October 31, 2009 (incorporated by reference to Exhibit 10.17 to the Company’s Annual Report on Form 10-K for the fiscal year ended December 31, 2009). + |
(10.19 | ) | Amendment No. 6 to the International Paper Company Unfunded Supplemental Retirement Plan for Senior Managers, effective January 1, 2012 (incorporated by reference to Exhibit 10.21 to the Company's Annual Report on Form 10-K for the fiscal year ended December 31, 2011). + |
(10.20 | ) | Form of Non-Competition Agreement, entered into by certain Company employees (including named executive officers) who have received restricted stock (incorporated by reference to Exhibit 10.22 to the Company’s Annual Report on Form 10-K for the fiscal year ended December 31, 2008). + |
(10.21 | ) | Form of Non-Solicitation Agreement, entered into by certain Company employees (including named executive officers) who have received restricted stock (incorporated by reference to Exhibit 10.5 to the Company’s Quarterly Report on Form 10-Q for the quarter ended March 31, 2006). + |
(10.22 | ) | Form of Change-in-Control Agreement - Tier I, for the Chief Executive Officer and all "grandfathered" senior vice presidents elected prior to 2012 (all named executive officers) - approved September 2013 (incorporated by reference to Exhibit 10.1 to the Company’s Quarterly Report on Form 10-Q for the quarter ended September 30, 2013). + |
(10.23 | ) | Form of Change-in-Control Agreement - Tier II, for all future senior vice presidents and all "grandfathered" vice presidents elected prior to February 2008 - approved September 2013 (incorporated by reference to Exhibit 10.2 to the Company’s Quarterly Report on Form 10-Q for the quarter ended September 30, 2013). + |
(10.24 | ) | Form of Indemnification Agreement for Directors (incorporated by reference to Exhibit 10.13 to the Company’s Annual Report on Form 10-K for the fiscal year ended December 31, 2003). + |
(10.25 | ) | Board Policy on Severance Agreements with Senior Executives (incorporated by reference to Exhibit 10.1 to the Company’s Current Report on Form 8-K filed on October 18, 2005). + |
(10.26 | ) | Board Policy on Change of Control Agreements (incorporated by reference to Exhibit 10.2 to the Company’s Current Report on Form 8-K filed on October 18, 2005). + |
(10.27 | ) | Amended and Restated Time Sharing Agreement, dated May 31, 2012, by and between John V. Faraci and International Paper Company (incorporated by reference to Exhibit 10.1 to the Company’s Quarterly Report on Form 10-Q for the quarter ended June 30, 2012). + |
(10.28 | ) | Five-Year Credit Agreement dated as of August 26, 2011, among International Paper Company, JPMorgan Chase Bank, N.A., individually and as administrative agent, and certain lenders (incorporated by reference to Exhibit 99.1 to the Company’s Current Report on Form 8-K dated August 26, 2011). |
(10.29 | ) | IP Debt Security, dated December 7, 2006, issued by International Paper Company to Basswood Forests LLC (incorporated by reference to Exhibit 4.1 to the Company’s Current Report on Form 8-K dated December 13, 2006). |
(10.30 | ) | IP Hickory Note, dated December 7, 2006, issued by International Paper Company to Hickory Forests LLC (incorporated by reference to Exhibit 4.2 to the Company’s Current Report on Form 8-K dated December 13, 2006). |
(10.31 | ) | Credit Agreement, dated as of February 13, 2012, by and among the Company, UBS AG, Stamford Branch, as administrative agent; BNP Paribas Securities Corp., as syndication agent; Deutsche Bank Securities Inc., HSBC Securities (USA) Inc. and The Royal Bank of Scotland PLC, as co-documentation agents; UBS Securities LLC, BNP Paribas Securities Corp., CoBank, ACB, Deutsche Bank Securities Inc., HSBC Securities (USA) Inc. and RBS Securities Inc., as joint lead arrangers; and the lenders party thereto (incorporated by reference to Exhibit 10.1 to the Company’s Current Report on Form 8-K dated February 13, 2012). |
(10.32 | ) | Loan Agreement dated December 3, 2007, by and among TIN Land Financing, LLC, Citibank, N.A., Citicorp North America, Inc., as Agent, and the other Lenders named therein (incorporated by reference to Exhibit 10.1 to Temple-Inland's Current Report on Form 8-K filed with the Commission on December 4, 2007). |
99
(10.33 | ) | Amendment No. 1 dated August 11, 2011 to Loan Agreement dated December 3, 2007, by and among TIN Land Financing, LLC, Citibank, N.A., Citicorp North America, Inc., as Agent, and the other Lenders named therein (incorporated by reference to Exhibit 10.1 to Temple-Inland's Quarterly Report on Form 10-Q for the quarter ended October 1, 2011, and filed with the Commission on November 7, 2011). |
(10.34 | ) | Loan Agreement dated December 3, 2007, by and among TIN Timber Financing, LLC, Citibank, N.A., Citicorp North America, Inc., as Agent, and the other Lenders named therein (incorporated by reference to Exhibit 10.2 to Temple-Inland's Current Report on Form 8-K filed with the Commission on December 4, 2007). |
(10.35 | ) | Amendment No. 1 dated August 11, 2011 to Loan Agreement dated December 3, 2007, by and among TIN Timber Financing, LLC, Citibank, N.A., Citicorp North America, Inc., as Agent, and the other Lenders named therein (incorporated by reference to Exhibit 10.2 to Temple-Inland's Quarterly Report on Form 10-Q for the quarter ended October 1, 2011, and filed with the Commission on November 7, 2011). |
(10.36 | ) | Form of Timber Note Receivable (incorporated by reference to Exhibit 10.1 to Temple-Inland's Quarterly Report on Form 10-Q for the quarter ended July 3, 2010, and filed with the Commission on August 9, 2010).The Company agrees to furnish supplementally a copy of any omitted schedule or exhibit to the staff of the Securities and Exchange Commission upon request. |
(10.37 | ) | Form of Letter of Credit (incorporated by reference to Exhibit 10.2 to Temple-Inland's Quarterly Report on Form 10-Q for the quarter ended July 3, 2010, and filed with the Commission on August 9, 2010). |
(10.38 | ) | Commitment Letter, dated January 28, 2014, by and among xpedx Holding Company, Bank of America, N.A., Merrill Lynch, Pierce, Fenner & Smith Incorporated, Wells Fargo Bank, N.A., SunTrust Bank and SunTrust Robinson Humphrey, Inc. (incorporated by reference to Exhibit 2.3 to the Company's Current Report on Form 8-K dated February 3, 2014). |
(11 | ) | Statement of Computation of Per Share Earnings.* |
(12 | ) | Computation of Ratio of Earnings to Fixed Charges and Preferred Stock Dividends. * |
(21 | ) | List of Subsidiaries of Registrant. * |
(23 | ) | Consent of Independent Registered Public Accounting Firm. * |
(24 | ) | Power of Attorney (contained on the signature page to the Company’s Annual Report on Form 10-K for the year ended December 31, 2013). |
(31.1 | ) | Certification by John V. Faraci, Chairman and Chief Executive Officer, pursuant to Section 302 of the Sarbanes-Oxley Act of 2002. * |
(31.2 | ) | Certification by Carol L. Roberts, Chief Financial Officer, pursuant to Section 302 of the Sarbanes-Oxley Act of 2002. * |
(32 | ) | Certification pursuant to 18 U.S.C. Section 1350, as adopted pursuant to Section 906 of the Sarbanes-Oxley Act of 2002.* |
(101.INS) | XBRL Instance Document * | |
(101.SCH) | XBRL Taxonomy Extension Schema * | |
(101.CAL) | XBRL Taxonomy Extension Calculation Linkbase * | |
(101.DEF) | XBRL Taxonomy Extension Definition Linkbase * | |
(101.LAB) | XBRL Taxonomy Extension Label Linkbase * | |
(101.PRE) | XBRL Extension Presentation Linkbase * | |
+ Management contract or compensatory plan or arrangement.
* Filed herewith
100
INTERNATIONAL PAPER COMPANY AND CONSOLIDATED SUBSIDIARIES
SCHEDULE II – VALUATION AND QUALIFYING ACCOUNTS
(In millions)
For the Year Ended December 31, 2013 | |||||||||||||||||
Balance at Beginning of Period | Additions Charged to Earnings | Additions Charged to Other Accounts | Deductions from Reserves | Balance at End of Period | |||||||||||||
Description | |||||||||||||||||
Reserves Applied Against Specific Assets Shown on Balance Sheet: | |||||||||||||||||
Doubtful accounts – current | $ | 119 | $ | 45 | $ | — | (55)(a) | $ | 109 | ||||||||
Restructuring reserves | 19 | 63 | — | (30)(b) | 52 | ||||||||||||
For the Year Ended December 31, 2012 | |||||||||||||||||
Balance at Beginning of Period | Additions Charged to Earnings | Additions Charged to Other Accounts | Deductions from Reserves | Balance at End of Period | |||||||||||||
Description | |||||||||||||||||
Reserves Applied Against Specific Assets Shown on Balance Sheet: | |||||||||||||||||
Doubtful accounts – current | $ | 126 | $ | 17 | $ | — | (24)(a) | $ | 119 | ||||||||
Restructuring reserves | 15 | 31 | — | (27)(b) | 19 | ||||||||||||
For the Year Ended December 31, 2011 | |||||||||||||||||
Balance at Beginning of Period | Additions Charged to Earnings | Additions Charged to Other Accounts | Deductions from Reserves | Balance at End of Period | |||||||||||||
Description | |||||||||||||||||
Reserves Applied Against Specific Assets Shown on Balance Sheet: | |||||||||||||||||
Doubtful accounts – current | $ | 129 | $ | 18 | $ | — | (21)(a) | $ | 126 | ||||||||
Restructuring reserves | 14 | 25 | — | (24)(b) | 15 | ||||||||||||
(a) | Includes write-offs, less recoveries, of accounts determined to be uncollectible and other adjustments. |
(b) | Includes payments and deductions for reversals of previously established reserves that were no longer required. |
101
Pursuant to the requirements of Section 13 or 15(d) of the Securities Act of 1934, the Registrant has duly caused this report to be signed on its behalf by the undersigned, thereunto duly authorized.
INTERNATIONAL PAPER COMPANY
February 27, 2014 | |||
By: | /S/ SHARON R. RYAN | ||
Sharon R. Ryan | |||
Senior Vice President, General Counsel and Corporate Secretary | |||
POWER OF ATTORNEY
KNOW ALL MEN BY THESE PRESENTS, that each person whose signature appears below constitutes and appoints Sharon R. Ryan and Deon Vaughan as his or her true and lawful attorney-in-fact and agent, acting alone, with full power of substitution and resubstitution for him or her and in his or her name, place and stead, in any and all capacities, to sign any or all amendments to this annual report on Form 10-K, and to file the same, with all exhibits thereto and other documents in connection therewith, with the Securities and Exchange Commission, granting unto said attorney-in-fact full power and authority to do and perform each and every act and thing requisite or necessary to be done, hereby ratifying and confirming all that said attorney-in-fact and agent, or her substitute or substitutes, may lawfully do or cause to be done by virtue hereof.
Pursuant to the requirements of the Securities Exchange Act of 1934, this report has been signed below by the following persons on behalf of the registrant and in the capacities and on the dates indicated:
102
Signature | Title | Date | ||
/S/ JOHN V. FARACI | Chairman of the Board, Chief Executive Officer and Director | February 27, 2014 | ||
John V. Faraci | ||||
/S/ DAVID J. BRONCZEK | Director | February 27, 2014 | ||
David J. Bronczek | ||||
/S/ AHMET C. DORDUNCU | Director | February 27, 2014 | ||
Ahmet C. Dorduncu | ||||
/S/ ILENE S. GORDON | Director | February 27, 2014 | ||
Ilene S. Gordon | ||||
/S/ JAY L. JOHNSON | Director | February 27, 2014 | ||
Jay L. Johnson | ||||
/S/ STACEY J. MOBLEY | Director | February 27, 2014 | ||
Stacey J. Mobley | ||||
/S/ JOAN E. SPERO | Director | February 27, 2014 | ||
Joan E. Spero | ||||
/S/ JOHN L. TOWNSEND III | Director | February 27, 2014 | ||
John L. Townsend III | ||||
/S/ JOHN F. TURNER | Director | February 27, 2014 | ||
John F. Turner | ||||
/S/ WILLIAM G. WALTER | Director | February 27, 2014 | ||
William G. Walter | ||||
/S/ J. STEVEN WHISLER | Director | February 27, 2014 | ||
J. Steven Whisler | ||||
/S/ CAROL L. ROBERTS | Senior Vice President and Chief Financial Officer | February 27, 2014 | ||
Carol L. Roberts | ||||
/S/ TERRI L. HERRINGTON | Vice President – Finance and Controller | February 27, 2014 | ||
Terri L. Herrington | ||||
103
2013 LISTING OF FACILITIES
(all facilities are owned except noted otherwise)
PRINTING PAPERS | Nova Campina, São Paulo, Brazil | Tampa, Florida leased | ||
Paulinia, São Paulo, Brazil | Columbus, Georgia | |||
Uncoated Papers and Pulp | Yanzhou City, China | Forest Park, Georgia | ||
U.S.: | Veracruz, Mexico | Griffin, Georgia | ||
Courtland, Alabama | Kenitra, Morocco | Kennesaw, Georgia leased | ||
Selma, Alabama (Riverdale Mill) | Edirne, Turkey | Lithonia, Georgia | ||
Cantonment, Florida (Pensacola Mill) | Corum, Turkey | Savannah, Georgia | ||
Ticonderoga, New York | Tucker, Georgia | |||
Riegelwood, North Carolina | Corrugated Container | Aurora, Illinois (2 locations) | ||
Eastover, South Carolina | U.S.: | Bedford Park, Illinois (2 locations) 1 leased | ||
Georgetown, South Carolina | Bay Minette, Alabama | Belleville, Illinois | ||
Sumter, South Carolina | Decatur, Alabama | Carroll Stream, Illinois | ||
Franklin, Virginia | Dothan, Alabama leased | Chicago, Illinois (2 locations) | ||
Huntsville, Alabama | Des Plaines, Illinois | |||
International: | Bentonville, Arkansas | Elgin, Illinois | ||
Luiz Antônio, São Paulo, Brazil | Conway, Arkansas | Lincoln, Illinois | ||
Mogi Guacu, São Paulo, Brazil | Fort Smith, Arkansas (2 locations) | Montgomery, Illinois | ||
Três Lagoas, Mato Grosso do Sul, Brazil | Russellville, Arkansas (2 locations) | Northlake, Illinois | ||
Saillat, France | Tolleson, Arizona | Rockford, Illinois | ||
Kadiam, India | Yuma, Arizona | Butler, Indiana | ||
Rajahmundry, India | Anaheim, California | Crawfordsville, Indiana | ||
Kwidzyn, Poland | Bell, California | Evansville, Indiana (1) | ||
Svetogorsk, Russia | Buena Park, California leased | Fort Wayne, Indiana | ||
Camarillo, California | Hammond, Indiana | |||
INDUSTRIAL PACKAGING | Carson, California | Indianapolis, Indiana (2 locations) | ||
Cerritos, California leased | Saint Anthony, Indiana | |||
Containerboard | Compton, California | Tipton, Indiana | ||
U.S.: | El Centro, California (4) | Cedar Rapids, Iowa | ||
Pine Hill, Alabama | Elk Grove, California | Waterloo, Iowa | ||
Prattville, Alabama | Exeter, California | Garden City, Kansas | ||
Cantonment, Florida (Pensacola Mill) | Gilroy, California (2 locations) 2 leased | Kansas City, Kansas (3) | ||
Rome, Georgia | Los Angeles, California (leased) | Bowling Green, Kentucky | ||
Savannah, Georgia | Modesto, California | Lexington, Kentucky | ||
Cayuga, Indiana | Ontario, California | Louisville, Kentucky | ||
Cedar Rapids, Iowa | Salinas, California | Walton, Kentucky | ||
Henderson, Kentucky | Sanger, California | Lafayette, Louisiana | ||
Maysville, Kentucky | San Leandro, California leased | Bogalusa, Louisiana | ||
Bogalusa, Louisiana | Santa Fe Springs, California (2 locations) 1 leased | Shreveport, Louisiana | ||
Campti, Louisiana | Stockton, California | Springhill, Louisiana | ||
Mansfield, Louisiana | Tracy, California | Auburn, Maine | ||
Vicksburg, Mississippi | Golden, Colorado | Three Rivers, Michigan | ||
Valliant, Oklahoma | Wheat Ridge, Colorado | Arden Hills, Minnesota | ||
Springfield, Oregon | Putnam, Connecticut | Austin, Minnesota | ||
Orange, Texas | Jacksonville, Florida leased (3) | Fridley, Minnesota | ||
Lake Wales, Florida (2) | Minneapolis, Minnesota leased | |||
International: | Orlando, Florida | Shakopee, Minnesota | ||
Franco da Rocha, São Paulo, Brazil | Plant City, Florida | White Bear Lake, Minnesota | ||
A-1
Houston, Mississippi | Lancaster, Pennsylvania | Shenyang, China | ||
Jackson, Mississippi | Littlestown, Pennsylvania | Suzhou, China | ||
Magnolia, Mississippi leased | Mount Carmel, Pennsylvania | Tianjin, China (2 locations) | ||
Olive Branch, Mississippi | Georgetown, South Carolina | Wuhan, China | ||
Fenton, Missouri | Laurens, South Carolina | Arles, France | ||
Kansas City, Missouri | Lexington, South Carolina | Chalon-sur-Saone, France | ||
Maryland Heights, Missouri | Ashland City, Tennessee leased | Creil, France | ||
North Kansas City, Missouri leased | Cleveland, Tennessee | LePuy, France (Espaly Box Plant) | ||
St. Joseph, Missouri | Elizabethton, Tennessee leased | Mortagne, France | ||
St. Louis, Missouri | Morristown, Tennessee | Guadeloupe, French West Indies | ||
Omaha, Nebraska | Murfreesboro, Tennessee | Batam, Indonesia | ||
Barrington, New Jersey | Amarillo, Texas | Bellusco, Italy | ||
Bellmawr, New Jersey | Carrollton, Texas (2 locations) | Catania, Italy | ||
Milltown, New Jersey | Edinburg, Texas (2 locations) | Pomezia, Italy | ||
Spotswood, New Jersey | El Paso, Texas | San Felice, Italy | ||
Thorofare, New Jersey | Ft. Worth, Texas leased | Kuala Lumpur, Malaysia | ||
Binghamton, New York | Grand Prairie, Texas | Juhor, Malaysia | ||
Buffalo, New York | Hidalgo, Texas | Ixtaczoquitlan, Mexico | ||
Rochester, New York | McAllen, Texas | Juarez, Mexico leased | ||
Scotia, New York | San Antonio, Texas (2 locations) | Los Mochis, Mexico | ||
Utica, New York | Sealy, Texas | Puebla, Mexico leased | ||
Charlotte, North Carolina (2 locations) | Lynchburg, Virginia | Reynosa, Mexico | ||
1 leased | Petersburg, Virginia | San Jose Iturbide, Mexico | ||
Lumberton, North Carolina | Richmond, Virginia | Santa Catarina, Mexico | ||
Manson, North Carolina | Moses Lake, Washington | Silao, Mexico | ||
Newton, North Carolina | Olympia, Washington | Tijuana, Mexico (2 locations) | ||
Statesville, North Carolina | Yakima, Washington | Villa Nicolas Romero, Mexico | ||
Byesville, Ohio | Fond du Lac, Wisconsin | Zapopan, Mexico | ||
Delaware, Ohio | Manitowoc, Wisconsin | Agadir, Morocco | ||
Eaton, Ohio | Casablanca, Morocco | |||
Kenton, Ohio | International: | Kenitra, Morocco | ||
Madison, Ohio | Manaus, Amazonas, Brazil | Monterrey, Nuevo Leon leased | ||
Marion, Ohio | Paulinia, São Paulo, Brazil | Singapore, Singapore | ||
Middletown, Ohio | Rio Verde, Goias, Brazil | Alcala, Spain leased (3) | ||
Mt. Vernon, Ohio | Suzano, São Paulo, Brazil | Almeria, Spain | ||
Newark, Ohio | Las Palmas, Canary Islands | Barcelona, Spain | ||
Streetsboro, Ohio | Tenerife, Canary Islands | Bilbao, Spain | ||
Wooster, Ohio | Rancagua, Chile | Gandia, Spain | ||
Oklahoma City, Oklahoma | Baoding, China | Madrid, Spain | ||
Beaverton, Oregon (2 locations) | Beijing, China (2 locations) | Valladolid, Spain | ||
Hillsboro, Oregon | Chengdu, China | Bangkok, Thailand | ||
Portland, Oregon | Dalian, China | Adana, Turkey | ||
Salem, Oregon leased | Dongguan, China | Bursa, Turkey | ||
Biglerville, Pennsylvania | Guangzhou, China (2 locations) | Corlu, Turkey | ||
Eighty-four, Pennsylvania | Huhot, China | Corum, Turkey | ||
Hazleton, Pennsylvania | Nanjing China | Gebze, Turkey | ||
Kennett Square, Pennsylvania | Shanghai, China (2 locations) | Izmir, Turkey | ||
A-2
Recycling | Riegelwood, North Carolina | BUILDING PRODUCTS (5) | ||
U.S.: | Hazelton, Pennsylvania | U.S.: | ||
Phoenix, Arizona leased | (C & D Center) | Monroeville, Alabama | ||
Fremont, California leased | Prosperity, South Carolina | El Dorado, Arkansas (owned by Del-Tin Fiber L.L.C) | ||
Norwalk, California | Texarkana, Texas | Hope, Arkansas | ||
West Sacramento, California | West Memphis, Arkansas | |||
Denver, Colorado | Foodservice | Rome, Georgia | ||
Itasca, Illinois | U.S.: | Thomson, Georgia | ||
Des Moines, Iowa | Visalia, California | DeQuincy, Louisiana | ||
Wichita, Kansas | Shelbyville, Illinois | Fletcher, Oklahoma | ||
Roseville, Minnesota | Kenton, Ohio | Mt. Jewett, Pennsylvania | ||
Omaha, Nebraska leased | Buna, Texas | |||
Charlotte, North Carolina | International: | Diboll, Texas (3 locations) | ||
Beaverton, Oregon | Shanghai, China | McQueeney, Texas | ||
Eugene, Oregon leased | Beijing, China | Pineland, Texas | ||
Memphis, Tennessee leased | Bogota, Colombia | Cumberland City, Tennessee | ||
Carrollton, Texas | Cheshire, England leased | |||
Salt Lake City, Utah | ||||
Richmond, Virginia | DISTRIBUTION | |||
Kent, Washington | ||||
xpedx | ||||
International: | U.S.: | |||
Monterrey, Mexico leased | Wholesale | |||
Xalapa, Veracruz, Mexico leased | Loveland, Ohio | |||
81 locations nationwide | ||||
Bags | 69 leased | |||
U.S.: | ||||
Buena Park, California | International: | |||
Beaverton, Oregon | Mexico (5 locations) all leased | |||
Grand Prairie, Texas | ||||
IP Asia | ||||
CONSUMER PACKAGING | International: | |||
China (8 locations) | ||||
Coated Paperboard | Malaysia | |||
Ontario, California leased | Taiwan | |||
(C & D Center) | Thailand | |||
Augusta, Georgia | Vietnam | |||
Springhill, Louisiana | ||||
(C & D Center) | FOREST PRODUCTS | |||
Sturgis, Michigan | ||||
(C & D Center) | Forest Resources | |||
Greensboro, North Carolina | International: | |||
(C & D Center) | Approximately 332,000 acres in Brazil | |||
(1) Closed March 2013 | (4) Closed December 2013 | |||
(2) Closed May 2013 | (5) Sold July 2013 | |||
(3) Closed June 2013 | ||||
A-3
2013 CAPACITY INFORMATION
CONTINUING OPERATIONS
(in thousands of short tons) | U.S. | EMEA | Americas, other than U.S. | Asia | India | Total | |||||||||||
Industrial Packaging | |||||||||||||||||
Containerboard | 13,035 | 43 | 373 | — | — | 13,451 | |||||||||||
Printing Papers | |||||||||||||||||
Uncoated Freesheet | 2,500 | 1,150 | 1,135 | — | 266 | 5,051 | |||||||||||
Bristols | 200 | — | — | — | — | 200 | |||||||||||
Uncoated Papers and Bristols | 2,700 | 1,150 | 1,135 | — | 266 | 5,251 | |||||||||||
Dried Pulp | 1,190 | 329 | 140 | — | — | 1,659 | |||||||||||
Newsprint | — | 125 | — | — | — | 125 | |||||||||||
Total Printing Papers | 3,890 | 1,604 | 1,275 | — | 266 | 7,035 | |||||||||||
Consumer Packaging | |||||||||||||||||
Coated Paperboard | 1,559 | 371 | — | 1,421 | — | 3,351 | |||||||||||
Forest Resources | ||
We own, manage or have an interest in approximately 1.2 million acres of forestlands worldwide. These forestlands and associated acres are located in the following regions: | (M Acres) | |
Brazil | 332 | |
We have harvesting rights in: | ||
Russia | 896 | |
Total | 1,228 | |
A-4