Use these links to rapidly review the document
TABLE OF CONTENTS
FINANCIAL STATEMENTS
As filed with the Securities and Exchange Commission on 28 August 2017
UNITED STATES
SECURITIES AND EXCHANGE COMMISSION
Washington, D.C. 20549
FORM 20-F
o |
REGISTRATION STATEMENT PURSUANT TO SECTION 12(b) OR 12(g) OF THE SECURITIES EXCHANGE ACT OF 1934 |
|
OR |
||
ý |
ANNUAL REPORT PURSUANT TO SECTION 13 OR 15(d) OF THE SECURITIES EXCHANGE ACT OF 1934—for the year ended 30 June 2017 |
|
OR |
||
o |
TRANSITION REPORT PURSUANT TO SECTION 13 OR 15(d) OF THE SECURITIES EXCHANGE ACT OF 1934 |
|
OR |
||
o |
SHELL COMPANY REPORT PURSUANT TO SECTION 13 OR 15(d) OF THE SECURITIES EXCHANGE ACT OF 1934 |
|
Commission file number: 001-31615
Sasol Limited
(Exact name of registrant as Specified in its Charter)
Republic of South Africa
(Jurisdiction of Incorporation or Organisation)
Sasol Place, 50 Katherine Street, Sandton, 2196
South Africa
(Address of Principal Executive Offices)
Paul Victor, Chief Financial Officer, Tel. No. +27 10 344 7896, Email paul.victor@sasol.com
Sasol Place, 50 Katherine Street, Sandton, 2196, South Africa
(Name, Telephone, E-mail and/or Facsimile number and Address of Company Contact Person)
Securities registered or to be registered pursuant to Section 12(b) of the Act:
| Title of Each Class | Name of Each Exchange on Which Registered | |
|---|---|---|
| American Depositary Shares | New York Stock Exchange | |
| Ordinary Shares of no par value* | New York Stock Exchange | |
| 4,50% Notes due 2022 issued by Sasol Financing International Limited | New York Stock Exchange |
- *
- Listed on the New York Stock Exchange not for trading or quotation purposes, but only in connection with the registration of American Depositary Shares pursuant to the requirements of the Securities and Exchange Commission.
Securities registered pursuant to Section 12(g) of the Act: None
Securities for which there is a reporting obligation pursuant to Section 15(d) of the Act: None
Indicate
the number of outstanding shares of each of the issuer's classes of capital or common stock as of the close of the period covered by the annual report:
651 436 793 Sasol ordinary shares of no par value
25 547 081 Sasol preferred ordinary shares of no par value
2 838 565 Sasol BEE ordinary shares of no par value
Indicate by check mark if the registrant is a well-known seasoned issuer, as defined in Rule 405 of the Securities Act. Yes ý No o
If this report is an annual or transition report, indicate by check mark if the registrant is not required to file reports pursuant to Section 13 or 15(d) of the Securities Exchange Act of 1934. Yes o No ý
Indicate by check mark whether the registrant (1) has filed all reports required to be filed by Section 13 or 15(d) of the Securities Exchange Act of 1934 during the preceding 12 months (or for such shorter period that the registrant was required to file such reports), and (2) has been subject to such filing requirements for the past 90 days. Yes ý No o
Indicate by check mark whether the registrant has submitted electronically and posted on its corporate Web site, if any, every Interactive Data File required to be submitted and posted pursuant to Rule 405 of Regulation S-T (§232 405 of this chapter) during the preceding 12 months (or for such shorter period that the registrant was required to submit and post such files). Yes o No o
Indicate by check mark whether the registrant is a large accelerated filer, an accelerated filer, a non-accelerated filer, or an emerging growth company. See definition of "large accelerated filer," "accelerated filer," and "emerging growth company" in Rule 12b-2 of the Exchange Act. (Check one):
| Large accelerated filer ý | Accelerated filer o | Non-accelerated filer o | Emerging growth company o |
If an emerging growth company that prepares its financial statements in accordance with U.S. GAAP, indicate by check mark if the registrant has elected not to use the extended transition period for complying with any new or revised financial accounting standards† provided pursuant to Section 13(a) of the Exchange Act. o
- †
- The term "new or revised financial accounting standard" refers to any update issued by the Financial Accounting Standards Board to its Accounting Standards Codification after April 5, 2012.
Indicate by check mark which basis of accounting the registrant has used to prepare the financial statements included in this filing:
| U.S. GAAP o | International Financial Reporting Standards as issued by the International Accounting Standards Board ý |
Other o |
If "Other" has been checked in response to the previous question, indicate by check mark which financial statement item the registrant has elected to follow.
Item 17 o Item 18 o
If this is an annual report, indicate by check mark whether the registrant is a shell company (as defined in Rule 12b-2 of the Exchange Act). Yes o No ý
1
We are incorporated in the Republic of South Africa as a public company under South African company law. Our audited consolidated financial statements are prepared in accordance with International Financial Reporting Standards (IFRS), as issued by the International Accounting Standards Board (IASB).
As used in this Form 20-F:
- •
- "rand" or "R" means the currency of the Republic of South Africa;
- •
- "US dollars", "dollars", "US$" or "$" means the currency of the United States (US);
- •
- "euro", "EUR" or "€" means the common currency of the member states of the European Monetary Union; and
- •
- "CAD" means Canadian dollar, the currency of Canada.
We present our financial information in rand, which is our reporting currency. Solely for your convenience, this Form 20-F contains translations of certain rand amounts into US dollars at specified rates as at and for the year ended 30 June 2017. These rand amounts do not represent actual US dollar amounts, nor could they necessarily have been converted into US dollars at the rates indicated.
All references in this Form 20-F to "years" refer to the financial years ended on 30 June. Any reference to a calendar year is prefaced by the word "calendar".
Besides applying barrels (b or bbl) and standard cubic feet (scf) for reporting oil and gas reserves and production, Sasol applies the Système International (SI) metric measures for all global operations. A ton, or tonne, denotes one metric ton equivalent to 1 000 kilograms (kg). Sasol's reference to metric tons should not be confused with an imperial ton equivalent to 2 240 pounds (or about 1 016 kg). Barrels per day, or bpd, or bbl/d, is used to refer to our oil and gas production.
In addition, in line with a South African convention under the auspices of the South
African Bureau of Standards (SABS), the information presented herein is displayed using the decimal comma (e.g., 3,5) instead of the more familiar decimal point (e.g., 3.5) used in the UK, US and elsewhere. Similarly, a hard space is used to distinguish thousands in numeric figures (e.g., 2 500) instead of a comma (e.g., 2,500).
All references to the "group", "us", "we", "our", "company", or "Sasol" in this Form 20-F are to Sasol Limited, its group of subsidiaries and its interests in associates, joint arrangements and structured entities. All references in this Form 20-F are to Sasol Limited or the companies comprising the group, as the context may require. All references to "(Pty) Ltd" refer to Proprietary Limited, a form of corporation in South Africa which restricts the right of transfer of its shares and prohibits the public offering of its shares.
All references in this Form 20-F to "South Africa" and "the government" are to the Republic of South Africa and its government. All references to the "JSE" are to the JSE Limited or Johannesburg Stock Exchange, the securities exchange of our primary listing. All references to "SARB" refer to the South African Reserve Bank. All references to "PPI" and "CPI" refer to the South African Producer Price Index and Consumer Price Index, respectively, which are measures of inflation in South Africa. All references to "GTL" and "CTL" refer to our gas-to-liquids and coal-to-liquids processes, respectively.
Unless otherwise stated, presentation of financial information in this annual report on Form 20-F will be in terms of IFRS. Our discussion of business segment results follows the basis used by the Joint Presidents and Chief Executive Officers (the company's chief operating decision makers) for segmental financial decisions, resource allocation and performance assessment, which forms the accounting basis for segmental reporting, that is disclosed to the investing and reporting public.
"CFO Report" means the Integrated Report—Chief Financial Officer's Report included in Exhibit 99.3.
"Headline Earnings per share (HEPS)" refers to disclosure made in terms of the JSE listing requirements.
2
We may from time to time make written or oral forward-looking statements, including in this Form 20-F, in other filings with the United States Securities and Exchange Commission, in reports to shareholders and in other communications. These statements may relate to analyses and other information which are based on forecasts of future results and estimates of amounts not yet determinable. These statements may also relate to our future prospects, developments and business strategies. Examples of such forward-looking statements include, but are not limited to:
- •
- the capital cost of our projects (including material, engineering and construction cost) and the timing of project milestones;
- •
- our ability to obtain financing to meet the funding requirements of our capital investment programme, as well as to fund our on-going business
activities and to pay dividends;
- •
- changes in the demand for and international prices of crude oil, gas, petroleum and chemical products and changes in foreign currency exchange
rates;
- •
- statements regarding our future results of operations and financial condition and regarding future economic performance including cost
containment and cash conservation programmes;
- •
- statements regarding recent and proposed accounting pronouncements and their impact on our future results of operations and financial
condition;
- •
- statements of our business strategy, business performance outlook, plans, objectives or goals, including those related to products or services;
- •
- statements regarding future competition, volume growth and changes in market share in the industries and markets for our products;
- •
- statements regarding our existing or anticipated investments (including the
- •
- statements regarding our estimated oil, gas and coal reserves;
- •
- statements regarding the probable future outcome of litigation and regulatory proceedings and the future development in legal and regulatory
matters including statements regarding our ability to comply with future laws and regulations;
- •
- statements regarding future fluctuations in refining margins and crude oil, natural gas and petroleum product prices;
- •
- statements regarding the demand, pricing and cyclicality of oil and petrochemical product prices;
- •
- statements regarding changes in the manufacturers' fuel pricing mechanism in South Africa and their effects on fuel prices, our operating
results and profitability;
- •
- statements regarding future fluctuations in exchange and interest rates and changes in credit ratings;
- •
- statements regarding total shareholder return;
- •
- statements regarding our growth and expansion plans;
- •
- statements regarding our current or future products and anticipated customer demand for these products;
- •
- statements regarding acts of war, terrorism or other events that may adversely affect the group's operations or that of key stakeholders to the
group;
- •
- statements and assumptions relating to macro-economics;
- •
- statements regarding tax litigation and assessments; and
Lake Charles Chemicals Project, Mozambique exploration and development activities, the GTL joint ventures in Qatar and Nigeria, chemical projects and joint arrangements in North America and other investments), acquisitions of new businesses or the disposal of existing businesses;
3
- •
- statements of assumptions underlying such statements.
Words such as "believe", "anticipate", "expect", "intend", "seek", "will", "plan", "could", "may", "endeavour", "target", "forecast" and "project" and similar expressions are intended to identify forward-looking statements, but are not the exclusive means of identifying such statements.
By their very nature, forward-looking statements involve inherent risks and uncertainties, both general and specific, and there are risks that the predictions, forecasts, projections and other forward-looking statements will not be achieved. If one or more of these risks materialise, or should underlying assumptions prove incorrect, our actual results may differ materially from those anticipated in such forward-looking statements. You should understand that a number of important factors could cause actual results to differ materially from the plans, objectives, expectations, estimates and intentions expressed in such forward-looking statements. These factors include among others, and without limitation:
- •
- the outcome in pending and developing regulatory matters and the effect of changes in regulation and government policy;
- •
- the political, social and fiscal regime and economic conditions and developments in the world, especially in those countries in which we
operate;
- •
- the outcome of legal proceedings including tax litigation and assessments;
- •
- our ability to maintain key customer relations in important markets;
- •
- our ability to improve results despite increased levels of competition;
- •
- our ability to exploit our oil, gas and coal reserves as anticipated;
- •
- the continuation of substantial growth in significant developing markets;
- •
- the ability to benefit from our capital investment programme;
- •
- the accuracy of our assumptions in assessing the economic viability of our large capital projects; growth in significant developing areas of
our business;
- •
- the ability to gain access to sufficient competitively priced gas, oil and coal reserves and other commodities;
- •
- the impact of environmental legislation and regulation on our operations and access to natural resources;
- •
- our success in continuing technological innovation;
- •
- our ability to maintain sustainable earnings despite fluctuations in oil, gas and commodity prices, foreign currency exchange rates and
interest rates;
- •
- our ability to attract and retain sufficient skilled employees;
- •
- the risk of completing major projects within budget and schedule; and
- •
- our success at managing the foregoing risks.
The foregoing list of important factors is not exhaustive; when making investment decisions, you should carefully consider the foregoing factors and other uncertainties and events, and you should not place undue reliance on forward-looking statements. Forward-looking statements apply only as of the date on which they are made and we do not undertake any obligation to update or revise any of them, whether as a result of new information, future events or otherwise. See "Item 3.D—Risk factors"
ENFORCEABILITY OF CERTAIN CIVIL LIABILITIES
We are a public company incorporated under the company law of South Africa. Most of our directors and officers reside outside the US, principally in South Africa. You may not be able, therefore, to effect service of process within the US upon those directors and officers with respect to matters arising under the federal securities laws of the US.
4
In addition, most of our assets and the assets of most of our directors and officers are located outside the US. As a result, you may not be able to enforce against us or our directors and officers judgements obtained in US courts predicated on the civil liability provisions of the federal securities laws of the US.
There are additional factors to be considered under South African law in respect of the enforceability, in South Africa (in original actions or in actions for enforcement of judgements of US courts) of liabilities predicated on the US federal securities laws. These additional factors include, but are not necessarily limited to:
- •
- South African public policy considerations;
- •
- South African legislation regulating the applicability and extent of damages and/or penalties that may be payable by a party;
- •
- the applicable rules under the relevant South African legislation which regulate the recognition and enforcement of foreign judgements in South
Africa; and
- •
- the South African courts' inherent jurisdiction to intervene in any matter which such courts may determine warrants the courts' intervention (despite any agreement amongst the parties to (i) have any certificate or document being conclusive proof of any factor, or (ii) oust the courts' jurisdiction).
Based on the foregoing, there is no certainty as to the enforceability in South Africa (in original actions or in actions for enforcement of judgements of US courts) of liabilities predicated on the US federal securities laws.
ITEM 1. IDENTITY OF DIRECTORS, SENIOR MANAGEMENT AND ADVISERS
Not applicable.
ITEM 2. OFFER STATISTICS AND EXPECTED TIMETABLE
Not applicable.
3.A Selected financial data
The following information should be read in conjunction with "Item 5—Operating and financial review and prospects" and the consolidated financial statements, the accompanying notes and other financial information included elsewhere in this annual report on Form 20-F.
The financial data set forth below for the years ended as at 30 June 2017 and 2016 and for each of the years in the three-year period ended 30 June 2017 has been derived from and should be read in conjunction with our audited consolidated financial statements included in Item 18.
Financial data as at 30 June 2015, 2014 and 2013, and for the years ended 30 June 2014 and 2013 have been derived from the group's previously published audited consolidated financial statements, which are not included in this document.
The audited consolidated financial statements from which the selected consolidated financial data set forth below have been derived were prepared in accordance with IFRS.
| |
30 June 2017 |
30 June 2016 |
30 June 2015 |
30 June 2014 |
30 June 2013 |
|||||||||||
|---|---|---|---|---|---|---|---|---|---|---|---|---|---|---|---|---|
| |
(Rand in millions) (except per share information and weighted average shares in issue) |
|||||||||||||||
Income Statement data: |
||||||||||||||||
Turnover |
172 407 | 172 942 | 185 266 | 202 683 | 169 891 | |||||||||||
Operating profit |
31 705 | 24 239 | 46 549 | 45 818 | 40 845 | |||||||||||
Profit attributable to owners of Sasol Limited |
20 374 | 13 225 | 29 716 | 29 580 | 26 274 | |||||||||||
Statement of Financial Position data: |
||||||||||||||||
Total assets |
398 939 | 390 714 | 323 599 | 280 264 | 246 165 | |||||||||||
Total equity |
217 234 | 212 418 | 196 483 | 174 769 | 152 893 | |||||||||||
Share capital |
29 282 | 29 282 | 29 228 | 29 084 | 28 711 | |||||||||||
Per share information (Rand): |
||||||||||||||||
Basic earnings per share |
33,36 | 21,66 | 48,71 | 48,57 | 43,38 | |||||||||||
Diluted earnings per share |
33,27 | 21,66 | 48,70 | 48,27 | 43,30 | |||||||||||
Dividends per share(1) |
12,60 | 14,80 | 18,50 | 21,50 | 19,00 | |||||||||||
Weighted average shares in issue (in millions): |
||||||||||||||||
Average shares outstanding—basic |
610,7 | 610,7 | 610,1 | 609,0 | 605,7 | |||||||||||
Average shares outstanding—diluted |
612,4 | 610,7 | 610,2 | 620,8 | 606,8 | |||||||||||
- (1)
- The total dividend includes the interim and final dividend. The final dividend was declared subsequent to the reporting date and is presented for information purposes only. No provision for this final dividend has been recognised.
5
Exchange rate information
The following table sets forth certain information with respect to the rand/US dollar exchange rate for the years shown:
Rand per US dollar for the year ended 30 June and the respective month:
| |
Average(1) | High(2) | Low(2) | |||||||
|---|---|---|---|---|---|---|---|---|---|---|
2013 |
8,85 | 10,21 | 8,08 | |||||||
2014 |
10,39 | 11,32 | 9,59 | |||||||
2015 |
11,45 | 12,58 | 10,51 | |||||||
2016 |
14,52 | 16,88 | 12,25 | |||||||
2017 |
13,61 | 14,75 | 12,44 | |||||||
April 2017 |
13,46 | 13,95 | 13,02 | |||||||
May 2017 |
13,26 | 13,66 | 12,87 | |||||||
June 2017 |
12,90 | 13,08 | 12,63 | |||||||
2018(3) |
||||||||||
July 2017(3) |
13,14 | 13,57 | 12,90 | |||||||
August 2017 (Up to 24 August 2017) |
13,29 | 13,46 | 13,16 | |||||||
- (1)
- The
average exchange rates for each full year are calculated using the average exchange rate on the last day of each month during the period. The average exchange
rate for each month is calculated using the average of the daily exchange rates during the period.
- (2)
- Based
on the closing rate of Thomson Reuters for the applicable period.
- (3)
- The average exchange rate for the period 1 July 2017 to 24 August 2017 is calculated using the average exchange rate on the last day of each month and as at 24 August 2017. The average exchange rate is calculated using the average of the daily exchange rates during the period.
On 24 August 2017 the closing exchange rate of rand per US dollar as reported by Thomson Reuters was R13,20.
3.B Capitalisation and indebtedness
Not applicable.
3.C Reasons for the offer and use of proceeds
Not applicable.
3.D Risk factors
Fluctuations in crude oil, natural gas and petroleum product prices and refining margins may adversely affect our business, operating results, cash flows and financial condition
Market prices for crude oil, natural gas and petroleum products fluctuate as they are subject to local and international supply and demand fundamentals and other factors over which we have no control. Worldwide supply conditions and the price levels of crude oil may be significantly influenced by general economic conditions, industry inventory levels, technology advancements, production quotas or other actions that might be imposed by international cartels that control the production of a significant proportion of the worldwide supply of crude oil, weather-related damage and disruptions, competing fuel prices and geopolitical risks, especially in the Middle East, North Africa and West Africa.
Prolonged periods of low prices for crude oil can have a material adverse effect on our business, operating results, cash flows and financial condition as the selling prices of fuel and the majority of our chemical products are linked to the oil price. The group's profitability was negatively impacted by the sustained low oil prices in 2017. During 2017, the dated Brent crude oil price averaged US$49,77/bbl and fluctuated between a high of US$56,30/bbl and a low of US$40,26/bbl. This compares to an average dated Brent crude oil price of US$43,37/bbl during 2016, which fluctuated between a high of US$61,67/bbl and a low of US$25,99/bbl.
A substantial proportion of our turnover is derived from sales of petroleum and petrochemical products, prices for which have fluctuated widely in recent years and are affected by crude oil prices, the price and availability of substitute fuels, changes in product inventory, product specifications and other factors.
The South African government controls and/or regulates certain fuel prices. The pump price of petrol is regulated at an absolute level. Furthermore maximum price regulation applies to the refinery gate price of liquefied petroleum
6
gas (LPG) and the sale of unpacked illuminating paraffin. South African liquid fuels are valued using the "Basic Fuel Price" (BFP). BFP is a formula-driven price that considers, amongst others, the international prices of refined products (petrol, diesel and illuminating paraffin), the rand/US dollar exchange rate and the logistical cost of transporting liquid fuels to South Africa. The BFP is then used as a component in the regulated prices that are published by the Government on a monthly basis.
Through our equity participation in the National Petroleum Refiners of South Africa (Pty) Ltd (Natref) crude oil refinery, we are exposed to fluctuations in refinery margins resulting from fluctuations in international crude oil and petroleum product prices. We are also exposed to changes in absolute levels of international petroleum product prices through our synthetic fuel operations.
Prolonged periods of low crude oil and natural gas prices could also result in projects being delayed or cancelled, as well as the impairment of certain assets. An impairment loss amounting to R1,7 billion (US$130 million) has been recognised on our US GTL project due to the uncertainty around the probability and timing of project execution. In Canada, low gas prices resulted in an impairment of our shale gas assets of R9,9 billion (CAD880 million) in 2016, and R1,3 billion (CAD133 million) in 2015.
We use derivative financial instruments to partially protect us against day-to-day, and longer term fluctuations in US dollar oil prices. The oil price affects the profitability of both our energy and chemical products. See "Item 11—Quantitative and qualitative disclosures about market risk". While the use of these instruments may provide some protection against fluctuations in crude oil prices, it does not protect us against longer term fluctuations in crude oil prices or differing trends between crude oil and petroleum product prices.
We are unable to accurately forecast fluctuations in crude oil, natural gas and petroleum products prices. Fluctuations in any of these may have a material adverse effect on our business, operating results, cash flows and
financial condition. Refer "Item 5A—Operating results" for the impact of the crude oil prices on the results of our operations.
Fluctuations in exchange rates may adversely affect our business, operating results, cash flows and financial condition
The rand is the principal functional currency of our operations and we report our results in rand. However, a significant majority of our turnover is impacted by the US dollar and the price of most petroleum and chemical products is based on global commodity and benchmark prices which are quoted in US dollars.
Further, as explained above, the components that constitute BFP are US dollar denominated and converted to rand, which impacts the price at which we can sell fuel in South Africa.
A significant part of our capital expenditure is US dollar-denominated, as it is directed to investments outside South Africa or constitutes materials, engineering and construction costs imported into South Africa. Fluctuations in the rand/US dollar exchange rate impact our gearing and estimated capital expenditure.
We also generate turnover and incur operating costs in euro and other currencies.
Fluctuations in the exchange rates of the rand against the US dollar, euro and other currencies impacts the comparability of our financial statements between periods due to the effects of translating the functional currencies of our foreign subsidiaries into rand at different exchange rates.
Accordingly, fluctuations in exchange rates between the rand and US dollar, and/or euro may have a material effect on our business, operating results, cash flows and financial condition.
We use derivative financial instruments to limit our exposure to fluctuations in the rand/US dollar exchange rate. During 2017, the rand/US dollar exchange rate averaged R13,61 fluctuating between a high of R14,75 and a low of R12,44. This compares to an average exchange rate of R14,52 during 2016, which fluctuated between a high of R16,88 and a low of R12,25. At 30 June
7
2017 the closing rand/US dollar exchange rate was R13,06 as compared to R14,71 at 30 June 2016.
The rand exchange rate is affected by various international and South African economic and political factors. Subsequent to 30 June 2017, the rand has on average strengthened against the US dollar and the euro, closing at R13,20 and R15,58, respectively, on 24 August 2017. In general, a weakening of the rand would have a positive effect on our operating results. Conversely, strengthening of the rand would have an adverse effect on our operating results, cash flows and financial condition. Refer to "Item 5.A—Operating results" for further information regarding the effect of exchange rate fluctuations on our results of operations, and "Item 11—Quantitative and qualitative disclosures about market risk".
Although the exchange rate of the rand is primarily market-determined, its value at any time may not be an accurate reflection of its underlying value, due to the potential effect of, among other factors, exchange controls. For more information regarding exchange controls in South Africa see "Item 10.D—Exchange controls".
Cyclicality in petrochemical product prices and demand may adversely affect our business, operating results, cash flows and financial condition
The demand for chemicals and especially products such as polymers, solvents, olefins, surfactants and fertilisers are cyclical. Typically, higher demand during peaks in the industry business cycle leads producers to increase their production capacity. Although peaks in the business cycle have been characterised by increased selling prices and higher operating margins in the past, such peaks have led to overcapacity with supply exceeding demand growth. Low periods during the industry business cycle are characterised by a decrease in selling prices and excess capacity, which can depress operating margins. We are unable to accurately forecast the timing of the industry business cycle, and lower prices for chemical products during
downturns in the cycle may have a material adverse effect on our business, operating results, cash flows and financial condition.
Our large projects are subject to schedule delays and cost overruns, and we may face constraints in financing our existing projects or new business opportunities, which could render our projects unviable or less profitable than planned
In October 2014, we made the final investment decision (FID) on the Lake Charles Chemicals Project (LCCP) (an ethane cracker and chemical derivatives plant) in the US.
Overall construction on the project continues on all fronts, with most engineering and procurement activities nearing completion. At 30 June 2017, the capital expenditure to date on LCCP was US$7,5 billion, and the overall project completion was around 74%.
The total forecasted capital cost for the project remains within the revised estimate of US$11 billion, which includes the US$2,1 billion increase announced in 2016. We obtain the views of independent market consultants in formulating our views on our long-term assumptions. Their views differ significantly from period to period, which again is indicative of the volatility in the market. For these reasons, the internal rate of return (IRR) for the LCCP, based on these different sets of price assumptions, varies between a range of returns which is both higher and lower than our weighted average cost of capital. We are of the view that limited structural changes have occurred to market fundamentals since February 2017, when we last published the expected long-term IRR of the project. Based on our assessment, we are of the view that the IRR is in a range of 7% to 8% (Sasol WACC at 8% in US$ terms).The cracker, however, remains cost competitive and is at the lower end of the cost curve for ethylene producers.
Approximately 90% of the LCCP performance chemicals output will be placed with existing customers and good progress is being made in securing new customers for most of the new Base Chemicals US output.
8
During 2016, the low density polyethylene (LDPE) cash generating unit of the LCCP project was impaired by R956 million (US$65 million), largely as a result of the increased capital cost and lower margins. This impairment was reversed at 30 June 2017, based on a reduction in the discount rate applicable to the US (based on spot market factors in terms of IFRS requirements), the extension of the useful life to 50 years based on more detailed engineering analysis performed, the completion of the project cost review and schedule evaluation which included external assurance that these are achievable.
In Mozambique, the Field Development Plan (FDP) for the Production Sharing Agreement (PSA) licence was approved by regulatory authorities in 2016. The PSA FDP proposes an integrated oil, Liquefied Petroleum Gas (LPG) and gas-to-power project adjacent to the Petroleum Production Agreement (PPA) area. The development of these projects is a capital-intensive process carried out over long durations and requires us to commit significant capital expenditure and allocate considerable management resources in utilising our existing experience and know-how.
Projects like LCCP and PSA are subject to risk of delay and cost overruns inherent in any large construction project, including as a result of, among other factors:
- •
- shortages or unforeseen increases in the cost of equipment, labour and raw materials;
- •
- unforeseen design and engineering problems;
- •
- unforeseen construction problems;
- •
- inadequate phasing of activities;
- •
- labour disputes;
- •
- inadequate workforce planning or productivity of workforce;
- •
- inadequate change management practices;
- •
- natural disasters and adverse weather conditions, including excessive winds, higher than expected rainfall patterns, tornadoes, cyclones and hurricanes;
- •
- failure or delay of third-party service providers; and
- •
- changes to regulations, such as environmental regulations.
In addition, significant variations in the assumptions we make in assessing the viability of our projects, including those relating to commodities prices and the prices for our products, exchange rates, interest rates, discount rates (due to change in country risk premium) and the demand for our products, may adversely affect the profitability or even the viability of our investments. As the LCCP capital investment is particularly material to Sasol, any further cost overruns or adverse changes in assumptions affecting the viability of the project could have a material adverse effect on our business, cash flows, financial condition and prospects.
Our operating cash flow and banking facilities may be insufficient to meet our capital expenditure plans and requirements, depending on the timing and cost of development of our existing projects and any further projects we may pursue, as well as our operating performance and the utilisation of our banking facilities. As a result, new sources of capital may be needed to meet the funding requirements of these projects, to fund ongoing business activities and to pay dividends. Our ability to raise and service significant new sources of capital will be a function of macro-economic conditions, our credit rating, our gearing and other risk metrics, the condition of the financial markets, future prices for the products we sell, the prospects for our industry, our operational performance and operating cash flow and debt position, among other factors.
In the event of unanticipated operating or financial challenges, any dislocation in financial markets, any further downgrade of our credit ratings by ratings agencies or new funding limitations, our ability to pursue new business opportunities, invest in existing and new projects, fund our ongoing business activities and retire or service outstanding debt and pay dividends, could be constrained, any of which could have a material adverse effect on our business, operating results, cash flows and financial condition.
9
Our access to and cost of funding is affected by our credit rating, which in turn is affected by the sovereign credit rating of the Republic of South Africa
Our credit rating may be affected by our ability to maintain our outstanding debt and financial ratios at levels acceptable to the credit ratings agencies, our business prospects, the sovereign credit rating of the Republic of South Africa and other factors, some of which are outside our control. The credit rating assigned by the ratings agencies is dependent on a number of factors, including the gearing levels of the group. In assessing these gearing levels, performance guarantees which have been issued by Sasol are taken into account as potential future exposure, which may impact the liquidity of the group. Our credit rating has been affected by movements in the sovereign credit rating of the Republic of South Africa.
In April 2017, South Africa's foreign currency sovereign credit rating was downgraded by Standard & Poor's Rating Services (S&P) from the investment grade rating of BBB– to BB+ with a negative outlook.
Any future adverse rating actions or downgrade of the South African sovereign credit rating may have an adverse effect on our credit rating, which could negatively impact our ability to borrow money and could increase the cost of debt finance.
Regulation of greenhouse gas emissions could increase our operational cost and reduce demand for our products
Some of our processes in South Africa, especially coal gasification and combustion, result in relatively high carbon dioxide emissions. Consequently, climate change mitigation poses a significant risk for our business, in meeting societal pressures, addressing anticipated or new legislative requirements such as more stringent greenhouse gas pricing, carbon budgets and targets and bearing the financial impact associated with the necessary development of required new technologies and rising feedstock costs.
Further, climate change poses a significant risk for our business as it relates to potential physical impacts including but not limited to change of weather patterns including extreme events and water scarcity. In addition, the related climate change policies could impact our projected growth strategies and targets.
Sasol's highly energy-intensive operations exist largely in South Africa in the midst of rapidly evolving national legislation on greenhouse gas emissions. In the National Climate Change Response White Paper (NCCRWP), South Africa reiterated its intent to, subject to certain conditions, to implement nationally appropriate mitigation actions to enable a 34% deviation below the "business as usual" emissions growth trajectory by 2020, and 42% by 2025. The NCCRWP indicates the implementation of a carbon budget process which is now being cascaded to company level in the form of a voluntary carbon budget, a process in which Sasol is participating. It is likely that carbon budgets and associated compliance will become mandatory in 2021. We believe that given the developmental challenges currently faced by South Africa and the structure of its economy, there are alternative mechanisms which could achieve the same outcomes intended by the proposed carbon tax. There is however a high risk that the National Treasury in South Africa will pursue a stand-alone carbon tax that is not aligned with the carbon budget process. The draft Carbon Tax bill was published in December 2015 and the bill may be introduced into the parliamentary process towards the end of calendar year 2017. A substantial carbon tax may negatively impact free cash flows generated from our South African operations.
As with many proposed policies that may have an impact on our business, we continue to actively engage with the South African government in a solution-oriented constructive manner, particularly given the compliance and associated financial implications should carbon tax and budgets be implemented independently of each other. This could have a material adverse effect on our business, operating results, cash flows and financial condition.
10
Identifying an appropriate response that balances the need for economic development, job creation, energy security and reductions in greenhouse gas emissions remains a key challenge and risk. We continue to consider sustainable lower carbon technologies for purposes of reducing our carbon footprint.
Current measures in South Africa have already resulted in increased compliance costs for power suppliers that are passed on to consumers in the form of levies for electricity generated from fossil fuels. These types of levies have increased substantially over time and are likely to increase further.
Our international operations are less carbon intensive and have been operating in a more mature greenhouse gas regulatory regime for a period of time already. However, continued political attention to issues concerning climate change, and potential mitigation through regulation, could have a material impact on our business, operating results, cash flows and financial condition.
Exposure related to investments in associates and joint arrangements may adversely affect our business, operating results, cash flows and financial condition
We have invested in a number of associates and joint arrangements and would consider opportunities for further upstream oil and gas and downstream GTL investments (including licensing opportunities), where appropriate, as well as opportunities in chemicals. The development of these projects may require investments in associates and joint arrangements, some of which are aimed at facilitating entry into countries and/or sharing risk with third parties. Although the risks are shared, the objectives of our associates, and joint arrangement partners, their ability to meet their financial and/or contractual obligations, their behaviour, their compliance with legal and ethical standards, as well as the increasing complexity of country-specific legislation and regulations may adversely affect our reputation and/or result in disputes and/or litigation, all of which may have a material adverse effect on our business, operating results, cash flows and
financial condition, and may constrain the achievement of our growth objectives.
Our coal, synthetic oil, natural oil and natural gas reserve estimates may be materially different from quantities that we eventually recover, and we may be unable to replace our reserves or acquire new reserves at a rate that is adequate to support our growth
Our reported coal, synthetic oil, natural oil and gas reserves are estimated quantities based on applicable reporting regulations that, under present and anticipated conditions, have the potential to be economically mined, processed or produced.
There are numerous uncertainties inherent in estimating quantities of reserves and in projecting future rates of production, including factors which are beyond our control. The accuracy of any reserve estimate is a function of the quality of available data, engineering and geological interpretation, costs to develop and market prices for related products.
Reserve estimates will require revision based improved data acquired from actual production experience and other factors, including resource extensions and new discoveries. In addition, regulatory changes, market prices, increased production costs and other factors may result in a revision to estimated reserves. Revised estimates may have a material adverse effect on our business, operating results, cash flows and financial condition. See "Item 4.D—Property, plants and equipment".
Delivering our near-to-medium-term strategy, which is more heavily based on coal, gas and oil in Southern Africa, depends on our ability to find and develop new resources into reserves. Additionally, our industry remains challenged to access, discover and develop natural gas, oil and coal resources in a timely manner, which could adversely impact our ability to support and sustain our current business operations.
Our future growth could be impacted by our success in securing reliable long-term feedstock supply contracts, as well as competition in finding new gas and oil resources to develop into
11
high value opportunities in line with our investment objectives, capital resources and existing capital commitments, whilst also complying with regulatory and environmental standards. These factors could have a material adverse effect on our business, operating results, cash flows and financial condition.
We may not achieve projected benefits of acquisitions or divestments
We may pursue acquisitions or divestments. With any such transaction, there is the risk that any benefits or synergies identified at the time of acquisition may not be achieved as a result of changing or inappropriate assumptions or materially different market conditions, or other factors. Furthermore, we could be found liable, regardless of extensive due diligence reviews, for past acts or omissions of the acquired business without any adequate right of redress.
In addition, delays in the sale of assets, or reductions in value realisable, may arise due to changing market conditions. Failure to achieve expected values from the sale of assets, or delays in expected receipt or delivery of funds may result in higher debt levels, underperformance of those businesses and loss of key personnel.
There are country-specific risks relating to the countries in which we operate that could adversely affect our business, operating results, cash flows and financial condition
Several of our subsidiaries, joint arrangements and associates operate in countries and regions that are subject to significantly differing political, social, economic and market conditions. See "Item 4.B—Business overview" for a description of the extent of our activities in the main countries and regions in which we operate. Although we are a South African-domiciled company and the majority of our operations are located in South Africa, we also have significant energy businesses in other African countries, chemical businesses in Europe, the US, the Middle East and Asia, a joint venture GTL facility in Qatar, joint operations in the United States and Canada and a 10% indirect interest in a GTL asset in Nigeria.
Particular aspects of country-specific risks that may have a material adverse impact on our business, operating results, cash flows and financial condition include:
(a) Political and socio-economic issues
i. Political, social and economic uncertainty
We have invested, or are in the process of investing in, significant operations in African, European, North American, Asian and Middle Eastern countries that have in the past, to a greater or lesser extent, experienced political, social and economic uncertainty.
In particular, in South Africa, the continuing rise in risks to the country's medium-term economic prospects and its fiscal strength has led to credit rating agencies downgrading the South African sovereign credit rating. In Mozambique, the fiscal crisis has led to a significant currency weakening and downgrades in its credit rating by all the major rating agencies, which complicated debt restructuration discussions between the country and the International Monetary Fund. Other countries in which we operate may also face sovereign downgrade risks and risks that may impact their ability to access funding and honour commitments.
Government policies, laws and regulations in countries in which we operate, or plan to operate, may change in the future. Governments in those countries have in the past and may in the future pursue policies of resource nationalism and market intervention, including through protectionism and subsidies. The impact of such changes on our ability to deliver on planned projects cannot be determined with any degree of certainty and such changes may therefore have an adverse effect on our operations and financial results.
ii. Transformation and localisation issues
In some countries, our operations are required to comply with local procurement, employment equity, equity participation, corporate social responsibility and other regulations which are designed to address
12
country-specific social and economic transformation and localisation issues.
In South Africa, there are various transformation initiatives with which we are required to comply. We embrace, engender and participate in initiatives to bring about meaningful transformation in South Africa. We consider these initiatives to be a strategic imperative and we acknowledge the risks of not pursuing them. The broad risks that we are faced with, should we not comply with these transformation initiatives include the inability to obtain licenses to operate in certain sectors such as mining and liquid fuels, limited ability to successfully tender for government and public entity tenders; and potential loss of customers (as private sector customers increasingly require their suppliers to have a minimum B-BBEE rating).
The revised Codes of Good Practice for broad-based black economic empowerment (B-BBEE) (the Revised Codes), which came into effect on 1 May 2015, provides a standard framework for the measurement of B-BBEE across all sectors of the economy, other than sectors that have their own sectorial transformation charters (e.g. the mining and liquid fuels industries).The Revised Codes provide more stringent targets, which impact on Sasol's B-BBEE contributor status. The more stringent targets comprise both increased pillar-specific targets (for example, in preferential procurement the target for black ownership of suppliers increased from 25% to 51%) and the generic scorecard requiring more points to be obtained in order to qualify for a given level. Our most recent certification was issued in April 2017. Our contributor status remained at Level 8, although there was noticeable improvement in our scorecard points. We have embarked on a project to assess our B-BBEE strategies and restore our Level 4 rating by 2020. The Sasol Inzalo B-BBEE transaction is maturing in 2018. The group is investigating the merits of a new B-BBEE transaction with some of our South African—based wholly owned subsidiaries.
We believe that the long-term benefits to the company and South Africa should outweigh
any possible adverse effects, such as dilution, but we cannot assure you that future implications of compliance with these requirements or with any newly imposed conditions will not have a material adverse effect on our shareholders or business, operating results, cash flows and financial condition. See "Item 4.B—Empowerment of historically disadvantaged South Africans".
iii. Disruptive industrial action
The majority of our employees worldwide belong to trade unions. These employees comprise mainly of general workers, artisans and technical operators. The South African labour market remains volatile and can be characterised by major industrial action in key sectors of the economy.
Wage negotiations impacting the South African operations of the Sasol Group within the Petroleum and Industrial Chemicals sectors as well as within Sasol Mining took place at the beginning of May 2016. Negotiations in the Industrial Chemicals and Petroleum sector were successfully concluded for the 2016 year. The conclusion of negotiations in the Petroleum sector reached a two year wage agreement which is valid until the end of June 2018.
In Sasol Mining, we initially concluded agreements in 2016 with four of our five recognised trade unions, however, the Association of Mineworkers and Construction Union (AMCU) embarked on industrial action. Following a 79 day strike by AMCU, an agreement was entered into in November 2016, ending one of the longer striking periods to date. An additional cost of R1,4 billion (including external coal purchases) was incurred during the period of the Mining strike. Our focus remains on the safety of our employees, contractors, the community and our assets as well as continuing to strengthen our direct relationship with our employees.
We have commenced the 2017 wage negotiations in May 2017 in the Industrial Chemicals Sector and in Sasol Mining. These negotiations are still in process.
13
Sasol remains committed to a peaceful resolution of the current wage negotiations process in both Mining and the Chemicals sector in South Africa. These two areas remain our focal point and we will continue to engage key roles players to ensure a successful conclusion hereof.
Although we have constructive relations with our employees and their unions, we cannot assure you that significant labour disruptions will not occur in the future or that our labour costs will not increase significantly in the future.
(b) Fiscal
Macro-economic factors, such as higher inflation and interest rates, could adversely impact our ability to contain costs and/or ensure cost-effective debt financing in the countries in which we operate.
Our sustainability and competitiveness is influenced by our ability to optimise our cost base. As we are unable to control the price at which our products are sold, an increase in inflation in countries in which we operate may result in significantly higher future operational costs.
In South Africa, consumer price inflation averaged 6,1% in 2017, from 5,6% in 2016. This rise in consumer inflation can to a large extent be attributed to food price pressures caused by severe drought conditions. With inflation remaining above the South African Reserve Bank's (SARB) 6% inflation target ceiling for most of 2017 and notwithstanding weakening economic growth, the policy interest rate remained unchanged at 7% in 2017.
The exchange rate remains one of the key risks to the inflation outlook, where global monetary policy developments, sovereign credit rating trends and domestic political and policy developments continue to pose both a depreciation and volatility risk to the rand.
Weak business and consumer confidence levels point to persistent poor economic growth conditions. This, along with indications of slowing inflation in 2018, led to the SARB's decision to cut the policy interest rate by 25 basis points to 6,75% on 21 July 2017. While
further decisions remain data dependent, if current conditions persist the SARB could cut interest rates further during the course of the 2018 calendar year.
(c) Legal and regulatory
i. Exchange control regulations
South African law provides for exchange control regulations which apply to transactions involving South African residents, including both natural persons and legal entities. These regulations may restrict the export of capital from South Africa, including foreign investments. The regulations may also affect our ability to borrow funds from non-South African sources for use in South Africa, including the repayment of these borrowings from South Africa and, in some cases, our ability to guarantee the obligations of our subsidiaries with regard to these funds. These restrictions may affect the manner in which we finance our transactions outside South Africa and the geographic distribution of our debt. See "Item 10.D—Exchange controls" and "Item 5.B—Liquidity and capital resources".
ii. Tax laws and regulations
We operate in multiple tax jurisdictions globally and are subject to both local and international tax laws and regulations. Although we aim to fully comply with tax laws in all the countries in which we operate, tax is a highly complex area leading to the risk of unexpected tax uncertainties. Tax laws are changing regularly and their interpretation may potentially result in ambiguities and uncertainties, in particular in the areas of international taxation and transfer pricing. Where the tax law is not clear, we interpret our tax obligations in a responsible way, with the support of legal and tax advisors as deemed appropriate. Tax authorities and courts may arrive at different interpretations to those taken by Sasol, which may lead to substantial increases in tax payments. Although we believe we have adequate systems, processes and people in place to assist us with complying with all applicable tax laws and regulations, the outcomes of certain tax disputes and assessments may have a material adverse effect on our
14
business, operating results, cash flows and financial position.
For more information regarding pending tax disputes and assessments refer to "Legal proceedings and other contingencies" under 4.B Business overview.
iii. Ownership rights
We operate in several countries where ownership of rights in respect of land and resources is uncertain and where disputes in relation to ownership or other community matters may arise. These disputes are not always predictable and may cause disruption to our operations or development plans.
iv. Legal and regulatory uncertainties
Some of the countries where we have already made, or other countries where we may consider making investments are in various stages of developing institutions and legal and regulatory systems that are characteristic of democracies and market economies.
The procedural safeguards of the legal and regulatory regimes in these countries in many cases are still being developed and, therefore, existing laws and regulations may be applied inconsistently. In some circumstances, it may not be possible to obtain the legal remedies provided under those laws and regulations in a timely manner. In particular in South Africa the legal landscape is rapidly evolving, amongst others, due to increasing societal and enforcement pressure. Therefore, the risk of uncertainty is higher in South Africa which could have a material adverse effect on our business, operating results, cash flows, financial condition and future growth.
(d) Transportation, water, electricity and other infrastructure
The infrastructure in some countries in which we operate, such as rail infrastructure, electricity and water supply may need to be further upgraded and expanded, and in certain instances, possibly at our own cost. Water, as a resource, is becoming increasingly limited as world demand for water increases. A significant
part of our operations, including mining, chemical processing and others, requires use of large volumes of water. South Africa is generally an arid country and prolonged periods of drought or significant changes to current water laws could increase the cost of our water supplies or otherwise impact our operations. Water use by our operations varies widely depending largely on feedstock and technology choice. Although various technological advances may improve the water efficiency of our processes, we may experience limited water availability and other infrastructure challenges which could have a material adverse effect on our business, operating results, cash flows, financial condition and future growth.
(e) Stakeholder relationships
Our operations can also have an impact on local communities, including the need, from time to time, to relocate or resettle communities or relocate infrastructure networks such as railways and utility services. Failure to manage relationships with local communities, governments and non-governmental organisations may harm our reputation as well as our ability to conduct our operations effectively. In addition, the costs and management time required to comply with standards of social responsibility, community relations and sustainability, including costs related to the resettlement of communities or relocation of infrastructure, have increased substantially and are expected to further increase over time.
(f) Contract stability
Host governments in some of the resource-rich countries where we operate or consider making investments may display tendencies of wanting to change existing contracts through early terminations, non-renewal or cancellation of contractual rights, or we may not be able to fully enforce our contractual rights in those jurisdictions or enforce judgements obtained in the courts of other jurisdictions, should they hold the view that these contracts are not beneficial to their countries.
15
(g) Other specific country risks that are applicable to countries in which we operate and which may have a material adverse effect on our business include:
- •
- acts of warfare and civil clashes;
- •
- the loss of control of oil and gas field developments and transportation infrastructure;
- •
- failure to receive new permits and consents;
- •
- expropriation of assets;
- •
- lack of capacity to deal with emergency response situations;
- •
- social and labour unrest due to economic and political factors in host countries;
- •
- terrorism, xenophobia and kidnapping threats;
- •
- security threats to assets, employees and supply chain;
- •
- possible demands to participate in unethical or corrupt conduct that lead us to forgo certain opportunities;
- •
- feedstock security of supply; and
- •
- sanctions against countries in which we operate.
Actual or alleged non-compliance with laws could result in criminal or civil sanctions and could harm our reputation
Non-compliance with competition laws, anti-corruption laws, sanction laws and environmental laws have been identified as our top four legal risks.
Anti-corruption and anti-bribery laws
Ethical misconduct and non-compliance with applicable anti-corruption laws, including a violation of the rules to disclose payments made to governments, could have a material adverse impact on our reputation, operations and licence to operate.
Petrochemical and energy companies need to be particularly vigilant with regard to the risk of bribery, especially when the scale of investments and the corruption perception of the countries where operations take place are
considered. We, like other international petrochemical companies, have a geographically diverse portfolio and conduct operations in countries, some of which have a perceived high prevalence of corruption. Our operations must comply with the US Foreign Corrupt Practices Act and similar anti-corruption and anti-bribery laws of South Africa and other applicable jurisdictions. There has been a substantial increase in the global enforcement of these laws. In particular, major investments in countries with a high corruption risk are subject to an elevated risk in dealings with private companies, governments or government-controlled entities. Although we have an anti-corruption and anti-bribery compliance programme in place designed to reduce the likelihood of violations of such laws, any violation could result in substantial criminal or civil sanctions and could damage our reputation.
Sanctions laws
Our international operations could expose us to trade and economic sanctions or other restrictions imposed by the United States or other governments or organisations, including the United Nations, the European Union and its member countries. Under economic and trading sanctions laws, governments may seek to impose modifications to business practices, and modifications to compliance programmes, which may increase compliance costs, and may subject us to fines, penalties and other sanctions.
Although we believe that we are in compliance with all applicable sanctions and embargo laws and regulations, and intend to maintain such compliance, there can be no assurance that we will be in compliance in the future, particularly as the scope of certain laws may be unclear and may be subject to changing interpretations.
We are monitoring developments in the United States, the European Union and other jurisdictions that maintain sanctions programmes, including developments in implementation and enforcement of such sanctions programmes. Expansion of sanctions programmes, embargoes and other restrictions in the future (including additional designations of
16
countries subject to sanctions), or modifications in how existing sanctions are interpreted or enforced, could have a material adverse effect on our business, operating results, cash flows and financial condition.
Environmental laws and regulations
Over the last years, the environmental legislation in South Africa set stricter standards than in the past which poses a risk to some of our operations in South Africa. For instance, the promulgation of the South African National Environmental Management: Air Quality Act in 2004, followed by the publication of minimum emission standards for point sources in April 2010, introduced a fundamental new approach to air quality management. Accordingly, by 2020, our existing plants are required to meet the same more stringent point source standards applicable to newly commissioned plants. Meeting some of these requirements may require retrofitting of some of our existing plants, which could pose significant compliance challenges for our existing plants from a technical and financial feasibility point of view.
We continue to investigate technologies that may enable us to comply and advance environmental roadmaps to enable compliance.
To mitigate associated compliance risks in the short- and long- term, Sasol will be reliant on mechanisms available in law and decisions thereon by the relevant authorities to obtain postponements on the requisite compliance time frames. We remain concerned about the limitations of the postponement mechanism, which is currently the only formalised mechanism provided in law for this compliance challenge, to provide longer-term certainty in the face of these significant compliance challenges. This is particularly the case since the outcome of these applications cannot be guaranteed and may be successfully challenged by third parties. Non-compliance may result in the violation of licence conditions with the associated consequence of administrative enforcement action, which may include directions to cease operations, as well as criminal prosecution. This may have a material adverse impact on our business.
Where we are unable to rely on mechanisms available in law or find appropriate feasible solutions, we may, of necessity, elect to decommission or mothball essential parts of our plant.
We also rely on other available alternative mechanisms, such as the implementation of air quality offsets as per our approved plans, to address our compliance challenges. We further continue to engage with the regulatory authorities in order to encourage a sustainable air quality regulatory system, including the formal recognition of offsets. The success of these engagements cannot be guaranteed.
The Department of Environmental Affairs has also declared the Vaal Triangle (where the Sasolburg plant is situated) and the Highveld area (where our Secunda operations are situated) as Priority Areas. The Vaal Triangle and Highveld Priority Area Air Quality Improvement Plans are being implemented. Compliance with the provisions of these plans is also likely to trigger significant cost.
Competition laws
Violations of competition/antitrust legislation could expose the group to administrative penalties and civil claims and damages, including punitive damages, by entities which can prove they were harmed by such conduct. Such penalties and damages could be significant and have an adverse impact on our business, operating results, cash flows and financial condition. In addition, our reputation could be damaged by findings of such contraventions and individuals could be subject to imprisonment or fines in some countries where antitrust violations are a criminal offence. Competition authorities are increasingly engaging with each other to exchange information relating to violations of antitrust laws and enforce antitrust laws.
The South African Competition Commission is conducting proceedings against various petroleum products producers, including Sasol. The Competition Commission has finalised a market inquiry in the South African LPG market and Sasol is in the process of implementing the Commission's recommendations. We continue to
17
interact and co-operate with the South African Competition Commission in respect of leniency applications as well as in the areas that are subject to the Commission's investigations. In June 2017, Sasol Germany received a request for information from the European Commission regarding the market of ethylene in Europe. Sasol responded to this request for information.
Although it is our policy to comply with all laws, and notwithstanding training and compliance programmes, we could inadvertently contravene competition or antitrust laws and be subject to the imposition of fines, criminal sanctions and/or civil claims and damages. This could have a material adverse impact on our reputation, business, operating results, cash flows and financial condition.
South African mining legislation may have an adverse effect on our mineral rights
Certain amendments to the Mineral and Petroleum Resource Development Act, 28 of 2002 (MPRDA) are currently under consideration. The impact thereof on our operations will be considered once we have clarity on the nature of the amendments.
The revised Mining Charter published on 15 June 2017 contains more stringent compliance criteria than the previous Mining Charter, which may have a material adverse effect on Sasol Mining. The potential impact on Sasol Mining is two-fold: higher cost of production and the risk of being in non-compliance with the requirements of the revised Mining Charter, which can lead to the suspension or cancellation of Sasol Mining's mining and/or prospecting rights. Amongst other provisions, the revised Mining Charter increases the minimum requirement for a Black shareholding from 26% to 30%, which minimum Black shareholding must be maintained, even in the case of Black shareholders selling their shares. In such a situation, new Black shareholders would have to be brought in. The revised Mining Charter also requires that 1% of the turnover generated by mining rights granted after 15 June 2017 will have to be paid to Black shareholders in addition to a dividend. The full extent of the financial and compliance risks associated with
the revised Mining Charter are currently being assessed and can only be fully evaluated upon completion of pending legal proceedings.
If a holder of a prospecting right or mining right in South Africa conducts prospecting or mining operations in contravention of the MPRDA, including the revised Mining Charter and Social and Labour Plans, the converted mining rights can be suspended or cancelled by the Minister of Mineral Resources. The entity, upon receiving a notice of breach from the Minister, has a specific period of time to remedy such breach. The MPRDA and applicable provisions in the National Environmental Management Act and National Water Act impose additional responsibilities with respect to environmental management as well as the prevention of environmental pollution, degradation or damage from mining and/or prospecting activities.
The effect of the proposed changes to the MPRDA, associated regulations to be promulgated and the revised Mining Charter on our mining and petroleum rights in the future may have a material adverse effect on our business, operating results, cash flows and financial condition. See "Item 4.B—Business overview—Regulation of mining activities in South Africa".
Legislation in South Africa on petroleum and energy activities may have an adverse impact on our business, operating results, cash flows and financial condition
Regulation of Petroleum Products
The Petroleum Products Amendment Act
The Petroleum Products Amendment Act (the Petroleum Act) requires persons involved in the manufacturing, wholesale and retail sale of petroleum products to obtain relevant licences for such activities. Sasol Oil, Natref and Sasol South Africa (Pty) Ltd submitted applications for their respective operations. The Sasol Oil wholesale and manufacturing licences; and Sasol South Africa (Pty) Ltd manufacturing licence applications have been approved and issued. The Natref manufacturing licence application is still under review by the Department of Energy.
18
Nevertheless, these facilities continue to operate as being persons who, as of the effective date of the Petroleum Act, are deemed to be holders of a licence until their applications have been finalised. Until this application has been finalised, we cannot provide assurance that the conditions of the licences may not have a material adverse impact on our business, operating results, cash flows and financial condition.
The Petroleum Act entitles the Minister of Energy to regulate the prices, specifications and stock holding of petroleum products and the status in this regard is as follows:
- •
- A regulatory price review was conducted by the Department of Energy which resulted in new price calculation methodologies for retail liquid
fuels and that have been implemented since December 2013;
- •
- Regulations to better align South African liquid fuels specifications with those prevailing in Europe were meant to come into force on
1 July 2017. None of the local refineries, including those of Sasol, would have been able to comply with these new specifications. The Minister of Energy however rescinded and amended the
regulations and will announce a new implementation date some time in the future. We are monitoring the changes in this regard as the significant risk for us as a local producer of fuels is that the
market demand and supply of cleaner fuels can overtake the regulatory date of the introduction of these fuels and/or the date we can convert our plants to meet this demand. Compliance with these new
specifications will require substantial capital investments at both Natref and Secunda Synfuels Operations. The amount of capital investment required has not yet been finalised and discussions with
the South African government regarding potential cost recoveries and/or incentives are on-going; and
- •
- Regulations to oblige licenced manufacturers and/or wholesalers to keep minimum levels of market-ready petrol,
diesel, illuminating paraffin, jet fuel and liquid petroleum gas (LPG) are currently under consideration by the Department of Energy. No indications on volumes, cost recovery, implementation date and compensation mechanisms are available as yet.
Regulation of pipeline gas activities in South Africa
The Gas Act
The Gas Act provides that the National Energy Regulatory of South Africa (NERSA) has the authority to issue licences for construction and operation of gas pipelines and trading in gas. NERSA also has the authority to approve gas transmission tariffs and maximum gas prices that may be charged by gas traders, where there is inadequate competition as contemplated in the South African Competition Act. The Gas Act further gives NERSA the authority to impose fines and other punitive measures for failure to comply with the licence conditions and/or the provisions of the Gas Act. Future regulation of maximum gas prices may have a material adverse effect on our business, operating results, cash flow and financial condition.
Pursuant to the NERSA decisions approving the Sasol Gas maximum gas prices and transmission tariffs, Sasol Gas implemented a standardised pricing mechanism in its supply agreements with customers in compliance with the applicable regulatory and legal framework. Seven of Sasol Gas's largest customers initiated a judicial review of the NERSA decisions relating to its maximum price and tariff methodologies and NERSA's decision on Sasol Gas's maximum price application. The review application proceedings were completed and the judgement upheld the NERSA approved pricing methodology. The gas customers have since appealed and we are awaiting the outcome of the appeal. We cannot assure you that the provisions of the Gas Act and the implementation of a new gas price and tariff methodology pursuant to the NERSA approvals, and the outcome of the appeal application, will not have a material adverse impact on our business, operating results, cash flows and financial condition.
19
Changes in safety, health and environmental regulations and legislation and public opinion may adversely affect our business, operating results, cash flows and financial condition
We are subject to a wide range of general and industry-specific environmental, health and safety and other legislation in jurisdictions in which we operate. See "Item 4.B—Business overview—Regions in which Sasol operates and their applicable legislation".
One of our most material challenges is the ability to anticipate and respond to the rapidly changing regulatory and policy context and associated stakeholder challenges in particular relating to environmental legislation in South Africa. Evolving legislation relating to air quality, climate change, water and waste management introduce profound regulatory challenges to our existing plants in South Africa. The quality, emission and disposal limit requirements imposed in our air quality, waste management and water use licenses for our South African operations are consequently becoming increasingly more stringent. These laws and regulations and their enforcement are likely to become more stringent over time in all jurisdictions in which we operate, although these laws in some jurisdictions are already more established and entrenched than in others. These compliance challenges are further impacted by the fact that, in some instances, legislation does not adequately provide for sufficient and/or flexible transitional arrangements for existing plants to comply with the imposed more stringent requirements. Compliance with these requirements is a significant factor in our business. We continue to effectively invest in significant capital and expenditures in order to comply with these requirements, our committed environmental roadmaps and offset commitments. We continue with transparent disclosures and engagements with our key stakeholders in an effort to address these challenges.
Changes to waste management legislation in South Africa particularly around landfill prohibitions, are compelling our South African operations to find alternative solutions to waste management and disposal. The changing
regulatory landscape introduces increasingly stringent waste disposal restrictions and punitive fiscal reform measures including waste levies. We are quantifying the potential costs associated with meeting these requirements. We will be dependent on regulatory authorities clarifying the interpretation and applicability of specific requirements to our waste streams, to determine whether there would be compliance challenges associated with technical and feasibility constraints. We may have to rely on mechanisms in law, such as exemption applications, to address potential waste management compliance challenges, the outcome of which cannot be guaranteed.
Although systems and processes are in place, monitored and improved upon, to ensure compliance with applicable laws and regulations, we cannot assure you that we will be in compliance with all laws and regulations at all times. For example, non-compliance with environmental, health or safety laws may occur, from system or human errors in monitoring our emissions of hazardous or toxic substances into the environment, such as our use of incorrect methodologies or defective or inappropriate measuring equipment, errors in manually capturing results, or other mistaken or unauthorised acts of our employees.
Public opinion is growing more sensitive and challenges are increasingly being raised to community and consumer health and safety associated with the manufacturing and use of chemicals and industries reliant on fossil fuels. Our manufacturing processes may utilise and result in the emission of or exposure to substances with potential health risks. We also manufacture products which may pose health risks. Although we remain committed to apply a duty of care principle and implement measures to eliminate or mitigate associated potential risks, including the Chemical and Allied Industries' Association Responsible Care® programme, we may be subject to liabilities as a result of the use or exposure to these materials or emissions. See Item 4.B "Business overview—Regulation" for more detail.
Consequently, markets may apply pressure on us concerning certain of our products,
20
feedstock, manufacturing processes, transportation and distribution arrangements. As a result of these additional pressures, the associated costs of compliance and other factors, we may be required to withdraw certain products from the market, which could have a material adverse effect on our business, operating results, cash flows, financial condition and reputation. In addition, as currently framed, the draft South African Chemicals Management Bill may impose significant requirements for the management of chemicals in our South African value chain. The scope of the impact on Sasol's business cannot be predicted at this time.
We may not be successful in attracting and retaining sufficiently skilled employees
We are highly dependent on the continuous development and successful application of new technologies. In order to achieve this, we need to maintain a focus on recruiting and retaining qualified scientists, engineers, project execution managers, artisans and operators. In addition, we are dependent on highly skilled employees in business and functional roles to establish new business ventures as well as to maintain existing operations.
The quality and availability of skills in certain labour markets is impacted by the challenges within the education and training systems in certain countries in which we operate.
Localisation, diversity and other similar legislation in countries in which we operate are also key considerations in the attraction and retention of sufficiently skilled employees. In an increasingly competitive market for limited skills, failure to attract and retain people with the right capabilities and experience could negatively affect our ability to operate existing facilities, to introduce and maintain the appropriate technological improvements to our business, as well as our ability to successfully construct and commission new plants or establish new business.
Intellectual property risks may adversely affect our freedom to operate our processes and sell our products and may dilute our competitive advantage
Our various products and processes, including most notably, our chemical, CTL and GTL products and processes have unique characteristics and chemical structures and, as a result, are subject to confidentiality and/or patent protection, the extent of which varies from country to country. Rapid changes in our technology commercialisation strategy may result in a misalignment between our intellectual property protection filing strategy and the countries in which we operate. The disclosure of our confidential information and/or the expiry of a patent may result in increased competition in the market for our products and processes, although the continuous supplementation of our patent portfolio reduces such risk to an extent. In addition, aggressive patenting by our competitors, particularly in countries like the US, may result in an increased patent infringement risk and may constrain our ability to operate in our preferred markets.
A significant percentage of our products can be regarded as commodity chemicals, some of which have unique characteristics and chemical structure which make the products suitable for different applications than the typical commodity products. These products are normally utilised by our customers as feedstock to manufacture specialty chemicals or application-type products. We have noticed a worldwide trend of increased filing of patents relating to the composition of product formulations and the applications thereof. These patents may create pressure on those of our customers who market these product formulations which may adversely affect our sales to these customers. These patents may also increase our risk to exposure from limited indemnities provided to our customers of these products in case there is a patent infringement which may impact the use of the product on our customers' side. Patent-related pressures may adversely affect our business, operating results, cash flows and financial condition.
We believe that our proprietary technology, know-how, confidential information and trade
21
secrets provide us with a competitive advantage. A possible loss of experienced personnel to competitors, and a possible transfer of know-how and trade secrets associated therewith, including the patenting by our competitors of technology built on our know-how obtained through former employees may negatively impact this advantage.
Similarly, operating and licensing technology in countries in which intellectual property laws are not well established and enforced may result in an inability to effectively enforce our intellectual property rights. The risk of some transfer of our know-how and trade secrets to our competitors is increased by the increase in the number of licences granted under our intellectual property, as well as the increase in the number of licenced plants which are brought into operation through entities which we do not control. As intellectual property warranties and indemnities are provided under each new licence granted, the cumulative risk increases accordingly.
The above risks may adversely affect our business, operating results, cash flows and financial condition.
Increasing competition in relation to products originating from countries with low production costs may adversely affect our business, operating results, cash flows and financial condition
Certain of our chemical production facilities are located in developed countries, including the US and Europe. Economic and political conditions in these countries result in relatively high labour costs and, in some regions, relatively inflexible labour markets. Increasing competition from regions with lower production costs and more flexible labour markets, for example the Middle East, India and China, exerts pressure on the competitiveness of our chemical products and, therefore, on our profit margins. This could result in the withdrawal of particular products or the closure of specific facilities, which may have a material adverse effect on our business, operating results, cash flows and financial condition.
We may face potential costs in connection with industry-related accidents or deliberate acts of terror causing property damage, personal injuries or environmental contamination
We operate coal mines, explore for and produce oil and gas and operate a number of plants and facilities for the manufacture, storage, processing and transportation of oil, chemicals and gas, related raw materials, products and wastes. These facilities and their respective operations are subject to various risks, such as fires, explosions, releases and loss of containment of hazardous substances, soil and water contamination, flooding and land subsidence, among others. As a result, we are subject to the risk of, and in the past have experienced, industry-related incidents. Our facilities are also subject to the risk of deliberate acts of terror.
Our main Secunda Synfuels production facilities are concentrated in a relatively small area in Secunda, South Africa. The size of the facility is approximately 82,5 square kilometres (km2) with operating plants accounting for 8,35 km2. This facility utilises feedstock from our mining and gas businesses, while the chemical and energy businesses rely on the facility for the raw materials it produces. Accidents and acts of terror may result in damage to our facilities and may require shutdown of the affected facilities, thereby disrupting production and increasing production costs and may in turn disrupt the mining, gas, chemicals and oil businesses which make up a significant portion of our total income. Furthermore, accidents or acts of terror at our operations may have caused, or may in future cause, environmental contamination, personal injuries, health impairment or fatalities and may result in exposure to extensive environmental remediation costs, civil litigation, the imposition of fines and penalties and the need to obtain or implement costly pollution control technology.
Our products are ultimately sold to customers around the world and this exposes us to risks related to the transportation of such products by road, rail, pipelines or marine vessels. Such activities take place in the public
22
domain exposing us to incident risks over which we have limited control.
It is Sasol's policy to procure appropriate property damage and business interruption insurance cover for its production facilities above acceptable deductible levels at acceptable commercial premiums. However, full cover for all loss scenarios may not be available at acceptable commercial rates, and we cannot give any assurance that the insurance procured for any particular year would cover all potential risks sufficiently or that the insurers will have the financial ability to pay all claims that may arise.
The costs we may incur as a result of the above or related factors could have a material adverse effect on our business, operating results, cash flows and financial condition.
We may face the risk of information security breaches or attempts to disrupt critical information technology services, which may adversely impact our operations
The increasing use of information technology (IT) systems in operations is making all industries, including the energy and chemicals industries, much more susceptible to cyber threats. IT systems with related IT services include our financial, commercial, transacting and production systems. Sasol has an information security program in place to mitigate the risks that come with information security breaches but recognises that if there is a breach of information security we can experience disruptions of IT services, or in worst case scenario, could have a material adverse effect on our business, operating results, cash flows and financial condition and our disclosure control processes.
We may not be able to exploit technological advances quickly and successfully or competitors may develop superior technologies
Most of our operations, including the gasification of coal and the manufacture of synfuels and petrochemical products, are highly dependent on the use of advanced technologies. The development, commercialisation and integration of the appropriate advanced
technologies can affect, among other things, the competitiveness of our products, the continuity of our operations, our feedstock requirements and the capacity and efficiency of our production.
It is possible that new technologies or novel processes may emerge and that existing technologies may be further developed in the fields in which we operate. Unexpected advances in employed technologies or the development of novel processes can affect our operations and product ranges in that they could render the technologies we utilise or the products we produce obsolete or less competitive in the future. Difficulties in accessing new technologies may impede us from implementing them and competitive pressures may force us to implement these new technologies at a substantial cost.
In addition to the technological challenges, a number of our expansion projects are integrated across our value chain. Delays with the development of an integrated project might, accordingly, have an impact on more than one business segment.
Our ability to compete will depend on our timely and cost-effective implementation of new technological advances. It will also depend on our success in commercialising these advances irrespective of competition we face. Any failure to do so could result in a material adverse effect on our business, operating results, cash flows and financial condition.
In the US, we recognised a partial impairment in 2017, of R1 697 million (US$130 million), relating to our GTL project, mainly driven by exposure to low crude oil prices, project execution and delayed start-ups, changes in technology, and the nature of the costs currently capitalised, and whether these costs would have any value should the project recommence.
The exercise of voting rights by holders of American Depositary Receipts is limited in some circumstances
Holders of American Depositary Receipts (ADRs) may exercise voting rights with respect to the ordinary shares underlying their American
23
Depositary Shares (ADSs) only in accordance with the provisions of our deposit agreement (Deposit Agreement) with The Bank of New York Mellon, as the depositary (Depositary). For example, ADR holders will not receive notice of a meeting directly from us. Rather, we will provide notice of a shareholders meeting to The Bank of New York Mellon in accordance with the Deposit Agreement. The Bank of New York Mellon has undertaken in turn, as soon as practicable after receipt of our notice, to mail voting materials to holders of ADRs. These voting materials include information on the matters to be voted on as contained in our notice of the shareholders meeting and a statement that the holders of ADRs on a specified date will be entitled, subject to any applicable provision of the laws of South Africa and our Memorandum of Incorporation, to instruct The Bank of New York Mellon as to the exercise of the voting rights pertaining to the shares underlying their respective ADSs.
Upon the written instruction of an ADR holder, The Bank of New York Mellon will endeavour, in so far as practicable, to vote or cause to be voted the shares underlying the ADSs in accordance with the instructions received. If instructions from an ADR holder are not received by The Bank of New York Mellon by the date specified in the voting materials, The Bank of New York Mellon will not request a proxy on behalf of such holder. The Bank of New York Mellon will not vote or attempt to exercise the right to vote other than in accordance with the instructions received from ADR holders.
We cannot assure you that you will receive the voting materials in time to ensure that you can instruct The Bank of New York Mellon to vote the shares underlying your ADSs. In addition, The Bank of New York Mellon and its agents are not responsible for failing to carry out voting instructions or for the manner of carrying out voting instructions. This means that you may not be able to exercise your right to vote and there may be no recourse if your voting rights are not exercised as you directed.
Sales of a large amount of Sasol's ordinary shares and ADSs could adversely affect the prevailing market price of the securities
Historically, trading volumes and liquidity of shares listed on the JSE Limited (JSE) have been low in comparison with other major markets. The ability of a holder to sell a substantial number of Sasol's ordinary shares on the JSE in a timely manner, especially in a large block trade, may be restricted by this limited liquidity. The sales of ordinary shares or ADSs, if substantial, or the perception that these sales may occur and be substantial, could exert downward pressure on the prevailing market prices for the Sasol ordinary shares or ADSs, causing their market prices to decline.
ITEM 4. INFORMATION ON THE COMPANY
4.A History and development of the company
Sasol Limited, the ultimate holding company of our group, is a public company. It was incorporated under the laws of the Republic of South Africa in 1979 and has been listed on the JSE Limited (JSE) since October 1979. Our registered office and corporate headquarters are at Sasol Place, 50 Katherine Street, Sandton, 2196, South Africa, and our telephone number is +27 10 344 5000. Our agent for service of process in the United States is Puglisi & Associates, 850 Library Avenue, Suite 204, P.O. Box 885, Newark, Delaware 19715.
For a description of the company's principal capital expenditures and divestitures refer to "Item 5.B—Liquidity and capital resources".
4.B Business overview
Sasol is an international integrated chemicals and energy company that, through its talented people, uses selected technologies to safely and sustainably source, produce and market chemical and energy products competitively to create superior value for our customers, shareholders and other stakeholders.
24
For details regarding the following sections, refer as indicated.
- •
- For information regarding our Business Overview, refer "Our Operating Model Structure" as contained in Exhibit 99.4;
- •
- For information regarding our Strategy, refer "Integrated Report—"Our strategy" as contained in Exhibit 99.5; and "Our
integrated value chain" as contained in Exhibit 99.6;
- •
- For a description of the company's operations and principal activities refer "Our Operating Model Structure" as contained in
Exhibit 99.4; "Integrated Report—Operational reviews" as contained in Exhibit 99.7; and Item 18—"Annual Financial Statements—Segment
information"; and
- •
- For a description of our principal markets, refer to Item 18—"Annual Financial Statements—Geographic segmentation", which provides information regarding the geographic location of the principal markets in which we generate our turnover, as well as of our asset base.
Seasonality
Production and sales volumes of our products are generally not subject to seasonal fluctuations, but tend to follow broader global industry trends and are therefore impacted by macro-economic factors. Sasol operates globally and in many diverse markets, and accordingly, no element of seasonality is likely to be material to the results of Sasol as a whole. For further information regarding cyclicality and prices and demand, refer to Item 3.D—"Risk Factors".
Raw materials
In the Southern Africa value chain, the main feedstock components for the production of fuels and chemical products are coal obtained from Mining, natural gas obtained from Exploration and Production International and crude oil purchased from external suppliers.
In our Performance Chemicals business, the main feedstocks used are kerosene, benzene, ethane, ethylene, oleochemical and aluminium. Feedstocks are purchased externally, with the exception of a portion of ethylene which is produced at our Lake Charles facility and the Fischer-Tropsch-based feedstock used for our South African alcohol, wax, ammonia, phenolics, and co-monomer production. The pricing of most of these raw materials follow global market dynamics which relate to crude oil and energy prices.
Marketing channels and principal markets
In our Operating Business Units, we make use of direct sales models, long-term marketing gas sales agreements and short-term crude oil sale and purchase agreements.
Our Regional Operating Hubs channel their products through the Strategic Business Units to external markets.
In our Strategic Business Units, marketing channels can be divided into the following main areas:
Energy:
- •
- Liquid fuel sales to licensed wholesalers;
- •
- Liquid fuels direct marketing (retail and commercial markets in South Africa);
- •
- Natural gas marketing in South Africa (wholesale and commercial markets);
- •
- Liquid fuels overland exports into other parts of Southern Africa; and
- •
- Electricity sales to Eskom and Electricidade de Moçambique (EDM) in Mozambique.
Base chemicals:
- •
- Polymer products are mainly sold directly to customers in South Africa and internationally;
- •
- Solvents products are sold through 13 regional sales offices and 9 storage hubs in South Africa, Europe, the Asia-Pacific region, the Middle East and the United States; and
25
- •
- Fertiliser and explosives are sold mainly within Southern Africa.
Performance chemicals:
- •
- The majority of products are sold globally, directly to end-user customers under annual and multi-year contracts.
Factors on which the business is dependent
Intellectual property
Our proprietary or licensed technologies, our software licences, procedures and protocols support Sasol's competitive advantage.
- •
- Skilled, experienced and technically qualified employees, industry thought leaders and experts that enable Sasol to respond to the constantly
changing environment;
- •
- Our patented technologies; and
- •
- Our business processes and management systems.
Intellectual Capital summary |
2017 | 2016 | ||
|---|---|---|---|---|
Number of new patents issued |
190 | 429 | ||
Total worldwide patents held |
2 216 | 2 023 | ||
Investment in research and development |
R1 077 million | R1 105 million |
The Sasol Slurry Phase DistillateTM (SPDTM) process—Based on our Technology function's extensive experience in the commercial application of the Fischer-Tropsch (FT) technology, we have successfully developed the FT-based Sasol SPDTM process for converting natural gas into high-quality, environment-friendly GTL diesel, GTL kerosene and other liquid hydrocarbons.
The SPDTM process consists of three main steps, each of which is commercially proven. These include:
- •
- the Haldor Topsøe reforming technology, which converts natural gas and oxygen into syngas;
- •
- our Slurry Phase Distillate FT technology, which converts syngas into hydrocarbons; and
- •
- the Chevron IsocrackingTM technology, which converts hydrocarbons into particular products, mainly diesel, naphtha and LPG.
Currently we believe, based on our knowledge of the industry and publicly available information, that globally, we have the most extensive experience in the application of FT technology on a commercial scale. Given the increasing discovery of extensive natural gas resources, our Sasol SPDTM process can be applied with significant commercial advantages in various parts of the world. As a consequence, our technology has evoked interest from countries and companies with extensive natural gas resources as an appealing alternative for commercialising these resources. The Sasol SPDTM process converts natural gas into diesel and other liquid hydrocarbons, which are generally more environmentally friendly and of higher quality and performance compared to the equivalent crude oil-derived products. In view of product specifications gradually becoming more stringent, especially with respect to emissions, we believe that the option of environmentally friendly GTL fuels will become increasingly appealing. GTL diesel can be used with optimised engines for best performance, although it can also be utilised with current compression ignition engines. GTL diesel is currently used as a cost-competitive blend stock for conventional diesels, thereby enabling conventional diesel producers to improve the quality and capacity of their product without investing substantially in sophisticated new plants and infrastructure. We anticipate that the combined factors of GTL diesel's superior characteristics and the prevailing market conditions in developed economies will enable GTL diesel to command premium prices for either niche applications or as a blend stock for upgrading lower-specification products. The construction of GTL facilities and the production of GTL fuels require significant capital investment.
Key contracts
ORYX GTL, our 49% joint venture in Qatar, purchases natural gas feedstock from Al Khaleej Gas, a joint venture between
26
ExxonMobil Middle East Gas Marketing Limited and Qatar Petroleum, under a gas purchase agreement with a contracted minimum off-take volume. The agreement commenced in November 2005 and is valid for a term of 25 years. The term of the agreement may be extended by the parties on terms and conditions that are mutually agreed.
Escravos GTL (EGTL), in which we hold a 10% indirect economic interest, purchases 100% of its gas requirements for the EGTL plant from Chevron Nigeria Limited (CNL) and Nigerian National Petroleum Corporation (NNPC), the upstream joint venture partners. The agreement commenced from the date of commission of each unit and is valid for 25 years after the start of beneficial operation which was during June 2014. The term of the agreement may be extended by the parties on terms and conditions that are mutually agreed.
The marketing agreement between Sasol Chevron Holdings Limited (a 50% owned joint venture) and EGTL in respect of diesel and naphtha will cease in November 2017. Thereafter, EGTL will be responsible for the marketing of its own products.
Central Térmica de Ressano Garcia (CTRG), our 49% joint venture in Mozambique, purchases natural gas feedstock produced from our natural gas asset Pande-Temane PPA, which is managed by an unincorporated joint venture comprising of Sasol's subsidiary Sasol Petroleum Temane Limitada (SPT), and partners Companhia Mozambique de Hidrocabonetos (CMH) and the International Financial Corporation (IFC). CTRG also has a gas transport agreement with the Republic of Mozambique Pipeline Investment Company (ROMPCO) and a power purchase agreement with Electricidade de Mozambique (EDM). The term of the agreements commenced on 27 February 2015 and is valid for 20 years.
Ethane and propane used as feedstock for the cracker in Malaysia (12% shareholding) (PETRONAS Chemicals Olefins Sdn Bhd), is purchased from PETRONAS at a set price, which escalates annually in line with US inflation rates.
Refer to Item 4.D—Exploration and Production International" for detail regarding key contracts in Gabon and Mozambique.
Legal proceedings and other contingencies
From time to time, Sasol companies are involved in litigation, tax and similar proceedings in the normal course of business. Although the outcome of these claims and disputes cannot be predicted with certainty, a detailed assessment is performed on each matter, and a provision is recognised, or contingent liability disclosed, where appropriate in terms of International Financial Reporting Standards.
The South African Revenue Service ("SARS") has issued revised assessments for Sasol Oil (Pty) Ltd ("Sasol Oil") relating to a dispute around its international crude oil procurement activities for the 2005 to 2012 tax years. These revisions could result in potential adjustments to the company's taxable income and an additional tax liability including interest and penalties of approximately R1,2 billion for the periods 2005 to 2014.
Sasol Oil has co-operated fully with SARS during the course of the audit related to these assessments. SARS' decisions to suspend the payment of this disputed tax for the periods 2005 to 2012 currently remain in force. The litigation process in the Tax Court, relating to the international crude oil procurement activities for the 2005 to 2007 years of assessment was concluded and judgement was delivered on 30 June 2017 in favour of SARS. As a result, a liability of R1,2 billion has been recognised in the annual financial statements in respect of the 2005 to 2014 matters that remain the subject of the ongoing litigation.
Sasol Oil, in consultation with its tax and legal advisors, does not support the basis of the judgement and issued a Notice of Intention to Appeal to the Supreme Court of Appeal on 31 July 2017. The Tax Court granted Sasol Oil's application for leave to appeal to the Supreme Court of Appeal on 14 August 2017.
SARS has notified Sasol Oil of its intention to place on hold the field audit relating to this issue for the 1999 to 2004 tax years pending the
27
outcome of the litigation. As a result of the judgement handed down on 30 June 2017, a possible obligation may arise from the field audit, which is regarded as a contingent liability.
In addition, there could be a potential tax exposure of R11,6 billion for the periods 2013 to 2014 on varying tax principles relating to the aforementioned activities. Supported by its specialist tax and external legal advisors, Sasol Oil disagrees with SARS' assessment for 2013 and 2014 periods. Accordingly, Sasol Oil has submitted an objection to the revised assessments and requested suspension of payment.
Sasol Oil and SARS have come to a resolution with regards to the request for suspension of payment, resulting in SARS suspending payment for the significant majority of the disputed tax. Further based on the outcome of the Tax Court judgement, a possible obligation may arise for the tax years subsequent to 2014, which could give rise to a further contingent liability at 30 June 2017.
Following a judgement by the South African Constitutional Court in 2011, which confirmed the right of employees in the mining industry who contracted certain occupational diseases to claim damages from their employers, a number of legal cases were instituted in South Africa. Similar cases have also been threatened against participants in the coal sector of the mining industry. As a result of the Constitutional Court judgement referred to above, Sasol Mining is currently the defendant in three separate litigation matters. The first matter was instituted by 22 claimants who allege that they have contracted coal dust related lung diseases, including pneumoconiosis, while in Sasol Mining's employment. This claim was followed by two separate but similar claims instituted by single individuals.
The first lawsuit is not a class action but rather 22 individual cases, each of which will be judged on its own merits. The plaintiffs seek
compensation for damages relating to past and future medical costs and loss of income amounting to R82,5 million in total. Sasol Mining is defending the claim.
The merits of each single claim are not yet clear. There is also some uncertainty as to whether one or more of the claims has become prescribed. Therefore, it is not possible at this stage to make an estimate of the likelihood that the plaintiffs will succeed with their claim and if successful, what the quantum of damages would be that the court will award. Therefore, no provision has been raised at 30 June 2017.
Further, from time to time, communities and non-governmental organisations challenge our environmental licences and related applications on the basis of concerns regarding potential health and environmental impacts associated with Sasol's activities.
For instance, the South African National Environmental Management: Air Quality Act prescribed minimum emission standards, applicable to existing plants which had to be complied with starting on 1 April 2015. Some parts of our operating units in South Africa were not able to comply with the new emission standards, and accordingly, applied for postponements. On 24 February 2015, the Department of Environmental Affairs issued the postponement decisions and an administrative appeal lodged against those by the Legal Resources Centre in South Africa was dismissed by the Minister of Environmental Affairs. Sasol continues to operate under atmospheric emission licences that incorporate these postponement decisions. In those instances where Sasol was granted compliance extensions for less than the five years it initially requested, Sasol has either received or has made application for further postponements. It is uncertain whether these further postponement applications will be granted or whether they will be challenged by third parties and if so, whether any decisions granted in respect thereof can always be successfully defended. In case of a postponement decision being declared invalid, the consequences for Sasol may be material as operating units may be found in non-compliance with the aforementioned Air Quality Act and the
28
associated atmospheric emission licence which may trigger substantial investment requirements or even a cease operation decision by the competent authorities.
Competition law compliance
Sasol continuously evaluates its compliance programmes and controls in general, including its competition law compliance programme and controls. As a consequence of these compliance programmes and controls, including monitoring and review activities, Sasol has adopted appropriate remedial and/or mitigating steps, where necessary or advisable, lodged leniency applications and made disclosures on material findings as and when appropriate. These ongoing compliance activities have already revealed, and may still reveal, competition law contraventions or potential contraventions in respect of which we have taken, or will take, appropriate remedial and/or mitigating steps including lodging leniency applications.
The South African Competition Commission is conducting an investigation into the South African petroleum products industry. Sasol continues to interact and co-operate with the Commission.
To the extent appropriate, further announcements on competition law matters will be made in future.
Environmental Orders
Sasol is subject to loss contingencies pursuant to numerous national and local environmental laws and regulations that regulate the discharge of materials into the environment and that may require Sasol to remediate or rehabilitate the effects of its operations on the environment. The contingencies may exist at a number of sites, including, but not limited to, sites where action has been taken to remediate soil and groundwater contamination. These future costs are not fully determinable due to factors such as the unknown extent of possible contamination, uncertainty regarding the timing and extent of remediation actions that may be required, the allocation of the environmental obligation among multiple parties, the discretion of regulators and changing legal requirements.
Sasol's environmental obligation accrued at 30 June 2017 was R15 716 million compared to R17 128 million at 30 June 2016. Included in this balance is an amount accrued of approximately R5 816 million in respect of the costs of remediation of soil and groundwater contamination and similar environmental costs. These costs relate to the following activities: site assessments, soil and groundwater clean-up and remediation, and on-going monitoring. Due to uncertainties regarding future costs, the potential loss in excess of the amount accrued cannot be reasonably determined.
Although Sasol has provided for known environmental obligations that are probable and reasonably estimable, the amount of additional future costs relating to remediation and rehabilitation may be material to the results of the operations in the period in which they are recognised. It is not expected that these environmental obligations will have a material effect on the financial position of the group.
Regulation
The South African government has, over the past 20 years, introduced a legislative and policy regime with the imperative of redressing historical social and economic inequalities, as stated in the Constitution of the Republic of South Africa, by way of the empowerment of historically disadvantaged South Africans (HDSAs) in the areas of ownership, management and control, employment equity, skills development, procurement, enterprise development and socio-economic development.
The majority of our operations are based in South Africa, but we also operate in numerous other countries throughout the world. In South Africa, we operate coal mines and a number of production plants and facilities for the storage, processing and transportation of raw materials, products and wastes related to coal, oil, chemicals and gas. These facilities and the respective operations are subject to various laws and regulations that may become more stringent and may, in some cases, affect our business, operating results, cash flows and financial condition.
29
Our business activities in South Africa relating to coal mining, petroleum production, distribution and marketing of fuel products, electricity and gas are subject to regulation by various government departments and independent regulators. Refer to "Item 3.D—Risk factors" for details on particular aspects of regulation affecting our business activities.
Empowerment of historically disadvantaged South Africans
Black Economic Empowerment policies and legislation
Broad-based Black Economic Empowerment Act, 53 of 2003
Sasol is well aligned with the economic transformation and sustainable development objectives embodied in the South African legislative and regulatory framework governing Broad-Based Black Economic Empowerment (B-BBEE). The key elements of this framework are the B-BBEE Act and the Codes of Good Practice (the new Codes were gazetted on 11 October 2013 and promulgated on 1 May 2015) for B-BBEE issued by the Minister of Trade and Industry in terms of the Act (Codes), as well as the Charters (i.e. the Mining Charter and Liquid Fuels Charter) adopted by the various sectors within which Sasol operates businesses and related scorecards.
Transformation is an essential part of the group's strategy, and thus our B-BBEE framework and plans have been developed to ensure that measurable progress is made towards sustainable economic transformation. Our approach is intrinsically collaborative and the business works together with all of our stakeholders—customers, partners, suppliers and the public sector, including government. Our approach to transformation is thus much more than just meeting targets and we are committed to constant evaluation of our achievements, as well as tackling challenges and leveraging new opportunities.
Sasol continues to support the goals of the National Development Plan (NDP) 2030, B-BBEE, Employment Equity and Skills Development Acts. Sasol supports the broader
objectives of skills development and has been a significant contributor to skills development and in turn socio-economic development in South Africa over the years. Through various management training programmes, Sasol has notably built a pipeline of black managers who are moving from junior management to middle management positions and have made strides in this area. Furthermore Sasol provides support to small, medium and micro-sized enterprises (SMMEs) which includes loan funding to majority black-owned suppliers through the Sasol Siyakha Enterprise and Supplier Development Fund and, business development and incubation support through our Sasol Business Incubator located in Sasolburg. Being a credible corporate citizen and member of the communities in which we operate is at the core of our approach to our socio-economic development contribution. As a result, we have realigned our social investments towards programmes that enable access to quality education; stimulate local economic development and job creation, bolster the pool of technical, vocational and science, technology, engineering and mathematics-related skills; facilitate collaboration to advance the delivery of municipal services; and promote the protection of the environment.
Our most recent certification issued in April 2017 remained at a contributor status of level 8 and represents a key milestone in our transformation efforts, with year on year improvements once again being realised across most pillars of the scorecard.
Sasol continues to entrench transformation within the organisational culture, enhancing its commitment as a corporate citizen.
Sasol Inzalo share transaction
In 2008, Sasol entered into the Sasol Inzalo black economic empowerment (BEE) share transaction, which resulted in the transfer of beneficial ownership of 10% (63,1 million shares) of Sasol Limited's issued share capital before the implementation of this transaction, to its employees and a broad-based group of black South Africans (BEE participants). This transaction will contractually unwind during the period June to September 2018. Refer to
30
"Item 18—Annual Financial Statements—Note 34—Share based payment reserve".
The revised Mining Charter
The revised Mining Charter requires mining companies to meet various criteria intended to promote meaningful participation of HDSAs in the mining sector.
The revised Mining Charter was published on 15 June 2017. The revised Mining Charter is intended to ensure alignment between the B-BBEE Act and the Mining Charter. The revised Mining Charter introduces a number of new requirements which may have a material adverse effect on Sasol. The increase of Black shareholding in respect of prospecting rights, from 26% to 51%, will impact on existing prospecting rights under application or renewal and the transfer of prospecting rights recently acquired. The introduction of various categories of shareholders, that must be included in any future Black economic empowerment transactions, as well as the increase in the minimum required Black shareholding from 26% to 30%, will have an impact on future applications for mining rights. The holder of a mining right granted after 15 June 2017 will be required to pay 1% of annual turnover to its Black shareholders, prior to and over and above any distributions to shareholders, which may have a significant financial impact on Sasol. The revised Mining Charter determines that the "once empowered always empowered" principle is not applicable which means, for instance, that in the event any existing B-BBEE shareholders decide to sell their shares, the company would be required to look for new B-BBEE shareholders, who in turn might require Sasol-assisted financing for their purchases of such shares. The revised Mining Charter also introduces the contribution of funds to the Mining Transformation and Development Agency, still to be established. Stringent requirements in respect of procurement, supplier and enterprise development are set, which includes compulsory procurement of 80% of services from Black-owned (50% + 1 vote) companies, Black-female and Black youth-owned companies.
The Chamber of Mines applied to the High Court for an urgent interdict to suspend the implementation of the revised Mining Charter until such a time as an application for a judicial review of the revised Mining Charter has been dealt with. The Chamber of Mines also requested the Court to proceed with the application for a declaratory order to determine whether the "once empowered always empowered" principle is still applicable and this application will be heard in the High Court on 9 and 10 November 2017. The Minister of Mineral Resources announced that it would not implement the revised Mining Charter pending the completion of the litigation. Sasol is assessing the impact of the revised Mining Charter on its business.
The Mineral and Petroleum Resources Development Amendment Bill
The Mineral and Petroleum Resources Development Amendment Bill (the MPRDA Bill) was introduced during June 2013 after it went through the parliamentary process. The MPRDA Bill was sent back by the President to Parliament for reconsideration based on certain concerns about the MPRDA Bill's constitutionality. The MPRDA Bill was reviewed and amended. The legislative process is currently still ongoing.
The MPRDA Bill contains certain provisions that may have a material negative effect on the mining industry. These include elevating the Codes of Good Practice for the South African Minerals Industry, the Housing and Living Conditions Standards for the Mineral Industry and the Amended Broad-Based Socio Economic Empowerment Charter for the South African Mining and Minerals Industry to the status of legislation without such documents having followed the normal route to create legislation. Another potential negative material effect on the mining industry is linked to the obligation on mining companies to sell a certain percentage of their production to local beneficiaries at a so-called "mine gate price" which price will most likely be lower than the price that the producer can sell the minerals for in the open market.
31
The Liquid Fuels Charter
In 2000, following a process of consultation, the Department of Minerals and Energy (now the Department of Energy) and a number of companies in the liquid fuels industry, including Sasol Oil, signed the Liquid Fuels Charter (the Charter) which sets out the principles for the empowerment of HDSAs in the South African petroleum and liquid fuels industry. The Charter requires liquid fuels companies, including Sasol Oil, to ensure that HDSAs hold at least 25% equity ownership in the South African entity holding their operating assets by the end of a period of 10 years from the date of the signing of the Charter.
The Charter also requires liquid fuels companies to adopt policies to further other empowerment objectives of the Charter, among other things, employment equity, preferential procurement and skills development.
In order to meet the equity ownership objective of the Charter, Sasol Limited concluded a BEE transaction with an HDSA-owned company, Tshwarisano LFB Investment (Pty) Ltd (Tshwarisano), in terms of which Sasol Limited disposed of 25% of its shareholding in Sasol Oil to Tshwarisano. With effect from 1 July 2006, Sasol Oil met the 25% BEE ownership target, with Tshwarisano holding 25% of the shares in Sasol Oil in line with the Charter.
Tshwarisano's shareholding is fully unencumbered after it settled the last of its debt relating to its equity shareholding in February 2016. In September 2016 and March 2017, Tshwarisano disbursed R132,7 million in dividends to the Batho Trust, which consists of broad-based beneficiaries, including several non-profit organisations.
The Charter further provides for the evaluation by the Department of Energy, from time to time, of the industry's progress in achieving the objectives of the Charter. Given the fact that the aforementioned 10-year period had run its course, the Department of Energy initiated a compliance audit in respect of the Charter in the latter part of the 2010 calendar year. Sasol Oil's compliance with the Charter
was audited during the first half of the 2011 calendar year and the final industry report, albeit that the written report has not yet been issued to industry, has been discussed with industry by the Department of Energy on an aggregated basis. Together with the other members of the South African Petroleum Industry Association (SAPIA), Sasol Oil is involved in the ongoing engagements with the Department of Energy regarding the status and possible review of the Liquid Fuels Charter in the context of section 12 of the Broad-based Black Economic Empowerment Act, 53 of 2003, which provides for the development and promulgation of transformation charters to apply to a particular sector of the economy. In addition to the aforementioned engagement of industry with the Department of Energy, engagements are also ongoing between the Department of Energy and the Department of Trade and Industry relating to a possible revised charter or alignment of the Liquid Fuels Charter with the B-BBEE Codes for the liquid fuels industry. To date no draft or revised charter has been completed or published. Consequently, any effect of such future regulation on Sasol cannot be assessed yet.
The Restitution of Land Rights Act, 22 of 1994
Our privately held land could be subject to land restitution claims under the Restitution of Land Rights Act, 22 of 1994. Under this act, any person who was dispossessed of rights to land in South Africa as a result of past racially discriminatory laws or practices is granted certain remedies, including, but not limited to the restoration of the land claimed with or without compensation to the holder.
Mining rights
Sasol Mining is the holder of mining rights in terms of the Mineral and Petroleum Resources Development Act, 2002, in respect of its operations in the Mpumalanga and Free State provinces in South Africa.
The current mining rights have been granted until 2040, and can be renewed for further periods of 30 years at a time depending on the approval of the competent authorities and the applicable legal framework at that point in time.
32
Safety, health and environment
Regions in which Sasol operates and their applicable legislation
South Africa
The major part of our operations is located in South Africa. We operate a number of plants and facilities for the manufacture, storage, processing and transportation of chemical feedstock, products and wastes. These operations are subject to numerous laws and regulations relating to safety, health and the protection of the environment.
Environmental regulation
The Constitution of the Republic of South Africa (the Constitution) contains the underlying right which must be given effect to by environmental legislation in South Africa. The South African National Environmental Management Act is therefore the framework Act which primarily aims to give effect to the Constitutional environmental right. It also underpins specific environmental management acts, such as the National Environmental Management: Waste Act, the National Water Act and the National Environmental Management: Air Quality Act which all, in turn, regulate specific environmental media and the associated regulation of potential impacts thereon. The National Environmental Management: Waste Act also specifically regulates the process for management of contaminated land. These Acts also provide for enforcement mechanisms as well as provisions for the imposition of criminal sanction. These also apply to mining activities.
Apart from its international commitments, climate change mitigation regulation in South Africa is still being developed. Sasol continues to engage with the South African government on the development of pollution prevention plans, a draft Carbon Tax Bill as well as the imposition of mandatory carbon budgets. Sasol has received and agreed to the carbon budget allocated to it, which is in place until 2020. Mandatory greenhouse gas reporting will begin in 2018, although the regulations pertaining thereto were published in 2017. Sasol's engagement focuses on
the need for alignment of mitigation instruments in an effort to create long-term policy certainty.
For information regarding our challenges associated with these regulatory requirements refer to "Item 3.D—Risk factors".
Health and safety
Occupational health and safety is governed by the Occupational Health and Safety Act and the Mine Health and Safety Act for compensation of employees who suffer occupationally related diseases or injuries. Specific requirements for chemicals and hazardous substances are currently regulated by the Hazardous Substances Act.
Germany and Italy
In Germany and Italy, we operate a number of plants and facilities for the manufacture, storage, processing and transportation of chemical feedstock, products and waste. These operations are subject to numerous laws and ordinances relating to safety, health and the protection of the environment. The objectives and requirements of these legal frameworks are largely consistent with that of the South African Framework, although more established and pervasive in some respects.
Hazardous substances
Provisions for the protection of humans and the environment against the harmful effects of hazardous substances and preparations are provided in the Chemicals Acts, and related ordinances on the Prohibition of Certain Chemicals and Hazardous Incidents. All hazardous substances are subject to the requirements of the European Union (EU) Registration, Evaluation, Authorisation and Restriction of Chemicals (REACH) Regulation, including requirements for registration and notification obligation before these substances can be brought onto the market. Hazardous substances and mixtures must be classified, labelled and packed in accordance with the EU classification, labelling and packaging regulation. Further regulations prohibiting and limiting manufacture, marketing and use also apply.
33
United States
In the US, we operate a number of plants and facilities for the storage and processing of chemical feedstock, products and wastes. Sasol's US operations and growth projects are subject to numerous laws, regulations and ordinances relating to safety, health and the protection of the environment. The objectives and requirements of these legal frameworks are largely consistent with that of the South African Framework, although more established and entrenched in some respects.
Hazardous substances are, in particular, regulated by a standard that incorporates the requirements of the Globally Harmonised System for classification and labelling of chemicals into occupational health and safety legislations. Chemical manufacturers and importers are required to evaluate the hazards of the chemicals they produce or import, and prepare labels and safety data sheets to convey the hazard information to their downstream customers.
Regulation relating to climate change in the US at federal level is currently uncertain given the announced policies of the Trump administration. However, in most states, climate change regulation continues to be developed.
Canada
Oil and natural gas production
The British Columbia (BC) Petroleum and Natural Gas Act and Environmental Management Act are the primary sources of regulatory controls over our natural oil and gas-producing areas in Canada. The acts and supporting legislation are administered by the BC Oil & Gas Commission to regulate the oil and gas industry and ensure public safety, environmental protection, conservation of petroleum resources and equitable participation in production. Regulations aimed at achieving methane reductions have recently been published.
In late 2016, the Canadian federal government announced a national carbon price programme which will require all provinces and territories to have carbon pricing initiatives in
effect by 2018 at a minimum of CAD10/tonne of CO2 equivalent emissions, to increase by CAD10/tonne annually until it reaches CAD50/tonne in 2022. The introduction of the national carbon price programme should have a relatively minor financial impact on Sasol's Canadian operations.
Mozambique
A National Environmental Policy (Resolution 5/95) is the government document outlining the priorities for environmental management and sustainable development in Mozambique, including the required legal framework. The Environmental Law (Law 20/1997) provides a legal framework for the use and correct management of the environment and its components and to assure sustainable development in Mozambique. The Regulations on Environmental Impact Assessment (Decree 54/2015) set forth the procedures applicable for the granting of environmental licences.
The Environmental Regulations for Petroleum Operations (Decree 56/2010) apply to petroleum operations including exploration, development, production, transport, storage and marketing of petroleum products.
Regulations on Environmental Quality and Emission Standards (Decree 18/2004—amended by Decree 67/2010) aim to establish the standards for environmental quality and for effluents release in order to assure the effective control and maintenance of the admissible standards of concentration of polluting substances on the environmental components. This is supplemented by specific regulations on solid waste and water quality management.
The Petroleum Act (Law 21/2014) and the Petroleum Operations Regulations (Decree 34/2015) requires holders of exploration and production rights to conduct petroleum operations in compliance with environmental and other applicable legislation. The law makes provision for compensation to be paid under general legislation by the holder of a right to conduct petroleum operations to persons whose assets are damaged. The law establishes strict
34
liability for the holder of the right who causes environmental damage or pollution.
Gabon
Natural oil and gas activities
The primary legislation in Gabon governing oil and gas activities is the Hydrocarbon Law (law No. 011/2014) which established a new regime governing hydrocarbons exploration, exploitation and transportation activities, in compliance with environmental and other applicable legislation. Existing production sharing contracts remain in force until their expiry and will remain governed by the previous law (law No. 14/1982), with the exception of a limited number of additional obligations under the new regime such as a natural gas flaring prohibition.
Other countries
In a number of other countries, we are engaged in various activities that are impacted by local and international laws, regulations and treaties. In Malaysia, China and other countries, we operate plants and facilities for the storage, processing and transportation of chemical substances, including feedstock, products and waste. In the United Arab Emirates, Nigeria and other countries, we are involved, or are in the process of becoming involved, in exploration, extraction, processing or storage and transportation activities in connection with feedstock, products and waste relating to natural oil and gas, petroleum and chemical substances.
In Qatar, we participate in a joint venture owning and operating a GTL facility involving the production, storage and transportation of GTL diesel, GTL naphtha and LPG. These operations are subject to numerous laws and ordinances relating to safety, health and the protection of the environment.
Our operations in the respective jurisdictions are subject to numerous laws and regulations relating to exploration and mining rights and the protection of safety, health and the environment.
4.C Organisational Structure
Sasol Limited (Sasol) is the ultimate parent of the Sasol group of companies.
Sasol South Africa (Pty) Ltd, a wholly owned subsidiary in the Sasol group and a company incorporated in the Republic of South Africa, primarily holds our operations located in South Africa. A number of other subsidiaries incorporated in the Republic of South Africa, including Sasol Oil (Pty) Ltd, Sasol Mining Holdings (Pty) Ltd, Sasol Middle East and India (Pty) Ltd and Sasol Africa (Pty) Ltd, hold our interests in operations in South Africa, other parts of Africa and the Middle East. Sasol Financing (Pty) Ltd, responsible for the management of cash resources and investments, is wholly owned and incorporated in the Republic of South Africa.
Our wholly owned subsidiary, Sasol Investment Company (Pty) Ltd, a company incorporated in the Republic of South Africa, primarily holds our interests in companies incorporated outside South Africa, including Sasol European Holdings Limited (United Kingdom), Sasol Wax International GmbH (Germany), Sasol (USA) Corporation (United States), Sasol Holdings (Asia Pacific) (Pty) Ltd (South Africa), Sasol Chemical Holdings International (Pty) Ltd (South Africa), Sasol Canada Holdings Limited (Canada) and their subsidiaries.
See Exhibit 8.1 for a list of our significant subsidiaries and significant jointly controlled entities.
4.D Property, plants and equipment
Refer to "Item 18—Annual Financial Statements—Note 16—Property, plant and equipment" for further information regarding our property, plant and equipment.
35
Mining
Coal mining facilities
Our main coal mining facilities are located at the Secunda Mining Complex, which consists of underground collieries (Bosjesspruit, Brandspruit, Impumelelo, Middelbult, Shondoni shaft, Syferfontein, and Twistdraai, Thubelisha shaft) and the Sigma complex consisting of the Mooikraal colliery near Sasolburg.
For detail regarding the cost of the assets in our coal mining facilities, refer to the segmental information contained in "Item 18—Annual Financial Statements—Note 16—Property, plant and equipment".
A map showing the location of our coal properties and major manufacturing plants in South Africa is shown on page M-1.
Mining operates seven mines for the supply of coal to the Secunda Synfuels Operations, Sasolburg Operations (utility coal only) and the external market. The annual production of each mine, the primary market to which it supplies coal and the location of each mine are indicated in the table below:
| |
|
|
|
Production (Mt)(3) | |||||||||||||
|---|---|---|---|---|---|---|---|---|---|---|---|---|---|---|---|---|---|
| |
|
|
Nominated capacity per year (Mt)(2) |
||||||||||||||
Colliery
|
Location | Market | 2017(4) | 2016 | 2015 | ||||||||||||
Bosjesspruit |
Secunda | Secunda Synfuels Operations | 7,1 | 6,1 | 6,6 | 7,3 | |||||||||||
Brandspruit |
Secunda | Secunda Synfuels Operations | 3,3 | 2,8 | 5,3 | 7,0 | |||||||||||
Impumelelo |
Secunda | Secunda Synfuels Operations | 3,6 | 2,2 | 1,7 | — | |||||||||||
Middelbult, Shondoni shaft |
Secunda | Secunda Synfuels Operations | 7,9 | 6,5 | 7,6 | 6,9 | |||||||||||
Syferfontein |
Secunda | Secunda Synfuels Operations | 11,3 | 10,9 | 11,1 | 10,6 | |||||||||||
Twistdraai, Thubelisha shaft |
Secunda | Export/Secunda Synfuels Operations(1) | 8,9 | 7,9 | 8,2 | 7,5 | |||||||||||
Sigma : Mooikraal |
Sasolburg | Sasolburg Operations | 1,9 | 1,2 | 1,8 | 1,9 | |||||||||||
| | | | | | | | | | | | | | | | | | |
|
37,6 | 42,3 | 41,2 | ||||||||||||||
| | | | | | | | | | | | | | | | | | |
Production tons per continuous miner (mining production machine) per shift (t/cm/shift) |
1 147 | 1 322 | 1 367 | ||||||||||||||
| | | | | | | | | | | | | | | | | | |
- (1)
- The
secondary product from the export beneficiation plant is supplied to Secunda Synfuels Operations.
- (2)
- The
nominated capacity of the mines is the expected maximum production of that mine during normal operating hours, and does not represent the total maximum capacity
of the mine.
- (3)
- Production
excludes externally purchased coal.
- (4)
- The decrease in production volumes is primarily due to the impact of labour actions at our Secunda mining operations in the first half of 2017.
Processing operations
Coal export business—Secunda operations. We started the coal export business in August 1996. Run of mine coal is sourced from the existing East shaft of Twistdraai Colliery (formerly East, West and Central shafts) and the Thubelisha shaft (nominated capacity 8,9 Million tons (Mt)). The export beneficiation plant has a design throughput total capacity of 10,5 Mt per annum. In 2017, we produced 7,9Mt from Twistdraai, Thubelisha shaft; of which we beneficiated 7,3Mt.
The run of mine (ROM) coal is transported via overland conveyor belts to the export beneficiation plant from the Twistdraai shafts. The export product is loaded onto trains by means of a rapid load-out system, and then transported to the Richards Bay Coal Terminal (RBCT) in KwaZulu-Natal.
Mining has a 4,2% shareholding in RBCT, which corresponds to the existing entitlement of 3,6Mt per year. Actual export volumes for 2017 were 3,03 Mt. For the foreseeable future, we anticipate exports of approximately 3,30Mt per year.
36
Sasol Coal Supply—Secunda Operations. Sasol Coal Supply operates the coal handling facility between Mining and Secunda Synfuels Operations by stacking and blending coal on six live stockpiles. The overland conveyors from the mining operations to the coal handling facility are, in total, 100 kilometres (km) long and also form part of the Sasol Coal Supply operation.
The operation has a live stockpile capacity of 720 000 tons, which is turned over around 1,2 times per week. In addition, there is a targeted strategic stockpile capacity of more than 2,0Mt. The objectives of this facility are:
- •
- to homogenise the coal quality supplied to Secunda Synfuels Operations;
- •
- to keep mine bunkers empty;
- •
- to keep the Secunda Synfuels Operations bunkers full with a product that conforms to customer requirements;
- •
- to maintain a buffer stockpile to ensure even supply; and
- •
- to perform a reconciliation of business with regard to quantity and quality.
The daily coal supply to Secunda Synfuels Operations is approximately 112 000 tons.
Coal exploration techniques
Mining's geology department employs several exploration techniques in assessing the geological risks associated with the exploitation of the coal deposits. These techniques are applied in a mutually supportive way to achieve an optimal geological model of the relevant coal seams, targeted for production purposes. The Highveld Basin is considered to be structurally complex when compared to the other coalfields in South Africa where mining activities take place. As a result, Mining bases its geological modelling on sufficient and varied geological information. This approach is utilised in order to achieve a high level of confidence and support to the production environment.
Core recovery exploration drilling. This is the primary exploration technique that is applied in all exploration areas, especially during reconnaissance phases. In and around
operational mines, the average vertical borehole density varies from 1:10 to 1:15 (boreholes per hectare), while in medium-term mining areas, the average borehole density is in the order of 1:25. Depths of the boreholes drilled vary, depending on the depth to the Pre-Karoo basement, from 160 metres (m) to 380m. The major application of this technique is to locate the coal horizons, to determine coal quality and to gather structural information about dolerite dykes and sills, and the associated de-volatilisation and displacement of coal reserves. This information is used to compile geological models and forms the basis of geological interpretation.
Directional drilling. Directional drilling from surface to in-seam has been successfully applied for several years. A circular area with a radius of approximately 1,4km of coal deposit can be covered by this method from one drill site. The main objective of this approach is to locate dolerite dykes and transgressive dolerite sills, as well as faults with displacements larger than the coal seam thickness.
Horizontal drilling. This technique is applied to all operational underground mines and supplies short-term (minimum three months) exploration coverage per mining section. No core is usually recovered, although core recovery is possible, if required. The main objective is to locate dolerite dykes and transgressive sills intersecting the coal mining horizon, by drilling horizontal holes in the coal seam from a mined out area. A drilling reach of up to 1km is possible, although the average length is usually 800m in undisturbed coal.
Aeromagnetic surveys. Many explorations are usually aero-magnetically surveyed before the focused exploration is initiated. The main objective is to locate magnetic dolerite sills and dykes, as well as large-scale fault zones.
Geophysical wireline surveys of directional boreholes. Geophysical surveys are routinely conducted in the completed directional drilled boreholes. This results in the availability of detailed information leading to increased confidence of the surface directional drilling results.
37
Secunda operations
The coal supplied to Secunda Synfuels Operations is the raw coal mined from the five mines supplying Secunda Synfuels Operations exclusively and the secondary product from the export beneficiation plant.
We have carried out extensive geological exploration in the coal resource areas, and undertake additional exploration to update and refine the geological models. This allows for accurate forecasting of geological conditions and coal qualities, and also effective planning and utilisation of coal reserves.
Computation and storage of geological information
We store geological information in the acQuire database. We conduct regular data validation and quality checking through several in-house methods. Data modelling is conducted by manual interpretation and computer-derived geological models, using the Minex 6 edition of the GEOVIA/ MINEX software. Reserves and composite qualities are computed using established and recognised geo-statistical techniques.
General stratigraphy
The principal coal horizon, the Number 4 Lower Coal Seam, provides some 89,26% (2016—89,41%) of the total proved and probable reserves. The Number 4 Lower Coal Seam is one of six coal horizons occurring in the Vryheid Formation of the Karoo Supergroup, a permo-carboniferous aged, primarily sedimentary sequence. The coal seams are numbered from the oldest to the youngest.
The Number 4 Lower Coal Seam is a bituminous hard coal, characterised by the following borehole statistics:
- •
- The depth to the base of the seam ranges from 40m to 241m with an average depth of 135m below the surface topography. All the current mining
done on this seam is underground;
- •
- The floor of the seam dips gently from north to south at approximately 0,5 degrees;
- •
- The thickness of the seam varies in a range up to 10m with a weighted average thickness of 3,3m. In general, thinner coal is found to the south
and thicker coal to the west adjacent to the Pre-Karoo basement highs;
- •
- The inherent ash content (air dried basis) is an average 28,6%, which is in line with the coal qualities supplied during the past
30 years to Secunda Synfuels Operations;
- •
- The volatile matter content is tightly clustered around a mean of 19,5% (air dried); and
- •
- The total sulphur content (air dried), which primarily consists of mineral sulphur in the form of pyrite and minor amounts of organic sulphur, averages 0,92% of the total mass of the coal.
The other potential coal seam is:
- •
- The Number 2 Coal Seam at Middelbult colliery and Impumelelo colliery, which has been included in our reserve base.
Reserve estimation (remaining reserves at 31 March 2017)
We have approximately 3,7 billion tons (Bt) (2016—3,7 Bt) of gross in situ proved and probable coal reserves in the Secunda Deposit and approximately 1,2 Bt (2016—1,2 Bt) of recoverable reserves. The coal reserve estimations are set out in table 1 that follows. Reported reserves will be converted into synthetic oil reserves, except for reserves which will be used for utilities in Secunda Synfuels Operations and the majority of the Twistdraai, Thubelisha shaft reserves which will be exported. The reserve disclosure in this section includes Mining's total coal resources and reserves available for mining operations in Secunda. These reserves have not been adjusted for the synthetic oil reserves reported in the supplemental oil and gas information. The different reserve areas are depicted on the map on page M-1, as well as whether a specific reserve area has been assigned to a specific mine.
38
Table 1.
Coal reserve estimations(1) as at 31 March 2017, in the Secunda area where we have converted mining rights (signed on 29 March 2010) in terms of the Mineral and Petroleum Resources Development Act, Act 28 of 2002
Reserve area
|
Gross in situ coal resource(2) (Mt)(5) |
Geological discount (Mt)(5) |
Mine layout losses (Mt)(5) |
Extraction rate (%) |
Recoverable reserves(3) (Mt)(5) |
Beneficiated yield(4) (%) |
Proved/ probable |
|||||||||||||
|---|---|---|---|---|---|---|---|---|---|---|---|---|---|---|---|---|---|---|---|---|
Middelbult mine, number 4 seam |
666 | 90 | 168 | 45 | 206 | 100 | Proved | |||||||||||||
Middelbult mine, number 2 seam |
61 | 13 | 8 | 39 | 19 | 100 | Probable | |||||||||||||
Bosjesspruit mine |
218 | 9 | 92 | 49 | 76 | 100 | Proved | |||||||||||||
Bosjesspruit mine |
— | — | — | — | 33 | 100 | Probable | |||||||||||||
Twistdraai mine |
7 | 1 | 3 | 35 | 1 | P43,S23 | Proved | |||||||||||||
Syferfontein mine |
219 | 16 | 54 | 39 | 86 | 100 | Proved | |||||||||||||
Brandspruit mine |
43 | 1 | 34 | 44 | 3 | 100 | Proved | |||||||||||||
Twistdraai Thubelisha shaft |
692 | 179 | 117 | 55 | 250 | P34,S38 | Proved | |||||||||||||
Impumelelo, Block 2, number 4 seam |
703 | 49 | 99 | 54 | 230 | 100 | Proved | |||||||||||||
Impumelelo, Block 2, number 2 seam |
384 | 27 | 118 | 54 | 63 | 100 | Probable | |||||||||||||
Block 2 South, number 4 seam |
363 | 98 | 48 | 54 | 123 | 100 | Probable | |||||||||||||
Block 2 South, number 2 seam |
133 | 36 | 18 | 54 | 45 | 100 | Probable | |||||||||||||
Block 3 South |
141 | 38 | 19 | 58 | 52 | 100 | Probable | |||||||||||||
| | | | | | | | | | | | | | | | | | | | | |
Total Secunda area |
3 630 | 1 187 | ||||||||||||||||||
| | | | | | | | | | | | | | | | | | | | | |
| | | | | | | | | | | | | | | | | | | | | |
| | | | | | | | | | | | | | | | | | | | | |
- (1)
- The
coal reserve estimations in this table were compiled under supervision of Mr Viren Deonarain and Mr Jakes Lock who are considered competent people.
The "South African Code for Reporting of Minerals Resources and Minerals Reserves (The SAMREC Code 2007 edition)" dealing with competence and responsibility, paragraph 7, state Documentation
detailing Exploration Results, Mineral Resources and Mineral reserves from which a Public Report is prepared, must be prepared by, or under the direction of, and signed by a Competent Person.
Paragraph 9 states: A 'Competent Person' is a person who is registered with SACNASP, ECSA or PLATO, or is a Member or Fellow of the SAIMM, the GSS or a Recognised Overseas Professional
organisation (ROPO). The Competent Person must comply with the provisions of the relevant promulgated Acts. Mr J Erasmus (Pr.Nat.Sc), on behalf of Sumsare Consulting performed a comprehensive
and independent audit of the coal resource/reserve estimations in July 2015 and the estimates were certified as correct. The estimation of the reserves is compliant with the definition and guidelines
as stated in the SAMREC and Joint Ore Reserve Committee (JORC) codes, as well as SEC Industry Guideline 7.
- (2)
- The
gross in situ coal resource is an estimate of the coal tonnage, contained in the full coal seam above the minimum thickness cut off and relevant coal quality cut
off parameters. No loss factors are applied and seam height does not include external dilution or contamination material.
- (3)
- The
recoverable coal reserve is an estimate of the expected recovery of the mines in these areas and is determined by the subtraction of losses due to geological and
mining factors and the addition of dilatants such as moisture and contamination.
- (4)
- The
P% of P43 and P34 refers to the export product yield from the recoverable coal reserve and the S% of S23 and S38 refers to secondary product yield, which will be
supplied to the Sasol Synfuels Operations. The balance of this is discard material.
- (5)
- Mt refers to 1 million tons. Reference is made of tons, each of which equals 1 000 kilograms, approximately 2 205 pounds or 1 102 short tons.
39
Table 2.
Coal qualities, on an air dry basis, in respective coal reserve areas, where Mining has converted mining rights in respect of the Secunda mining complex in terms of the Mineral and Petroleum Resources Development Act, Act 28 of 2002.
Reserve area
|
Wet/dry tons |
Average Inherent Moisture Content (%) |
Average Superficial Moisture Content (%) |
Assigned/ unassigned |
Steam/ metallurgical coal |
Heat Value (air dry) basis MJ/kg |
Sulphur (air dry basis) |
|||||||||||
|---|---|---|---|---|---|---|---|---|---|---|---|---|---|---|---|---|---|---|
Middelbult mine |
Wet | 4,2 | n/a | Assigned | Steam | 21,3 | 0,9 | |||||||||||
Bosjesspruit mine |
Wet | 3,8 | n/a | Assigned | Steam | 18,8 | 0,8 | |||||||||||
Twistdraai mine |
Wet | 3,8 | n/a | Assigned | Steam | 20,8 | 1,1 | |||||||||||
Syferfontein mine |
Wet | 5,5 | n/a | Assigned | Steam | 21,4 | 0,8 | |||||||||||
Brandspruit mine |
Wet | 3,8 | n/a | Assigned | Steam | 17,6 | 1,3 | |||||||||||
Twistdraai, Thubelisha shaft |
Wet | 4,3 | n/a | Assigned | Steam | 20,5 | 1,1 | |||||||||||
Impumelelo, Block 2, number 4 seam. |
Wet | 4,1 | n/a | Assigned | Steam | 18,1 | 1,2 | |||||||||||
Impumelelo, Block 2, number 2 seam |
Wet | 3,7 | n/a | Assigned | Steam | 17,5 | 0,8 | |||||||||||
Block 2 South, number 4 seam |
Wet | 4,1 | n/a | Unassigned | Steam | 18,2 | 1,2 | |||||||||||
Block 2 South, number 2 seam |
Wet | 3,6 | n/a | Unassigned | Steam | 17,4 | 0,7 | |||||||||||
Block 3 South |
Wet | 3,6 | n/a | Unassigned | Steam | 21,9 | 0,7 | |||||||||||
Table 3.
Coal qualities, on an as received basis, in respective coal reserve areas, where Mining has converted mining rights in the Secunda mining complex in terms of the Mineral and Petroleum Resources Development Act, Act 28 of 2002.
Reserve area
|
Wet/dry tons |
Average Inherent Moisture Content (%) |
Average Superficial Moisture Content (%) |
Assigned/ unassigned |
Steam/ metallurgical coal |
Heat Value (as received) basis MJ/kg |
Sulphur (as received basis) |
||||||||||||
|---|---|---|---|---|---|---|---|---|---|---|---|---|---|---|---|---|---|---|---|
Middelbult mine |
Wet | 4,2 | 4,5 | Assigned | Steam | 20,3 | 0,9 | ||||||||||||
Bosjesspruit mine |
Wet | 3,7 | 4,0 | Assigned | Steam | 18,1 | 0,9 | ||||||||||||
Twistdraai mine |
Wet | 3,8 | 3,6 | Assigned | Steam | 20,0 | 1,1 | ||||||||||||
Syferfontein mine |
Wet | 5,5 | 4,7 | Assigned | Steam | 20,5 | 0,8 | ||||||||||||
Brandspruit mine |
Wet | 3,7 | 3,7 | Assigned | Steam | 16,9 | 1,2 | ||||||||||||
Twistdraai, Thubelisha shaft |
Wet | 4,2 | 4,3 | Assigned | Steam | 19,6 | 1,0 | ||||||||||||
Impumelelo, Block 2, number 4 seam |
Wet | 4,1 | 3,7 | Assigned | Steam | 18,0 | 1,1 | ||||||||||||
Impumelelo, Block 2, number 2 seam |
Wet | 3,7 | 3,7 | Assigned | Steam | 17,5 | 0,8 | ||||||||||||
Block 2 South, number 4 seam |
Wet | 4,1 | 3,1 | Unassigned | Steam | 18,0 | 1,1 | ||||||||||||
Block 2 South, number 2 seam |
Wet | 3,6 | 2,7 | Unassigned | Steam | 17,2 | 0,7 | ||||||||||||
Block 3 South |
Wet | 3,4 | 3,6 | Unassigned | Steam | 21,8 | 0,7 | ||||||||||||
40
Criteria for proved and probable
Over and above the definitions for coal reserves, probable coal reserves and proved coal reserves, set forth in Industry Guide 7, promulgated by the US Securities and Exchange Commission, we consider the following criteria to be pertinent to the classification of the reserves:
Probable reserves are those reserve areas where the drill hole spacing is sufficiently close in the context of the deposit under consideration, where conceptual mine design can be applied, and for which all the legal and environmental aspects have been considered. Probable reserves can be estimated with a lower level of confidence than proved coal reserves. Currently this classification results in variable drill spacing depending on the complexity of the area being considered and is generally less than 500m, although in some areas it may extend to 800m. The influence of increased drilling in these areas should not materially change the underlying geostatistics of the area on the critical parameters such as seam floor, seam thickness, ash and volatile content.
Proved reserves are those reserves for which the drill hole spacing is generally less than 350m, for which a complete mine design has been applied which includes layouts and schedules resulting in a full financial estimation of the reserve. This classification has been applied to areas in the production stage or for which a detailed feasibility study has been completed.
Legal rights on coalfields
Our subsidiary, Sasol Mining (Pty) Ltd, is the holder of various prospecting and mining rights in respect of the areas where we operate in Mpumalanga and the Free State. These prospecting and mining rights are granted by the State acting as custodian of South Africa's mineral and petroleum resources in accordance with the provisions of the Mineral and Petroleum Resources Development Act, 28 of 2002. In respect of the Secunda Complex, the mining right which covers an area of 168 439 hectares, became effective on 29 March 2010 and remains valid for a period of 30 years and comprises the total reserve area shown in
table 1 and on page M-1. The Secunda Complex mining right was amended to incorporate additional reserves areas which were acquired to extend the life of the mining operations. The amended mining right is yet to be registered in the Mineral and Petroleum Titles Registration Office. Sasol Mining has also taken transfer of a mining right located directly adjacent to the Secunda complex mining right. This registered mining right covers an additional 2 476 hectares and remains valid for a period of twenty years from 23 December 2015.
In respect of the Mooikraal Colliery near the town of Sasolburg in the Free State, the two mining rights which became effective on 29 March 2010 were consolidated into a single mining right covering approximately 6 647 hectares. The consolidated mining right remains valid for a period of 30 years and is yet to be registered in the Mineral and Petroleum Titles Registration Office. The validity period of our mining rights may, on application to the Department of Mineral Resources, be renewed for further periods not exceeding 30 years each. The revised Mining Charter was published on 15 June 2017. The Chamber of Mines applied to the High Court for an urgent interdict to suspend the implementation of the revised Mining Charter until such a time as an application for a judicial review of the revised Mining Charter has been dealt with.
Exploration and Production International (E&PI)
Natural Oil and Gas Operations
Our natural oil and gas operations are managed by our Exploration and Production International (E&PI) business unit. E&PI's principal activities are the exploration, appraisal, development and production of hydrocarbon resources. Currently we hold equity in three producing assets with proved reserves in Mozambique, Canada and Gabon and one non-producing asset in Mozambique. We also have equity in exploration licences in Mozambique, Australia, Nigeria and South Africa.
In the narrative sections below, unless stated otherwise, all quantitative statements refer to
41
gross figures. The tabular information which follows after the narrative provides:
- •
- Total gross and net developed and undeveloped acreage of our natural oil and gas assets and exploration licences by geographic area, at
30 June 2017
- •
- The number of net natural oil and gas wells completed in each of the last three years and the number of wells being drilled or temporarily
suspended, at 30 June 2017
- •
- Capitalised natural oil and gas exploratory well costs at the end of the last three years and information about the continued capitalisation of
natural oil and gas exploratory well costs at 30 June 2017
- •
- Details about the production capacity of our natural oil and gas production facilities and the number of productive natural oil and gas wells,
at 30 June 2017
- •
- Average sales prices and production costs, of natural oil and gas.
Refer to the "Supplemental Oil and Gas Information" on pages G-1 to G-6 for:
- •
- Costs incurred in natural oil and gas property acquisition, exploration and development activities, for the last three years
- •
- Capitalised costs relating to natural oil and gas activities, for the last three years
- •
- The results of operations for natural oil and gas producing activities, for the last three years
- •
- Natural oil and gas proved reserves and production quantity information, for the last three years
- •
- Standardised measures of discounted future net cashflows relating to natural oil and gas proved reserves, for the last three years
- •
- Changes in the standardised measures of discounted future net cashflows relating to natural oil and gas proved reserves, for the last three years.
The maps on page M-2 show E&PI's global footprint and the location of our assets and exploration licences.
Mozambique
Licence Terms
Development and Production Assets
In Mozambique, we have interests in two onshore assets, one of which is producing, with proved reserves. The other asset consists of two areas under development and other reservoirs that are being assessed for commerciality.
The producing asset is the Pande-Temane Petroleum Production Agreement (PPA) licence (302,2 thousand developed net acres). Our subsidiary, Sasol Petroleum Temane Limitada (SPT), the operator, holds a 70% working interest in the PPA. The PPA expires in 2034, and carries two possible five-year extensions. There is no requirement to relinquish any acreage until the expiry of the PPA.
The other asset is the Pande-Temane Production Sharing Agreement (PSA) licence (442,8 thousand undeveloped net acres). Our subsidiary, Sasol Petroleum Mozambique Limitada (SPM), the operator, holds a 100% working interest, which will be reduced to 70% (with a corresponding reduction of 132,8 thousand undeveloped net acres) on completion of a 30% farm-down of our equity, for which a term sheet was signed with Empresa National de Hidrocarbonetos de Moçambique (ENH), the national oil company of Mozambique on 21 June 2017. Under the terms of the current PSA licence, ENH is also entitled to a calculated share of production.
The two PSA development areas covered by development and production periods until 2041 for the oil development (125,9 thousand undeveloped net acres) and 2046 for the gas development (157,3 thousand undeveloped net acres), are being developed in accordance with the Phase 1 field development plan approved by the Mozambican authorities in January 2016. The remaining PSA area (159,6 thousand undeveloped net acres) is covered by a five-year commercial assessment period (CAP) ending in February 2018, which will be followed by a
42
further five-year CAP upon application. Thereafter, the retention of reservoirs in the CAP area is contingent on a declaration of commerciality and field development plan approval by the Mozambican government.
Exploration
We also have interests in two exploration licences, one offshore and the other onshore, and two licences which are in the process of being negotiated.
The offshore exploration licence comprises the shallow water parts of the Exploration and Production Concession Blocks 16 and 19. Our subsidiary Sasol Petroleum Mozambique Exploration Limitada (SPMEL), the operator, holds an 85% working interest (622,7 thousand undeveloped net acres) and ENH has a 15% interest that is carried until field development. Petroleum operations in the licence were suspended in 2008 and will remain so until the Strategic Environmental Assessment (SEA), commissioned by the Mozambique government, is made public. We have retained our interest in the licence with a view to defining a future work programme when the outcome of the SEA is known.
The onshore exploration licence is the Exploration and Production Concession Area A. Our subsidiary SPMEL, the operator, holds a 50% working interest and ENH has a 10% interest that is carried until field development. ENH is also entitled under the terms of the Area A licence to a calculated share of production. In April 2017, the government agreed that the second period (which ended in May 2017) commitment well could be completed in the third period (which ends in May 2019), and confirmed the third period commitment to acquire 2D seismic had been fulfilled. A further 20% of the licence area was relinquished in May 2017, at the end of the second period. Retention of the remaining area (620,7 thousand undeveloped net acres) at the end of the third period in May 2019, is contingent on a declaration of commerciality and field development plan approval by the Mozambican government.
In October 2015, the authorities announced the results of the Fifth Mozambique Licensing Round in which our subsidiary SPMEL and our partners were successful. On completion of negotiations for Exploration and Production Concession contracts, SPMEL will hold a 70% working interest, as operator, in the onshore Pande-Temane Area PT5-C (521,0 thousand undeveloped net acres), and a 25,5% working interest (324,2 thousand undeveloped net acres) in the offshore Angoche Area A5-A, which will be operated by Eni Mozambico S.p.A.
Activities
In the Pande-Temane PPA asset, a minor de-bottlenecking project, which increased the capacity of the Central Processing Facility (CPF) to 491 million standard cubic feet per day, was completed in February 2017. Additionally, 42 square kilometres (km2) of 3D seismic data was acquired over Pande in 2017.
Present activities in the Pande-Temane PPA asset include infill drilling projects and compression projects that will lower the inlet pressure at the CPF. Well planning activities are being undertaken for the first infill well (scheduled to be operational in 2018), and detailed design and engineering work is progressing on phase two compression (scheduled to be operational in 2019). These projects will be followed by additional infill wells and phase three compression. These projects are necessary to maintain production as the reservoirs deplete and are in accordance with the approved field development plan.
In the Pande-Temane PSA development areas, six development wells were drilled and completed in 2017 with a further three wells scheduled to be drilled in 2018. These wells are part of the 12 producing well development programme, representing the initial development of four oil and gas reservoirs, in the approved field development plan. The field development plan also envisages the capacity of the PPA CPF to be increased to 633 million standard cubic feet per day gas. The light oil production rates are anticipated to realise between the low and mid-point of the range presented in the FDP. This has triggered a review of the development
43
programme and the design basis of the Liquids Processing Facility (LPF) to be constructed adjacent to the CPF. The cost of the development plan is US$1,4 billion covering expansion of the CPF, construction of the LPF and flowlines and the initial drilling programme. US$211,7 million has been spent to end 2017 comprising drilling costs, civil engineering works, detailed engineering and subsurface modelling.
During PSA development drilling, additional hydrocarbons were encountered in horizons, that were not the prime targets. A discovery notice and appraisal programme was submitted to the Mozambique government in order to mature these resources. In the PSA CAP areas, evaluation and well planning activities have progressed, with the aim of drilling two wells in 2018.
Additionally in the PSA, 125 km2 of 3D seismic data and 120 km of 2D seismic data were acquired in 2017.
In the Area A exploration licence, drilling activities for the commitment well (Babane-1) commenced in May 2017. The target reservoir sands were penetrated but no hydrocarbon-bearing zones were encountered. Demobilisation from the Babane-1 well was completed on 10 July 2017.
Capitalised Exploratory Well Costs
At 30 June 2017, there were no exploratory wells costs capitalised in the Pande-Temane PPA asset or in the two development areas in the Pande-Temane PSA asset.
In the Pande-Temane PSA CAP area, exploratory well costs continue to be capitalised for a period greater than one year after the completion of drilling, amounting to R276,3 million (US$18,7 million); these costs relate to the exploration drilling activities conducted and completed in 2008, and the follow up activities which continued in 2017.
At 30 June 2017, R14,0 million exploratory well costs remained capitalised for Area A.
Facilities and Productive Wells
Natural gas and condensate is produced from the Pande-Temane PPA asset, at the CPF on a site of approximately 400 000 square metres, that is located some 700 kilometres north of Maputo, the capital of Mozambique. Production from the Temane and Pande fields, which are managed as a single operational field, is routed from production wells via in-field flowlines and pipelines to the CPF. The design capacity of the CPF is 491 million standard cubic feet per day sales gas together with small amounts of associated condensate.
At 30 June 2017, there were 20 productive wells in the PPA asset.
Delivery Commitments
Gas produced from the Pande-Temane PPA asset, other than royalty gas provided to the Mozambican government, is supplied in accordance with long-term Gas Sales Agreements (GSAs). The gas produced in accordance with GSA1, signed on 27 December 2002 (25 years contract term), and GSA2, signed on 10 December 2008 (20 years contract term), is sold internally for use as part of the feedstock for our chemical and synthetic fuel operations in South Africa, with a base case supply of 120 PJ/a (108,86 bscf/a) and 27 PJ/a (24,49 bscf/a) respectively. There are four GSA3 20-year contracts, that supply gas to the Mozambique market. These satisfy a licence condition that a portion of gas produced is utilised in-country. The contracts are with Matola Gas Company S.A from 1 July 2014 for 8 PJ/a (7,26 bscf/a), ENH-Kogas from 1 March 2013 for 6 PJ/a (5,44 bscf/a), Central Termica de Ressano Garcia S.A. from end-February 2015 for 11 PJ/a (9,98 bscf/a) and ENH effective from 1 June 2015 for 2PJ/a (1,81 bscf/a).
Infill drilling and compression projects, which will convert proved undeveloped reserves from the PPA into proved developed reserves in order to meet near-term delivery commitments are under way. Additional steps are under consideration in order to ensure commitments can be met to the end of the contracts.
44
PPA condensate is currently sold to Petróleos de Moçambique, S.A. (Petromoc), who transports the condensate by truck from the CPF, for export via the port of Beira. The contract expires in July 2018 after which the condensate will be sold to a buyer selected by competitive tender.
Proved Reserves
Our Mozambique proved reserves are contained in the Pande-Temane PPA asset. These represent the net economic interest volumes that are attributable to Sasol after the deduction of petroleum production tax. The primary sales product for the PPA is natural gas, with minor amounts of associated liquid hydrocarbons.
Changes to proved reserves
There was a reduction in proved gas reserves due to production of 116,4 billion cubic feet.
Changes to proved developed reserves
Proved developed gas reserves decreased by 27,5 billion cubic feet to 710,7 billion cubic feet. The decrease was due to production which was partly offset by revisions resulting from an improved calibration of the integrated production system model of future recovery.
Proved undeveloped reserves converted to proved developed reserves
No reserves were converted from undeveloped to developed during 2017.
Changes to proved undeveloped reserves
Proved undeveloped gas reserves decreased by 43,3 billion cubic feet to 429,0 billion cubic feet. This was due to the improved calibration of the integrated production system model which resulted in a reclassification of some proved reserves from undeveloped to developed.
No resources were matured to undeveloped reserves in 2017.
Proved undeveloped reserves remaining undeveloped
Proved undeveloped gas reserves, presently estimated to be 429,0 billion cubic feet, have remained undeveloped in the Pande-Temane PPA asset for the last eleven years. The total proved volume (developed plus undeveloped) represents gas that will be recovered as part of the approved field development plan and which is required to satisfy existing gas sales agreements. In order to optimise the timing of capital expenditure, required to convert undeveloped reserves to developed reserves, E&PI regularly studies production performance and reviews its plan for installation of additional compression and wells. The first infill well and phase two compression are scheduled to be operational respectively in 2018 and 2019. These projects will be followed by additional infill wells and phase 3 compression.
Rest of Africa (outside Mozambique)
Licence Terms
Gabon
Development and Production
In Gabon, our subsidiary Sasol Gabon S.A. holds a 27,75% working interest in the Etame Marin Permit (EMP) asset, which is a producing asset with proved reserves. VAALCO Gabon S.A. is operator of the asset, under the terms of the EMP Exploration and Production Sharing Contract.
The EMP contract area comprises three 10-year Exclusive Exploitation Authorisations (EEAs), each with two five-year renewal periods available on request and subject to Government decree. The Etame EEA first five-year renewal period expired in July 2016 and an application for the second five-year renewal period, which was submitted in April 2016 is pending approval from the Government. The Avouma EEA is currently in the first five-year renewal period to March 2020. The initial ten-year period of the Ebouri EEA expired in June 2016 and an application for the first five-year renewal period, which was submitted in March 2016, is also pending approval. The current production plan
45
assumes the EEA renewals will be granted with no change in contract terms.
- •
- Etame EEA: 3,4 thousand developed net acres, 2001-2021
- •
- Avouma EEA: 3,6 thousand developed net acres, 2005-2020 + one five-year extension (to March 2025)
- •
- Ebouri EEA: 1,0 thousand developed net acres, 2006-2021 + one five-year extension (to June 2026)
Exploration
Our subsidiary Sasol Gabon S.A. has executed a farm-in agreement with Perenco Oil and Gas Gabon S.A for a 40% working interest in the DE 8 permit offshore Gabon (245,7 thousand undeveloped net acres). As at 30 June 2017, the transaction was subject to the satisfaction of certain conditions. The licence is in the second exploration period, which expires in December 2017 and includes one commitment well.
South Africa
In South Africa, we have interests in one exploration licence and one licence which is subject to negotiation.
Our subsidiary Sasol Africa (Pty) Ltd holds a 60% working interest in the ER236 licence, offshore in the Durban Basin, which is operated by Eni South Africa BV. At the end of the first exploration period in November 2016, 20% of the licence was relinquished (9 740,3 thousand undeveloped net acres remaining) and on 11 July 2017 the Petroleum Agency South Africa (PASA) granted entry into the second exploration period which expires in July 2019. The work programme commitments for the first two exploration periods have been met.
In July 2015, our subsidiary Sasol Africa (Pty) Ltd and The Petroleum Oil and Gas Corporation of South Africa (SOC) Limited (PetroSA) were invited to commence negotiations for an Exploration Right over the 3A/4A area located offshore in the Orange Basin which was previously covered by a technical co-operation permit. Provided the negotiations
are successful, on award of the exploration licence Sasol Africa (Pty) Ltd and PetroSA, the operator, will each hold a 50% working interest (3 129,8 thousand undeveloped net acres).
Nigeria
Our subsidiary, Sasol Exploration and Production Nigeria Limited (SEPNL), gave notice of our intention to withdraw from the OML 145 licence in Nigeria in May 2015. Government approval is awaited, after which the relinquishment of our working interest will be complete.
Activities
Gabon
In 2017 two workovers were performed to replace defective electric submersible pumps. These workovers were performed using a hydraulic workover unit, demonstrating the capability to perform such activities at a lower cost than had previously been possible. Present activities in the EMP asset, include well planning activities for a potential drilling and workover programme commencing in 2018 and study work for further development opportunities, including options for crude sweetening.
In October 2014, the Gabon government issued the findings from an industry-wide audit, performed on its behalf. Fee payment was made in October 2016, as final settlement of amounts due with respect to the EMP asset.
South Africa
In July 2016 the acquisition of 3D seismic data over the ER236 licence was completed, with data processing completed in May 2017.
Capitalised Exploratory Well Costs
At 30 June 2017, there were no exploratory well costs capitalised in our Gabon asset and South Africa or Nigeria exploration licences.
Facilities and Productive Wells
Oil is produced from the EMP asset facilities, located some 35-kilometres offshore southern Gabon, which consist of four wellhead
46
platforms, subsea flowlines and a floating production, storage and off-loading vessel (FPSO), managed as a single operational field. Oil from the Etame, Avouma and Ebouri, EEAs, is produced by means of a combination of subsea and platform wells which are connected by pipelines to the FPSO. The FPSO is contracted from and operated by Tinworth Pte. Limited. The processed oil is stored in tanks on the FPSO prior to export by shipping tanker.
At 30 June 2017, there were 11 productive wells across the three EEAs.
Delivery Commitments
Oil produced from the Gabon EMP asset is marketed internationally on the open market. The oil is sold under a short-term Crude Oil Sale and Purchase Agreement (COSPA) which is renewed periodically. The current COSPA, with Glencore Energy UK Limited as buyer, has been extended to 31 January 2018. The COSPA is expected to be further extended or re-contracted as required on terms not dissimilar to the current contract.
Proved Reserves
Our Rest of Africa proved reserves are contained in the EMP asset, offshore Gabon. These represent the net economic interest volumes attributable to Sasol after application of the licence terms, including the deduction of royalty. The primary sales product is oil, all gas produced is consumed in operations or flared.
Changes to proved reserves
There was a reduction in proved oil reserves due to production of 1,3 million barrels.
Changes to proved developed reserves
Proved developed reserves increased by 0,9 million barrels to 1,7 million barrels. The increase was a result of revisions totalling 2,1 million barrels due to better well performance than previously anticipated and changes in sales prices, partially offset by production. An additional increase of 0,1 million barrels was due to the successful workover of
one well which was unproductive in 2016 (at a cost of US$ 2,3 million net to Sasol).
Proved undeveloped reserves converted to proved developed reserves
No reserves were converted from undeveloped to developed during 2017.
Changes to proved undeveloped reserves
There were no undeveloped reserves at the beginning of 2017, and no resources were matured to undeveloped reserves in 2017.
Proved undeveloped reserves remaining undeveloped
There were no reserves remaining undeveloped at 30 June 2017.
North America
Licence Terms
Canada
In Canada, our subsidiary Sasol Canada Exploration and Production Limited (SCEPL), holds a 50% working interest in the Farrell Creek and Cypress A asset located in British Columbia, which is a producing asset with proved reserves. The asset is operated by Progress Energy Canada Ltd (PECL).
As at 30 June 2017 Farrell Creek comprised 29 licences and leases and Cypress A comprised 25 licences and leases. The Farrell Creek and Cypress A asset covers an area of 17,9 thousand developed net acres and 38,5 thousand undeveloped net acres, respectively. Acreage retention and the conversion of licences (which carry no production rights) to leases (with production rights) is enabled by drilling commitments, the provincial government's prescribed lease selection and validation process and licence extension applications.
The decision to retain acreage and convert licences to leases is dependent on the drilling results and ongoing study work. Production, drilling and other retention activities are included in the applicable work programmes so that licences and leases, due to expire before 31 December 2018 are retained (4 licences and
47
leases affected for a total of 2,1 thousand net acres).
Activities
In June 2016, to responsibly steward the Farrell Creek and Cypress A asset through the low gas price environment, the Progress Sasol Montney Partnership (PSMP) agreed to slow the pace of appraisal and development and significantly reduce activities. The drilling and completion work programme during 2017 was therefore limited to the completion of 10 previously drilled wells, three in Farrell Creek and seven in Cypress A.
In May 2017 the PSMP confirmed the work programme to 31 December 2017 and approved the drilling of two wells and the completion of one previously-drilled well, all in Cypress A. None of these wells will be productive by the end of the approved work programme.
Capitalised Exploratory Well Costs
At 30 June 2017, there are no exploratory well costs capitalised in our Canada asset.
Facilities and Productive Wells
Natural gas and liquids are produced from the Farrell Creek and Cypress A asset by means of production wells, flowlines, gathering lines and processing facilities. Gas from Farrell Creek wells and Cypress A southern wells is processed through facilities owned by SCEPL and PECL, covering a site of approximately 160 000 square metres. Gas from Cypress A northern wells is currently processed and sold through third party production facilities.
At 30 June 2017, there were 172 productive wells.
Delivery Commitments
Gas from the Farrell Creek and Cypress A asset is sold into the Western Canada market, under a long-term agreement with PECL, effective until 2024. Pricing is based on the daily realised spot market prices less transportation and marketing fees. A small amount of petroleum liquids is sold under the same agreement.
Production from Farrell Creek and Cypress A is currently not sufficient to fully utilise contracted gas transportation capacity. Low production in 2017 resulted in continued non-utilised transport charges in the Spectra and TransCanada/NOVA pipelines. PECL, as operator, partially mitigates exposure through placing of non-utilised gas transmission capacity in the gas transmission market. Additionally, a non-utilised capacity of 170 million standard cubic feet per day has been contracted to a third party for the period November 2017 to November 2019.
Proved Reserves
Our North America proved reserves are contained in the Canada Farrell Creek and Cypress A asset. These represent the net economic interest volumes that are attributable to Sasol before the deduction of royalties. The primary sales product is natural gas, with minor amounts of associated liquid hydrocarbons.
Full development of the asset will require around 2 900 wells, of which only some 6,5% have been drilled and completed to date. Reserves are limited to those volumes of gas and associated liquid hydrocarbons attributable to Sasol that are forecast to be produced from productive wells together with wells to be drilled and/or completed in the approved work programme.
Changes to proved reserves
There was a reduction in proved gas reserves due to production of 21,9 billion cubic feet.
Changes to proved developed reserves
Proved developed gas reserves increased by 14,5 billion cubic feet to 122,4 billion cubic feet. The increase was the result of revisions totalling 21,6 billion cubic feet due to better well performance than previously anticipated and conversion of undeveloped reserves to developed. These increases were partially offset by production.
48
Proved undeveloped reserves converted to proved developed reserves
Completion of 10 wells during 2017 resulted in conversion of 14,8 billion cubic feet undeveloped gas reserves to developed reserves. The total cost of this conversion was CAD50,4 million net to Sasol.
Changes to proved undeveloped reserves
The undeveloped gas reserves at 30 June 2016 were all converted to developed reserves in 2017, and no resources were matured to undeveloped reserves in 2017.
Proved undeveloped reserves remaining undeveloped
There were no reserves remaining undeveloped at 30 June 2017.
Australasia
Licence Terms
Australia
In Australia, we have interests in one offshore exploration licence and three onshore exploration licences. Offshore in the North West Shelf of Australia, our subsidiary Sasol Petroleum Australia Limited (SPAL) holds a 30% working interest in the AC/P 52 licence (160,9 thousand undeveloped net acres). The licence is operated by Shell Development Australia (Pty) Ltd.
Owing to an international boundary dispute, the AC/P 52 licence holders have submitted a Suspension and Extension application to the government requesting a licence period extension to May 2019.
Onshore in the Beetaloo Basin of Australia's Northern Territory, our subsidiary SPAL currently holds a 35% working interest in the EP76, EP98 and EP117 licences, which are
operated by Origin Energy Resources Limited. We are in the process of withdrawing from these licences (1 583,6 thousand undeveloped net acres affected) and government approval of the transfer of our interests is expected to be completed in 2018.
Activities
Australia
In 2017, in the Beetaloo Basin, a multi-stage fracture stimulation programme was performed on the Amungee NW-1 well, followed by a successful production test. Additionally, one well was drilled.
Capitalised Exploratory Wells Costs
Australia
At 30 June 2017, there were no exploratory well costs capitalised in our Australian exploration licences.
Tabular Natural Oil and Gas Information
Developed and Undeveloped Acreage
The table below provides total gross and net developed and undeveloped acreage for our natural oil and gas assets by geographic area at 30 June 2017.
Natural oil and gas acreage concentrations at 30 June 2017 |
Mozambique(1) | Rest of Africa(2) |
North America(1)(2) |
Australasia(2) | Total | |||||||||||
|---|---|---|---|---|---|---|---|---|---|---|---|---|---|---|---|---|
| |
thousand acres |
|||||||||||||||
Developed acreage |
||||||||||||||||
Gross |
431,7 | 28,7 | 35,7 | — | 496,1 | |||||||||||
Net |
302,2 | 8,0 | 17,9 | — | 328,1 | |||||||||||
Undeveloped acreage |
||||||||||||||||
Gross |
2 416,8 | 16 233,8 | 76,9 | 5 060,7 | 23 788,2 | |||||||||||
Net |
1 686,2 | 9 740,3 | 38,5 | 1 744,4 | 13 209,4 | |||||||||||
- (1)
- Certain
licences in Mozambique and North America overlap as they relate to specific stratigraphic horizons.
- (2)
- Rest of Africa comprises Gabon and South Africa, North America comprises Canada, Australasia comprises Australia.
Drilling Activities
The table below provides the number of net wells completed in each of the last three years
49
and the number of wells being drilled or temporarily suspended at 30 June 2017.
Number of wells(2) drilled for the year ended 30 June |
Mozambique(1) | Rest of Africa(1) |
North America(1) |
Australasia(1) | Total | |||||||||||
|---|---|---|---|---|---|---|---|---|---|---|---|---|---|---|---|---|
2015 |
||||||||||||||||
Net development wells—productive(2) |
— | 0,8 | 7,5 | — | 8,3 | |||||||||||
2016 |
||||||||||||||||
Net development well—productive(2) |
— | 0,8 | 9,0 | — | 9,8 | |||||||||||
Net stratigraphic test well—exploratory type(3) |
— | — | — | 1,0 | 1,0 | |||||||||||
As at 30 June 2016 |
||||||||||||||||
Temporarily suspended wells—gross |
— | — | — | — | — | |||||||||||
Temporarily suspended wells—net |
— | — | — | — | — | |||||||||||
2017 |
||||||||||||||||
Net exploratory wells—productive(2) |
— | — | — | — | — | |||||||||||
Net exploratory wells—dry(2) |
— | — | — | — | — | |||||||||||
Net development wells—productive(2) |
6,0 | — | 5,0 | — | 11,0 | |||||||||||
Net development wells—dry(2) |
— | — | — | — | — | |||||||||||
Net stratigraphic test wells—exploratory type(3) |
0,5 | — | — | 0,4 | 0,9 | |||||||||||
Net stratigraphic test wells—development type(3) |
— | — | — | — | — | |||||||||||
As at 30 June 2017 |
||||||||||||||||
Wells being drilled—gross(4) |
— | — | 4,0 | — | 4,0 | |||||||||||
Wells being drilled—net(4) |
— | — | 2,0 | — | 2,0 | |||||||||||
Temporarily Suspended wells—gross |
— | — | — | — | — | |||||||||||
Temporarily Suspended wells—net |
— | — | — | — | — | |||||||||||
- (1)
- Rest
of Africa comprises Gabon and South Africa, North America comprises Canada, Australasia comprises Australia.
- (2)
- A
productive well is an exploratory or development well that is not a dry well. A dry well is an exploratory or development well that proves to be incapable of
producing either oil or natural gas in sufficient quantities to justify completion.
- (3)
- A
stratigraphic test well is drilled to obtain information pertaining to a specific geological condition and is customarily drilled without the intent of being
completed. Stratigraphic test wells are 'exploratory type' if not drilled in a known area or 'development type' if drilled in known area.
- (4)
- The number of wells being drilled includes wells that have been drilled, but have not yet been mechanically completed to enable production.
Capitalised Exploratory Well Costs
The table below provides details about natural oil and gas exploratory well costs at the end of the last three years, showing additions, costs charged to expense and costs reclassified.
| |
2017 | 2016 | 2015 | |||||||
|---|---|---|---|---|---|---|---|---|---|---|
| |
(Rand in millions) |
|||||||||
Capitalised Exploratory Well Costs |
||||||||||
Balance at beginning of year |
279,8 | 1 670,2 | 1 351,9 | |||||||
Additions for the year |
197,7 | 1 588,7 | 511,8 | |||||||
Costs incurred |
209,6 | 897,8 | 583,7 | |||||||
Asset retirement obligation adjustments |
(11,9 | ) | 690,9 | (71,9 | ) | |||||
Charged to expense for the year |
(189,0 | ) | (320,0 | ) | — | |||||
Farm down proceeds |
— | (112,0 | ) | — | ||||||
Exiting of licences |
— | — | (200,7 | ) | ||||||
Costs reclassified to Capital Work in Progress |
— | (2 620,3 | ) | — | ||||||
Translation of foreign entities |
1,8 | 73,2 | 7,2 | |||||||
| | | | | | | | | | | |
Balance at end of year |
290,3 | 279,8 | 1 670,2 | |||||||
| | | | | | | | | | | |
| | | | | | | | | | | |
| | | | | | | | | | | |
Capitalised Exploratory Well costs Ageing at 30 June 2017 |
Mozambique (Rand in millions) |
|||
|---|---|---|---|---|
1 to 5 years |
221,0 | |||
over 5 years |
58,2 | |||
Number of projects |
1 | (1) | ||
- (1)
- Project activities for the Pande-Temane PSA CAP area are described above, under Mozambique—Activities.
Oil and Gas Production Facilities and Productive Wells
We operate production facilities in Mozambique and have non-operating interests in producing assets in Canada and Gabon.
The table below provides the production capacity at 30 June 2017.
Plant Description
|
Location | Design Capacity | ||
|---|---|---|---|---|
Central Processing Facility |
Pande-Temane PPA, Mozambique | 491 MMscf/day gas | ||
Floating, Production, Storage and Offloading facility |
Etame Marin Permit, Gabon |
25 000 bpd oil |
||
Processing Facilities |
Farrell Creek, Canada |
320 MMscf/day gas |
The table below provides the number of productive oil and gas wells at 30 June 2017. A productive well is a producing well or a well that is mechanically capable of production.
Number of productive wells 30 June 2017 |
Mozambique | Rest of Africa(1) |
North America(1) |
Total | |||||||||
|---|---|---|---|---|---|---|---|---|---|---|---|---|---|
Productive oil wells (number) |
|||||||||||||
Gross |
— | 11,0 | — | 11,0 | |||||||||
Net |
— | 3,1 | — | 3,1 | |||||||||
Productive gas wells (number) |
|||||||||||||
Gross |
20,0 | — | 172,0 | 192,0 | |||||||||
Net |
14,0 | — | 86,0 | 100,0 | |||||||||
- (1)
- Rest of Africa comprises Gabon, North America comprises Canada.
Proved Reserves and Production
The proved developed and proved undeveloped reserves of natural oil and gas as at 30 June 2017 and the two previous years along with volumes produced during the year are contained in the Natural Gas and Oil supplemental information, in Table 4, on page G-4.
50
Sales Prices and Production Costs
The table below summarises the average sales prices for natural gas and petroleum liquids produced and the average production cost, not including ad valorem and severance taxes, per unit of production for each of the last three years.
Average sale prices and production costs (Rand per unit) for the year ended 30 June |
Mozambique | North America(2) |
Rest of Africa(2) |
|||||||
|---|---|---|---|---|---|---|---|---|---|---|
2015 |
||||||||||
Average sales prices |
||||||||||
Natural gas, per thousand standard cubic feet |
30,9 | 28,3 | — | |||||||
Natural liquids, per barrel |
489,5 | 385,7 | 614,2 | |||||||
Average production cost(1) |
||||||||||
Natural gas, per thousand standard cubic feet |
10,0 | 7,4 | — | |||||||
Natural liquids, per barrel |
— | — | 308,9 | |||||||
2016 |
||||||||||
Average sales prices |
||||||||||
Natural gas, per thousand standard cubic feet |
25,1 | 20,0 | ||||||||
Natural liquids, per barrel |
106,4 | 361,6 | 574,3 | |||||||
Average production cost(1) |
||||||||||
Natural gas, per thousand standard cubic feet |
3,9 | 9,1 | — | |||||||
Natural liquids, per barrel |
— | — | 489,4 | |||||||
2017 |
||||||||||
Average sales prices |
||||||||||
Natural gas, per thousand standard cubic feet |
23,0 | 24,3 | — | |||||||
Natural liquids, per barrel |
166,1 | 338,7 | 653,2 | |||||||
Average production cost(1) |
||||||||||
Natural gas, per thousand standard cubic feet |
3,2 | 2,4 | — | |||||||
Natural liquids, per barrel |
— | — | 389,0 | |||||||
- (1)
- Average
production costs per unit of production are calculated according to the primary sales product.
- (2)
- Rest of Africa comprises Gabon, North America comprises Canada
Supplemental oil and gas information
Supplemental oil and gas information: See "Item 18—Financial Statements—Supplemental Oil and Gas Information" for supplemental information relating to natural oil and gas producing activities.
Energy—Plants and Facilities
Our facilities in South Africa
Our main manufacturing facilities are located at Secunda Synfuels Operations. Additionally the Natref refinery, based in Sasolburg, is approximately 2,0 km2
Our interests in facilities in Qatar
ORYX GTL is a gas-to-liquids plant, located at Ras Laffan Industrial City, situated along the northeast coast of Qatar.
Our interests in facilities in Mozambique
CTRG is a power generation facility, located at Ressano Garcia.
Transportation capacity
The table below provides details of the transportation capacity and location available to the Energy business.
Plant description
|
Location | Design capacity(1) |
||
|---|---|---|---|---|
Gauteng transmission network |
Gauteng | 128 bscf/a | ||
Rompco Pipeline |
From Central Processing Facility (Mozambique) to Pressure Protection Station (Secunda) (865km)—From Mozambique to Secunda and Sasolburg | 191 bscf/a | ||
Secunda, Witbank and Middelburg pipeline |
South Africa | 11 bscf/a | ||
Transnet Pipeline transmission pipeline |
South Africa | 23 bscf/a |
- (1)
- Nameplate capacity represents the total saleable production capacity. Due to the integrated nature of these facilities, the requirement for regular statutory maintenance shutdowns and market conditions, actual saleable volumes will be less than the nameplate
The following table provides details of the production capacity and location of the main joint arrangement plants where the Energy business has an interest.
Plant description
|
Location | Design capacity(1) | ||
|---|---|---|---|---|
ORYX GTL |
Ras Laffan Industrial City in Qatar | 32 400 bpd (nominal) | ||
EGTL |
Escravos, Nigeria | 33 200 bpd (nominal) | ||
Natref |
Sasolburg, South Africa | 108 000 bpd (nominal) | ||
CTRG |
Ressano Garcia, Mozambique | 175MW |
- (1)
- Nameplate capacity represents the total saleable production capacity. Due to the integrated nature of these facilities, the requirement for regular statutory maintenance shutdowns and market conditions, actual saleable volumes will be less than the nameplate.
Secunda Synfuels operations
Synthetic oil
Refer to "Item 4. D Property, plants and equipment—Mining" for details on our mining properties and coal exploration techniques used during the estimation of synthetic oil reserves.
The size of this total property is approximately 82,5 square kilometres (km2) with
51
operating plants accounting for 8,35 km2. This forms the base for the main manufacturing facilities for Energy, Base and Performance Chemicals.
The following table sets forth a summary of the synthetic oil equivalent average sales price and related production costs for the year shown:
| |
2017 | 2016 | 2015 | |||||||
|---|---|---|---|---|---|---|---|---|---|---|
Average sales price per barrel (Rand per unit) |
683,46 | 635,85 | 869,72 | |||||||
Average production cost per barrel (Rand per unit) |
448,67 | 359,75 | 280,88 | |||||||
Production (millions of barrels) |
41,3 | 51,6 | 51,8 | |||||||
Supplemental oil and gas information
Supplemental oil and gas information: See "Item 18—Financial Statements—Supplemental Oil and Gas Information" for supplemental information relating to synthetic oil producing activities.
Base Chemicals
Our facilities in South Africa
Our main manufacturing facilities are located at Secunda Synfuels Operations and Secunda Chemicals Operations. The size of this total property is approximately 82,5 square kilometres (km2) with operating plants accounting for 8,35 km2.
Our Sasolburg facilities
The Base and Performance Chemical facilities at Sasolburg are the base for a number of our chemical industries operations. The size of these properties is approximately 51,4 km2.
The following table summarises the main production capacities of the Regional Operating Hubs in Secunda and Sasolburg that produce polymer and monomer products marketed by Base Chemicals.
Production capacity at 30 June 2017
Product
|
South Africa(2) |
Malaysia(1)(2) | Total | |||||||
|---|---|---|---|---|---|---|---|---|---|---|
| |
(ktpa) |
|||||||||
Ethylene |
615 | 72 | 687 | |||||||
Propylene |
950 | 11 | 961 | |||||||
LDPE |
220 | 102 | 322 | |||||||
LLDPE |
150 | — | 150 | |||||||
Polypropylene-1 |
250 | — | 250 | |||||||
Polypropylene-2 |
375 | — | 375 | |||||||
Ethylene dichloride |
160 | — | 160 | |||||||
Vinyl chloride |
205 | — | 205 | |||||||
PVC |
190 | — | 190 | |||||||
Chlorine |
145 | — | 145 | |||||||
Caustic soda |
167 | — | 167 | |||||||
Cyanide |
40 | — | 40 | |||||||
Hydrochloric acid |
90 | — | 90 | |||||||
Calcium chloride |
10 | — | 10 | |||||||
- (1)
- Includes
our attributable share of the production capacity of joint operations.
- (2)
- Nameplate capacity represents the total saleable production capacity. Due to the integrated nature of these facilities, the requirement for regular statutory maintenance shutdowns and market conditions, actual saleable volumes will be less than the nameplate capacity.
The following table summarises the main production capacities of the Regional Operating
52
Hubs in Secunda and Sasolburg that produce solvent products marketed by Base Chemicals:
Production capacity as at 30 June 2017
Product
|
South Africa |
Germany | Total(1) | |||||||
|---|---|---|---|---|---|---|---|---|---|---|
| |
(ktpa) |
|||||||||
Ketones |
293 | — | 293 | |||||||
• Acetone |
175 | — | 175 | |||||||
• MEK |
60 | — | 60 | |||||||
• MiBK |
58 | — | 58 | |||||||
Glycol ethers |
— | 80 | 80 | |||||||
• Butyl glycol ether |
— | 80 | 80 | |||||||
Acetates |
54 | — | 54 | |||||||
• Ethyl acetate |
54 | — | 54 | |||||||
Mixed alcohols |
215 | — | 215 | |||||||
Pure alcohols |
473 | — | 473 | |||||||
• Methanol (C1) |
140 | — | 140 | |||||||
• Ethanol (C2) |
114 | — | 114 | |||||||
• n-Propanol (C3) |
70 | — | 70 | |||||||
• n-Butanol (C4) |
150 | — | 150 | |||||||
• iso-Butanol (C4) |
15 | — | 15 | |||||||
Acrylates |
125 | — | 125 | |||||||
• Ethyl acrylate |
35 | — | 35 | |||||||
• Butyl acrylate |
80 | — | 80 | |||||||
• Glacial acrylic acid |
10 | — | 10 | |||||||
Maleic anhydride(2) |
— | 53 | 53 | |||||||
Other |
19 | — | 19 | |||||||
- (1)
- Consolidated
nameplate capacities excluding internal consumption and including our attributable share of the production capacity of our Sasol Huntsman joint venture.
Nameplate capacity represents the total saleable production capacity. Due to the integrated nature of these facilities, the requirement for regular statutory maintenance shutdowns and market conditions, actual saleable volumes will be less than the nameplate capacity.
- (2)
- Our 50% share of the production capacity of our Sasol Huntsman joint venture.
Approximately 90% of our production capacity is located at sites in South Africa and 10% in Germany.
Our facilities in the United States
Construction of our 50% joint venture high-density polyethylene plant with Ineos Olefins and Polymers USA is essentially complete and is due to reach beneficial operation in the second half of the 2017 calendar year. Upon completion, the plant will be the largest bi-modal HDPE manufacturing facility in the US with a nameplate capacity of 470 kilotons annually.
Base Chemicals' share of the LCCP, currently being constructed, is located at Lake Charles, Louisiana (site size approximately 6 million m2; plant size 650 000 m2).
Refer to "Item 3.D—Risk factors" and "Item 5.B—Liquidity and capital resources" for further detail on the construction of the LCCP.
Performance Chemicals
Our facilities in South Africa
Our facilities at Secunda and Sasolburg are the base for a number of our chemical industries operations.
Our facilities in Germany
Performance Chemicals operations are based at three locations in Germany, namely Brunsbüttel (site size approximately 2 million m2; plant size 500 000 m2), Marl (site size approximately 160 000 m2; plant size 75 000 m2) and the Wax facility based in Hamburg (site size approximately 160 000 m2; plant size 100 000 m2).
Our facilities in Italy
The operations of Performance Chemicals are based at three locations in Italy. The primary facilities are at Augusta (site size approximately 1,36 million m2; plant size 510 000 m2) and Terranova (site size approximately 330 000 m2; plant size 160 000 m2).
Our facilities in the United States
Various Performance Chemicals operations are based at a number of locations in the US. The most significant of these facilities is located at Lake Charles, Louisiana (site size approximately 6 million m2; plant size 650 000 m2).
Performance Chemicals also has phenolics operations based at Oil City, Pennsylvania; Houston and Winnie, Texas;- as well as an alumina facility in Tucson, Arizona.
53
Our facility in China
The operations of Performance Chemicals are based at Nanjing (site size approximately 90 000 m2; plant size 4 000 m2).
Production capacity at 30 June 2017
Product
|
| Facilities location | | Total(1) | | |||
|---|---|---|---|---|---|---|---|---|
| |
| |
| (ktpa) |
| |||
Surfactants |
| United States, Europe, Far East | | | 1 000 | | | |
C6+ alcohol |
| United States, Europe, South Africa, Far East | | | 630 | | | |
Ethylene |
| United States | | | 455 | | | |
Inorganics |
| United States, Europe, South Africa | | | 71 | | | |
Paraffins and olefins |
| United States, Europe | | | 750 | | | |
LAB |
| United States, Europe | | | 435 | | | |
C5-C8 alpha olefins |
| United States, South Africa | | | 456 | | | |
Paraffin wax and wax emulsions |
| Europe | | | 460 | | | |
FT-based wax and related products |
| South Africa | | | 280 | | | |
Paraffin wax |
| South Africa | | | 30 | | | |
- (1)
- Nameplate capacity represents the total saleable production capacity. Due to the integrated nature of these facilities, the requirement for regular statutory maintenance shutdowns and market conditions, actual saleable volumes will be less than the nameplate capacity.
Performance Chemicals' share of the LCCP, currently being constructed, is located at Lake Charles, Louisiana (site size approximately 3 million m2; plant size 540 000m2).
Refer to "Item 3.D—Risk factors" and "Item 5.B—Liquidity and capital resources" for further detail on the construction of the LCCP.
ITEM 4A. UNRESOLVED STAFF COMMENTS
There are no unresolved written comments from the SEC staff regarding our periodic reports under the Securities Exchange Act of 1934 received not less than 180 days before 30 June 2017, that are considered material.
ITEM 5. OPERATING AND FINANCIAL REVIEW AND PROSPECTS
This section should be read in conjunction with our consolidated financial statements included in "Item 18—Annual Financial Statements" as at 30 June 2017 and 2016, and for the years ended 30 June 2017, 2016 and 2015, including the accompanying notes, that are included in this annual report on Form 20-F. The following discussion of operating results and the financial review and prospects as well as our consolidated financial statements have been
prepared in accordance with IFRS as issued by the IASB.
For information regarding our financial overview and external factors impacting on our business, refer to the "CFO Report—Market overview" and "Key risks impacting our financial performance" as contained in Exhibit 99.3. This includes an analysis of the impact of macro-economic factors on Sasol's performance and an overview of the current economic environment, crude oil prices, exchange rates, gas prices and chemical prices. Movements in our cost base are also analysed, including the impact of cost-reduction measures and inflation.
Certain information contained in the discussion and analysis set forth below and elsewhere in this annual report includes forward-looking statements that involve risks and uncertainties. See "Forward-Looking Statements". See "Item 3.D—Key information—Risk factors" for a discussion of significant factors that could cause actual results to differ materially from the results described in or implied by the forward-looking statements contained in this annual report.
5.A Operating results
Results of operations
| |
| 2017 | | 2016 | | Change 2017/2016 |
| 2015 | | Change 2016/2015 |
| |||||||||||
|---|---|---|---|---|---|---|---|---|---|---|---|---|---|---|---|---|---|---|---|---|---|---|
| |
| (Rand in millions) |
| (%) |
| (Rand in millions) |
| (%) |
| |||||||||||||
Turnover |
| 172 407 | | 172 942 | | | — | | | | 185 266 | | | | (7 | ) | | |||||
Operating costs and expenses |
| (140 157 | ) | (136 320 | ) | | 3 | | | | (139 967 | ) | | | (3 | ) | | |||||
Remeasurement items |
| (1 616 | ) | (12 892 | ) | | (87 | ) | | | (807 | ) | | | 1 498 | | | |||||
Share of profit of equity accounted investments, net of tax |
| 1 071 | | 509 | | | 110 | | | | 2 057 | | | | (75 | ) | | |||||
| | | | | | | | | | | | | | | | | | | |||||
Operating profit |
| 31 705 | | 24 239 | | | 31 | | | | 46 549 | | | | (48 | ) | | |||||
Net finance costs |
| (1 697 | ) | (521 | ) | | 226 | | | | (956 | ) | | | (46 | ) | | |||||
| | | | | | | | | | | | | | | | | | | |||||
Profit before tax |
| 30 008 | | 23 718 | | | 27 | | | | 45 593 | | | | (48 | ) | | |||||
Taxation |
| (8 495 | ) | (8 691 | ) | | (2 | ) | | | (14 431 | ) | | | (40 | ) | | |||||
| | | | | | | | | | | | | | | | | | | |||||
Profit |
| 21 513 | | 15 027 | | | 43 | | | | 31 162 | | | | (52 | ) | | |||||
| | | | | | | | | | | | | | | | | | | |||||
| | | | | | | | | | | | | | | | | | | |||||
| | | | | | | | | | | | | | | | | | | |||||
Financial review 2017
- •
- For information regarding our financial condition, and an overview of our results refer "CFO Report—Financial performance" as contained in Exhibit 99.3.
54
- •
- For information on changes in our financial condition, and overall financial performance refer "CFO Report—Market overview" and "Financial performance" as contained in Exhibit 99.3.
Turnover
Turnover consists of the following categories:
| |
| 2017 | | 2016 | | Change 2017/2016 |
| 2015 | | Change 2016/2015 |
| |||||||||||
|---|---|---|---|---|---|---|---|---|---|---|---|---|---|---|---|---|---|---|---|---|---|---|
| |
| (Rand in millions) |
| (%) |
| (Rand in millions) |
| (%) |
| |||||||||||||
Sale of products |
| 169 115 | | 170 830 | | | (1 | ) | | | 183 935 | | | | (7 | ) | | |||||
Services rendered |
| 1 549 | | 1 695 | | | (9 | ) | | | 998 | | | | 70 | | | |||||
Other trading income |
| 1 743 | | 417 | | | 318 | | | | 333 | | | | 25 | | | |||||
| | | | | | | | | | | | | | | | | | | |||||
Turnover |
| 172 407 | | 172 942 | | | — | | | | 185 266 | | | | (7 | ) | | |||||
| | | | | | | | | | | | | | | | | | | |||||
| | | | | | | | | | | | | | | | | | | |||||
| | | | | | | | | | | | | | | | | | | |||||
The primary factors contributing to the decreases in turnover were:
| |
| Change 2017/2016 |
| Change 2016/2015 |
| ||||||||||||||||
|---|---|---|---|---|---|---|---|---|---|---|---|---|---|---|---|---|---|---|---|---|---|
| |
| (Rand in millions) |
| (%) |
| (Rand in millions) |
| (%) |
| ||||||||||||
Turnover, 2016 and 2015 |
| | 172 942 | | | | | | | 185 266 | | | | | | ||||||
Exchange rate effects |
| | (11 330 | ) | | | (7 | ) | | | 23 565 | | | | 13 | | | ||||
Product prices |
| | 14 343 | | | | 8 | | | | (32 442 | ) | | | (18 | ) | | ||||
—crude oil |
| | 9 041 | | | | 5 | | | | (26 120 | ) | | | (14 | ) | | ||||
—other products |
| | 5 302 | | | | 3 | | | | (6 322 | ) | | | (4 | ) | | ||||
Net volume changes |
| | 705 | | | | — | | | | (3 413 | ) | | | (2 | ) | | ||||
Other effects |
| | (4 253 | )(1) | | | (2 | ) | | | (34 | ) | | | — | | | ||||
| | | | | | | | | | | | | | | | | | | ||||
Turnover |
| | 172 407 | | | | — | | | | 172 942 | | | | (7 | ) | | ||||
| | | | | | | | | | | | | | | | | | | ||||
| | | | | | | | | | | | | | | | | | | ||||
| | | | | | | | | | | | | | | | | | | ||||
- (1)
- Other effects arise mainly from the offset of feedstock credits against turnover, relating to kerosene return-stream swap agreements entered into in 2017.
Operating costs and expenses
Operating costs and expense consists of the following categories:
| |
| 2017 | | 2016 | | Change 2017/2016 |
| 2015 | | Change 2016/2015 |
| |||||||||||
|---|---|---|---|---|---|---|---|---|---|---|---|---|---|---|---|---|---|---|---|---|---|---|
| |
| (Rand in millions) |
| (%) |
| (Rand in millions) |
| (%) |
| |||||||||||||
Materials, energy and consumable used |
| (71 436 | ) | (71 320 | ) | | — | | | | (80 169 | ) | | | (11 | ) | | |||||
Selling and distribution costs |
| (6 405 | ) | (6 914 | ) | | (7 | ) | | | (6 041 | ) | | | 14 | | | |||||
Maintenance expenditure |
| (8 654 | ) | (8 453 | ) | | 2 | | | | (7 628 | ) | | | 11 | | | |||||
Employee-related expenditure |
| (24 417 | ) | (23 911 | ) | | 2 | | | | (22 096 | ) | | | 8 | | | |||||
Exploration expenditure and feasibility costs |
| (491 | ) | (282 | ) | | 74 | | | | (554 | ) | | | (49 | ) | | |||||
Depreciation and amortisation |
| (16 204 | ) | (16 367 | ) | | (1 | ) | | | (13 567 | ) | | | 21 | | | |||||
Translation (losses)/gains |
| (1 201 | ) | 150 | | | (901 | ) | | | (959 | ) | | | (116 | ) | | |||||
Other operating expenses |
| (13 037 | ) | (13 011 | ) | | 0 | | | | (10 854 | ) | | | 20 | | | |||||
Other operating income |
| 1 688 | | 3 788 | | | (55 | ) | | | 1 901 | | | | 99 | | | |||||
| | | | | | | | | | | | | | | | | | | |||||
Operating costs and expenses |
| (140 157 | ) | (136 320 | ) | | 3 | | | | (139 967 | ) | | | (3 | ) | | |||||
| | | | | | | | | | | | | | | | | | | |||||
| | | | | | | | | | | | | | | | | | | |||||
| | | | | | | | | | | | | | | | | | | |||||
Materials, energy and consumables used. Materials, energy and consumables used in 2017 amounted to R71 436 million, an increase of R116 million, or 0,2%, compared with R71 320 million in 2016, which decreased by 11% from R80 169 million in 2015. These costs remained relatively flat between 2017 and 2016 due to the continued decline in crude oil prices, partially offset by higher production volumes at Secunda Synfuels Operations, Sasolburg Operations and Eurasia Operations.
Selling and distribution costs. These costs comprise of marketing and distribution of products, freight and customs and excise duty after the point of sale. Selling and distribution costs in 2017 amounted to R6 405 million, which represents a decrease of R509 million, or 7%, compared with R6 914 million in 2016, which increased by R873 million, or 15%, million compared with R6 041 million in 2015. The variation in these costs was mainly attributable to the stronger rand against major currencies, which impacted our foreign operations during 2017. Selling and distribution costs represented 4% of sales in 2017, 4% of sales in 2016, and 3% of sales in 2015.
Maintenance expenditure. Maintenance expenditure in 2017 amounted to R8 654 million, which represents an increase of R201 million, or 2%, compared with R8 453 million in 2016, which increased by R825 million, or 11%, compared with R7 628 million in 2015. Maintenance expenditure remained relatively flat in 2017 compared to 2016 mainly due to our cost-saving initiatives implemented as part of the Response Plan and the stronger rand/US dollar exchange rate. Maintenance costs include additional stonework sections, overhauls and required maintenance due to unforeseen technical difficulties in equipment at Sasol Mining. The increase in maintenance expenditure in 2016 was mainly due to the weakening of the exchange rate against major currencies, planned extended shutdowns in Sasolburg and the US, as well as well workovers amounting to R133 million in Gabon.
Employee related expenditure. Employee related expenditure amounted to R24 471 million, which represents an increase of
55
R506 million, or 2%, compared with R23 911 million in 2016, which increased by R1 815 million, or 8%, from 2015.
This amount includes labour costs of R24 654 million (2016—R23 540 million and 2015—R23 478 million) and a share-based payment charge to the income statement of R226 million (debit), (2016—R494 million (debit) and 2015—R1 161 million (credit)).
Excluding the effect of the share-based payment expenses, our employee costs increased by R1 114 million, or 5%, in 2017. This was primarily due to normal annual salary increases and an increase in headcount. Overall headcount increased from 30 100 in 2016 to 30 900 employees in 2017, an increase of 2,7%.
Exploration expenditure and feasibility costs. Exploration expenditure and feasibility costs in 2017 amounted to R491 million, which represents an increase of R209 million, or 74%, compared with R282 million in 2016, which decreased by R272 million compared with R554 million in 2015. The increase in 2017, as compared to 2016 and 2015, was largely attributable to an increased focus on West Africa where additional costs were incurred for the acquisition of seismic data for possible exploration activities.
Depreciation and amortisation. Depreciation and amortisation in 2017 amounted to R16 204 million, which represents a marginal decrease of R163 million, compared with R16 367 million in 2016, which increased by R2 800 million compared with R13 567 million in 2015. The decrease in depreciation is largely attributable to the strengthening of the rand/US dollar exchange rate, and a stable asset base in 2017.
The increase in depreciation and amortisation in 2016 compared to 2015 is mainly due to the increase in assets that reached beneficial operations in 2016 at Secunda Synfuels operations, Mining and Base Chemicals, as well as the impact of the weaker rand/US dollar exchange rate. In addition, our Gabon assets recorded higher depreciation (R779 million), due to lower reserves being declared, on the back of a lower oil price.
Translation (losses)/gains. Translation losses arising primarily from the translation of monetary assets and liabilities, as well as foreign exchange contracts, amounted to R1 201 million in 2017, as compared to a R150 million gain in 2016 and a R959 million loss in 2015. The 2017 translation loss includes a translation loss on receivables of R909 million. During 2017, the rand consistently strengthened against the US dollar resulting in exchange rate losses.
The closing rate is used to translate, to rand, all our monetary assets and liabilities denominated in a currency other than the rand at the reporting date and, as a result, a net loss was recognized on these translations during 2017 and a gain was recognised on these translations in 2016 and a loss in 2015. The strengthening of the rand has a positive impact on the translation of our monetary liabilities, while the weakening of the rand has a positive impact on the translation of our monetary assets. On the converse, a strengthening of the rand has a negative impact on the translation of our monetary assets.
Other operating expenses. Other operating expenses in 2017 amounted to R13 037 million, an increase of R26 million, compared to R13 011 million in 2016, which increased by R2 157 million from R10 854 million in 2015.
This amount includes:
- •
- rental expenses of R1 367 million (2016—R1 243 million and
2015—R1 114 million);
- •
- insurance costs of R511 million (2016—R457million and 2015—R542 million);
- •
- computer costs of R1 991 million (2016—R1 832 million and
2015—R 1 614million);
- •
- hired labour of R878 million (2016—R893 million and 2015—R804 million);
- •
- audit remunerations of R89 million (2016—R85 million and 2015—R87 million);
- •
- professional fees of R1 383 million (2016—R 1 202 million and 2015—R1 227 million);
56
- •
- derivative gains (including foreign exchange contracts) of R635 million, 2016—R1 250 million and
2015—R317 million;
- •
- movements in rehabilitation provisions of R472 million (2016—R1 946 million and
2015—(R1 722 million) due to the extension of useful life); and
- •
- other expenses of R6 981 million (2016—R6 603 million and 2015—R7 505 million).
Included in other expenses are restructuring costs related to our Business Performance Enhancement Programme (BPEP) of Rnil (2016—R235 million; 2015—R1 525 million)
In 2015, the reversal of the administrative penalty of R534 million, which was imposed by the Competition Tribunal in June 2014 was included against other operating expenses.
Other operating income. Other operating income in 2017 amounted to (R1 688 million), which represents a decrease of R2 100 million, or 55%, compared with (R3 788 million) in 2016. In 2015, other operating income amounted to (R1 901 million).
Other operating income in 2016 includes the reversal of the EGTL provision of R2 296 million, after a favorable decision at the Tax Appeal Tribunal.
Share of profits from equity accounted investments
| |
| 2017 | | 2016 | | Change 2017/2016 |
| 2015 | | Change 2016/2015 |
| |||||||||||||
|---|---|---|---|---|---|---|---|---|---|---|---|---|---|---|---|---|---|---|---|---|---|---|---|---|
| |
| |
| (%) |
| |
| (Rand in millions) |
| (%) |
| |||||||||||||
Profit before tax |
| 1 338 | | | 378 | | | | 254 | | | | 2 333 | | | | (84 | ) | | |||||
Tax |
| (267 | ) | | 131 | | | | (304 | ) | | | (276 | ) | | | 147 | | | |||||
| | | | | | | | | | | | | | | | | | | | | |||||
Share of equity accounted profit, net of tax |
| 1 071 | | | 509 | | | | 110 | | | | 2 057 | | | | (75 | ) | | |||||
| | | | | | | | | | | | | | | | | | | | | |||||
| | | | | | | | | | | | | | | | | | | | | |||||
| | | | | | | | | | | | | | | | | | | | | |||||
Remeasurement items, net of tax |
| 14 | | | 13 | | | | — | | | | 1 | | | | 1 200 | | | |||||
| | | | | | | | | | | | | | | | | | | | | |||||
| | | | | | | | | | | | | | | | | | | | | |||||
| | | | | | | | | | | | | | | | | | | | | |||||
The share of profits of equity accounted investments (net of tax) amounted to R1 071 million in 2017 as compared to R509 million in 2016 and R2 057 million in 2015. The increase in share of profit of equity accounted investments in 2017 compared to 2016
is mainly due to a 16% volume increase at our ORYX GTL facility coupled with the positive impact of higher Brent crude oil prices resulting in an 81% increase in ORYX GTL's equity accounted earnings from R463 million in 2016 to R839 million in 2017. The ORYX GTL plant achieved an average utilisation rate of 95% during the 2017 year.
The Escravos gas to liquids (EGTL) plant in Nigeria resumed operation in quarter three of 2017 after completion of the scheduled maintenance programme and both trains are operating as expected. Losses of R472 million were incurred relating to EGTL in 2017.
Remeasurement items
For information regarding the remeasurement items recognised, refer to "Item 18—Annual Financial Statements—Note 8".
Finance costs and finance income
For information regarding finance costs incurred and finance income earned, refer to "Item 18—Annual Financial Statements—Note 6".
The increase in finance costs is due to an increased number of projects having reached beneficial operation during 2017 for which interest is no longer capitalised as well as finance costs charged by the South African Revenue Service on South African income tax assessments. For more information on the South African income tax assessments issued by the South African Revenue Service refer to "Legal proceedings and other contingencies" under 4.B Business overview.
Tax
For information regarding the tax charge, refer to "Item 18—Annual Financial Statements—Note 11".
Non-controlling interests
For information regarding our non-controlling interests, and their share of profit, refer "Item 18—Annual Financial Statements—Note 21".
57
Profit attributable to non-controlling interests in subsidiaries of R1 139 million decreased by R663 million, or 37%, from R1 802 million in 2016; which was an increase of R356 million or 25% from R1 446 million in 2015.
The decrease in profit attributable to non-controlling interests in 2017, as compared to the increase in 2016 and 2015 is largely attributable to a decrease in the profits attributable to the non-controlling interests in Sasol Oil of R546 million due to a liability of R1,2 billion in respect of the ongoing tax litigation with the South African Revenue Service.
Financial review 2016
Group results
Operating profit of R24,2 billion decreased by 48% compared to the prior year on the back of challenging and highly volatile global markets. Average Brent crude oil prices moved dramatically lower by 41% compared to the prior year (average dated Brent was US$43/bbl for the year ended 30 June 2016 compared with US$73/bbl in the prior year). Although commodity chemical prices were lower due to depressed oil prices, there was still strong demand and robust margins in certain key markets. The average basket of commodity chemical prices decreased by 22% compared to a 41% decrease in oil. In particular, the average margin for our speciality chemicals business remained resilient compared to the prior year. The effect of lower oil and commodity chemical prices was partly offset by a 27% weaker average rand/US dollar exchange rate (R14,52/US$ for the year ended 30 June 2016 compared with R11,45/US$ in the prior year). On average, the rand/bbl oil price of R630 was 25% lower compared to the prior year.
Items which materially impacted operating profit
During 2016, profitability was impacted by the following significant items:
- •
- a net remeasurement items expense of R12,9 billion compared to a R0,8 billion
- •
- a cash-settled share-based payment charge to the income statement of R371 million compared to a credit of R1,4 billion in the
prior year. The credit in the prior year was largely due to a 29% decrease in the share price in financial year 2015; and
- •
- the reversal of a provision of R2,3 billion (US$166 million) based on a favourable ruling received from the Tax Appeal Tribunal in Nigeria relating to the Escravos Gas-to-Liquids (EGTL) project.
expense in the prior year. These items relate mainly to partial impairments of our low density polyethylene cash generating unit in the United States (US) of R956 million (US$65 million) and our share in the Montney shale gas asset of R9,9 billion (CAD880 million) due to a further deterioration of conditions in the North American gas market resulting in a decline in forecasted natural gas prices;
Financial review 2015
Group results
Operating profit of R46,5 billion increased by 2% compared to the prior year. This achievement was due to a strong overall operational performance with increased sales volumes, resilient margins and cost increases contained to below inflation. Conversely, the group's profitability was adversely impacted by a 33% decline in average Brent crude oil prices (average dated Brent was US$73,46/bbl for the year ended 30 June 2015 compared with US$109,40/bbl in the prior year). This decrease was partly off-set by a 10% weaker average rand/US dollar exchange rate (R11,45/US$ for the year ended 30 June 2015 compared with R10,39/US$ in the prior year).
Items which materially impacted operating profit
During 2015, profitability was positively impacted by the following significant items:
- •
- a cash-settled share-based payment credit to the income statement of R1,4 billion compared to an expense of R5,4 billion in the prior year, largely due to a 29% lower
58
- •
- the extension of the useful life of our operating assets in South Africa resulting in a decrease in depreciation of R1,4 billion and
environmental rehabilitation provisions of R1,8 billion; and
- •
- net remeasurement items expense of R0,8 billion in 2015, as compared to a R7,6 billion expense in the prior year. The 2015 remeasurement items relate mainly to the full reversal of the previous R2,0 billion impairment of the FT Wax Expansion Project, the partial impairment of our Canadian shale gas assets of R1,3 billion and the partial impairment of our Etame assets in Gabon of R1,3 billion.
share price (closing share price of R450,00 compared to R632,36 in the prior year), partially negated by the increase in the number of share options exercised during the year;
Segment review—results of operations
Reporting segments are identified in the way in which the Joint Presidents and Chief Executive Officers organise segments within our group for making operating decisions and assessing performance. The segment overview included below is based on our segment results. Inter-segment turnover was entered into under terms and conditions substantially similar to terms and conditions which would have been negotiated with an independent third party. Refer to Business segment information of "Item 18—Annual Financial statements" for further detail regarding turnover and Operating profit per segment.
Refer also to "Our Operating Model Structure" as contained in Exhibit 99.4.
Operating Business Units
Mining
| |
| 2017 | | 2016 | | Change 2017/2016 |
| 2015 | | Change 2016/2015 |
| |||||||||||
|---|---|---|---|---|---|---|---|---|---|---|---|---|---|---|---|---|---|---|---|---|---|---|
| |
| (Rand in millions) |
| (%) |
| (Rand in millions) |
| (%) |
| |||||||||||||
External turnover |
| 2 946 | | 2 360 | | | 25 | | | | 2 215 | | | | 7 | | | |||||
Inter-segment turnover |
| 16 016 | | 14 615 | | | 10 | | | | 13 472 | | | | 8 | | | |||||
| | | | | | | | | | | | | | | | | | | |||||
Total turnover |
| 18 962 | | 16 975 | | | 12 | | | | 15 687 | | | | 8 | | | |||||
Operating costs and expenses(1) |
| (15 237 | ) | (12 236 | ) | | 25 | | | | (11 344 | ) | | | 8 | | | |||||
| | | | | | | | | | | | | | | | | | | |||||
Operating profit |
| 3 725 | | 4 739 | | | (21 | ) | | | 4 343 | | | | 9 | | | |||||
| | | | | | | | | | | | | | | | | | | |||||
| | | | | | | | | | | | | | | | | | | |||||
| | | | | | | | | | | | | | | | | | | |||||
Operating margin % |
| 20 | | 28 | | | | | | 28 | | | | | | |||||||
- (1)
- Operating costs and expenses net of other income.
Results of operations 2017 compared to 2016
Total turnover increased by 12% from R16 975 million to R18 962 million. Operating profit of R3 725 million represents a decrease of 21% when compared to the prior year primarily due to the impact of labour actions at our Secunda mining operations in the first half of the financial year. The labour action resulted in additional once-off costs of R1 billion (relating mainly to additional security and hired labour costs) and external coal purchases of R0,4 billion to ensure continuous supply to Secunda Synfuels Operations (SSO). The total cost amounts to R1,4 billion. Production volumes decreased to 37,6 Mt for 2017 compared with 42,3 Mt due to the prolonged labour action and slower-than-expected ramp up of productivity after the strike. Normalised unit costs of production were 13% above inflation in 2017.
Our export coal business benefited from higher global coal prices during the year; however a portion of the volumes were sent to SSO during the strike period. Our export volumes, decreased by 7% to 3 million tons (Mt) (2016—3,2 Mt). Export sales represented approximately 16% of the total turnover generated by Mining during 2017 (2016—14%).
Results of operations 2016 compared to 2015
Total turnover increased by 8% from R15 687 million to R16 975 million. Operating profit of R4 739 million represents an increase of 9% as compared to the prior year. Production volumes increased to 42,3 Mt for 2016 compared with 41,2 Mt in 2015. Normalised unit costs of production were contained to 5% below inflation
59
in 2016, following on from a 2% decrease in 2015 as compared to 2014.
Our export volumes, primarily to Pakistan, India and Africa, decreased by 6% to 3,2 million tons (Mt) (2015—3,4 Mt). Export sales represented approximately 14% of the total turnover generated by Mining during 2016 (2015—14%).
For further analysis of our results refer "Integrated Report—Operational reviews" as contained in Exhibit 99.7.
Exploration and Production International
| |
2017 | 2016 | Change 2017/ 2016 |
2015 | Change 2016/ 2015 |
|||||||||||
|---|---|---|---|---|---|---|---|---|---|---|---|---|---|---|---|---|
| |
(Rand in millions) |
(%) |
(Rand in millions) |
(%) |
||||||||||||
External turnover |
1 750 | 1 706 | 3 | 2 043 | (17 | ) | ||||||||||
Inter-segment turnover |
2 334 | 2 505 | (7 | ) | 3 129 | (20 | ) | |||||||||
| | | | | | | | | | | | | | | | | |
Total turnover |
4 084 | 4 211 | (3 | ) | 5 172 | (19 | ) | |||||||||
Operating costs and expenses(1) |
(3 499 | ) | (15 925 | ) | (78 | ) | (8 342 | ) | 91 | |||||||
| | | | | | | | | | | | | | | | | |
Operating profit/(loss) |
585 | (11 714 | ) | (105 | ) | (3 170 | ) | 270 | ||||||||
| | | | | | | | | | | | | | | | | |
| | | | | | | | | | | | | | | | | |
| | | | | | | | | | | | | | | | | |
Operating margin % |
14 | (278 | ) | (61 | ) | |||||||||||
- (1)
- Operating costs and expenses net of other income including exploration costs and depreciation
Results of operations 2017 compared to 2016
Total turnover decreased by 3% from R4 211 million in 2016 to R4 084 million in 2017 due to the stronger rand/US dollar exchange rate. Exploration and Production International (E&PI) recorded an operating profit of R585 million compared to an operating loss of R1,8 billion (excluding the impact of the partial impairment of our Canadian shale gas operations of R9,9 billion) in the prior year. This result was achieved through focused management of the asset portfolio and strict cost control. Operating profit includes a translation gain of R337 million versus a translation loss of R695 million in the prior year.
Operating profit from our Mozambican producing operations increased to R1 990 million from R1 128 million in the prior year, mainly due to a 2% increase in gas production volumes and the net positive impact of foreign currency translations.
Our Gabon asset recorded an operating profit of R295 million compared to an operating loss of R994 million in the prior year, mainly due to higher sales prices, the partial reversal of an impairment of R197 million and lower depreciation charges. This was offset by an 18% decrease in production volumes resulting from the deferral of drilling activities in line with our Response Plan cash-conservation initiatives.
Our Canadian shale gas asset in Montney generated a lower operating loss of R746 million, compared to an operating loss of R1 075 million (excluding the impact of a partial impairment of R9 882 million) in the prior year.
Our Canadian gas production volumes increased by 6% compared to the prior year, mainly due to completion activities on existing wells. There were no drilling rigs in operation during the year in line with our Response Plan as well as capital and cash conservation initiatives.
Results of operations 2016 compared to 2015
Total turnover decreased by 19% from R5 172 million in 2015 to R4 211 million in 2016. The business recorded an operating loss of R11 714 million compared to an operating loss of R3 170 million in the prior year.
Excluding the partial impairment of our Canadian shale gas operations of R9 882 million (CAD880 million) in 2016, which was recognised due to the continued decline in gas prices, the business recorded a loss of R1 832 million.
In Mozambique, production volumes increased by 5% as a result of our efforts to debottleneck the production facility, coupled with the increase in gas transportation capacity to 169 billion standard cubic feet (bscf), and a full volume offtake by our joint electricity operations in Mozambique.
The lower oil price had a significant impact on our Gabon assets resulting in a loss of R994 million which includes the impact of higher depreciation (R779 million) due to lower reserves being declared, on the back of a lower oil price. This is compared to a R1 124 million loss in the prior year, which included the partial impairment of the asset of R1 331 million. The
60
new development wells which were brought on line during the financial year resulted in a 16% higher average of 18 824 barrels of oil production per day (on a gross basis) when compared to 16 284 barrels in the prior year.
Our Canadian gas production volumes were 5% lower compared to the prior year due to reduced development activities, driven by lower oil and gas prices. Our Canadian operations produced and sold 20,7 bscf of natural gas during 2016 compared to 21,8 bscf in 2015.
In order to manage the shale gas asset through the low gas price environment, in 2016 we concluded an agreement with our partner, Progress Energy, to settle the outstanding funding commitment of R4 160 million (CAD380 million) and reduce the pace of appraisal, development and drilling activities. An 18-month reduced work programme was approved in June 2016. CAD305 million was paid in June 2016. The remaining CAD75 million will be paid on 1 July 2018.
For further analysis of our results refer "Integrated Report—Operational reviews" as contained in Exhibit 99.7.
Strategic Business Units
Energy
| |
2017 | 2016 | Change 2017/ 2016 |
2015 | Change 2016/ 2015 |
|||||||||||
|---|---|---|---|---|---|---|---|---|---|---|---|---|---|---|---|---|
| |
(Rand in millions) |
(%) |
(Rand in millions) |
(%) |
||||||||||||
External turnover |
64 254 | 63 818 | 1 | 75 264 | (15 | ) | ||||||||||
Inter-segment turnover |
518 | 523 | (1 | ) | 536 | (2 | ) | |||||||||
| | | | | | | | | | | | | | | | | |
Total turnover |
64 772 | 64 341 | 1 | 75 800 | (15 | ) | ||||||||||
Operating costs and expenses(1) |
(53 554 | ) | (50 272 | ) | 7 | (53 274 | ) | (6 | ) | |||||||
| | | | | | | | | | | | | | | | | |
Operating profit |
11 218 | 14 069 | (20 | ) | 22 526 | (38 | ) | |||||||||
| | | | | | | | | | | | | | | | | |
| | | | | | | | | | | | | | | | | |
| | | | | | | | | | | | | | | | | |
Operating margin % |
17 | 22 | 30 | |||||||||||||
- (1)
- Operating costs and expenses net of other income.
Results of operations 2017 compared to 2016
Total turnover increased by 1% from R64 341 million in 2016 to R64 772 million in 2017, due to increases in the international prices of refined products, partly negated by the lower volumes sold and the stronger rand/US dollar exchange rate.
Operating profit, including equity accounted earnings, of R11 218 million decreased by R2 851 million or 20% compared to the prior year. Operating margins decreased from 22% to 17%.
Excluding the effect of remeasurements, mainly the partial impairment of our US gas-to-liquids project (R1,7 billion), translation effects on the valuation of the balance sheet using the closing rand/US dollar exchange rate and the reversal of the Escravos GTL PIA provision of R2,3 billion in 2016, operating profit, including equity accounted earnings, increased by 5%.
The 5% increase is mainly due to higher crude oil prices, solid production performance of ORYX GTL, further positive contributions from our BPEP and Response Plan initiatives, partially negated by a 19% decrease in petrol differentials, stronger rand/US dollar exchange rates and lower liquid fuel sales volumes. Cost increases were contained to below inflation.
Gas sales volumes were 2% lower compared to the prior year mainly due to lower market demand. Our share of power produced at the Central Térmica de Ressano Garcia (CTRG) joint operation in Mozambique amounted to 658 gigawatt-hours of electricity, 1% higher than the prior year.
ORYX GTL delivered an excellent production performance with an average utilisation rate of 95%, while maintaining a world-class safety recordable case rate of zero. ORYX GTL contributed R839 million to operating profit with volumes increasing by 16% compared to the prior year.
The group participates in ORYX GTL's net assets (before tax) and pre-tax profits at 49%. With effect from 29 April 2017 as a result of change in tax regulations, tax is levied only on Sasol's share of profits and as a result any tax liability included in ORYX GTL's results is included at 100% in our equity-accounted share of ORXY GTL's financial results.
In Nigeria, Escravos GTL resumed operation after completion of the scheduled maintenance programme with both trains
61
running as expected. The plant is expected to ramp up towards design capacity during the year.
Results of operations 2016 compared to 2015
Total turnover decreased by 15% from R75 800 million in 2015 to R64 341 million in 2016, due to the sharp decline in oil prices.
Operating profit of R14 069 million decreased by R8 457 million or 38% compared to the prior year despite a 41% reduction in crude oil prices. Operating margins held firm at 22%, mainly as a result of record production volumes, higher liquid fuels sales through higher yielding marketing channels, the weaker rand/US dollar exchange rate and contributions from the BPEP and Response Plan initiatives.
Secunda Synfuels Operations increased production volumes of refined product by 1% to a record 7,8Mt. Natref Operations increased production volumes by 1% compared to the prior year. Sales volumes, however, remained flat on the back of challenging market and trading conditions experienced during the first half of the financial year, driven by lower demand for liquid fuels in Southern Africa, specifically in the agricultural, mining and manufacturing sectors.
Gas sales volumes were 1% higher compared to the prior year, mainly due to higher methane-rich gas sales to commercial customers. Our share of the Central Termica de Ressano Garcia (CTRG) joint operation in Mozambique delivered 653 089 megawatt-hours of electricity.
For further analysis of our results refer "Integrated Report—Operational reviews" as contained in Exhibit 99.7.
Base Chemicals
| |
2017 | 2016 | Change 2017/ 2016 |
2015 | Change 2016/ 2015 |
|||||||||||
|---|---|---|---|---|---|---|---|---|---|---|---|---|---|---|---|---|
| |
(Rand in millions) |
(%) |
(Rand in millions) |
(%) |
||||||||||||
External turnover |
35 135 | 33 696 | 4 | 36 838 | (9 | ) | ||||||||||
Inter-segment turnover |
620 | 1 371 | (55 | ) | 2 890 | (53 | ) | |||||||||
| | | | | | | | | | | | | | | | | |
Total turnover |
35 755 | 35 067 | 2 | 39 728 | (12 | ) | ||||||||||
Operating costs and expenses(1) |
(30 130 | ) | (30 581 | ) | (1 | ) | (29 520 | ) | 4 | |||||||
| | | | | | | | | | | | | | | | | |
Operating profit |
5 625 | 4 486 | 25 | 10 208 | (56 | ) | ||||||||||
| | | | | | | | | | | | | | | | | |
| | | | | | | | | | | | | | | | | |
| | | | | | | | | | | | | | | | | |
Operating margin % |
16 | 13 | 3 | 26 | ||||||||||||
- (1)
- Operating costs and expenses net of other income.
Results of operations 2017 compared to 2016
Total turnover increased by 2% from R35 067 million in 2016 to R35 755 million in 2017, due to a 3% increase in sales volumes mainly as a result of higher volumes from SSO and improved production due to the commissioning of the C3 Expansion Project in the prior year. The US dollar basket price of our commodity chemicals improved by 6% compared to the prior year, but this was negated by the stronger rand/US dollar exchange rate.
Operating profit of R5 625 million increased by R1 139 million or 25% and operating margin increased from 13% to 16%.
The increase in operating profit is largely attributable to the reversal of the previously recognised impairment of R849 million ($65 million), in 2017 on the low density polyethylene (LDPE) cash generating unit of the LCCP project in the US.
Other cost increases were contained well within inflation.
Results of operations 2016 compared to 2015
Total turnover decreased by 12% from R39 728 million in 2015 to R35 067 million in 2016.
Excluding the partial impairment of our low density polyethylene (LDPE) cash generating unit in the US of R956 million (US$65 million) and the R537 million impairment of our methyl isobutyl ketone (MIBK) business in Sasolburg, in 2016 Base Chemicals recorded an operating profit of R5 979 million.
62
The operating margin decreased from 26% in the prior year to 13%. Sales volumes were down by 8% as a result of a planned extended shutdown to enable commissioning activities associated with the C3 Expansion Project, subdued demand for explosives and fertilisers and a planned stock build. A 22% decrease in our basket of commodity chemical prices was partly negated by the weaker rand/US dollar exchange rate. In nominal terms, we reduced costs by 1,5% compared to the prior year.
For further analysis of our results refer "Integrated Report—Operational reviews" as contained in Exhibit 99.7.
Performance Chemicals
| |
2017 | 2016 | Change 2017/ 2016 |
2015 | Change 2016/ 2015 |
|||||||||||
|---|---|---|---|---|---|---|---|---|---|---|---|---|---|---|---|---|
| |
(Rand in millions) |
(%) |
(Rand in millions) |
(%) |
||||||||||||
External turnover |
67 806 | 71 254 | (5 | ) | 68 874 | 3 | ||||||||||
Inter-segment turnover |
2 080 | 2 380 | (13 | ) | 2 910 | (18 | ) | |||||||||
| | | | | | | | | | | | | | | | | |
Total turnover |
69 886 | 73 634 | (5 | ) | 71 784 | 3 | ||||||||||
Operating costs and expenses(1) |
(59 886 | ) | (62 358 | ) | (4 | ) | (59 070 | ) | 6 | |||||||
| | | | | | | | | | | | | | | | | |
Operating profit |
10 000 | 11 276 | (11 | ) | 12 714 | (11 | ) | |||||||||
| | | | | | | | | | | | | | | | | |
| | | | | | | | | | | | | | | | | |
| | | | | | | | | | | | | | | | | |
Operating margin % |
14 | 15 | (1 | ) | 18 | |||||||||||
- (1)
- Operating costs and expenses net of other income.
Results of operations 2017 compared to 2016
Turnover decreased by 5% from 73 634 million to R69 886 million. Operating profit of R10 000 million decreased by 11% compared to the prior year mainly as a result of significantly lower margins on ammonia due to lower market prices, the impact of a stronger rand and a partial impairment of R527 million (US$38,4 million) relating to our US Phenolics cash generating unit.
Sales volumes increased by 2% compared to the prior year mainly due to an increase of 2% in Organics volumes. Our FT Wax facility in South Africa continues to ramp up and produced 92kt of hard wax in 2017, which is in line with our forecast. These additional wax volumes were offset by lower volumes from our European wax facility due to reduced demand.
The European organics products benefitted from improved volumes and margins resulting
from favourable market conditions. Our US assets benefitted from higher ethylene sales prices during the first half of the financial year, but subsequently came under pressure as a result of reduced market prices. Other cost increases remained below inflation for the year.
Results of operations 2016 compared to 2015
Turnover increased by 3% from R71 874 million to R73 634 million. Operating profit of R11 276 million decreased by 11% compared to the prior year mainly as a result of the R2 021 million FT Wax Expansion Project (FTWEP) impairment reversal in the prior year.
Our operating margin reflects the full annual depreciation charge being recognised on FTWEP in 2016, while the project is still ramping up to full production. Excluding the impact of the impairment reversal in the prior year, operating profit increased by 5%. This increase is largely as a result of the weakening of the rand, coupled with resilience of the margins achieved by our European surfactants and alcohols businesses, negated by lower ethylene prices which negatively impacted the margins achieved by our assets in the US. Production volumes in our Eurasian Operations increased by 4%, while production volumes at our US Operations remained flat compared to the prior year.
Total sales volumes decreased marginally by 1% compared to the prior year, as a result of planned shutdowns at our ethylene plant in North America and our production facilities in Sasolburg and reduced demand for oilfield chemicals. The decrease in wax and ammonia sales volumes were compensated by an increase of 4% in organic sales volumes. Normalised sales volumes were up by 1,8%.
For further analysis of our results refer "Integrated Report—Operational reviews" as contained in Exhibit 99.7.
Disclosure pursuant to Section 219 of the Iran Threat Reduction and Syria Human Rights Act of 2012 and Section 13 (r) of the Exchange Act
To our knowledge, none of Sasol's activities, transactions or dealings is in violation with
63
applicable sanctions laws and regulations. Performance Chemicals sold chemicals to a distributor in Switzerland who shipped the product to a customer in Iran. The total revenue from the two transactions was R1,5 million (EUR 0,09 million) which generated a loss from this activity amounted to R0,4 million (EUR 0,03 million). Further deliveries may be made as part of global supply arrangements with customers who deliver product to their customers in various countries including Iran.
For more information refer to "Actual or alleged non-compliance with laws could result in criminal or civil sanctions and could harm our reputation—Sanction laws" under Item 3.D. "Risk Factors"
Significant accounting policies and estimates
The preparation of our consolidated financial statements requires management to make estimates and assumptions that affect the reported results of its operations. Some of our accounting policies require the application of significant judgements and estimates by management in selecting the appropriate assumptions for calculating financial estimates. By their nature, these judgements are subject to an inherent degree of uncertainty and are based on our historical experience, terms of existing contracts, management's view on trends in the industries in which we operate and information from outside sources and experts. Actual results may differ from those estimates. Management believes that the more significant judgement and estimates relating to the accounting policies used in the preparation of Sasol's consolidated financial statements could potentially impact the reporting of our financial results and future financial performance.
We evaluate our estimates, including those relating to environmental rehabilitation and decommissioning obligations, long-lived assets, trade receivables, inventories, investments, intangible assets, income taxes, share-based payment expenses, hedges and derivatives, pension and other post-retirement benefits and contingencies and litigation on an ongoing basis. We base our estimates on historical experience and on various other assumptions that we
believe to be reasonable under the circumstances, the results of which form the basis for making our judgements about carrying values of assets and liabilities that are not readily available from other sources.
In addition to the items below, "Item 18—Annual Financial statements" are incorporated by reference.
For accounting policies and areas of judgements relating to:
- •
- Valuation of share-based payments , refer "Item 18—Annual Financial statements"—Note 33 Cash settled
share appreciation rights and Note 34—Share-based payment reserve;
- •
- Impairments—refer "Item 18—Annual Financial statements—Note 8 Remeasurement items";
- •
- Long-term provisions—refer "Item 18—Annual Financial statements—Note 30 Long-term
provisions";
- •
- Post-retirement benefit obligations—refer "Item 18—Annual Financial statements—Note 32
Post-retirement benefit obligations";
- •
- Useful economic lives of assets and depreciation of coal mining assets—"Item 18—Annual Financial
statements—Note 16 Property, plant and equipment and Note 17 Assets under construction";
- •
- Estimation of coal reserves—refer "Item 18—Annual Financial statements—Note 17 Assets under
construction";
- •
- Recognition of deferred tax assets and utilisation of tax losses—refer "Item 18—Annual Financial statements—Note 13 Deferred tax and Note 12 Tax paid".
Estimation of natural oil and gas reserves
In accordance with the United States Securities and Exchange Commission (SEC) regulations, proved oil and gas reserves are those quantities of oil and gas which, by analysis of geoscience and engineering data, can be estimated with reasonable certainty to be economically producible—from a given date
64
forward, from known reservoirs under existing economic conditions, operating methods, and government regulations—prior to the time at which contracts providing the right to operate expire, unless evidence indicates that renewal is reasonably certain, regardless of whether deterministic or probabilistic methods are used for the estimation. The project to extract hydrocarbons must be approved and must have commenced or the operator must be reasonably certain that it will commence the project within a reasonable time. Existing economic conditions define prices and costs at which economic producibility is to be determined. The price is the average sales price during the 12-month period prior to the reporting date (30 June), determined as an un-weighted arithmetic average of the first-day-of-the-month price for each month within such period, unless prices are defined by contractual arrangements. Future price changes are limited to those provided by contractual arrangements in existence at year-end.
Our reported natural oil and gas reserves are estimated quantities based on SEC reporting regulations. Additionally, we require that the estimated quantities of oil and gas and related substances to be produced by a project be sanctioned by all internal and external parties to the extent necessary for the project to enter the execution phase and sufficient to allow the resultant products to be brought to market. See "Item 4.D Information on the company—Property, plants and equipment".
There are numerous uncertainties inherent in estimating quantities of reserves and in projecting future rates of production, including factors which are beyond our control. The accuracy of any reserve estimate is a function of the quality of available data, engineering and geological interpretation and judgement. Estimates of oil and gas reserves therefore are subject to future revision, upward or downward, resulting from new data and current interpretation, as well as a result of improved recovery, extensions and discoveries, the purchase or sale of assets, and production. Accordingly, financial and accounting measures (such as the standardised measure of future discounted cash flows, depreciation and
amortisation charges and environmental and decommissioning obligations) that are based on proved reserves are also subject to revision and change.
Refer to "Standardised measure of discounted future net cash flows", on page G-6 for our standardised discounted future net cash flow information in respect of proved reserves for the year ended 30 June 2017 and to "Changes in the standardised measure of discounted future net cash flows", on page G-7.
Depreciation of natural oil and gas assets
Depreciation of mineral assets on producing oil and gas properties and property acquisition costs is based on the units-of-production method, calculated using estimated proved developed reserves.
Fair value estimations of financial instruments
We base fair values of financial instruments on quoted market prices of identical instruments, where available. If quoted market prices are not available, fair value is determined based on other relevant factors, including dealers' price quotations and price quotations for similar instruments traded in different markets. Fair value for certain derivatives is based on pricing models that consider current market and contractual prices for the underlying financial instruments or commodities, as well as the time value and yield curve or fluctuation factors underlying the positions. Pricing models and their underlying assumptions impact the amount and timing of unrealised gains and losses recognised, and the use of different pricing models or assumptions could produce different financial results. Refer to "Item 11—Quantitative and qualitative disclosures about market risk".
5.B Liquidity and capital resources
Liquidity, cash flows and borrowings
Based on our funding plan, we believe that current cash on hand, funds from operations and existing borrowing facilities, will be sufficient to cover our working capital and debt service requirements in the year ahead. We finance our
65
capital expenditure from funds generated out of our business operations, existing borrowing facilities and, in some cases, additional borrowings to fund specific projects.
For information regarding our funding cash flows and liquidity, refer "Item 18—Annual Financial Statements—Note 15—Long-term debt" which includes an overview of our banking facilities and debt arrangements.
For information regarding the company's cash flow requirements refer to the "CFO Report—Our cash flow generation and utilisation" and "Managing our funding plan, debt profile and credit rating" as contained in Exhibit 99.3.
The following table provides a summary of our cash flows for each of the three years ended 30 June 2017, 2016 and 2015.
| |
2017 | 2016 | 2015 | |||||||
|---|---|---|---|---|---|---|---|---|---|---|
| |
|
(Rand in millions) |
||||||||
Net cash retained from operating activities |
28 480 | 33 935 | 40 936 | |||||||
Net cash used in investing activities |
(56 677 | ) | (71 034 | ) | (42 085 | ) | ||||
Net cash generated by financing activities |
8 547 | 29 178 | 13 065 | |||||||
| | | | | | | | | | | |
Cash flows retained from operating activities include the following significant items:
| |
2017 | 2016 | 2015 | |||||||
|---|---|---|---|---|---|---|---|---|---|---|
| |
|
(Rand in millions) |
||||||||
Cash generated by operating activities |
44 069 | 54 673 | 61 783 | |||||||
Income tax paid |
(6 352 | ) | (9 329 | ) | (10 057 | ) | ||||
Dividends paid |
(8 628 | ) | (10 680 | ) | (12 739 | ) | ||||
| | | | | | | | | | | |
The cash generated by our operating activities is applied first to fund our operations, pay our debt and tax commitments and then to provide a return in the form of a dividend to our shareholders. The net cash retained is then invested based on our updated capital allocation framework which is aimed at driving maximum shareholder return.
Operating activities
Cash generated by operating activities in 2017 decreased by 19% to R44 069 million,
largely attributable to purchases of crude oil options of $103 million (approximately R1,4 billion) necessary as part of our risk mitigation strategy, increases in working capital as well as a stronger rand (exchange rate of R13,06/US$ compared to R14,71/US$ at 30 June 2016).
Cash generated by operating activities in 2016 decreased by 12% to R54 673 million mainly as a result of a decrease in turnover due to lower oil prices (average dated Brent was 41% lower at $43/bbl for the year ended 30 June 2016 compared with US$73/bbl in the prior year).
In 2015, cash generated by operating activities decreased by 6% to R61 783 million from R65 449 million in 2014. This movement was also due to a 33% lower oil price in 2015 which impacted on turnover.
For further information regarding our cash flow generation, refer "CFO Report—Our cash flow generation and utilisation" as contained in Exhibit 99.3.
Investing activities
Net cash used in investing activities decreased to R56 677 million in 2017 as compared to R71 034 million in 2016. Net cash used in investing activities in 2016 increased from R42 085 million in 2015.
In 2017, included in additions to non-current assets is R36,8 billion (US$2,7 billion) relating to the construction of the LCCP. This is as compared to R42,4 billion (US$2,9 billion) in 2016. This decrease is largely as a result of the strengthening of the rand against the US dollar, re-phasing of the LCCP capital cash flow and active management of the capital portfolio .
Included in investing activities in 2017 are the proceeds from the sale of the Dongguan packaging facility (R89 million) as well as the partial sale of the Canadian land (R389 million).
Included in investing activities in 2016 is the settlement of our funding commitment on the Canadian shale gas asset of R4,4 billion (CAD380 million).
66
Cash flows utilised in investing activities include the following significant items:
| |
2017 | 2016 | 2015 | |||||||
|---|---|---|---|---|---|---|---|---|---|---|
| |
|
(Rand in millions) |
||||||||
Additions to non-current assets(1) |
(56 812 | ) | (70 497) | (2) | (42 645 | ) | ||||
Proceeds on disposals |
788 | 569 | 1 210 | |||||||
- (1)
- Includes
additions to property, plant and equipment; assets under construction and other intangible assets.
- (2)
- In 2016, additions include R4 160 million in respect of an agreement concluded with our Canadian shale gas partner, Progress Energy, to settle the outstanding funding commitment. R3 339 million was settled in 2016, with the remaining CAD75 million (R821 million) due in July 2018.
For information regarding cash flows from investing activities refer "CFO Report—"Managing our funding plan, debt profile and credit rating" as contained in Exhibit 99.3.
For information regarding cash flows from additions and disposals, refer "Item 18—Annual Financial Statements—Note 16 and Note 9".
For details of our additions to non-current assets, and the projects to which these relate, refer to "Note 17—Assets under construction".
For details of our capital commitments refer to "Note 16—Property, plant and equipment".
Financing activities
The group's operations are financed primarily by means of its operating cash flows. Cash shortfalls are usually short-term in nature and are met primarily from short-term banking facilities. Our long-term capital expansion projects are financed by a combination of floating and fixed rate long-term debt, as well as internally generated funds. This debt is normally financed in the same currency as the underlying project and the repayment terms are designed to match the cash flows expected from that project.
For information regarding our debt and funding structure, refer "CFO Report—Managing our funding plan, debt profile and credit rating" as contained in Exhibit 99.3.
Capital resources
Sasol Financing (Pty) Ltd and Sasol Financing International Limited act as our group's financing vehicles. All our group treasury, cash management and borrowing activities are facilitated through Sasol Financing (Pty) Ltd and Sasol Financing International Limited. The group executive committee (GEC) and senior management meet regularly, to review and, if appropriate, approve the implementation of optimal strategies for the effective management of the group's financial risk.
Our cash requirements for working capital, share repurchases, capital expenditures, debt service and acquisitions over the past three years have been primarily financed through a combination of funds generated from operations and borrowings. In our opinion, our working capital is sufficient for present requirements.
Our debt as at 30 June comprises the following:
| |
2017 | 2016 | 2015 | |||||||
|---|---|---|---|---|---|---|---|---|---|---|
| |
(Rand in millions) |
|||||||||
Long-term debt, including current portion |
81 405 | 79 877 | 42 066 | |||||||
Short-term debt |
2 625 | 138 | 534 | |||||||
Bank overdraft |
123 | 136 | 319 | |||||||
| | | | | | | | | | | |
Total debt |
84 153 | 80 151 | 42 919 | |||||||
Less cash (excluding cash restricted for use) |
(27 643 | ) | (49 985 | ) | (48 329 | ) | ||||
| | | | | | | | | | | |
Net debt/(cash) |
56 510 | 30 166 | (5 410 | ) | ||||||
| | | | | | | | | | | |
As at 30 June 2017, we had R1 803 million (2016—R2 331 million) in cash restricted for use. Refer to "Item 18—Financial Statements—Note 26" for a breakdown of amounts included in cash restricted for use.
The group has borrowing facilities with major financial institutions of R136 143 million (2016—R132 448 million; 2015—R113 732 million). Of these facilities, R84 153 million (2016—R80 151 million; 2015—R42 919 million) has been utilised at year end. Refer to "Item 18—Annual Financial Statements—Note 15 Long-term debt", for a breakdown of our banking facilities and the utilisation thereof.
67
There were no events of default for the years ended 30 June 2017 and 30 June 2016.
Included in the abovementioned borrowing facilities is our commercial paper programme of R8 billion, normally at fixed interest rates. There were no amounts outstanding under the commercial paper programme at 30 June 2017. Further, a revolving credit facility of US$1,5 billion is available to the group for further funding requirements. Centralised treasury facilities of R22,7 billion (US$1,6 billion and EUR170 million) were drawn during 2017.
Financial instruments and risk
Refer to "Item 11—Quantitative and qualitative disclosures about market risk" for a breakdown of our liabilities summarised by fixed and floating interest rates.
Debt profile and covenants
The information set forth under "Item 18—"Annual Financial Statements—Note 15—Long-term debt" is incorporated by reference.
Capital commitments
Refer "Item 18—"Annual Financial Statements—Note 16—Property, plant and equipment".
Our growth aspirations have been prioritised as we steadily advance our growth strategy, particularly in Southern Africa and North America. Capital investments in these regions will constitute a significant portion of our total capital expenditure over the next 10 years. We have sufficient headroom in our balance sheet to fund selective growth opportunities, pay dividends and provide a buffer against volatilities. Given that a large portion of our funding for our capital intensive growth plan will come from the offshore debt markets, we are acutely aware that we need to manage our gearing within our long-term targeted range. We expect that our gearing is likely to reach our internal gearing ceiling of 20% - 44% in the near term.
In the US, we are constructing the US$11 billion LCCP, which consists of a world-scale 1,5 million ton per year ethane cracker,
and six downstream chemical projects. At 30 June 2017, the capital expenditure to date is $7,5 billion, and the overall project completion is around 74%. We have project specific finance facilities in place to fund the LCCP. For further detail on the funding of the LCCP, refer "Item 18—Annual Financial Statements—Note 15—Long-term debt". This US$11 billion estimate includes a contingency, which measured against industry norms for this stage of project completion, is considered sufficient to effectively take the project to beneficial operation within the revised cost estimate.
The first units of the LCCP are expected to reach beneficial operation in the second half of the 2018 calendar year.
During 2016, the LDPE cash generating unit was impaired by R956 million (US$65 million), largely as a result of the increased capital cost and lower margins. This impairment was fully reversed at 30 June 2017, based on a reduction in the spot WACC rate applicable to the US, the extension of the useful life to 50 years based on more detailed engineering analysis performed, and the completion of the project cost and schedule evaluation.
Various savings opportunities have been identified and are continuously being implemented to mitigate project risks. Although unplanned event-driven risks may stil impact the execution and cost of the project, we are confident that the remaining construction, procurement, execution and business readiness risks can be managed within the revised cost estimate of US$11 billion.
We continue to monitor the economics of the project against the backdrop of a challenging macro-economic environment. We rely extensively on the views of independent market consultants in formulating our views on our long-term assumptions. Their views differ significantly- from period to period, which again is indicative of the volatility in the market. For these reasons, the IRR for the LCCP, based on these different sets of price assumptions, varies between a range of returns which is both higher and lower than our weighted average cost of capital. At spot market prices, using the last
68
quarter of 2017 as a reference, the IRR is between 8% to 8,5%. We are of the view that limited structural changes have occurred to market fundamentals since February 2017, when we last published the expected long-term IRR of the project, hence, based on our internal assessment, we are of the view that the IRR is in a range of 7% to 8% (Sasol WACC at 8% in US$ terms) based on conservative ethane prices. The cracker, however, remains cost competitive and is at the lower end of the cost curve for ethylene producers. We will continue to focus on factors that we can control, which are progressing the cost and schedule of the project according to plan.
In Mozambique, the field development plan (FDP) for the Production Sharing Agreement (PSA) licence was approved by regulatory authorities. The PSA FDP proposes an integrated oil, Liquefied Petroleum Gas (LPG) and gas-to-power project adjacent to the Petroleum Production Agreement (PPA) area. The development of these projects is a capital-intensive process carried out over long durations and requires us to commit significant capital expenditure. The total project cost for tranche one of the first phase of the PSA licence area and the fifth train is estimated at US$1,4 billion. The project is in its early stages of execution with the drill rig proceeding with the 13 well drilling programme.
For information on amounts capitalised in respect of these projects refer, "Item 18—Annual Financial Statements—Note 16—Property, plant and equipment" and "Note 17—Assets under construction".
For information on future amounts expected to be spent to complete the projects, refer "Item 18—Annual Financial Statements—Note 17—Assets under construction".
5.C Research and development, patents and licences
Refer to the "Item 4.B—Intellectual Capital" for further information research and development, patents and licences.
During 2017, R1 077 million was spent on research and development activities (2016—R1 105 million; 2015—R1 645 million).
5.D Trend information
Refer to the "CFO Report—Market overview" and "Key risks impacting our financial performance" as contained in Exhibit 99.3.
5.E Off-balance sheet arrangements
We do not engage in off-balance sheet financing activities and do not have any off-balance sheet debt obligations, off-balance sheet structured entities or unconsolidated affiliates.
Guarantees
As at 30 June 2017, the group recognised amounts in respect of certain guarantees. Refer to "Item 18—Annual Financial Statements, "Note 15 Long-term debt" and "Note 17 Assets under construction" for further information on guarantees.
Product warranties
The group provides product warranties with respect to certain products sold to customers in the ordinary course of business. These warranties typically provide that products sold will conform to specifications. The group accrues a warranty liability on a transaction-specific basis depending on the individual facts and circumstances related to each sale. Both the liability and expense related to product warranties are immaterial to the consolidated financial statements.
69
5.F Tabular disclosure of contractual obligations
Contractual obligations/commitments. The following significant undiscounted contractual obligations existed at 30 June 2017:
Contractual obligations
|
Total amount |
Within 1 year |
1 to 5 years |
More than 5 years |
|||||||||
|---|---|---|---|---|---|---|---|---|---|---|---|---|---|
| |
(Rand in millions) |
||||||||||||
Bank overdraft |
123 | 123 | |||||||||||
Capital commitments |
90 736 | 59 236 | 31 500 | ||||||||||
Environmental and other obligations |
102 729 | 11 657 | 22 954 | 68 118 | |||||||||
External long-term debt |
94 044 | 9 783 | 68 332 | 15 929 | |||||||||
External short-term debt |
2 625 | 2 625 | |||||||||||
Finance leases |
3 781 | 278 | 1 195 | 2 308 | |||||||||
Operating leases |
21 373 | 1 460 | 4 786 | 15 127 | |||||||||
Post-retirement healthcare obligations(1) |
4 163 | 179 | 911 | 3 073 | |||||||||
Post-retirement pension obligations(1) |
7 260 | 176 | 740 | 6 344 | |||||||||
Purchase commitments(2) |
45 642 | 19 668 | 24 557 | 1 417 | |||||||||
Share-based payments |
883 | 883 | |||||||||||
| | | | | | | | | | | | | | |
Total |
373 358 | 106 068 | 154 975 | 112 315 | |||||||||
| | | | | | | | | | | | | | |
| | | | | | | | | | | | | | |
| | | | | | | | | | | | | | |
- (1)
- Represents
discounted values
- (2)
- Includes off-take agreements entered into in the ordinary course of business, the most significant of which relate to LCCP (R17 639 million, US$1 351 million undiscounted) and ORYX GTL for a contracted minimum off-take gas volume.
Refer to "Item 18—Annual Financial statements"—Note 16 Property, plant and equipment for significant capital commitments and Note 30 Long-term provisions of for environmental and other obligations.
ITEM 6. DIRECTORS, SENIOR MANAGEMENT AND EMPLOYEES
6.A Directors and senior management
The board of directors and senior management
- •
- For information regarding our directors, refer to "Our board of directors and senior management" as contained in Exhibit 99.8.
Senior management—experience
We have identified our senior management as the members of our group executive committee (GEC). See "Our board of directors and senior management" as contained in
Exhibit 99.8 for experience of our executive directors who are members of the GEC.
Family relationship
There are no family relationships between any of our non-executive directors, executive directors or members of our group executive committee.
Other arrangements
None of our non-executive directors, executive directors or group executive committee members or other key management personnel are elected or appointed under any arrangement or understanding with any major shareholder, customer, supplier or otherwise.
6.B Compensation
Refer to our Remuneration Report filed as Exhibit 99.2 for details of our directors and senior management compensation.
Long-term incentive schemes applicable to executive directors and senior management
For details regarding our long-term incentive schemes applicable to executive directors and senior management named in Item 6.A. Refer to our Remuneration Report filed as Exhibit 99.2.
6.C Board practices
Refer to "Item 6.A—Directors and senior management" for our board of directors and information with respect to their terms of office. Refer to our Remuneration Report filed as Exhibit 99.2 for details of our directors' and senior management service contracts and benefits upon termination of employment.
Refer to "Integrated Report—Our governance framework" as contained in Exhibit 99.9 for details relating to our audit- and remuneration committees, as well as the names of committee members; and refer to the "Terms of Reference—Audit Committee and Remuneration Committee" as contained in Exhibit 99.9.2 for summaries of the terms of reference under which the committees operate.
70
6.D Employees
The information set forth under "Item 18—Annual Financial Statements—Note 3—Employee-related expenditure" is incorporated by reference.
Remuneration of directors and key personnel is contained in the Remuneration Report, contained in Exhibit 99.2.
For information regarding the employees per segment, refer to "Item 18—Annual Financial Statements—Note 3—Employee-related expenditure". Our workforce geographic location composition at 30 June is presented below:
Region
|
2017 | 2016 | 2015 | |||||||
|---|---|---|---|---|---|---|---|---|---|---|
| |
Number of employees |
|||||||||
South Africa |
26 058 | 25 394 | 26 138 | |||||||
Europe |
2 728 | 2 721 | 2 780 | |||||||
North America |
1 430 | 1 289 | 1 209 | |||||||
Other |
684 | 696 | 792 | |||||||
| | | | | | | | | | | |
Total |
30 900 | 30 100 | 30 919 | |||||||
| | | | | | | | | | | |
| | | | | | | | | | | |
| | | | | | | | | | | |
6.E. Share ownership
Refer to our Remuneration Report filed as Exhibit 99.2 for details of share ownership applicable to executive directors and senior management.
ITEM 7. MAJOR SHAREHOLDERS AND RELATED PARTY TRANSACTIONS
7.A Major shareholders
Refer to "Item 18—Annual Financial Statements—Note 14—Equity" for the authorised and issued share capital of Sasol Limited.
To the best of our knowledge, Sasol Limited is not directly or indirectly owned or controlled by another corporation or the government of South Africa or any other government. We believe that no single person or entity holds a controlling interest in our securities.
In accordance with the requirements of the Companies Act of South Africa (Companies Act), the following beneficial shareholdings equal to or exceeding 5% of the total issued securities during the last three years were
disclosed or established from inquiries as of 30 June 2017:
| |
2017 | 2016 | 2015 | ||||||||||||||||
|---|---|---|---|---|---|---|---|---|---|---|---|---|---|---|---|---|---|---|---|
| |
Number of shares |
% of shares |
Number of shares |
% of shares |
Number of shares |
% of shares |
|||||||||||||
GEPF(1)(2) |
85 275 320 | 13,1 | 84 121 005 | 12,9 | 92 425 614 | 13,6 | |||||||||||||
IDC(3) |
53 266 887 | 8,2 | 53 266 887 | 8,2 | 53 266 887 | 7,8 | |||||||||||||
AGPL(4) |
40 366 150 | 6,2 | * | * | |||||||||||||||
- (1)
- Government
Employees Pension Fund (GEPF)
- (2)
- PIC
Equities manages 67,6 million of the shares owned by GEPF.
- (3)
- Industrial
Development Corporation of South Africa (IDC)
- (4)
- Allan
Gray Proprietary Limited (AGPL)
- *
- Not considered a major shareholder in this year
The voting rights of major shareholders do not differ from the voting rights of other shareholders.
As of 31 July 2017, 19 692 729 million Sasol ordinary shares, or approximately 3% of our total issued securities, were held in the form of American Depositary Receipts (ADRs). As of 31 July 2017, 391 record holders in the United States held approximately 18,73% of our total issued securities in the form of either Sasol ordinary shares or ADRs.
7.B Related party transactions
There have been no material transactions during the most recent three years, other than as described below, nor are there proposed to be any material transactions at present to which we or any of our subsidiaries are or were a party and in which any senior executive or director, or 10% shareholder, or any relative or spouse thereof or any relative of such spouse, who shared a home with this person, or who is a director or executive officer of any parent or subsidiary of ours, had or is to have a direct or indirect material interest. Furthermore, during our three most recent years, there has been no, and at 30 June 2017 there was no, outstanding indebtedness to us or any of our subsidiaries owed by any of our executive or independent directors or any associate thereof.
During the year, group companies, in the ordinary course of business, entered into various purchases and sale transactions with associates, joint ventures and certain other related parties. The effect of these transactions is included in the financial performance and results of the
71
group. Terms and conditions are determined on an arm's length basis.
Amounts due to and from related parties are disclosed in the respective notes to the financial statements for the respective statement of financial position line items. Refer to "Item 18—Annual Financial Statements—Note 37—Related party transactions" for further details.
7.C Interests of experts and counsel
Not applicable.
8.A Consolidated statements and other financial information
Refer "Item—18. Annual Financial Statements" for our financial statements, related notes and other financial information.
Dividend policy
Our previous dividend distribution policy was a progressive dividend policy. In February 2015 the Sasol Limited Board approved a change in the company's dividend policy, which is based on a dividend cover range. The Company's dividend policy takes into consideration various factors, including overall market and economic conditions, the Group's financial position, capital investment plans as well as earnings growth.
Headline earnings per share will serve as the basis for deciding on the dividend amount. The prevailing circumstances of the company, future investment plans, financial performance and the trading and macro-economic environments will be considered when we make decisions on dividends. The average rate of earnings to dividend distributions in the past five years was approximately 2,3 times. Our dividend cover for 2016 and 2017 was 2,8 times. We distribute dividends twice a year.
Refer to "Item 10.B—Memorandum and articles of association—Rights and privileges of holders of our securities".
Legal proceedings
For information regarding our legal proceedings refer to "Item 4.B—Business
overview—Legal proceedings and other contingencies".
8.B Significant changes
Refer to "Item 18—Annual Financial statements—Note 38 Subsequent events".
9.A Offer and listing details
The following table sets forth, for the years indicated, the reported high and low quoted prices for the ordinary shares on the Johannesburg Stock Exchange (JSE) and for our American Depositary Receipts (ADRs) on the New York Stock Exchange.
| |
Shares (Price per share in rand) |
ADRs (Price per ADR in US$) |
|||||||||||
|---|---|---|---|---|---|---|---|---|---|---|---|---|---|
Period
|
High | Low | High | Low | |||||||||
2013 |
452,96 | 336,00 | 47,92 | 39,94 | |||||||||
2014 |
645,10 | 420,00 | 60,21 | 41,65 | |||||||||
2015 |
642,72 | 392,78 | 60,80 | 31,66 | |||||||||
2016 |
|||||||||||||
First quarter |
447,89 | 375,25 | 36,57 | 26,97 | |||||||||
Second quarter |
465,69 | 358,79 | 34,31 | 24,55 | |||||||||
Third quarter |
492,50 | 360,70 | 31,62 | 21,88 | |||||||||
Fourth quarter |
487,00 | 390,10 | 32,96 | 25,29 | |||||||||
2017 |
|||||||||||||
First quarter |
402,44 | 358,71 | 28,48 | 25,15 | |||||||||
Second quarter |
410,11 | 358,00 | 29,76 | 25,12 | |||||||||
Third quarter |
430,95 | 357,00 | 32,20 | 27,31 | |||||||||
Fourth quarter |
416,33 | 359,99 | 31,55 | 27,14 | |||||||||
April |
416,16 | 396,79 | 31,03 | 29,21 | |||||||||
May |
416,33 | 392,10 | 31,55 | 29,69 | |||||||||
June |
386,55 | 359,99 | 30,05 | 27,14 | |||||||||
July |
398,71 | 366,98 | 30,35 | 27,36 | |||||||||
August (up to 24 August 2017) |
410,00 | 390,00 | 30,55 | 29,55 | |||||||||
9.B Plan of distribution
Not applicable.
9.C Markets
The principal trading market for our shares is currently the JSE. Our American Depositary Shares (ADS) have been listed on the New York Stock Exchange since 9 April 2003, each representing one common ordinary share of no par value, under the symbol "SSL". The Bank of New York Mellon is acting as the Depositary for our ADSs and issues our ADRs in respect of our ADSs.
72
9.D Selling shareholders
Not applicable.
9.E Dilution
Not applicable.
9.F Expenses of the issue
Not applicable.
ITEM 10. ADDITIONAL INFORMATION
10.A Share capital
Not applicable.
10.B Memorandum and articles of association
1. Registration number, and object and purpose of the Company
Refer to "Item 10.B" of our registration statement pursuant to section 12(b) or 12(g) of the Securities Exchange Act of 1934, filed with the Securities and Exchange Commission on 6 March 2003 (the Registration Statement) for the registration number and object and purpose of the Company.
2. Our board of directors
Appointment, retirement and re-election of directors. Our directors are elected by our shareholders at the annual general meeting. The directors shall, within the minimum and maximum limits stipulated in the Memorandum of Incorporation (MOI), determine the number of directors from time to time. If so approved by the board, directors may also appoint alternate directors in their stead.
Retiring non-executive Directors may be re-elected, provided they are eligible. There is no age restriction and directors are allowed to serve irrespective of their age. The directors who retire every year shall be the longest serving since their last election. As between directors of equal seniority, the directors to retire, in the absence of agreement, will be selected from among them in alphabetical order. For more details regarding the rotation of directors, see information provided in our Registration Statement.
If at the date of the annual general meeting a non-executive director has held office for a period of five years since his last election, which election took place prior to 25 November 2016, or if he has held office for a period of 9 (nine) years since his first election, which election took place on or after 25 November 2016, he shall retire at such meeting, if not included as one of the directors to retire by rotation. The Board may nominate a director who served for 9 (nine) years for re-election for additional periods of one year at a time, but no such director's term of office shall exceed 12 (twelve) years.
Power to vote in respect of matters in which a director has a material interest. In terms of our MOI and the Companies Act, a director who has a personal financial interest in respect of a matter to be considered at a meeting, or knows that a related person has a personal financial interest in the matter, may not vote on the matter. In terms of our board charter, directors are appointed on the express understanding and agreement that they may be removed by the board if and when they develop an actual or prospective material, enduring conflict of interest with Sasol or a group company.
Power to vote on remuneration. A distinction is drawn between remuneration of directors as employees (executive directors) of the company and remuneration of directors for their services as directors. With regard to remuneration of directors for their services as directors and in accordance with the Companies Act, our MOI requires shareholder approval by way of a special resolution obtained in the previous two years for the payment of remuneration to directors for their service as directors, and the basis of payment thereof.
The remuneration of executive directors is determined by a disinterested quorum of directors on recommendation of the remuneration committee determined in accordance with the group's remuneration policy put to shareholders for a non-binding advisory vote at the annual general meeting as required by the King IV Report on Corporate Governance for South Africa 2016 (King IV). King IV now further requires that the remuneration implementation report also be put
73
to shareholders for a non-binding advisory vote. No powers are conferred by our MOI, or by any other means, on the directors who are employees of the company, to vote on their own remuneration in the absence of a disinterested quorum of directors.
Borrowing powers exercisable by directors. Clause 26.2 of our MOI provides that the directors may borrow money and secure the payment or repayment thereof upon terms and conditions which they may deem fit in all respects and, in particular, through the issue of debentures which bind as security all or any part of the property of the Company, both current and future.
For information regarding the qualification shares to be held by directors, see information provided in our Registration Statement.
3. Rights and privileges of holders of our securities
Classes of shares. We have three classes of shares in issue, namely:
- •
- Ordinary Shares;
- •
- Preferred Ordinary Shares; and
- •
- Sasol BEE Ordinary Shares,
which have the rights and privileges more fully set out in our MOI and which are briefly described herein.
- •
- Ordinary Shares: In terms of our MOI, the company may make distributions as defined in the Companies Act, save however that no dividend may be declared and paid unless the company has first declared and paid in full the dividends due to the holders of the Preferred Ordinary Shares, the details of which are set out more fully below. If a dividend is declared by the board, only then does a shareholder have a right to receive a dividend which may be enforced against the company.
Dividend rights attaching to the various classes of shares
For more information regarding the payment of dividends on Ordinary Shares and to
Holders of American Depositary Receipts (ADRs), refer to our Registration Statement.
- •
- Sasol BEE Ordinary Shares: The Sasol BEE Ordinary Shares rank pari passu with Sasol Ordinary Shares
as regards to dividends.
- •
- Preferred Ordinary Shares carry a cumulative preferred ordinary dividend right for a period of ten years from the date of issue. These preferred dividend rights rank ahead of the dividend rights of the holders of any other shares in the company, including the Sasol BEE ordinary shares (but excluding any preference shares). The holders thereof have the right to receive and be paid a preferred ordinary dividend of R30,80 per annum until 30 June 2018.
Any payments made to holders of Sasol preferred ordinary shares must be made without deduction, set-off or withholding.
In terms of our MOI, no dividend may be paid unless it reasonably appears that the company will satisfy the solvency and liquidity test as defined in the Companies Act immediately after completing the proposed distribution; and the board, by resolution, has acknowledged that it has applied the solvency and liquidity test and has reasonably concluded that the company's assets equal or exceed the liabilities of the company and that the company will be able to pay its debts as they become due in the ordinary course of business for a period of 12 months following the payment of the dividend.
For further information on our dividend policy, see "Item 8.A—Consolidated statements and other financial information and our Registration Statement".
Voting rights. The Sasol BEE Ordinary Shares and the Preferred Ordinary Shares rank pari passu with Ordinary Shares in relation to the right to vote at shareholders' meetings of the company.
If the rights of any class of shareholders will be affected, then provision is made in the Companies Act for a separate class meeting. For
74
more details regarding shareholders voting rights, see information provided in our Registration Statement.
Right to share in profits. This is not relevant under South African law. In terms of South African law, dividends are declared subject to the directors being satisfied as to the solvency and liquidity of a company.
Rights to surplus in the event of liquidation.
On the winding up of the company all dividends that should have been declared and paid to the holders of Preferred Ordinary Shares at that point in time will automatically be declared and paid in priority to shareholders of any other class of shares other than preference shares. Thereafter, each Preferred Ordinary Share shall participate pari passu with each Ordinary Share in the remaining assets of the company and the assets remaining after payment of the debts and liabilities of the company, the costs of liquidation and the payment of all dividends that should have been declared and paid to the holders of Preferred Ordinary Shares, as set out above, shall be distributed among the shareholders in proportion to the number of shares respectively held by each of them.
Redemption provision:. There are no redemption provisions relating to the Ordinary Shares and the Sasol BEE Ordinary Shares.
The restrictions on and entitlements in relation to the Preferred Ordinary Shares will lapse on the earlier of the tenth anniversary of the date of issue of the first Preferred Ordinary Shares or on the date of receipt by the company of a notice that a redemption event has occurred, in accordance with the terms of various agreements entered into by inter alia Sasol and the company Sasol Inzalo Groups Funding (Pty) Ltd (RF), and the company Sasol Inzalo Public Funding (Pty) Ltd (RF), (the redesignation date). On the redesignation date, the Preferred Ordinary Shares will be redesignated as Sasol ordinary shares and will rank pari passu in all respects with the Ordinary Shares.
Sinking funds. There are no sinking funds.
Liability for further capital calls. Under the previous Companies Act of South Africa, shares could only be issued if they were fully paid. Accordingly, no shares were issued which were subject to any capital calls. Under the latest Companies Act of South Africa however, partly paid shares may be issued under certain circumstances. The company has not yet made use of these provisions.
Discriminatory provisions against majority shareholders. There are no discriminatory provisions in our MOI against any holder of securities as a result of such holder owning a substantial number of shares in the company.
4. Changing rights of holders of securities
In terms of our MOI, we may only by way of special resolution amend the rights attached to any shares or convert any of our shares (whether issued or not) into shares of another class. A special resolution is also required for the company to convert shares into stock and to reconvert stock into shares. If the rights of any class of shareholders will be affected, then provision is made in the Companies Act for a separate class meeting of the holders of such shares. In addition to the above, shareholders have appraisal rights under the Companies Act, and accordingly, if we amend our MOI by altering the preferences, rights, limitations or other terms of any class of our shares in a manner that is materially adverse to the rights or interests of holders of that class of shares, every holder of that class of shares that was present at the meeting at which the resolution to amend our MOI was passed and voted against such resolution, will be entitled, on notice to the company to seek court relief upon establishing that they have been unfairly prejudiced by the company. For a special resolution to be approved by shareholders, it must be supported by at least 75% of the voting rights exercised on the resolution.
5. General meeting of shareholders
In terms of the Companies Act, the board or any other person specified in the company's MOI, including a shareholder/s holding not less than 10% (ten per cent) of the voting rights
75
attached to the shares, may call a shareholders' meeting at any time. A written and signed demand to convene a shareholders meeting must describe the specific purpose for which the meeting is proposed.
If a company is unable to convene a meeting because it has no directors, then in terms of our MOI, any single shareholder entitled to vote may convene a meeting.
If the company fails to convene a meeting in accordance with its MOI, or as required by the shareholders holding in the aggregate at least 10% of the voting rights as set out above, or within the time periods as required, any shareholder may apply to court for an order to convene a shareholders' meeting on a date and subject to such terms as a court considers appropriate.
Notices. In terms of our MOI we are required to deliver written notice of shareholders' meetings to each shareholder and each beneficial shareholder at least 15 business days before a meeting. The Companies Act also stipulates that delivery of a notice will be deemed to have taken place on the seventh calendar day following the day on which the notice was posted by way of registered post.
Attendance at meetings. Before a person will be allowed to attend or participate at shareholder meetings, that person must present reasonably satisfactory identification and the person presiding at the meeting must reasonably satisfy himself that the right of the person to attend as shareholder or proxy has been reasonably verified. Meetings of shareholders may be attended by any person who holds shares in the company and whose name has been entered into our securities register and includes any person who is entitled to exercise any voting rights in relation to the company. Any person entitled to attend and to vote at any meeting may appoint a proxy/ies in writing to attend and to vote at such meeting on his/her/its behalf. In respect of shares which are not subject to the rules of a central securities depository, and in respect of which a person holds a beneficial interest which includes the right to vote on a matter, that beneficial holder may attend and vote on a matter at a meeting of shareholders,
but only if that person's name has been entered in our register of disclosures as the holder of that beneficial interest. Beneficial shareholders whose shares are not registered in their own name or (in the case of certificated shares in the company's register of disclosure), or beneficial owners who have dematerialised their shares, are required to contact the registered shareholder or their Central Securities Depository Participant, as the case may be, for assistance to attend and vote at meetings.
Quorum. In terms of our MOI, the quorum necessary for the commencement of a shareholders meeting shall be sufficient persons present at the meeting to exercise, in aggregate, at least 25% of all the voting rights that are entitled to be exercised in respect of at least one matter to be decided at the shareholders meeting but the shareholders' meeting may not begin unless at least three persons entitled to vote are present. In terms of our MOI, if the required quorum of shareholders is not present within 30 minutes from the time appointed for the meeting to begin, the meeting will be postponed to the next business day and if at such adjourned shareholders' meeting a quorum is not present within 15 minutes from the time appointed for the shareholders' meeting, then the persons entitled to vote present shall be deemed to be the requisite quorum. In terms of the Companies Act, no further notice is required of a postponed or adjourned meeting unless the location is different from that of the postponed or adjourned meeting, or is different from a location announced at the time of an adjourned meeting.
See our Registration Statement for more information with respect to the holding of an annual general meeting and the proceedings at the annual general meeting.
6. Rights of non-South African shareholders
The only limitation imposed is that Sasol BEE ordinary shares may only be owned by persons who meet certain broad-based black economic empowerment credentials. In order to meet such credentials such person must, inter alia, be a South African citizen. See our Registration Statement for more information
76
with respect to the rights of non-South African shareholders.
7. Provisions that would have the effect of delaying a change of control or merger
The Companies Act and the regulations to the Companies Act deal extensively with the requirements that must be met by a company with respect to a merger, an acquisition or a corporate restructure.
8. Disclosure of ownership threshold
Pursuant to section 122(1)(a) and (b) of the Companies Act, a person must notify the company within three business days after acquiring or disposing of a beneficial interest in sufficient securities of a class issued by that company such that, as a result of the acquisition or disposal, the person holds or no longer holds as the case may be, a beneficial interest in securities amounting to any multiple of 5% of the issued securities of that class. The Takeover Regulation Panel has interpreted this to mean an acquisition or disposal of shares in any 5% increment.
The JSE Listings Requirements require a listed company to disclose in its annual financial statements the interest of any shareholder, other than a director, who, insofar as it is known to the company, is directly or indirectly beneficially interested in 5% or more of any class of the company's capital.
9. Effect of the law
With respect to items 2 through 8 above, the effect of the law applicable to our company and where required, is explained.
10. Changes in share capital
In terms of the Companies Act, the board may (save to the extent that a company's MOI provides otherwise), increase or decrease the number of authorised shares in any class of shares. In addition, the board may (save to the extent that the company's MOI provides otherwise), classify any unclassified shares, or determine any preference rights, limitations or other terms in respect of a class of shares which
have been provided for in a company's MOI and for which the board is required to determine the associated preference rights, limitations or other terms of shares.
In terms of our MOI and the JSE Listings Requirements, we are required to obtain the consent of shareholders, by special resolution, to increase the number of authorised shares in the share capital of the company, or to consolidate or to subdivide all or any shares or to amend the rights and privileges of any class of shares.
Issued shares placed under the control of directors. See section 4 above.
Unissued shares placed under the control of directors. The Companies Act generally allows the board to issue authorised shares without shareholder approval. However, in terms of our MOI, and subject to the JSE Listings Requirements, the company may, in a shareholders' meeting, place the balance of the ordinary shares not allotted under the control of the directors with general authorisation to allot, and issue such shares at such prices and upon such terms and conditions and with the rights and privileges attached thereto, as may be determined in shareholders' meeting. A special resolution is required to place the preference shares under the control of the directors. Further, in terms of our MOI, a special resolution is required to amend the rights attached to any unissued shares or convert any of our unissued shares into shares of another class. A special resolution is also required for the company to cancel, vary or amend shares or any rights attached to shares which, at the time of the passing of the relevant resolution, have not been taken up by any person or which no person has agreed to take up, and we may reduce our share capital by the amount of the shares so cancelled.
In terms of the Companies Act, a special resolution is required to approve an issue of shares or securities convertible into shares, or the issue of options for the allotment or subscription of authorised shares or other securities of the company, or a grant of any other rights exercisable for securities, if the shares, securities, options or rights are issued to a director, future director, prescribed officer, or
77
future prescribed officer of the company, or their related parties or nominees. In addition, a special resolution is required to approve an issue of shares or securities which will, as a result of a transaction or a series of transactions, result in the voting power of the class of shares being issued being equal to or exceeding 30% of the voting powers of all the shares of that class immediately before the transaction or series of transactions.
10.C Material contracts
We do not have any material contracts, other than contracts entered into in the ordinary course of business.
10.D Exchange controls
South African exchange control regulations are administered by the Financial Surveillance Department (FSD) of the South African Reserve Bank and are applied throughout the Common Monetary Area (CMA) (South Africa, the Kingdoms of Lesotho and Swaziland and the Republic of Namibia) and regulate transactions involving South African residents, as defined in the Exchange Control Rulings, including natural persons and legal entities.
Day to day interaction with the FSD on exchange control matters is facilitated through Authorised Dealers who are persons authorised by National Treasury to deal in foreign exchange, in so far as transactions in respect of foreign exchange are concerned.
The South African government has from time to time stated its intention to relax South Africa's exchange control regulations when economic conditions permit such action. In recent years, the government has incrementally relaxed aspects of exchange control.
The following is a general outline of South African exchange controls. The comments below relate to exchange controls in force at the date of this annual report. These controls are subject to change at any time without notice. Investors should consult a professional advisor as to the exchange control implications of their particular investments.
Foreign financing and investments
Foreign debt. We, and our South African subsidiaries, require approval by the FSD to obtain foreign loans.
Funds raised outside the CMA by our non-resident subsidiaries, i.e. a non-resident for exchange control purposes, are not restricted under South African exchange control regulations and may be used for any purpose including foreign investment, as long as such use is without recourse to South Africa. We, and our South African subsidiaries, would, however, require approval by the FSD in order to provide guarantees for the obligations of any of our subsidiaries with regard to funds obtained from non-residents of the CMA.
Debt raised outside the CMA by our non-resident subsidiaries must be repaid or serviced by those foreign subsidiaries. Without approval by the FSD, we can neither use cash we earn in South Africa to repay or service such foreign debts nor can we provide security on behalf of our non-resident subsidiaries.
We may retain dividends declared by our foreign subsidiaries offshore which we may use for any purpose, without any recourse to South Africa. These funds may, subject to certain conditions, also be invested back into the CMA in the form of equity investments or loans.
Raising capital overseas. A listing by a South African company on any stock exchange requires prior approval by the FSD.
Under South African exchange control regulations, we must obtain approval from the FSD regarding any capital raising activity involving a currency other than the rand. In granting its approval, the FSD may impose conditions on our use of the proceeds of the capital raising activity outside South Africa, including limits on our ability to retain the proceeds of this capital raising activity outside South Africa or a requirement that we seek further approval by the FSD prior to applying any of these funds to any specific use. Any limitations imposed by the FSD on our use of the proceeds of a capital raising activity could adversely affect our flexibility in financing our investments.
78
Foreign investments. Under current exchange control regulations we, and our South African subsidiaries, require approval, either by Authorised Dealers of the FSD to invest offshore.
Although there is no limitation placed on us with regard to the amount of funds that we can transfer from South Africa for an approved foreign investment, the FSD may, however, request us to stagger the capital outflows relating to large foreign investments in order to limit the impact of such outflows on the South African economy and the foreign exchange market.
The FSD also requires us to provide it with an annual report, which will include the results, of all our foreign subsidiaries.
Investment in South African companies
Inward investment. As a general rule, a foreign investor may invest freely in shares in a South African company. Foreign investors may also sell shares in a South African company and transfer the proceeds out of South Africa without restriction. Acquisitions of shares or assets of South African companies by non-South African purchasers are not generally subject to review by the FSD when the consideration is in cash, but may require review by the FSD in certain circumstances, including when the consideration is equity in a non-South African company or when the acquisition is financed by a loan from a South African lender.
Dividends. There are no exchange control restrictions on the remittance of dividends declared out of trading profits to non-residents of the CMA. However, residents of the CMA may under no circumstances have dividends paid outside the CMA without specific approval from the FSD.
Transfer of shares and ADSs. Under South African exchange control regulations, our shares and ADSs are freely transferable outside South Africa among persons who are not residents of the CMA. Additionally, where shares are sold on the JSE on behalf of our shareholders who are not residents of the CMA, the proceeds of such sales will be freely exchangeable into foreign currency and remittable to them. The FSD may
also require a review to establish that the shares have been sold at market value and at arm's length. While share certificates held by non-resident shareholders will be endorsed with the words "non-resident", such endorsement will, however, not be applicable to ADSs held by non-resident shareholders.
10.E Taxation
South African taxation
Corporate Income Tax
The following discussion summarises the South African (SA) tax consequences of the ownership and disposition of shares or ADSs by a US holder (as defined below). This summary is based upon current SA tax law and the convention that has been concluded between the governments of the United States and the SA for the avoidance of double taxation and the prevention of fiscal evasion with respect to taxes on income and capital gains, signed on 17 February 1997 (the Treaty). In addition, this summary is based in part upon representations of the Depositary (The Bank of New York Mellon, as Depositary for our ADSs), and assumes that each obligation provided for in, or otherwise contemplated by the Deposit Agreement and any related agreement, will be performed in accordance with its respective terms.
The summary of the SA tax considerations does not address the tax consequences to a US holder that is resident in SA for SA tax purposes or whose holding of shares or ADSs is effectively connected with a permanent establishment in SA through which such US holder carries on business activities. It equally does not address the scenario where the US holder is not the beneficial recipient of the dividends or returns or, where the source of the transaction is deemed to be in SA, the recipient is not entitled to the full benefits under the Treaty or, in the case of an individual who performs independent person services, who has a fixed base situated in SA.
The statements of law set forth below are subject to any changes (which may be applied retroactively) in SA law or in the interpretation
79
thereof by the SA tax authorities, or in the Treaty, occurring after the date hereof. Holders are strongly urged to consult their own tax advisors as to the consequences under SA, US federal, state and local, and other applicable laws, of the ownership and disposition of shares or ADSs.
Taxation of dividends
A dividends tax was introduced in SA with effect from 1 April 2012. In terms of these provisions, a dividends tax at the rate of 15% which changed to 20% with effect from 22 February 2017, on any dividend paid by a company to a shareholder. The liability to pay such dividends tax is on the shareholder, even though the company generally acts as a withholding agent. In the case of listed shares the regulated intermediary (being the Central Securities Depository Participant referred to below) is liable to withhold the dividends tax.
In the absence of any renegotiation of the Treaty, the tax on the dividends paid to a US holder with respect to shares or ADSs, is limited to 5% of the gross amount of the dividends where a US corporate holder holds directly at least 10% of the voting stock of Sasol. The maximum dividends tax rate is equal to 15% of the gross amount of the dividends in all other cases.
The definition of a dividend currently means any amount transferred or applied by a company that is a resident (including Sasol) for the benefit or on behalf of any person in respect of any share in that company, whether that amount is transferred or applied by way of a distribution made by the company, or as consideration for the acquisition of any share in that company. It specifically excludes any amount transferred or applied by the company that results in a reduction of so-called contributed tax capital (CTC) or constitutes shares in the company or constitutes an acquisition by the company of its own securities by way of a general repurchase of securities in terms of the JSE Listings Requirements. A distinction is thus made between a general repurchase of securities and a specific repurchase of securities. If the company embarks upon a general repurchase of securities,
the proceeds are not deemed to be a dividend whereas, in the case of a specific repurchase of securities where the purchase price is not funded out of CTC, the proceeds are likely to constitute a dividend.
The concept of CTC effectively means the sum of the stated capital or share capital and share premium of a company that existed on 1 January 2011, excluding any transfers from reserves to the share premium account or stated capital account, plus proceeds from any new issue of shares by a company. Any application of CTC is limited to the holders of a class of shares and specifically that a distribution of CTC attributable to a specific class of shares must be made proportionately to the number of shares held by a shareholder in a specific class of shares. In other words, CTC can only be used proportionately by a company and cannot be applied by a company for the benefit of only one specific shareholder. The CTC of the company cannot therefore also be used in respect of different classes of shares and the CTC of a specific class is ring-fenced.
Taxation of gains on sale or other disposition
With effect from 1 October 2001, SA introduced a tax on capital gains, which only applies to SA residents and to non-residents if the sale is attributable to a permanent establishment of the non-resident or if it relates to an interest in immovable property in SA. With effect from 1 October 2007, gains realised on the sale of ordinary shares are automatically deemed to be on capital account, and therefore, subject to capital gains tax, if the ordinary shares have been held for a continuous period of at least three years by the holder thereof. This deeming provision is limited to ordinary shares and does not extend to preference shares or ADSs. The meaning of the word "resident" is different for individuals and corporations and is governed by the SA Income Tax Act of 1962 (the Act) and by the Treaty. In the event of conflict, the Treaty, which contains a tie breaker clause or mechanism to determine residency if a holder is resident in both countries, will prevail. In terms of the Act and the Treaty, a US resident holder of shares or ADSs will not be subject to capital gains tax on the disposal of securities held as
80
capital assets unless the securities are linked to a permanent establishment conducted in SA. In contrast, gains on the disposal of securities which are not capital in nature are usually subject to income tax. However, even in the latter case, a US resident holder will not be subject to income tax unless the US resident holder carries on business in SA through a permanent establishment situated therein. In such a case, this gain may be subject to tax in SA, but only so much as is attributable generally to that permanent establishment.
Securities transfer tax
With effect from 1 July 2008, a single security transfer tax of 0,25% was introduced and is applicable to all secondary transfers of shares. No securities transfer tax (STT) is payable on the issue of securities, even though it is payable on the redemption of securities. STT is payable in SA regardless of whether the transfer is executed within or outside SA. A transfer of a dematerialised share can only occur in SA.
A security is also defined as a depository receipt in a company. Accordingly, STT is payable on the transfer of a depository receipt issued by a company. Generally, the central securities depository that has been accepted as a participant in terms of the Financial Markets Act, No. 19 of 2012 (that commenced on 3 June 2013) is liable for the payment of the STT, on the basis that the STT is recoverable from the person to whom the security is transferred.
Withholding taxes
A withholding tax of interest at the rate of 15% has been introduced with effect from 1 March 2015. This withholding tax is reduced to zero percent in terms of the Treaty to the extent that the interest is derived and beneficially owned by a resident of the other Contracting State.
A withholding tax of royalties at the rate of 15% (increased from 12.5% with effect from 1 March 2015). This withholding tax is reduced to zero percent in terms of the Treaty to the extent that the royalty is derived and beneficially
owned by a resident of the other Contracting State.
Reportable arrangements
The legislation dealing with Reportable Arrangements ("RA") was promulgated during February 2016 which places a requirement on SA taxpayers to report certain transactions which are perceived by the South African Revenue Service ("SARS") to have characteristics that may lead to undue tax benefits. The reporting of such transactions intends to give SARS advance notice of the arrangements. In this regard, RA would typically include the following:
- •
- Hybrid equity instruments (excluding listed instruments)
- •
- Share buy backs in excess of R10 million
- •
- Contributions/payments to non-resident trusts in excess of R10 million
- •
- Acquisition of shares in companies with tax losses (or expected tax losses) in excess of R50 million
- •
- Foreign insurance premiums paid in excess of R5 million; and
- •
- Payment to foreign service providers rendering services in SA in excess of R10 million.
Excluded from RA's are:
- •
- Transactions listed above where the tax benefit is less than R5 million; and
- •
- Transactions where the financial reporting and tax classification differs and the tax benefit is not the main benefit of the transaction
Transfer Pricing and BEPS
Transfer pricing was introduced in SA in 1995, and the transfer pricing principles adopted in SA largely follow the Organisation for Economic Co-Operation and Development (the OECD) guidelines on transfer pricing. The main requirement is to ensure that a transaction is concluded at arm's length and that the transfer pricing between group entities is also at arm's length (also known as the 'arm's length
81
principle'). The OECD guidelines prescribe methodologies for determining arm's length pricing which have been adopted by many countries including SA for their local transfer pricing regulation.
Where there is a deviation from the arm's length principle, the price charged between group entities (where one of those entities is a tax resident) which is different to what would have been concluded at an arm's length basis between unrelated persons and to tax the entity concerned is adjusted to increase the taxable income of the tax resident (also known as a primary adjustment). In addition, the adjusted amount is also deemed to be a dividend (also referred to as a secondary adjustment) that will be subject to dividend withholding tax, as well as the relevant penalties and interest is levied should such an adjustment occur.
Although not a member, SA is an observer of the OECD and therefore closely monitors the developments within the OECD. SA participated in the recent Base Erosion Profit Shifting (BEPS) project initiative by the OECD. This has influenced certain legislation amendments in the SAn Income Tax as well as the adoption of regulatory obligations such as the country-by-country reporting (CBC), master file and local file.
United States federal income taxation
The following is a general summary of the material US federal income tax consequences of the ownership and disposition of shares or ADSs to a US holder (as defined below) that holds its shares or ADSs as capital assets. This summary is based on US tax laws, including the Internal Revenue Code of 1986, as amended (the Code), Treasury regulations, rulings, judicial decisions, administrative pronouncements, all as of the date of this annual report, and all of which are subject to change or changes in interpretation, possibly with retroactive effect. In addition, this summary is based in part upon the representations of the Depositary and the assumption that each obligation in the Deposit Agreement relating to the ADSs and any related agreement will be performed in accordance with its terms.
US holders are strongly urged to consult their own tax advisors regarding the specific US federal, state and local tax consequences of owning and disposing of shares or ADSs in light of their particular circumstances as well as any consequences arising under the laws of any other taxing jurisdiction. In particular, US holders are urged to consult their own tax advisors regarding whether they are eligible for benefits under the Treaty.
This summary does not address all aspects of US federal income taxation that may apply to holders that are subject to special tax rules, including US expatriates, insurance companies, tax-exempt organisations, banks, financial institutions, regulated investment companies, persons subject to the alternative minimum tax or the 3.8% Medicare tax on net investment income, securities broker-dealers, traders in securities who elect to apply a mark-to-market method of accounting, persons holding their shares or ADSs as part of a straddle, hedging transaction or conversion transaction, persons who acquired their shares or ADSs pursuant to the exercise of employee stock options or similar derivative securities or otherwise as compensation, persons who directly or indirectly hold more than 10% of the total combined voting power of Sasol's shares or persons whose functional currency is not the US dollar. Such holders may be subject to US federal income tax consequences different from those set forth below.
As used herein, the term "US holder" means a beneficial owner of shares or ADSs that is:
- (a)
- a
citizen or individual resident of the US for US federal income tax purposes;
- (b)
- a
corporation (or other entity taxable as a corporation for US federal income tax purposes) created or organised in or under the laws of the US, any state thereof or
the District of Columbia;
- (c)
- an
estate whose income is subject to US federal income taxation regardless of its source; or
- (d)
- a trust if a court within the US can exercise primary supervision over the
82
administration of the trust and one or more US persons are authorised to control all substantial decisions of the trust.
If a partnership (or other entity or arrangement treated as a partnership for US federal income tax purposes) holds shares or ADSs, the tax treatment of a partner generally will depend upon the status of the partner and the activities of the partnership. A partner in a partnership that holds shares or ADSs is urged to consult its own tax advisor regarding the specific tax consequences of the ownership and disposition of the shares or ADSs.
For US federal income tax purposes, a US holder of ADSs should be treated as owning the underlying shares represented by those ADSs. The following discussion (except where otherwise expressly noted) applies equally to US holders of shares and US holders of ADSs. Furthermore, deposits or withdrawals of shares by a US holder for ADSs or ADSs for shares will not be subject to US federal income tax.
Taxation of distributions
Distributions (without reduction of SA withholding taxes, if any) made with respect to shares or ADSs (other than certain pro rata distributions of Sasol's capital stock or rights to subscribe for shares of Sasol's capital stock) are includible in the gross income of a US holder as foreign source dividend income on the date such distributions are received by the US holder, in the case of shares, or by the Depositary, in the case of ADSs, to the extent paid out of Sasol's current or accumulated earnings and profits, if any, as determined for US federal income tax purposes ("earnings and profits"). Any distribution that exceeds Sasol's earnings and profits will be treated first as a nontaxable return of capital to the extent of the US holder's tax basis in the shares or ADSs (thereby reducing a US holder's tax basis in such shares or ADSs) and thereafter as either long-term or short-term capital gain (depending on whether the US holder has held shares or ADSs, as applicable, for more than one year as of the time such distribution is actually or constructively received).
The amount of any distribution paid in foreign currency, including the amount of any SA withholding tax thereon, will be included in the gross income of a US holder in an amount equal to the US dollar value of the foreign currency calculated by reference to the spot rate in effect on the date the dividend is actually or constructively received by the US holder, in the case of shares, or by the Depositary, in the case of ADSs, regardless of whether the foreign currency is converted into US dollars at such time. If the foreign currency is converted into US dollars on the date of receipt, a US holder of shares generally should not be required to recognise foreign currency gain or loss in respect of the dividend. If the foreign currency received in the distribution is not converted into US dollars on the date of receipt, a US holder of shares will have a basis in the foreign currency equal to its US dollar value on the date of receipt.
Any gain or loss recognised upon a subsequent conversion or other disposition of the foreign currency will be treated as US source ordinary income or loss. In the case of a US holder of ADSs, the amount of any distribution paid in a foreign currency ordinarily will be converted into US dollars by the Depositary upon its receipt. Accordingly, a US holder of ADSs generally will not be required to recognise foreign currency gain or loss in respect of the distribution.
Accrual basis US holders are urged to consult their own tax advisors regarding the requirements and elections available to accrual method taxpayers to determine the US dollar amount includable in income in the case of taxes withheld in a foreign currency.
Subject to certain limitations (including a minimum holding period requirement), SA dividend withholding taxes (as discussed above under "Taxation—SA taxation—Taxation of dividends") will be treated as foreign taxes eligible for credit against a US holder's US federal income tax liability. For this purpose, dividends distributed by Sasol with respect to shares or ADSs generally will constitute foreign source "passive category income" for most US holders. The use of foreign tax credits is subject
83
to complex conditions and limitations. In lieu of a credit, a US holder may instead elect to deduct any such foreign income taxes paid or accrued in the taxable year, provided that the US holder elects to deduct (rather than credit) all foreign income taxes paid or accrued for the taxable year. US holders are urged to consult their own tax advisors regarding the availability of foreign tax credits or the deductibility of foreign taxes.
Dividends paid by Sasol will not be eligible for the dividends-received deduction generally allowed to US corporations in respect of dividends received from other US corporations. Certain non-corporate US holders are eligible for preferential rates of US federal income tax in respect of "qualified dividend income".
Sasol currently believes that dividends paid with respect to its shares and ADSs should constitute qualified dividend income for US federal income tax purposes (and Sasol anticipates that such dividends will be reported as qualified dividends on Form 1099-DIV delivered to US holders) if Sasol was not, in the year prior to the year in which the dividend was paid, and is not, in the year in which the dividend is paid, a Passive Foreign Investment Company (PFIC) for US federal income tax purposes. Each individual US holder of shares or ADSs is urged to consult his own tax advisor regarding the availability to him of the preferential dividend tax rate in light of his own particular situation including foreign tax credit limitations with respect to any qualified dividend income paid by Sasol, as applicable.
Sale, exchange or other taxable disposition of shares or ADSs
Upon a sale, exchange or other taxable disposition of shares or ADSs, a US holder generally will recognise capital gain or loss for US federal income tax purposes in an amount equal to the difference between the US dollar value of the amount realised on the disposition and the US holder's adjusted tax basis, determined in US dollars, in the shares or ADSs. Such gain or loss generally will be US source gain or loss, and generally will be treated as a long-term capital gain or loss if the holder's
holding period in the shares or ADSs exceeds one year at the time of disposition if Sasol was not, at any time during the holder's holding period, a PFIC for US federal income tax purposes. The deductibility of capital losses is subject to significant limitations. If the US holder is an individual, long-term capital gain generally is subject to US federal income tax at preferential rates. Each US holder of shares or ADSs is urged to consult his own tax advisor regarding the potential US tax consequences from the taxable disposition of shares or ADSs, including foreign currency implications arising therefrom and any other SA taxes imposed on a taxable disposition.
Passive foreign investment company considerations
Sasol believes that it should not be classified as a PFIC for US federal income tax purposes for the taxable year ended 30 June 2017. US holders are advised, however, that this conclusion is a factual determination that must be made annually and thus may be subject to change. If Sasol were to be classified as a PFIC, the tax on distributions on its shares or ADSs and on any gains realised upon the disposition of its shares or ADSs may be less favourable than as described herein. Furthermore, dividends paid by a PFIC are not "qualified dividend income" and are not eligible for the reduced rates of taxation for certain dividends. In addition, each US person that is a shareholder of a PFIC, may be required to file an annual report disclosing its ownership of shares in a PFIC and certain other information. US holders should consult their own tax advisors regarding the application of the PFIC rules (including applicable reporting requirements) to their ownership of the shares or ADSs.
US information reporting and backup withholding
Dividend payments made to a holder and proceeds paid from the sale, exchange, or other disposition of shares or ADSs through a US intermediary or other US paying agent may be subject to information reporting to the US Internal Revenue Service (-IRS). US federal backup withholding generally is imposed on specified payments to persons who fail to furnish required information. Backup withholding will
84
not apply to a holder who furnishes a correct taxpayer identification number or certificate of foreign status and makes any other required certification, or who is otherwise exempt from backup withholding. US persons who are required to establish their exempt status generally must provide IRS Form W-9 (Request for Taxpayer Identification Number and Certification) or applicable substitute form. Non-US holders generally will not be subject to US information reporting or backup withholding. However, these holders may be required to provide certification of non-US status (generally on IRS Form W-8BEN, W-8BEN-E or applicable substitute form) in connection with payments received in the United States or through certain US-related financial intermediaries.
Backup withholding is not an additional tax. Amounts withheld as backup withholding may be credited against a holder's US federal income tax liability. A holder may obtain a refund of any excess amounts withheld under the backup withholding rules by timely filing the appropriate claim for refund with the IRS and furnishing any required information.
Additional reporting requirements
Under recently enacted legislation and Treasury regulations, US holders who are individuals may be required to report to the IRS on Form 8938 information relating to their ownership of shares or ADSs, subject to certain exceptions (including an exception for shares or ADSs held in accounts maintained by certain financial institutions). US holders should consult their tax advisors regarding the effect, if any, of
this legislation and these regulations on their obligations to file information reports with respect to the shares or ADSs.
10.F Dividends and paying agents
Not applicable.
10.G Statement by experts
Not applicable.
10.H Documents on display
All reports and other information that we file with the Securities and Exchange Commission (SEC) may be obtained, upon written request, from the Bank of New York Mellon, as Depositary for our ADSs at its Corporate Trust office, located at 101 Barclay Street, New York, New York 10286. These reports and other information can also be inspected without charge and copied at prescribed rates at the public reference facilities maintained by the SEC at 100 F Street, N.E., Washington, D.C. 20549. These reports may also be accessed via the SEC's website (www.sec.gov). Also, certain reports and other information concerning us will be available for inspection at the offices of the NYSE. In addition, all the statutory records of the company and its subsidiaries may be viewed at the registered address of the company in South Africa.
10.I Subsidiary information
Not applicable. For a list of our subsidiaries see Exhibit 8.1 to this annual report on Form 20-F.
85
ITEM 11. QUANTITATIVE AND QUALITATIVE DISCLOSURES ABOUT MARKET RISK
As a group, we are exposed to various market risks associated with our underlying assets, liabilities and anticipated transactions. We continuously monitor these exposures and enter into derivative financial instruments to reduce these risks. We do not enter into derivative transactions on a speculative basis. All fair values have been determined using current market pricing models.
The principal market risks (i.e. the risk of losses arising from adverse movements in market rates and prices) to which we are exposed are:
- •
- foreign exchange rates applicable on conversion of foreign currency transactions as well as on conversion of assets and liabilities to rand;
- •
- commodity prices, mainly crude oil prices; and
- •
- interest rates on debt and cash deposits.
Refer to "Item 18—Annual Financial statements—Note 39 Financial risk management and financial instruments" for a qualitative and quantitative discussion of the group's exposure to these market risks. Specific recognition and measurement principles of the interest rate swap are contained within the same reference.The following is a breakdown of our debt arrangements and a summary of fixed versus floating interest rate exposures for operations. Liabilities reflect principal payments in each year.
Liabilities—notional
|
2018 | 2019 | 2020 | 2021 | 2022 | Thereafter | Total | Fair value |
|||||||||||||||||
|---|---|---|---|---|---|---|---|---|---|---|---|---|---|---|---|---|---|---|---|---|---|---|---|---|---|
| |
(Rand in millions) |
||||||||||||||||||||||||
Fixed rate (Rand) |
1 150 | 1 694 | 25 | 24 | 27 | 434 | 3 353 | 3 159 | |||||||||||||||||
Average interest rate |
12,47 | % | 12,32 | % | 13,00 | % | 13,00 | % | 13,00 | % | 0 | ||||||||||||||
Variable rate (Rand) |
5 598 | 7 318 | 1 180 | 1 030 | 733 | 1 709 | 17 569 | 17 541 | |||||||||||||||||
Average interest rate |
7,78 | % | 7,93 | % | 8,17 | % | 7,72 | % | 6,99 | % | 0 | ||||||||||||||
Fixed Rate (US$) |
15 | 9 | 2 | 2 | 1 | 13 015 | 13 044 | 13 396 | |||||||||||||||||
Average interest rate |
4,50 | % | 4,50 | % | 4,50 | % | 4,50 | % | 4,50 | % | 4,47 | % | |||||||||||||
Variable rate (US$) |
733 | 4 447 | 5 956 | 3 477 | 31 734 | 0 | 46 347 | 46 989 | |||||||||||||||||
Average interest rate |
3,35 | % | 3,34 | % | 3,39 | % | 3,52 | % | 3,49 | % | 1,31 | % | |||||||||||||
Fixed rate (Euro) |
209 | 68 | 49 | 48 | 49 | 99 | 521 | 521 | |||||||||||||||||
Average interest rate |
2,36 | % | 2,42 | % | 2,64 | % | 3,01 | % | 3,69 | % | 3,69 | % | |||||||||||||
Variable rate (Euro) |
2 542 | — | — | — | — | — | 2 542 | 2 542 | |||||||||||||||||
Average interest rate |
1,10 | % | — | — | — | — | — | ||||||||||||||||||
Variable rate (Other currencies) |
777 | — | — | — | — | — | 777 | 777 | |||||||||||||||||
Average interest rate |
— | — | — | — | — | — | — | — | |||||||||||||||||
| | | | | | | | | | | | | | | | | | | | | | | | | | |
Total |
11 025 | 13 537 | 7 212 | 4 581 | 32 544 | 15 257 | 84 153 | 84 926 | |||||||||||||||||
| | | | | | | | | | | | | | | | | | | | | | | | | | |
| | | | | | | | | | | | | | | | | | | | | | | | | | |
| | | | | | | | | | | | | | | | | | | | | | | | | | |
| |
2018 | 2019 | 2020 | 2021 | 2022 | Thereafter | |
Fair value |
|||||||||||||||||
|---|---|---|---|---|---|---|---|---|---|---|---|---|---|---|---|---|---|---|---|---|---|---|---|---|---|
| |
(Rand in millions) |
||||||||||||||||||||||||
Interest rate swap—designated as a hedging instrument* |
|||||||||||||||||||||||||
Average notional amount |
26 078 | 26 078 | 25 145 | 23 875 | 22 515 | 18 913 | 1 070 | ||||||||||||||||||
Average receive rate |
1,40 | % | 1,73 | % | 1,96 | % | 2,16 | % | 2,16 | % | 2,57 | % | |||||||||||||
Average pay rate |
2,70 | % | 2,70 | % | 2,70 | % | 2,70 | % | 2,70 | % | 2,70 | % | |||||||||||||
Notional at 30 June |
26 078 | 26 078 | 24 839 | 23 548 | 22 166 | 18 367 | |||||||||||||||||||
86
| |
2018 | 2019 | 2020 | 2021 | 2022 | Thereafter | Total Maturity |
|||||||||||||||
|---|---|---|---|---|---|---|---|---|---|---|---|---|---|---|---|---|---|---|---|---|---|---|
Foreign Currency Derivatives—held for trading* |
||||||||||||||||||||||
USD |
||||||||||||||||||||||
Zero-cost collars |
1 543 | — | — | — | — | — | 1 543 | |||||||||||||||
Foreign Exchange Contracts |
3 | — | — | — | — | — | 3 | |||||||||||||||
EUR |
||||||||||||||||||||||
Foreign Exchange Contracts |
(392 | ) | — | — | — | — | — | (392 | ) | |||||||||||||
Commodity derivatives—held for trading* |
||||||||||||||||||||||
Crude oil |
||||||||||||||||||||||
Crude oil options |
1 116 | — | — | — | — | — | 1 116 | |||||||||||||||
Crude oil futures |
1 602 | — | — | — | — | — | 1 602 | |||||||||||||||
Coal price |
||||||||||||||||||||||
Coal swaps |
19 | — | — | — | — | — | 19 | |||||||||||||||
- *
- For more information relating to contract amounts, weighted average strike prices, notional amounts and weighted average pay rate refer to "Item 18—Annual Financial statements—Note 39 Financial risk management and financial instruments".
ITEM 12. DESCRIPTION OF SECURITIES OTHER THAN EQUITY SECURITIES
12.A Debt securities
Not applicable.
12.B Warrants and rights
Not applicable.
12.C Other securities
Not applicable.
12.D American depositary shares
12.D.1 Depositary name and address
Not applicable.
12.D.2 Description of American depositary shares
Not applicable.
12.D.3 Depositary fees and charges
The Bank of New York Mellon serves as the depositary for Sasol's American Depositary Shares (ADSs). Sasol's ADSs, each representing one Sasol ordinary share, are traded on the New York Stock Exchange under the symbol "SSL". The ADSs are evidenced by American Depositary Receipts, or ADRs, issued by The Bank of New York Mellon, as Depositary, under
the Deposit Agreement (dated as of 14 July 1994, as amended and restated as of 6 March 2003), among The Bank of New York Mellon, Sasol Limited and its registered ADR holders. ADR holders are required to pay the following fees to the Depositary:
Service
|
Fees (USD) | |
|---|---|---|
Depositing or substituting the underlying shares |
Up to US$5,00 per 100 ADS |
|
Receiving or distributing dividends |
Up to US$0,02 per ADS |
|
Selling or exercising rights |
Up to US$5,00 per 100 ADS |
|
Withdrawing an underlying security |
Up to US$5,00 per 100 ADS |
In addition, all non-standard out-of-pocket administration and maintenance expenses, including but not limited to, any and all reasonable legal fees and disbursements incurred by the Depositary (including legal opinions, and any fees and expenses incurred by or waived to third-parties) will be paid by the company. Fees and out-of-pocket expenses for the servicing of non-registered ADR holders and for any special service(s) performed by the Depositary will be paid for by the company.
12.D.4 Depositary payments for 2017
In terms of the Amended and Restated Deposit Letter Agreement dated as of 21 September 2015 (the Letter Agreement), the
87
Depositary will pay the company 70% of all dividend fees it collects for as long as the number of ADRs outstanding exceed 50% of the number outstanding on 21 September 2015. These payments will be made to the company within 60 days from the date such fees are collected. During the 2017 financial year, two payments of $547 465,07 and $367 387,17 were received from the Bank of New York Mellon in respect of the 2016 year end final dividend and the 2017 interim dividend respectively.
ITEM 13. DEFAULTS, DIVIDEND ARREARAGES AND DELINQUENCIES
Not applicable.
ITEM 14. MATERIAL MODIFICATIONS TO THE RIGHTS OF SECURITY HOLDERS AND USE OF PROCEEDS
Not applicable.
ITEM 15. CONTROLS AND PROCEDURES
- (a)
- Disclosure controls and procedures
The company's Joint Presidents and Chief Executive Officers and Chief Financial Officer, based on their evaluation of the effectiveness of the group's disclosure controls and procedures (required by paragraph (b) of 17 CFR 240.13a-15) as of the end of the period covered by this annual report on Form 20-F, have concluded that, as of such date, the company's disclosure controls and procedures were effective.
- (b)
- Management's annual report on internal control over financial reporting
Management of Sasol is responsible for establishing and maintaining adequate internal control over financial reporting as defined in Rule 13a-15(f) under the Securities Exchange Act of 1934, as amended. Under Section 404 of the Sarbanes-Oxley Act of 2002, management is required to assess the effectiveness of Sasol's internal control over financial reporting as of the end of each financial year and report, based on that assessment, whether the Company's internal control over financial reporting is effective.
Sasol's internal control over financial reporting is a process designed under the supervision of the Joint Presidents and Chief Executive Officers and Chief Financial Officer to provide reasonable assurance as to the reliability of Sasol's financial reporting and the preparation of financial statements for external purposes in accordance with generally accepted accounting principles.
Internal control over financial reporting includes those policies and procedures that (i) pertain to the maintenance of records that in reasonable detail accurately and fairly reflect the transactions and dispositions of our assets; (ii) provide reasonable assurance that transactions are recorded as necessary to permit preparation of financial statements in accordance with generally accepted accounting principles, and that receipts and expenditures are being made only in accordance with authorisations of our management and directors; and (iii) provide reasonable assurance regarding prevention or timely detection of unauthorised acquisition, use or disposition of assets that could have a material effect on the financial statements.
Because of its inherent limitations, internal control over financial reporting may not prevent or detect misstatements. Therefore, even those systems determined to be effective can provide only reasonable assurance with respect to financial statement preparation and presentation.
Management assessed the effectiveness of Sasol's internal control over financial reporting as of 30 June 2017. In making this assessment, management used the criteria set forth by the Committee of Sponsoring Organisations of the Treadway Commission (COSO) in "Internal Control—Integrated Framework (2013)". Based on this assessment, our management has determined that, as of 30 June 2017, Sasol's internal control over financial reporting was effective.
- (c)
- The effectiveness of internal control over financial reporting as of 30 June 2017 was audited by PricewaterhouseCoopers Inc., independent registered public accounting firm, as stated in their report on page F-1 of this Form 20-F.
88
- (d)
- Changes in internal control over financial reporting
There were no changes in our internal control over financial reporting that occurred during the year ended 30 June 2017 that have materially affected, or are likely to materially affect, our internal control over financial reporting as at 30 June 2017.
Item 16.A AUDIT COMMITTEE FINANCIAL EXPERT
Mr. Colin Beggs, an independent member of the audit committee and its chairman since 1 January 2011, was determined by our board to be the audit committee's financial expert within the meaning of the Sarbanes-Oxley Act, in accordance with the Rules of the NYSE and the SEC.
Sasol has a code of ethics that applies to all of our directors, officers and employees, including the Joint Presidents and Chief Executive Officers, Chief Financial Officer and the Senior Vice President: Financial Control Services. We undertook a comprehensive review of our code in 2014, and adopted the current code with effect from 1 July 2014. The revised code has been translated into the common languages of all major countries in which we operate, and we conducted an extensive awareness campaign for our employees, service providers and customers. In July 2015, we also adopted a code of ethics for suppliers.
Any amendment or waiver of the code as it relates to our Joint Presidents and Chief Executive Officers or Chief Financial Officer will be posted on our website within five business days following such amendment or waiver. No such amendments or waivers are anticipated.
The code is available on our internet and intranet websites. The website address is http://www.sasol.com/sustainability/ethics. This website is not incorporated by reference in this annual report.
We have been operating an independent ethics reporting telephone line through external advisors since 2002. This confidential and
anonymous ethics hotline provides an impartial facility for all stakeholders to report deviations from ethical behaviour, including fraud and unsafe behaviour or environmental misconduct. Our code of ethics guides our interactions with all government representatives. Our policy prohibits contributions to political parties or government officials since these may be interpreted as an inducement for future beneficial treatment, and as interference in the democratic process.
Item 16.C PRINCIPAL ACCOUNTANT FEES AND SERVICES
The following table sets forth the aggregate audit and audit-related fees, tax fees and all other fees billed by our principal accountants (PricewaterhouseCoopers Inc.) for each of the 2017 and 2016 years:
| |
Audit fees |
Audit- related fees |
Tax fees |
All other fees |
Total | |||||||||||
|---|---|---|---|---|---|---|---|---|---|---|---|---|---|---|---|---|
| |
(Rand in millions) |
|||||||||||||||
2017(1) |
83 | 3 | 3 | — | 89 | |||||||||||
2016(1) |
80 | 4 | 1 | — | 85 | |||||||||||
- (1)
- In respect of our audit committee approval process, all non-audit and audit fees paid to PricewaterhouseCoopers Inc. have been pre-approved by the audit committee.
Audit fees consist of fees billed for the annual audit of the company's consolidated financial statements, review of the group's internal controls over financial reporting in accordance with Section 404 of the Sarbanes-Oxley Act and the audit of statutory financial statements of the company's subsidiaries, including fees billed for assurance and related services that are reasonably related to the performance of the audit or reviews of the company's financial statements that are services that only an external auditor can reasonably provide.
Audit-related fees consist of the review of documents filed with regulatory authorities, consultations concerning financial accounting and reporting standards, review of security controls and operational effectiveness of systems,
89
due diligence related to acquisitions and employee benefit plan audits.
Tax fees include fees billed for tax compliance services, including assistance in the preparation of original and amended tax returns; tax consultations, such as assistance in connection with tax audits and appeals; tax advice relating to acquisitions, transfer pricing, and requests for rulings or technical advice from tax authorities; and tax planning services and expatriate tax compliance, consultation and planning services.
All other fees consist of fees billed which are not included under audit fees, audit related fees or tax fees.
Audit committee approval policy
In accordance with our audit committee pre-approval policy, all audit and non-audit services performed for us by our independent accountants were approved by the audit committee of our board of directors, which concluded that the provision of such services by the independent accountants was compatible with the maintenance of that firm's independence in the conduct of its auditing functions.
In terms of our policy, non-audit services not exceeding R500 000 that fall into the categories set out in the pre-approval policy, do not require pre-approval by the audit committee, but are pre-approved by the Senior Vice President: Financial Control Services. The audit committee is notified of each such service at its first meeting following the rendering of such service. All non-audit services exceeding R500 000 but not exceeding R2 million are
pre-approved by the Chief Financial Officer. The audit committee is notified on a monthly basis of services approved within this threshold. Fees in respect of non-audit services exceeding R2 million require pre-approval by the audit committee, prior to engagement.
The total aggregate amount of non-audit fees in any one financial year must be less than 20% of the total audit fees for Sasol's annual audit engagement, unless otherwise directed by the audit committee. In addition, services to be provided by the independent accountants that are not within the category of approved services must be approved by the audit committee prior to engagement, regardless of the service being requested and the amount, but subject to the restriction above.
Requests or applications for services that require specific separate approval by the audit committee are required to be submitted to the audit committee by both management and the independent accountants, and must include a detailed description of the services to be provided and a joint statement confirming that the provision of the proposed services does not impair the independence of the independent accountants.
No work was performed by persons other than the principal accountant's employees on the principal accountant's engagement to audit Sasol Limited's financial statements for 2017.
Item 16.D EXEMPTIONS FROM THE LISTING STANDARDS FOR AUDIT COMMITTEES
Not applicable.
90
Item 16.E PURCHASES OF EQUITY SECURITIES BY THE ISSUER AND AFFILIATED PURCHASERS
Period
|
Total number of shares repurchased |
Average price paid per share |
Shares cancelled under the share repurchase programme |
Total number of shares purchased as part of publicly announced programmes |
Maximum number of shares that may yet be purchased under the programmes(1) |
||||||||||
|---|---|---|---|---|---|---|---|---|---|---|---|---|---|---|---|
For the year ended 30 June 2017 |
|||||||||||||||
Balance at 30 June 2016 |
40 309 886 | — | (31 500 000 | ) | 8 809 886 | 56 268 816 | |||||||||
2016-07-01 to 2016-07-31 |
— | — | — | — | 56 591 912 | ||||||||||
2016-08-01 to 2016-08-31 |
— | — | — | — | 56 593 482 | ||||||||||
2016-09-01 to 2016-09-30 |
— | — | — | — | 56 605 882 | ||||||||||
2016-10-01 to 2016-10-31 |
— | — | — | — | 56 607 392 | ||||||||||
2016-11-01 to 2016-11-30 |
— | — | — | — | 56 608 562 | ||||||||||
2016-12-01 to 2016-12-31 |
— | — | — | — | 56 612 922 | ||||||||||
2017-01-01 to 2016-01-31 |
— | — | — | — | 56 612 922 | ||||||||||
2017-02-01 to 2017-02-29 |
— | — | — | — | 56 612 922 | ||||||||||
2017-03-01 to 2017-03-31 |
— | — | — | — | 56 612 922 | ||||||||||
2017-04-01 to 2017-04-30 |
— | — | — | — | 56 612 922 | ||||||||||
2017-05-01 to 2017-05-31 |
— | — | — | — | 56 612 922 | ||||||||||
2017-06-01 to 2017-06-30 |
— | — | — | — | 56 612 922 | ||||||||||
2017-07-01 to 2017-07-31 |
— | — | — | — | 56 612 922 | ||||||||||
2017-08-01 to 2017-08-28 |
— | — | — | — | 56 612 922 | ||||||||||
| | | | | | | | | | | | | | | | |
|
40 309 886 | (31 500 000 | ) | 8 809 886 | |||||||||||
| | | | | | | | | | | | | | | | |
| | | | | | | | | | | | | | | | |
| | | | | | | | | | | | | | | | |
- (1)
- Approval
is obtained annually at the annual general meeting for a new maximum number of shares to be repurchased.
- a.
- At
our annual general meeting held on 25 November 2016, shareholders granted the authority to the directors to approve the repurchase by the company of its
issued securities up to 10% of each of Sasol's ordinary shares and Sasol BEE ordinary shares. The company's issued ordinary shares as at 25 November 2016, was
651 389 516 (4 December 2015—651 389 516) and its issued Sasol BEE ordinary shares as at 25 November 2016, was
2 838 565 (4 December 2015—2 838 565). No shares were repurchased in terms of this authority.
- b.
- The
repurchase is limited to a maximum of 10% of the company's securities in the applicable class at the time the authority was granted and no acquisition may be
made at a price more than 10% above the weighted average of the market value of the securities for the five business days immediately preceding the date of such acquisition.
- c.
- In
terms of the JSE Limited Listings Requirements and the terms of the resolution, the general authority granted to the directors by shareholders on
25 November 2016 to acquire the company's issued securities will not exceed 15 months from the date of the resolution and will be valid only until the company's next annual general
meeting, which is scheduled for 17 November 2017.
- d.
- The
authority granted by shareholders on 4 December 2015, was replaced by a new authority from shareholders on 25 November 2016 to repurchase Sasol
ordinary shares and Sasol BEE ordinary shares. The maximum number of Sasol ordinary shares that could be repurchased between 4 December 2015 and 25 November 2016 amounts to
65 138 951 and the maximum number of Sasol BEE ordinary shares 283 856.
- e.
- No programme was terminated prior to the expiration date. All programme previously approved by shareholders expire at the annual general meeting following the meeting at which such approval was granted.
Item 16.F CHANGE IN REGISTRANT'S CERTIFYING ACCOUNTANT
Not applicable.
Item 16.G CORPORATE GOVERNANCE
Sasol maintains a primary listing of its ordinary shares and Sasol BEE ordinary shares on the Johannesburg Stock Exchange operated by the JSE Limited (JSE) and a listing of American Depositary Shares on the New York Stock Exchange (NYSE). Accordingly, the company is subject to the disclosure, corporate governance and other requirements imposed by applicable South African and United States legislation, the JSE, the United States Securities and Exchange Commission (SEC) and the NYSE. We have implemented controls to provide reasonable assurance of our compliance with all relevant requirements in respect of our listings.
We have compared our corporate governance practices to those for domestic US companies listed on the NYSE and confirm that we comply substantially with such NYSE corporate governance standards and there were no significant differences at 30 June 2017.
Refer to "Integrated Report—Our governance framework" as contained in Exhibit 99.9, for further details of our corporate governance practices.
Item 16.H Mine Safety Disclosure
Not applicable.
Sasol is furnishing financial statements pursuant to the instructions of Item 18 of Form 20-F.
91
The following consolidated financial statements, together with the auditors' report of PricewaterhouseCoopers Inc. (PwC) are filed as part of this annual report on Form 20-F:
Index to Consolidated Financial Statements for the years ended 30 June 2017, 2016 and 2015
Report of the Independent Registered Public Accounting Firm (PwC) |
F-1 | |||
Consolidated Financial Statements* |
F- | |||
Supplemental Oil and Gas Information (Unaudited) |
G-1 |
- *
- Refer to Item 18—"Annual financial statements" which have been incorporated by reference.
92
Report of Independent Registered Public Accounting Firm
To the Board of Directors and Shareholders of Sasol Limited
In our opinion, the accompanying consolidated statements of financial position and the related consolidated income statements, statements of comprehensive income, changes in equity and cash flows present fairly, in all material respects, the financial position of Sasol Limited and its subsidiaries at 30 June 2017 and 30 June 2016, and the results of their operations and their cash flows for each of the three years in the period ended 30 June 2017 in conformity with International Financial Reporting Standards as issued by the International Accounting Standards Board. Also in our opinion, the Company maintained, in all material respects, effective internal control over financial reporting as of 30 June 2017, based on criteria established in Internal Control—Integrated Framework 2013 issued by the Committee of Sponsoring Organizations of the Treadway Commission (COSO). The Company's management is responsible for these financial statements, for maintaining effective internal control over financial reporting and for its assessment of the effectiveness of internal control over financial reporting, included in the accompanying Management's Annual Report on Internal Control Over Financial Reporting. Our responsibility is to express opinions on these financial statements and on the Company's internal control over financial reporting based on our integrated audits. We conducted our audits in accordance with the standards of the Public Company Accounting Oversight Board (United States). Those standards require that we plan and perform the audits to obtain reasonable assurance about whether the financial statements are free of material misstatement and whether effective internal control over financial reporting was maintained in all material respects. Our audits of the financial statements included examining, on a test basis, evidence supporting the amounts and disclosures in the financial statements, assessing the accounting principles used and significant estimates made by management, and evaluating the overall financial statement presentation. Our audit of internal control over financial reporting included obtaining an understanding of internal control over financial reporting, assessing the risk that a material weakness exists, and testing and evaluating the design and operating effectiveness of internal control based on the assessed risk. Our audits also included performing such other procedures as we considered necessary in the circumstances. We believe that our audits provide a reasonable basis for our opinions.
A company's internal control over financial reporting is a process designed to provide reasonable assurance regarding the reliability of financial reporting and the preparation of financial statements for external purposes in accordance with generally accepted accounting principles. A company's internal control over financial reporting includes those policies and procedures that (i) pertain to the maintenance of records that, in reasonable detail, accurately and fairly reflect the transactions and dispositions of the assets of the company; (ii) provide reasonable assurance that transactions are recorded as necessary to permit preparation of financial statements in accordance with generally accepted accounting principles, and that receipts and expenditures of the company are being made only in accordance with authorizations of management and directors of the company; and (iii) provide reasonable assurance regarding prevention or timely detection of unauthorized acquisition, use, or disposition of the company's assets that could have a material effect on the financial statements.
Because of its inherent limitations, internal control over financial reporting may not prevent or detect misstatements. Also, projections of any evaluation of effectiveness to future periods are subject to the risk that controls may become inadequate because of changes in conditions, or that the degree of compliance with the policies or procedures may deteriorate.
/s/ PricewaterhouseCoopers Inc.
Johannesburg,
Republic of South Africa
28 August 2017
F-1
SUPPLEMENTAL OIL AND GAS INFORMATION (unaudited)
In accordance with Financial Accounting Standards Board (FASB) Accounting Standards Codification (ASC) Section 932, "Extractive Industries—Oil and Gas", and regulations of the US Securities and Exchange Commission (SEC), this section provides supplemental oil and gas information separately about our natural oil and gas exploration and production operations, as managed by Exploration and Production International (E&PI); and about our coal mining operations and the conversion of coal reserves to synthetic oil, as managed by Mining and Sasol Secunda Operations.
NATURAL OIL AND GAS
The supplemental information provided below relates to our natural oil and gas operations, which are managed by Exploration and Production International (E&PI).
Tables 1 through to 3 present historical information pertaining to costs incurred for property acquisitions, exploration and development; capitalised costs; and results of operations. Table 4 presents estimates of proved developed and proved undeveloped reserves (which are not supplemental). Tables 5 and 6 present information on the standardised measure of estimated discounted future net cash flows related to proved reserves and changes therein.
TABLE 1—COSTS INCURRED FOR PROPERTY ACQUISITION, EXPLORATION, AND DEVELOPMENT ACTIVITIES
The table below presents the costs incurred, during the last three years, in natural oil and gas property acquisition, exploration and development activities, whether capitalised or charged to income currently.
| |
Natural oil and gas (Rand in millions) | ||||||||||||
|---|---|---|---|---|---|---|---|---|---|---|---|---|---|
| |
Mozambique | North America(1)(2) |
Other areas(1) | Total | |||||||||
Year ended 30 June 2015 |
|||||||||||||
Acquisition of unproved properties(3) |
— | — | 120,7 | 120,7 | |||||||||
Exploration |
550,8 | — | 248,9 | 799,7 | |||||||||
Development |
636,5 | 2 923,9 | 857,7 | 4 418,1 | |||||||||
| | | | | | | | | | | | | | |
Total costs incurred |
1 187,3 | 2 923,9 | 1 227,3 | 5 338,5 | |||||||||
| | | | | | | | | | | | | | |
| | | | | | | | | | | | | | |
| | | | | | | | | | | | | | |
Year ended 30 June 2016 |
|||||||||||||
Acquisition of unproved properties |
— | — | — | — | |||||||||
Exploration |
736,1 | — | 238,7 | 974,8 | |||||||||
Development |
745,6 | 7 447,7 | 391,7 | 8 585,0 | |||||||||
| | | | | | | | | | | | | | |
Total costs incurred |
1 481,7 | 7 447,7 | 630,4 | 9 559,8 | |||||||||
| | | | | | | | | | | | | | |
| | | | | | | | | | | | | | |
| | | | | | | | | | | | | | |
Year ended 30 June 2017 |
|||||||||||||
Acquisition of unproved properties |
— | — | — | — | |||||||||
Exploration |
40,5 | — | 372,7 | 413,2 | |||||||||
Development |
1 986,7 | 362,4 | (43,7) | (4) | 2 305,4 | ||||||||
| | | | | | | | | | | | | | |
Total costs incurred |
2 027,2 | 362,4 | 329,0 | 2 718,6 | |||||||||
| | | | | | | | | | | | | | |
| | | | | | | | | | | | | | |
| | | | | | | | | | | | | | |
- (1)
- North
America comprises Canada. Other Areas comprises: Gabon, Australia and South Africa.
- (2)
- Development
cost in 2016 includes CAD380 million (R4,2 billion), agreed with our partner, Progress Energy, as the first part of the settlement of the
remaining funding commitment.
- (3)
- Stated
as acquisition of proved properties in 2016.
- (4)
- Relates to the reversal of accruals raised in 2016.
G-1
TABLE 2—CAPITALISED COSTS RELATING TO OIL AND GAS PRODUCING ACTIVITIES
The table below summarises the aggregate amount of property, plant and equipment and intangible assets relating to natural oil and gas exploration and production activities, and the aggregate amount of the related depreciation and amortisation.
| |
Natural Oil and Gas (Rand in millions) | ||||||||||||
|---|---|---|---|---|---|---|---|---|---|---|---|---|---|
| |
Mozambique | North America(1) |
Other areas(1) | Total | |||||||||
Year ended 30 June 2015 |
|||||||||||||
Proved properties |
8 135,5 | 20 171,9 | 3 836,5 | 32 143,9 | |||||||||
| | | | | | | | | | | | | | |
Producing wells and equipment |
6 672,5 | 19 086,0 | 3 325,0 | 29 083,5 | |||||||||
Non-producing wells and equipment |
1 463,0 | 1 085,9 | 511,5 | 3 060,4 | |||||||||
| | | | | | | | | | | | | | |
Unproved properties |
1 882,6 | 1 278,8 | 216,3 | 3 377,7 | |||||||||
| | | | | | | | | | | | | | |
Capitalised costs |
10 018,1 | 21 450,7 | 4 052,8 | 35 521,6 | |||||||||
Accumulated depreciation |
(2 648,1 | ) | (10 870,8 | ) | (2 875,7 | ) | (16 394,6 | ) | |||||
| | | | | | | | | | | | | | |
Net book value |
7 370,0 | 10 579,9 | 1 177,1 | 19 127,0 | |||||||||
| | | | | | | | | | | | | | |
Year ended 30 June 2016 |
|||||||||||||
Proved properties |
8 992,2 | 31 030,0 | 5 099,2 | 45 121,4 | |||||||||
| | | | | | | | | | | | | | |
Producing wells and equipment |
8 808,2 | 30 584,2 | 5 099,2 | 44 491,6 | |||||||||
Non-producing wells and equipment |
184 | 445,8 | — | 629,8 | |||||||||
| | | | | | | | | | | | | | |
Unproved properties |
4 466,0 | — | 55,9 | 4 521,9 | |||||||||
| | | | | | | | | | | | | | |
Capitalised costs |
13 458,2 | 31 030,0 | 5 155,1 | 49 643,3 | |||||||||
Accumulated depreciation |
(3 274,3 | ) | (21 927,3 | ) | (4 545,6 | ) | (29 747,2 | ) | |||||
| | | | | | | | | | | | | | |
Net book value |
10 183,9 | 9 102,7 | 609,5 | 19 896,1 | |||||||||
| | | | | | | | | | | | | | |
| | | | | | | | | | | | | | |
| | | | | | | | | | | | | | |
Year ended 30 June 2017 |
|||||||||||||
Proved properties |
8 599,2 | 27 502,1 | 4 251,8 | 40 353,1 | |||||||||
| | | | | | | | | | | | | | |
Producing wells and equipment |
8 513,2 | 27 420,2 | 4 250,2 | 40 183,6 | |||||||||
Non-producing wells and equipment |
86,0 | 81,9 | 1,6 | 169,5 | |||||||||
| | | | | | | | | | | | | | |
Unproved properties |
6 051,6 | — | 49,3 | 6 100,9 | |||||||||
| | | | | | | | | | | | | | |
Capitalised costs |
14 650,8 | 27 502,1 | 4 301,1 | 46 454,0 | |||||||||
Accumulated depreciation |
(3 832,6 | ) | (20 577,9 | ) | (4 036,9 | ) | (28 447,4 | ) | |||||
| | | | | | | | | | | | | | |
Net book value |
10 818,2 | 6 924,2 | 264,2 | 18 006,6 | |||||||||
| | | | | | | | | | | | | | |
| | | | | | | | | | | | | | |
| | | | | | | | | | | | | | |
- (1)
- North America comprises Canada. Other Areas comprises: Gabon, Australia and South Africa
G-2
TABLE 3—RESULTS OF OPERATIONS FOR OIL AND GAS PRODUCING ACTIVITIES
The results of operations for natural oil and gas producing activities are summarised in the table below.
| |
Natural oil and gas (Rand in millions) | ||||||||||||
|---|---|---|---|---|---|---|---|---|---|---|---|---|---|
| |
Mozambique | North America(1) |
Other areas(1) | Total | |||||||||
Year ended 30 June 2015 |
|||||||||||||
Sales to unaffiliated parties |
392,4 | 695,5 | 954,9 | 2 042,8 | |||||||||
Transfers to affiliated parties |
3 129,2 | — | — | 3 129,2 | |||||||||
| | | | | | | | | | | | | | |
Total revenues |
3 521,6 | 695,5 | 954,9 | 5 172,0 | |||||||||
Production costs |
(1 102,1 | ) | (161,8 | ) | (493,5 | ) | (1 757,4 | ) | |||||
Foreign currency translation (losses)/gains |
(402,0 | ) | — | (9,4 | ) | (411,4 | ) | ||||||
Exploration expenses |
(21,7 | ) | — | (189,7 | ) | (211,4 | ) | ||||||
Valuation provision |
— | (1 295,6 | ) | (1 330,7 | ) | (2 626,3 | ) | ||||||
Farm-down (losses)/gains |
— | — | (502,9 | ) | (502,9 | ) | |||||||
| | | | | | | | | | | | | | |
Depreciation |
(569,3 | ) | (1 604,2 | ) | (259,7 | ) | (2 433,2 | ) | |||||
| | | | | | | | | | | | | | |
Operating profit / (loss) |
1 426,5 | (2 366,1 | ) | (1 831,0 | ) | (2 770,6 | ) | ||||||
Tax |
(746,4 | ) | — | 356,8 | (389,6 | ) | |||||||
| | | | | | | | | | | | | | |
Results of operations |
680,1 | (2 366,1 | ) | (1 474,2 | ) | (3 160,2 | ) | ||||||
| | | | | | | | | | | | | | |
| | | | | | | | | | | | | | |
| | | | | | | | | | | | | | |
Year ended 30 June 2016 |
— | ||||||||||||
Sales to unaffiliated parties |
228,4 | 466,4 | 861,4 | 1 556,2 | |||||||||
Transfers to affiliated parties |
2 655,2 | — | — | 2 655,2 | |||||||||
| | | | | | | | | | | | | | |
Total revenues |
2 883,6 | 466,4 | 861,4 | 4 211,4 | |||||||||
Production costs |
(440,8 | ) | (185,8 | ) | (783,1 | ) | (1 409,7 | ) | |||||
Foreign currency translation (losses)/gains |
(1 053,2 | ) | — | (2,8 | ) | (1 056,0 | ) | ||||||
Exploration expenses |
(108,8 | ) | — | (71,1 | ) | (179,9 | ) | ||||||
Valuation provision |
— | (9 882,1 | ) | (416,8 | ) | (10 298,9 | ) | ||||||
Farm-down (losses)/gains |
347,5 | — | (13,7 | ) | 333,8 | ||||||||
Depreciation |
(630,1 | ) | (1 310,3 | ) | (1 061,5 | ) | (3 001,9 | ) | |||||
| | | | | | | | | | | | | | |
Operating profit/(loss) |
998,2 | (10 911,8 | ) | (1 487,6 | ) | (11 401,2 | ) | ||||||
Tax |
589,3 | — | 389,1 | 978,4 | |||||||||
| | | | | | | | | | | | | | |
Results of operations |
1 587,5 | (10 911,8 | ) | (1 098,5 | ) | (10 422,8 | ) | ||||||
| | | | | | | | | | | | | | |
| | | | | | | | | | | | | | |
| | | | | | | | | | | | | | |
Year ended 30 June 2017 |
— | ||||||||||||
Sales to unaffiliated parties |
224,8 | 559,7 | 835,2 | 1 619,7 | |||||||||
Transfers to affiliated parties |
2 464,7 | — | — | 2 464,7 | |||||||||
| | | | | | | | | | | | | | |
Total revenues |
2 689,5 | 559,7 | 835,2 | 4 084,4 | |||||||||
Production costs |
(373,3 | ) | (48,2 | ) | (497,8 | ) | (919,3 | ) | |||||
Foreign currency translation (losses)/gains |
345,6 | — | (1,6 | ) | 344,0 | ||||||||
Exploration expenses |
(37,3 | ) | — | (222,5 | ) | (259,8 | ) | ||||||
Valuation provision |
— | — | 8,2 | 8,2 | |||||||||
Farm-down (losses)/gains |
— | — | (0,9 | ) | (0,9 | ) | |||||||
Depreciation |
(560,4 | ) | (1 260,3 | ) | (201,5 | ) | (2 022,2 | ) | |||||
| | | | | | | | | | | | | | |
Operating profit/(loss) |
2 064,1 | (748,8 | ) | (80,9 | ) | 1 234,4 | |||||||
Tax |
(321,1 | ) | — | (126,6 | ) | (447,7 | ) | ||||||
| | | | | | | | | | | | | | |
Results of operations |
1 743,0 | (748,8 | ) | (207,5 | ) | 786,7 | |||||||
| | | | | | | | | | | | | | |
| | | | | | | | | | | | | | |
| | | | | | | | | | | | | | |
- (1)
- North America comprises Canada. Other areas comprises: Gabon, Australia and South Africa.
G-3
TABLE 4—PROVED RESERVE QUANTITY INFORMATION
The table below summarises the proved developed and proved undeveloped reserves of natural oil and gas, as at 30 June 2017 and the two previous years, along with volumes produced during the year. Refer to Item 4.D Property, plants and equipment.
Proved reserves of synthetic oil is shown separately on page G-6. As at 30 June 2017, the total proved reserve estimate for natural oil and gas is 216,0 million barrels in oil equivalent terms (6 000 standard cubic feet of natural gas is equivalent to 1 barrel of oil).
The table below also presents the changes in proved reserves of natural oil and gas over the last three years and identifies the reasons for the changes in the estimates.
| |
Crude oil and condensate(4) | Natural gas(4) | Oil equivalent(1)(4) | |||||||||||||||||||||||||||||||
|---|---|---|---|---|---|---|---|---|---|---|---|---|---|---|---|---|---|---|---|---|---|---|---|---|---|---|---|---|---|---|---|---|---|---|
| |
Mozambique(2) | North America(3) |
Rest of Africa(3) |
Total | Mozambique(2) | North America(3)(5) |
Total | Mozambique | North America(3)(4) |
Rest of Africa(3) |
Total | |||||||||||||||||||||||
| |
Millions of barrels |
Billions of cubic feet |
Equivalent, Millions of barrels |
|||||||||||||||||||||||||||||||
Balance at 30 June 2014 |
4,1 | 0,2 | 4,2 | 8,5 | 1 388,4 | 72,5 | 1 460,9 | 235,5 | 12,3 | 4,2 | 252,0 | |||||||||||||||||||||||
Revisions |
0,0 | 0,1 | (1,3 | ) | (1,2 | ) | (82,8 | ) | 33,3 | (49,5 | ) | (13,8 | ) | 5,6 | (1,3 | ) | (9,5 | ) | ||||||||||||||||
Improved recovery |
0,6 | 0,2 | (0,5 | ) | 0,3 | 174,7 | 32,8 | 207,5 | 29,7 | 5,7 | (0,5 | ) | 34,9 | |||||||||||||||||||||
Production |
(0,3 | ) | (0,2 | ) | (1,3 | ) | (1,8 | ) | (109,2 | ) | (21,8 | ) | (131,0 | ) | (18,5 | ) | (3,8 | ) | (1,3 | ) | (23,6 | ) | ||||||||||||
| | | | | | | | | | | | | | | | | | | | | | | | | | | | | | | | | | | |
Balance at 30 June 2015 |
4,4 | 0,3 | 1,1 | 5,8 | 1 371,1 | 116,8 | 1 487,9 | 232,9 | 19,8 | 1,1 | 253,8 | |||||||||||||||||||||||
Revisions |
(0,3 | ) | 0,1 | 0,8 | 0,6 | (42,4 | ) | (0,6 | ) | (43,0 | ) | (7,4 | ) | 0,0 | 0,8 | (6,6 | ) | |||||||||||||||||
Improved recovery |
0,0 | 0,0 | 0,4 | 0,4 | (3,8 | ) | 27,2 | 23,4 | (0,6 | ) | 4,5 | 0,4 | 4,3 | |||||||||||||||||||||
Production |
(0,3 | ) | (0,2 | ) | (1,5 | ) | (2,0 | ) | (114,4 | ) | (20,7 | ) | (135,1 | ) | (19,4 | ) | (3,6 | ) | (1,5 | ) | (24,5 | ) | ||||||||||||
| | | | | | | | | | | | | | | | | | | | | | | | | | | | | | | | | | | |
Balance at 30 June 2016 |
3,8 | 0,2 | 0,8 | 4,8 | 1 210,5 | 122,7 | 1 333,2 | 205,5 | 20,7 | 0,8 | 227,0 | |||||||||||||||||||||||
Revisions |
0,2 | 0,5 | 2,1 | 2,8 | 88,9 | 21,6 | 110,5 | 15,1 | 4,0 | 2,1 | 21,2 | |||||||||||||||||||||||
Improved recovery |
(0,3 | ) | — | 0,1 | (0,2 | ) | (43,3 | ) | — | (43,3 | ) | (7,5 | ) | — | 0,1 | (7,4 | ) | |||||||||||||||||
Production |
(0,3 | ) | (0,1 | ) | (1,3 | ) | (1,7 | ) | (116,4 | ) | (21,9 | ) | (138,3 | ) | (19,7 | ) | (3,8 | ) | (1.3 | ) | (24,8 | ) | ||||||||||||
| | | | | | | | | | | | | | | | | | | | | | | | | | | | | | | | | | | |
Balance at 30 June 2017 |
3,4 | 0,6 | 1,7 | 5,7 | 1 139,7 | 122,4 | 1 262,1 | 193,4 | 20,9 | 1,7 | 216,0 | |||||||||||||||||||||||
| | | | | | | | | | | | | | | | | | | | | | | | | | | | | | | | | | | |
| | | | | | | | | | | | | | | | | | | | | | | | | | | | | | | | | | | |
| | | | | | | | | | | | | | | | | | | | | | | | | | | | | | | | | | | |
Proved developed reserves |
||||||||||||||||||||||||||||||||||
At 30 June 2015 |
1,1 | 0,3 | 1,1 | 2,5 | 386,8 | 103,7 | 490,5 | 65,5 | 17,6 | 1,1 | 84,2 | |||||||||||||||||||||||
| | | | | | | | | | | | | | | | | | | | | | | | | | | | | | | | | | | |
| | | | | | | | | | | | | | | | | | | | | | | | | | | | | | | | | | | |
| | | | | | | | | | | | | | | | | | | | | | | | | | | | | | | | | | | |
At 30 June 2016 |
2,2 | 0,2 | 0,8 | 3,2 | 738,1 | 107,9 | 846,0 | 125,2 | 18,2 | 0,8 | 144,2 | |||||||||||||||||||||||
| | | | | | | | | | | | | | | | | | | | | | | | | | | | | | | | | | | |
| | | | | | | | | | | | | | | | | | | | | | | | | | | | | | | | | | | |
| | | | | | | | | | | | | | | | | | | | | | | | | | | | | | | | | | | |
At 30 June 2017 |
2,0 | 0,6 | 1,7 | 4,3 | 710,7 | 122,4 | 833,1 | 120,5 | 20,9 | 1,7 | 143,1 | |||||||||||||||||||||||
| | | | | | | | | | | | | | | | | | | | | | | | | | | | | | | | | | | |
| | | | | | | | | | | | | | | | | | | | | | | | | | | | | | | | | | | |
| | | | | | | | | | | | | | | | | | | | | | | | | | | | | | | | | | | |
Proved undeveloped reserves |
||||||||||||||||||||||||||||||||||
At 30 June 2015 |
3,3 | 0,0 | — | 3,3 | 984,3 | 13,1 | 997,4 | 167,4 | 2,2 | — | 169,6 | |||||||||||||||||||||||
| | | | | | | | | | | | | | | | | | | | | | | | | | | | | | | | | | | |
| | | | | | | | | | | | | | | | | | | | | | | | | | | | | | | | | | | |
| | | | | | | | | | | | | | | | | | | | | | | | | | | | | | | | | | | |
At 30 June 2016 |
1,6 | 0,0 | — | 1,6 | 472,4 | 14,8 | 487,2 | 80,3 | 2,5 | — | 82,8 | |||||||||||||||||||||||
| | | | | | | | | | | | | | | | | | | | | | | | | | | | | | | | | | | |
| | | | | | | | | | | | | | | | | | | | | | | | | | | | | | | | | | | |
| | | | | | | | | | | | | | | | | | | | | | | | | | | | | | | | | | | |
At 30 June 2017 |
1,4 | — | — | 1,4 | 429,0 | — | 429,0 | 72,9 | — | — | 72,9 | |||||||||||||||||||||||
| | | | | | | | | | | | | | | | | | | | | | | | | | | | | | | | | | | |
| | | | | | | | | | | | | | | | | | | | | | | | | | | | | | | | | | | |
| | | | | | | | | | | | | | | | | | | | | | | | | | | | | | | | | | | |
- (1)
- 6 000
standard cubic feet of natural gas is equivalent to 1 barrel of oil.
- (2)
- Natural
oil and gas production in Mozambique in 2015, 2016 and 2017 originated from the single operational Pande-Temane PPA field, which comprises more than 15% of
our total proved reserves.
- (3)
- North
America comprises Canada, Rest of Africa comprises Gabon.
- (4)
- Volumes
presented in this table are after deduction of royalty taken in kind.
- (5)
- Revision of (0,6) billion cubic feet in 2016 was incorrectly stated as 0,6 billion cubic feet in Form 20-F of 2016.
G-4
Preparation of Reserve Estimates
To ensure natural oil and gas reserves are appropriately estimated, are accurately disclosed and are compliant with current Securities and Exchange Commission (SEC) regulations and Financial Accounting Standards Board (FASB) requirements, E&PI has established and maintains estimation guidelines, procedures and standards, which are subject to review by suitably experienced independent external consultants, and a set of internal controls, which are in accordance with the requirements of the Sarbanes Oxley Act of 2002. The internal controls cover, amongst other matters, the segregation of duties between the asset teams which provide the necessary data, the corporate reserves team which prepares the reserves estimates, and the corporate authority which is the E&PI executive committee. The controls also include confirmation that the members of the corporate reserves team are appropriately qualified and experienced and that their compensation arrangements are not materially affected by the reserves.
The process includes a review of all estimated future production rates and future capital and operating costs to ensure that the assumptions, data, methods and procedures are appropriate; a review of the technologies used in the estimation process to determine reliability; and arrangements to validate the economic assumptions and to ensure that only accurate, complete and consistent data are used in the estimation of reserves.
The technical person within E&PI who is primarily responsible for overseeing the preparation of natural oil and gas reserves is the E&PI Manager: Corporate Reserves and Resources. The qualifications of the incumbent include a MA and MSc in Mathematics with 38 years' experience in oil and gas exploration and production activities and 29 years' experience in reserves estimation.
The definitions of categories of natural oil and gas reserves used in this disclosure are
consistent with those set forth in the Regulations:
Proved Reserves of oil and gas—Those quantities of oil and gas, which, by analysis of geoscience and engineering data, can be estimated with reasonable certainty to be economically producible—from a given date forward, from known reservoirs under existing economic conditions, operating methods, and government regulations—prior to the time at which contracts providing the right to operate expire, unless evidence indicates that renewal is reasonably certain, regardless of whether deterministic or probabilistic methods are used for the estimation. The project to extract hydrocarbons must be approved and must have commenced or the operator must be reasonably certain that it will commence the project within a reasonable time. Additionally Sasol requires that natural oil and gas reserves will be produced by a "project sanctioned by all internal and external parties".
Existing economic conditions define prices and costs at which economic producibility is to be determined. The price is the average sales price during the 12-month period prior to the ending date of the period covered by the report, determined as an un-weighted arithmetic average of the first-day-of-the-month price for each month within such period, unless prices are defined by contractual arrangements. Future price changes are limited to those provided by contractual arrangements in existence at year-end. At the reporting date, product sales prices were determined by existing contracts for the majority of Sasol's natural oil and gas reserves. Costs comprise development and production expenditure, assessed in real terms, applicable to the reserves class being estimated. Depending upon the status of development proved reserves of oil and gas are subdivided into "Proved Developed Reserves" and "Proved Undeveloped Reserves".
Proved Developed Reserves—Those proved reserves that can be expected to be recovered through existing wells with existing equipment and operating methods (or in which the cost of the required equipment is relatively minor compared to the cost of a new well) and through
G-5
installed extraction equipment and infrastructure operational at the time of the reserves estimate if the extraction is by means not involving a well.
Proved Undeveloped Reserves—Those proved reserves that are expected to be recovered from new wells on undrilled acreage or from existing wells where a relatively major expenditure is required before production can commence.
Definitions of Changes to Proved Reserves
The definitions of the changes to Proved Reserves estimates used in this disclosure are consistent with FASB ASC 932-235-50-5.
TABLE 5—STANDARDISED MEASURE OF DISCOUNTED FUTURE NET CASH FLOWS RELATING TO PROVED RESERVES
The standardised measures of discounted future net cash flows, relating to natural oil and
gas proved reserves for the last three years, are shown in the table below.
| |
Natural oil and gas (Rand in million) | ||||||||||||
|---|---|---|---|---|---|---|---|---|---|---|---|---|---|
| |
Mozambique(1) | North America(1) |
Rest of Africa(1) |
Total | |||||||||
Year ended 30 June 2015 |
|||||||||||||
Future cash inflows |
48 356,0 | 3 908,1 | 1 006,0 | 53 270,1 | |||||||||
Future production costs |
(7 879,1 | ) | (3 122,6 | ) | (1 139,5 | ) | (12 141,2 | ) | |||||
Future development costs |
(6 825,3 | ) | (1 830,4 | ) | (927,9 | ) | (9 583,6 | ) | |||||
Future income taxes |
(11 060,1 | ) | — | (100,4 | ) | (11 160,5 | ) | ||||||
| | | | | | | | | | | | | | |
Undiscounted future net cash flows |
22 591,5 | (1 044,9 | ) | (1 161,8 | ) | 20 384,8 | |||||||
10% annual discount for timing of estimated cash flows |
(9 941,5 | ) | 882,9 | 229,2 | (8 829,4 | ) | |||||||
| | | | | | | | | | | | | | |
Standardised measure of discounted future net cash flows |
12 650,0 | (162,0 | ) | (932,6 | ) | 11 555,4 | |||||||
| | | | | | | | | | | | | | |
| | | | | | | | | | | | | | |
| | | | | | | | | | | | | | |
Year ended 30 June 2016 |
|||||||||||||
Future cash inflows |
31 758,7 | 3 306,5 | 507,5 | 35 572,7 | |||||||||
Future production costs |
(6 445,2 | ) | (3 140,9 | ) | (967,2 | ) | (10 553,3 | ) | |||||
Future development costs |
(7 394,8 | ) | (2 436,4 | ) | (889,7 | ) | (10 720,9 | ) | |||||
Future income taxes |
(6 677,0 | ) | 0,0 | (50,6 | ) | (6 727,6 | ) | ||||||
| | | | | | | | | | | | | | |
Undiscounted future net cash flows |
11 241,7 | (2 270,8 | ) | (1 400,0 | ) | 7 570,9 | |||||||
10% annual discount for timing of estimated cash flows |
(3 797,0 | ) | 1 118,1 | 224,8 | (2 454,1 | ) | |||||||
| | | | | | | | | | | | | | |
Standardised measure of discounted future net cash flows |
7 444,7 | (1 152,7 | ) | (1 175,2 | ) | 5 116,8 | |||||||
| | | | | | | | | | | | | | |
| | | | | | | | | | | | | | |
| | | | | | | | | | | | | | |
Year ended 30 June 2017 |
|||||||||||||
Future cash inflows |
25 803,2 | 3 642,5 | 1 142,7 | 30 588,4 | |||||||||
Future production costs |
(6 764,1 | ) | (2 787,4 | ) | (1 236,9 | ) | (10 788,4 | ) | |||||
Future development costs |
(5 720,9 | ) | (1 613,6 | ) | (595,6 | ) | (7 930,1 | ) | |||||
Future income taxes |
(5 396,4 | ) | — | (111,9 | ) | (5 508,3 | ) | ||||||
| | | | | | | | | | | | | | |
Undiscounted future net cash flows |
7 921,8 | (758,5 | ) | (801,7 | ) | 6 361,6 | |||||||
10% annual discount for timing of estimated cash flows |
(2 534,0 | ) | 620,6 | 213,2 | (1 700,2 | ) | |||||||
| | | | | | | | | | | | | | |
Standardised measure of discounted future net cash flows |
5 387,8 | (137,9 | ) | (588,5 | ) | 4 661,4 | |||||||
| | | | | | | | | | | | | | |
| | | | | | | | | | | | | | |
| | | | | | | | | | | | | | |
- (1)
- North America comprises Canada, Rest of Africa comprises Gabon.
The undiscounted future net cash flows in Canada for our Farrell Creek and Cypress A asset, and in Gabon for our Etame Marin Permit asset, 2015, 2016 and 2017 are negative as a result of future production and development costs, primarily contractually committed costs and asset retirement costs, which are not directly related to future production or dependent upon the continuation of production and will be incurred even in the event of no future production. For both assets these costs are fully responsible for the negative future cash flow.
In Canada, the cost of unused gas transportation capacity is included in production costs. We market the unused capacity on an ad hoc basis and though such marketing has been successful in the past, no future revenue from
G-6
this marketing is included in the calculation of the standardised measure of discounted future net cash flows.
Standardised Measure of Discounted Future Net Cash Flows
The standardised measure of discounted future net cash flows, relating to the proved reserves in the table above, are calculated in accordance with the requirements of FASB ASC Section 932-235. Future cash inflows are computed by applying the prices used in estimating proved reserves to the year-end quantities of those reserves. Future development and production costs are computed by applying the costs used in estimating proved reserves. Future income taxes are computed by applying the appropriate year-end statutory tax rates, with consideration of future tax rates already legislated, to the future pre-tax net cash flows relating to the reserves, less the tax basis of the properties involved. The future income tax expenses therefore give effect to the tax deductions, tax credits and allowances relating to the reserves.
Discounted future net cash flows are the result of subtracting future development and production costs and future income taxes from the cash inflows. A discount rate of 10 percent a year is applied to reflect the timing of the future net cash flows relating to the reserves. The information provided here does not represent management's estimate of the expected future cash flows or value of the properties. Estimates of reserves are imprecise and will change over time as new information becomes available. Moreover probable and possible reserves along with other classes of resources, which may become proved reserves in the future, are excluded from the calculations. The valuation prescribed under FASB ASC Section 932 requires assumptions as to the timing and amount of future development and production costs. The calculations are made as of 30 June each year and should not be relied upon as an indication of the companies' future cash flows or value of natural oil and gas reserves.
TABLE 6—CHANGES IN THE STANDARDISED MEASURE OF DISCOUNTED NET CASH FLOWS
The changes in standardised measure of discounted future net cash flows, relating to the Proved Reserves are shown in the table below.
| |
Natural oil and gas (Rand in millions) | ||||||||||||
|---|---|---|---|---|---|---|---|---|---|---|---|---|---|
| |
Mozambique(1) | North America(2) |
Rest of Africa(2) |
Total | |||||||||
Present value at 30 June 2014 |
13 501,1 | (400,5 | ) | 460,4 | 13 561,0 | ||||||||
Net changes for the year |
(851,1 | ) | 238,5 | (1 393,0 | ) | (2 005,6 | ) | ||||||
Sales and transfers of oil and gas produced net of production costs |
(3 317,7 | ) | (506,8 | ) | (662,0 | ) | (4 486,5 | ) | |||||
Development costs incurred |
853,8 | 2 930,0 | 855,0 | 4 638,8 | |||||||||
Net change due to current reserves estimates from: |
— | ||||||||||||
Improved recovery |
2 208,6 | 291,4 | (381,5 | ) | 2 118,5 | ||||||||
Revisions |
(1 349,3 | ) | 1 118,6 | (771,0 | ) | (1 001,7 | ) | ||||||
Net changes in prices and costs related to future production |
(5 216,4 | ) | (440,7 | ) | (1 052,6 | ) | (6 709,7 | ) | |||||
Changes in estimated future development costs |
(14,9 | ) | (3 114,3 | ) | (102,2 | ) | (3 231,4 | ) | |||||
Accretion of discount |
1 987,5 | (40,1 | ) | 100,7 | 2 048,1 | ||||||||
Net change in income tax |
769,6 | — | 457,2 | 1 226,8 | |||||||||
Net change due to exchange rate |
3 227,7 | 0,4 | 163,4 | 3 391,5 | |||||||||
Present value at 30 June 2015 |
12 650,0 | (162,0 | ) | (932,6 | ) | 11 555,4 | |||||||
| | | | | | | | | | | | | | |
| | | | | | | | | | | | | | |
| | | | | | | | | | | | | | |
Net changes for the year |
(5 205,3 | ) | (990,7 | ) | (242,6 | ) | (6 438,6 | ) | |||||
Sales and transfers of oil and gas produced net of production costs |
(2 394,0 | ) | (521,5 | ) | (209,1 | ) | (3 124,6 | ) | |||||
Development costs incurred |
637,7 | 2 205,9 | 570,6 | 3 414,2 | |||||||||
Net change due to current reserves estimates from: |
— | ||||||||||||
(Reduced)/improved recovery |
(88,3 | ) | 182,0 | 213,5 | 307,2 | ||||||||
Revisions |
697,7 | 333,9 | 501,8 | 1 533,4 | |||||||||
Net changes in prices and costs related to future production |
(11 445,5 | ) | (580,1 | ) | (739,3 | ) | (12 764,9 | ) | |||||
Changes in estimated future development costs |
(213,1 | ) | (2 565,8 | ) | (354,1 | ) | (3 133,0 | ) | |||||
Accretion of discount |
1 825,4 | (16,2 | ) | (84,3 | ) | 1 724,9 | |||||||
Net change in income tax |
1 775,2 | 0,0 | 43,1 | 1 818,3 | |||||||||
Net change due to exchange rate |
3 999,6 | (28,9 | ) | (184,8 | ) | 3 785,9 | |||||||
Present value at 30 June 2016 |
7 444,7 | (1 152,7 | ) | (1 175,2 | ) | 5 116,8 | |||||||
| | | | | | | | | | | | | | |
| | | | | | | | | | | | | | |
| | | | | | | | | | | | | | |
Net changes for the year |
(2 056,9 | ) | 1 014,8 | 586,7 | (455,4 | ) | |||||||
Sales and transfers of oil and gas produced net of production costs |
(2 141,9 | ) | (434,5 | ) | (375,9 | ) | (2 952,3 | ) | |||||
Development costs incurred |
267,0 | 499,9 | 35,7 | 802,6 | |||||||||
Net change due to current reserves estimates from: |
— | ||||||||||||
(Reduced)/improved recovery |
(822,0 | ) | — | 15,1 | (806,9 | ) | |||||||
Revisions |
1 324,8 | 434,2 | 1 204,4 | 2 963,4 | |||||||||
Net changes in prices and costs related to future production |
(1 232,1 | ) | 413,3 | (530,9 | ) | (1 349,7 | ) | ||||||
Changes in estimated future development costs |
289,2 | 71,5 | 261,7 | 622,4 | |||||||||
Accretion of discount |
1 127,4 | (115,3 | ) | (112,9 | ) | 899,2 | |||||||
Net change in income tax |
522,1 | — | (49,9 | ) | 472,2 | ||||||||
Net change due to exchange rate |
(1 391,4 | ) | 145,7 | 139,4 | (1 106,3 | ) | |||||||
Present value at 30 June 2017 |
5 387,8 | (137,9 | ) | (588,5 | ) | 4 661,4 | |||||||
| | | | | | | | | | | | | | |
| | | | | | | | | | | | | | |
| | | | | | | | | | | | | | |
- (1)
- Mozambique
values for 2014 have been recalculated in 2015.
- (2)
- North America comprises Canada, Rest of Africa comprises Gabon.
G-7
SYNTHETIC OIL
TABLE 1—COSTS INCURRED FOR PROPERTY ACQUISITION, EXPLORATION, AND DEVELOPMENT ACTIVITIES
The table below provides the costs incurred during the year in synthetic oil property acquisition, exploration and development activities, whether capitalised or charged to income currently.
| |
Synthetic oil—South Africa | |||||||||
|---|---|---|---|---|---|---|---|---|---|---|
Year ended 30 June
|
2017 | 2016 | 2015 | |||||||
Acquisition of proved properties |
0,1 | 11,8 | 174,4 | |||||||
Exploration |
129,8 | 154,3 | 148,0 | |||||||
Development |
2 063,8 | 3 014,4 | 4 729,7 | |||||||
| | | | | | | | | | | |
Total costs incurred |
2 193,7 | 3 180,5 | 5 052,1 | |||||||
| | | | | | | | | | | |
| | | | | | | | | | | |
| | | | | | | | | | | |
TABLE 2—CAPITALISED COSTS RELATING TO SYNTHETIC OIL ACTIVITIES
The table below summarises the aggregate amount of property, plant and equipment and intangible assets relating to synthetic oil and production activities, and the aggregate amount of the related depreciation and amortisation.
| |
|
Synthetic oil—South Africa | |
||||||||||
|---|---|---|---|---|---|---|---|---|---|---|---|---|---|
Year ended 30 June
|
|
2017 | 2016 | 2015 | |
||||||||
Proved properties |
91 872,4 | 85 985,0 | 78 711,2 | ||||||||||
| | | | | | | | | | | | | | |
Producing wells and equipment |
91 872,4 | 85 985,0 | 71 191,5 | ||||||||||
Non-producing wells and equipment |
— | — | 7 519,7 | ||||||||||
Unproved properties |
— | — | — | ||||||||||
| | | | | | | | | | | | | | |
Capitalised costs |
91 872,4 | 85 985,0 | 78 711,2 | ||||||||||
Accumulated depreciation |
(28 936,4 | ) | (26 027,6 | ) | (22 853,3 | ) | |||||||
| | | | | | | | | | | | | | |
Net book value |
62 936,0 | 59 957,4 | 55 857,9 | ||||||||||
| | | | | | | | | | | | | | |
| | | | | | | | | | | | | | |
| | | | | | | | | | | | | | |
TABLE 3—RESULTS OF OPERATIONS FOR OIL AND GAS PRODUCING ACTIVITIES
The results of operations for synthetic oil activities are summarised in the table below.
| |
Synthetic oil—South Africa | |||||||||
|---|---|---|---|---|---|---|---|---|---|---|
Year ended 30 June
|
2017 | 2016 | 2015 | |||||||
Sales to unaffiliated parties |
— | — | — | |||||||
Transfers to affiliated parties |
35 659,7 | 33 428,4 | 45 709,4 | |||||||
| | | | | | | | | | | |
Total revenues |
35 659,7 | 33 428,4 | 45 709,4 | |||||||
Production costs |
(18 507,5 | ) | (18 557,3 | ) | (14 543,2 | ) | ||||
Foreign currency translation gains / (losses) |
7,2 | 8,6 | (11,1 | ) | ||||||
Exploration expenses |
(28,0 | ) | (47,0 | ) | (45,0 | ) | ||||
Depreciation |
(6 088,1 | ) | (5 395,0 | ) | (4 511,8 | ) | ||||
| | | | | | | | | | | |
Operating profit/(loss) |
11 043,3 | 9 437,7 | 26 598,3 | |||||||
Tax |
(1 967,9 | ) | (2 600,2 | ) | (6 954,4 | ) | ||||
| | | | | | | | | | | |
Results of operations |
9 075,4 | 6 837,5 | 19 643,9 | |||||||
| | | | | | | | | | | |
| | | | | | | | | | | |
| | | | | | | | | | | |
TABLE 4—PROVED RESERVE QUANTITY INFORMATION
Proved Reserves
The table below summarises proved developed and proved undeveloped reserves of synthetic oil as at 30 June 2017, for the last three years. As at 30 June 2017, the total proved reserve estimate for synthetic oil is 980,5 million barrels in oil equivalent terms.
| |
Synthetic oil—South Africa | |||||||||
|---|---|---|---|---|---|---|---|---|---|---|
| |
2017 | 2016 | 2015 | |||||||
Opening balance |
990,9 | 1 042,5 | 680,7 | |||||||
Revisions |
30,9 | — | 413,6 | |||||||
Recovery/ (loss) |
— | — | — | |||||||
Production |
(41,3 | ) | (51,6 | ) | (51,8 | ) | ||||
| | | | | | | | | | | |
Balance at 30 June |
980,5 | 990,9 | 1 042,5 | |||||||
| | | | | | | | | | | |
Proved developed reserves |
980,5 | 990,9 | 1 042,5 | |||||||
| | | | | | | | | | | |
Proved undeveloped reserves |
— | — | — | |||||||
| | | | | | | | | | | |
| | | | | | | | | | | |
| | | | | | | | | | | |
G-8
TABLE 5—STANDARDISED MEASURE OF DISCOUNTED FUTURE NET CASH FLOWS RELATING TO PROVED RESERVES
| |
Synthetic oil—South Africa | |||||||||
|---|---|---|---|---|---|---|---|---|---|---|
Year ended 30 June
|
2017 | 2016 | 2015(1) | |||||||
Future cash inflows |
670 163,5 | 630 028,9 | 906 161,1 | |||||||
Future production costs |
(373 987,5 | ) | (341 767,1 | ) | (346 619,9 | ) | ||||
Future development costs |
(199 417,2 | ) | (183 888,3 | ) | (181 021,4 | ) | ||||
Future income taxes |
(38 109,1 | ) | (36 878,3 | ) | (114 069,6 | ) | ||||
| | | | | | | | | | | |
Undiscounted future net cash flows |
58 649,7 | 67 495,2 | 264 450,3 | |||||||
10% annual discount for timing of estimated cash flows |
(40 504,8 | ) | (43 046,6 | ) | (160 169,1 | ) | ||||
| | | | | | | | | | | |
Standardised measure of discounted future net cash flows |
18 144,9 | 24 448,6 | 104 281,2 | |||||||
| | | | | | | | | | | |
| | | | | | | | | | | |
| | | | | | | | | | | |
- (1)
- Standardised measure of discounted future net cash flows at 30 June 2015 has been restated to correct the allocation of future development costs. In 2015, the useful life of Secunda Synfuels Operations was extended to 2050, which exceeded the quantities of the proved coal reserves. The future development costs are now allocated in line with proved coal reserves and not on total synthetic oil production as used previously.
The standardised measure of discounted future net cash flows, relating to the proved reserves in the table above, are calculated in accordance with the requirements of FASB ASC Section 932-235.
TABLE 6—CHANGES IN THE STANDARDISED MEASURE OF DISCOUNTED NET CASH FLOWS
| |
|
Synthetic oil—South Africa | |
||||||||||
|---|---|---|---|---|---|---|---|---|---|---|---|---|---|
| |
|
2017 | 2016 | 2015(1) | |
||||||||
Present value—opening balance |
24 448,7 | 104 281,2 | 162 843,1 | ||||||||||
Net changes for the year |
(6 303,9 | ) | (79 832,5 | ) | (58 562,1 | ) | |||||||
| | | | | | | | | | | | | | |
Sales and transfers of oil and gas produced net of production costs |
(17 152,2 | ) | (14 871,2 | ) | (31 166,1 | ) | |||||||
Development costs incurred |
9 339,9 | 9 367,1 | 11 369,9 | ||||||||||
Net change due to current reserves estimates from: |
|||||||||||||
Improved recovery |
— | — | — | ||||||||||
Commercial arrangements |
— | — | — | ||||||||||
Revisions |
1 695,3 | 3 527,6 | 30 491,1 | ||||||||||
Net changes in prices and costs related to future production |
21 021,7 | (173 986,8 | ) | (123 966,6 | ) | ||||||||
Changes in estimated future development costs |
(11 616,0 | ) | (8 348,0 | ) | (20 968,8 | ) | |||||||
Accretion of discount |
2 195,5 | 9 441,1 | 14 599,3 | ||||||||||
Net change in income tax |
2 355,0 | 35 442,4 | 28 759,1 | ||||||||||
Net change due to exchange rate |
(14 143,1 | ) | 59 595,3 | 32 320,0 | |||||||||
| | | | | | | | | | | | | | |
Present value at 30 June |
18 144,8 | 24 448,7 | 104 281,0 | ||||||||||
| | | | | | | | | | | | | | |
| | | | | | | | | | | | | | |
| | | | | | | | | | | | | | |
- (1)
- Standardised measure of discounted future net cash flows at 30 June 2015 has been restated to correct the allocation of future development costs. In 2015, the useful life of Secunda Synfuels Operations was extended to 2050, which exceeded the quantities of the proved coal reserves. The future development costs are now allocated in line with proved coal reserves and not on total synthetic oil production as used previously.
Standardised Measure of Discounted Future Net Cash Flows
The standardised measure of discounted future net cash flows, relating to the proved reserves in the table above, are calculated in accordance with the requirements of FASB ASC Section 932-235. Future cash inflows are computed by applying the prices used in estimating proved reserves to the year-end quantities of those reserves. Future development and production costs are computed by applying the costs used in estimating proved reserves. Future income taxes are computed by applying the appropriate year-end statutory tax rates, with consideration of future tax rates already legislated, to the future pre-tax net cash flows relating to the reserves, less the tax basis of the properties involved. The future income tax expenses therefore give effect to the tax deductions, tax credits and allowances relating to the reserves.
G-9
Discounted future net cash flows are the result of subtracting future development and production costs and future income taxes from the cash inflows. A discount rate of 10 percent a year is applied to reflect the timing of the future net cash flows relating to the reserves. The information provided here does not represent management's estimate of the expected future cash flows or value of the properties. Estimates of reserves are imprecise and will change over time as new information becomes available. Moreover probable and possible reserves along with other classes of resources, which may become proved reserves in the future, are excluded from the calculations. The valuation prescribed under FASB ASC Section 932 requires assumptions as to the timing and amount of future development and production costs. The calculations are made as of 30 June each year and should not be relied upon as an indication of the companies' future cash flows or value of synthetic oil reserves.
G-10
| 1.1 | Memorandum of incorporation of Sasol Limited | ||
2.1 |
The amount of long-term debt securities issued by Sasol Limited and its subsidiaries authorised under any given instrument does not exceed 10% of the total assets of Sasol Limited and its subsidiaries on a consolidated basis. Sasol Limited hereby agrees to furnish to the SEC a copy of any such instrument upon its request. |
||
4.1 |
Management Share Incentive Scheme** |
||
4.2 |
The Deed of Trust for the Sasol Inzalo Management Trust* |
||
4.3 |
The Deed of Trust for the Sasol Inzalo Employee Scheme* |
||
8.1 |
List of subsidiaries |
||
12.1 |
Certification of Bongani Nqwababa and Stephen Russell Cornell, Joint Presidents and Chief Executive Officers of Sasol Limited pursuant of Section 302 of the Sarbanes-Oxley Act of 2002. |
||
12.2 |
Certification of Paul Victor, Chief Financial Officer of Sasol Limited pursuant of Section 302 of the Sarbanes-Oxley Act of 2002. |
||
13.1 |
Certification of Bongani Nqwababa and Stephen Russell Cornell, Joint Presidents and Chief Executive Officers of Sasol Limited and Paul Victor, Chief Financial Officer of Sasol Limited pursuant to 18 U.S.C. Section 1350, as adopted pursuant to Section 906 of the Sarbanes-Oxley Act of 2002. |
||
13.2 |
Certification of Bongani Nqwababa and Stephen Russell Cornell, Joint Presidents and Chief Executive Officers of Sasol Limited and Paul Victor, Chief Financial Officer of Sasol Limited pursuant to Rule 13a-15(f) under the Securities Exchange Act of 1934, as adopted pursuant to Section 404 of the Sarbanes- Oxley Act of 2002. |
||
15.2 |
Consent of independent registered public accounting firm—PwC |
||
99.1 |
Sasol Limited Consolidated Annual Financial Statements |
||
99.2 |
Sasol Limited Remuneration Report |
||
99.3 |
CFO Report |
||
99.4 |
Our Operating Model Structure |
||
99.5 |
Integrated Report—Our strategy |
||
99.6 |
Integrated Report—Our integrated value chain |
||
99.7 |
Integrated Report—Operational reviews |
||
99.8 |
Information about our board of directors and senior management |
||
99.9 |
Integrated Report—Our governance framework |
||
99.9.1 |
Sasol Limited Board Charter |
||
99.9.2 |
Terms of reference—Audit Committee and Remuneration Committee |
- *
- Incorporated
by reference to our annual report on Form 20-F filed on 7 October 2008.
- **
- Incorporated by reference to our registration statement on Form 20-F filed on 6 March 2003.
H-1
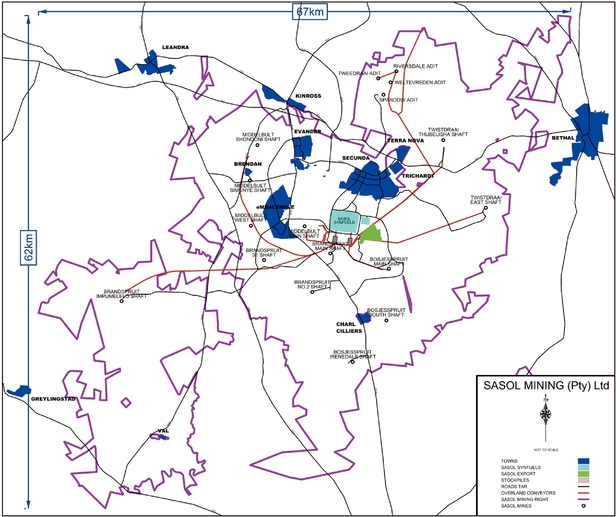
M-1
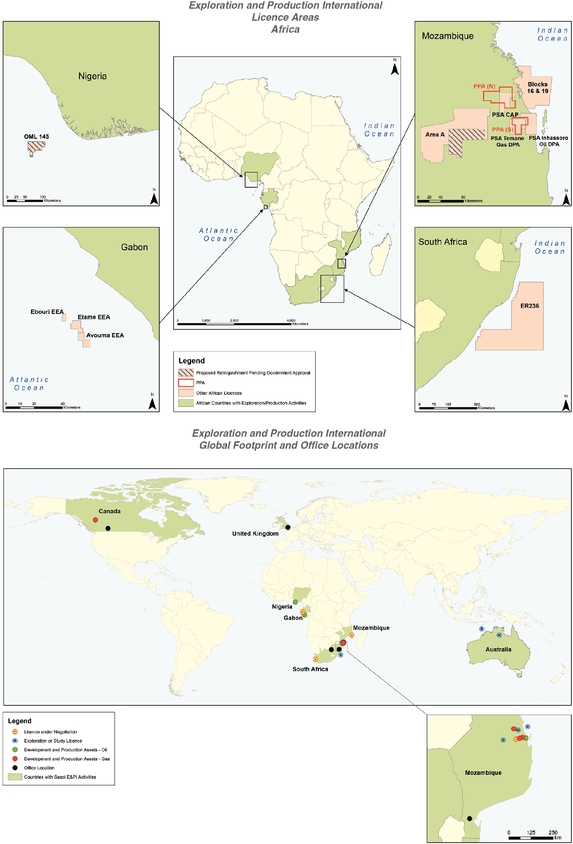
M-2