| Label |
Element |
Value |
| Risk/Return: |
rr_RiskReturnAbstract |
|
|
| Registrant Name |
dei_EntityRegistrantName |
JANUS INVESTMENT FUND |
|
| Prospectus Date |
rr_ProspectusDate |
Jan. 28,
2013 |
|
|
Janus Forty Fund | Class A, C, S, I, N, R, T Shares
|
|
|
|
| Risk/Return: |
rr_RiskReturnAbstract |
|
|
| Risk/Return [Heading] |
rr_RiskReturnHeading |
FUND SUMMARY
Janus Forty Fund |
|
| Objective [Heading] |
rr_ObjectiveHeading |
INVESTMENT OBJECTIVE |
|
| Objective, Primary [Text Block] |
rr_ObjectivePrimaryTextBlock |
Janus Forty Fund seeks long-term growth of capital. |
|
| Expense [Heading] |
rr_ExpenseHeading |
FEES AND EXPENSES OF THE FUND |
|
| Expense Narrative [Text Block] |
rr_ExpenseNarrativeTextBlock |
This table describes the fees and expenses that you may pay if you buy and hold Shares of the Fund. Each share class has different expenses, but represents an investment in the same Fund. |
|
| Shareholder Fees Caption [Text] |
rr_ShareholderFeesCaption |
SHAREHOLDER FEES
(fees paid directly from your investment) |
|
| Operating Expenses Caption [Text] |
rr_OperatingExpensesCaption |
ANNUAL FUND OPERATING EXPENSES
(expenses that you pay each year as a percentage of the value of your investment) |
|
| Portfolio Turnover [Heading] |
rr_PortfolioTurnoverHeading |
Portfolio Turnover: |
|
| Portfolio Turnover [Text Block] |
rr_PortfolioTurnoverTextBlock |
The Fund pays transaction costs, such as commissions, when it buys and sells securities (or “turns over” its portfolio). A higher portfolio turnover rate may indicate higher transaction costs and may result in higher taxes when Fund shares are held in a taxable account. These costs, which are not reflected in annual fund operating expenses or in the Example, affect the Fund’s performance. During the most recent fiscal year, the Fund’s portfolio turnover rate was 9% of the average value of its portfolio. |
|
| Portfolio Turnover, Rate |
rr_PortfolioTurnoverRate |
9.00% |
|
| Expense Breakpoint Discounts [Text] |
rr_ExpenseBreakpointDiscounts |
For Class A Shares, you may qualify for sales charge discounts if you and your family invest, or agree to invest in the future, at least $50,000 in the Fund or in other Janus mutual funds. More information about these and other discounts, as well as eligibility requirements for each share class, is available from your financial professional and in the “Purchases” section on page 85 of the Fund’s Prospectus and in the “Purchases” section on page 89 of the Fund’s Statement of Additional Information. |
|
| Expense Breakpoint, Minimum Investment Required [Amount] |
rr_ExpenseBreakpointMinimumInvestmentRequiredAmount |
50,000 |
|
| Expense Example [Heading] |
rr_ExpenseExampleHeading |
EXAMPLE: |
|
| Expense Example by Year [Heading] |
rr_ExpenseExampleByYearHeading |
The Example assumes that you invest $10,000 in the Fund for the time periods indicated and reinvest all dividends and distributions. The Example also assumes that your investment has a 5% return each year and that the Fund’s operating expenses remain the same. Although your actual costs may be higher or lower, based on these assumptions your costs would be: |
|
| Expense Example Narrative [Text Block] |
rr_ExpenseExampleNarrativeTextBlock |
The Example is intended to help you compare the cost of investing in the Fund with the cost of investing in other mutual funds. |
|
| Expense Example by, Year, Caption [Text] |
rr_ExpenseExampleByYearCaption |
If Shares are redeemed: |
|
| Expense Example, No Redemption, By Year, Caption [Text] |
rr_ExpenseExampleNoRedemptionByYearCaption |
If Shares are not redeemed: |
|
| Strategy [Heading] |
rr_StrategyHeading |
PRINCIPAL INVESTMENT STRATEGIES |
|
| Strategy Narrative [Text Block] |
rr_StrategyNarrativeTextBlock |
The Fund pursues its investment objective by normally investing primarily in a core group of 20-40 common stocks selected for their growth potential. The Fund may invest in companies of any size, from larger, well-established companies to smaller, emerging growth companies. The Fund may also invest in foreign equity and debt securities, which may include investments in emerging markets.
The portfolio manager applies a “bottom up” approach in choosing investments. In other words, the portfolio manager looks at companies one at a time to determine if a company is an attractive investment opportunity and if it is consistent with the Fund’s investment policies. |
|
| Risk [Heading] |
rr_RiskHeading |
PRINCIPAL INVESTMENT RISKS |
|
| Risk Narrative [Text Block] |
rr_RiskNarrativeTextBlock |
The biggest risk is that the Fund’s returns will vary, and you could lose money. The Fund is designed for long-term investors seeking an equity portfolio, including common stocks. Common stocks tend to be more volatile than many other investment choices.
Market Risk. The value of the Fund’s portfolio may decrease if the value of an individual company or security, or multiple companies or securities, in the portfolio decreases or if the portfolio manager’s belief about a company’s intrinsic worth is incorrect. Further, regardless of how well individual companies or securities perform, the value of the Fund’s portfolio could also decrease if there are deteriorating economic or market conditions. It is important to understand that the value of your investment may fall, sometimes sharply, in response to changes in the market, and you could lose money.
Growth Securities Risk. The Fund invests in companies after assessing their growth potential. Securities of companies perceived to be “growth” companies may be more volatile than other stocks and may involve special risks. If the portfolio manager’s perception of a company’s growth potential is not realized, the securities purchased may not perform as expected, reducing the Fund’s returns. In addition, because different types of stocks tend to shift in and out of favor depending on market and economic conditions, “growth” stocks may perform differently from the market as a whole and other types of securities.
Nondiversification Risk. The Fund is classified as nondiversified under the Investment Company Act of 1940, as amended. This gives the Fund’s portfolio manager more flexibility to hold larger positions in a smaller number of securities. As a result, an increase or decrease in the value of a single security held by the Fund may have a greater impact on the Fund’s net asset value and total return.
Foreign Exposure Risk. The Fund may have significant exposure to foreign markets as a result of its investments in foreign securities, including investments in emerging markets, which can be more volatile than the U.S. markets. As a result, its returns and net asset value may be affected to a large degree by fluctuations in currency exchange rates or political or economic conditions in a particular country. In some foreign markets, there may not be protection against failure by other parties to complete transactions. It may not be possible for the Fund to repatriate capital, dividends, interest, and other income from a particular country or governmental entity. In addition, a market swing in one or more countries or regions where the Fund has invested a significant amount of its assets may have a greater effect on the Fund’s performance than it would in a more geographically diversified portfolio.
Derivatives Risk. Derivatives can be highly volatile and involve risks in addition to the risks of the underlying referenced securities. Gains or losses from a derivative can be substantially greater than the derivative’s original cost, and can therefore involve leverage. Derivatives can be less liquid than other types of investments and entail the risk that the counterparty will default on its payment obligations.
An investment in the Fund is not a bank deposit and is not insured or guaranteed by the Federal Deposit Insurance Corporation or any other government agency. |
|
| Risk Lose Money [Text] |
rr_RiskLoseMoney |
The biggest risk is that the Fund’s returns will vary, and you could lose money. |
|
| Risk Nondiversified Status [Text] |
rr_RiskNondiversifiedStatus |
Nondiversification Risk. The Fund is classified as nondiversified under the Investment Company Act of 1940, as amended. This gives the Fund’s portfolio manager more flexibility to hold larger positions in a smaller number of securities. As a result, an increase or decrease in the value of a single security held by the Fund may have a greater impact on the Fund’s net asset value and total return. |
|
| Risk Not Insured Depository Institution [Text] |
rr_RiskNotInsuredDepositoryInstitution |
An investment in the Fund is not a bank deposit and is not insured or guaranteed by the Federal Deposit Insurance Corporation or any other government agency. |
|
| Bar Chart and Performance Table [Heading] |
rr_BarChartAndPerformanceTableHeading |
PERFORMANCE INFORMATION |
|
| Performance Narrative [Text Block] |
rr_PerformanceNarrativeTextBlock |
The following information provides some indication of the risks of investing in the Fund by showing how the Fund’s performance has varied over time. Class S Shares, Class A Shares, Class C Shares, Class I Shares, and Class R Shares of the Fund commenced operations on July 6, 2009, after the reorganization of each corresponding class of shares of Janus Adviser Forty Fund (“JAD predecessor fund”) into each respective share class of the Fund. Class T Shares of the Fund commenced operations on July 6, 2009. Class N Shares of the Fund commenced operations on May 31, 2012. - The performance shown for Class S Shares reflects the performance of the JAD predecessor fund’s Class S Shares (formerly named Class I Shares) from August 1, 2000 to July 6, 2009 (prior to the reorganization), calculated using the fees and expenses of Class S Shares of the JAD predecessor fund, net of any applicable fee and expense limitations or waivers. For the periods prior to August 1, 2000, the performance shown for Class S Shares reflects the historical performance of the Retirement Shares of Janus Aspen Series – Forty Portfolio (as a result of a separate prior reorganization of those Retirement Shares into the JAD predecessor fund). The performance shown for certain periods prior to August 1, 2000 was calculated using the fees and expenses of Class S Shares of the JAD predecessor fund, without the effect of any fee and expense limitations or waivers.
- The performance shown for Class A Shares reflects the performance of the JAD predecessor fund’s Class A Shares from September 30, 2004 to July 6, 2009 (prior to the reorganization), calculated using the fees and expenses of Class A Shares of the JAD predecessor fund, net of any applicable fee and expense limitations or waivers. For the periods August 1, 2000 to September 30, 2004, the performance shown for Class A Shares reflects the historical performance of the JAD predecessor fund’s Class S Shares (formerly named Class I Shares). For the periods prior to August 1, 2000, the performance shown for Class A Shares reflects the historical performance of the Retirement Shares of Janus Aspen Series – Forty Portfolio (as a result of a separate prior reorganization of those Retirement Shares into the JAD predecessor fund). The performance shown for certain periods prior to September 30, 2004 was calculated using the fees and expenses of Class S Shares of the JAD predecessor fund, without the effect of any fee and expense limitations or waivers.
- The performance shown for Class C Shares reflects the performance of the JAD predecessor fund’s Class C Shares from September 30, 2002 to July 6, 2009 (prior to the reorganization), calculated using the fees and expenses of Class C Shares of the JAD predecessor fund, net of any applicable fee and expense limitations or waivers. For the periods August 1, 2000 to September 30, 2002, the performance shown for Class C Shares reflects the historical performance of the JAD predecessor fund’s Class S Shares (formerly named Class I Shares). For the periods prior to August 1, 2000, the performance shown for Class C Shares reflects the historical performance of the Retirement Shares of Janus Aspen Series – Forty Portfolio (as a result of a separate prior reorganization of those Retirement Shares into the JAD predecessor fund). The performance shown for certain periods prior to September 30, 2002 was calculated using the fees and expenses of Class S Shares of the JAD predecessor fund, without the effect of any fee and expense limitations or waivers.
- The performance shown for Class I Shares reflects the performance of the JAD predecessor fund’s Class I Shares from November 28, 2005 to July 6, 2009 (prior to the reorganization), calculated using the fees and expenses of Class I Shares of the JAD predecessor fund, net of any applicable fee and expense limitations or waivers. For the periods August 1, 2000 to November 28, 2005, the performance shown for Class I Shares reflects the historical performance of the JAD predecessor fund’s Class S Shares (formerly named Class I Shares). For the periods prior to August 1, 2000, the performance shown for Class I Shares reflects the historical performance of the Retirement Shares of Janus Aspen Series – Forty Portfolio (as a result of a separate prior reorganization of those Retirement Shares into the JAD predecessor fund). The performance shown for certain periods prior to November 28, 2005 was calculated using the fees and expenses of Class S Shares of the JAD predecessor fund, without the effect of any fee and expense limitations or waivers.
- The performance shown for Class N Shares reflects the performance of the Fund’s Class S Shares from July 6, 2009 to May 31, 2012, calculated using the fees and expenses of Class S Shares, net of any applicable fee and expense limitations or waivers. For the period from August 1, 2000 to July 6, 2009, the performance shown for Class N Shares reflects the performance of Class S Shares (formerly named Class I Shares) of the JAD predecessor fund (prior to the reorganization of those Class S Shares into the Fund), calculated using the fees and expenses of Class S Shares of the JAD predecessor fund, net of any applicable fee and expense limitations or waivers. For the periods prior to August 1, 2000, the performance shown for Class N Shares reflects the historical performance of the Retirement Shares of Janus Aspen Series – Forty Portfolio (as a result of a separate prior reorganization of those Retirement Shares into the JAD predecessor fund). The performance for certain periods prior to August 1, 2000 was calculated using the fees and expenses of Class S Shares of the JAD predecessor fund, without the effect of any fee and expense limitations or waivers.
- The performance shown for Class R Shares reflects the performance of the JAD predecessor fund’s Class R Shares from September 30, 2004 to July 6, 2009 (prior to the reorganization), calculated using the fees and expenses of Class R Shares of the JAD predecessor fund, net of any applicable fee and expense limitations or waivers. For the periods August 1, 2000 to September 30, 2004, the performance shown for Class R Shares reflects the historical performance of the JAD predecessor fund’s Class S Shares (formerly named Class I Shares). For the periods prior to August 1, 2000, the performance shown for Class R Shares reflects the historical performance of the Retirement Shares of Janus Aspen Series – Forty Portfolio (as a result of a separate prior reorganization of those Retirement Shares into the JAD predecessor fund). The performance shown for certain periods prior to September 30, 2004 was calculated using the fees and expenses of Class R Shares of the JAD predecessor fund, without the effect of any fee and expense limitations or waivers.
- The performance shown for Class T Shares reflects the performance of the JAD predecessor fund’s Class S Shares (formerly named Class I Shares) from August 1, 2000 to July 6, 2009 (prior to the reorganization), calculated using the fees and expenses of Class S Shares of the JAD predecessor fund, net of any applicable fee and expense limitations or waivers. For the periods prior to August 1, 2000, the performance shown for Class T Shares reflects the historical performance of the Retirement Shares of Janus Aspen Series – Forty Portfolio (as a result of a separate prior reorganization of those Retirement Shares into the JAD predecessor fund). The performance shown for certain periods prior to August 1, 2000 was calculated using the fees and expenses of Class S Shares of the JAD predecessor fund, without the effect of any fee and expense limitations or waivers.
If Class A Shares, Class C Shares, Class I Shares, Class R Shares, and Class T Shares of the Fund had been available during each period prior to July 6, 2009, or Class N Shares of the Fund had been available during periods prior to May 31, 2012, the performance shown for each respective share class may have been different. The performance shown for periods following the Fund’s commencement of Class S Shares, Class A Shares, Class C Shares, Class I Shares, Class N Shares, Class R Shares, and Class T Shares reflects the fees and expenses of each respective share class, net of any applicable fee and expense limitations or waivers.
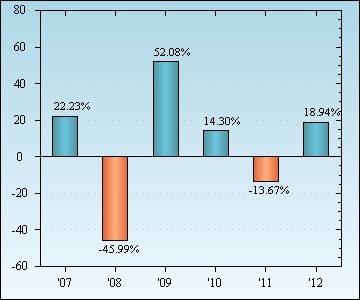
The bar chart depicts the change in performance from year to year during the periods indicated. The bar chart figures do not include any applicable sales charges that an investor may pay when they buy or sell Class A Shares or Class C Shares of the Fund. If sales charges were included, the returns would be lower. The table compares the Fund’s average annual returns for the periods indicated to broad-based securities market indices. The indices are not actively managed and are not available for direct investment. All figures assume reinvestment of dividends and distributions. For certain periods, the Fund’s performance reflects the effect of expense waivers. Without the effect of these expense waivers, the performance shown would have been lower.
The Fund’s past performance (before and after taxes) does not necessarily indicate how it will perform in the future. Updated performance information is available at janus.com/advisor/mutual-funds or by calling 1-877-335-2687. |
|
| Performance Information Illustrates Variability of Returns [Text] |
rr_PerformanceInformationIllustratesVariabilityOfReturns |
The following information provides some indication of the risks of investing in the Fund by showing how the Fund’s performance has varied over time.
The bar chart depicts the change in performance from year to year during the periods indicated. |
|
| Performance Additional Market Index [Text] |
rr_PerformanceAdditionalMarketIndex |
The table compares the Fund’s average annual returns for the periods indicated to broad-based securities market indices. The indices are not actively managed and are not available for direct investment. All figures assume reinvestment of dividends and distributions. |
|
| Performance Availability Phone [Text] |
rr_PerformanceAvailabilityPhone |
1-877-335-2687 |
|
| Performance Availability Website Address [Text] |
rr_PerformanceAvailabilityWebSiteAddress |
janus.com/advisor/mutual-funds |
|
| Performance Past Does Not Indicate Future [Text] |
rr_PerformancePastDoesNotIndicateFuture |
The Fund’s past performance (before and after taxes) does not necessarily indicate how it will perform in the future. |
|
| Bar Chart [Heading] |
rr_BarChartHeading |
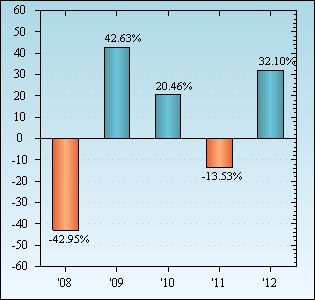
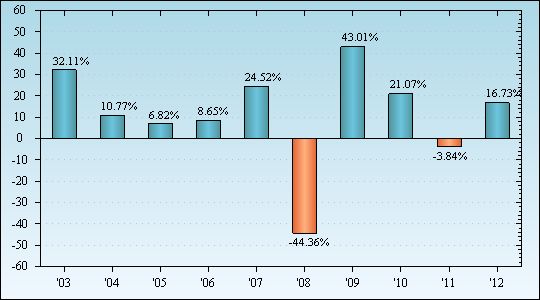
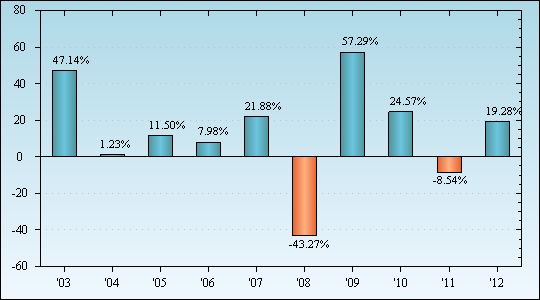
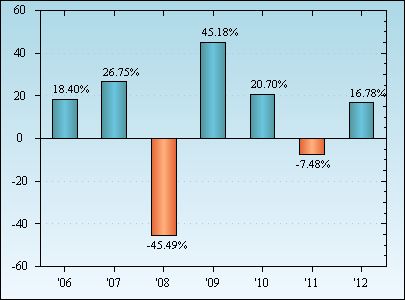
Annual Total Returns for Class S Shares (calendar year-end) |
|
| Bar Chart Does Not Reflect Sales Loads [Text] |
rr_BarChartDoesNotReflectSalesLoads |
The bar chart figures do not include any applicable sales charges that an investor may pay when they buy or sell Class A Shares or Class C Shares of the Fund. If sales charges were included, the returns would be lower. |
|
| Bar Chart Closing [Text Block] |
rr_BarChartClosingTextBlock |
Best Quarter: Second Quarter 2009 20.90% Worst Quarter: Fourth Quarter 2008 −25.11% |
|
| Performance Table Heading |
rr_PerformanceTableHeading |
Average Annual Total Returns (periods ended 12/31/12) |
|
| Performance Table Uses Highest Federal Rate |
rr_PerformanceTableUsesHighestFederalRate |
After-tax returns are calculated using the historically highest individual federal marginal income tax rates and do not reflect the impact of state and local taxes. |
|
| Performance Table Not Relevant to Tax Deferred |
rr_PerformanceTableNotRelevantToTaxDeferred |
Actual after-tax returns depend on your individual tax situation and may differ from those shown in the preceding table. The after-tax return information shown above does not apply to Fund shares held through a tax-deferred account, such as a 401(k) plan or an IRA. |
|
| Performance Table One Class of after Tax Shown [Text] |
rr_PerformanceTableOneClassOfAfterTaxShown |
After-tax returns are only shown for Class S Shares of the Fund. After-tax returns for the other classes of Shares will vary from those shown for Class S Shares due to varying sales charges (as applicable), fees, and expenses among the classes. |
|
| Performance Table Explanation after Tax Higher |
rr_PerformanceTableExplanationAfterTaxHigher |
If the Fund incurs a loss, which generates a tax benefit, the Return After Taxes on Distributions and Sale of Fund Shares may exceed the Fund’s other return figures. |
|
| Performance Table Narrative |
rr_PerformanceTableNarrativeTextBlock |
The Russell 1000® Growth Index measures the performance of those Russell 1000® companies with higher price-to-book ratios and higher forecasted growth values. This index is used to calculate the performance fee adjustment.
After-tax returns are calculated using distributions for the Fund’s Class S Shares for periods following July 6, 2009; for the JAD predecessor fund’s Class S Shares (formerly named Class I Shares) for the periods August 1, 2000 to July 6, 2009; and actual distributions for other classes of shares for periods prior to August 1, 2000. After-tax returns are calculated using the historically highest individual federal marginal income tax rates and do not reflect the impact of state and local taxes. Actual after-tax returns depend on your individual tax situation and may differ from those shown in the preceding table. The after-tax return information shown above does not apply to Fund shares held through a tax-deferred account, such as a 401(k) plan or an IRA.
After-tax returns are only shown for Class S Shares of the Fund. After-tax returns for the other classes of Shares will vary from those shown for Class S Shares due to varying sales charges (as applicable), fees, and expenses among the classes. |
|
| Performance Table Closing [Text Block] |
rr_PerformanceTableClosingTextBlock |
Updated performance information is available at janus.com/advisor/mutual-funds or by calling 1-877-335-2687. |
|
|
Janus Forty Fund | Class A, C, S, I, N, R, T Shares | Class A
|
|
|
|
| Risk/Return: |
rr_RiskReturnAbstract |
|
|
| Shareholder Fees Column [Text] |
rr_ShareholderFeesColumnName |
Class A |
|
| Maximum Sales Charge (load) Imposed on Purchases (as a percentage of offering price) |
rr_MaximumSalesChargeImposedOnPurchasesOverOfferingPrice |
5.75% |
|
| Maximum Deferred Sales Charge (load) (as a percentage of the lower of original purchase price or redemption proceeds) |
rr_MaximumDeferredSalesChargeOverOther |
none
|
|
| Operating Expenses Column [Text] |
rr_OperatingExpensesColumnName |
Class A |
|
| Management Fees (may adjust up or down) |
rr_ManagementFeesOverAssets |
0.48% |
|
| Distribution/Service (12b-1) Fees |
rr_DistributionAndService12b1FeesOverAssets |
0.25% |
|
| Other Expenses |
rr_OtherExpensesOverAssets |
0.27% |
|
| Total Annual Fund Operating Expenses |
rr_ExpensesOverAssets |
1.00% |
|
| Expense Example, By Year, Column [Text] |
rr_ExpenseExampleByYearColumnName |
Class A Shares |
|
| 1 Year |
rr_ExpenseExampleYear01 |
671 |
|
| 3 Years |
rr_ExpenseExampleYear03 |
875 |
|
| 5 Years |
rr_ExpenseExampleYear05 |
1,096 |
|
| 10 Years |
rr_ExpenseExampleYear10 |
1,729 |
|
| Expense Example, No Redemption, By Year, Column [Text] |
rr_ExpenseExampleNoRedemptionByYearColumnName |
Class A Shares |
|
| 1 Year |
rr_ExpenseExampleNoRedemptionYear01 |
671 |
|
| 3 Years |
rr_ExpenseExampleNoRedemptionYear03 |
875 |
|
| 5 Years |
rr_ExpenseExampleNoRedemptionYear05 |
1,096 |
|
| 10 Years |
rr_ExpenseExampleNoRedemptionYear10 |
1,729 |
|
|
Janus Forty Fund | Class A, C, S, I, N, R, T Shares | Class C
|
|
|
|
| Risk/Return: |
rr_RiskReturnAbstract |
|
|
| Shareholder Fees Column [Text] |
rr_ShareholderFeesColumnName |
Class C |
|
| Maximum Sales Charge (load) Imposed on Purchases (as a percentage of offering price) |
rr_MaximumSalesChargeImposedOnPurchasesOverOfferingPrice |
none
|
|
| Maximum Deferred Sales Charge (load) (as a percentage of the lower of original purchase price or redemption proceeds) |
rr_MaximumDeferredSalesChargeOverOther |
1.00% |
|
| Operating Expenses Column [Text] |
rr_OperatingExpensesColumnName |
Class C |
|
| Management Fees (may adjust up or down) |
rr_ManagementFeesOverAssets |
0.48% |
|
| Distribution/Service (12b-1) Fees |
rr_DistributionAndService12b1FeesOverAssets |
1.00% |
|
| Other Expenses |
rr_OtherExpensesOverAssets |
0.23% |
|
| Total Annual Fund Operating Expenses |
rr_ExpensesOverAssets |
1.71% |
|
| Expense Example, By Year, Column [Text] |
rr_ExpenseExampleByYearColumnName |
Class C Shares |
|
| 1 Year |
rr_ExpenseExampleYear01 |
274 |
|
| 3 Years |
rr_ExpenseExampleYear03 |
539 |
|
| 5 Years |
rr_ExpenseExampleYear05 |
928 |
|
| 10 Years |
rr_ExpenseExampleYear10 |
2,019 |
|
| Expense Example, No Redemption, By Year, Column [Text] |
rr_ExpenseExampleNoRedemptionByYearColumnName |
Class C Shares |
|
| 1 Year |
rr_ExpenseExampleNoRedemptionYear01 |
174 |
|
| 3 Years |
rr_ExpenseExampleNoRedemptionYear03 |
539 |
|
| 5 Years |
rr_ExpenseExampleNoRedemptionYear05 |
928 |
|
| 10 Years |
rr_ExpenseExampleNoRedemptionYear10 |
2,019 |
|
|
Janus Forty Fund | Class A, C, S, I, N, R, T Shares | Class S
|
|
|
|
| Risk/Return: |
rr_RiskReturnAbstract |
|
|
| Shareholder Fees Column [Text] |
rr_ShareholderFeesColumnName |
Class S |
|
| Maximum Sales Charge (load) Imposed on Purchases (as a percentage of offering price) |
rr_MaximumSalesChargeImposedOnPurchasesOverOfferingPrice |
none
|
|
| Maximum Deferred Sales Charge (load) (as a percentage of the lower of original purchase price or redemption proceeds) |
rr_MaximumDeferredSalesChargeOverOther |
none
|
|
| Operating Expenses Column [Text] |
rr_OperatingExpensesColumnName |
Class S |
|
| Management Fees (may adjust up or down) |
rr_ManagementFeesOverAssets |
0.48% |
|
| Distribution/Service (12b-1) Fees |
rr_DistributionAndService12b1FeesOverAssets |
0.25% |
|
| Other Expenses |
rr_OtherExpensesOverAssets |
0.31% |
|
| Total Annual Fund Operating Expenses |
rr_ExpensesOverAssets |
1.04% |
|
| Expense Example, By Year, Column [Text] |
rr_ExpenseExampleByYearColumnName |
Class S Shares |
|
| 1 Year |
rr_ExpenseExampleYear01 |
106 |
|
| 3 Years |
rr_ExpenseExampleYear03 |
331 |
|
| 5 Years |
rr_ExpenseExampleYear05 |
574 |
|
| 10 Years |
rr_ExpenseExampleYear10 |
1,271 |
|
| Expense Example, No Redemption, By Year, Column [Text] |
rr_ExpenseExampleNoRedemptionByYearColumnName |
Class S Shares |
|
| 1 Year |
rr_ExpenseExampleNoRedemptionYear01 |
106 |
|
| 3 Years |
rr_ExpenseExampleNoRedemptionYear03 |
331 |
|
| 5 Years |
rr_ExpenseExampleNoRedemptionYear05 |
574 |
|
| 10 Years |
rr_ExpenseExampleNoRedemptionYear10 |
1,271 |
|
| 2003 |
rr_AnnualReturn2003 |
18.92% |
|
| 2004 |
rr_AnnualReturn2004 |
17.64% |
|
| 2005 |
rr_AnnualReturn2005 |
14.60% |
|
| 2006 |
rr_AnnualReturn2006 |
10.18% |
|
| 2007 |
rr_AnnualReturn2007 |
35.57% |
|
| 2008 |
rr_AnnualReturn2008 |
(44.02%) |
|
| 2009 |
rr_AnnualReturn2009 |
43.53% |
|
| 2010 |
rr_AnnualReturn2010 |
5.62% |
|
| 2011 |
rr_AnnualReturn2011 |
(7.32%) |
|
| 2012 |
rr_AnnualReturn2012 |
23.65% |
|
| Highest Quarterly Return, Label |
rr_HighestQuarterlyReturnLabel |
Best Quarter: |
|
| Highest Quarterly Return, Date |
rr_BarChartHighestQuarterlyReturnDate |
Jun. 30,
2009 |
|
| Highest Quarterly Return |
rr_BarChartHighestQuarterlyReturn |
20.90% |
|
| Lowest Quarterly Return, Label |
rr_LowestQuarterlyReturnLabel |
Worst Quarter: |
|
| Lowest Quarterly Return, Date |
rr_BarChartLowestQuarterlyReturnDate |
Dec. 31,
2008 |
|
| Lowest Quarterly Return |
rr_BarChartLowestQuarterlyReturn |
(25.11%) |
|
|
Janus Forty Fund | Class A, C, S, I, N, R, T Shares | Class I
|
|
|
|
| Risk/Return: |
rr_RiskReturnAbstract |
|
|
| Shareholder Fees Column [Text] |
rr_ShareholderFeesColumnName |
Class I |
|
| Maximum Sales Charge (load) Imposed on Purchases (as a percentage of offering price) |
rr_MaximumSalesChargeImposedOnPurchasesOverOfferingPrice |
none
|
|
| Maximum Deferred Sales Charge (load) (as a percentage of the lower of original purchase price or redemption proceeds) |
rr_MaximumDeferredSalesChargeOverOther |
none
|
|
| Operating Expenses Column [Text] |
rr_OperatingExpensesColumnName |
Class I |
|
| Management Fees (may adjust up or down) |
rr_ManagementFeesOverAssets |
0.48% |
|
| Distribution/Service (12b-1) Fees |
rr_DistributionAndService12b1FeesOverAssets |
none
|
|
| Other Expenses |
rr_OtherExpensesOverAssets |
0.11% |
|
| Total Annual Fund Operating Expenses |
rr_ExpensesOverAssets |
0.59% |
|
| Expense Example, By Year, Column [Text] |
rr_ExpenseExampleByYearColumnName |
Class I Shares |
|
| 1 Year |
rr_ExpenseExampleYear01 |
60 |
|
| 3 Years |
rr_ExpenseExampleYear03 |
189 |
|
| 5 Years |
rr_ExpenseExampleYear05 |
329 |
|
| 10 Years |
rr_ExpenseExampleYear10 |
738 |
|
| Expense Example, No Redemption, By Year, Column [Text] |
rr_ExpenseExampleNoRedemptionByYearColumnName |
Class I Shares |
|
| 1 Year |
rr_ExpenseExampleNoRedemptionYear01 |
60 |
|
| 3 Years |
rr_ExpenseExampleNoRedemptionYear03 |
189 |
|
| 5 Years |
rr_ExpenseExampleNoRedemptionYear05 |
329 |
|
| 10 Years |
rr_ExpenseExampleNoRedemptionYear10 |
738 |
|
|
Janus Forty Fund | Class A, C, S, I, N, R, T Shares | Class N
|
|
|
|
| Risk/Return: |
rr_RiskReturnAbstract |
|
|
| Shareholder Fees Column [Text] |
rr_ShareholderFeesColumnName |
Class N |
|
| Maximum Sales Charge (load) Imposed on Purchases (as a percentage of offering price) |
rr_MaximumSalesChargeImposedOnPurchasesOverOfferingPrice |
none
|
|
| Maximum Deferred Sales Charge (load) (as a percentage of the lower of original purchase price or redemption proceeds) |
rr_MaximumDeferredSalesChargeOverOther |
none
|
|
| Operating Expenses Column [Text] |
rr_OperatingExpensesColumnName |
Class N |
|
| Management Fees (may adjust up or down) |
rr_ManagementFeesOverAssets |
0.48% |
|
| Distribution/Service (12b-1) Fees |
rr_DistributionAndService12b1FeesOverAssets |
none
|
|
| Other Expenses |
rr_OtherExpensesOverAssets |
0.03% |
[1] |
| Total Annual Fund Operating Expenses |
rr_ExpensesOverAssets |
0.51% |
|
| Expense Example, By Year, Column [Text] |
rr_ExpenseExampleByYearColumnName |
Class N Shares |
|
| 1 Year |
rr_ExpenseExampleYear01 |
52 |
|
| 3 Years |
rr_ExpenseExampleYear03 |
164 |
|
| 5 Years |
rr_ExpenseExampleYear05 |
285 |
|
| 10 Years |
rr_ExpenseExampleYear10 |
640 |
|
| Expense Example, No Redemption, By Year, Column [Text] |
rr_ExpenseExampleNoRedemptionByYearColumnName |
Class N Shares |
|
| 1 Year |
rr_ExpenseExampleNoRedemptionYear01 |
52 |
|
| 3 Years |
rr_ExpenseExampleNoRedemptionYear03 |
164 |
|
| 5 Years |
rr_ExpenseExampleNoRedemptionYear05 |
285 |
|
| 10 Years |
rr_ExpenseExampleNoRedemptionYear10 |
640 |
|
|
Janus Forty Fund | Class A, C, S, I, N, R, T Shares | Class R
|
|
|
|
| Risk/Return: |
rr_RiskReturnAbstract |
|
|
| Shareholder Fees Column [Text] |
rr_ShareholderFeesColumnName |
Class R |
|
| Maximum Sales Charge (load) Imposed on Purchases (as a percentage of offering price) |
rr_MaximumSalesChargeImposedOnPurchasesOverOfferingPrice |
none
|
|
| Maximum Deferred Sales Charge (load) (as a percentage of the lower of original purchase price or redemption proceeds) |
rr_MaximumDeferredSalesChargeOverOther |
none
|
|
| Operating Expenses Column [Text] |
rr_OperatingExpensesColumnName |
Class R |
|
| Management Fees (may adjust up or down) |
rr_ManagementFeesOverAssets |
0.48% |
|
| Distribution/Service (12b-1) Fees |
rr_DistributionAndService12b1FeesOverAssets |
0.50% |
|
| Other Expenses |
rr_OtherExpensesOverAssets |
0.29% |
|
| Total Annual Fund Operating Expenses |
rr_ExpensesOverAssets |
1.27% |
|
| Expense Example, By Year, Column [Text] |
rr_ExpenseExampleByYearColumnName |
Class R Shares |
|
| 1 Year |
rr_ExpenseExampleYear01 |
129 |
|
| 3 Years |
rr_ExpenseExampleYear03 |
403 |
|
| 5 Years |
rr_ExpenseExampleYear05 |
697 |
|
| 10 Years |
rr_ExpenseExampleYear10 |
1,534 |
|
| Expense Example, No Redemption, By Year, Column [Text] |
rr_ExpenseExampleNoRedemptionByYearColumnName |
Class R Shares |
|
| 1 Year |
rr_ExpenseExampleNoRedemptionYear01 |
129 |
|
| 3 Years |
rr_ExpenseExampleNoRedemptionYear03 |
403 |
|
| 5 Years |
rr_ExpenseExampleNoRedemptionYear05 |
697 |
|
| 10 Years |
rr_ExpenseExampleNoRedemptionYear10 |
1,534 |
|
|
Janus Forty Fund | Class A, C, S, I, N, R, T Shares | Class T
|
|
|
|
| Risk/Return: |
rr_RiskReturnAbstract |
|
|
| Shareholder Fees Column [Text] |
rr_ShareholderFeesColumnName |
Class T |
|
| Maximum Sales Charge (load) Imposed on Purchases (as a percentage of offering price) |
rr_MaximumSalesChargeImposedOnPurchasesOverOfferingPrice |
none
|
|
| Maximum Deferred Sales Charge (load) (as a percentage of the lower of original purchase price or redemption proceeds) |
rr_MaximumDeferredSalesChargeOverOther |
none
|
|
| Operating Expenses Column [Text] |
rr_OperatingExpensesColumnName |
Class T |
|
| Management Fees (may adjust up or down) |
rr_ManagementFeesOverAssets |
0.48% |
|
| Distribution/Service (12b-1) Fees |
rr_DistributionAndService12b1FeesOverAssets |
none
|
|
| Other Expenses |
rr_OtherExpensesOverAssets |
0.29% |
|
| Total Annual Fund Operating Expenses |
rr_ExpensesOverAssets |
0.77% |
|
| Expense Example, By Year, Column [Text] |
rr_ExpenseExampleByYearColumnName |
Class T Shares |
|
| 1 Year |
rr_ExpenseExampleYear01 |
79 |
|
| 3 Years |
rr_ExpenseExampleYear03 |
246 |
|
| 5 Years |
rr_ExpenseExampleYear05 |
428 |
|
| 10 Years |
rr_ExpenseExampleYear10 |
954 |
|
| Expense Example, No Redemption, By Year, Column [Text] |
rr_ExpenseExampleNoRedemptionByYearColumnName |
Class T Shares |
|
| 1 Year |
rr_ExpenseExampleNoRedemptionYear01 |
79 |
|
| 3 Years |
rr_ExpenseExampleNoRedemptionYear03 |
246 |
|
| 5 Years |
rr_ExpenseExampleNoRedemptionYear05 |
428 |
|
| 10 Years |
rr_ExpenseExampleNoRedemptionYear10 |
954 |
|
|
Janus Forty Fund | Class A, C, S, I, N, R, T Shares | Return Before Taxes | Class A
|
|
|
|
| Risk/Return: |
rr_RiskReturnAbstract |
|
|
| Column |
rr_AverageAnnualReturnColumnName |
Class A Shares |
|
| Label |
rr_AverageAnnualReturnLabel |
Return Before Taxes |
[2] |
| 1 Year |
rr_AverageAnnualReturnYear01 |
16.68% |
|
| 5 Years |
rr_AverageAnnualReturnYear05 |
(1.54%) |
|
| 10 Years |
rr_AverageAnnualReturnYear10 |
8.37% |
|
| Since Inception of Predecessor Fund |
rr_AverageAnnualReturnSinceInception |
9.35% |
|
| Inception Date |
rr_AverageAnnualReturnInceptionDate |
May
01,
1997 |
|
|
Janus Forty Fund | Class A, C, S, I, N, R, T Shares | Return Before Taxes | Class C
|
|
|
|
| Risk/Return: |
rr_RiskReturnAbstract |
|
|
| Column |
rr_AverageAnnualReturnColumnName |
Class C Shares |
|
| Label |
rr_AverageAnnualReturnLabel |
Return Before Taxes |
[3] |
| 1 Year |
rr_AverageAnnualReturnYear01 |
21.63% |
|
| 5 Years |
rr_AverageAnnualReturnYear05 |
(1.13%) |
|
| 10 Years |
rr_AverageAnnualReturnYear10 |
8.23% |
|
| Since Inception of Predecessor Fund |
rr_AverageAnnualReturnSinceInception |
9.09% |
|
| Inception Date |
rr_AverageAnnualReturnInceptionDate |
May
01,
1997 |
|
|
Janus Forty Fund | Class A, C, S, I, N, R, T Shares | Return Before Taxes | Class S
|
|
|
|
| Risk/Return: |
rr_RiskReturnAbstract |
|
|
| Column |
rr_AverageAnnualReturnColumnName |
Class S Shares |
|
| Label |
rr_AverageAnnualReturnLabel |
Return Before Taxes |
|
| 1 Year |
rr_AverageAnnualReturnYear01 |
23.65% |
|
| 5 Years |
rr_AverageAnnualReturnYear05 |
(0.56%) |
|
| 10 Years |
rr_AverageAnnualReturnYear10 |
8.82% |
|
| Since Inception of Predecessor Fund |
rr_AverageAnnualReturnSinceInception |
9.64% |
|
| Inception Date |
rr_AverageAnnualReturnInceptionDate |
May
01,
1997 |
|
|
Janus Forty Fund | Class A, C, S, I, N, R, T Shares | Return Before Taxes | Class I
|
|
|
|
| Risk/Return: |
rr_RiskReturnAbstract |
|
|
| Column |
rr_AverageAnnualReturnColumnName |
Class I Shares |
|
| Label |
rr_AverageAnnualReturnLabel |
Return Before Taxes |
|
| 1 Year |
rr_AverageAnnualReturnYear01 |
24.15% |
|
| 5 Years |
rr_AverageAnnualReturnYear05 |
(0.11%) |
|
| 10 Years |
rr_AverageAnnualReturnYear10 |
8.82% |
|
| Since Inception of Predecessor Fund |
rr_AverageAnnualReturnSinceInception |
9.64% |
|
| Inception Date |
rr_AverageAnnualReturnInceptionDate |
May
01,
1997 |
|
|
Janus Forty Fund | Class A, C, S, I, N, R, T Shares | Return Before Taxes | Class N
|
|
|
|
| Risk/Return: |
rr_RiskReturnAbstract |
|
|
| Column |
rr_AverageAnnualReturnColumnName |
Class N Shares |
|
| Label |
rr_AverageAnnualReturnLabel |
Return Before Taxes |
|
| 1 Year |
rr_AverageAnnualReturnYear01 |
23.65% |
|
| 5 Years |
rr_AverageAnnualReturnYear05 |
(0.56%) |
|
| 10 Years |
rr_AverageAnnualReturnYear10 |
8.82% |
|
| Since Inception of Predecessor Fund |
rr_AverageAnnualReturnSinceInception |
9.64% |
|
| Inception Date |
rr_AverageAnnualReturnInceptionDate |
May
01,
1997 |
|
|
Janus Forty Fund | Class A, C, S, I, N, R, T Shares | Return Before Taxes | Class R
|
|
|
|
| Risk/Return: |
rr_RiskReturnAbstract |
|
|
| Column |
rr_AverageAnnualReturnColumnName |
Class R Shares |
|
| Label |
rr_AverageAnnualReturnLabel |
Return Before Taxes |
|
| 1 Year |
rr_AverageAnnualReturnYear01 |
23.33% |
|
| 5 Years |
rr_AverageAnnualReturnYear05 |
(0.81%) |
|
| 10 Years |
rr_AverageAnnualReturnYear10 |
8.55% |
|
| Since Inception of Predecessor Fund |
rr_AverageAnnualReturnSinceInception |
9.40% |
|
| Inception Date |
rr_AverageAnnualReturnInceptionDate |
May
01,
1997 |
|
|
Janus Forty Fund | Class A, C, S, I, N, R, T Shares | Return Before Taxes | Class T
|
|
|
|
| Risk/Return: |
rr_RiskReturnAbstract |
|
|
| Column |
rr_AverageAnnualReturnColumnName |
Class T Shares |
|
| Label |
rr_AverageAnnualReturnLabel |
Return Before Taxes |
|
| 1 Year |
rr_AverageAnnualReturnYear01 |
23.96% |
|
| 5 Years |
rr_AverageAnnualReturnYear05 |
(0.56%) |
|
| 10 Years |
rr_AverageAnnualReturnYear10 |
8.82% |
|
| Since Inception of Predecessor Fund |
rr_AverageAnnualReturnSinceInception |
9.64% |
|
| Inception Date |
rr_AverageAnnualReturnInceptionDate |
May
01,
1997 |
|
|
Janus Forty Fund | Class A, C, S, I, N, R, T Shares | Return After Taxes on Distributions | Class S
|
|
|
|
| Risk/Return: |
rr_RiskReturnAbstract |
|
|
| Column |
rr_AverageAnnualReturnColumnName |
Class S Shares |
|
| Label |
rr_AverageAnnualReturnLabel |
Return After Taxes on Distributions |
|
| 1 Year |
rr_AverageAnnualReturnYear01 |
23.60% |
|
| 5 Years |
rr_AverageAnnualReturnYear05 |
(0.73%) |
|
| 10 Years |
rr_AverageAnnualReturnYear10 |
8.67% |
|
| Since Inception of Predecessor Fund |
rr_AverageAnnualReturnSinceInception |
9.51% |
|
| Inception Date |
rr_AverageAnnualReturnInceptionDate |
May
01,
1997 |
|
|
Janus Forty Fund | Class A, C, S, I, N, R, T Shares | Return After Taxes on Distributions and Sale of Fund Shares | Class S
|
|
|
|
| Risk/Return: |
rr_RiskReturnAbstract |
|
|
| Column |
rr_AverageAnnualReturnColumnName |
Class S Shares |
|
| Label |
rr_AverageAnnualReturnLabel |
Return After Taxes on Distributions and Sale of Fund Shares |
[4] |
| 1 Year |
rr_AverageAnnualReturnYear01 |
15.43% |
|
| 5 Years |
rr_AverageAnnualReturnYear05 |
(0.53%) |
|
| 10 Years |
rr_AverageAnnualReturnYear10 |
7.80% |
|
| Since Inception of Predecessor Fund |
rr_AverageAnnualReturnSinceInception |
8.73% |
|
| Inception Date |
rr_AverageAnnualReturnInceptionDate |
May
01,
1997 |
|
|
Janus Forty Fund | Class A, C, S, I, N, R, T Shares | Russell 1000® Growth Index (reflects no deduction for expenses, fees, or taxes)
|
|
|
|
| Risk/Return: |
rr_RiskReturnAbstract |
|
|
| Label |
rr_AverageAnnualReturnLabel |
Russell 1000® Growth Index |
|
| 1 Year |
rr_AverageAnnualReturnYear01 |
15.26% |
|
| 5 Years |
rr_AverageAnnualReturnYear05 |
3.12% |
|
| 10 Years |
rr_AverageAnnualReturnYear10 |
7.52% |
|
| Since Inception of Predecessor Fund |
rr_AverageAnnualReturnSinceInception |
4.75% |
|
| Inception Date |
rr_AverageAnnualReturnInceptionDate |
May
01,
1997 |
|
|
Janus Forty Fund | Class A, C, S, I, N, R, T Shares | S&P 500® Index (reflects no deduction for expenses, fees, or taxes)
|
|
|
|
| Risk/Return: |
rr_RiskReturnAbstract |
|
|
| Label |
rr_AverageAnnualReturnLabel |
S&P 500® Index |
|
| 1 Year |
rr_AverageAnnualReturnYear01 |
16.00% |
|
| 5 Years |
rr_AverageAnnualReturnYear05 |
1.66% |
|
| 10 Years |
rr_AverageAnnualReturnYear10 |
7.10% |
|
| Since Inception of Predecessor Fund |
rr_AverageAnnualReturnSinceInception |
5.67% |
|
| Inception Date |
rr_AverageAnnualReturnInceptionDate |
May
01,
1997 |
|
|
|
|