| INVESCO International Small Company Fund | ||||||||||||||||||||||||||||||||||||||||||||||||||||||||||||||||||
| Fund Summaries - INVESCO INTERNATIONAL SMALL COMPANY FUND | ||||||||||||||||||||||||||||||||||||||||||||||||||||||||||||||||||
| Investment Objective(s) | ||||||||||||||||||||||||||||||||||||||||||||||||||||||||||||||||||
| The Fund’s investment objective is long-term growth of capital. | ||||||||||||||||||||||||||||||||||||||||||||||||||||||||||||||||||
| Fees and Expenses of the Fund | ||||||||||||||||||||||||||||||||||||||||||||||||||||||||||||||||||
| This table describes the fees and expenses that you may pay if you buy and hold shares of the Fund. | ||||||||||||||||||||||||||||||||||||||||||||||||||||||||||||||||||
| Shareholder Fees (fees paid directly from your investment) | ||||||||||||||||||||||||||||||||||||||||||||||||||||||||||||||||||
|
||||||||||||||||||||||||||||||||||||||||||||||||||||||||||||||||||
| Annual Fund Operating Expenses (expenses that you pay each year as a percentage of the value of your investment) | ||||||||||||||||||||||||||||||||||||||||||||||||||||||||||||||||||
|
||||||||||||||||||||||||||||||||||||||||||||||||||||||||||||||||||
| Example. | ||||||||||||||||||||||||||||||||||||||||||||||||||||||||||||||||||
| This Example is intended to help you compare the cost of investing in the Fund with the cost of investing in other mutual funds. The Example assumes that you invest $10,000 in the Fund for the time periods indicated and then redeem all of your shares at the end of those periods. The Example also assumes that your investment has a 5% return each year and that the Fund’s operating expenses remain the same. Although your actual costs may be higher or lower, based on these assumptions, your costs would be: |
||||||||||||||||||||||||||||||||||||||||||||||||||||||||||||||||||
|
||||||||||||||||||||||||||||||||||||||||||||||||||||||||||||||||||
| Portfolio Turnover. | ||||||||||||||||||||||||||||||||||||||||||||||||||||||||||||||||||
| The Fund pays transaction costs, such as commissions, when it buys and sells securities (or “turns over” its portfolio). A higher portfolio turnover rate may indicate higher transaction costs and may result in higher taxes when Fund shares are held in a taxable account. These costs, which are not reflected in annual Fund operating expenses or in the example, affect the Fund’s performance. During the most recent fiscal year, the Fund’s portfolio turnover rate was 18% of the average value of its portfolio. | ||||||||||||||||||||||||||||||||||||||||||||||||||||||||||||||||||
| Principal Investment Strategies of the Fund | ||||||||||||||||||||||||||||||||||||||||||||||||||||||||||||||||||
| The Fund invests, under normal circumstances, at least 80% of its net assets (plus any borrowings for investment purposes) in securities of small international issuers. The Fund’s portfolio managers do not intend to invest more than 35% of the Fund’s net assets in issuers located in developing countries. The Fund invests primarily in equity securities. In complying with the 80% investment requirement, the Fund may include synthetic securities that have economic characteristics similar to the Fund’s direct investments that are counted toward the 80% investment requirement. The Fund is non-diversified, which means it can invest a greater percentage of its assets in any one issuer than a diversified fund can. The Fund considers an issuer to be a small-capitalization issuer if it has a market capitalization, at the time of purchase, no larger than the largest capitalized issuer included in the Russell 2000® Index during the most recent 11-month period (based on month end data) plus the most recent data during the current month. As of December 30, 2011, the capitalization of companies in the Russell 2000® Index ranged from $16 million to $3.7 billion. As of December 31, 2011, the principal countries in which the Fund was invested were Canada, the United Kingdom, Malaysia, the Philippines and Japan. The Fund may invest up to 20% of its net assets in securities of U.S. issuers. The Fund may invest up to 20% of its total assets in securities exchangeable for or convertible into equity securities of foreign issuers. The Fund can invest in derivatives, including forward foreign currency contracts to mitigate the risk of foreign currency exposure. A forward foreign currency contract is an agreement between parties to exchange a specified amount of currency at a specified future time at a specified rate. Forward foreign currency contracts are used to protect against uncertainty in the level of future foreign currency exchange rates. The Fund will use these contracts to hedge against adverse movements in the foreign currencies in which portfolio securities are denominated. The portfolio managers employ a disciplined investment strategy that emphasizes fundamental research, supported by quantitative analysis, portfolio construction and risk management techniques. The strategy primarily focuses on identifying quality issuers that have experienced, or exhibit the potential for, accelerating or above average earnings growth but whose prices do not fully reflect these attributes. Investments for the portfolio are selected bottom-up on a security-by-security basis. The focus is on the strengths of individual issuers, rather than sector or country trends. The Fund’s portfolio managers may consider selling a security for several reasons, including (1) its fundamentals deteriorate or it posts disappointing earnings, (2) its security price appears to be overvalued, or (3) a more attractive investment opportunity is identified. |
||||||||||||||||||||||||||||||||||||||||||||||||||||||||||||||||||
| Principal Risks of Investing in the Fund | ||||||||||||||||||||||||||||||||||||||||||||||||||||||||||||||||||
| As with any mutual fund investment, loss of money is a risk of investing. An investment in the Fund is not a deposit in a bank and is not insured or guaranteed by the Federal Deposit Insurance Corporation or any other governmental agency. The risks associated with an investment in the Fund can increase during times of significant market volatility. The principal risks of investing in the Fund are: Derivatives Risk. The performance of derivative instruments is tied to the performance of an underlying currency, security, index or other instrument. In addition to risks relating to their underlying instruments, the use of derivatives may include other, possibly greater, risks. Derivatives involve costs, may be volatile, and may involve a small initial investment relative to the risk assumed. Risks associated with the use of derivatives may include counterparty, leverage, correlation, liquidity, tax, market, interest rate and management risks. Derivatives may also be more difficult to purchase, sell or value than other investments. The Fund may lose more than the cash amount invested on investments in derivatives. Investors should bear in mind that, while the Fund intends to use derivative strategies, it is not obligated to actively engage in these transactions, generally or in any particular kind of derivative, if the investment manager elects not to do so due to availability, cost, market conditions or other factors. Developing/Emerging Markets Securities Risk. Securities issued by foreign companies and governments located in developing/emerging countries may be affected more negatively by inflation, devaluation of their currencies, higher transaction costs, delays in settlement, adverse political developments, the introduction of capital controls, withholding taxes, nationalization of private assets, expropriation, social unrest, war or lack of timely information than those in developed countries. Foreign Securities Risk. The Fund’s foreign investments may be affected by changes in a foreign country’s exchange rates, political and social instability, changes in economic or taxation policies, difficulties when enforcing obligations, decreased liquidity, and increased volatility. Foreign companies may be subject to less regulation resulting in less publicly available information about the companies. Growth Investing Risk. Growth stocks tend to be more expensive relative to their earnings or assets compared with other types of stock. As a result they tend to be more sensitive to changes in their earnings and can be more volatile. Management Risk. The investment techniques and risk analysis used by the Fund’s portfolio managers may not produce the desired results. Market Risk. The prices of and the income generated by the Fund’s securities may decline in response to, among other things, investor sentiment, general economic and market conditions, regional or global instability, and currency and interest rate fluctuations. Non-Diversification Risk. The Fund is non-diversified and can invest a greater portion of its assets in a single issuer. A change in the value of the issuer could affect the value of the Fund more than if it was a diversified fund. Small- and Mid-Capitalization Risks. Stocks of small and mid-sized companies tend to be more vulnerable to adverse developments and may have little or no operating history or track record of success, and limited product lines, markets, management and financial resources. The securities of small and mid-sized companies may be more volatile due to less market interest and less publicly available information about the issuer. They also may be illiquid or restricted as to resale, or may trade less frequently and in smaller volumes, all of which may cause difficulty when establishing or closing a position at a desirable price. Synthetic Securities Risk. Fluctuations in the values of synthetic securities may not correlate perfectly with the instruments they are designed to replicate. Synthetic securities may be subject to interest rate changes, market price fluctuations, counterparty risk and liquidity risk. |
||||||||||||||||||||||||||||||||||||||||||||||||||||||||||||||||||
| Performance Information | ||||||||||||||||||||||||||||||||||||||||||||||||||||||||||||||||||
| The bar chart and performance table provide an indication of the risks of investing in the Fund. The bar chart shows changes in the performance of the Fund from year to year as of December 31. The performance table compares the Fund’s performance to that of a broad-based securities market benchmark, a style specific benchmark and a peer group benchmark comprised of funds with investment objectives and strategies similar to the Fund. The benchmarks may not reflect payment of fees, expenses or taxes. The Fund’s past performance (before and after taxes) is not necessarily an indication of its future performance. Updated performance information is available on the Fund’s Web site at www.invesco.com/us. | ||||||||||||||||||||||||||||||||||||||||||||||||||||||||||||||||||
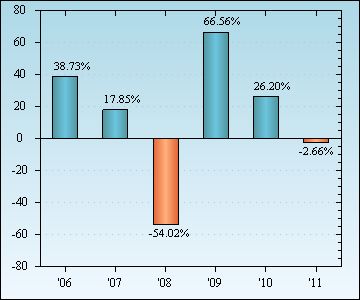
| Annual Total Returns | ||||||||||||||||||||||||||||||||||||||||||||||||||||||||||||||||||
 |
||||||||||||||||||||||||||||||||||||||||||||||||||||||||||||||||||
| Class R5 shares year-to-date (ended June 30, 2012): 0.22% Best Quarter (ended June 30, 2009): 34.03% Worst Quarter (ended December 31, 2008): -27.38% |
||||||||||||||||||||||||||||||||||||||||||||||||||||||||||||||||||
| Average Annual Total Returns (for the periods ended December 31, 2011) | ||||||||||||||||||||||||||||||||||||||||||||||||||||||||||||||||||
|
||||||||||||||||||||||||||||||||||||||||||||||||||||||||||||||||||
| After-tax returns are calculated using the historical highest individual federal marginal income tax rates and do not reflect the impact of state and local taxes. Actual after-tax returns depend on an investor’s tax situation and may differ from those shown, and after-tax returns shown are not relevant to investors who hold their Fund shares through tax-deferred arrangement, such as 401(k) plans or individual retirement accounts. | ||||||||||||||||||||||||||||||||||||||||||||||||||||||||||||||||||