As filed with the Securities and Exchange Commission on December 13, 2023
Securities Act File No.
UNITED STATES
SECURITIES AND EXCHANGE COMMISSION
Washington, D.C. 20549
FORM N-2
REGISTRATION STATEMENT
UNDER
THE SECURITIES ACT OF 1933
Pre-Effective Amendment No. |
||
Post-Effective Amendment No. |
(Exact name of registrant as specified in charter)
(212 ) 419-3000
(Address and telephone number, including area code, of principal executive offices)
Chief Operating Officer and Chief Financial Officer
(Name and address of agent for service)
COPIES TO:
Cynthia M. Krus, Esq.
Kristin H. Burns, Esq.
Dwaune L. Dupree, Esq.
Eversheds Sutherland (US) LLP
700 Sixth Street, NW
Washington, DC 20004
Tel: (202) 383-0100
Fax: (202) 637-3593
Approximate date of commencement of proposed public offering:
Check box if the only securities being registered on this Form are being offered pursuant to dividend or interest reinvestment plans. |
Check box if any securities being registered on this Form will be offered on a delayed or continuous basis in reliance on Rule 415 under the Securities Act of 1933 (“Securities Act”), other than securities offered in connection with a dividend reinvestment plan. |
Check box if this Form is a registration statement pursuant to General Instruction A.2 or a post-effective amendment thereto. |
Check box if this Form is a registration statement pursuant to General Instruction B or a post-effective amendment thereto that will become effective upon filing with the Commission pursuant to Rule 462(e) under the Securities Act. |
Check box if this Form is a post-effective amendment to a registration statement filed pursuant to General Instruction B to register additional securities or additional classes of securities pursuant to Rule 413(b) under the Securities Act. |
It is proposed that this filing will become effective (check appropriate box):
when declared effective pursuant to Section 8(c) of the Securities Act. |
immediately upon filing pursuant to paragraph (b) |
on (date) pursuant to paragraph (b) |
60 days after filing pursuant to paragraph (a) |
on (date) pursuant to paragraph (a) |
If appropriate, check the following box:
This [post-effective] amendment designates a new effective date for a previously filed [post-effective amendment] [registration statement]. |
This Form is filed to register additional securities for an offering pursuant to Rule 462(b) under the Securities Act, and the Securities Act registration statement number of the earlier effective registration statement for the same offering is: |
This Form is a post-effective amendment filed pursuant to Rule 462(c) under the Securities Act, and the Securities Act registration statement number of the earlier effective registration statement for the same offering is: |
This Form is a post-effective amendment filed pursuant to Rule 462(d) under the Securities Act, and the Securities Act registration statement number of the earlier effective registration statement for the same offering is: |
Check each box that appropriately characterizes the Registrant:
Registered Closed-End Fund (closed-end company that is registered under the Investment Company Act of 1940 (“Investment Company Act”)). |
Business Development Company (closed-end company that intends or has elected to be regulated as a business development company under the Investment Company Act). |
Interval Fund (Registered Closed-End Fund or a Business Development Company that makes periodic repurchase offers under Rule 23c-3 under the Investment Company Act). |
A.2 Qualified (qualified to register securities pursuant to General Instruction A.2 of this Form). |
Well-Known Seasoned Issuer (as defined by Rule 405 under the Securities Act ). |
Emerging Growth Company (as defined by Rule 12b-2 under the Securities Exchange Act of 1934 (“Exchange Act”). |
| ☐ | If an Emerging Growth Company, indicate by check mark if the Registrant has elected not to use the extended transition period for complying with any new or revised financial accounting standards provided pursuant to Section 7(a)(2)(B) of Securities Act. |
New Registrant (registered or regulated under the Investment Company Act for less than 12 calendar months preceding this filing). |
No new interests in the Registrant are being registered by this filing. Registration fee was paid in connection with Registrant’s previous filing.
Explanatory Note
This Post-Effective Amendment No. 3 (the “Amendment”) to the Registration Statement on Form N-2 of Blue Owl Credit Income Corp. (f/k/a Owl Rock Core Income Corp.) (the “Registrant”) is being filed pursuant to Rule 486(b) under the Securities Act of 1933, as amended, to register additional shares of the Registrant’s common stock, provide updated financial information and make certain other non-material changes to the Registrant’s Prospectus. This Amendment is organized as follows (a) Prospectus and (b) Part C Information relating to the Registrant.
Prospectus

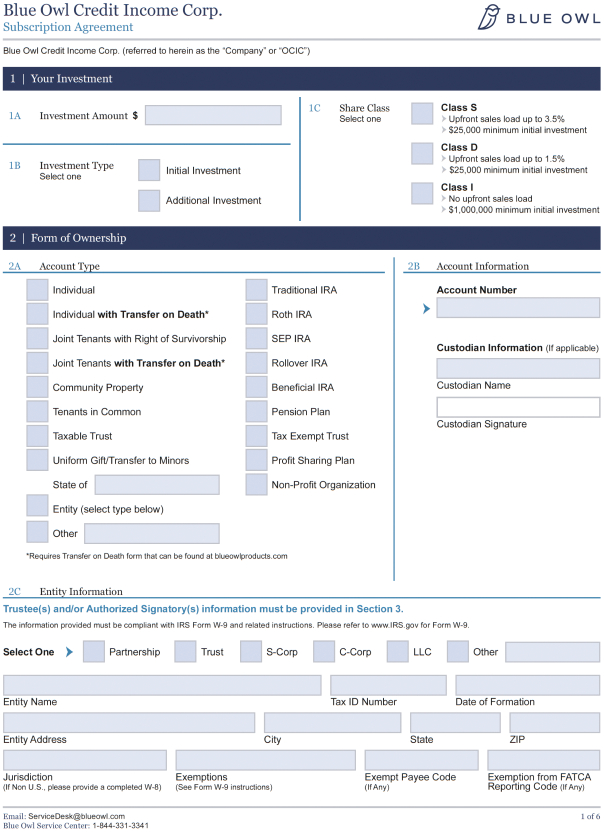
Blue Owl Credit Income Corp.
Maximum Offering of up to $9,500,000,000 in Class S, Class D and Class I Shares of Common Stock
Blue Owl Credit Income Corp. (f/k/a Owl Rock Core Income Corp.) (the “Company,” “we,” “us,” or “our”) is an externally managed closed-end management investment company that has elected to be regulated as a business development company, or BDC, under the Investment Company Act of 1940, as amended (the “1940 Act”). We are managed by Blue Owl Credit Advisors LLC (f/k/a Owl Rock Capital Advisors LLC) (“the Adviser” or “our Adviser”), which is registered as an investment adviser with the U.S. Securities and Exchange Commission (the “SEC”). We also have elected to be treated for U.S. federal income tax purposes, and intend to qualify annually, as a regulated investment company (a “RIC”) under the Internal Revenue Code of 1986, as amended (the “Code”).
Our investment objective is to generate current income and, to a lesser extent, capital appreciation by targeting investment opportunities with favorable risk-adjusted returns. Our investment strategy focuses primarily on originating and making loans to, and making debt and equity investments in, U.S. middle-market companies. We invest in senior secured or unsecured loans, subordinated loans or mezzanine loans, and, to a lesser extent, equity and equity-related securities which include common and preferred stock, securities convertible into common stock, and warrants. We define “middle-market companies” to generally mean companies with earnings before interest expense, income tax expense, depreciation and amortization (“EBITDA”) between $10 million and $250 million annually and/or annual revenue of $50 million to $2.5 billion at the time of investment. We may on occasion invest in smaller or larger companies if an attractive opportunity presents itself, especially when there are dislocations in the capital markets. Consistent with our goal of capital preservation, we generally invest in companies with loan-to-value ratios of 50% or lower. Our target credit investments typically will have maturities between three and ten years. We expect that our investments will have position sizes that range between 1% and 3% of our portfolio, although investment sizes will vary with the size of our capital base, particularly during the period prior to raising sufficient capital. To a lesser extent, we may make investments in syndicated loan opportunities for cash management purposes, which includes but is not limited to maintaining more liquid investments to manage our share repurchase program. We intend, under normal circumstances, to invest directly, or indirectly through our investment in Blue Owl Credit Income Senior Loan Fund (f/k/a ORCIC Senior Loan Fund) or any similarly situated companies, at least 80% of the value of our total assets in credit investments. We define “credit” to mean debt investments made in exchange for regular interest payments.
We have received an exemptive order that permits us to offer multiple classes of shares of common stock and to impose varying sales loads, asset-based service and/or distribution fees and early withdrawal fees. We are offering on a best efforts, continuous basis up to $9,500,000,000 in any combination of amount of shares of Class S, Class D and Class I common stock. Class S, Class D and Class I shares are currently being offered at prices per share of $9.69, $9.51, and $9.38, respectively, as of November 1, 2023. We sell our shares at a net offering price that we believe reflects the net asset value per share as determined in accordance with the Company’s share pricing policy. Each class of common stock is offered through Blue Owl Securities LLC (d/b/a Blue Owl Securities) (the “Dealer Manager”). The initial minimum permitted purchase by each individual investor is $25 thousand in Class S or Class D shares, or $1 million in Class I shares unless such minimums are waived by the