0001171843-18-003122.txt : 20180427 0001171843-18-003122.hdr.sgml : 20180427 20180427070025 ACCESSION NUMBER: 0001171843-18-003122 CONFORMED SUBMISSION TYPE: 8-K PUBLIC DOCUMENT COUNT: 32 CONFORMED PERIOD OF REPORT: 20180427 ITEM INFORMATION: Results of Operations and Financial Condition ITEM INFORMATION: Regulation FD Disclosure ITEM INFORMATION: Financial Statements and Exhibits FILED AS OF DATE: 20180427 DATE AS OF CHANGE: 20180427 FILER: COMPANY DATA: COMPANY CONFORMED NAME: WestRock Co CENTRAL INDEX KEY: 0001636023 STANDARD INDUSTRIAL CLASSIFICATION: PAPERBOARD CONTAINERS & BOXES [2650] IRS NUMBER: 473335141 STATE OF INCORPORATION: DE FISCAL YEAR END: 0930 FILING VALUES: FORM TYPE: 8-K SEC ACT: 1934 Act SEC FILE NUMBER: 001-37484 FILM NUMBER: 18780958 BUSINESS ADDRESS: STREET 1: 504 THRASHER STREET CITY: NORCROSS STATE: GA ZIP: 30071 BUSINESS PHONE: 678-291-7456 MAIL ADDRESS: STREET 1: 504 THRASHER STREET CITY: NORCROSS STATE: GA ZIP: 30071 FORMER COMPANY: FORMER CONFORMED NAME: Rome-Milan Holdings, Inc. DATE OF NAME CHANGE: 20150309 8-K 1 f8k_042718.htm FORM 8-K
 

UNITED STATES
SECURITIES AND EXCHANGE COMMISSION
Washington, D.C. 20549
_____________________

Form 8-K
_____________________

CURRENT REPORT

Pursuant to Section 13 or 15(d) of the Securities Exchange Act of 1934

Date of Report (Date of earliest event Reported): April 27, 2018  

WestRock Company
(Exact Name of Registrant as Specified in Charter)

Delaware001-3748447-3335141
(State or Other Jurisdiction of Incorporation)(Commission File Number)(I.R.S. Employer Identification Number)


1000 Abernathy Road, Atlanta, GA 30328
(Address of Principal Executive Offices) (Zip Code)

770-448-2193
(Registrant's telephone number, including area code)

Not Applicable
(Former name or former address, if changed since last report)

Check the appropriate box below if the Form 8-K filing is intended to simultaneously satisfy the filing obligation of the registrant under any of the following provisions:

 [   ]  Written communications pursuant to Rule 425 under the Securities Act (17 CFR 230.425)
 [   ]  Soliciting material pursuant to Rule 14a-12 under the Exchange Act (17 CFR 240.14a-12)
 [   ]  Pre-commencement communications pursuant to Rule 14d-2(b) under the Exchange Act (17 CFR 240.14d-2(b))
 [   ]  Pre-commencement communications pursuant to Rule 13e-4(c) under the Exchange Act (17 CFR 240.13e-4(c))


Indicate by check mark whether the registrant is an emerging growth company as defined in Rule 405 of the Securities Act of 1933 (17 CFR §230.405) or Rule 12b-2 of the Securities Exchange Act of 1934 (17 CFR §240.12b-2). Emerging growth company [   ]


If an emerging growth company, indicate by check mark if the registrant has elected not to use the extended transition period for complying with any new or revised financial accounting standards provided pursuant to Section 13(a) of the Exchange Act. [   ]


Item 2.02. Results of Operations and Financial Condition.

On April 27, 2018, WestRock Company (“WestRock”) issued a press release announcing WestRock’s financial results for the second quarter of fiscal 2018. A copy of the press release is attached as Exhibit 99.1.

The information provided pursuant to this Item 2.02, including Exhibit 99.1 in Item 9.01, is “furnished” and shall not be deemed to be “filed” with the Securities and Exchange Commission (the “SEC”) or incorporated by reference in any filing under the Securities Exchange Act of 1934, as amended (the “Exchange Act”), or the Securities Act of 1933, as amended (the “Securities Act”), except as shall be expressly set forth by specific reference in any such filings.

Item 7.01. Regulation FD Disclosure.

On April 27, 2018, WestRock will host a conference call during which it will discuss WestRock’s financial results for the second quarter of fiscal 2018 and other topics that may be raised during the discussion. The presentation to be used in connection with the conference call is attached as Exhibit 99.2.

The information provided pursuant to this Item 7.01, including Exhibit 99.2 in Item 9.01, is “furnished” and shall not be deemed to be “filed” with the SEC or incorporated by reference in any filing under the Exchange Act or the Securities Act, except as shall be expressly set forth by specific reference in any such filings.

Item 9.01. Financial Statements and Exhibits.

(d) Exhibits

     99.1   Press release dated April 27, 2018 – WestRock Reports Strong Fiscal 2018 Second Quarter Results
     99.2   Q2 FY18 Results Presentation dated April 27, 2018


SIGNATURE

Pursuant to the requirements of the Securities Exchange Act of 1934, the registrant has duly caused this report to be signed on its behalf by the undersigned hereunto duly authorized.

 WestRock Company
   
  
Date: April 27, 2018By: /s/ Robert B. McIntosh        
  Robert B. McIntosh
  Executive Vice-President, General Counsel and Secretary
  

EX-99.1 2 exh_991.htm PRESS RELEASE EdgarFiling

EXHIBIT 99.1

WestRock Reports Strong Fiscal 2018 Second Quarter Results

Earnings Per Share Increased More Than 50%

ATLANTA, April 27, 2018 (GLOBE NEWSWIRE) -- WestRock Company (NYSE:WRK), a leading provider of differentiated paper and packaging solutions, today announced results for its fiscal second quarter ended March 31, 2018.

Second Quarter 2018 Highlights

  • Earned $0.86 per diluted share and $0.83 of adjusted earnings per diluted share compared to $0.40 per diluted share and $0.54 of adjusted earnings per diluted share in the prior year quarter, up 115% and 54%, respectively.
  • Segment EBITDA increased $122 million, or 22%, compared to the prior year quarter.
  • Corrugated Packaging Segment EBITDA increased 39% compared to the prior year quarter. The segment delivered a Segment EBITDA margin of 18.9% and a North American Adjusted Segment EBITDA margin of 20.5%, up 410 and 460 basis points, respectively, compared to the prior year quarter.
  • Pulp & Paper Week published North American price increases across all of WestRock’s major grades, including containerboard, SBS, CNK, CRB and URB.
  • Achieved $64 million in year-over-year productivity and a run rate of $975 million of synergy and performance improvements since the creation of WestRock.
  • The effective tax rate was 7.7%, including an income tax benefit of $31.5 million, or $0.12 per diluted share. This benefit was due to a refinement of the estimated impact on deferred tax balances related to the corporate tax rate reduction under the Tax Cuts and Jobs Act (as defined below). This benefit has been excluded from adjusted earnings per diluted share, and the adjusted tax rate on adjusted earnings per diluted share was 21.3%.
  • Acquired substantially all of the assets of Plymouth Packaging, Inc. (“Plymouth”), including its “Box on Demand” systems that enhance our platform and drive differentiation and innovation. The systems produce packaging that is accurately sized for any product type according to customers’ specifications.
  • Initiated integration planning for the planned acquisition of KapStone Paper and Packaging Corporation (“KapStone”), which is expected to close by the end of the September quarter or during the December quarter, subject to customary closing conditions.

“The WestRock team performed well and delivered a strong second quarter. With our acquisition of Plymouth and the agreement to acquire KapStone, we are further strengthening our capabilities and solutions offerings for our customers,” said Steve Voorhees, WestRock’s chief executive officer. “Paper and packaging markets remain attractive and, with the momentum that we have across our businesses, we expect to exceed our previously announced financial goals for fiscal 2018. As a result, we have raised our guidance for annual sales and EBITDA.”

Consolidated Financial Results

WestRock’s performance for the three months ended March 31, 2018 and March 31, 2017 (in millions):

      
 Three Months Ended Three Months Ended  
 March 31, 2018 March 31, 2017 Change
      
Net sales$4,017.0  $3,656.3  $360.7 
      
Segment income$368.2  $295.8  $72.4 
Non-allocated expenses (16.1)  (12.6)  (3.5)
Depreciation 233.4   207.5   25.9 
Amortization 84.3   56.4   27.9 
Less: Deferred financing costs (1.4)  (1.1)  (0.3)
Segment EBITDA$668.4  $546.0  $122.4 
Inventory step-up, net of LIFO 0.4   0.5   (0.1)
Adjusted Segment EBITDA$668.8  $546.5  $122.3 
      

The $361 million increase in net sales compared to the prior year quarter was primarily attributable to $179 million of increased Corrugated Packaging segment sales driven by higher selling price/mix and $250 million of increased Consumer Packaging segment sales, primarily due to the contribution from the Multi Packaging Solutions acquisition. Those increases were partially offset by the absence of net sales from WestRock’s former Home Health & Beauty business (“HH&B”) due to the sale of HH&B in April 2017. In addition, Land and Development segment sales were $73 million lower than the prior year quarter due to the timing of real estate sales.

The $72 million increase in segment income was primarily due to $93 million of increased Corrugated Packaging segment income, which was partially offset by $20 million of decreased Consumer Packaging segment income, including the absence of $24 million of income due to sale of HH&B. Adjusted Segment EBITDA increased 22% compared to the prior year quarter.

Additional information about the changes in segment sales and income is included in the discussions below.

Restructuring and Other Items

Restructuring and other items during the second quarter of fiscal 2018 included the following pre-tax costs:

  • $21 million of restructuring costs primarily associated with the consolidation of operations
  • $6 million of acquisition costs, primarily related to the Plymouth acquisition and the planned KapStone acquisition
  • $5 million of integration costs

Cash Provided By Operating, Financing and Investing Activities

Net cash provided by operating activities was $372 million in the second quarter of fiscal 2018 compared to $300 million in the prior year quarter, as higher cash earnings exceeded an increased use of working capital and lower real estate sales. Total debt was $6.7 billion at March 31, 2018. Consistent with WestRock’s disciplined capital allocation strategy, during the second quarter WestRock invested $213 million in capital expenditures, deployed $189 million to strategic acquisitions and paid $110 million in dividends to its stockholders.

Segment Results

Corrugated Packaging Segment

      
 Three Months Ended Three Months Ended  
 March 31, 2018 March 31, 2017 Change
      
Segment sales$2,244.3 $2,065.0 $179.3 
      
Segment income$252.8 $159.5 $93.3 
Depreciation 142.7  123.5  19.2 
Amortization 28.9  21.8  7.1 
Segment EBITDA$424.4 $304.8 $119.6 
Inventory step-up, net of LIFO 0.4  0.5  (0.1)
Adjusted Segment EBITDA$424.8 $305.3 $119.5 
      

 Operating Highlights for the Three Months Ended March 31, 2018 compared to March 31, 2017:

  • The Corrugated Packaging segment delivered a Segment EBITDA margin of 18.9% and a North American Adjusted EBITDA margin of 20.5%, up 410 and 460 basis points, respectively.
  • Segment sales increased $179 million primarily due to an estimated $177 million of favorable corrugated selling price/mix and $24 million of higher corrugated volumes that were partially offset by lower recycling sales of $20 million.
  • Segment income increased $93 million, or 58%, as favorable corrugated selling price/mix and productivity were partially offset by cost inflation and other items, including weather.
  • North America box shipments increased 6.8% on a per day basis, including the impact of acquisitions.

Consumer Packaging Segment

      
 Three Months Ended Three Months Ended  
 March 31, 2018 March 31, 2017 Change
      
Segment sales$1,804.4 $1,554.6 $249.8 
      
Segment income$99.3 $118.8 $(19.5)
Depreciation 88.9  82.0  6.9 
Amortization 54.5  34.3  20.2 
Segment EBITDA$242.7 $235.1 $7.6 
      

 Operating Highlights for the Three Months Ended March 31, 2018 compared to March 31, 2017:

  • Segment sales increased $250 million primarily due to a $423 million increase from the impact of acquisitions that was partially offset by a $146 million decrease related to the sale of HH&B and $38 million of lower volume.
  • Segment income decreased $20 million due to lower volume, higher inflation, the absence of $24 million of income from HH&B (including lower depreciation due to the business being held for sale) due to its sale in April 2017 and the impact of weather, all of which were partially offset by income from acquisitions, productivity, favorable price/mix and an acquisition reserve adjustment.
  • Shipments of paperboard and converted products increased 6.1%, driven by the impact of acquisitions.

Land and Development Segment

      
 Three Months Ended Three Months Ended  
 March 31, 2018 March 31, 2017 Change
      
Segment sales$26.7 $100.0 $(73.3)
      
Segment income$16.1 $17.5 $(1.4)
Depreciation 0.1  0.2  (0.1)
Segment EBITDA$16.2 $17.7 $(1.5)
      

WestRock’s monetization strategy is proceeding as previously disclosed. We have excluded the results of the Land and Development segment from adjusted earnings per diluted share.

Conference Call

WestRock will host a conference call to discuss its results of operations for the second quarter of fiscal 2018 and other topics that may be raised during the discussion at 8:30 a.m., Eastern Time, on April 27, 2018. The conference call, which will be webcast live, an accompanying slide presentation, and this press release can be accessed at ir.westrock.com.

Investors who wish to participate in the webcast via teleconference should dial 833-287-0804 (inside the U.S.) or 647-689-4463 (outside the U.S.) at least 15 minutes prior to the start of the call and enter the passcode 2446969. Replays of the call can be accessed at ir.westrock.com.

About WestRock

WestRock (NYSE:WRK) partners with our customers to provide differentiated paper and packaging solutions that help them win in the marketplace. WestRock’s 45,000 team members support customers around the world from more than 300 operating and business locations spanning North America, South America, Europe, Asia and Australia. Learn more at www.westrock.com.

Cautionary Statements

This release contains forward-looking statements within the meaning of the Private Securities Litigation Reform Act of 1995. Forward-looking statements are based on our current expectations, beliefs, plans or forecasts and are typically identified by words or phrases such as "may," "will," "could," "should," "would," "anticipate," "estimate," "expect," "project," "intend," "plan," "believe," "target," "prospects," "potential" and "forecast," and other words, terms and phrases of similar meaning. Forward-looking statements involve estimates, expectations, projections, goals, forecasts, assumptions, risks and uncertainties. WestRock cautions readers that a forward-looking statement is not a guarantee of future performance and that actual results could differ materially from those contained in the forward-looking statement. Such forward-looking statements include, but are not limited to, statements (i) concerning our estimates of the impact of the comprehensive tax legislation enacted by the U.S. government on December 22, 2017 (the “Tax Cuts and Jobs Act”), which estimates may continue to be refined by us in future periods, (ii) concerning our expectations that the planned acquisition of KapStone will close by the end of the September quarter or during the December quarter, subject to customary closing conditions and (iii) that paper and packaging markets remain attractive and, with the momentum that we have across our businesses; we expect to exceed our previously announced financial goals for fiscal 2018. With respect to these statements, WestRock has made assumptions regarding, among other things, economic, competitive and market conditions generally; volumes and price levels of purchases by customers; and competitive conditions in WestRock's businesses and possible adverse actions of their customers, competitors and suppliers. Among the key factors that could cause actual results to differ materially from those projected in the forward-looking statements are the following: WestRock’s and KapStone’s ability to consummate the transaction; the conditions to the completion of the transaction, including the receipt of KapStone stockholder approval; the regulatory approvals required for the transaction may not be obtained on the terms expected or on the anticipated schedule; and the parties’ ability to meet expectations regarding the timing, completion and accounting and tax treatments of the transaction. Further, WestRock's businesses are subject to a number of general risks that would affect any such forward-looking statements including, among others, decreases in demand for their products; increases in energy, raw materials, shipping and capital equipment costs; reduced supply of raw materials; fluctuations in selling prices and volumes; intense competition; the potential loss of certain customers; the scope, costs, timing and impact of any restructuring of our operations and corporate and tax structure; the occurrence of a natural disaster, such as a hurricane, winter or tropical storm, earthquake, tornado, flood, fire, or other unanticipated problems such as labor difficulties, equipment failure or unscheduled maintenance and repair, which could result in operational disruptions; our desire or ability to continue to repurchase company stock; the impact of the Tax Cuts and Jobs Act; our ability to complete, and risks and uncertainties associated with, the proposed acquisition of KapStone; and adverse changes in general market and industry conditions. Such risks and other factors that may impact management's assumptions are more particularly described in our filings with the Securities and Exchange Commission, including in Part I, Item 1A “Risk Factors” in our Annual Report on Form 10-K for the fiscal year ended September 30, 2017 and Part II, Item 1A of our Quarterly Report on Form 10-Q for the fiscal quarter ended December 31, 2017. The information contained herein speaks as of the date hereof and WestRock does not have or undertake any obligation to update or revise its forward-looking statements, whether as a result of new information, future events or otherwise.

        
WestRock Company       
Condensed Consolidated Statements of Income       
In millions, except per share amounts (unaudited)       
        
 Three Months Ended Six Months Ended
 March 31, March 31,
 2018 2017 2018 2017
        
Net sales$   4,017.0   $   3,656.3   $   7,911.0   $   7,103.5  
Cost of goods sold 3,220.4   2,980.9   6,332.0   5,836.8 
Selling, general and administrative, excluding intangible amortization 381.2   349.1   747.4   685.4 
Selling, general and administrative intangible amortization 75.2   49.6   147.7   102.2 
Multiemployer pension withdrawal -   -   180.0   - 
Pension lump sum settlement -   28.7   -   28.7 
Land and Development impairment -   42.7   27.6   42.7 
Restructuring and other costs 31.7   18.3   48.0   99.3 
Operating profit 308.5   187.0   428.3   308.4 
Interest expense, net (78.3)  (52.9)  (143.1)  (107.0)
Gain (loss) on extinguishment of debt 0.1   (0.1)  (0.9)  (0.1)
Other income, net 1.1   1.3   3.6   2.4 
Equity in income of unconsolidated entities 11.9   6.5   15.7   20.2 
Income before income taxes 243.3   141.8   303.6   223.9 
Income tax (expense) benefit (18.8)  (43.6)  1,054.4   (47.2)
Consolidated net income 224.5   98.2   1,358.0   176.7 
Less: Net (income) loss attributable to noncontrolling interests (1.3)  4.9   0.3   7.3 
Net income attributable to common stockholders$   223.2   $   103.1   $   1,358.3   $   184.0  
        
Computation of diluted earnings per share under the two-class method (in millions, except per share data):    
        
Net income attributable to common stockholders$223.2  $103.1  $1,358.3  $184.0 
Less:  Distributed and undistributed income available to participating securities -   -   (0.2)  - 
Distributed and undistributed income available to common stockholders$223.2  $103.1  $1,358.1  $184.0 
        
Diluted weighted average shares outstanding 260.3   254.6   259.7   254.9 
        
Diluted earnings per share$   0.86   $   0.40   $   5.23   $   0.72  


WestRock Company       
Segment Information       
In millions (unaudited)       
        
 Three Months Ended Six Months Ended
 March 31, March 31,
 2018 2017 2018 2017
Net sales:       
        
Corrugated Packaging$2,244.3  $2,065.0  $4,422.9  $4,008.6 
Consumer Packaging 1,804.4   1,554.6   3,567.7   3,065.5 
Land and Development 26.7   100.0   38.1   154.0 
Intersegment Eliminations (58.4)  (63.3)  (117.7)  (124.6)
Total net sales$   4,017.0   $   3,656.3   $   7,911.0   $   7,103.5  
        
Income before income taxes:       
        
Corrugated Packaging$252.8  $159.5  $516.9  $301.0 
Consumer Packaging 99.3   118.8   191.7   206.4 
Land and Development 16.1   17.5   15.4   19.2 
Total segment income   368.2      295.8      724.0      526.6  
        
Multiemployer pension withdrawal -   -   (180.0)  - 
Pension lump sum settlement -   (28.7)  -   (28.7)
Land and Development impairment -   (42.7)  (27.6)  (42.7)
Restructuring and other costs (31.7)  (18.3)  (48.0)  (99.3)
Non-allocated expenses (16.1)  (12.6)  (24.4)  (27.3)
Interest expense, net (78.3)  (52.9)  (143.1)  (107.0)
Gain (loss) on extinguishment of debt 0.1   (0.1)  (0.9)  (0.1)
Other income, net 1.1   1.3   3.6   2.4 
Income before income taxes$   243.3   $   141.8   $   303.6   $   223.9  


WestRock Company       
Condensed Consolidated Statements of Cash Flows       
In millions (unaudited)       
 Three Months Ended Six Months Ended
 March 31, March 31,
 2018 2017 2018 2017
Cash flows from operating activities:       
Consolidated net income$224.5  $98.2  $1,358.0  $176.7 
        
Adjustments to reconcile consolidated net income to net cash provided by       
operating activities:       
Depreciation, depletion and amortization 317.7   263.9   625.4   539.1 
Cost of real estate sold 19.5   73.3   27.1   124.6 
Deferred income tax expense (benefit) 11.9   (36.7)  (1,222.7)  (55.5)
(Gain) loss on extinguishment of debt (0.1)  0.1   0.9   0.1 
Share-based compensation expense 19.3   17.4   33.9   34.5 
Loss (gain) on disposal of plant and equipment and other, net 2.5   (8.1)  4.0   (8.5)
Equity in income of unconsolidated entities (11.9)  (6.5)  (15.7)  (20.2)
Pension and other postretirement funding (more) less than expense (income) (25.9)  7.0   (49.8)  (10.0)
Multiemployer pension withdrawal -   -   180.0   - 
Gain on sale or deconsolidation of subsidiaries 1.8   1.7   1.5   1.7 
Cash surrender value increase in excess of premium paid (5.6)  (12.1)  (17.1)  (18.4)
Impairment adjustments 4.0   6.9   10.4   45.0 
Distributed earnings from equity investments 12.0   4.1   12.1   12.7 
Other non-cash items 9.8   (8.3)  (0.2)  (21.7)
Land and Development impairment -   42.7   27.6   42.7 
Changes in operating assets and liabilities, net of acquisitions / divestitures:       
Accounts receivable (129.4)  (144.6)  (47.5)  (90.8)
Inventories (9.0)  (5.4)  (83.0)  (50.7)
Other assets (58.6)  (36.8)  (49.4)  (52.8)
Accounts payable 22.1   52.2   (67.3)  218.7 
Income taxes (24.1)  13.2   94.1   10.3 
Accrued liabilities and other (8.9)  (22.5)  (87.2)  (60.4)
  Net cash provided by operating activities   371.6      299.7      735.1      817.1  
        
Investing activities:       
        
Capital expenditures (212.6)  (189.2)  (426.7)  (365.3)
Cash paid for purchase of businesses, net of cash acquired (188.6)  (35.2)  (185.2)  (31.7)
Corporate-owned life insurance premium paid (1.1)  (0.1)  (1.1)  (0.8)
Investment in unconsolidated entities (0.3)  -   (111.0)  (1.4)
Cash related to sale or deconsolidation of subsidiary (1.7)  -   (1.7)  - 
Return of capital from unconsolidated entities 6.9   3.1   7.5   12.6 
Proceeds from sale of property, plant and equipment 3.6   24.9   15.7   29.6 
  Net cash used for investing activities   (393.8)    (196.5)    (702.5)    (357.0)
        
Financing activities:       
        
Proceeds from issuance of notes 1,197.3   -   1,197.3   - 
Additions to revolving credit facilities 6.7   62.2   94.3   65.6 
Additions to debt 377.9   0.6   853.2   1.2 
Repayments of debt (959.8)  (170.4)  (2,010.4)  (175.9)
Changes in commercial paper, net (491.4)  -   63.3   - 
Other financing (repayments) additions, net (11.0)  18.4   (24.5)  7.8 
Debt issuance costs (24.0)  -   (24.0)  - 
Issuances of common stock, net of related minimum tax withholdings 6.0   (2.0)  17.4   7.2 
Purchases of common stock -   (25.0)  -   (93.0)
Excess tax benefits from share-based compensation -   0.8   -   1.5 
Repayments from unconsolidated entity (1.6)  (1.9)  (0.9)  (0.9)
Cash dividends paid to shareholders (109.8)  (100.7)  (219.4)  (201.1)
Cash distributions paid to noncontrolling interests (7.1)  (1.1)  (8.6)  (22.1)
  Net cash used for financing activities   (16.8)    (219.1)    (62.3)    (409.7)
        
Effect of exchange rate changes on cash and cash equivalents (0.9)  7.9   (1.9)  (6.0)
(Decrease) Increase in cash and cash equivalents   (39.9)    (108.0)    (31.6)    44.4  
        
Cash and cash equivalents at beginning of period 306.4   493.3   298.1   340.9 
Cash and cash equivalents at end of period$   266.5   $   385.3   $   266.5   $   385.3  
        
Supplemental disclosure of cash flow information       
Cash paid during the period for:       
Income taxes, net of refunds$28.0  $67.1  $69.8  $90.6 
Interest, net of amounts capitalized$107.9  $95.0  $135.1  $115.5 


WestRock Company   
Condensed Consolidated Balance Sheets   
In millions (unaudited)   
    
 March 31, September 30,
 2018 2017
Assets   
Current assets:   
Cash and cash equivalents$266.5 $298.1
Restricted cash 5.9  5.9
Accounts receivable (net of allowances of $48.9 and $45.8) 1,950.2  1,886.8
Inventories 1,888.2  1,797.3
Other current assets 311.4  329.2
Assets held for sale 154.5  173.6
Total current assets   4,576.7     4,490.9
    
Property, plant and equipment, net 9,056.8  9,118.3
Goodwill 5,583.0  5,528.3
Intangibles, net 3,311.7  3,329.3
Restricted assets held by special purpose entities 1,284.3  1,287.4
Prepaid pension asset 407.5  368.0
Other assets 1,219.7  966.8
Total Assets$   25,439.7  $   25,089.0
    
Liabilities and Equity   
Current liabilities:   
Current portion of debt$1,113.5 $608.7
Accounts payable 1,442.9  1,492.1
Accrued compensation and benefits 333.2  416.7
Other current liabilities 455.9  492.3
Total current liabilities   3,345.5     3,009.8
    
Long-term debt due after one year 5,613.0  5,946.1
Pension liabilities, net of current portion 261.2  279.4
Postretirement medical liabilities, net of current portion 150.8  153.4
Non-recourse liabilities held by special purpose entities 1,157.9  1,161.9
Deferred income taxes 2,305.8  3,410.2
Other long-term liabilities 1,018.5  737.4
Redeemable noncontrolling interests 4.8  4.7
    
Total stockholders' equity 11,547.9  10,342.5
Noncontrolling interests 34.3  43.6
Total Equity 11,582.2  10,386.1
Total Liabilities and Equity$   25,439.7  $   25,089.0
    

Non-GAAP Financial Measures and Reconciliations

WestRock reports its financial results in accordance with accounting principles generally accepted in the United States ("GAAP"). However, management believes certain non-GAAP financial measures provide investors and other users with additional meaningful financial information that should be considered when assessing our ongoing performance. Management also uses these non-GAAP financial measures in making financial, operating and planning decisions, and in evaluating WestRock’s performance. Non-GAAP financial measures should be viewed in addition to, and not as an alternative for, WestRock’s GAAP results. The non-GAAP financial measures we present may differ from similarly captioned measures presented by other companies. We discuss below details of the non-GAAP financial measures presented by us and provide reconciliations of these non-GAAP financial measures to the most directly comparable financial measures calculated in accordance with GAAP.

Adjusted Segment EBITDA

WestRock uses “Adjusted Segment EBITDA”, along with other factors, to evaluate our segment performance against our peers. Management believes this measure is also useful to investors to evaluate WestRock’s performance relative to its peers. The consolidated financial results and segment tables include a reconciliation of “Adjusted Segment EBITDA” to “Segment EBITDA”.

Adjusted Segment EBITDA Margins

WestRock uses “Adjusted Segment EBITDA Margins”, along with other factors, to evaluate our segment performance against our peers. Management believes this measure is also useful to investors to evaluate WestRock’s performance relative to its peers. “Segment EBITDA Margin” is calculated for each segment by dividing that segment’s Segment EBITDA by Segment sales. “Adjusted Segment EBITDA Margin” is calculated for each segment by dividing that segment’s Adjusted Segment EBITDA by Adjusted Segment Sales.

Set forth below is a reconciliation of Adjusted Segment Sales, Adjusted Segment EBITDA and Adjusted Segment EBITDA Margins to the most directly comparable GAAP measures, Segment Sales and Segment Income for the quarter ended March 31, 2018 (in millions, except percentages):

          
 Corrugated
Packaging
 Consumer
Packaging
 Land and
Development
 Corporate
/ Elim.
 Consolidated
          
Segment / Net Sales$2,244.3  $1,804.4  $26.7 $(58.4) $4,017.0 
Less: Trade Sales (83.2)  -   -  -   (83.2)
Adjusted Segment Sales$2,161.1  $1,804.4  $26.7 $(58.4) $3,933.8 
          
Segment income$252.8  $99.3  $16.1 $-  $368.2 
Non-allocated expenses -   -   -  (16.1)  (16.1)
Depreciation & Amortization 171.6   143.4   0.1  2.6   317.7 
Less: Deferred Financing costs -   -   -  (1.4)  (1.4)
Segment EBITDA$424.4  $242.7  $16.2 $(14.9) $668.4 
Plus: Inventory step-up 0.4   -   -  -   0.4 
Adjusted Segment EBITDA$424.8  $242.7  $16.2 $(14.9) $668.8 
          
Segment EBITDA Margins 18.9%  13.5%      
Adj. Segment EBITDA Margins 19.7%  13.5%      


 North
American
Corrugated
 Brazil
Corrugated
 Other Total
Corrugated
Packaging
        
Segment Sales$1,996.3  $112.8  $135.2 $2,244.3 
Less: Trade Sales (83.2)  -   -  (83.2)
Adjusted Segment Sales$1,913.1  $112.8  $135.2 $2,161.1 
        
Segment Income$239.5  $13.1  $0.2 $252.8 
Depreciation & Amortization 152.0   17.1   2.5  171.6 
Segment EBITDA$391.5  $30.2  $2.7 $424.4 
Plus: Inventory step-up 0.4   -   -  0.4 
Adjusted Segment EBITDA$391.9  $30.2  $2.7 $424.8 
        
Segment EBITDA Margins 19.6%  26.8%    18.9%
Adj. Segment EBITDA Margins 20.5%  26.8%    19.7%
        

Set forth below is a reconciliation of Adjusted Segment Sales, Adjusted Segment EBITDA and Adjusted Segment EBITDA Margins to the most directly comparable GAAP measures, Segment Sales and Segment Income for the quarter ended March 31, 2017 (in millions, except percentages):

          
 Corrugated
Packaging
 Consumer
Packaging
 Land and
Development
 Corporate
/ Elim.
 Consolidated
          
Segment / Net Sales$2,065.0  $1,554.6  $100.0 $(63.3) $3,656.3 
Less: Trade Sales (72.0)  -   -  -   (72.0)
Adjusted Segment Sales$1,993.0  $1,554.6  $100.0 $(63.3) $3,584.3 
          
Segment Income$159.5  $118.8  $17.5 $-  $295.8 
Non-allocated expenses -   -   -  (12.6)  (12.6)
Depreciation & Amortization 145.3   116.3   0.2  2.1   263.9 
Less: Deferred Financing costs -   -   -  (1.1)  (1.1)
Segment EBITDA$304.8  $235.1  $17.7 $(11.6) $546.0 
Plus: Inventory step-up 0.5   -   -  -   0.5 
Adjusted Segment EBITDA$305.3  $235.1  $17.7 $(11.6) $546.5 
          
Segment EBITDA Margins 14.8%  15.1%      
Adj. Segment EBITDA Margins 15.3%  15.1%      


 North
American
Corrugated
 Brazil
Corrugated
 Other Total
Corrugated
Packaging
        
Segment Sales$1,807.3  $104.7  $153.0 $2,065.0 
Less: Trade Sales (72.0)  -   -  (72.0)
Adjusted Segment Sales$1,735.3  $104.7  $153.0 $1,993.0 
        
Segment income$146.7  $5.8  $7.0 $159.5 
Depreciation & Amortization 128.2   14.5   2.6  145.3 
Segment EBITDA$274.9  $20.3  $9.6 $304.8 
Plus: Inventory step-up 0.5   -   -  0.5 
Adjusted Segment EBITDA$275.4  $20.3  $9.6 $305.3 
        
Segment EBITDA Margins 15.2%  19.4%    14.8%
Adj. Segment EBITDA Margins 15.9%  19.4%    15.3%
        

Adjusted Operating Cash Flow

WestRock uses the non-GAAP financial measure “Adjusted Operating Cash Flow”. Management believes this non-GAAP financial measure provides WestRock’s board of directors, investors, potential investors, securities analysts and others with useful information to evaluate its performance relative to other periods because it excludes certain cash restructuring and other costs, net of tax that management believes are not indicative of the ongoing operating results of the business. WestRock believes that the most directly comparable GAAP measure is “Net cash provided by operating activities”. Set forth below is a reconciliation of “Adjusted Operating Cash Flow” to Net cash provided by operating activities for the three months ended March 31, 2018 (in millions).

   
Net cash provided by operating activities$    371.6
Plus: Cash Restructuring and other costs, net of income tax benefit of $2.7     7.9
Adjusted Operating Cash Flow$    379.5
   

Adjusted Net Income and Adjusted Earnings per Diluted Share

WestRock uses the non-GAAP financial measures “adjusted net income” and “adjusted earnings per diluted share”. Management believes these non-GAAP financial measures provide WestRock’s board of directors, investors, potential investors, securities analysts and others with useful information to evaluate its performance because they exclude restructuring and other costs, net, and other specific items that management believes are not indicative of the ongoing operating results of the business. WestRock and its board of directors use these measures to evaluate its performance relative to other periods. WestRock believes that the most directly comparable GAAP measures are Net income attributable to common stockholders, represented in the table below as the GAAP Results for Consolidated net income (i.e. Net of Tax) plus Noncontrolling interests, and Earnings per diluted share, respectively. This press release includes a reconciliation of Earnings per diluted share to Adjusted earnings per diluted share. Set forth below is a reconciliation of Adjusted net income to Net income attributable to common stockholders (in millions).

  
 Three Months Ended March 31, 2018
      
 Pre-Tax Tax Net of Tax
GAAP Results (1)$243.3  $(18.8) $224.5 
Impact of Tax Cuts and Jobs Act -   (31.5)  (31.5)
Restructuring and other items 31.7   (8.2)  23.5 
Inventory stepped-up in purchase accounting, net of LIFO 0.4   (0.1)  0.3 
Land and Development operating results including impairment (16.6)  4.3   (12.3)
Losses at closed plants and transition costs 4.1   (1.0)  3.1 
Accelerated depreciation on major capital projects 7.3   (2.1)  5.2 
Gain on extinguishment of debt (0.1)  -   (0.1)
Consumer Packaging segment acquisition reserve adjustment (10.0)  2.6   (7.4)
Acquisition bridge and other financing fees 10.1   (2.6)  7.5 
Other 5.5   (1.2)  4.3 
Adjusted Results$275.7  $(58.6) $217.1 
Noncontrolling interests     (1.3)
Adjusted Net Income    $215.8 
      
(1) The GAAP results for Pre-Tax, Tax and Net of Tax are equivalent to the line items "Income before income taxes", "Income tax (expense) benefit" and "Consolidated net income", respectively, as reported on the statements of income.


 Three Months Ended March 31, 2017
      
 Pre-Tax Tax Net of Tax
GAAP Results (1)$141.8  $(43.6) $98.2 
HH&B – impact of held for sale accounting (10.1)  2.3   (7.8)
Restructuring and other items 18.3   (9.8)  8.5 
Pension lump sum settlement 28.7   (11.0)  17.7 
Inventory stepped-up in purchase accounting, net of LIFO 0.5   (0.2)  0.3 
Land and Development operating results including impairment 18.1   (7.2)  10.9 
Losses at closed plants and transition costs 2.8   (0.9)  1.9 
Gain on sale or deconsolidation of subsidiaries 1.7   (0.6)  1.1 
Other 2.3   (0.7)  1.6 
Adjusted Results$204.1  $(71.7) $132.4 
Noncontrolling interests     4.9 
Adjusted Net Income    $137.3 
      
(1) The GAAP results for Pre-Tax, Tax and Net of Tax are equivalent to the line items "Income before income taxes", "Income tax (expense) benefit" and "Consolidated net income", respectively, as reported on the statements of income.
 

Adjusted Earnings per Diluted Share

Set forth below is a reconciliation Earnings per diluted share to Adjusted earnings per diluted share.

    
 Three Months Three Months
 Ended Ended
 March 31, 2018 March 31, 2017
    
Earnings per diluted share$   0.86   $   0.40  
    
Impact of Tax Cuts and Jobs Act (0.12)  - 
Restructuring and other items 0.09   0.03 
Land and Development operating results including impairment (0.05)  0.05 
Losses at closed plants and transition costs 0.01   0.01 
Accelerated depreciation on major capital projects 0.02   - 
Consumer Packaging segment acquisition reserve adjustment (0.03)  - 
Acquisition bridge and other financing fees 0.03   - 
Pension lump sum settlement -   0.07 
HH&B – impact of sale accounting -   (0.03)
Other 0.02   0.01 
Adjusted earnings per diluted share$   0.83   $   0.54  
        

Adjusted Tax Rate

WestRock uses the non-GAAP financial measure “Adjusted Tax Rate”. Management believes this non-GAAP financial measure is useful because it adjusts our GAAP effective tax rate to exclude the impact of restructuring and other costs, net, and other specific items that management believes are not indicative of the ongoing operating results of the business. “Adjusted Tax Rate” is calculated as “Adjusted Tax Expense” divided by “Adjusted Pre-Tax Income”. WestRock believes that the most directly comparable GAAP measures to Adjusted Pre-Tax Income and Adjusted Tax Expense are “Income before income taxes” and “Income tax (expense) benefit”, respectively. Set forth in the tables above is a reconciliation of “Adjusted Tax Expense” to “Income tax (expense) benefit” for the three months ended March 31, 2018 and March 31, 2017. The results of which, are included in the table below to compute the “Adjusted Tax Rate” (in millions).

    
 Three Months Ended
 March 31, 2018 March 31, 2017
    
Adusted pre-tax income$  275.7  $  204.1 
Adjusted tax expense   (58.6)    (71.7)
 $  217.1  $  132.4 
    
Adjusted Tax Rate 21.3%  35.1%
    

CONTACT:                   

Investors:                                                                                 Media:
James Armstrong, 470-328-6327                                            John Pensec, 470-328-6397
Vice President, Investor Relations                                            Director, Corporate Communications
james.armstrong@westrock.com                                             mediainquiries@westrock.com
           
John Stakel, 678-291-7901
Senior Vice President – Treasurer
john.stakel@westrock.com

EX-99.2 3 exh_992.htm PRESENTATION EdgarFiling

EXHIBIT 99.2


Q2 FY18 Results April 27, 2018 Steve Voorhees Chief Executive Officer Ward Dickson Chief Financial Officer Jeff Chalovich President, Corrugated Packaging Bob Feeser President, Consumer Packaging


2 Forward Looking Statements This presentation contains forward - looking statements within the meaning of the Private Securities Litigation Reform Act of 1995 , including but not limited to the statements on the slides entitled “Q2 FY18 Key Highlights”, “Q2 FY18 Consumer Packaging Results”, “Q2 FY18 Land and De vel opment Results”, “Synergy and Performance Improvements”, “Q3 FY18 Sequential Guidance”, “Full Year 2018 Guidance”, “Mill Maintenance Schedule” , a nd “Key Commodity Annual Consumption Volumes and FX by Currency” that give guidance or estimates for future periods as well as statem ent s regarding, among other things, that we are implementing strategic investments at the Florence, SC containerboard mill, Mahrt , AL CNK mill and Porto Feliz , Brazil box plant; the MPS internalization is on track for a full 100k ton run rate by the end of the fourth quarter of fiscal 2018; tha t we are on target to achieve the overall monetization goal for our Land and Development segment of after - tax free cash flow of $275 to $300 million by the end of calendar year 2018; that we will achieve our $1 billion synergy and productivity goal by the end of the third quarter of fiscal 2018; that we expect a to tal of +$98 to +$118 million of impacts on our third quarter adjusted EBITDA, comprised of (a) +$75 to +$90 million of price, mix, volume & productivity, (b) - $ 20 million of maintenance downtime, (c) +$15 to +$20 million of commodity deflation and +$28 million of weather disruptions, as well as other adjusting ea rnings per share items totaling - $0.08 to - $0.10 per share; that we expect adjusted segment EBITDA associated with the adjusted earnings per share of $ 747 to $767 million; that we expect third quarter adjusted earnings per share to be significantly higher than second quarter adjusted earnings per sh are; that we expect 10% revenue growth (to >$16.4 billion), 25% to 30% adjusted EBITDA growth (to >$2.9 billion) and 20% to 25% adjusted operating ca sh flow growth (to >$2.45 billion) in fiscal 2018 compared to fiscal 2017; we expect to follow the maintenance schedule presented on slide 16; a nd that we estimate our annual consumption volumes of key commodities and impact from key currencies is as presented on slide 17. Forward - looking statements are based on our current expectations, beliefs, plans or forecasts and are typically identified by wo rds or phrases such as "may," "will," "could," "should," "would," "anticipate," "estimate," "expect," "project," "intend," "plan," "believe," "targe t," "prospects," "potential" and "forecast," and other words, terms and phrases of similar meaning. Forward - looking statements involve estimates, expectations, p rojections, goals, forecasts, assumptions, risks and uncertainties. WestRock cautions readers that a forward - looking statement is not a guarantee o f future performance and that actual results could differ materially from those contained in the forward - looking statement. WestRock’s businesses are subject to a number of general risks that would affect any such forward - looking statements, including, among others, decreases in demand for their prod ucts; increases in energy, raw materials, shipping and capital equipment costs; reduced supply of raw materials; fluctuations in selling prices and volumes; intense competition; the potential loss of certain customers; the scope, costs, timing and impact of any restructuring of our operati ons and corporate and tax structure; the occurrence of a natural disaster, such as a hurricane, winter or tropical storm, earthquake, tornado, flood, f ire , or other unanticipated problems such as labor difficulties, equipment failure or unscheduled maintenance and repair, which could result in operation al disruptions of varied duration; our desire or ability to continue to repurchase company stock; and adverse changes in general market and industry c ond itions. Further, WestRock's businesses are subject to a number of general risks that would affect any such forward - looking statements. Such risks and other factors that may impact management's assumptions are more particularly described in our filings with the Securities and Exchange Commissio n, including in Item 1A under the caption "Risk Factors" in our Annual Report on Form 10 - K for the year ended September 30, 2017 and our Form 10 - Q for t he quarter ended December 31, 2017. The information contained herein speaks as of the date hereof and WestRock does not have or undertake any obl igation to update or revise its forward - looking statements, whether as a result of new information, future events or otherwise.


3 Disclaimer; Non - GAAP Financial Measures We may from time to time be in possession of certain information regarding WestRock that applicable law would not require us to disclose to the public in the ordinary course of business, but would require us to disclose if we were engaged in the purchase or sale of our securitie s. This presentation shall not be considered to be part of any solicitation of an offer to buy or sell WestRock securities. This presentation also may not i ncl ude all of the information regarding WestRock that you may need to make an investment decision regarding WestRock securities. Any investment decision sh oul d be made on the basis of the total mix of information regarding WestRock that is publicly available as of the date of the investment decision . We report our financial results in accordance with accounting principles generally accepted in the United States ("GAAP"). Ho wev er, management believes certain non - GAAP financial measures provide users with additional meaningful financial information that should be consi dered when assessing our ongoing performance. Management also uses these non - GAAP financial measures in making financial, operating and planning deci sions and in evaluating our performance. Non - GAAP financial measures should be viewed in addition to, and not as an alternative for, our GAAP results. The non - GAAP financial measures we present may differ from similarly captioned measures presented by other companies. See the Append ix for details about these non - GAAP financial measures, as well as the required reconciliations.


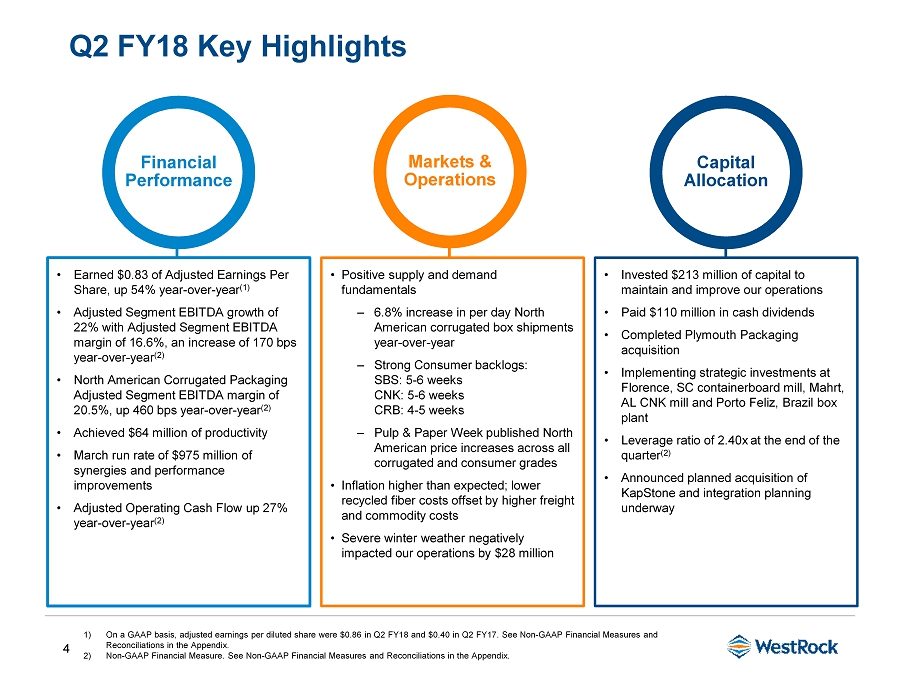
4 Q2 FY18 Key Highlights • Positive supply and demand fundamentals ‒ 6.8% increase in per day North American corrugated box shipments year - over - year ‒ Strong Consumer backlogs: SBS: 5 - 6 weeks CNK: 5 - 6 weeks CRB: 4 - 5 weeks ‒ Pulp & Paper Week published North American price increases across all corrugated and consumer grades • Inflation higher than expected; lower recycled fiber costs offset by higher freight and commodity costs • Severe winter weather negatively impacted our operations by $28 million • Invested $ 213 million of capital to maintain and improve our operations • Paid $110 million in cash dividends • Completed Plymouth Packaging acquisition • Implementing strategic investments at Florence, SC containerboard mill, Mahrt , AL CNK mill and Porto Feliz, Brazil box plant • Leverage ratio of 2.40x at the end of the quarter (2) • Announced planned acquisition of KapStone and integration planning underway • Earned $0.83 of Adjusted E arnings P er S hare, up 54 % year - over - year (1) • Adjusted Segment EBITDA growth of 22% with Adjusted Segment EBITDA margin of 16.6%, an increase of 170 bps year - over - year (2) • North American Corrugated Packaging Adjusted Segment EBITDA margin of 20.5%, up 460 bps year - over - year (2) • Achieved $64 million of productivity • March run rate of $975 million of synergies and performance improvements • Adjusted Operating Cash Flow up 27% year - over - year (2) Financial Performance Markets & Operations Capital Allocation 1) On a GAAP basis, adjusted earnings per diluted share were $0.86 in Q2 FY18 and $0.40 in Q2 FY17. See Non - GAAP Financial Measures and Reconciliations in the Appendix. 2) Non - GAAP Financial Measure. See Non - GAAP Financial Measures and Reconciliations in the Appendix.


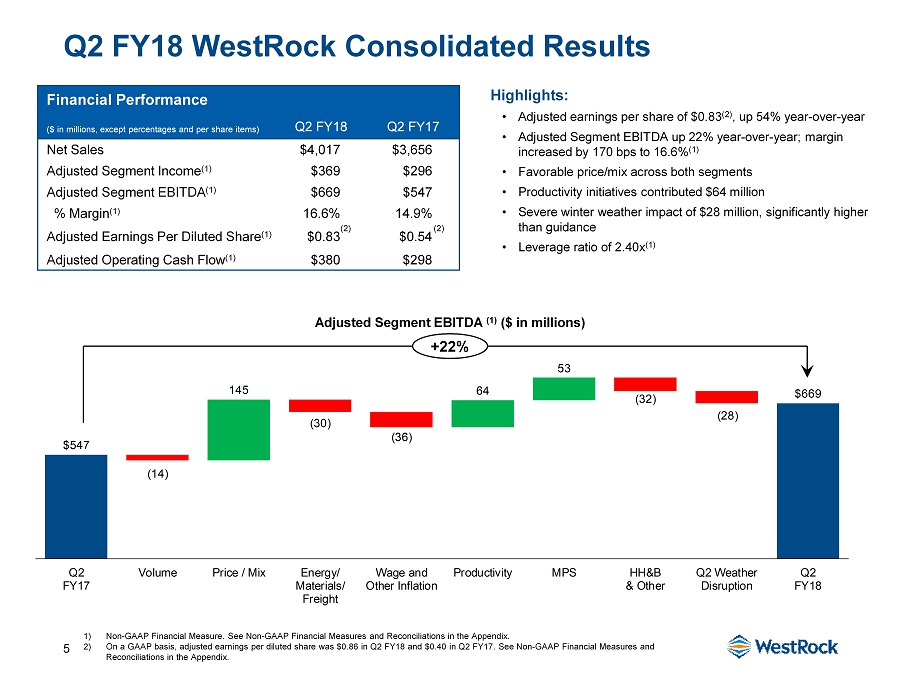
5 Q2 FY18 WestRock Consolidated Results 1) Non - GAAP Financial Measure. See Non - GAAP Financial Measures and Reconciliations in the Appendix. 2) On a GAAP basis, adjusted earnings per diluted share was $0.86 in Q2 FY18 and $0.40 in Q2 FY17. See Non - GAAP Financial Measures and Reconciliations in the Appendix. Highlights: • Adjusted earnings per share of $0.83 (2) , up 54% year - over - year • Adjusted Segment EBITDA up 22% year - over - year; margin increased by 170 bps to 16.6% (1) • Favorable price/mix across both segments • Productivity initiatives contributed $64 million • Severe winter weather impact of $28 million, significantly higher than guidance • Leverage ratio of 2.40x (1) Financial Performance ($ in millions, except percentages and per share items) Q2 FY18 Q2 FY17 Net Sales $4,017 $3,656 Adjusted Segment Income (1) $369 $296 Adjusted Segment EBITDA (1) $669 $547 % Margin (1) 16.6% 14.9% Adjusted Earnings Per Diluted Share (1) $0.83 $0.54 Adjusted Operating Cash Flow (1) $380 $298 Adjusted Segment EBITDA (1) ($ in millions) (2) (2) +22% $547 ​ 145 ​ ​ 64 53 ​ ​ $669 (14) (30) (36) (32) (28) Q2 FY17 Volume Price / Mix Energy/ Materials/ Freight Wage and Other Inflation Productivity MPS HH&B & Other Q2 Weather Disruption Q2 FY18


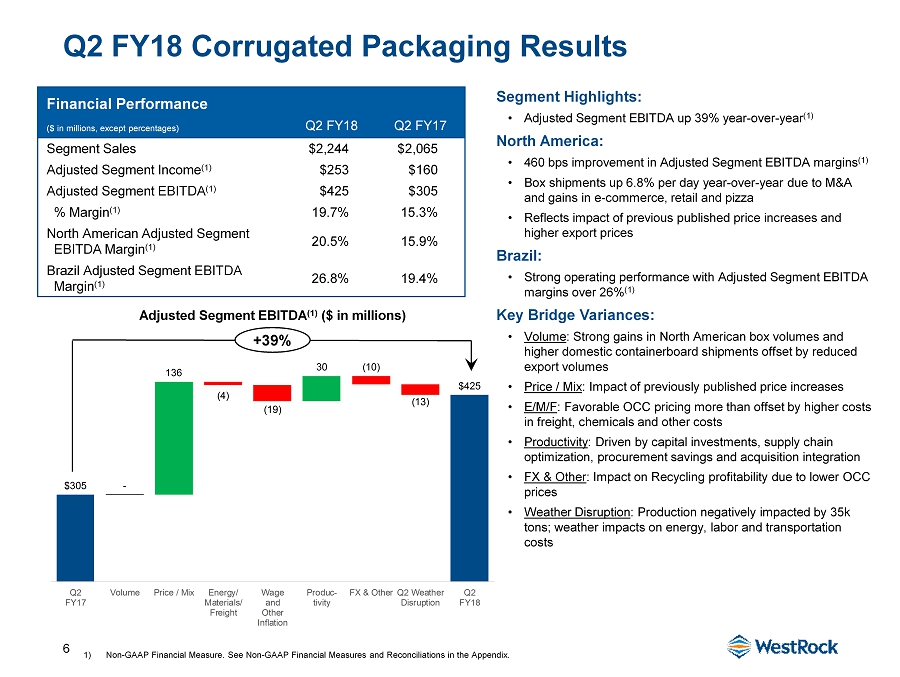
6 Q2 FY18 Corrugated Packaging Results 1) Non - GAAP Financial Measure. See Non - GAAP Financial Measures and Reconciliations in the Appendix. Segment Highlights: • Adjusted Segment EBITDA up 39% year - over - year (1) North America: • 460 bps improvement in Adjusted Segment EBITDA margins (1) • Box shipments up 6.8% per day year - over - year due to M&A and gains in e - commerce, retail and pizza • Reflects impact of previous published price increases and higher export prices Brazil: • Strong operating performance with Adjusted Segment EBITDA margins over 26% (1) Key Bridge Variances: • Volume : Strong gains in North American box volumes and higher domestic containerboard shipments offset by reduced export volumes • Price / Mix : Impact of previously published price increases • E/M/F : Favorable OCC pricing more than offset by higher costs in freight, chemicals and other costs • Productivity : Driven by capital investments, supply chain optimization, procurement savings and acquisition integration • FX & Other : Impact on Recycling profitability due to lower OCC prices • Weather Disruption : Production negatively impacted by 35k tons; weather impacts on energy, labor and transportation costs Financial Performance ($ in millions, except percentages) Q2 FY18 Q2 FY17 Segment Sales $2,244 $2,065 Adjusted Segment Income (1) $253 $160 Adjusted Segment EBITDA (1) $425 $305 % Margin (1) 19.7% 15.3% North American Adjusted Segment EBITDA Margin (1) 20.5% 15.9% Brazil Adjusted Segment EBITDA Margin (1) 26.8% 19.4% Adjusted Segment EBITDA (1) ($ in millions) +39% $305 - 136 30 $425 (4) (19) (10) (13) Q2 FY17 Volume Price / Mix Energy/ Materials/ Freight Wage and Other Inflation Produc- tivity FX & Other Q2 Weather Disruption Q2 FY18


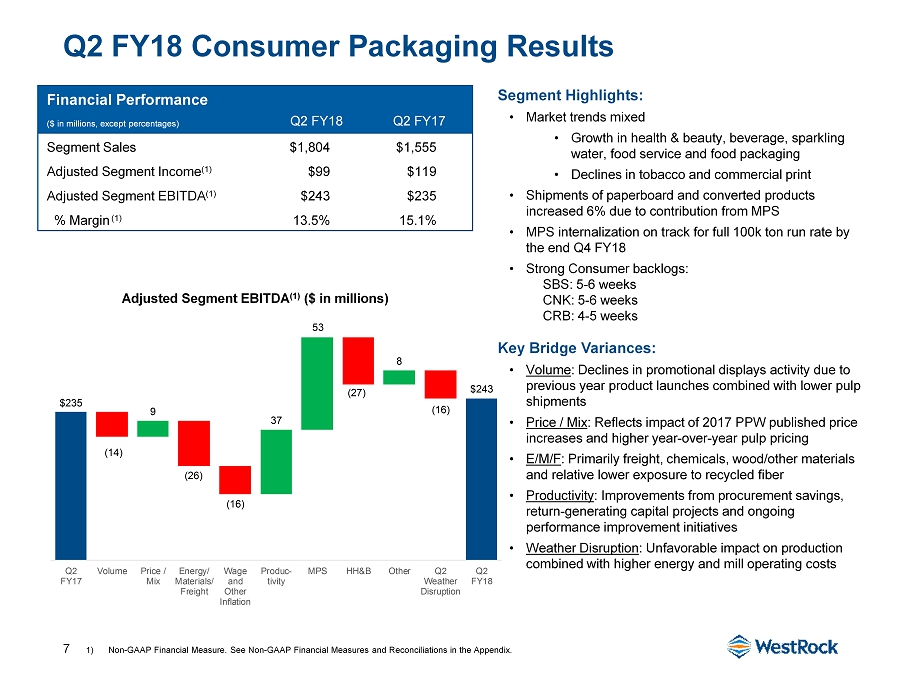
7 Q2 FY18 Consumer Packaging Results 1) Non - GAAP Financial Measure. See Non - GAAP Financial Measures and Reconciliations in the Appendix. Segment Highlights: • Market trends mixed • Growth in health & beauty, beverage, sparkling water, food service and food packaging • Declines in tobacco and commercial print • Shipments of paperboard and converted products increased 6% due to contribution from MPS • MPS internalization on track for full 100k ton run rate by the end Q4 FY18 • Strong Consumer backlogs: SBS: 5 - 6 weeks CNK: 5 - 6 weeks CRB: 4 - 5 weeks Key Bridge Variances: • Volume : Declines in promotional displays activity due to previous year product launches combined with lower pulp shipments • Price / Mix : Reflects impact of 2017 PPW published price increases and higher year - over - year pulp pricing • E/M/F : Primarily freight, chemicals, wood/other materials and relative lower exposure to recycled fiber • Productivity : Improvements from procurement savings, return - generating capital projects and ongoing performance improvement initiatives • Weather Disruption : Unfavorable impact on production combined with higher energy and mill operating costs Financial Performance ($ in millions, except percentages) Q2 FY18 Q2 FY17 Segment Sales $1,804 $1,555 Adjusted Segment Income (1) $99 $119 Adjusted Segment EBITDA (1) $243 $235 % Margin (1) 13.5% 15.1% Adjusted Segment EBITDA (1) ($ in millions) $235 9 37 53 8 $243 (14) (26) (16) (27) (16) Q2 FY17 Volume Price / Mix Energy/ Materials/ Freight Wage and Other Inflation Produc- tivity MPS HH&B Other Q2 Weather Disruption Q2 FY18


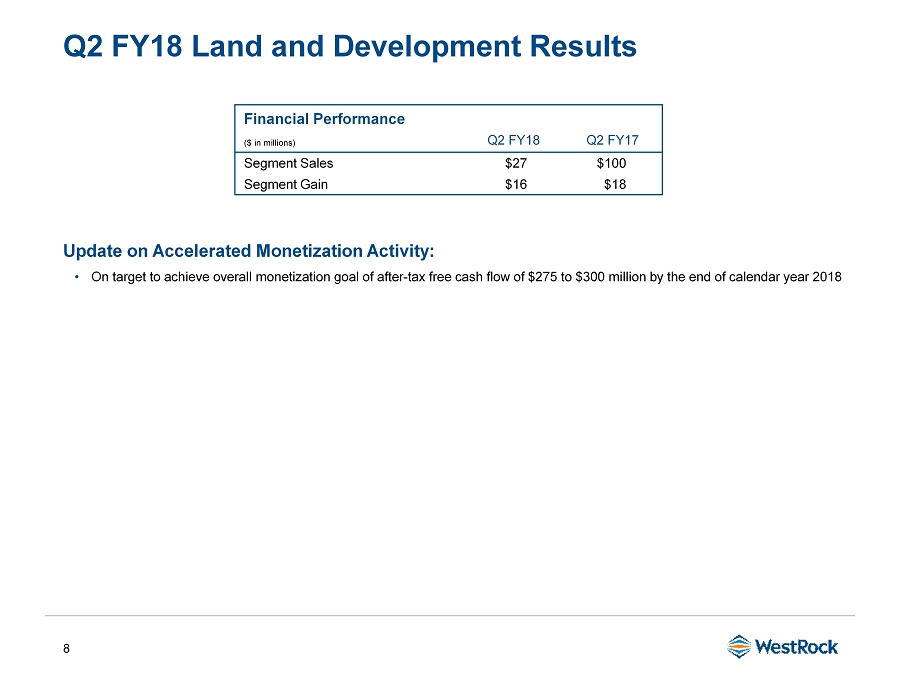
8 Update on Accelerated Monetization Activity: • On target to achieve overall monetization goal of after - tax free cash flow of $275 to $300 million by the end of calendar year 2 018 Q2 FY18 Land and Development Results Financial Performance ($ in millions) Q2 FY18 Q2 FY17 Segment Sales $27 $100 Segment Gain $16 $18


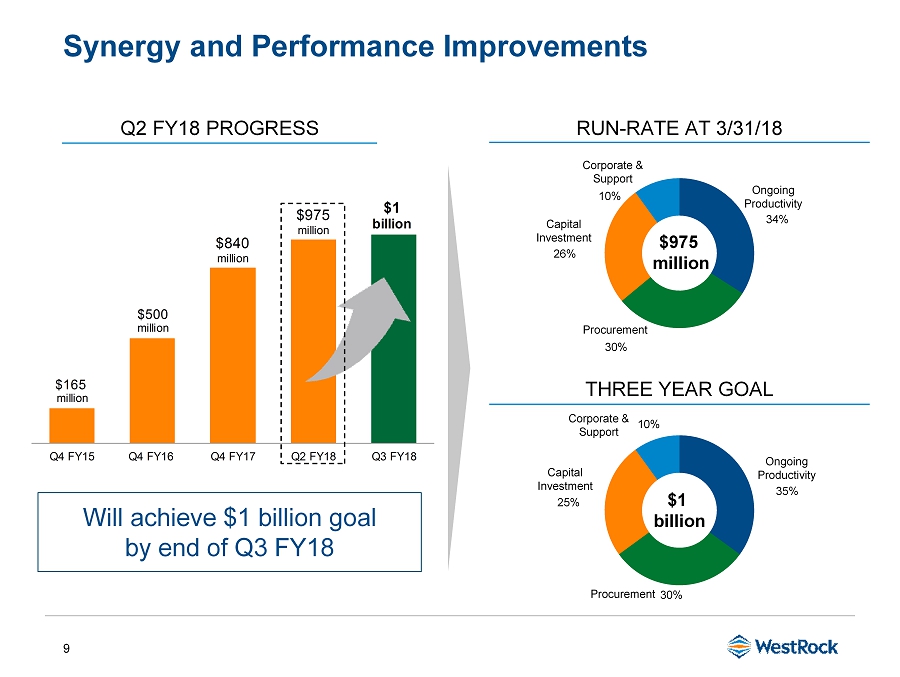
9 $165 million $840 million $975 million $1 billion $500 million Q4 FY15 Q4 FY16 Q4 FY17 Q2 FY18 Q3 FY18 Synergy and Performance Improvements Will achieve $1 billion goal by end of Q3 FY18 Q2 FY18 PROGRESS 34% 30% 26% 10% Procurement Capital Investment Ongoing Productivity Corporate & Support $1 billion RUN - RATE AT 3/31/18 THREE YEAR GOAL $975 million 10% 25% 30% 35% Corporate & Support Capital Investment Ongoing Productivity Procurement


10 Q3 FY18 Sequential Guidance 1) Non - GAAP Financial Measure 2) See reconciliation table for adjustment to Adjusted Segment EBITDA associated with Adjusted EPS on page 18 Q2 FY18 EBITDA Adjustments Adjusted Segment EBITDA (1) $668.8 million L&D and other items not included in adjusted EPS - $19.5 million Q2 FY18 Adjusted Segment EBITDA Associated with Adjusted EPS (1)(2) $649.3 million Items Impacting Q3 FY18 Adjusted EBITDA Price, Mix, Volume & Productivity +$75 to +$90 million Maintenance Downtime - $20 million Commodity Deflation +$15 to +$20 million Weather Disruptions +$28 million Total of Items Impacting Q3 FY18 Adjusted EBITDA +$98 to $118 million Q3 FY18 Adjusted Segment EBITDA Associated with Adjusted EPS $747 to $767 million Q3 FY18 Adjusted EPS Significantly Higher Than Q2 FY18 (1) Other Sequential Adjusting EPS Items – Negative $0.08 to $0.10/share Tax Rate of approximately 25.5% on adjusted income, up sequentially from 21.3%; D&A sequentially higher; Higher sequential interest expense


11 Full Year 2018 Guidance (1) >10% Revenue Growth > $16.4B 25% - 30% Adj. EBITDA (2) Growth >$2.9B 20% - 25% Adj. Operating Cash Flow (2) Growth >$2.45B 1) Growth on a year - over - year basis vs. as reported results; excludes any potential contribution from the acquisition of KapStone 2) Non - GAAP Financial Measure. See Non - GAAP Financial Measures and Forward - looking Guidance in the Appendix. Raising Revenue & Adjusted EBITDA Guidance Reaffirming Full - Year Cash Flow Guidance


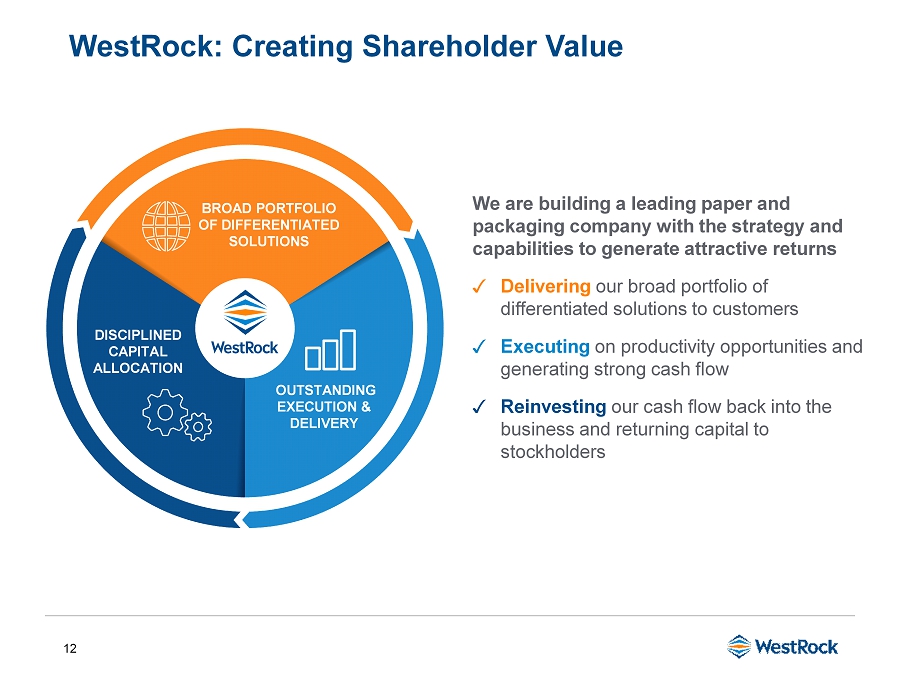
12 WestRock: Creating Shareholder Value We are building a leading paper and packaging company with the strategy and capabilities to generate attractive returns ✓ Delivering our broad portfolio of differentiated solutions to customers ✓ Executing on productivity opportunities and generating strong cash flow ✓ Reinvesting our cash flow back into the business and returning capital to stockholders OUTSTANDING EXECUTION & DELIVERY DISCIPLINED CAPITAL ALLOCATION BROAD PORTFOLIO OF DIFFERENTIATED SOLUTIONS


Appendix


14 Non - GAAP Financial Measures Adjusted Earnings Per Diluted Share We use the non - GAAP financial measure “adjusted earnings per diluted share,” also referred to as “adjusted earnings per share” o r “Adjusted EPS” because we believe this measure provides our board of directors, investors, potential investors, securities analysts and ot hers with useful information to evaluate our performance since it excludes restructuring and other costs, net, and other specific items that w e b elieve are not indicative of our ongoing operating results. Our management and board of directors use this information to evaluate our perf orm ance relative to other periods. Adjusted Operating Cash Flow We use the non - GAAP financial measure “adjusted operating cash flow” because we believe this measure provides our board of direc tors, investors, potential investors, securities analysts and others with useful information to evaluate our performance since it e xcl udes restructuring and other costs, net, and other specific items that we believe are not indicative of our ongoing operating results. While th is measure is similar to adjusted free cash flow, we believe it provides greater comparability across periods when capital expenditures are changin g s ince it excludes an adjustment for capital expenditures. We believe the most directly comparable GAAP measure is net cash provided by operati ng activities. Adjusted Segment EBITDA and Adjusted Segment EBITDA Margins We use the non - GAAP financial measures “adjusted segment EBITDA” and “adjusted segment EBITDA margins”, along with other factors , to evaluate our segment performance against the performance of our peers. We believe that investors also use these measures to eva luate our performance relative to our peers. We calculate adjusted segment EBITDA for each segment by adding that segment’s adjusted s egm ent income to its depreciation, depletion and amortization. We calculate adjusted segment EBITDA margin for each segment by divi din g that segment’s adjusted segment EBITDA by its adjusted segment sales.


15 Non - GAAP Financial Measures (cont.) Leverage Ratio We use the non - GAAP financial measure “leverage ratio” as a measurement of our operating performance and to compare to our publi cly disclosed target leverage ratio, and because we believe investors use this measure to evaluate our available borrowing capaci ty. We define leverage ratio as our Total Funded Debt divided by our Credit Agreement EBITDA, each of which term is defined in our credit a gre ement, dated July 1, 2015. Borrowing capacity under our credit agreement depends on, in addition to other measures, the Credit Agreement Deb t/EBITDA ratio or the leverage ratio. As of the March 31, 2018 calculation, our leverage ratio was 2.40 times. While the leverage rat io under our credit agreement determines the credit spread on our debt, we are not subject to a leverage ratio cap. Our credit agreement is subj ect to a Debt to Capitalization and Consolidated Interest Coverage Ratio, as defined therein. Forward - looking Guidance We are not providing forward - looking guidance for U.S. GAAP reported financial measures or a reconciliation of forward - looking n on - GAAP financial measures to the most directly comparable U.S. GAAP measure because we are unable to predict with reasonable certain ty the ultimate outcome of certain significant items without unreasonable effort. These items include, but are not limited to, merge r a nd acquisition - related expenses, restructuring expenses, asset impairments, litigation settlements, changes to contingent consideration and cer tain other gains or losses. These items are uncertain, depend on various factors, and could have a material impact on U.S. GAAP reported resul ts for the guidance period. Adjusted Tax Rate WestRock uses the non - GAAP financial measure “Adjusted Tax Rate”. Management believes this non - GAAP financial measure is useful because it adjusts our effective tax rate to exclude the impact of restructuring and other costs, net, and other specific ite ms that management believes are not indicative of the ongoing operating results of the business. “Adjusted Tax Rate” is calculated as “Adjusted Tax Expense” divided by “Adjusted Pre - Tax Income”. WestRock believes that the most directly comparable GAAP measures are “Income tax (expense) benefi t” and “Income before income taxes”, respectively.


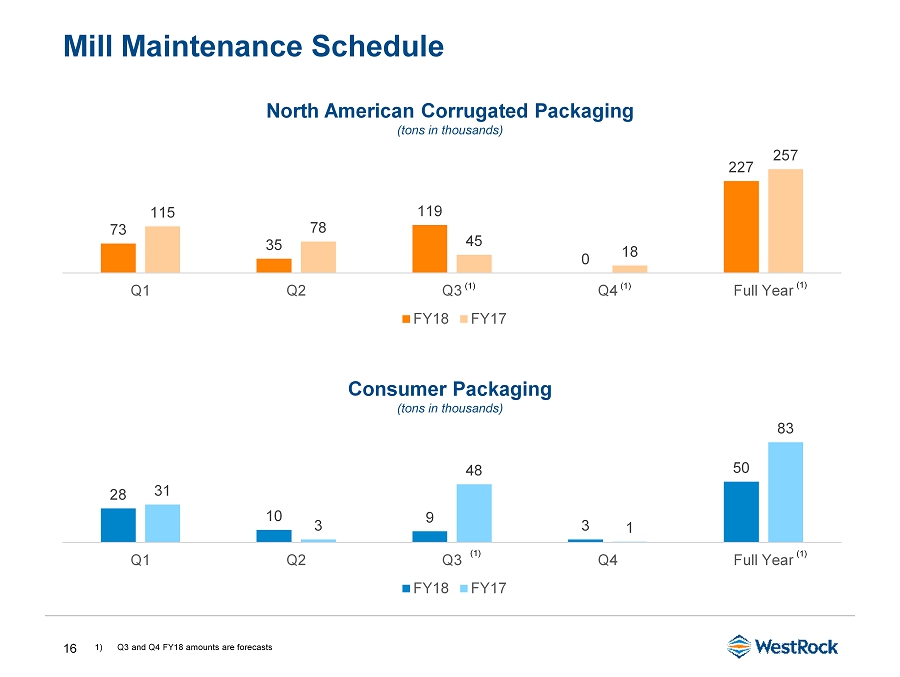
16 Mill Maintenance Schedule 1) Q3 and Q4 FY18 amounts are forecasts 73 35 119 0 227 115 78 45 18 257 Q1 Q2 Q3 Q4 Full Year FY18 FY17 28 10 9 3 50 31 3 48 1 83 Q1 Q2 Q3 Q4 Full Year FY18 FY17 North American Corrugated Packaging (tons in thousands) Consumer Packaging (tons in thousands) (1) (1) (1) (1) (1)


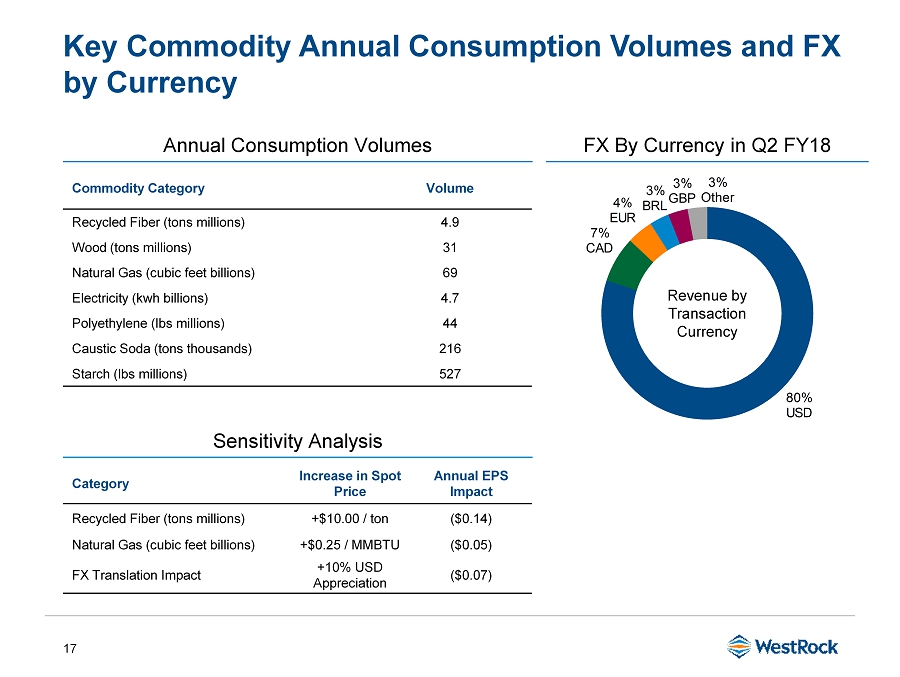
17 Key Commodity Annual Consumption Volumes and FX by Currency Commodity Category Volume Recycled Fiber (tons millions) 4.9 Wood (tons millions) 31 Natural Gas (cubic feet billions) 69 Electricity (kwh billions) 4.7 Polyethylene (lbs millions) 44 Caustic Soda (tons thousands) 216 Starch (lbs millions) 527 Annual Consumption Volumes FX By Currency in Q2 FY18 Sensitivity Analysis Category Increase in Spot Price Annual EPS Impact Recycled Fiber (tons millions) +$10.00 / ton ($0.14) Natural Gas (cubic feet billions) +$0.25 / MMBTU ($0.05) FX Translation Impact +10% USD Appreciation ($0.07) Revenue by Transaction Currency 80% USD 7% CAD 4% EUR 3% BRL 3% GBP 3% Other


18 Adjusted Segment EBTIDA Associated with Adjusted Earnings Per Share (AEPS) Q2 FY18 Adjusted Segment EBITDA 668.8$ Adjustments excluded from AEPS: Land and Development operating results including impairment (16.1) Losses at closed plants and transition costs 4.1 Consumer Packaging segment acquisition reserve adjustment (10.0) Other 2.5 Adjusted Segment EBITDA associated with AEPS 649.3 Depreciation, amortization and depletion (317.7) Accelerated depreciation on major capital projects 7.3 Deferred financing costs 1.4 Interest expense, net (78.3) Acquisition bridge fee and other 13.0 Other 0.7 Adjusted pre-tax income 275.7 Adjusted taxes (58.6) 217.1 Noncontrolling interest (1.3) Adjusted net income 215.8$ Diluted weighted average shares outstanding 260.3 Adjusted earnings per diluted share 0.83$ ($ in millions, except per share amount)


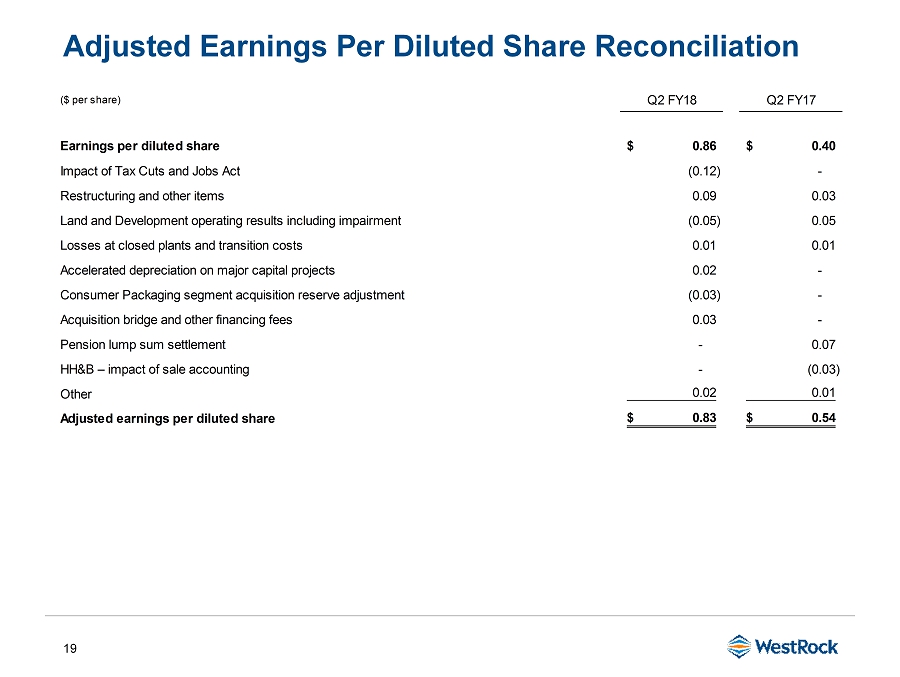
19 Adjusted Earnings Per Diluted Share Reconciliation ($ per share) Q2 FY18 Q2 FY17 Earnings per diluted share 0.86$ 0.40$ Impact of Tax Cuts and Jobs Act (0.12) - Restructuring and other items 0.09 0.03 Land and Development operating results including impairment (0.05) 0.05 Losses at closed plants and transition costs 0.01 0.01 Accelerated depreciation on major capital projects 0.02 - Consumer Packaging segment acquisition reserve adjustment (0.03) - Acquisition bridge and other financing fees 0.03 - Pension lump sum settlement - 0.07 HH&B – impact of sale accounting - (0.03) Other 0.02 0.01 Adjusted earnings per diluted share 0.83$ 0.54$


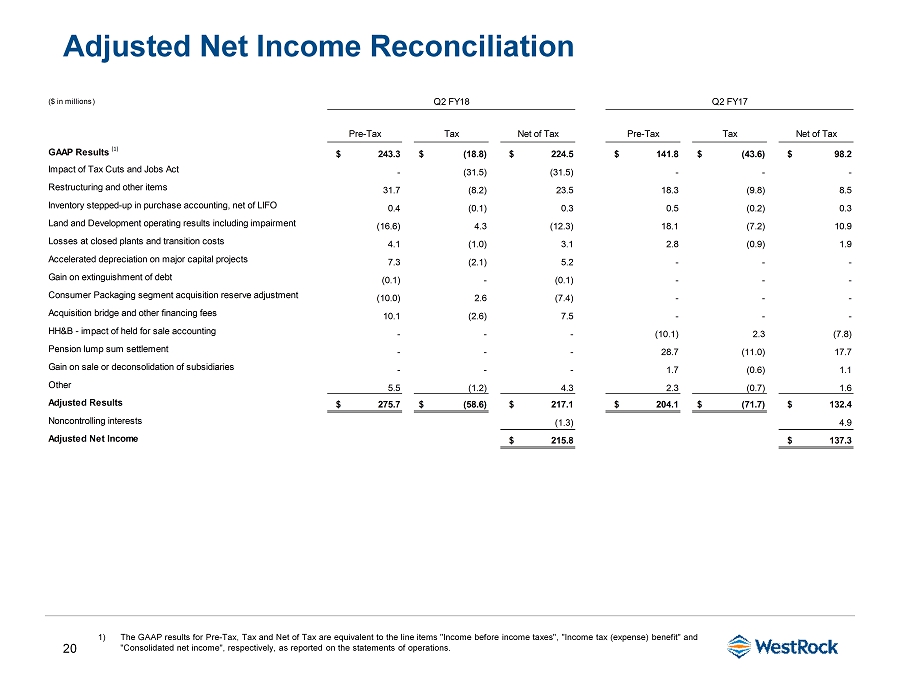
20 Adjusted Net Income Reconciliation 1) The GAAP results for Pre - Tax, Tax and Net of Tax are equivalent to the line items "Income before income taxes", "Income tax (exp ense) benefit" and "Consolidated net income", respectively, as reported on the statements of operations. ($ in millions) Q2 FY18 Q2 FY17 Pre-Tax Tax Net of Tax Pre-Tax Tax Net of Tax GAAP Results (1) $ 243.3 $ (18.8) $ 224.5 $ 141.8 $ (43.6) $ 98.2 Impact of Tax Cuts and Jobs Act - (31.5) (31.5) - - - Restructuring and other items 31.7 (8.2) 23.5 18.3 (9.8) 8.5 Inventory stepped-up in purchase accounting, net of LIFO 0.4 (0.1) 0.3 0.5 (0.2) 0.3 Land and Development operating results including impairment (16.6) 4.3 (12.3) 18.1 (7.2) 10.9 Losses at closed plants and transition costs 4.1 (1.0) 3.1 2.8 (0.9) 1.9 Accelerated depreciation on major capital projects 7.3 (2.1) 5.2 - - - Gain on extinguishment of debt (0.1) - (0.1) - - - Consumer Packaging segment acquisition reserve adjustment (10.0) 2.6 (7.4) - - - Acquisition bridge and other financing fees 10.1 (2.6) 7.5 - - - HH&B - impact of held for sale accounting - - - (10.1) 2.3 (7.8) Pension lump sum settlement - - - 28.7 (11.0) 17.7 Gain on sale or deconsolidation of subsidiaries - - - 1.7 (0.6) 1.1 Other 5.5 (1.2) 4.3 2.3 (0.7) 1.6 Adjusted Results $ 275.7 $ (58.6) $ 217.1 $ 204.1 $ (71.7) $ 132.4 Noncontrolling interests (1.3) 4.9 Adjusted Net Income $ 215.8 $ 137.3


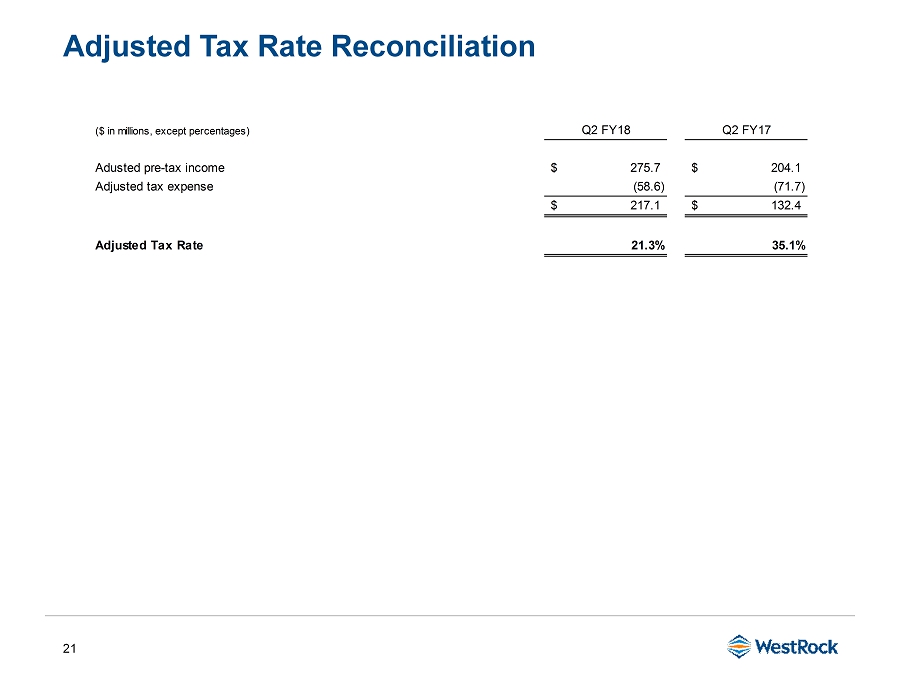
21 Adjusted Tax Rate Reconciliation ($ in millions, except percentages) Q2 FY18 Q2 FY17 Adusted pre-tax income 275.7$ 204.1$ Adjusted tax expense (58.6) (71.7) 217.1$ 132.4$ Adjusted Tax Rate 21.3% 35.1%


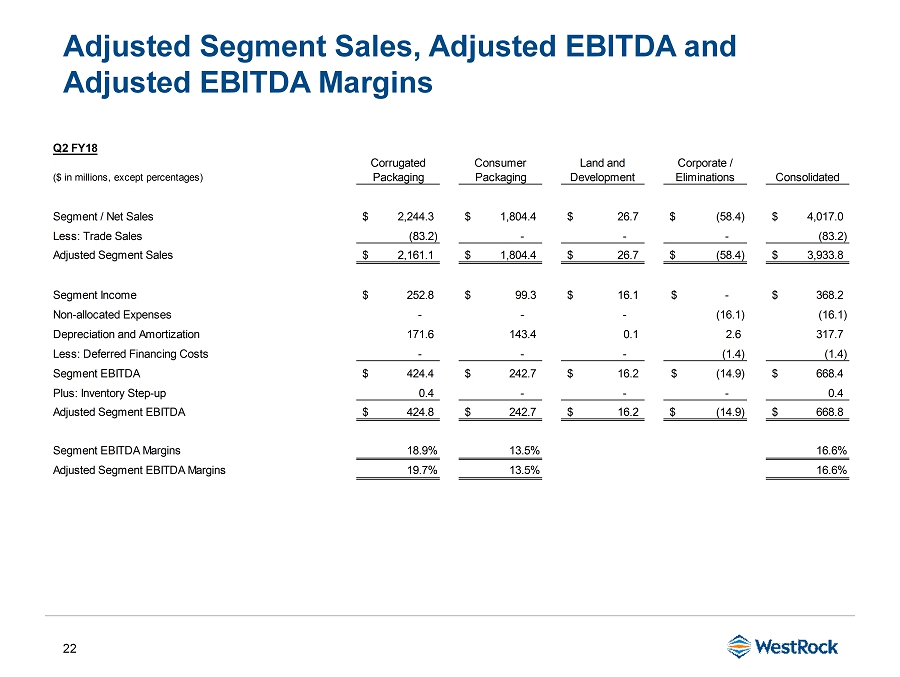
22 Adjusted Segment Sales, Adjusted EBITDA and Adjusted EBITDA Margins Q2 FY18 ($ in millions, except percentages) Corrugated Packaging Consumer Packaging Land and Development Corporate / Eliminations Consolidated Segment / Net Sales 2,244.3$ 1,804.4$ 26.7$ (58.4)$ 4,017.0$ Less: Trade Sales (83.2) - - - (83.2) Adjusted Segment Sales 2,161.1$ 1,804.4$ 26.7$ (58.4)$ 3,933.8$ Segment Income 252.8$ 99.3$ 16.1$ -$ 368.2$ Non-allocated Expenses - - - (16.1) (16.1) Depreciation and Amortization 171.6 143.4 0.1 2.6 317.7 Less: Deferred Financing Costs - - - (1.4) (1.4) Segment EBITDA 424.4$ 242.7$ 16.2$ (14.9)$ 668.4$ Plus: Inventory Step-up 0.4 - - - 0.4 Adjusted Segment EBITDA 424.8$ 242.7$ 16.2$ (14.9)$ 668.8$ Segment EBITDA Margins 18.9% 13.5% 16.6% Adjusted Segment EBITDA Margins 19.7% 13.5% 16.6%


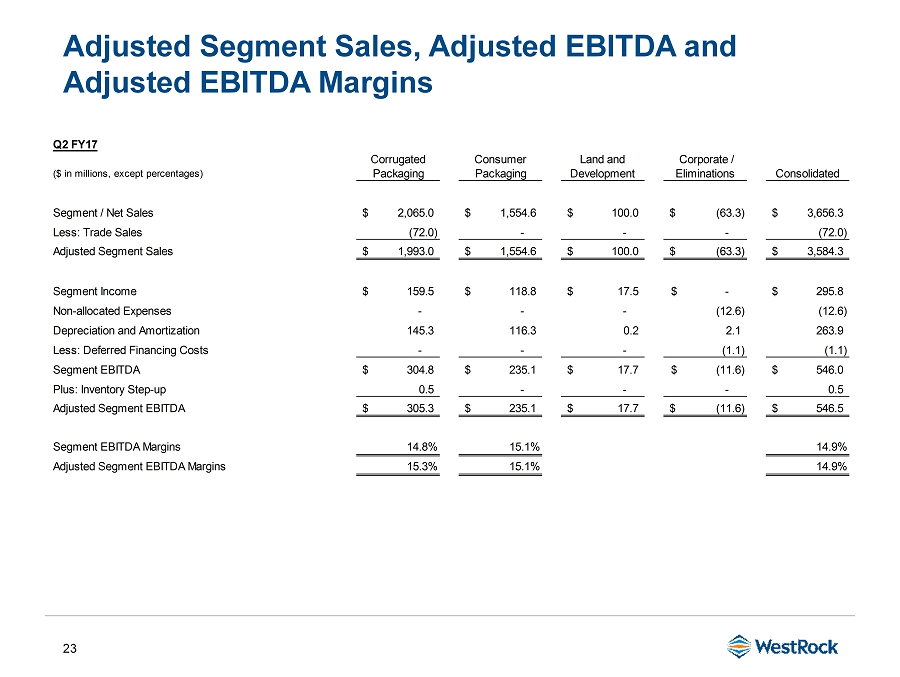
23 Adjusted Segment Sales, Adjusted EBITDA and Adjusted EBITDA Margins Q2 FY17 ($ in millions, except percentages) Corrugated Packaging Consumer Packaging Land and Development Corporate / Eliminations Consolidated Segment / Net Sales 2,065.0$ 1,554.6$ 100.0$ (63.3)$ 3,656.3$ Less: Trade Sales (72.0) - - - (72.0) Adjusted Segment Sales 1,993.0$ 1,554.6$ 100.0$ (63.3)$ 3,584.3$ Segment Income 159.5$ 118.8$ 17.5$ -$ 295.8$ Non-allocated Expenses - - - (12.6) (12.6) Depreciation and Amortization 145.3 116.3 0.2 2.1 263.9 Less: Deferred Financing Costs - - - (1.1) (1.1) Segment EBITDA 304.8$ 235.1$ 17.7$ (11.6)$ 546.0$ Plus: Inventory Step-up 0.5 - - - 0.5 Adjusted Segment EBITDA 305.3$ 235.1$ 17.7$ (11.6)$ 546.5$ Segment EBITDA Margins 14.8% 15.1% 14.9% Adjusted Segment EBITDA Margins 15.3% 15.1% 14.9%


24 Corrugated Packaging EBITDA Margins ($ in millions, except percentages) North American Corrugated Brazil Corrugated Other Corrugated Packaging Segment Sales 1,996.3$ 112.8$ 135.2$ 2,244.3$ Less: Trade Sales (83.2) - - (83.2) Adjusted Segment Sales 1,913.1$ 112.8$ 135.2$ 2,161.1$ Segment Income 239.5$ 13.1$ 0.2$ 252.8$ Depreciation and Amortization 152.0 17.1 2.5 171.6 Segment EBITDA 391.5$ 30.2$ 2.7$ 424.4$ Plus: Inventory Step-up 0.4 - - 0.4 Adjusted Segment EBITDA 391.9$ 30.2$ 2.7$ 424.8$ Segment EBITDA Margins 19.6% 26.8% 18.9% Adjusted Segment EBITDA Margins 20.5% 26.8% 19.7% ($ in millions, except percentages) North American Corrugated Brazil Corrugated Other Corrugated Packaging Segment Sales 1,807.3$ 104.7$ 153.0$ 2,065.0$ Less: Trade Sales (72.0) - - (72.0) Adjusted Segment Sales 1,735.3$ 104.7$ 153.0$ 1,993.0$ Segment Income 146.7$ 5.8$ 7.0$ 159.5$ Depreciation and Amortization 128.2 14.5 2.6 145.3 Segment EBITDA 274.9$ 20.3$ 9.6$ 304.8$ Plus: Inventory Step-up 0.5 - - 0.5 Adjusted Segment EBITDA 275.4$ 20.3$ 9.6$ 305.3$ Segment EBITDA Margins 15.2% 19.4% 14.8% Adjusted Segment EBITDA Margins 15.9% 19.4% 15.3% Q2 FY18 Q2 FY17


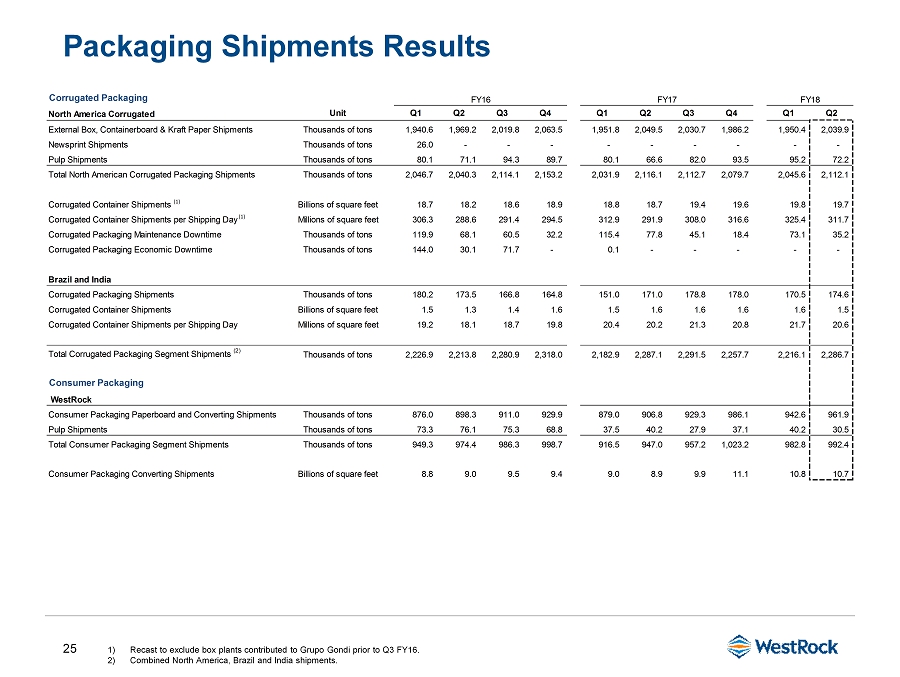
25 Packaging Shipments Results 1) Recast to exclude box plants contributed to Grupo Gondi prior to Q3 FY16. 2) Combined North America, Brazil and India shipments. Corrugated Packaging North America Corrugated Unit Q1 Q2 Q3 Q4 Q1 Q2 Q3 Q4 Q1 Q2 External Box, Containerboard & Kraft Paper Shipments Thousands of tons 1,940.6 1,969.2 2,019.8 2,063.5 1,951.8 2,049.5 2,030.7 1,986.2 1,950.4 2,039.9 Newsprint Shipments Thousands of tons 26.0 - - - - - - - - - Pulp Shipments Thousands of tons 80.1 71.1 94.3 89.7 80.1 66.6 82.0 93.5 95.2 72.2 Total North American Corrugated Packaging Shipments Thousands of tons 2,046.7 2,040.3 2,114.1 2,153.2 2,031.9 2,116.1 2,112.7 2,079.7 2,045.6 2,112.1 Corrugated Container Shipments (1) Billions of square feet 18.7 18.2 18.6 18.9 18.8 18.7 19.4 19.6 19.8 19.7 Corrugated Container Shipments per Shipping Day (1) Millions of square feet 306.3 288.6 291.4 294.5 312.9 291.9 308.0 316.6 325.4 311.7 Corrugated Packaging Maintenance Downtime Thousands of tons 119.9 68.1 60.5 32.2 115.4 77.8 45.1 18.4 73.1 35.2 Corrugated Packaging Economic Downtime Thousands of tons 144.0 30.1 71.7 - 0.1 - - - - - Brazil and India Corrugated Packaging Shipments Thousands of tons 180.2 173.5 166.8 164.8 151.0 171.0 178.8 178.0 170.5 174.6 Corrugated Container Shipments Billions of square feet 1.5 1.3 1.4 1.6 1.5 1.6 1.6 1.6 1.6 1.5 Corrugated Container Shipments per Shipping Day Millions of square feet 19.2 18.1 18.7 19.8 20.4 20.2 21.3 20.8 21.7 20.6 Total Corrugated Packaging Segment Shipments (2) Thousands of tons 2,226.9 2,213.8 2,280.9 2,318.0 2,182.9 2,287.1 2,291.5 2,257.7 2,216.1 2,286.7 Consumer Packaging WestRock Consumer Packaging Paperboard and Converting Shipments Thousands of tons 876.0 898.3 911.0 929.9 879.0 906.8 929.3 986.1 942.6 961.9 Pulp Shipments Thousands of tons 73.3 76.1 75.3 68.8 37.5 40.2 27.9 37.1 40.2 30.5 Total Consumer Packaging Segment Shipments Thousands of tons 949.3 974.4 986.3 998.7 916.5 947.0 957.2 1,023.2 982.8 992.4 Consumer Packaging Converting Shipments Billions of square feet 8.8 9.0 9.5 9.4 9.0 8.9 9.9 11.1 10.8 10.7 FY16 FY17 FY18


26 LTM Credit Agreement EBITDA 1) Additional Permitted Charges includes among other items, $145 million of restructuring and other costs and $27 million pre - tax e xpense for inventory stepped - up in purchase accounting. ($ in millions) Q2 FY18 Consolidated Net Income 1,879.9$ Interest Expense, Net 232.1 Income Taxes (942.6) Depreciation & Amortization 1,202.9 Additional Permitted Charges (1) 298.9 LTM Credit Agreement EBITDA 2,671.2$


27 Total Debt, Funded Debt and Leverage Ratio ($ in millions, except ratios) Q2 FY18 Current Portion of Debt 1,113.5$ Long-Term Debt Due After One Year 5,613.0 Total Debt 6,726.5 Less: Unamortized Debt Stepped-up to Fair Value in Purchase and Deferred Financing Costs (243.4) Plus: Letters of Credit, Guarantees and Other Adjustments (63.9) Total Funded Debt 6,419.2$ LTM Credit Agreement EBITDA 2,671.2$ Leverage Ratio 2.40x


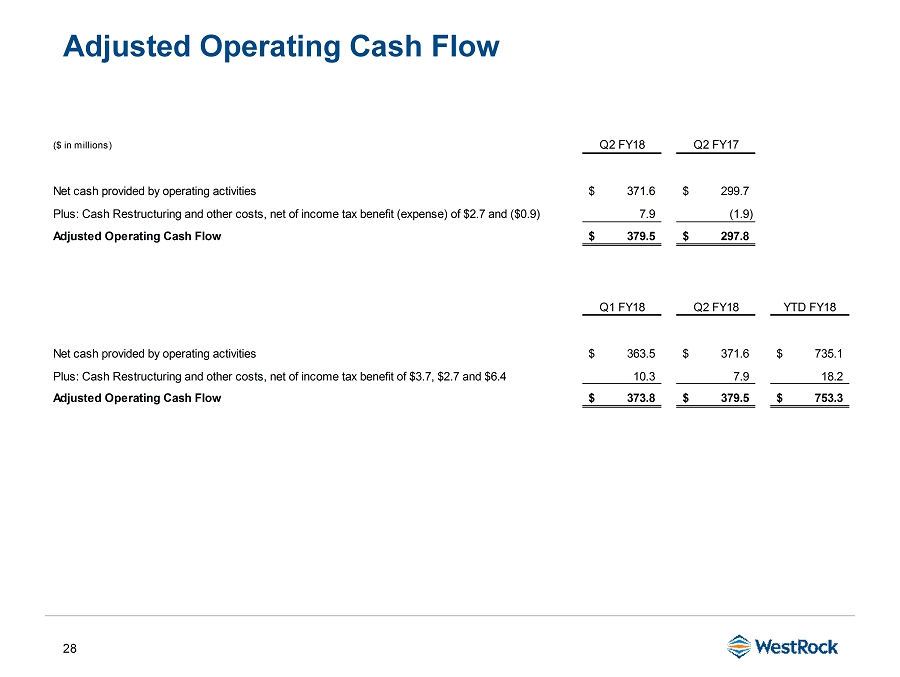
28 Adjusted Operating Cash Flow ($ in millions) Q2 FY18 Q2 FY17 Net cash provided by operating activities 371.6$ 299.7$ Plus: Cash Restructuring and other costs, net of income tax benefit (expense) of $2.7 and ($0.9) 7.9 (1.9) Adjusted Operating Cash Flow 379.5$ 297.8$ Q1 FY18 Q2 FY18 YTD FY18 Net cash provided by operating activities 363.5$ 371.6$ 735.1$ Plus: Cash Restructuring and other costs, net of income tax benefit of $3.7, $2.7 and $6.4 10.3 7.9 18.2 Adjusted Operating Cash Flow 373.8$ 379.5$ 753.3$


GRAPHIC 4 exh992_01.jpg begin 644 exh992_01.jpg M_]C_X 02D9)1@ ! 0$ 8 !@ #_VP!# $! 0$! 0$! 0$! 0$! 0$! 0$! M 0$! 0$! 0$! 0$! 0$! 0$! 0$! 0$! 0$! 0$! 0$! 0$! 0$! 0$! 0'_ MVP!# 0$! 0$! 0$! 0$! 0$! 0$! 0$! 0$! 0$! 0$! 0$! 0$! 0$! 0$! M 0$! 0$! 0$! 0$! 0$! 0$! 0$! 0'_P 1" *E X0# 2( A$! Q$!_\0 M'P 04! 0$! 0$ $" P0%!@<("0H+_\0 M1 @$# P($ P4% M! 0 %] 0(# 01!1(A,4$&$U%A!R)Q%#*!D:$((T*QP152T? D,V)R@@D* M%A<8&1HE)B7J#A(6&AXB)BI*3E)66EYB9FJ*CI*6FIZBIJK*SM+6VM[BYNL+#Q,7& MQ\C)RM+3U-76U]C9VN'BX^3EYN?HZ>KQ\O/T]?;W^/GZ_\0 'P$ P$! 0$! M 0$! 0 $" P0%!@<("0H+_\0 M1$ @$"! 0#! <%! 0 0)W $" M Q$$!2$Q!A)!40=A<1,B,H$(%$*1H;'!"2,S4O 58G+1"A8D-.$E\1<8&1HF M)R@I*C4V-S@Y.D-$149'2$E*4U155E=865IC9&5F9VAI:G-T=79W>'EZ@H.$ MA8:'B(F*DI.4E9:7F)F:HJ.DI::GJ*FJLK.TM;:WN+FZPL/$Q<;'R,G*TM/4 MU=;7V-G:XN/DY>;GZ.GJ\O/T]?;W^/GZ_]H # ,! (1 Q$ /P#^_BBBB@ H MHHH **** "BBB@ HHHH **** "BBB@ HHHH **** "BBB@ HHHH **** "BB MB@ HHHH **** "BBB@ HHHH **** "BBB@ HHHH **** "BBB@ HHHH **** M "BBB@ HHHH **** "BBB@ HHHH **** "BBB@ HHHH **** "BBB@ HHHH M**** "BBB@ HHHH **P/%7BSPMX%\.ZOXO\ &WB70/!WA/P_9R:CKWBCQ5K. MG>'O#NB:?$5$M]J^M:OFZ;9QEE$EU>7,,"%E#."17\GG_ 40_P""YOBO MX@W&J?"+]B+6-2\%?#UK;4=*\4_'BXTJ33_'7C9+Z![&6R^&6GZU:I??#WP[ M':2W)/C._P!/MOB+?W]Q:W?A9/A\V@0:SXI^PX.X&X@XWQ_U3)\-;#TI1^O9 MIB54IY=@(/6]:NH2]I7E&[HX/#JKBJS2:A1I'^7?7<]Q=\3 M6C+^S\HPCIU$^55\=B71P=!-IU*];EPL_U2_P""BW_! M7_X4?L;G7/A3\,[73OB]^TO'8R0R^%UN;J/P1\*[O4M.>;1M7^)^LV:*;^]A M::UU9/ACX>O[;Q5JVF"%=:U?P!INO:%XENOXV?CI\?\ XP_M*_$/6?BC\;/' M6L>./%VL3R.DE[,8-$\/V++#'!H7A#P[ RZ1X6T"TAM[>.+3=)MH!=2Q-J>K M3:EK5W?ZG=^-)&D:[44*NYF('5G=B\CL3RSR.S/([$L[LSN2S$E]?VSP-X<< M/\"X5+ TEC,VJTU#&YWBJ<'C*][.=+#1]^&7X/F2Y<+AI85G@,EHU7/ 9!@ZM3ZE0M=0K8N?[N>98ZS=\5B8\E/FE#!X7 M"T_>F45U'@GP/XV^)GBC3_ _PW\'>*?B!XSU59)--\)^"M U3Q/XBO(86C6X MNH=(T:UO+W[%:F6+[9?/"EG9K(CW4\*,&K^BO]CS_@WU\::_-IOC/]M3Q9%X M)T1H8[E/@G\--:M-6\9W,DB3JUGXX^(UB+OPSX<^QS)"TVF_#^7QD=4MK@/; M>.-!N+=X)O7XFXSX:X0PWUC/LTH86'P4']8S+%VO987 49.O--^[[:JL M-A8N_-B?=E%>)PEP'Q7QOBOJW#F48C&4X3C#$YA47U;*L%?5O%YC6C'#P:C[ MWL*+Q>+DK?!WX?^*_B7XVU6XL[>V\/^$=) MGU.XMA?7 MH+_6[T>7I7AC0HY=S7_B7Q-J&C^'-)MHKB^U;5;&QM;FYA_H[_ M &._^#?&\N)K3QE^V[XP2"T1[*[L?@G\)?$,PEND#6UQ<67Q&^),=C;SV\4J M_:],O=#^&K%K%/Z0?@M\!O@Y^SKX*M?AW\$?AUX9^&W@^UE M-RVE>'+$02:C?M%%!)JNNZI]D2&)5] M;K^7>,/'S/\ -U6P7#%#_5W 3YH?792AB,[K0;LI1K*,L+EO-&Z<<)3Q&(BI M:8R$ES+^O^!_HW<-9(Z&/XMQ"XHS*')4^HQA4PV08>HE=QEAW*.+S7DG9J6- MJX;#R<=<#.#Y)>8_"+X+?"?X!^"M/^'7P9^'_A?X;^"]-(D@T+PMI<&GP7%V M8(+>;5-5N%#7VMZW>16T U#7=9NK_6=2>));^^N91OKTZBBOP:O7KXFM5Q&) MK5L1B*\Y5:U>O5J5ZU:I-WG4JUJLZE6I.3UE.=24GU=DDOZ,P^'P^$H4L+A: M%'"X;#TXTJ&'PU&EA\/0I07+"G1HT:=*E2IP6D84Z<(I7LKMN111161L%%%% M !117S]\?_VJ?V>/V6_#A\3_ ![^+7@_X+[F%Y4\^U\-:)JD]M%ON+A(K:*::/HPF$Q>/Q%+"8'"XG&8 MJO)0HX;"4*V)Q%63^S3HT*=6K-]7:%HJ\I2A%.<>;&8W!Y=AJV-S#%X7 X/# MP&? WA328_.U3Q-XPUW2_#>@:='@G?>ZOK%U9V%LI"MM,UPFX@A?"V3PZ6O'@'Q;^,D%G?:@VG):R1/-X8^&.CWT]C:7 ML]_)'=Z=K'BWQ+J$5OI]GY&I^ Y;O5F_L+^?;XZ_M$?'#]IKQ:OC?X^?$[Q/ M\3_$4(*Z=)K\]K!HV@PLTC&W\,>%='M=,\*>%K9C-(98?#VBZ:MPSO+=&>9W MD;]QX6\ N)\V]EB>(:]+AO!2]YT)*&-SB0Z[X7_9>\):M\=_&MLUWI]EXWUV"\\'_ ;L+V-) MK<:E#/="#QMXYMK&_5)%LM'T7P]H7B2Q1Y]'^($%K<6>H2_SG_M1?\%%/VN_ MVO+O4H/BS\5]4L/ U_(3#\(?AXUWX(^%EI:Y@D2QO?#]A>SZEXSBBN;=+Z"Y M^(^N>,]0L[QY&T^[LK46]I;_ !)17](<+>&7!O"7LZN7953Q.84[/^ULTY,? MF'.E&\Z$JU/ZM@O>CS16"PM&4&_=Q.G,_P"5N,/%OCKC5U:.9YS5PF656U_8 MV3\^6Y;[-N5J>(C1JK%8^T9,9+N#XA>&%TZUM%MM&TBS\37/@O35FN)#X/NY7 M1H_Z/OV6?^"Z?[(GQR&F>'?B]<7_ .S+\0[VYL]/2T\?3'5?AIJ=[=F<&72O MBMIEE%HNC6%N(HOM=U\2K#X?11SW<-M82ZJ$DN1_$K00""",@\$'H1Z&OS7B MGPGX+XK]K6Q&6QRO,JEY?VIDJI8&O*H[OGQ.&C2_L_&WD[S=?"4JT];XGF?. MOU?@_P :./>#?94,/FLLXRNGRQ_LC/I5LPP\::Y5R87%SJ_VE@;17+!4,95H MPTMA.5.[L- M1TZ_M))K6]L;VUFBN;2[MI9;>YMY8YH9'C=6-ZO\X']FO]L?]I;]D359M1^ M'Q6U[P5IU[<_:M9\%SI:>(?AWX@E9E,TVK>!]=AOM!&H7"*(9-?TJVTOQ/'; MYAM=QU;QC\.KM M'FGD-]J/@B>XU'XB^$TM;=K:T^PZ-/\ %&6^FBFU#[5IT=RNF6?\W\5>!/%N M1NIB,F]GQ/E\6VOJ4/89M3AJ_P![EE6I^^<4K.6 Q6(ONL.KJ*_JG@[Z17!7 M$*I8;/O:<)9E)*+^OS^L9-5GHOW.;4:2]@I-W4,RPF&Y5H\2^5R?])-%>;_" M[XQ?"CXV^&H/&'P@^(_@GXF>&;A('&L^"/$FD^([.W>XC,L=K?MI=UZ%>ABJ-/$86O1Q.'K052CB,/6I8BA5IR5XSI5 MJ%6M1J0:VE3JSB^]TTBBBBLC4**** "BBB@ HHHH **** "BBB@ HHHH *** M* "BBB@ HHHH **** "BBB@ HHHH **** "BBB@ HHHH **** "BBB@ HHHH M **** "BBB@ HHHH **** "BBB@ HHHH **** "BBB@ HHHH **** "BBB@ MHHHH **** "BBB@ HHHH **** "BBB@ HHHH **** "BBB@ HHHH *^2?VO? MVVO@%^Q+X!C\H:K]HC\%_#GPXVF:C\2?B%=V$/#=]J>E+ M=6FE&_LGUS7M1OM,\-Z"MY8KJ^L6=QJ6FP7GYT?\%'?^"S?PZ_9@N/%WP0^ MD-G\4/VAK*TO]&U;7([BVG^'/P<\0/'-:X\2W2?:#XM\9Z#'/@K MF/$JP^<<2?6,HR":IUJ&'2]EFF;TI*,XRHQG%O 8&K!IK&5J;Q%:$D\%A7"< M,6?SKXH^/F5<)O$Y'PJ\-G?$D'4H8C%-^VRC)*T7*$XUY4Y)9EF%&::>!H55 MAJ,XN..QBG">#/L#]N?_ (*/_M ?MV^(?)\<7T/@GX0:+JEW=>#/@MX2O-1C M\,6T::G=76BZYX[N)[IF^('CZPTY[*Q?Q#>VVG:#ITUG->>#O"?A.35M:_M+ M\_ZU-#T/7/%&MZ5X9\+Z'K7BCQ-KMW'I^A^&_#6DZAK_ (AUN_ESY5AH^AZ1 M;7FJ:I>RX/EVMC:SSO@E8R "+HP7[_ M ZT06/B7XS:OIYER+35+A9+CP9\-GU"T:*]MY[FX\=>(+%&?2]>\'^']7$R MV']08[-N#/#C)L/A\17R[(,MH4Y+!9?0CS8G$M*]1X;!4?:X[&UZLXIUL544 MN>K*^(QT':%/^1,OR7CWQ3SW$XK"X?-.),TQ%2#Q^9XB7+A,)&3:IQQ6/K^Q MR_ 8>E!M4,)2J>)?$NM71Y%MI6A:+:WNJ:A,!\S1VEK*R(&=PJ*S#^A7]C?\ X( _ M$?QVFD^./VQ/%-S\*/"]Q'%>P_"'P)>:9J7Q-U"*2-)8(?%GBV2'5?"W@E"V M%O=(T2U\7:S/:R/"VL>$]5B81?TB_LS_ +%_[-/[(>@_V+\!OA9H'A*^NK%; M#7?&EPDNN_$3Q7%YZ7.M9>]\2:G:R7R?;8=&-_#X>TJ39;Z'H^EV%O: MVD'U'7\Y<9>/^:YBJN!X0PT\DPM%W7-AZ257!Y:I+6,K8W&1 M3_B49*Z_J7@3Z-6396Z.8<;XJ&?XV/+..3X-UJ&24)JTN7$UFZ.-S647[LH- MX# R:_AUHNS\'_9__9B^ ?[+/A*7P3\ OAAX;^&^A7LZG=6\4TL4,T<;LI]XHHK^?L5B\5C ML15Q>-Q.(QF*Q$W4KXG%5JN(Q%:;LG.K6K5*E6I*R2O*;LDHQ48QC&/]+X/! MX3+\-1P6 PN&P.#PT%3P^$P>'HX7#4*:;:A1H8>G2I4XW;;4*:O)RE)SG*4Y M%%%%*2XN;FXDCA@AC>65T1&8?C=^U+_ ,%R/V/O@#=:AX8^&]WJ M'[37CNUMV*V_PJU/2#\-K.^(8Q6>M?%BXFN]%=25*7+^"-,\>W6GRD07]C;S MAXT]O(^&\^XEQ/U3(LIQN9UU;VGU:C)T:">TL3BJGLL)AH6U4L1B:3:3<(5+ M-+P.(.*>'.%,)]=XBSG 91AW?V?UNO&-?$..\<+A*?ML;BYIZ..&PE91DXJ= M2ES)O]G:_/\ _:G_ ."G7['/[(S:MH_Q%^*%IXG^(ND-Y-Q\(/A<+'QO\2XK MTPPW*6&KZ5;ZC9:-X,N9K2XAN[9OB#K_ (1M;FWDCDM[F7S8@_\ )1^U!_P5 M_P#VV?VG/M^BMX_'P/\ AY=/>0IX%^!T^K^$;B]TR:ZF:UM?%7Q .I7'CKQ! MF:KX6\)^((Q/)<^"[6&Z:SC_+J.*.%0D4:1H"2%C4(N68LQPH MRS$LQZLQ+$DDFOZ%X5^CO4E[/%<8YJJ4?=D\HR6:G4>S<,3FU6E[.&GNRCE^ M%JR3O;$Z*3_F/C'Z3]*'M<)P-D[K2]Z"SK/ZB:)^S;X-GD>*/6[1[7QS\6;^S&( M_P!YXBUG38_"OAE;V+>\UOH7A:\UG3)9$73?&1>W%W/^(?B;Q+XD\;>(]7\8 M^-/$6N^,/%WB"ZDOM>\5>*=7U#Q!XCUF\E=I'N-4UO5KB[U*^E+.Q4W%S((P M=D81 %&+17]$Y!PMP]POAWALARC!9;&45"K5HTN;%XA*S_VK'5G5QF(O)*7+ M5Q'LE+WHT(.UOY?XDXQXGXOQ*Q7$F=X_-9QE*=&C7JN&"PSE=/ZIE]!4<#AO M=?+S4L,ZKC[LL1-73****]\^:"BBB@ HHHH **** "BBB@ HHHH **** .]^ M%WQ3^)/P2\;:7\1_A!XY\2_#CQSHT\4]CXD\*:C)IUXPBWC['J<&)=/U[2)T MDEAOM"UZRU/1-2MI9K34=.NK6::%_P!]?V7/^#A;XK>#8(_#W[6_PX@^,6E0 MQ6,=M\1?A9::'X-^(P\J9_[2F\1>#KZ\TKX>>*+R\@E62QD\/7?PPLK"2P6T MGT_4!JCZCI/\YM%?,<1\&<,<64O9Y]D^%QM2,%3I8Q1>'S'#Q3;4:&8X?V>+ MIQ3;:I3GB*&K_<*[O]=PKQYQ;P76]KPYG>,P%*51U*V E)8K*L3-I1E+$Y9B M74P=2TQ7"&9PS&DN:2RK-I4L)CE[S:AA\?"*P.)M%I16*IX*K+EUJ.4C M^I>#OI/99BO983C?*9Y76?+!YQDT:N-R^3Y4G4Q.6SD\PPO-)-MX.ICZ,5+2 MFHQ/[?**_+[]E/\ X*\_L9?M3G2] M_':_!OXG7\5I$WPU^,D^F^$KZ^U6YN M/L:Z;X0\527TO@SQO<7-T/,TS3=#UQO%-SI\MO>7_AC29FN;*T_4&OY_S?), MXR#%RP.=99CFG&OAJR6]'%8?#559_NY).04445 MY9ZX4444 %%%% !1110 4444 %%%% !1110 4444 %%%% !1110 4444 %%% M% !1110 4444 %%%% !1110 4444 %%%% !1110 4444 %%%% !1110 4444 M %%%% !1110 4444 %%%% !1110 4444 %%%% !1110 4444 %%%% !1110 M4444 %%%% !117Q'^VE^W]^S[^PWX..M?%+7SK'CK5+*.Z\$_!WPM<:?=_$; MQHDM^NG'4+/3+N[M;?1O#-C,+F;5?%FO7&GZ-!%I]Y8Z?-JOB)].T'4.[+M4<:=&A5 MJ24#ZM\>^/\ P3\+?!^O_$#XC^*M"\$^"?"VGR:IXA\4>)=2MM)T;2;&(JAF MN[V[DCB5I97CM[:!2UQ>7-_CU;Z]\&_V3 MY/$'PM^#EW]JTOQ%\3YF;2OB9\4M'N]/6VN]-TJQELDU#X7>%IKB:\#3V>H? M\)WK]G'I[7-UX,MI-9\-ZE^;W[:/[?'[07[=_C>UU'XG:I_9/@FPUJ)_AQ\# M_"%QJ4G@CPS>S/=:;HUT+"5VN?&_Q%FM-4FTJ?QGJ5HNI7DVHZC9>%M'\*:) MJI\-1?7'[('_ 1*_:O_ &CYK'Q+\5+&X_9A^%CO!++J?Q#T*ZF^*6O6LD5S M*8_#'PJEN-,U'2OWMO#97FH_$74/![V":C;:MH^A>,8+:ZL#_4G"OAIPGX=8 M.CQ/XC9CED\SA:MA,#B*L*V P-:'+-0P^$4:E?/LRIRI8.M@L-5471ISE M&.+7\@<8^*_&?BACJ_"7A9E>;4\IFY4,9F6&I3H9CF%&;E"4\3C7*EA^']G^X M:\+C'Z0>.Q+K8+@S!_4*#YH?VUF5*%;'U%[R<\'E\G4PN#4E9PJ8N6,Q,=)> MQIRTC]#P-]&;+\(J&/X[QW]I8E-2E@ MHX'"2UC[>K'WI?('[+'["/[+_P"QQHZ6?P1^&FF:7XEGTY=-UWXEZ_CQ'\3O M$\3&"2[&L>,=0C:^M[&^N[>*^F\.Z"FB>$[:Z5&TW0+"**&*/Z_HHK^=L?F. M/S7%U<=F>-Q688VO+FK8K&5ZN(KU'K9.I5G)J,;M0IP5.E3C[M.E3@E$_J#+ M:YC^R?VH-.BT6TG8?VCJ=E"LDR?SG_M1_\ M!PQ\2?$4WB7PI^R5\--,^'V@RP:AI>C_ !<^)B0>)/'CF46\5OXFT#X>QK)X M-\-7EH5OI=+M?%UY\0K2\6;3+W6] LG@O_#LWW'"_ASQ?Q>X3RC*:L<#)J^: MX^^ RQ1YE&4H8FO33Q3C>3<,#1Q"."5.GG>=499A!. MV3Y)!*NGZ18"YU M/49E^SV-I<3LL9_ G]J/_@X6^%OA"?6?"G[*/PTO_B[K$,5Y9VOQ1\?37O@S MX:VVH!5%IJ6C^%HX#X[\;Z=#)YJW5GJ)^&0N-D;Z=K%U;RBX'\L_Q4^,'Q7^ M.?BA?&OQG^)/C7XI^*XH)K2SUOQSXBU+Q#<:383W,EY+I6@07T\EEX(<6K2>#H^UP&44Y) MIV<85%F&-2M9^WKX6C/6]%Q=G_*W&'TE^)\V]KA.$\%1X9P4KQ6.K^QS+.ZD M&G%N,YTWEN D[WB\/AL96AI:NIKF7U3^TK^VY^U-^UY+#%\?OB_KWC#P[9:G M)JVD^ +&WTWPK\.='O29UM+BW\%^&[33=)U2_P!)M[FYL=(U_P 4IXA\4V-C M=7ENNO.+^_:Z^5@ !@# ' Z >E%%?NV!P&!RS"T\%EV#PN P=&_LL+@L/1P MN'I\UG)QHT*=.'--I.3$ @D10 M,0""<9J&5A!=7%C/FWOK20Q7=E<*T%[:RK]Z*YM)@EQ;RKD;HYHT=?MD_LC_P!F:1X ^*%UXR^'6FK!;Q?"3XMMJ/COP);: M=:V;V-IIGALW.I6GBGP'IUA$ZSV.E^!?$GA[0EOH()]0T?4H3?F M>4Y7G6$G@SKTG)7E0Q-'$T)/65%OW MC^NSX<_\'&G[/5WX2TV7XO? 3XX^'/'JJT6LZ?\ #1/A[XY\&N\854O=)UWQ M3X\^'6N".\^:9].OO#2OIC-]D74]66,7\Q7\B=%?EU7P(\.:M2I467YK152< MIJE0SW'0HT^9M\E*$\/6E&G&]H1E5J.,;+GE9,_7Z/TB_%*E2ITGF635W3A& M#K8CAW+ZE>KRI+VE:<,30A.I*UYRC1I*4KOV<;M'^HQ1117\,'^AP4444 %% M%% !1110 4444 %%%% !1110 4444 %%%% !1110 4444 %%%% !1110 444 M4 %%%% !1110 4444 %%%% !1110 4444 %%%% !1110 4444 %%%% !1110 M 4444 %%%% !1110 4444 %%%% !1110 4444 %%%% !1110 45YO\7/C!\, M/@-\/O$?Q5^,?CCP_P##OX?>$[)[[7/$_B2]6SLH%Y6VL;.%1)>ZOK>J7'EV M&A>'M'M;_7O$&JSVFD:'INH:I>6MI-^&OQ+\6?M]?\%8HKWP1^S]H^N?L8_L M)^)M*CLM6^,WQ0T2ZM?B=^T'X.\16D&_!2/I7B&'P!K&F2*;'1](\0> M'-(\<>'+U)=:^)=YH_B+4O ^E?39!PQB40C6S#$Q&CC\5%85:W_ M 4<_P""W7@3]G>X\2?!O]F$^'/B=\:-*GUCP]XQ\=ZK)>O\-O@WK>F7-M;7 MEF\(M;:V^)?B^U/]HV,ND:/KMGX=\*:S;-_PE&JZAJ.E:AX'OOQ^_9V_X)4? MMR?M\^/-4^.7Q[U'Q'\,O#_CW5=,\1^+/C#\:+.XF^(OC^WO[2W=9_!7P^=M M.U5[2RT%-*T_PZVMV_@OP%HVA-I.D>#$O=*T!_#^G_TD?L>_\$F/V0OV/5TW M7]#\&CXJ?%:P:SN(OBM\5;72_$.MZ)>VBV[Q2> =!2Q@\+?#V.UNXIYK"_\ M#VE)XN%M9 MX]JS(N/\PH9QXK9Q'ZA MAZKKY;P'PYB*M/*,O3NHQS#-.6%7'XQTG&GB<3A*4:E2]:C3QF%PT_8O\^?V M1/\ @F1^R7^QQ9:1J/@7X?V7C+XIV""2Z^-GQ'M=/\3?$:2_>*Y@N+CP[>36 M<>E_#^TEM;N73VTWP%IOAZ&]T^.W&NR:WJ*W&IW/Z#445^29IFV:9WC*F89O MF&+S+&U6W/$8RO4KU+.3DH4U.7)1I1TQ&(JXC$5'K4KSV11117G'IA M116/XA\1>'_".@ZSXJ\6:[H_ACPQX:EJ^ MLZQJ4]MI^EZ9I]I#+=7U_?7$%I:6T4D\\L<2,PJ,93E&$(RG.U"\\'_ KTDVK30RW$GQ)U'P_JL?BM7E6&;3)/A_H?BG0-5M3, MS^*=,*P&?^<#]J;_ (*C?MD?M9R:KI?C+XF7?@'X?BG'%'#&D4,:111J%2.-%2-%'1410%51V I]?TCPMX,<%\ M->RKU\&^(,RIVE]=SF%*M0A45GS8;*XIY?149*\)5X8^JM&Y M\5^VPV&QJX9RJI>/U#(IU:.)J4WS+EQ6<3:S*LY1=JDU[5-4U[7M7N#>:OKNN:C>ZSK>KWC*%:[U75]2GNM1U*[9556N;VY MGG8* TA %4J**_6$E%*,4HQBE&,8I1C&,4HQC&,5&,8QBE&,8QC&,4E&,4DE M^+RE*4I2E*4I2E*4I2E*4I2DW*4I2E*4I2E)N4I2E*4I-RE*4FY,HHHIB"BB MB@ HJ":YM[9=UQ<0P+C.Z:5(A@<9R[*,9./K7T/\+OV3OVH/C8(Y/A/^SU\8 MO'=E+]A*:SHW@'Q!'X:"ZES822>*]3L]/\,0PW4?[^.>;5XX1:@W;R+:J9AA MBL7A<#1>(QN*PN"H+>OC,3A\)15MU[7%5\/3OY* M+Q^)>V'P.%Q.-KM/K['"8?$U4O[SIQC_ 'D?/]%?LG\+/^"$?[?_ (_N[4>, MO#/PZ^"6ERI-+(]6$D=L][H_PM^&NC^$WM)<(;RU MM?$_C'7_ !ZNH(#YD=K?R^$-+8C9-+IH(: _!9IXL>'N4N4<1Q/@<34BF_99 M7#$YM-M7T4L!0GA[NSLGBTO[RNK_ */E'@QXG9THSPW"6882E)I*MG$\+DL$ MM-7#,<1#%65U=K!-VO[KLS^5VHO.B\Z"V$B-221@B*S$"O[LOAA_P1#_ ."=_P .+>T.J?"CQ!\6-8M6G)U[ MXK_$#Q7K4EVLS382\\+^';_PK\/9U@BF6&!O^$,65!!!.TCWBO!/A_P"%?"UW=1VJ1QP&^O=%TJSO+^9%BC)N M+V>>XDD7S9)7D)<_GN9_2,X:H<\)Y)YUQ#D651=G.E@Z>/SC$13WCS1AEN#QRRV>JZ[X)O_ 'AZZCAE\B1K?Q/\1? M^$2\.3!9MT>(]59F:.8(&,,NS]!OA7_P0%_;C\;XN/B#J'PC^"EBKVZRV_B+ MQ;-XV\1E)4#S/;:7\/['6/#TQM<^4Z7'C*R,DX80EX-MRW]K=%?G69_2'XOQ M2E#+,MR/*(O2,W1Q6:8B*N]5/&UZ.'YK6_YA9)/5)JR/U'*?HP\#X-PGFV:\ M0YW..LJ?M\)E&&D[+1PP&'KXGEO?_F+BVK)M.[/YK_AW_P &W_PJLEMI/B]^ MT]\3/%4@3?=6OPQ\&^$?AO!YI52L*77BQOBS-);QR;DEE\BVFNHOFB73Y&!3 M]#_A=_P1L_X)V?"Y=+G3X :=\1-9TY+#S]:^+GB/Q/\ $4:Q%=< MU:3X>EKZ9'N-0L=/\':?I%P\TEN--CL5AM(?U!HK\\S/Q,X^S=2CC.*LWC3E M>]'!5XY71M)-./)EE+ R<;.W+*O)+1JTO>/T[*/"?PWR1QE@.#LE=6%N6OC\ M-+-Z]XM-2]IFU;,(J5U?FCAXMZIWB^4\_P# 'PF^%?PHTV/1OA;\-/A_\-=( MAA^S0Z5X \&^'/!VFQ6_F>=Y$=CX=TW3K5(?-_>^4L03S/GV[N:POB/^S]\! MOC$BQ_%OX)_"3XHI')YT8^(?PY\'^-/*FV(@GB/B/1]2,4ZI'&JS1E95$<85 MAL7'KM%?'QQV.AB'C(8W&PQC;D\7'&8R.+\GBHXN.*"45%8*>!P4\$HJUHK!SP)=(@42-9Z/ M\6/AWHWBZXEQ'(8H;KQ1X+UCX?Q0;I?*22ZB\'7&R,O(EG(RK$W].M%?:97X MI>(&4%/#7PS^-5H+47)D^'/Q&TW1[V-O.EC>UET_XJVWPZ5KF.&-+IEL;V_CDC MF6&WEGNU:"OSR^)?[)/[4_P;2[N/BE^SC\;?!&FV-S):7.OZO\-O%,GA-;B* M$W#QQ>,M.TZ^\)78\A))DEL];N(9(H;AXY'6WG,?^DI17Z+EGTBN*<-RQS7) M\DS6*LI5**Q>58B2N[O_ &>KC,+S6LE^XC%6NT[V/R[-_HO<'8KGGDV>9_DT MW=PI5W@LYPT79U3U_I*_%']DS]E_P"-?VB3XL_L]_!OX@WMS%Y#ZQXG^'7A74O$,4>] M)/\ 0_$DNF?V]I[[XT/FV&I6TN!MW[2P/YY_%7_@A+_P3\^(HDG\,^$/B#\% M-3FEN9Y[_P"%GQ$UE[:>6:/9$G_"._$A/B)X6TZTM7 EBM- T318RR;$S717Q%+'X-2ZZXB,%MS-[_P[45_3O\2O^#;S684O M;SX-_M56-XP^SC3?#?Q3^&#_$TJ)M!N)[:.W^&[[L0VDL MJYDO:_.OXF_\$2O^"B/PZFU!]*^$WAOXL:1IYOY3K'PO^(WA*Y,]E9!W2Z@\ M/^.+_P #>*KN:\A7?;:7IFB:EJDW=I>[B9*^B;W/R_-_"#Q+R3FEC.#\VKTHWO7RJ%'. MJ-E=N5\JKXJLE9-^_A(NVK4=C\G**]5^*7P(^.'P/G>W^,WP;^*7PKVM(J7? MC[P'XF\,:1=B*1(7FTS7M4TVWT/5[59I$A^VZ5J-[9M,RQ+.SD+7DTK7HR MWU4:K:V:3T7YYB<-B<'6GAL9AL1A,33TJ8?%X>OA<1#_ !T,31P]:/DY44GN MG):N2BBBM3$**** /]1BBBBO\MS_ & "BBB@ HHHH **** "BBB@ HHHH ** M** "BBB@ HHHH **** "BBB@ HHHH **** "BBB@ HHHH **** "BBB@ HHH MH **** "BBB@ HHHH **** "BBB@ HHHH **** "BBB@ HHHH **** "BBB@ M HHHH **** "BBB@ HHHH *@NFNDM;EK&*WGO5MYFLX+JXDM+6:Z6-C;Q7-U M#;7LMM;R2A$FN(K.[DAC9I$MIV41//136C3LG9IV>SLT[.S3L]G9IV;U6Z35 MTU=JZ:NMU=-75TU=7NKIJZ5TUH_D.P_9 \'>*/'^E_%_]HG6[K]HGXE:"N[P M?:>,-/6Q^"WPKN7-R+B]^$/P.>_UKPQX:UJXBN#!)X]\7W_Q"^+7V-1I7_"Q M_P"Q!%I47UY1177B\?C,%*>(J.MBJSV,O_ NCXIZ5 M9^*VMGGTWX9>%U/BSXF:PPA6>W2#PEI#2W>DVUX'CCMM<\4R^'_#0EEC6XUN MW#!J[]4JP MCJ<&99KEF38.KF&;YA@LLP-!7JXO'XFCAT?:5JD%*1-Y@B\>^-[/2O&OQ7U: 2K]DO;+1'-[\/O OF0>;%>Z;)_P7\?>/O'7Q6\7ZE\0/B?XS\4_$3QSK!']I>+O&NNZCXD\0 M7,2 +!9C4M5N+F>VTVRB5+;3=)LVM]*TJRB@L-,L[2RMX+>/]YX5^CYGN8>R MQ7%.-I9#A9MCJU-O6CS1<5_.7&/TF.' M,L]M@^$,!6XCQD>>G',<7[7+LDA-)I5*2<%F68PC.S2IT,OHU8JZKXO?#7['7PO7QO-!+)"OQ7^,UEK6@>#[@17!"W/ASX:Z=>Z+ MXYUK3[^T^>&[\5ZU\.-4TZX(%SX:O8U*O_.Q^T!^UM^TE^U'K5_J_P =?C%X MV\#;C6KS3OAMH5S"4^QCPW\.=.FMO!^C-8QQ01PWT&DMK%RT$= MYJFJ:CJ1EOI?G6BOZ.X8\/>$>$8P>39106,C%1EFF-2QV:5&M7+ZWB(2^KW= MWRX&C@8Q3<5*4='_ "QQ=XF\;<;3G'/,[Q#P,IN4,HP#>7Y123T4?J>&J0^L M\L;+GS"OCYR:4W&,W=%%-=TC4O(ZHB\EG8*H'J68@#\37;_#[X:_$GXM:G_8 MWPI^'7CWXGZL&B1].^'G@[Q%XTNX3.MPT!N(O#FFZD;59EM+IHI+GRD=;6Y9 M6(@EV_8U:E.C3G6K5*=&C35ZE:M4IT:--=ZE:M4HTH+SG5@O,^&HT:V(JPH8 M>C5Q%>H^6G0P]*K7KU)/:-.C0I5ZU1^5.C-^1Q5%?J!\-O\ @C7_ ,%%OB4; M&=?@,GP]TF^*[=:^*GCGP;X5BM580MOO_#MAJWB#Q[:*$FW,K>#VE4Q3Q&+[ M1'Y+?H!\+?\ @W&^,&J+;W/QJ_:1^'?@K@27.C_##PAXB^(L[@72C[-'X@\5 M7?PU@M)9+$,[W/\ PCFI16UZX@2WOK:'[3-G:]D[GWV4^$_B1G3@\#P;G<:<[6KYAAHY1A[-) MJ3JYM6P+Y6G=-8>5U>UW[I_-_44LT,"[YYHH4_O2R)&OK]YR!T!/7M7]J?PX M_P"#?G]AKPC-'<^.=5^-GQB82%Y=/\5>/X/">CR(8C&($C^%>B> ]=BC#GS] MW_"1//YBJOG>3OB?]'/A/^PK^QS\#XK$?"_]FKX/>&K[3H+*WM_$4G@K2-?\ M9,NG+"+22\\;^)8-9\8:C=));Q7,E[J&N75Y:?2'X/ MPJE'*\NSO.*BVE*CA\JP[TT;J8RMB<0U?1\N%3MJF]C]/RCZ,/&^,<99OFG# M^24W;FC&OBLYQ2UU2IX&AA<*G;5!O$GB?1[=[9[>*Y^W:]I>G7&AZ9G](SB.NY1RC( MJ34,SQEFM+^VC)-W3V/Y6OAA_P;>Z].;*]^-7[4^FV"AYUU'PQ M\)_AQ/?RM&;=?LLMCX^\9^(+2*)UNV?[1;W'PRG62VA417,4MR6M/T&^%W_! M!G]@3P!-9WOBK0OB;\:+ZT%E*I^)/Q#U"STIKZTE6=[B30OAM:?#_2[^VNG7 MRI])UR'6-+EM#]GGM9]TDDG[/T5^=YGXL^(>:\\:_$^.PM.=TZ.5PPV54U%W M]U/ X>&(M9M7>+Y[:.;W/T_*?!CPQR;DEA^$>*SBJY*WO-9AB M9X:]TG98+D3U4%L?._PO_9&_9:^"KVD_PG_9X^#/@#4+*<74&M>&OAQX4T_Q M']J4RF.[G\2QZ6=?N[J%9Y(H+F[U*:>"W(MH9([=$B7Z(HHKX/%8S&8ZJZ^- MQ>*QM=[UL9BL3BZS3=[.KBL1B*EKZV4U&^T4?HV$P."R^BL/@,%@\!AXVM0P M.$PN#HII635'"8;"TKVTYG3@6>E^)$GJK-',D=Q$Z3Q1R+]845UX/,,?EU7V^7X[&X"MI^]P.,Q6#J.SNDYX7$8>4 MDGJHSB^ M/-9FMYC()'B@\0V?\ //XJ_P#!N+\5]+CN[SX)?M*^!/&A M+SR6?A[XH>"M<^'UQ! B P6TOBSPKJ?Q"MM2NY6#*UP/!^A6RED!A50[U_6C M17W^6>+WB)E3@J?$F)QU.%E['-Z.%S2$DOLRGB:$,5KUDL9SO^?O^;9OX(^% M^<*;J\*X3+ZL[OV^2U\9E%2,G]J,,)B*F$NKZ1>"Y%_)V_@]\0_\$3O^"E&A MZK<:;8? 71?&%K"L1CU[PO\ &+X00Z-=F2-79;:/QEXT\'^( T#,89OM>@VB MF5&,#3PE)6*_O"HK[&'TB>-8QBI99PQ4DDE*;P690]H)16RT M/AI_1?X!E.4HYMQ93BY-QIK'Y5-03>D5.IDSJ245HI3;D]Y.X4445^"']'A1 M110 4444 %%%% !1110 4444 %%%% !1110 4444 %%%% !1110 4444 %%% M% !1110 4444 %%%% !1110 4444 %%%% !1110 4444 %%%% !1110 4444 M %%%% !1110 4444 %%%% !1110 4444 %%%% !1110 4444 %%%% !17.^* M_%_A/P'X?U+Q9XY\4>'?!GA;1H#=:OXE\5ZWIOAWP_I5LO#7&I:SK%S9Z=8P M*>LUU)/VF_BGRM!<20GQYXYCL+J&"\MQX2\*)X6\5:?TQ#JT3>'PLZGMLQQDE>T,%EN&5?'XJJ>)-*^RWL3^'+B_ACL)_P"^)^D_P#!;;_@ MI!-=6WBGX5?&71/A].\+CX>KHB_LP_"&'3];@N+(];^)-Y96UT%M7CBU?3;>\Z?X9_\ !O+^V%XD%A/\1?B+\"OA-I-Q;%I; M2RU/Q5\1O%NES*^Q+6ZT'2_#OAGPG(I0>8)=/^(=V@4HFT,6\O\ 7+ M'B/Q#S8;PS\-\^CAYMQI\0\1955PZG%W@JV%R_&U,]2BGBE@B7Q M'\49;B'Q'*]K#-(($\'V_@>S:9QZA?7WUY<.9+B\OKR=Y+B[NIY&:2>YN)9)I79GD=F))_KY^&O\ P;H? MLVZ''#/\6/CG\:?B/J$-Q'(UKX4A\'?#+PQ=VRQQ>;;7FG2:-XY\3[I9EF83 MZ?XVTYX[>1(0IFB^UR?H7\,O^"3O_!/'X5,)M%_9;^'7BF\-DEE+=_%B#5/C M+YFR:*X^VQ6'Q3U'Q;H^G:F98E/]HZ3INGW:1&2VAECMI987_0:/C#X5\(X6 M6!X4R;&U:459QRO*J.6T\1*+3C+$8_-:_P!C> M';+4M2NKEHXY)%@@M9)2D;N$*JQ'WM\,O^"3O_!0WXK6UGJ.A_LQ^,?#.DWI M?&I?%'4_"WPLEM5CNY+-WO?#/CC7-'\V,KP275IX'L?%_Q,UJ"VDC9YHI/[6TW MX;Z3%J$#[(FCM[[5+%F\QH[Z1%1I?T-^&O\ P;Q_LA^&HK.X^)7Q'^.'Q5U- M(HUO[5=>\/> ?"=S.LFYY;/2_#'AX^++&.6/$30S>/-0**7>.59"CQ_OI17Y MYFGC+XBYIS)\03RZG*_[K)\)@\N23OI[6%'%8K9[_68NZ3NF?I^4>!7A=E'+ M*/#5/,ZL;?O<[QN.S1MJVOL:E?"81:J]OJLHZM+[&Z 8>9I_C'XG3^+_%.FK\S8M]/U>VMER D M*A5"_:EE96>FV=KI^G6EM86%C;PVEE8V4$5K9V=K;QK%!;6MM D<-O;P1*L< M,,2)''&JHBJH %FBOS['YIF>:U?;YGF689E6NW[3'XW%XR:;W<7B<374+VU5 M.%)/^7O^F9=E&4Y/1^KY1E66Y70LE[++5':>0;F68 MK#'$\K*AZ,/A,5C*GLL'A<5BZNG[K"8;$8JKJ[)^SPV'Q-2S;LGR6;TO?0YL M5C,'@:?ML;C,)@J.J]MC,7A<'2NES->UQ>)PM.ZBFVO:72UM;4]VHK\Q/&W_ M 63_P"";O@74;K2;W]I/2O$=_:B,G_A7_@3XH?$329]YB)^R^*?!?@K6_"- MP8TE\QQ'KY.(Y8U#W"&$[O@#_@KE_P $Y_B--%;:1^U'X(\/7,@M0\?Q+TSQ M?\)8(9;L796&34_B;X<\)Z.[0-8SI=RV^HSVMLTEBTMPL>J:7)>^]+@OC&%! M8J7"G$D<.TI*J\CS3EY6KJ5E@Y5.5K5-T%VM>Z7SD>/.!YXAX2'&7"LL2IS3?Z/45Y3X%^/'P.^*,R6_PS^,OPI^(MQ+ M:F]C@\"_$3PAXNFDLQ,EN;M(O#^L:@[VHGDC@-PJF(32)%OWLJGU:OGZ^'Q& M&J.EB:%?#55JZ6)H5L/52=[-TL11H5$G9ZNFMGV=OIL/B<-BZ:K87$X?%49- MJ-;"XBAB:,FK74:N&KXBDVKJZ55M75TKJY1116)L%%%% !1110 4444 %%%% M !1110 4444 %%%% !1110 4444 %%%% !1110 4444 %%%% !1110 4444 M%%%% !1110 4444 %%%% !1110 4444 %%%% !1110 4444 %%%% !1110 4 M444 %%%% !1110 4444 %%%% !1110 4444 %%%% !1110 4444 %%%% !11 M10 52U*TGOM/O;*UU.^T6YNK6>W@U?38]-EU#3998V2.^LHM8T_5M*DNK9B) M8$U'3-0LFD51MKV6-+G4;/P]\/=*M-1N MD@FO8)VM++[/]/\ @GX>> /AIHT7ASX<^!O!_@#P] $6#0O!/AG1?"NC0K&& M$:Q:7H5E86,80,P0) H9@N,G/845WXK-LTQM&CAL7F..Q&%P\5##X2KBJ[P M>'BFVHT,'&I3P="*MBL%E>7X;%XF3GB<92 MP>'6-Q,Y*,92Q&.E2JXZO*48Q3=;&U$U&*Y$HQ42BBBO//2"BBB@ HHHH ** M** "BBB@ HHHH **BGGAMH9+BYFBMX(4:2:>>1(H8HU&6>220JB(HY9F8*!R M2*^<_&G[9'[(_P .;F_L?'G[3_[/WA'4]+56O]'U[XP> -.UNVW;=B/HEQKZ M:JTLFY?+A2S>63<-B-FNK"X+&XZ;IX+!8S&U%:]/!X3%8N:NTDW#"X7$R2;: M5Y1BKM:ZG)B\PP&7P57'X_ X"D[VJ8[&X/!4VTFVE/&8O"0DTDVU&4G9-VT/ MI&BORV\=?\%GO^"1S"$VOP]\#?$#QC$V8S)YL>L:9X9;P[ M)" K21ZRP$A$?+Y ^0_%O\ P<5_LF:9'/'X-^#G[1'B^\CG6.&74-'^'7A/ M1KJ ,1)7'Q#U;68AM :&&X\.12R%MLHM\$CZO!>&_'N8J,L+PCGKC*UIU M\#+!0L]GS9A6P.G=\CLM6K'QF8>*?AQECE'&<:\.QG&]Z>'S"./J76ZY,MHY MA[W9.O^#D7QK=0W]M\,?V3O#.BSE9$TO7/'_Q:U/Q&B/Y MRF&XU#PGX;\#>&2Z^0KB6SMO&RGSI5*7^RW(N?CKQI_P7L_X*"^*A,NB:E\% M/AJLEJ]O&_@CX73W\\$C%"+Y)/B/XK\?P/>1[66-9;62PVR/YMC*XC=/K\#X M#^(>,LZ^"RO+(NUWC\XPKFDTG=TL#3Q\^K37.I)IIK9GQ.8_2,\,,#S1H8_- M\VDEHLNR3&*G)IM65;,*N74ULFGR.+334MTO[>J1F5%9W8*J@LS,0JJJC)9B M< $DD@ #)K_/8\:_\ !4'_ (*%?$$Q'Q%^UM\5K40M(8E\$R>&/A: )5D1 MEE/PN\.>#7NE59&$7VQ[AHF$/_B+<37?Q$\?^//B%=W% MS*%O+RXN/$NJ:I-/=W:@+=7,KO-<*,3.XXKZ[ _1N MSB=GF?%&5856UA@,!C\=)._2>)J9?2:M;7E6MU:RN_B,Q^E3D5.ZRGA'.,6[ MZ3S',%I9E63O=6YGHD[W=E_HX>-?VK/V7_ (;SW%K\0?VCO@3X M'O+61HKBR\6?%OP%X?OH9DC,SPO9:IK]K="9(5:9HO)\Q8E:0J$4L/CKQQ_P M68_X)P^!99K6?]HJQ\5WT<;2);?#WP-\1_'5O<%998?+AU[PYX2O?"ZR,T+L MBW&NP!H6AN WD7-O)+_!#%;6T @MX(0. (HHXP .@ 10!BIZ^OP/TXYV7-##4FWRSQ M5?-$_A/^T5XOG+)NDE\/ M?#[PUIZH6&\^?J?Q%EU%I47<0G]D"-V"+YRJS21_)'C[_@Y%\8W5O?VGPL_9 M.\.Z-<^8PTKQ!\0_BUJ/B&+R@S!'U'P9X9\#>'")&38S16OC]T1B\8FD"K(_ M\S-%?78+P1\.,&XREDV)Q\HM/_A1S;,<1!M._O4J,\#2DGLXR3BXZ-=3XC'_ M $@?%/'*489[A,NC)-6RO)[6KT\PJQ:W4XN,U+5/2Q^UWC7_ (+[ M_M]>*/M,?A]?@7\-X9;?R+=_"GPVU;5M1M&WA_MGVKQYXS\7:?<7PYB!DT=+ M 0[0=.:=6N'^2_&?_!4W_@HAX]01^(/VM/B9:HL=S$J^#+3P3\,F6.ZB,,@, MWPS\)>$+F1TC/^C7$TTEU9R@7-K/#=9G/P+17UV"X%X*R[E^I\)\/47&W+-Y M3A,1432M?VN-ACZE[;^]J]6K[?$X_P 1>/LTYOKW&?$U>,_BA'.<;AJ35[V= M+ 3RZE9/;W=-D[:/L?&GQ&^(_P 25*?$GXC?$+XC(9A-U:Y4DB MY9?%&K:J&N 68B<@R@LQ#Y))X:*UM8 !!;6\( P!%#'& /0!%4 >PJQ17U-. MG3HTU2HTZ=&E'X:5&G3HTHWWY:5&G1I1O97Y:4;V5[V5OD*M6KB*CK8BK5Q% M:7Q5L15JUZTO\5:O5KU9;OXJLMWW=RBBBJ(*LUC8W (N+.UG!.2)K>&4$X(R M0Z-S@D9]"17K/@SXW_&WXE%3IL'@OXG>./"]I8A;B2[\N MVL]$UVQM(X&NIIYY;80?9YY9[AIHI#/-O\PHK.M1HXFG[+$T:.)I.]Z6)HT< M32=TT_W6(HXBGJFT_P!W=IM-V=C7#XC$82HJV$Q%?"UE:U;"UZ^%K*S4E^]P MM?#5=))-?O;)I.UTF?HAX/\ ^"L__!1OP/"UMH_[5GC34+62Z%W-!XR\+_#' MX@23,/O0C4_&_@77];M+5QP;;3M4LHEZQA& :OK+PA_P<#?MV^'@8O$.@_L^ M>/H6BB0S:UX \6:)J:R11E#-'<^%?B'I&F@W+'S;N.3195:0*+/[#$&B?\/: M*^6QO /!&87>+X2X>JRE=N<,KPV&J-NVKJ8'ZA-OW5JV[6LE9N_V. \2?$'+ M.58+C7B:E&*M&%3-\5BZ:2OHJ>8?VC!+WGHDKWNWHK?U#^!O^#DB3.GVOQ._ M9':-$B5=5U[X>_&*.^EGGW-OET[P=XG\ :3':Q;-NRWN?'EV^X'==;2"/K#P M;_P<+_L4ZZME%XK\$?M!_#^YF=8[Z?4_!7A3Q'I%BQ&7GCNO!_CO7-8O+-,X M#)X?BOG(.-/ VEOXR**^0QO@;X759R2Y59UL)_9U2[4=96"=!DMY8(G_P"%D:3XS^$\+FYE:**2 MWN_B;X9\)65U""A>YFMKB:.QA*37[6T3JQ^P_ _[0'P&^)SO%\-OC;\(_B%) M'%',\?@?XD^#?%CI#,\<<,SIH.M7[+%+)-%''(0$D>6-5)9U!_S0ZJS6-E<# M%Q9VLX])K>*4<]>'1NN37R&-^CAP_4=8.Z]V&+PN6YA!/2[E.']GUI M+?1*.Z5]-?M\O^E/Q+245FG"V0XZS]Z>"QF:Y9.2U^&%3^TJ$7\.K$K<0QNLBVSVN@:]86 MLUH64>99S0R6LJY26%T)4_6_@[_@K!_P47\#0Q6VB_M6^.M0MHEV>5XST#X= M?$*611YA'FZEX[\%^(M99@9"?,&I+*VU%9V2-%7Y#&_1PSZFV\NXER;%Q^S' M&83,L!/KO*E_:%*^VVG=GVV7_2HX"O^#@#]O#PTT$?B72_@)\1K17LQ=/K_P_\0Z%JTT$$F;L M6M]X.\7\):/[3/X?O[6TF$4\6G.B2VT_V+X)_X.2+Y8=,M?B3^R+" M\Z0A-9UWP'\9"4N;A4&;C2_"/B/X=PFSAEER/L=WXXOGMX\-]NN6^6OD<=X% M^(N#NZ66Y?F45?7+\XP4I-)-W]EC%@*FNRBG*3;6BW/MLN^D1X78ZRK9KF65 M3=O=S/),?"";:5O;8)YE2TO=R:C%)-W>S_J8HK^?_1_^#BW]D&XTVUEU[X-? MM-Z5J[QYOK#3?#GPIUJPMY@Q!6TU27XNZ/->PE0K++-I=A*22K6R8!8KY^7A M5XC1;C_J=G+LVKQIX.479M7C)9I:2=KJ2T:LUHSZ:/C%X72C&2XYR)*24DI5 M<="2ND[2C+*.:,E>SB]4[IZH_H HHHK\_/TH**** "BBB@ HHHH **** "BB MB@ HI&955F9@JJ"S,Q 55 R68G !)). .37\WW[7?_ #?A M;\&?"E[^TUX,T?Q+):_'OXG^!=?L;/0-!T5%N;";3/@Q=7L8T;XL>+--NVBU MN\OSK&@_#J\LK*#PWI'C2]U'7]1UKP)[_#W"W$'%6*JX/A_*\3F5>A1GB*_L M5&-*A3A"T53$5*=&5/#T5*K6G&*C&I_2%17@ M'[-'[47P)_:^^%>D?&7]GOXAZ)\0_!&J2?8;N?39O*UCPOK\=G97][X2\:>' M[CR]7\(^+=,M-1L+F_\ #VNVEGJ$=G?Z?J4,4^EZEIU[=>_UX^)PV)P6(K83 M&8>MA<5AJDZ.(PV(I5*->A5IOEG3JTJL85*,HK1IIRC*$Y^OA\1A\70H MXK"UZ.)PV(IPK4,10J0K4:U*:YH5*56G*<)PDMI1DUHT[2C*,2BBBL#8**** M "BBB@ HHHH **** "BBB@ HHHH **** "BBB@ HHHH **** "BBB@ HHHH M**** "BBB@ HHHH **** "BBB@ HHHH **** "BBB@ HHHH **** "BBB@ H MHHH **** "BJE]?V.EV=SJ.IWMIIVGV4,ES>7U]<0VEG:6\2EY;BYNKAXX(( M8U!:265TC102S #-?-GB_P#;:_8X\ -+%XS_ &JOV=_#EW%$\QTW4_C)\/H= M7D2-Y(W^SZ,/$#:K=N)(98_+M;.:0R121JA=&4=>%P&/QTN3 X'&XV::3A@L M%C,9)-[)QPF%Q37?WE'36Z6IQXS,/Q^"P46ENXRQF,P MBE:UO=O&6H0W!CMI/%!^'G@+0+Z!=H^TQ:A9^,/&VO0*Y+F.&[\*03%54R+$SE M4^MP/AIQ_F+7U;A'/%%M+GQ6#_L^FN;9N>8U\%[O>2A)):M(^*S#Q7\-LK3^ MM\:\/N23?L\)CO[2JOEW2IY90Q_O=HN<&^C9_0Y17\FGC7_@Y"^*5ZE[%\.? MV5O 7AIBDB:=?^-_BAX@\:[7^8175]H^@>$/ 09?NM)86^O C#(NI-N#K\<^ M-/\ @NU_P42\6,6T?QE\*OAF#'$FSX?_ FTJY0-&DRO,/\ A:&J?$V3S+AI M4DF!D,0>WA%O%!&;B.X^OP/@+XA8NSQ&&RC+(NUWCLWP\YJZOK2R^CCIOL[5 M+IZ6>Y\3F/TCO#'!76&Q>=9M)7LLOR3$P@[-K2MF5?+X+:ZO3LT[IK8_N1JM M>7MGIUM+>ZA=VMC9PA3-=WEQ%:VT(=UC0RSSND48>1TC7>XW.ZH,LP!_SQ_& MO_!2/]OOX@X_X23]KOXWV^)6F_XHKQ2GPKR[))&0?^%4V7@G,6V5RL!_<(XC ME2)988'C^2_&/C+QE\1;^35OB)XR\7_$+59CF75/'GBG7O&>IRGSI;C,M_XE MU#5+N0_:)YKCYYF_?S2S?ZR1V;Z[ _1NS6;B\SXJRW#JWO0P&6X[&33NM%4Q M=; T6FKZ\B:=O=:/B,P^E5DT%)93P?FN*E?W9YEFF78&FU;>5/!T,PKIWMIS MM-7]Y,_T7_&/[9W[('P]N9['QS^U/^SMX2U*W2Y>32?$'QH^'6EZRWV,[;F. M'1[OQ''J=S/$^(VMK>TEN#*RPK$965#\A>.?^"U'_!.7P0(4C^.\WC6ZF\PB MU^'_ ( ^('B81K&9%W3:E%X;MM$B,DD>R.)]4$[*\5QY0M)%N*_@VCABA7;# M%'$O'RQHL:\=.% '';BI*^NP7T<^%Z+B\?GN?8ZUN:%&&6Y=3;L[VE"CC:RB MW9J\E)6M=W;/B._BKK?C"*.0"3,]_P"'/#W@OP2TJ,6AQ:VWBN(IY4G^FOYZ_9_YJ:*^OP7@ MGX;X/E;R.MCI1:?-F.:YEB4VK/WJ=.M@J33:UBX.-FX[/3XC'^/_ (J8[F4> M(:&7QDFN7*\FRK"N*::]VK5H8^M&23TFIJ5TI;K7]D/&O_!>+_@H=XM+G1_$ MOP>^&6ZU>W ^'WPG@N5CE=0!?1_\+0\0_$YOM<9!:-9&DL=S$2V4J[57Y0\: M?\%+_P#@H#X_,9\1?M<_&6W\OS-@\%ZWIWPN&))C.PHKZ_!<$\'9=R_4N%>'L.X_#-91@:U1;K^)BZ..J/=[SE^5OB M)L2I_%!YWF%"F]4_X6"KY?26J6U.-NG5/H_&7C+QE\1M0N M-7^(OC+Q?\0M6N[R74;K5/'?BC7O&.HW.H3QK%-?SWWB/4-2N9;V:%$ADNGE M:=X42)G,:*HY>.""%0L,,42CHL<:(H^@4 #\*EHKZ6$(4J<:5*$*5*"2A2I0 MA2I02224*5*%*E!)))*%."2222227R52&_#.DZMKEY;V5[HW4'Q3_:0O](6_P#"WP.\/ZG%;3Z9#>V[ MRZ=XE^*?B)8KNT^'WA*3$YT[]G; M]GA]13Q-?:?-IJ:5<6OBGQ9J'ABS^(VGZ=8ZCJWQ;\6ZG:)!RGFY4J^>8V#C1PD5S76&>(IUY67M98>/ MNS\-_P""H7_!=#XX_MVC6_@_\(;?7?@+^RM?/>Z3>>$8KZ!/B;\9=/O93:0K M\6]:T:ZNK33]"OK,K WPF\):C>>'II-0U.T\7>(OB- VAKH7D7[/_P#P0I_X M*2?M#_#/6OBGH'P9T_X<:':Z*-7\'Z#\:_$*_#/QK\3F+'9IO@[PGJ6GW6I: M///"%N+'5/B)_&WBB"/[0_:_%?_@KM^PA\)/&NE^!M3^+W_"97]SJ#6.O:S\,=$U# MQ_X4\&1JA)OO$'B/05GT^_B696M)]/\ !LGBO7K*Y1EO]'M8QYM?KF \1,=& MF^%_ O@#&8["8#]_BL?+*<9F.(Q,:2&T\.QZ1XKU[[#\8>!?V*?\ @H]\'/[*\6:-\'_VH/A1>><;2X6;3]>O/">K M:CICVT]WH>O:7<6WC'X7>.H--O)+=M0T74?"WC71EFEA%Q8R[U'\O'[9?_!M M+\6_AGXB_P"%O_\ !.;XI:EXC_X1O5+7Q=X=^%7COQ;'X*^+_A#Q!I%_;ZIH MUS\*/C'8#0]!U+4M)U1(KOPW)XMN/A_K?AN'2[6ZE^('BC72MRWEYMQ%P)XF M\^6\;8"KX><=81?5:>