
UNITED STATES
SECURITIES AND EXCHANGE COMMISSION
WASHINGTON, D.C. 20549
FORM
(Mark One)
|
|
ANNUAL REPORT PURSUANT TO SECTION 13 OR 15(d) OF THE SECURITIES EXCHANGE ACT OF 1934 |
For the fiscal year ended
|
|
TRANSITION REPORT PURSUANT TO SECTION 13 OR 15(d) OF THE SECURITIES EXCHANGE ACT OF 1934 FOR THE TRANSITION PERIOD FROM TO |
Commission File Number
(Exact name of registrant as specified in its charter)
|
|
|
|
|
(State of Incorporation) |
|
(I.R.S. Employer Identification No.) |
|
|
|
|
|
|
|
|
|
(Address of Principal Executive Offices) |
|
(Zip Code) |
(
(Registrant’s telephone number, including area code)
Securities registered pursuant to Section 12(g) of the Act: None
|
Title of each class |
Trading Symbol |
Name of exchange on which registered |
|
|
|
|
Securities registered pursuant to Section 12(b) of the Act:
Indicate by check mark if the registrant is a well-known seasoned issuer, as defined in Rule 405 of the Securities Act.
Indicate by check mark if the registrant is not required to file reports pursuant to Section 13 or Section 15(d) of the Act. Yes ☐
Indicate by check mark whether the registrant (1) has filed all reports required to be filed by Section 13 or 15(d) of the Securities Exchange Act of 1934 during the preceding 12 months (or for such shorter period that the registrant was required to file such reports), and (2) has been subject to such filing requirements for the past 90 days.
Indicate by check mark whether the registrant has submitted electronically every Interactive Data File required to be submitted pursuant to Rule 405 of Regulation S-T during the preceding 12 months (or for such shorter period that the registrant was required to submit such files).
Indicate by check mark whether the registrant is a large accelerated filer, an accelerated filer, a non-accelerated filer, or a smaller reporting company. See the definitions of “large accelerated filer,” “accelerated filer” and “smaller reporting company” in Rule 12b-2 of the Exchange Act.
|
Large accelerated filer |
|
☒ |
|
Accelerated filer |
|
☐ |
|
|
|
|
|
|||
|
Non-Accelerated filer |
|
☐ |
|
Smaller reporting company |
|
|
|
Emerging growth company |
|
|
|
|
|
|
If an emerging growth company, indicate by check mark if the registrant has elected not to use the extended transition period for complying with any new or revised financial accounting standards provided pursuant to Section 13(a) of the Exchange Act. ☐
Indicate by check mark whether the registrant is a shell company (as defined in Rule 12b-2 of the Act). Yes
As of June 30, 2019, the last business day of the registrant’s most recently completed second fiscal quarter, the aggregate market value of the registrant’s common stock held by non-affiliates was approximately $
As of February 20, 2020,
Documents Incorporated By Reference
The information required by Items 10, 11, 12, 13, and 14 will be furnished (and are hereby incorporated) by an amendment hereto or pursuant to a definitive proxy statement pursuant to Regulation 14A that will contain such information.
Freshpet, Inc.
Annual Report on Form 10-K
TABLE OF CONTENTS
|
|
|
|||
|
Item 1 |
|
|
4 |
|
|
Item 1A |
|
|
10 |
|
|
Item 1B |
|
|
23 |
|
|
Item 2 |
|
|
23 |
|
|
Item 3 |
|
|
23 |
|
|
Item 4 |
|
|
23 |
|
|
|
|
|
|
|
|
|
|
|||
|
Item 5 |
|
|
23 |
|
|
Item 6 |
|
|
25 |
|
|
Item 7 |
|
Management’s Discussion and Analysis of Financial Condition and Results of Operation |
|
27 |
|
Item 7A |
|
|
39 |
|
|
Item 8 |
|
|
41 |
|
|
Item 9 |
|
Changes in and Disagreements with Accountants on Accounting and Financial Disclosure |
|
65 |
|
Item 9A |
|
|
65 |
|
|
Item 9B |
|
|
66 |
|
|
|
|
|
|
|
|
|
|
|||
|
Item 10 |
|
|
67 |
|
|
Item 11 |
|
|
67 |
|
|
Item 12 |
|
Security Ownership of Certain Beneficial Owners and Management and Relate Stockholder Matters |
|
67 |
|
Item 13 |
|
Certain Relationships and Related Transactions, and Director Independence |
|
67 |
|
Item 14 |
|
|
67 |
|
|
|
|
|
|
|
|
|
|
|||
|
Item 15 |
|
|
68 |
|
|
Signatures |
|
|
|
|
2
Forward-Looking Statements
This report contains forward-looking statements that are subject to risks and uncertainties. All statements other than statements of historical fact included in this report are forward-looking statements. Forward-looking statements discuss our current expectations and projections relating to our financial condition, results of operations, plans, objectives, future performance and business. You can identify forward-looking statements by the fact that they do not relate strictly to historical or current facts. These statements may include words such as “aim,” “anticipate,” “believe,” “estimate,” “expect,” “forecast,” “outlook,” “potential,” “project,” “projection,” “plan,” “intend,” “seek,” “may,” “could,” “would,” “will,” “should,” “can,” “can have,” “likely,” the negatives thereof and other words and terms of similar meaning in connection with any discussion of the timing or nature of future operating or financial performance or other events. They appear in a number of places throughout this report and include statements regarding our intentions, beliefs or current expectations concerning, among other things, our results of operations, financial condition, liquidity, prospects, growth, strategies and the industry in which we operate. All forward-looking statements are subject to risks and uncertainties that may cause actual results to differ materially from those that we expected, including:
|
|
• |
our ability to successfully implement our growth strategy; |
|
|
• |
our ability to timely complete the construction of our Freshpet Kitchens 2.0, Kitchens South and Kitchens 3.0 and achieve the anticipated benefits therefrom; |
|
|
• |
our ability to generate sufficient cash flow or raise capital on acceptable terms; |
|
|
• |
the loss of key members of our senior management team; |
|
|
• |
allegations that our products cause injury or illness or fail to comply with government regulations; |
|
|
• |
the loss of a significant customer; |
|
|
• |
the entrance of new competitors into our industry; |
|
|
• |
the effectiveness of our marketing and trade spending programs; |
|
|
• |
our ability to introduce new products and improve existing products; |
|
|
• |
our limited manufacturing capacity; |
|
|
• |
the impact of government regulation, scrutiny, warning and public perception; |
|
|
• |
the effect of false marketing claims; |
|
|
• |
adverse weather conditions, natural disasters, pestilences and other natural conditions affecting our operations; |
|
|
• |
our ability to develop and maintain our brand; |
|
|
• |
the effect of potential price increases and shortages on the inputs, commodities and ingredients that we require; |
|
|
• |
our ability to manage our supply chain effectively; |
|
|
• |
volatility in the price of our common stock; and |
|
|
• |
other factors discussed under the headings “Risk Factors,” “Business,” and “Management’s Discussion and Analysis of Financial Condition and Results of Operations” in this report. |
While we believe that our assumptions are reasonable, we caution that it is very difficult to predict the impact of known factors, and it is impossible for us to anticipate all factors that could affect our actual results. Important factors that could cause actual results to differ materially from our expectations, or cautionary statements, are disclosed under “Risk Factors” and “Management’s Discussion and Analysis of Financial Condition and Results of Operations” in this report. All forward-looking statements are expressly qualified in their entirety by these cautionary statements. You should evaluate all forward-looking statements made in this report in the context of these risks and uncertainties.
3
PART I
ITEM 1. BUSINESS
Overview
Freshpet, Inc. (“Freshpet” or the “Company”) is disrupting the over $30.0 billion North American pet food industry by driving consumers to reassess conventional dog and cat food offerings that have remained essentially unchanged for decades. We position our brand to benefit from mainstream trends of growing pet humanization and consumer focus on health and wellness. We price our products to be accessible to the average consumer, providing us with broad demographic appeal and allowing us to penetrate multiple classes of retail, including grocery (including online), mass, club, pet specialty and natural. We have successfully expanded our network of Freshpet Fridges within leading blue-chip retail chains. The strength of our business model extends to our customers, who we believe find that Freshpet grows their pet category sales, drives higher traffic, increases shopper frequency and delivers category leading margins. As of December 31, 2019, Freshpet Fridges were located in approximately 21,500 stores, and we believe there is an opportunity to install a Freshpet Fridge in at least 30,000 stores across North America. Additionally, we believe that there are opportunities to expand our network into international markets as demonstrated with our recent initiatives in the U.K. market.
Our Industry
We primarily compete in the North American dog and cat food market which we estimate has grown at an average compounded annual growth rate over 4% from 2012 to 2019. We believe pet food spending in North America will continue to increase at a similar rate over the next five years. Of the total market, we estimate that dog food, cat food and treats & mixers accounted for retail sales exceeding $31.7 billion. The pet food market has historically been resilient as consumers continue to spend on their pets even during economic downturns.
We believe the following trends are driving growth in our industry:
Pet ownership. There are currently over 80 million dog and cat owning households in the United States, which represents approximately 60% of total households, and over 170 million dogs and cats in the United States, according to the American Pet Products Association.
Pet humanization. According to Packaged Facts, 95% of U.S. pet owners view their pets as members of the family. As pets are increasingly viewed as companions, friends and family members, pet owners are being transformed into “pet parents” who spare no expense for their loved ones, driving premiumization across pet categories. This trend is reflected in food purchasing decisions. Nearly 80% of U.S. pet owners are as concerned about the quality of their pet’s food as they are about their own, according to market researcher Mintel.
Increasing consumer focus on health & wellness. Consumers are increasingly purchasing fresh, natural and organic food products. We believe consumers are seeking simple, fresh and easy to understand food products from brands they trust and made with ingredients that are transparently sourced.
The pet food purchasing decision is underpinned by higher brand loyalty than many other consumer packaged goods categories. A consumer selecting a pet food brand resists frequent switching in order to avoid disrupting the pet’s diet, resulting in high repeat purchasing behavior. As a result, we believe that as consumers try fresh, refrigerated pet food, they are likely to become repeat users of the product.
Our Opportunity
Even though long-term consumer trends of pet humanization and health and wellness are well documented, conventional pet food sold as dry kibble or wet food in cans has not changed substantially for decades. We believe that the pet food industry has not kept pace with how consumers think about food for their families, including their pets. As a result, consumers are searching for higher quality, less processed food for their dogs’ and cats’ meals that measure up to today’s sensibilities of what actually constitutes “good food.” Freshpet was specifically designed to address this growing need with affordable offerings accessible to the average consumer.
4
Our Mission and Values
We started Freshpet with a single-minded mission—to bring the power of real, fresh food to our dogs and cats. And, we are committed to doing so in ways that are good for Pets, People and Planet.
Pets
Our pets are members of our family and deserve to eat the kind of fresh, healthy food that we do. We cook our fresh, nutritious pet food with the same care that we would take in preparing human food. Through the Freshpet Foundation, we support nutritional research in areas of prevention, care and treatment of diseases in dogs. Since founding Freshpet, we have donated over five million fresh meals to pets via shelters, charitable organizations and humane societies. Our team members get paid time off to pursue activities that help pets in their community. We also participate in Random Acts of Kindness to do our part to improve the lives of pets and pet parents.
People
People include our team members, our partners and pet parents. We treat our team members with respect and are committed to helping them develop professionally and personally. As a demonstration of our commitment, beginning in 2019, all full-time hourly team members, with at least one year of service, will be eligible for equity grants. These equity grants are in addition to their existing wages, benefits and performance incentives. We try to be good partners with customers, distributors and suppliers by conducting business with honesty and transparency. Additionally, we strive to help pet owners by providing pet parenting resources.
Planet
We are committed to being socially responsible and minimizing our environmental impact. As of December 31, 2019, the electricity used in the Freshpet Kitchens is 100% wind-powered. Freshpet Kitchens is a landfill-free facility and we plant trees to offset carbon emissions. We also strive to conserve energy by continually improving the efficiency of our Freshpet Fridges and partnering with freight and logistics providers committed to sustainable practices.
Our commitment to our values helps us engage with consumers, motivate our team members and attract strong partners, which allows us to fulfill our mission of delivering the best nutritional product choices to improve the well-being of our pets, enrich pet parents’ lives and contribute to communities. Freshpet—Pets, People, Planet.
Our Products
Our products consist of dog food, cat food and dog treats. All Freshpet products are made according to our nutritional philosophy of fresh, meat-based nutrition and minimal processing. Our proprietary recipes include real, fresh meat and varying combinations of vitamin-rich vegetables, leafy greens and anti-oxidant rich fruits, without the use of preservatives, additives or artificial ingredients. Our unique product attributes appeal to diverse consumer needs across multiple classes of retail where Freshpet is sold. Consequently, our brand resonates across a broad cross-section of pet parent demographics.
Our products are sold under the Freshpet brand name, with ingredients, packaging and labeling customized by different classes of trade and are available in multiple forms, including slice and serve rolls, bagged meals and tubs.


We also offer fresh treats across all classes of retail under the Dognation and Dog Joy labels.
5
Our Product Innovation
As the first manufacturer of fresh, refrigerated pet food distributed across North America, product innovation is core to our strategy. We take a fresh approach to pet food and are not constrained by conventional pet food products, attributes and production capabilities. We employ a tightly-knit, creative team of marketing and research and development professionals, and we consult with outside experts through our Nutrition Council, which consist of PhD’s in nutrition and veterinary nutritionists. Our team often identifies pet parents’ needs by evaluating emerging demand trends in both pet food and human food. Our research and development facility located near the Freshpet Kitchens tests small batches of new recipes and tries out new cooking techniques. New products are refined iteratively with the help of consumer panel data to arrive at products that we believe can be commercially successful.
The success of our approach is evidenced by our broad product portfolio today. We began Freshpet by producing fresh, refrigerated slice and serve rolls, and over time have steadily expanded into successful new product forms including bags, tubs and treats. We also introduced new fresh recipes and ingredients, such as proteins and grain-free options never before seen in pet food that cater to the specific dietary requirements of pets.
Our Innovation Center, which is part of our Freshpet Kitchens manufacturing plant, helps us ensure that we remain capable of strong innovation including creating new product platforms to expand the breadth of our fresh offerings. We expect that new product introductions will continue to meaningfully drive growth going forward.
Our Supply Chain
Manufacturing: All of our products are manufactured in the United States. We own and operate what we believe to be the first fresh, refrigerated pet food manufacturing facility in North America, the Freshpet Kitchens in Pennsylvania. This 100,000 square foot facility was built to United States Department of Agriculture standards and houses four production lines customized to produce fresh, refrigerated food. In 2019, approximately 99% of our product volume was manufactured by us.
Expansion: Due to the continued growth of the Company’s fresh pet food sales, the Company has plans to continue expanding its manufacturing capacity. The Company converted three of its four manufacturing lines from five-day production to seven-day production during 2019 and converted the fourth line to seven-day production in January 2020. Additionally, the Company is in the process of adding additional capacity by investing $105 million to build a 90,000 square-foot addition to our manufacturing location, “Freshpet Kitchens 2.0”, as well as investing $15 million at a manufacturing facility, titled “Kitchens South”. The $120 million strategic capital investment is expected to support Freshpet’s growth in the United States, Canada and Europe by creating total capacity for approximately $590 million in net sales from the facility. The facility Freshpet Kitchens 2.0 will make greater use of automation to improve quality, safety and reduce costs. Production start-up is slated for the second half of 2020. We expect to make future capital expenditures of approximately $300 million in connection with the development of our Freshpet Kitchens 3.0. We expect to fund such capital expenditures with cash from operations, borrowings under credit facilities and possible debt and/or equity raises.
Ingredients and Packaging: Our products are made with natural and fresh ingredients including meat, vegetables, fruits, whole grains, vitamins and minerals. Over 60% of our ingredients are sourced locally from within a 200 mile radius of the Freshpet Kitchens, and 96% are from North America. We maintain rigorous standards for ingredient quality and safety. By volume, our largest input, fresh chicken, represents approximately 48% of total ingredients. In order to retain operating flexibility and negotiating leverage, we do not enter into exclusivity agreements or long-term commitments with any of our suppliers. All of our suppliers are well-established companies that have the scale to support our growth. For every ingredient, we either use multiple suppliers or have identified alternative sources of supply that meet our quality and safety standards.
Distribution: Beginning in 2016, outbound transportation from our facility is handled through a third-party refrigerated freight broker. We expect to be able to leverage certain distribution costs as volumes grow. We use national and regional distributors to cover the grocery (including online), mass, pet specialty and natural retail classes.
Our Product Quality and Safety
We go to great lengths to ensure product quality, consistency and safety from ingredient sourcing to finished product. Our company-owned manufacturing facility allows us to exercise significant control over production. Our quality assurance team includes 31 professionals with significant experience in pet and human food production.
6
Our production processes are designed to meet science-based quality standards with documented plans for Hazard Analysis Critical Control Points and Hazard Analysis Risk Based Preventive Control to monitor established production controls, calibrate instruments, record data and perform corrective actions. Our on-site laboratory has microbial and composition testing capabilities. Quality control approvals are based on a positive release strategy, wherein a batch can only be shipped when it passes control point record reviews and laboratory testing. Before commencing production, quality assurance professionals swab equipment to test for potential contaminants.
Freshpet’s food safety program is certified at Safe Quality Food Level III, which is the highest standard determined under the Global Food Safety Initiative Benchmarks. We believe our systems and standards for product quality and safety can support our growth and ensure continued success in the market.
Our Customers and Distributors
We sell our products throughout United States, Canada, the United Kingdom and Europe, generating the vast majority of our sales in the United States. The strength of our business model makes us an attractive partner for leading blue-chip retailers, who we believe find that Freshpet grows the sales of their pet category, drives higher traffic, increases shopper frequency and delivers category-leading margins. Our Freshpet Fridge locations have been consistently increasing as we add new retail accounts and add stores in existing accounts. We are in approximately 21,500 stores and believe there is opportunity for us to install a Freshpet Fridge in at least 30,000 stores in North America. We sell our products through the following classes of retail: grocery (including online), mass, club, pet specialty and natural.
Our customers determine whether they wish to purchase our products either directly from us or through a third-party distributor. In 2019, our largest distributor by net sales, McLane Company, Inc., accounted for 17% of our net sales and our largest customer, Phillips Feed Service, Inc., accounted for 11% of our net sales.
The Freshpet Fridge
We sell our products through a growing network of company-owned branded refrigerators, the Freshpet Fridges. Our Freshpet Fridges are typically four feet wide by seven feet high and replace standard shelving in the pet aisle or an end-cap of a retail store. Our Freshpet Fridge designs are constantly evolving with all new models featuring prominent edge-lit LED headers, LED interior lighting, crisp black interiors and frameless glass swing doors for aesthetics and easy access. We use state-of-the-art refrigeration technology and environmentally friendly refrigerants to minimize energy consumption and environmental impact.
We design, produce, install and maintain the Freshpet Fridge through a combination of in-house resources and world-class partners. We source our Freshpet Fridges from five leading global commercial refrigerator manufacturers with whom we have a collaborative approach to refrigerator design and innovation. Once ordered by us, Freshpet Fridges are shipped to distribution centers for delivery and installation in retail stores.
Installation into retail locations and ongoing maintenance of the Freshpet Fridge is coordinated by Freshpet and executed through leading third-party service providers. All of our Freshpet Fridges are protected by a manufacturer warranty of three years. Our refrigerators are designed to be highly reliable, and at any given time less than 0.5% of the network is out of service for maintenance. Moreover, to ensure quality, cleanliness and appropriate in-stock levels, we employ brokerage partners to conduct a physical audit of the Freshpet Fridge network on an ongoing basis, with photographic results of our Freshpet Fridges transmitted back to Freshpet for review by members of our sales team.
We currently estimate less than 15 month cash-on-cash payback for the average Freshpet Fridge installation, calculated by comparing our total current costs for a refrigerator (including installation and maintenance) to our current margin on net revenues. We believe our attractive value proposition to retailers and pet parents will allow us to continue penetrating store locations of existing and new customers. The Freshpet Fridge provides a highly-visible merchandising platform, allows us to control how our brand is presented to consumers at point-of-sale and represents a significant point of differentiation from other pet food competitors.
Marketing and Advertising
Our marketing strategy is designed to educate consumers about the benefits of fresh refrigerated pet food and build awareness of the Freshpet brand. We deploy a broad set of marketing tools across television, digital and public relations to reach consumers through multiple touch points and increase product trials.
7
Our network of approximately 21,500 branded Freshpet Fridges in prominent locations within blue-chip retailers helps to introduce consumers to our brand and instantly distinguish Freshpet from traditionally merchandised pet food. We have effectively used national TV advertising to drive incremental consumers to try Freshpet products. We expect to realize greater benefits from national TV advertising as we continue to grow the network of Freshpet store locations nationwide. We have also expanded our online presence to better target consumers seeking information on healthy pet food. We reach consumers across multiple digital and social media platforms including websites, blogs and online reviews, as well as with tailored messaging on popular digital hubs including Instagram, Facebook, Twitter and YouTube.
Our marketing strategy has allowed us to drive new consumers to our brand and develop a highly engaged community of users who actively advocate for Freshpet.
Competition
Pet food is a highly competitive industry. We compete with manufacturers of conventional pet food such as Mars, Nestlé and Big Heart Pet Brands (part of The J.M. Smucker Company). We also compete with specialty and natural pet food manufacturers such as Colgate-Palmolive and General Mills. In addition, we compete with many regional niche brands in individual geographic markets.
Given a North American retail landscape dominated by large retailers, with limited shelf space and a significant number of competing products, competitors actively support their brands through marketing, advertising, promotional spending and discounting.
Competitive factors in the pet food industry include product quality, ingredients, brand awareness and loyalty, product variety, product packaging and design, reputation, price, advertising, promotion and nutritional claims. We believe that we compete effectively with respect to each of these factors.
Team Members
As of December 31, 2019, we had 462 employees, of which all but six are located in the United States. None of our employees are represented by a labor union or by any collective bargaining arrangements with respect to his or her employment with us. We believe that our employee relations are good.
Our Corporate Information
We were incorporated in Delaware in November 2004 and currently exist as a Delaware corporation. Our principal executive offices are located at 400 Plaza Drive, 1st Floor, Secaucus, New Jersey 07094.
Website Information
The address of our corporate website is www.freshpet.com. Our Annual Reports on Form 10-K, annual proxy statements and related proxy cards are made available on our website at the same time they are mailed to stockholders. Our quarterly reports on Form 10-Q, periodic reports on Form 8-K and amendments to those reports that we file or furnish pursuant to Section 13(a) or 15(d) of the Securities Exchange Act of 1934, as amended (the “Exchange Act”), are available through our website, free of charge, as soon as reasonably practicable after they have been electronically filed or furnished to the Securities and Exchange Commission (the “SEC”). Our website also provides access to reports filed by our directors, executive officers and certain significant shareholders pursuant to Section 16 of the Exchange Act. In addition, our Corporate Governance Guidelines, General Code of Ethics, Code of Ethics for Executive Officers and Principal Accounting Personnel and charters for the committees of our board of directors are available on our website as well as other shareholder communications. The information contained in or that can be accessed through our website does not constitute a part of, and is not incorporated by reference into, this report. The SEC maintains a website, www.sec.gov, which contains reports, proxy and information statements and other information that we file electronically with the SEC.
Trademarks and Other Intellectual Property
We believe that our rights in our trademarks and service marks are important to our marketing efforts to develop brand recognition and differentiate our brand from our competitors and are a valuable part of our business. We own a number of trademarks and service marks that have been registered, or for which applications are pending, with the United States
8
Patent and Trademark Office including, among others, Freshpet, Vital, Nature’s Fresh, Roasted Meals, Fresh From The Kitchen, Freshpet Dog Joy, Dognation, Homestyle Creations and Pets People Planet.
We believe that our intellectual property has substantial value and has significantly contributed to our success to-date. We are continually developing new technology and enhancing proprietary technology related to our pet food, Freshpet Fridges and manufacturing operations.
We also rely on unpatented proprietary expertise, recipes and formulations, continuing innovation and other trade secrets to develop and maintain our competitive position.
Government Regulation
Along with our brokers, distributors, and ingredients and packaging suppliers, we are subject to extensive laws and regulations in the United States by federal, state and local government authorities. In the United States, the federal agencies governing the manufacture, distribution and advertising of our products include, among others, the Federal Trade Commission, the U.S. Food and Drug Administration (“FDA”), the U.S. Department of Agriculture, the United States Environmental Protection Agency and the Occupational Safety and Health Administration. Under various statutes, these agencies, among other things, prescribe the requirements and establish the standards for quality and safety and regulate our marketing and advertising to consumers. Certain of these agencies, in certain circumstances, must not only approve our products, but also review the manufacturing processes and facilities used to produce these products before they can be marketed in the United States. In addition to agency regulation, we are required to comply with state feed control requirements in the United States. We are also subject to the laws of Canada, including the Canadian Food Inspection Agency, and the United Kingdom, including the Food Standards Agency, as well as provincial and local regulations.
We are subject to labor and employment laws, laws governing advertising, privacy laws, safety regulations and other laws, including consumer protection regulations that regulate retailers or govern the promotion and sale of merchandise. Our operations, and those of our distributors and suppliers, are subject to various laws and regulations relating to environmental protection and worker health and safety matters. We monitor changes in these laws and believe that we are in material compliance with applicable laws.
Information Systems
We employ a comprehensive Enterprise Resource Planning (“ERP”) system provided by a leading global software provider and are supported by a local consulting partner. This system covers order entry, customer service, accounts payable, accounts receivable, purchasing, asset management and manufacturing. Our order management process is automated via Electronic Data Interchange with virtually all our customers, which feeds orders directly to our ERP platform. We complement the ERP system with a Warehouse Management System, which allows us to improve tracking and management of ingredients and streamline manufacturing.
We backup data every hour and store a copy locally for immediate restoration if needed. All data is transmitted to a secure offsite cloud storage service daily for disaster recovery needs. We believe our systems infrastructure is scalable and can support our future growth.
9
ITEM 1A. RISK FACTORS
Investing in our common stock involves a high degree of risk. Before you purchase our common stock, you should carefully consider the risks described below and the other information contained in this report, including our consolidated financial statements and accompanying notes. If any of the following risks actually occurs, our business, financial condition, results of operations or cash flows could be materially adversely affected. In any such case, the trading price of our common stock could decline, and you could lose all or part of your investment.
Risks Related to Our Business and Industry
We may not be able to successfully implement our growth strategy on a timely basis or at all.
Our future success depends, in large part, on our ability to implement our growth strategy of expanding distribution by installing new Freshpet Fridges, attracting new consumers to our brand and launching new products. Our ability to increase awareness, consumer trial and adoption of our products, and to implement this growth strategy depends, among other things, on our ability to:
|
|
• |
partner with customers to secure space for our Freshpet Fridges; |
|
|
• |
implement our marketing strategy; |
|
|
• |
develop new product lines and extensions; |
|
|
• |
partner with distributors to deliver our products to customers; |
|
|
• |
continue to compete effectively in multiple classes of retail, including grocery (including online), mass, club, pet specialty and natural; and |
|
|
• |
expand and maintain brand loyalty; and |
|
|
• |
build capacity to meet demands. |
We may not be able to successfully implement our growth strategy or to grow consistently from period to period. Our business, financial condition and results of operations will be adversely affected if we fail to implement our growth strategy or if we invest resources in a growth strategy that ultimately proves unsuccessful.
We expect to need capital in the future for business development, and we may not be able to generate sufficient cash flow or raise capital on acceptable terms to meet our needs.
Developing our business will require significant capital in the future. To meet our capital needs, we expect to rely on our cash flow from operations, our credit facilities, and other third-party financing. Third-party financing in the future may not, however, be available on terms favorable to us, or at all. Our ability to obtain additional funding will be subject to various factors, including general market conditions, our operating performance, the market’s perception of our growth potential, lender sentiment and our ability to incur additional debt in compliance with other contractual restrictions, such as financial covenants under our debt documents.
Additionally, our ability to make payments on and to refinance any indebtedness and to fund planned expenditures for our growth plans will depend on our ability to generate cash in the future. If our business does not achieve the levels of profitability or generate the amount of cash that we anticipate or if we expand faster than anticipated, we may need to seek additional debt or equity financing to operate and expand our business.
We believe that our cash and cash equivalents, expected cash flow from operations and planned borrowing capacity are adequate to fund debt service requirements, operating lease obligations, capital expenditures and working capital obligations for the foreseeable future. From time to time, we may seek to raise additional capital by accessing the debt and/or equity markets to fund capital expenditures or otherwise. However, our ability to continue to meet our capital resource requirements and obligations will depend on, among other things, our ability to achieve anticipated levels of revenue and cash flow from operations, our ability to manage costs and working capital successfully and our ability to access the debt or equity markets. Additionally, our cash flow generation ability is subject to general economic, financial, competitive, legislative and regulatory factors and other factors that are beyond our control. We cannot assure you that our business will generate cash flow from operations in an amount sufficient to enable us to fund our liquidity needs. Further, our capital requirements may vary materially from those currently planned if, for example, our revenues do not reach expected levels, or we have to incur unforeseen capital expenditures and make investments to maintain our competitive position. If this is the case, we may seek alternative financing, such as selling additional debt or equity securities, and we cannot assure you that we will be able to do so on favorable terms, if at all. Moreover, if we issue new
10
debt securities, the debt holders would have rights senior to common stockholders to make claims on our assets, and the terms of any debt could restrict our operations, including our ability to pay dividends on our common stock. If we issue additional equity or convertible debt securities, existing stockholders may experience dilution, and such new securities could have rights senior to those of our common stock. These factors may make the timing, amount, terms and conditions of additional financings unattractive. Our inability to raise capital could impede our growth or otherwise require us to forego growth opportunities and could materially adversely affect our business, financial condition and results of operations.
Certain of our variable rate indebtedness uses LIBOR as a benchmark, which is subject to regulatory uncertainty that could increase the cost of our variable rate indebtedness.
Certain of our variable rate indebtedness uses LIBOR as a benchmark for establishing the rate of interest and may be hedged with LIBOR-based interest rate derivatives. LIBOR is the subject of recent national, international and other regulatory guidance and proposals for reform. On July 27, 2017, the United Kingdom's Financial Conduct Authority announced that it intends to stop persuading or compelling banks to submit LIBOR rates after 2021. It is expected that most, if not all, banks currently reporting information to set LIBOR will stop doing so at such time, which could either cause LIBOR publication to stop immediately or cause LIBOR's regulator to announce the discontinuation of its publication (and, during any such transition period, LIBOR may perform differently than in the past). These reforms and other pressures may cause LIBOR to be replaced with a new benchmark or to perform differently than in the past. The consequences of these developments cannot be entirely predicted but could include an increase in the cost of our variable rate indebtedness.
If our products are alleged to cause injury or illness, be mislabeled or misbranded, or fail to comply with governmental regulations, we may suffer adverse public relations, need to recall our products and experience product liability claims.
We may be exposed to product recalls, including voluntary recalls or withdrawals, and adverse public relations if our products are alleged to cause injury or illness or if we are alleged to have mislabeled or misbranded our products or otherwise violated governmental regulations. For example, we have had legal claims brought against us in California for our use of the word “natural” in describing certain of our products. We may also voluntarily recall or withdraw products that we consider below our standards, whether for taste, appearance or otherwise, in order to protect our brand reputation. Consumer or customer concerns (whether justified or not) regarding the quality or safety of our products could adversely affect our business. A product recall or withdrawal could result in substantial and unexpected expenditures, destruction of product inventory, and lost sales due to the unavailability of the product for a period of time, which could reduce profitability and cash flow. In addition, a product recall or withdrawal may require significant management attention. Product recalls, product liability claims (even if unmerited or unsuccessful), or any other events that cause consumers to no longer associate our brands with high quality and safe products may also result in adverse publicity or legal challenges, hurt the value of our brands, lead to a decline in consumer confidence in and demand for our products, and lead to increased scrutiny, fines, or other penalties by federal and state regulatory agencies of our operations, which could have a material adverse effect on our business, financial condition and results of operations.
We also may be subject to product liability claims and adverse public relations if consumption or use of our products is alleged to cause injury or illness. While we carry product liability insurance, our insurance may not be adequate to cover all liabilities we may incur in connection with product liability claims. For example, punitive damages are generally not covered by insurance. In addition, we may not be able to continue to maintain our existing insurance, obtain comparable insurance at a reasonable cost, if at all, or secure additional coverage (which may result in future product liability claims being uninsured). A product liability judgment against us or our agreement to settle a product liability claim could also result in substantial and unexpected expenditures, which would reduce profitability and cash flow. In addition, even if product liability claims against us are not successful or are not fully pursued, these claims could harm our brand image, be costly and time-consuming and may require management to spend time defending the claims rather than operating our business.
The loss of a significant customer, certain actions by a significant customer or financial difficulties of a significant customer could adversely affect our results of operations.
A relatively limited number of customers account for a large percentage of our net sales. During 2019, ten customers, who purchase either directly from us or through third-party distributors, collectively accounted for more than 70% of our net sales. In 2019, our largest distributor by net sales, McLane Company, Inc., accounted for 17% of our net sales. These percentages may increase if there is consolidation among retailers or if mass merchandisers grow disproportionately to their competition. We expect that a significant portion of our revenues will continue to be derived from a small number of
11
customers; however, these customers may not continue to purchase our products in the same quantities as they have in the past. Our customers are not contractually obligated to purchase from us. Changes in our customers’ strategies, including a reduction in the number of brands they carry, shipping strategies, a shift of shelf space to or increased emphasis on private label products (including “store brands”), a reduction in shelf space for pet food items or a reduction in the space allocated for our Freshpet Fridges may adversely affect our sales. Requirements that may be imposed on us by our customers, such as sustainability, inventory management or product specification requirements, may have an adverse effect on our results of operations. Additionally, especially during economic downturns, our customers may face financial difficulties, bankruptcy or other business disruptions that may impact their operations and their purchases from us and may affect their ability to pay us for products purchased from us. Customers may grow their inventory in anticipation of a price increase, or in anticipation of, or during, our promotional events, which typically provide for reduced prices during a specified time or other customer or consumer incentives. To the extent customers seek to reduce their usual or customary inventory levels or change their practices regarding purchases in excess of consumer consumption, our sales and results of operations could be adversely impacted in that period. If our sales of products to one or more of our significant customers are reduced, this reduction could have a material adverse effect on our business, financial condition and results of operations.
Our operating results depend, in part, on the sufficiency and effectiveness of our marketing and trade spending programs.
In general, due to the highly competitive nature of the businesses in which we compete, we must execute effective and efficient marketing investments and trade spending programs with respect to our businesses overall to sustain our competitive position in our markets. Marketing investments may be costly. Additionally, we may, from time to time, change our marketing and trade spending strategies, including the timing, amount or nature of television advertising and related promotional programs. The sufficiency and effectiveness of our marketing and trade spending practices is important to our ability to retain or improve our market share or margins. If our marketing and trade spending programs are not successful or if we fail to implement sufficient and effective marketing and trade spending programs, our business, financial condition and results of operations may be adversely affected.
The growth of our business depends on our ability to introduce new products and improve existing products in anticipation of changes in consumer preferences and demographics.
Our business is focused on the development, manufacture, marketing and distribution of pet food products. If consumer demand for our products decreased, our business would suffer. Sales of pet food products are subject to evolving consumer preferences and changing demographics. A significant shift in consumer demand away from our products or a decline in pet ownership could reduce our sales or the prestige of our brand, which would harm our business, financial condition and results of operations.
A key element of our growth strategy depends on our ability to develop and market new products and improvements to our existing products that meet our standards for quality and appeal to consumer preferences. The success of our innovation and product development efforts is affected by our ability to anticipate changes in consumer preferences and demographics, the technical capability of our product development staff in developing and testing product prototypes, including complying with governmental regulations, and the success of our management and sales team in introducing and marketing new products. Failure to develop and market new products that appeal to consumers could negatively impact our business, financial condition and results of operations.
Additionally, the development and introduction of new products requires substantial research, development and marketing expenditures, which we may be unable to recoup if the new products do not gain widespread market acceptance. Efforts to accelerate our innovation may exacerbate risks associated with innovation. If we are unsuccessful in meeting our objectives with respect to new or improved products, our business, financial condition and results of operations could be harmed.
12
Limited manufacturing capacity could have a material adverse effect on our business, financial condition and results of operations.
All of the products we manufacture in-house are processed through our Freshpet Kitchens in Bethlehem, Pennsylvania, which we believe is North America’s first fresh, refrigerated pet food manufacturing facility. Accordingly, we have limited available manufacturing capacity to meet our quality standards. Due to the continued growth of the Company’s fresh pet food sales, the Company is expanding its manufacturing capacity. The expansion includes the renovation of an existing 50,000 square foot building and a 90,000 square-foot addition, “Freshpet Kitchens 2.0”, and an investment in a manufacturing facility, “Kitchens South”. The $120 million strategic capital investment is expected to support Freshpet’s growth in the United States, Canada and Europe by creating total capacity for approximately $590 million in net sales from the facility. The facility Freshpet Kitchens 2.0 will make greater use of automation to improve quality, safety and reduce costs. Production start-up is slated for the second half of 2020. Our Freshpet Kitchens 2.0 may not be successfully completed on a timely basis, or at all, or we may not achieve our expected results following its completion. We expect to make future capital expenditures of approximately $300 million in connection with the development of our Freshpet Kitchens 3.0. We expect to fund such capital expenditures with cash from operations, borrowings under credit facilities and possible debt and/or equity raises.
In addition, an unforeseen event, such as a natural disaster or work stoppage, at our Freshpet Kitchens could significantly limit our manufacturing capacity.
Accurate forecasting of sales demand is critical to ensuring available capacity. Our forecasts are based on multiple assumptions, which may cause our estimates to be inaccurate, affecting our ability to obtain adequate manufacturing capacity.
If our growth exceeds our expectations, we may not be able to increase our own manufacturing capacity to, or obtain contract manufacturing capacity at, a level that meets demand for our products, which could prevent us from meeting increased customer demand and harm our business. However, if we overestimate our demand and overbuild our capacity, we may have significantly underutilized assets, and we may experience reduced margins. If we do not accurately align our manufacturing capabilities with demand, it could have a material adverse effect on our business, financial condition and results of operations.
Failure to retain our senior management or failure to hire and integrate suitable replacements may adversely affect our operations.
Our success is substantially dependent on the continued service of certain members of our senior management. These members of senior management are primarily responsible for determining the strategic direction of our business and for executing our growth strategy and are integral to our brand and culture, and the reputation we enjoy with suppliers, contract manufacturers, distributors, customers and consumers. The loss of the services of any of these employees could have a material adverse effect on our business and prospects, as we may not be able to find and integrate suitable replacements on a timely basis, if at all. In addition, any such departure could be viewed in a negative light by investors and analysts, which may cause the price of our common stock to decline.
Government regulation, scrutiny, warnings and public perception could increase our costs of production and increase legal and regulatory expenses.
Manufacturing, processing, labeling, packaging, storing and distributing pet products are activities subject to extensive federal, state and local regulation, as well as foreign regulation. In the United States, these aspects of our operations are regulated by the FDA, and various state and local public health and agricultural agencies. The FDA Food Safety Modernization Act of 2011 provides direct recall authority to the FDA and includes a number of other provisions designed to enhance food safety, including increased inspections by the FDA of domestic and foreign food facilities and increased review of food products imported into the United States. In addition, many states have adopted the Association of American Feed Control Officials’ model pet food regulations or variations thereof, which generally regulate the information manufacturers provide about pet food. Complying with government regulation can be costly or may otherwise adversely affect our business. Failure to comply with applicable laws and regulations could subject us to civil remedies, including fines, injunctions, recalls or seizures, as well as potential criminal sanctions, which could have a material adverse effect on our business, financial condition and results of operations.
Our business is also affected by import and export controls and similar laws and regulations, both in the United States and elsewhere. Issues such as national security or health and safety, which slow or otherwise restrict imports or exports, could adversely affect our business. In addition, the modification of existing laws or regulations or the introduction of new laws
13
or regulations could require us to make material expenditures or otherwise adversely affect the way that we have historically operated our business.
Our business may be subject to false marketing claims.
From time to time we may be subject to claims from competitors or consumers, including consumer class actions, alleging that our product claims are deceptive, such as products being mislabeled or misbranded. Regardless of their merit, these claims can require significant time and expense to investigate and defend. Whether or not a false marketing claim is successful, such assertions could have an adverse effect on our business, financial condition and results of operations, and the negative publicity surrounding them could harm our reputation and brand image.
Adverse weather conditions, natural disasters, pestilences and other natural conditions can disrupt our operations, which can adversely affect our business, financial condition and results of operations.
The ingredients that we use in the production of our products (including, among others, meat, vegetables, fruits, carrageenans, whole grains, vitamins and minerals) are vulnerable to adverse weather conditions and natural disasters, such as floods, droughts, frosts, fires, earthquakes, tornadoes and pestilences. Adverse weather conditions may be impacted by climate change and other factors. Adverse weather conditions and natural disasters can reduce crop size and crop quality, which in turn could reduce our supply of ingredients, lower recoveries of usable ingredients, increase the prices of our ingredients, increase our transportation costs or increase our cost of storing ingredients if harvests are accelerated and processing capacity is unavailable. Additionally, the growth of crops, as well as the manufacture and processing of our products, requires significant amounts of water. Drought or other causes of a reduction of water in aquifers may affect availability of water, which in turn may adversely affect our results of operations. Competing manufacturers may be affected differently by weather conditions and natural disasters depending on the location of their supplies or operations. If our supply of ingredients is reduced, we may not be able to find enough supplemental supply sources on favorable terms, if at all, which could impact our ability to supply product to our customers and adversely affect our business, financial condition and results of operations. Increased costs for ingredients or other inputs could also adversely affect our business, financial condition and results of operations as described in “—The inputs, commodities and ingredients that we require are subject to price increases and shortages that could adversely affect our results of operations.”
Additionally, adverse weather conditions, natural disasters or other natural conditions affecting our operating activities or major facilities could cause an interruption or delay in our production or delivery schedules and loss of inventory and/or data or render us unable to accept and fulfill customer orders in a timely manner, or at all. If our operations are damaged by a fire, flood or other disaster, for example, we may be subject to supply or delivery interruptions, destruction of our facilities and products or other business disruptions, which could adversely affect our business, financial condition and results of operations.
If we fail to develop and maintain our brand, or the quality of our products that customers have come to expect, our business could suffer.
We believe that developing and maintaining our brand and the quality of our products is critical to our success. The importance of our brand recognition and the quality of our products may become even greater as competitors offer more products similar to ours. Our financial success is directly dependent on consumer perception of our brand and our products. Our brand-building activities involve providing high-quality products, increasing awareness of our brand, creating and maintaining brand loyalty and increasing the availability of our products.
The success of our brand may suffer if our marketing plans or product initiatives do not have the desired impact on our brand’s image or its ability to attract customers. Further, our brand value could diminish significantly due to a number of factors, including consumer perception that we have acted in an irresponsible manner, adverse publicity about our products (whether or not valid), our failure to maintain the quality of our products, product contamination, the failure of our products to deliver consistently positive consumer experiences, or the products becoming unavailable to consumers. The growing use of social and digital media by consumers increases the speed and extent that information and opinions can be shared. Negative posts or comments about us or our brands or products on social or digital media could damage our brands and reputation. If we fail to maintain the favorable perception of our brands, our business, financial condition and results of operations could be negatively impacted.
The pet food product category in which we participate is highly competitive. If we are unable to compete effectively, our results of operations could be adversely affected.
The pet food product category in which we participate is highly competitive. There are numerous brands and products that compete for shelf space and sales, with competition based primarily upon brand recognition and loyalty, product
14
packaging, quality and innovation, taste, nutrition, breadth of product line, price and convenience. We compete with a significant number of companies of varying sizes, including divisions or subsidiaries of larger companies. We face strong competition from competitors’ products that are sometimes sold at lower prices. Price gaps between our products and our competitors’ products may result in market share erosion and harm our business. A number of our competitors have broader product lines, substantially greater financial and other resources and/or lower fixed costs than we have. Our competitors may succeed in developing new or enhanced products, including fresh, refrigerated pet food, that are more attractive to customers or consumers than our products. These competitors may also prove to be more successful in marketing and selling their products or may be better able to increase prices to reflect cost pressures. We may not compete successfully with these other companies or maintain or grow the distribution of our products. We cannot predict the pricing or promotional activities of our competitors or whether they will have a negative effect on us. Many of our competitors engage in aggressive pricing and promotional activities. There are competitive pressures and other factors which could cause our products to lose market share or decline in sales or result in significant price or margin erosion, which would have a material adverse effect on our business, financial condition and results of operations.
If the operating capacity or reputation of our Freshpet Fridges is harmed, our business, financial condition and results of operations may suffer.
Our success depends on our network of company-owned branded refrigerators, known as Freshpet Fridges. If the operating capacity of our Freshpet Fridges is harmed by external factors, such as adverse weather or energy supply, or internal factors, such as faulty manufacturing or insufficient maintenance, our products contained in those fridges may be damaged and need to be discarded. In addition, if our Freshpet Fridges fail to operate as intended, for any reason, the reputation of our Freshpet Fridges with customers and the reputation of our brand with consumers may decline. In such event, customers may choose to discontinue, or not to expand, their use of Freshpet Fridges and our products and consumers may choose to forgo purchasing our products. Additionally, growing concern about the environmental impact of refrigerators could likewise harm the reputation of our Freshpet Fridges with customers and our brand with consumers. Any such harm to the operating capacity or reputation of our Freshpet Fridges could adversely affect our business, financial condition and results of operations.
If we are not successful in protecting our intellectual property rights, our business, financial conditions and results of operations may be harmed.
We rely on trademark, copyright, trade secret, patent and other intellectual property laws, as well as nondisclosure and confidentiality agreements and other methods, to protect our intellectual property rights as well as the intellectual property of third parties with respect to which we are subject to non-use and non-disclosure obligations. We may need to engage in litigation or similar activities to enforce our intellectual property rights, to protect our trade secrets or to determine the validity and scope of proprietary rights of others. Any such litigation could require us to expend significant resources and divert the efforts and attention of our management and other personnel from our business operations. The steps we take to prevent misappropriation, infringement or other violation of our intellectual property or the intellectual property of others may not be successful. In addition, effective patent, copyright, trademark and trade secret protection may be unavailable or limited for some of our trademarks and patents in some foreign countries. Failure to protect our intellectual property could harm our business, financial condition and results of operations.
Our brand names and trademarks are important to our business, and we have registered or applied to register many of these trademarks. We cannot assure you that our trademark applications will be approved. Third parties may also oppose our trademark applications, or otherwise challenge our use of the trademarks. In the event that our trademarks are successfully challenged, we could be forced to rebrand our products, which could result in the loss of brand recognition and could require us to devote resources to advertising and marketing new brands. Further, we cannot assure you that competitors will not infringe our trademarks, or that we will have adequate resources to enforce our trademarks.
We rely on unpatented proprietary know-how in the areas of recipes, ingredients sourcing, cooking techniques, packaging, transportation and delivery. It is possible that others will independently develop the same or similar know-how or otherwise obtain access to our proprietary know-how. To protect our trade secrets and other proprietary know-how, we require employees, consultants, advisors and collaborators to enter into confidentiality agreements. We cannot assure you that these agreements will provide meaningful protection in the event of any unauthorized use, misappropriation or disclosure of our trade secrets, know-how or other proprietary information. If we are unable to maintain the proprietary nature of our recipes, methods and other know-how, we could be materially adversely affected.
We may not be able to successfully implement initiatives to improve productivity and streamline operations to control or reduce costs. Failure to implement such initiatives could adversely affect our results of operations.
15
Because our ability to effectively implement price increases for our products can be affected by factors outside of our control, our profitability and growth depend significantly on our efforts to control our operating costs. Because many of our costs, such as energy and logistics costs, packaging costs and ingredient, commodity and raw product costs, are affected by factors outside or substantially outside our control, we generally must seek to control or reduce costs through operating efficiency or other initiatives. If we are not able to identify and complete initiatives designed to control or reduce costs and increase operating efficiency on time or within budget, our results of operations could be adversely impacted. In addition, if the cost savings initiatives we have implemented to date, or any future cost-savings initiatives, do not generate expected cost savings, our business, financial condition and results of operations could be adversely affected.
The inputs, commodities and ingredients that we require are subject to price increases and shortages that could adversely affect our results of operations.
The primary inputs, commodities and ingredients that we use include meat, vegetables, fruits, carrageenans, whole grains, vitamins, minerals, packaging and energy (including wind power). Prices for these and other items we use may be volatile, and we may experience shortages in these items due to factors beyond our control, such as commodity market fluctuations, availability of supply, increased demand (whether for the item we require or for other items, which in turn impacts the item we require), weather conditions, natural disasters, currency fluctuations, governmental regulations (including import restrictions), agricultural programs or issues, energy programs, labor strikes and the financial health of our suppliers. Input, commodity and ingredient price increases or shortages may result in higher costs or interrupt our production schedules, each of which could have a material adverse effect on our results of operations. Production delays could lead to reduced sales volumes and profitability, as well as loss of market share. Higher costs could adversely impact our earnings. For example, fuel prices affect our transportation costs for both ingredients and finished product. If we are not able to implement our productivity initiatives or increase our product prices to offset price increases of our inputs, commodities and ingredients, as a result of consumer sensitivity to pricing or otherwise, or if sales volumes decline due to price increases, our results of operations could be adversely affected. Our competitors may be better able than we are to implement productivity initiatives or effect price increases or to otherwise pass along cost increases to their customers. Moreover, if we increase our prices in response to increased costs, we may need to increase marketing spending, including trade promotion spending, in order to retain our market share. Such increased marketing spending may significantly offset the benefits, if any, of any price increase and negatively impact our business, financial condition and results of operations.
If the ingredients we use in our products are contaminated, alleged to be contaminated or are otherwise rumored to have adverse effects, our results of operations could be adversely affected.
We buy our ingredients from third-party suppliers. If these materials are alleged or prove to include contaminants that affect the safety or quality of our products or are otherwise rumored to have adverse effects, for any reason, we may need to find alternate ingredients for our products, delay production of our products, or discard or otherwise dispose of our products, which could adversely affect our results of operations. Additionally, if this occurs after the affected product has been distributed, we may need to withdraw or recall the affected product and we may experience adverse publicity or product liability claims. In either case, our business, financial condition and results of operations could be adversely affected.
Restrictions imposed in reaction to outbreaks of animal diseases could have a material adverse effect on our business, financial condition and results of operations.
The cost of the protein-based ingredients we use in our products has been adversely impacted in the past by the publicity surrounding animal diseases, such as bovine spongiform encephalopathy, or “mad cow disease.” As a result of extensive global publicity and trade restrictions imposed to provide safeguards against mad cow disease, the cost of alternative sources of the protein-based ingredients we use in our products has from time to time increased significantly and may increase again in the future if additional cases of mad cow disease are found.
If mad cow disease or other animal diseases, such as foot-and-mouth disease or highly pathogenic avian influenza, also known as “bird flu,” impacts the availability of the protein-based ingredients we use in our products, we may be required to locate alternative sources for protein-based ingredients. Those sources may not be available to sustain our sales volumes, may be more costly and may affect the quality and nutritional value of our products. If outbreaks of mad cow disease, foot-and-mouth disease, bird flu or any other animal disease or the regulation or publicity resulting therefrom impacts the cost of the protein-based ingredients we use in our products, or the cost of the alternative protein-based ingredients necessary for our products as compared to our current costs, we may be required to increase the selling price of our products to avoid margin deterioration. However, we may not be able to charge higher prices for our products without negatively impacting future sales volumes.
16
We rely on co-packers to provide our supply of treat products. Any failure by co-packers to fulfill their obligations or any termination or renegotiation of our co-packing agreements could adversely affect our results of operations.
We have supply agreements with co-packers that require them to provide us with specific finished products. We rely on co-packers as our sole-source for treat products. We also anticipate that we will rely on sole suppliers for future products. The failure for any reason of a co-packer to fulfill its obligations under the applicable agreements with us or the termination or renegotiation of any such co-packing agreement could result in disruptions to our supply of finished goods and have an adverse effect on our results of operations. Additionally, from time to time, a co-packer may experience financial difficulties, bankruptcy or other business disruptions, which could disrupt our supply of finished goods or require that we incur additional expense by providing financial accommodations to the co-packer or taking other steps to seek to minimize or avoid supply disruption, such as establishing a new co-packing arrangement with another provider. During an economic downturn, our co-packers may be more susceptible to experiencing such financial difficulties, bankruptcies or other business disruptions. A new co-packing arrangement may not be available on terms as favorable to us as the existing co-packing arrangement, if at all.
If we do not manage our supply chain effectively, including inventory levels, our business, financial condition and results of operation may be adversely affected.
The inability of any supplier, co-packer, third-party distributor or transportation provider to deliver or perform for us in a timely or cost-effective manner could cause our operating costs to increase and our profit margins to decrease. We must continuously monitor our inventory and product mix against forecasted demand or risk having inadequate supplies to meet consumer demand, as well as having too much inventory on hand that may reach its expiration date and become unsaleable. Changes in the availability and cost of freight may affect our supply chain and ultimately the pricing and availability of our products. If we are unable to manage our supply chain effectively and ensure that our products are available to meet consumer demand, our operating costs could increase and our profit margins could decrease.
Failure by our transportation providers to deliver our products on time or at all could result in lost sales.
We use third-party transportation providers for our product shipments. We rely on one such provider for almost all of our shipments. Transportation services include scheduling and coordinating transportation of finished products to our customers, shipment tracking and freight dispatch services. Our use of transportation services for shipments is subject to risks, including increases in fuel prices, which would increase our shipping costs, and employee strikes and inclement weather, which may impact the ability of providers to provide delivery services that adequately meet our shipping needs, including keeping our products adequately refrigerated during shipment. Any such change could cause us to incur costs and expend resources. Moreover, in the future we may not be able to obtain terms as favorable as those we receive from the third-party transportation providers that we currently use, which in turn would increase our costs and thereby adversely affect our business, financial condition and results of operations.
If we are unable to maintain or increase prices for our products, our results of operations may be adversely affected.
We rely in part on price increases to neutralize cost increases and improve the profitability of our business. Our ability to effectively implement price increases or otherwise raise prices for our products can be affected by a number of factors, including competition, our competitors’ pricing and marketing, aggregate industry supply, category limitations, market demand and economic conditions, including inflationary pressures. During challenging economic times, our ability to increase the prices of our products may be particularly constrained. Additionally, customers may pressure us to rescind price increases that we have announced or already implemented (either through a change in list price or increased promotional activity). If we are unable to maintain or increase prices for our products (or must increase promotional activity), our results of operations could be adversely affected. Furthermore, price increases generally result in volume losses, as consumers purchase fewer units. If such losses (also referred to as the elasticity impact) are greater than expected or if we lose distribution due to a price increase (which may result from a customer response or otherwise), our business, financial condition and results of operations could be adversely affected.
We may face difficulties as we expand into countries in which we have no prior operating experience.
In recent years, we have expanded our global footprint by entering into new markets and may expand into additional markets in the future. For example, we currently do business with three retailers in the United Kingdom, where our products are selling in 374 stores. As we expand our business into new countries, we may encounter regulatory, personnel, technological and other difficulties that increase our expenses or delay our ability to become profitable in such countries. This may have an adverse effect on our business. These risks include:
17
|
|
• |
fluctuations in currency exchange rates; |
|
|
• |
the difficulty of enforcing agreements and collecting receivables through some foreign legal systems; |
|
|
• |
customers in some foreign countries potentially having longer payment cycles; |
|
|
• |
changes in local tax laws, tax rates in some countries that may exceed those of the United States or Canada and lower earnings due to withholding requirements or the imposition of tariffs, exchange controls or other restrictions; |
|
|
• |
seasonal reductions in business activity; |
|
|
• |
port conditions and the pricing of freight transport; |
|
|
• |
the credit risk of local customers and distributors; |
|
|
• |
general economic and political conditions; |
|
|
• |
modifications to international trade agreements; |
|
|
• |
unexpected changes in legal, regulatory or tax requirements; |
|
|
• |
unexpected changes in import and export regulations, processes and procedures; |
|
|
• |
differences in culture and trends in foreign countries with respect to pets and pet care; |
|
|
• |
the difficulties associated with managing a large global organization; |
|
|
• |
the risk that certain governments may adopt regulations or take other actions that would have a direct or indirect adverse impact on our business and market opportunities, including nationalization of private enterprise; |
|
|
• |
non-compliance with applicable currency exchange control regulations, transfer pricing regulations or other similar regulations; |
|
|
• |
violations of the Foreign Corrupt Practices Act or comparable local anticorruption laws by acts of agents and other |
|
|
• |
intermediaries whom we have limited or no ability to control; and |
|
|
• |
violations of regulations enforced by the U.S. Department of The Treasury’s Office of Foreign Asset Control. |
In addition, our expansion into new countries may require significant resources and the efforts and attention of our management and other personnel, which will divert resources from our existing business operations. As we expand our business globally, our success will depend, in large part, on our ability to anticipate and effectively manage these and other risks associated with our operations outside of the United States and Canada.
If we are unable to attract, train and retain employees, we may not be able to grow or successfully operate our business.
Our success depends in part upon our ability to attract, train and retain a sufficient number of employees who understand and appreciate our culture and are able to represent our brand effectively and establish credibility with our business partners and consumers. If we are unable to hire and retain employees capable of meeting our business needs and expectations, our business and brand image may be impaired. Any failure to meet our staffing needs or any material increase in turnover rates of our employees may adversely affect our business, financial condition and results of operations.
Unionization activities or labor disputes may disrupt our operations and affect our profitability.
Although none of our employees are currently covered under collective bargaining agreements, our employees may elect to be represented by labor unions in the future. If a significant number of our employees were to become unionized and collective bargaining agreement terms were significantly different from our current compensation arrangements, it could adversely affect our business, financial condition and results of operations. In addition, a labor dispute involving some or all of our employees may harm our reputation, disrupt our operations and reduce our revenues, and resolution of disputes may increase our costs.
18
As an employer, we may be subject to various employment-related claims, such as individual or class actions or government enforcement actions relating to alleged employment discrimination, employee classification and related withholding, wage-hour, labor standards or healthcare and benefit issues. Such actions, if successful in whole or in part, may affect our ability to compete or could materially adversely affect our business, financial condition and results of operations.
Disruptions in the worldwide economy may adversely affect our business, results of operations and financial condition.
Adverse and uncertain economic conditions may impact distributor, customer and consumer demand for our products. In addition, our ability to manage normal commercial relationships with our suppliers, contract manufacturers, distributors, customers, consumers and creditors may suffer. Consumers have access to lower-priced offerings and, during economic downturns, may shift purchases to these lower-priced or other perceived value offerings. Customers may become more conservative in response to these conditions and seek to reduce their inventories. For example, during the economic downturn from 2007 through 2009, customers significantly reduced their inventories. Our results of operations depend upon, among other things, our ability to maintain and increase sales volume with our existing customers, to attract new consumers and to provide products that appeal to consumers at prices they are willing and able to pay. Prolonged unfavorable economic conditions may have an adverse effect on our sales and profitability.
We are subject to environmental regulation and environmental risks, which may adversely affect our business. Climate change or concerns regarding climate change may increase environmental regulation and environmental risks.
As a result of our agricultural and food processing operations, we are subject to numerous environmental laws and regulations. Many of these laws and regulations are becoming increasingly stringent and compliance with them is becoming increasingly expensive. Changes in environmental conditions may result in existing legislation having a greater impact on us. Additionally, we may be subject to new legislation and regulation in the future. For example, increasing concern about climate change may result in additional federal and state legal and regulatory requirements to reduce or mitigate the effects of green-house gas emissions. Compliance with environmental legislation and regulations, particularly if they are more aggressive than our current sustainability measures used to monitor our emissions and improve our energy efficiency, may increase our costs and adversely affect our results of operations. We cannot predict the extent to which any environmental law or regulation that may be enacted or enforced in the future may affect our operations. The effect of these actions and future actions on the availability and use of pesticides could adversely impact our financial position or results of operations. If the cost of compliance with applicable environmental laws or regulations increases, our business, financial condition and results of operations could be negatively impacted.
Intellectual property infringement or violation claims may adversely impact our results of operations.
We may be subject to claims by others that we infringe on their intellectual property or otherwise violate their intellectual property rights. To the extent we develop, introduce and acquire products, the risk of such claims may be exacerbated. Any such claims, even those without merit, could (i) require us to expend significant resources, (ii) cause us to cease making or using products that incorporate the challenged intellectual property, (iii) require us to redesign, reengineer or rebrand our products or packaging, including our Freshpet Fridges, (iv) divert management’s attention and resources or (v) require us to enter into royalty or licensing agreements in order to obtain the right to use a third-party’s intellectual property, which may not be available to us on acceptable terms or at all. Any of such events may adversely impact our business, financial condition and results of operations.
Our business operations could be disrupted if our information technology systems fail to perform adequately.
The efficient operation of our business depends on our information technology systems, some of which are managed by third-party service providers. We rely on our information technology systems to effectively manage our business data, communications, supply chain, order entry and fulfillment, and other business processes. The failure of our information technology systems to perform as we anticipate could disrupt our business and could result in transaction errors, processing inefficiencies, and the loss of sales and customers, causing our business and results of operations to suffer. In addition, our information technology systems may be vulnerable to damage or interruption from circumstances beyond our control, including fire, natural disasters, power outages, systems failures, security breaches, cyber-attacks and viruses. Any such damage or interruption could have a material adverse effect on our business, financial condition and results of operations.
19
We are subject to cyber security risks and may incur increasing costs in an effort to minimize those risks.
Our business employs systems and websites that allow for the secure storage and transmission of proprietary or confidential information regarding our customers, employees, suppliers and others, including personal identification information. Security breaches could expose us to a risk of loss or misuse of this information, litigation, and potential liability. We may not have the resources or technical sophistication to anticipate or prevent rapidly-evolving types of cyber-attacks. Attacks may be targeted at us, our customers and suppliers, or others who have entrusted us with information. Actual or anticipated attacks may cause us to incur increasing costs, including costs to deploy additional personnel and protection technologies, train employees, and engage third-party experts and consultants. Advances in computer capabilities, new technological discoveries or other developments may result in the technology used by us to protect transaction or other data being breached or compromised. In addition, data and security breaches can also occur as a result of non-technical issues, including breach by us or by persons with whom we have commercial relationships that result in the unauthorized release of personal or confidential information. Any compromise or breach of our security could result in a violation of applicable privacy and other laws, significant legal and financial exposure, and a loss of confidence in our security measures, which could have an adverse effect on our business, financial condition and results of operations.
We may be unable to use some or all of our net operating loss carryforwards, which could adversely affect our financial results.
As of December 31, 2019, we had federal net operating loss (“NOLs”) carryforwards of approximately $198.1 million and state NOLs of approximately $160.0 million that we may use to offset against taxable income for U.S. federal and state income tax purposes, respectively. In general, a corporation that undergoes an ‘‘ownership change’’ is subject to limitations on its ability to utilize its “pre-ownership change” NOLs to offset future taxable income. In general, under the U.S. Internal Revenue Code of 1986, as amended (the “Code”), an ownership change occurs if the aggregate stock ownership of certain stockholders (generally 5% stockholders, applying certain look-through and aggregation rules) increases by more than 50 percentage points over such stockholders’ lowest percentage ownership during the testing period (generally three years). Purchases or sales of our common stock in amounts greater than specified levels, which are generally beyond our control, could create a limitation on our ability to utilize our NOLs for tax purposes in the future. Limitations imposed on our ability to utilize NOLs could cause U.S. federal and state income taxes to be paid earlier than would be paid if such limitations were not in effect. In addition, under the tax reform bill commonly known as the Tax Cuts and Jobs Act, (i) the amount of NOLs generated in taxable years beginning after December 31, 2017 that we are permitted to deduct in any taxable year is limited to 80% of our taxable income in such year, and (ii) NOLs generated in taxable years beginning after December 31, 2017 cannot be carried back to prior taxable years. Furthermore, we may not be able to generate sufficient taxable income to utilize our NOLs before they expire. If any of these events occur, we may not derive some or all of the expected benefits from our NOLs. In addition, NOLs incurred in one state may not be available to offset income earned in a different state. Furthermore, there may be periods during which the use of NOLs is suspended or otherwise limited for state tax purposes, which could accelerate or permanently increase state taxes owed.
Failure to maintain effective internal controls in accordance with Section 404 of the Sarbanes-Oxley Act could have a material adverse effect on our business and stock price.
As a publicly traded company, we are required to comply with the SEC’s rules implementing Section 302 and 404 of the Sarbanes-Oxley Act of 2002, which require management to certify financial and other information in our quarterly and annual reports and provide an annual management report on the effectiveness of controls over financial reporting. If we identify weaknesses in our internal control over financial reporting, are unable to comply with the requirements of Section 404 in a timely manner or to assert that our internal control over financial reporting is effective, or if our independent registered public accounting firm is unable to express an opinion as to the effectiveness of our internal control over financial reporting, investors may lose confidence in the accuracy and completeness of our financial reports and the market price of our common stock could be negatively affected, and we could become subject to investigations by NASDAQ, the SEC or other regulatory authorities, which could require additional financial and management resources.
Risks Related to Ownership of Our Common Stock
Our quarterly operating results may fluctuate significantly and could fall below the expectations of securities analysts and investors due to seasonality and other factors, some of which are beyond our control, resulting in a decline in our stock price.
Our quarterly operating results may fluctuate significantly because of several factors, including:
|
|
• |
the timing of installation of new Freshpet Fridges and related expenses; |
20
|
|
• |
profitability of our Freshpet Fridges, especially in new markets; |
|
|
• |
changes in interest rates; |
|
|
• |
impairment of long-lived assets; |
|
|
• |
macroeconomic conditions, both nationally and locally; |
|
|
• |
negative publicity relating to the consumption of products we serve; |
|
|
• |
changes in consumer preferences and competitive conditions; |
|
|
• |
expansion to new markets; |
|
|
• |
increases in infrastructure costs; |
|
|
• |
fluctuations in commodity prices; and |
|
|
• |
timing of media spending. |
As a result of these factors, our quarterly and annual operating results may fluctuate significantly. Accordingly, results for any one quarter are not necessarily indicative of results to be expected for any other quarter or for any year for any particular future period may decrease. In the future, operating results may fall below the expectations of securities analysts and investors. In that event, the price of our common stock would likely decrease.
The price of our common stock has been and may continue to be volatile and you may lose all or part of your investment.
The trading price of our common stock has been, and may continue to be, volatile, and you may not be able to resell your shares at or above the purchase price. Such volatility could be based on various factors in addition to those otherwise described in this report, including those described under “Risks Related to Our Business and Industry” and the following:
|
|
• |
our operating performance and the performance of our competitors or pet food companies in general; |
|
|
• |
the public’s reaction to our press releases, our other public announcements and our filings with the SEC; |
|
|
• |
changes in earnings estimates or recommendations by research analysts who follow us or other companies in our industry; |
|
|
• |
global, national or local economic, legal and regulatory factors unrelated to our performance; |
|
|
• |
the number of our shares publicly traded; |
|
|
• |
future sales of our common stock, including by our officers, directors and significant stockholders; |
|
|
• |
the arrival or departure of key personnel; and |
|
|
• |
other developments affecting us, our industry or our competitors. |
In addition, in recent years the stock market has experienced significant price and volume fluctuations. These fluctuations may be unrelated to the operating performance of particular companies. These broad market fluctuations may cause declines in the market price of our common stock. The price of our common stock could fluctuate based upon factors that have little or nothing to do with our business, financial condition and results of operations, and those fluctuations could materially reduce our common stock price.
As we operate in a single industry, we are especially vulnerable to these factors to the extent that they affect our industry or our products. In the past, securities class action litigation has often been initiated against companies following periods of volatility in their stock price and we are currently defending against the claims made in Curran v. Freshpet, Inc. et al and Meldon v. Freshpet, Inc. et al. This type of litigation could result in substantial costs and divert our management’s attention and resources and could also require us to make substantial payments to satisfy judgments or to settle litigation.
Future sales of our common stock, or the perception that such sales may occur, could depress our common stock price.
As of December 31, 2019, we had 36,148,264 shares of common stock outstanding, and our Certificate of Incorporation authorizes us to issue up to 200 million shares of common stock.
21
In the future, we may issue additional shares of common stock or other securities if we need to raise additional capital. The number of new shares of our common stock issued in connection with raising additional capital could constitute a material portion of the then outstanding shares of our common stock. Any future sales of our common stock, or the perception that such sales may occur, could negatively impact the price of our common stock.
If securities or industry analysts do not publish research or publish inaccurate or unfavorable research about our business, our stock price and trading volume could decline.
The trading market for our common stock depends in part on the research and reports that securities or industry analysts publish about us or our business. If one or more of the analysts who cover us downgrades our common stock or publishes inaccurate or unfavorable research about our business, our stock price would likely decline. If one or more of these analysts ceases coverage of us or fails to publish reports on us regularly, demand for our common stock could decrease, which could cause our stock prices and trading volume to decline.
We have no current plans to pay dividends for the foreseeable future.
We intend to retain future earnings, if any, for future operations, expansion and debt repayment and have no current plans to pay any cash dividends for the foreseeable future. Any future determination to declare and pay cash dividends will be at the discretion of our Board of Directors and will depend on, among other things, our financial condition, results of operations, cash requirements, contractual restrictions and such other factors as our Board of Directors deems relevant. Our ability to pay dividends may also be limited by covenants of any future outstanding indebtedness we or our subsidiaries incur. As a result, you may not receive any return on an investment in our common stock unless you sell our common stock for a price greater than that which you paid for it.
Provisions in our charter documents and Delaware law may delay or prevent our acquisition by a third-party, even if the acquisition would be beneficial to our stockholders, and could make it more difficult for you to change our management.
Our Certificate of Incorporation and Bylaws and Delaware law contain several provisions that may make it more difficult for a third-party to acquire control of us without the approval of our Board of Directors. For example, we have a classified Board of Directors with three-year staggered terms, which could delay the ability of stockholders to change membership of a majority of our Board of Directors. These provisions may make it more difficult or expensive for a third-party to acquire a majority of our outstanding equity interests. These provisions also may delay, prevent or deter a merger, acquisition, tender offer, proxy contest or other transaction that might otherwise result in our stockholders receiving a premium over the market price for their common stock.
Claims for indemnification by our directors and officers may reduce our available funds to satisfy successful third-party claims against us and may reduce the amount of money available to us.
Our Certificate of Incorporation and Bylaws provide that we will indemnify our directors and officers, in each case, to the fullest extent permitted by Delaware law. In addition, we have entered and expect to continue to enter into agreements to indemnify our directors, executive officers and other employees as determined by our Board of Directors. Under the terms of such indemnification agreements, we are required to indemnify each of our directors and officers, to the fullest extent permitted by the laws of the state of Delaware, if the basis of the indemnitee’s involvement was by reason of the fact that the indemnitee is or was a director or officer of the Company or any of its subsidiaries or was serving at the Company’s request in an official capacity for another entity. We must indemnify our officers and directors against all reasonable fees, expenses, charges and other costs of any type or nature whatsoever, including any and all expenses and obligations paid or incurred in connection with investigating, defending, being a witness in, participating in (including on appeal), or preparing to defend, be a witness or participate in any completed, actual, pending or threatened action, suit, claim or proceeding, whether civil, criminal, administrative or investigative, or establishing or enforcing a right to indemnification under the indemnification agreement. The indemnification agreements also require us, if so requested, to advance within 30 days of such request all reasonable fees, expenses, charges and other costs that such director or officer incurred, provided that such person will return any such advance if it is ultimately determined that such person is not entitled to indemnification by us. Any claims for indemnification by our directors and officers may reduce our available funds to satisfy successful third-party claims against us and may reduce the amount of money available to us.
22
Future offerings of debt securities, which would rank senior to our common stock upon our bankruptcy or liquidation, and future offerings of equity securities that may be senior to our common stock for the purposes of dividend and liquidating distributions, may adversely affect the market price of our common stock.
In the future, we may attempt to increase our capital resources by making offerings of debt securities or additional offerings of equity securities. Upon bankruptcy or liquidation, holders of our debt securities and shares of preferred stock and lenders with respect to other borrowings will receive a distribution of our available assets prior to the holders of our common stock. Additional equity offerings may dilute the holdings of our existing stockholders or reduce the market price of our common stock, or both, and may result in future Section 382 limitations that could reduce the rate at which we utilize our NOL carryforwards. Preferred stock, if issued, could have a preference on liquidating distributions or a preference on dividend payments or both that could limit our ability to make a dividend distribution to the holders of our common stock. Our decision to issue securities in any future offering will depend on market conditions and other factors beyond our control. As a result, we cannot predict or estimate the amount, timing or nature of our future offerings, and purchasers of our common stock in this offering bear the risk of our future offerings reducing the market price of our common stock and diluting their ownership interest in our company.
ITEM 1B. UNRESOLVED STAFF COMMENTS
None.
ITEM 2. PROPERTIES
Our corporate headquarters, located in Secaucus, New Jersey and consisting of approximately 24,000 square feet of office space, is subject to a lease agreement that expires on June 30, 2024.
We own the Freshpet Kitchens, our approximately 100,000 square foot manufacturing facility in Bethlehem, Pennsylvania. We believe that our properties have been adequately maintained, are in good condition generally and are suitable and adequate for its business as presently conducted.
Due to the continued growth of the Company’s fresh pet food sales, the Company is expanding its manufacturing capacity. The expansion includes the renovation of an existing 50,000 square foot building and a 90,000 square-foot addition. The $105 million strategic capital investment is expected to support Freshpet’s growth in the United States, Canada and Europe by creating total capacity for approximately $590 million in net sales from the facility. The facility “Freshpet Kitchens 2.0” will make greater use of automation to improve quality, safety and reduce costs. Production start-up is slated for the second half of 2020.
We expect to make future capital expenditures of approximately $300 million in connection with the development of our Freshpet Kitchens 3.0. We expect to fund such capital expenditures with cash from operations, borrowings under credit facilities and possible debt and/or equity raises.
ITEM 3. LEGAL PROCEEDINGS
We are party to litigation proceedings. While the results of such litigation proceedings cannot be predicted with certainty, management believes that the final outcome will not have a material adverse effect on our financial condition, results of operations or cash flows. See also “Item 1A. Risk Factors” and Note 8 to our Consolidated Financial Statements for a discussion of certain legal proceedings involving the Company.
ITEM 4. MINE SAFETY DISCLOSURES
Not applicable
PART II
ITEM 5. Market for registrant’s common equity, related stockholder matters and issueR purchases of equity secuRIties
Market Information
Shares of our common stock are publicly traded on the Nasdaq Global Market under the symbol "FRPT".
23
The number of stockholders of record of our common stock as of February 20, 2020 was 236. This number excludes stockholders whose stock is held in nominee or street name by brokers.
Dividend Policy
Since we became a publicly traded company in 2014, we have not declared or paid, and do not anticipate declaring or paying in the foreseeable future, any cash dividends on our capital stock. Any future determination to declare and pay cash dividends will be at the discretion of our Board of Directors in accordance with applicable laws and will depend on, among other things, our financial condition, results of operations, cash requirements, contractual restrictions and such other factors as our Board of Directors deems relevant. Our ability to pay dividends may also be limited by covenants of any future outstanding indebtedness we or our subsidiaries incur.
Issuer Purchases of Equity Securities
None.
Stock Performance Graph
This performance graph shall not be deemed “soliciting material” or to be “filed” with the SEC for purposes of Section 18 of the Exchange Act or otherwise subject to the liabilities under that Section, and shall not be deemed to be incorporated by reference into any filing of Freshpet, Inc. under the Securities Act of 1933, as amended (the “Securities Act”), or the Exchange Act.
The following graph compares our total common stock return with the total return for (i) the NASDAQ Composite Index (the “NASDAQ Composite”) and (ii) the Russell 3000 Index (the “Russell 3000”) for the five year period ended December 31, 2019. The graph assumes that $100 was invested on December 31, 2014 in each of our common stock, the NASDAQ Composite and the Russell 3000. The comparisons in the table are required by the SEC and are not intended to forecast or be indicative of possible future performance of our common stock.
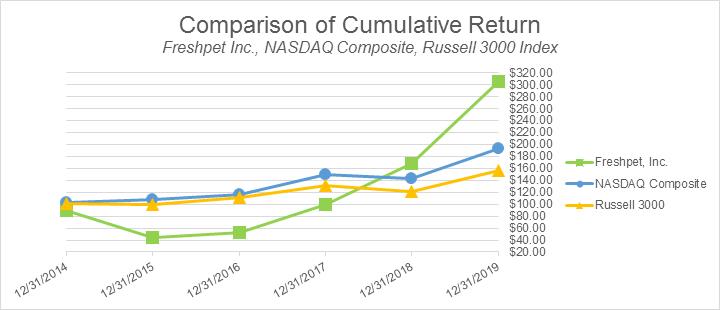
|
Date |
|
Freshpet, Inc. |
|
|
NASDAQ Composite |
|
|
Russell 3000 |
|
|||
|
31-Dec-15 |
|
$ |
44.43 |
|
|
$ |
108.09 |
|
|
$ |
99.96 |
|
|
31-Dec-16 |
|
$ |
53.11 |
|
|
$ |
116.20 |
|
|
$ |
110.37 |
|
|
31-Dec-17 |
|
$ |
99.16 |
|
|
$ |
149.02 |
|
|
$ |
131.17 |
|
|
31-Dec-18 |
|
$ |
168.29 |
|
|
$ |
143.23 |
|
|
$ |
122.00 |
|
|
31-Dec-19 |
|
$ |
304.50 |
|
|
$ |
193.11 |
|
|
$ |
156.36 |
|
24
ITEM 6. SELECTED FINANCIAL DATA
The following selected consolidated financial data should be read together with our consolidated financial statements and accompanying notes and “Management’s Discussion and Analysis of Financial Condition and Results of Operations” appearing elsewhere in this report. The selected consolidated financial data in this section is not intended to replace our consolidated financial statements and the accompanying notes. Our historical results are not necessarily indicative of our future results.
We derived the consolidated statements of operations data for the fiscal years ended December 31, 2019, 2018 and 2017 and the consolidated balance sheets data as of December 31, 2019 and 2018 from our audited consolidated financial statements appearing elsewhere in this report. The consolidated statement of operations data for the years ended December 31, 2016 and 2015 and the consolidated balance sheet data as of December 31, 2017, 2016 and 2015 have been derived from our audited consolidated financial statements, which are not included in this report.
|
|
|
Year Ended December 31, |
|
|||||||||||||||||
|
|
|
2019 |
|
|
2018 |
|
|
2017 |
|
|
2016 |
|
|
2015 |
|
|||||
|
Consolidated Statement of Operations Data |
|
(Dollars in thousands except share and per share data) |
|
|||||||||||||||||
|
Net sales |
|
$ |
245,862 |
|
|
$ |
193,237 |
|
|
$ |
152,359 |
|
|
$ |
129,707 |
|
|
$ |
113,505 |
|
|
Cost of goods sold |
|
|
131,665 |
|
|
|
103,247 |
|
|
|
79,943 |
|
|
|
69,336 |
|
|
|
58,856 |
|
|
Gross profit |
|
|
114,197 |
|
|
|
89,990 |
|
|
|
72,416 |
|
|
|
60,371 |
|
|
|
54,649 |
|
|
Selling, general and administrative expenses |
|
|
114,450 |
|
|
|
94,876 |
|
|
|
75,167 |
|
|
|
62,586 |
|
|
|
58,297 |
|
|
Loss from operations |
|
|
(253 |
) |
|
|
(4,886 |
) |
|
|
(2,751 |
) |
|
|
(2,215 |
) |
|
|
(3,648 |
) |
|
Other income (expenses), net |
|
|
5 |
|
|
|
(102 |
) |
|
|
(525 |
) |
|
|
(182 |
) |
|
|
449 |
|
|
Interest expense |
|
|
(991 |
) |
|
|
(296 |
) |
|
|
(910 |
) |
|
|
(698 |
) |
|
|
(455 |
) |
|
Loss before income taxes |
|
|
(1,239 |
) |
|
|
(5,284 |
) |
|
|
(4,187 |
) |
|
|
(3,095 |
) |
|
|
(3,653 |
) |
|
Income tax expense |
|
|
144 |
|
|
|
77 |
|
|
|
75 |
|
|
|
66 |
|
|
|
58 |
|
|
Net loss attributable to common stockholders |
|
$ |
(1,383 |
) |
|
$ |
(5,361 |
) |
|
$ |
(4,262 |
) |
|
$ |
(3,161 |
) |
|
$ |
(3,711 |
) |
|
Net loss per share |
|
|
|
|
|
|
|
|
|
|
|
|
|
|
|
|
|
|
|
|
|
Basic |
|
$ |
(0.04 |
) |
|
$ |
(0.15 |
) |
|
$ |
(0.12 |
) |
|
$ |
(0.09 |
) |
|
$ |
(0.11 |
) |
|
Diluted |
|
$ |
(0.04 |
) |
|
$ |
(0.15 |
) |
|
$ |
(0.12 |
) |
|
$ |
(0.09 |
) |
|
$ |
(0.11 |
) |
|
Weighted Average shares of common stock outstanding |
|
|
|
|
|
|
|
|
|
|
|
|
|
|
|
|
|
|
|
|
|
Basic |
|
|
35,950,117 |
|
|
|
35,329,170 |
|
|
|
34,487,239 |
|
|
|
33,674,416 |
|
|
|
33,497,940 |
|
|
Diluted |
|
|
35,950,117 |
|
|
|
35,329,170 |
|
|
|
34,487,239 |
|
|
|
33,674,416 |
|
|
|
33,497,940 |
|
25
|
|
|
Year Ended December 31, |
|
|||||||||||||||||
|
|
|
2019 |
|
|
2018 |
|
|
2017 |
|
|
2016 |
|
|
2015 |
|
|||||
|
Other Financial Data |
|
(Dollars in thousands) |
|
|||||||||||||||||
|
Freshpet Fridge store locations at period end |
|
|
|
|
|
|
|
|
|
|
|
|
|
|
|
|
|
|
|
|
|
Grocery and Online |
|
|
11,315 |
|
|
|
10,129 |
|
|
|
9,056 |
|
|
|
7,953 |
|
|
|
6,887 |
|
|
Pet |
|
|
4,837 |
|
|
|
4,164 |
|
|
|
4,630 |
|
|
|
4,530 |
|
|
|
4,294 |
|
|
Mass and Club |
|
|
4,963 |
|
|
|
4,783 |
|
|
|
3,930 |
|
|
|
3,814 |
|
|
|
3,555 |
|
|
Natural |
|
|
455 |
|
|
|
423 |
|
|
|
388 |
|
|
|
312 |
|
|
|
279 |
|
|
Total Freshpet Fridge store locations at period end |
|
|
21,570 |
|
|
|
19,499 |
|
|
|
18,004 |
|
|
|
16,609 |
|
|
|
15,015 |
|
|
EBITDA (1) |
|
$ |
15,673 |
|
|
$ |
9,080 |
|
|
$ |
9,414 |
|
|
$ |
7,490 |
|
|
$ |
4,376 |
|
|
Adjusted EBITDA (1) |
|
|
29,159 |
|
|
|
20,280 |
|
|
|
17,565 |
|
|
|
17,654 |
|
|
|
11,110 |
|
|
Adjusted EBITDA as a % of Net Sales |
|
|
11.9 |
% |
|
|
10.5 |
% |
|
|
11.5 |
% |
|
|
13.6 |
% |
|
|
9.8 |
% |
|
Adjusted Gross Profit (1) |
|
|
121,489 |
|
|
|
96,938 |
|
|
|
78,450 |
|
|
|
66,248 |
|
|
|
57,416 |
|
|
Adjusted Gross Profit as a % of Net Sales |
|
|
49.4 |
% |
|
|
50.2 |
% |
|
|
51.5 |
% |
|
|
51.1 |
% |
|
|
50.6 |
% |
|
Adjusted SG&A Expenses (1) |
|
|
92,473 |
|
|
|
76,698 |
|
|
|
60,797 |
|
|
|
48,651 |
|
|
|
46,347 |
|
|
Adjusted SG&A Expenses as a % of Net Sales |
|
|
37.6 |
% |
|
|
39.7 |
% |
|
|
39.9 |
% |
|
|
37.5 |
% |
|
|
40.8 |
% |
|
Capital Expenditures |
|
|
|
|
|
|
|
|
|
|
|
|
|
|
|
|
|
|
|
|
|
Freshpet Kitchens and other plant capital expenditures |
|
|
48,550 |
|
|
|
5,175 |
|
|
|
3,287 |
|
|
|
20,817 |
|
|
|
24,071 |
|
|
Freshpet Fridge and other capital expenditures |
|
|
22,083 |
|
|
|
11,099 |
|
|
|
9,716 |
|
|
|
9,135 |
|
|
|
8,082 |
|
|
Total cash outflows of capital expenditures |
|
$ |
70,633 |
|
|
$ |
16,274 |
|
|
$ |
13,003 |
|
|
$ |
29,952 |
|
|
$ |
32,153 |
|
|
|
|
As of December 31, |
|
|||||||||||||||||
|
|
|
2019 |
|
|
2018 |
|
|
2017 |
|
|
2016 |
|
|
2015 |
|
|||||
|
Consolidated Balance Sheet Data |
|
(Dollars in thousands) |
|
|||||||||||||||||
|
Cash and cash equivalents |
|
$ |
9,472 |
|
|
$ |
7,554 |
|
|
$ |
2,184 |
|
|
$ |
3,908 |
|
|
$ |
8,029 |
|
|
Short-term investments |
|
|
— |
|
|
|
— |
|
|
|
— |
|
|
|
— |
|
|
|
3,250 |
|
|
Working capital (2) |
|
|
12,338 |
|
|
|
12,741 |
|
|
|
10,265 |
|
|
|
575 |
|
|
|
16,246 |
|
|
Total assets |
|
|
236,126 |
|
|
|
139,965 |
|
|
|
133,900 |
|
|
|
126,451 |
|
|
|
113,098 |
|
|
Total debt |
|
|
54,466 |
|
|
|
— |
|
|
|
— |
|
|
|
7,000 |
|
|
|
— |
|
|
Total stockholders' equity (deficit) |
|
$ |
131,265 |
|
|
$ |
121,474 |
|
|
$ |
116,903 |
|
|
$ |
107,783 |
|
|
$ |
103,950 |
|
|
(1) |
EBITDA, Adjusted EBITDA, Adjusted Gross Profit and Adjusted SG&A Expenses are not financial measures prepared in accordance with U.S. generally accepted accounting principles, or GAAP. These metrics are explained in more detail in the section “Non-GAAP Financial Measures” in “Item 7—Management’s Discussion and Analysis of Financial Conditions and Results of Operations,” where they are reconciled to the closest GAAP measure. |
|
(2) |
Represents current assets minus current liabilities. |
|
|
|
26
ITEM 7. Management’s Discussion and Analysis of Financial Conditions and Results of Operations
The following discussion contains forward-looking statements that involve risks and uncertainties. Our actual results may differ materially from those discussed in these forward-looking statements as a result of various factors, including those set forth in “Risk Factors.” The following discussion of our financial condition and results of operations should be read in conjunction with our consolidated financial statements included elsewhere in this report, as well as the information presented under “Selected Financial Data.” For more information regarding our consolidated results and liquidity and capital resources for the year ended December 31, 2018 as compared to the year ended December 31, 2017, refer to "Part II-Item 7. Management’s Discussion and Analysis of Financial Condition and Results of Operations" in the Company's 2018 Annual Report on Form 10-K, which information is incorporated herein by reference.
Overview
We started Freshpet with a single-minded mission to bring the power of real, fresh food to our dogs and cats. We were inspired by the rapidly growing view among pet owners that their dogs and cats are a part of their family, leading them to demand healthier pet food choices. Since inception of the company in 2006, we have created a comprehensive business model to deliver wholesome pet food that pet parents can trust, and in the process, we believe we have become one of the fastest growing pet food companies in North America. Our business model is difficult for others to replicate and we see significant opportunity for future growth by leveraging the unique elements of our business, including our brand, our product know-how, our Freshpet Kitchens, our refrigerated distribution, our Freshpet Fridge and our culture.
Recent Developments
Freshpet Kitchens Expansion
Due to the continued growth of the Company’s fresh pet food sales, the Company has plans to continue expanding its manufacturing capacity. The Company converted three of its four manufacturing lines from five-day production to seven-day production in 2019, and converted the fourth line to seven-day production in January 2020. To date, the conversion to seven-day production has added more than 170 employees to the Freshpet team. Additionally, the Company is in the process of adding additional capacity by investing $105 million to build a 90,000 square-foot addition to our manufacturing location, “Freshpet kitchens 2.0”, as well as investing $15 million at a manufacturing facility titled “Kitchens South”. The $120 million strategic capital investment is expected to support Freshpet’s growth in the United States, Canada and Europe by creating total capacity for approximately $590 million in net sales from the facility. The facility Freshpet Kitchens 2.0 will make greater use of automation to improve quality, safety and reduce costs. Production start-up is slated for the second half of 2020. During the year ended December 31, 2019, we invested $45.1 million of capital for the Freshpet Kitchens 2.0 project and other expansion projects and have spent $47.1 million on the projects to date. We expect to make future capital expenditures of approximately $300 million in connection with the development of our Freshpet Kitchens 3.0. We expect to fund such capital expenditures with cash from operations, borrowings under credit facilities and possible debt and/or equity raises.
Components of our Results of Operations
Net Sales
Our net sales are derived from the sale of pet food to our customers, who purchase either directly from us or through third-party distributors. Our products are sold to consumers through a fast-growing network of company-owned branded refrigerators, known as Freshpet Fridges, located in our customers’ stores. We continue to roll out Freshpet Fridges across leading retailers across North America and parts of Europe and have installed Freshpet Fridges in approximately 21,500 retail stores as of December 31, 2019. Our products are sold under the Freshpet brand name, with ingredients, packaging and labeling customized by class of retail. Sales are recorded net of discounts, slotting, returns and promotional allowances.
Our net sales growth is driven by the following key factors:
|
|
• |
Increasing sales velocity from the average Freshpet Fridge due to increasing awareness, trial and adoption of Freshpet products and innovation. Our investments in marketing and advertising help to drive awareness and trial at each point of sale. |
|
|
• |
Increased penetration of Freshpet Fridge locations in major classes of retail, including grocery (including online), mass, club, pet specialty and natural. The impact of new Freshpet Fridge installations on our net sales varies by |
27
|
|
retail class and depends on numerous factors including store traffic, refrigerator size, placement within the store and proximity to other stores that carry our products. |
|
|
• |
Consumer trends including growing pet ownership, pet humanization and a focus on health and wellness. |
We believe that as a result of the above key factors, we will continue to penetrate the pet food marketplace and increase our share of the pet food category.
Gross Profit
Our gross profit is net of costs of goods sold, which include the costs of product manufacturing, product ingredients, packaging materials, inbound freight and depreciation.
Our gross profit margins are impacted by the cost of ingredients, packaging materials, and labor and overhead. We expect to mitigate any adverse movement in input costs through a combination of cost management and price increases.
Selling, General and Administrative Expenses
Due to our Feed the Growth initiative, which has increased our investment level in media, our selling, general and administrative (“SG&A”) expenses as a percentage of net sales increased in 2017, remained stable in 2018 and decreased in 2019. SG&A as a percentage of net sales was 49.3% in 2017, 49.1% in 2018 and 46.6% in 2019. We believe that as we continue to realize the benefits of our Feed the Growth initiative, SG&A expenses will continue to decrease as a percentage of net sales.
Our selling, general and administrative expenses consist of the following:
Outbound freight. We utilize a third-party logistics provider for outbound freight that ships directly to retailers as well as third-party distributors.
Marketing & advertising. Our marketing and advertising expenses primarily consist of national television media, digital marketing, social media and grass roots marketing to drive brand awareness. These expenses may vary from quarter to quarter depending on the timing of our marketing and advertising campaigns. Our Feed the Growth initiative will focus on growing the business through increased marketing investments.
Freshpet Fridge operating costs. Freshpet Fridge operating costs consist of repair costs and depreciation. The purchase and installation costs for new Freshpet Fridges are capitalized and depreciated over the estimated useful life. All new refrigerators are covered by a manufacturer warranty for three years. We subsequently incur maintenance and freight costs for repairs and refurbishments handled by third-party service providers.
Research & development (“R&D”). R&D costs consist of expenses to develop and test new products. The costs are expensed as incurred.
Brokerage. We utilize third-party brokers to assist with monitoring our products at the point-of-sale as well as representing us at headquarters for various customers. These brokers visit our retail customers’ store locations and ensure items are appropriately stocked and maintained.
Share-based compensation. We account for all share-based compensation payments issued to employees, directors and non-employees using a fair value method. Accordingly, share-based compensation expense is measured based on the estimated fair value of the awards on the grant date. We recognize compensation expense for the portion of the award that is ultimately expected to vest over the period during which the recipient renders the required services to us using the straight-line basis.
Other general & administrative costs. Other general and administrative costs include plant salaried and non-plant personnel salaries and benefits, as well as corporate general & administrative costs.
28
Income Taxes
We had federal net operating loss (“NOL”) carry forwards of approximately $198.1 million as of December 31, 2019, of which, approximately $175.0 million, generated in 2017 and prior, will expire between 2025 and 2037. The NOL generated in 2018 and 2019, of approximately $23.0 million, will have an indefinite carryforward period but can generally only be used to offset 80% of taxable income in any particular year. We may be subject to certain limitations in our annual utilization of NOL carry forwards to off-set future taxable income pursuant to Section 382 of the Internal Revenue Code, which could result in NOLs expiring unused. At December 31, 2019, we had approximately $160.0 million of state NOLs, which expire between 2019 and 2038. At December 31, 2019, we had a full valuation allowance against our net deferred tax assets as the realization of such assets was not considered more likely than not.
Results of Operations
|
|
|
Twelve Months Ended December 31, |
|
|||||||||||||||||||||
|
|
|
2019 |
|
|
2018 |
|
|
2017 |
|
|||||||||||||||
|
|
|
Amount |
|
|
% of Net Sales |
|
|
Amount |
|
|
% of Net Sales |
|
|
Amount |
|
|
% of Net Sales |
|
||||||
|
|
|
(Dollars in thousands) |
|
|||||||||||||||||||||
|
Net sales |
|
$ |
245,862 |
|
|
|
100 |
% |
|
$ |
193,237 |
|
|
|
100 |
% |
|
$ |
152,359 |
|
|
|
100 |
% |
|
Cost of goods sold |
|
|
131,665 |
|
|
|
54 |
|
|
|
103,247 |
|
|
|
53 |
|
|
|
79,943 |
|
|
|
52 |
|
|
Gross profit |
|
|
114,197 |
|
|
|
46 |
|
|
|
89,990 |
|
|
|
47 |
|
|
|
72,416 |
|
|
|
48 |
|
|
Selling, general and administrative expenses |
|
|
114,450 |
|
|
|
47 |
|
|
|
94,876 |
|
|
|
49 |
|
|
|
75,167 |
|
|
|
49 |
|
|
Loss from operations |
|
|
(253 |
) |
|
|
(0 |
) |
|
|
(4,886 |
) |
|
|
(3 |
) |
|
|
(2,751 |
) |
|
|
(2 |
) |
|
Other income/(expenses), net |
|
|
5 |
|
|
|
0 |
|
|
|
(102 |
) |
|
|
(0 |
) |
|
|
(525 |
) |
|
|
(0 |
) |
|
Interest expense |
|
|
(991 |
) |
|
|
(0 |
) |
|
|
(296 |
) |
|
|
(0 |
) |
|
|
(910 |
) |
|
|
0 |
|
|
Loss before income taxes |
|
|
(1,239 |
) |
|
|
(1 |
) |
|
|
(5,284 |
) |
|
|
(3 |
) |
|
|
(4,187 |
) |
|
|
(3 |
) |
|
Income tax expense |
|
|
144 |
|
|
|
0 |
|
|
|
77 |
|
|
|
0 |
|
|
|
75 |
|
|
|
0 |
|
|
Net loss |
|
$ |
(1,383 |
) |
|
|
(1 |
)% |
|
$ |
(5,361 |
) |
|
|
(3 |
)% |
|
$ |
(4,262 |
) |
|
|
(3 |
)% |
Twelve Months Ended December 31, 2019 Compared To Twelve Months Ended December 31, 2018
Net Sales
The following table sets forth net sales by class of retail:
|
|
|
Twelve Months Ended December 31, |
|
|||||||||||||||||||||
|
|
|
2019 |
|
|
2018 |
|
||||||||||||||||||
|
|
|
Amount |
|
|
% of Net Sales |
|
|
Store Count |
|
|
Amount |
|
|
% of Net Sales |
|
|
Store Count |
|
||||||
|
|
|
(Dollars in thousands) |
|
|||||||||||||||||||||
|
Grocery (including Online), Mass and Club (1) |
|
$ |
206,550 |
|
|
|
84 |
% |
|
|
16,278 |
|
|
$ |
158,506 |
|
|
|
82 |
% |
|
|
14,293 |
|
|
Pet Specialty and Natural (2) |
|
|
39,312 |
|
|
|
16 |
|
|
|
5,292 |
|
|
|
34,731 |
|
|
|
18 |
|
|
|
5,206 |
|
|
Net Sales |
|
$ |
245,862 |
|
|
|
100 |
% |
|
|
21,570 |
|
|
$ |
193,237 |
|
|
|
100 |
% |
|
|
19,499 |
|
|
(1) |
Stores at December 31, 2019 and December 31, 2018 consisted of 11,315 and 10,129 grocery (including online) and 4,963 and 4,164 mass and club, respectively. |
|
(2) |
Stores at December 31, 2019 and December 31, 2018 consisted of 4,837 and 4,783 pet specialty and 455 and 423 natural, respectively. |
Net sales increased $52.6 million, or 27.2%, to $245.9 million for the twelve months ended December 31, 2019 as compared to the same period in the prior year. The $52.6 million increase in net sales was driven by growth in the Grocery (including Online), Mass, and Club refrigerated channel of $48.0 million, and Pet Specialty and Natural of $4.6 million. The net sales increase was driven by overall velocity gains and an increase of Freshpet Fridges store locations, which grew by 10.6% from 19,499 as of December 31, 2018 to 21,570 as of December 31, 2019.
Gross Profit
Gross profit increased $24.2 million, or 26.9%, to $114.2 million for the twelve months ended December 31, 2019 as compared to the same period in the prior year. The increase in gross profit was primarily driven by higher net sales offset by a slightly decreased gross margin.
29
Our gross profit margin of 46.4% for the twelve months ended December 31, 2019, was a decrease of 20 basis points compared to the same period in the prior year, due to scrapping and incremental processing costs of 130 basis points, commodity inflation and in-bound freight costs of 100 basis points, unabsorbed labor cost in advance of a new seven day operation of 40 basis points, partially offset by increases in sales price and shifting selling mix of 100 basis points, leverage of depreciation and option expense of 60 basis points, and increased production efficiencies of 90 basis points.
Adjusted Gross Profit was $121.5 million and $96.9 million in the years ended December 31, 2019 and 2018, respectively. Adjusted Gross Profit Margin as a percentage of net sales was 49.4% and 50.2% in the years ended December 31, 2019 and 2018, respectively. Adjusted Gross Profit excludes $6.4 million and $6.1 million of depreciation expense in 2019 and 2018, respectively, and $0.9 million in non-cash share-based compensation expense in both 2019 and 2018. See “—Non-GAAP Financial Measures” for how we define Adjusted Gross Profit and a reconciliation of Adjusted Gross Profit to Gross Profit, the closest comparable U.S. GAAP measure.
Selling, General and Administrative Expenses
SG&A expenses increased $19.6 million, or 20.6%, to $114.5 million for the twelve months ended December 31, 2019 as compared to the same period in the prior year. Key components of the dollar increase include higher media spend of $8.0 million, increased variable cost due to volume of $4.1 million, which includes freight cost and brokerage, higher depreciation and share-based compensation expense of $2.5 million, increased variable incentive compensation of $0.5 million, secondary offering costs of $0.3 million, and higher incremental operating expenses of $4.7 million, offset by lower selling expense of $0.5 million. The increased operating expenses were primarily due to new hires and increased employee benefit costs.
As a percentage of net sales, selling, general and administrative expenses decreased to 46.6% for the twelve months ended December 31, 2019 from 49.1% for the twelve months ended December 31, 2018.
Adjusted SG&A decreased as a percentage of net sales to 37.6% in the in the year ended December 31, 2019 as compared to 39.7% of net sales in the year ended December 31, 2018. The decrease of 210 basis points in adjusted SG&A is a result of 290 basis point gain in SG&A leverage, offset by a decrease of 90 basis points related to media ad spend increase. The media spend increase is due to the Company’s Feed the Growth Initiative. Since the start of the initiative the Company has gained 560 basis points of leverage on adjusted SG&A. Adjusted SG&A excludes $9.6 million and $8.0 million for depreciation and amortization expense in 2019 and 2018, respectively, $6.9 million and $5.9 million for non-cash items related to share-based compensation in 2019 and 2018, respectively, $4.6 million and $3.5 million for launch expense in 2019 and 2018, respectively, $0.3 million related to secondary offering expenses in both 2019 and 2018, and $0.6 million loss on disposal of assets in 2019, and $0.3 million of litigation expense in 2018. Adjusted SG&A is a Non-GAAP measure. See “—Non-GAAP Financial Measures” for how we define Adjusted SG&A, a reconciliation of Adjusted SG&A to SG&A, the closest comparable U.S. GAAP measure, certain limitations of Non-GAAP measures and why management has included such Non-GAAP measures.
Loss from Operations
Loss from operations decreased $4.6 million from a loss of $4.9 million for the twelve months ended December 31, 2018 to a loss of $0.3 million for the twelve months ended December 31, 2019 as a result of the factors discussed above.
Interest Expense
Interest expense was $1.0 million and $0.3 million for the twelve months ended December 31, 2019 and 2018, respectively, relating primarily to our Credit Facilities (as defined below). Interest expense in the twelve months ended December 31, 2019 included $0.1 million of accelerated amortization of debt issuance costs related to the amendment of our Credit Facilities (as defined below). See “—Liquidity and Capital Resources.”
Other Income/(Expenses), net
Other income/(expenses), net decreased $0.1 million from a loss of $0.1 million for the twelve months ended December 31, 2018 to income of less than $0.1 million for the twelve months ended December 31, 2019.
30
Net Loss
Net loss decreased $4.0 million, or 74.2%, to $1.4 million for the twelve months ended December 31, 2019 as compared to net loss of $5.4 million for the same period in the prior year. Net loss was 0.6% of net sales for the twelve months ended December 31, 2019 as compared to a net loss of 2.8% of net sales for the same period in the prior year.
Adjusted EBITDA
Adjusted EBITDA increased $8.9 million from $20.3 million for the twelve months ended December 31, 2018 to $29.2 million for the twelve months ended December 31, 2019. Adjusted EBITDA as a percentage of net sales increased 140 basis points from 10.5% for the twelve months ended December 31, 2018 to 11.9% for the twelve months ended December 31, 2019. The increase is a result of leverage gain on Adjusted SG&A of 290 basis points, partially offset by a decrease in Adjusted Gross Margin of 80 basis points, and increased media spend as part of our Feed the Growth initiative of 90 basis points.
Selected Quarterly Financial Data
The following quarterly consolidated statement of operations data for the 12 fiscal quarters ended December 31, 2019 has been prepared on a basis consistent with our audited annual consolidated financial statements and includes, in the opinion of management, all normal recurring adjustments necessary for a fair statement of the financial information contained herein. The following quarterly data should be read together with our consolidated financial statements included elsewhere in this report.
|
|
|
2019 |
|
|||||||||||||
|
|
|
Q1 |
|
|
Q2 |
|
|
Q3 |
|
|
Q4 |
|
||||
|
|
|
(Dollars in thousands) |
|
|||||||||||||
|
Freshpet Fridge store locations |
|
|
20,053 |
|
|
|
20,414 |
|
|
|
20,779 |
|
|
|
21,570 |
|
|
Net sales |
|
$ |
54,792 |
|
|
$ |
60,052 |
|
|
$ |
65,266 |
|
|
$ |
65,752 |
|
|
Gross profit |
|
|
25,915 |
|
|
|
27,326 |
|
|
|
30,706 |
|
|
|
30,250 |
|
|
Gross profit margin |
|
|
47.3 |
% |
|
|
45.5 |
% |
|
|
47.0 |
% |
|
|
46.0 |
% |
|
Net income (loss) |
|
$ |
(3,422 |
) |
|
$ |
(5,661 |
) |
|
$ |
3,067 |
|
|
$ |
4,633 |
|
|
|
|
|
|
|
|
|
|
|
|
|
|
|
|
|
|
|
|
|
|
2018 |
|
|||||||||||||
|
|
|
Q1 |
|
|
Q2 |
|
|
Q3 |
|
|
Q4 |
|
||||
|
|
|
(Dollars in thousands) |
|
|||||||||||||
|
Freshpet Fridge store locations |
|
|
18,277 |
|
|
|
18,662 |
|
|
|
19,107 |
|
|
|
19,499 |
|
|
Net sales |
|
$ |
43,170 |
|
|
$ |
47,625 |
|
|
$ |
50,799 |
|
|
$ |
51,643 |
|
|
Gross profit |
|
|
20,128 |
|
|
|
22,878 |
|
|
|
23,615 |
|
|
|
23,368 |
|
|
Gross profit margin |
|
|
46.6 |
% |
|
|
48.0 |
% |
|
|
46.5 |
% |
|
|
45.2 |
% |
|
Net income (loss) |
|
$ |
(3,521 |
) |
|
$ |
(3,501 |
) |
|
$ |
(97 |
) |
|
$ |
1,757 |
|
|
|
|
|
|
|
|
|
|
|
|
|
|
|
|
|
|
|
|
|
|
2017 |
|
|||||||||||||
|
|
|
Q1 |
|
|
Q2 |
|
|
Q3 |
|
|
Q4 |
|
||||
|
|
|
(Dollars in thousands) |
|
|||||||||||||
|
Freshpet Fridge store locations |
|
|
17,031 |
|
|
|
17,357 |
|
|
|
17,650 |
|
|
|
18,004 |
|
|
Net sales |
|
$ |
33,678 |
|
|
$ |
38,728 |
|
|
$ |
40,125 |
|
|
$ |
39,829 |
|
|
Gross profit |
|
|
15,803 |
|
|
|
18,170 |
|
|
|
19,503 |
|
|
|
18,940 |
|
|
Gross profit margin |
|
|
46.9 |
% |
|
|
46.9 |
% |
|
|
48.6 |
% |
|
|
47.6 |
% |
|
Net income (loss) |
|
$ |
(2,880 |
) |
|
$ |
(2,652 |
) |
|
$ |
(246 |
) |
|
$ |
1,517 |
|
31
Non-GAAP Financial Measures
Freshpet uses the following non-GAAP financial measures in its financial communications. These non-GAAP financial measures should be considered as supplements to the GAAP reported measures, should not be considered replacements for, or superior to, the GAAP measures and may not be comparable to similarly named measures used by other companies.
•Adjusted Gross Profit
•Adjusted Gross Profit as a percentage of net sales
•Adjusted SG&A expenses
•Adjusted SG&A expenses as a percentage of net sales
•EBITDA
•Adjusted EBITDA
•Adjusted EBITDA as a percentage of net sales
Such financial measures are not financial measures prepared in accordance with U.S. GAAP. We define Adjusted Gross Profit as Gross Profit before non-cash depreciation expense, plant start-up expenses and non-cash share-based compensation. We define Adjusted SG&A as SG&A expenses before depreciation and amortization expense, non-cash share-based compensation, launch expense, fees related to secondary offerings, leadership transition expenses and litigation expense. EBITDA represents net income (loss) plus interest expense, income tax expense, and depreciation and amortization. Adjusted EBITDA represents EBITDA plus gain (loss) on disposal of equipment, non-cash share-based compensation, warrant fair valuation, launch expenses, fees related to secondary offerings, leadership transition expenses and litigation expense.
We believe that each of these non-GAAP financial measures provide additional metrics to evaluate our operations and, when considered with both our U.S. GAAP results and the reconciliation to the closest comparable U.S. GAAP measures, provide a more complete understanding of our business than could be obtained absent this disclosure. We use the non-GAAP financial measures, together with U.S. GAAP financial measures, such as net sales, gross profit margins and cash flow from operations, to assess our historical and prospective operating performance, to provide meaningful comparisons of operating performance across periods, to enhance our understanding of our operating performance and to compare our performance to that of our peers and competitors.
Adjusted EBITDA is also an important component of internal budgeting and setting management compensation.
The non-GAAP financial measures are presented here because we believe they are useful to investors in assessing the operating performance of our business without the effect of non-cash items, and other items as detailed below. The non-GAAP financial measures should not be considered in isolation or as alternatives to net income (loss), income (loss) from operations or any other measure of financial performance calculated and prescribed in accordance with U.S. GAAP. Neither EBITDA nor Adjusted EBITDA should be considered a measure of discretionary cash available to us to invest in the growth of our business. Our non-GAAP financial measures may not be comparable to similarly titled measures in other organizations because other organizations may not calculate non-GAAP financial measures in the same manner as we do.
Our presentation of the non-GAAP financial measures should not be construed as an inference that our future results will be unaffected by the expenses that are excluded from that term or by unusual or non-recurring items. We recognize that the non-GAAP financial measures have limitations as analytical financial measures. For example, the non-GAAP financial measures do not reflect:
|
|
• |
our capital expenditures or future requirements for capital expenditures; |
|
|
• |
the interest expense, or the cash requirements necessary to service interest expense or principal payments, associated with indebtedness; |
|
|
• |
depreciation and amortization, which are non-cash charges, although the assets being depreciated and amortized will likely have to be replaced in the future, nor any cash requirements for such replacements; and |
|
|
• |
changes in cash requirements for our working capital needs. |
Additionally, Adjusted EBITDA excludes (i) non-cash share-based compensation expense, which is and will remain a key element of our overall long-term incentive compensation package, and (ii) certain costs essential to our sales growth and
32
strategy, including an allowance for marketing expenses for each new store added to our network and non-capitalizable freight costs associated with Freshpet Fridge replacements. Adjusted EBITDA also excludes certain cash charges resulting from matters we consider not to be indicative of our ongoing operations. Other companies in our industry may calculate the non-GAAP financial measures differently than we do, limiting their usefulness as comparative measures.
The following table provides a reconciliation of EBITDA and Adjusted EBITDA to net loss, the most directly comparable financial measure presented in accordance with U.S. GAAP:
|
|
|
Twelve Months Ended |
|
|
|||||||||||||||||
|
|
|
December 31, |
|
|
|||||||||||||||||
|
|
|
2019 |
|
|
2018 |
|
|
2017 |
|
|
2016 |
|
|
2015 |
|
|
|||||
|
|
|
(Dollars in thousands) |
|
|
|||||||||||||||||
|
Net loss |
|
$ |
(1,383 |
) |
|
$ |
(5,361 |
) |
|
$ |
(4,262 |
) |
|
$ |
(3,161 |
) |
|
$ |
(3,711 |
) |
|
|
Depreciation and amortization |
|
|
15,921 |
|
|
|
14,068 |
|
|
|
12,692 |
|
|
|
9,887 |
|
|
|
7,574 |
|
|
|
Interest expense |
|
|
991 |
|
|
|
296 |
|
|
|
910 |
|
|
|
698 |
|
|
|
455 |
|
|
|
Income tax expense |
|
|
144 |
|
|
|
77 |
|
|
|
75 |
|
|
|
66 |
|
|
|
58 |
|
|
|
EBITDA |
|
$ |
15,673 |
|
|
$ |
9,080 |
|
|
$ |
9,414 |
|
|
$ |
7,490 |
|
|
$ |
4,376 |
|
|
|
Loss on disposal of equipment |
|
|
787 |
|
|
|
142 |
|
|
|
104 |
|
|
|
190 |
|
|
|
94 |
|
|
|
Non-cash share-based compensation |
|
|
7,834 |
|
|
|
6,808 |
|
|
|
4,438 |
|
|
|
4,193 |
|
|
|
3,924 |
|
|
|
Launch expense (a) |
|
|
4,563 |
|
|
|
3,540 |
|
|
|
3,066 |
|
|
|
2,813 |
|
|
|
2,626 |
|
|
|
Plant start-up expenses (b) |
|
|
— |
|
|
|
— |
|
|
|
— |
|
|
|
1,628 |
|
|
|
— |
|
|
|
Warrant fair valuation (c) |
|
|
— |
|
|
|
— |
|
|
|
335 |
|
|
|
49 |
|
|
|
(503 |
) |
|
|
Secondary offering expenses (d) |
|
|
302 |
|
|
|
362 |
|
|
|
— |
|
|
|
— |
|
|
|
593 |
|
|
|
Leadership transition expenses (e) |
|
|
— |
|
|
|
— |
|
|
|
63 |
|
|
|
1,291 |
|
|
|
— |
|
|
|
Litigation expense (f) |
|
|
— |
|
|
|
348 |
|
|
|
145 |
|
|
|
— |
|
|
|
— |
|
|
|
Adjusted EBITDA |
|
$ |
29,159 |
|
|
$ |
20,280 |
|
|
$ |
17,565 |
|
|
$ |
17,654 |
|
|
$ |
11,110 |
|
|
|
Adjusted EBITDA as a % of Net Sales |
|
|
11.9 |
% |
|
|
10.5 |
% |
|
|
11.5 |
% |
|
|
13.6 |
% |
|
|
9.8 |
% |
|
|
(a) |
Represents new store marketing allowance of $1,000 for each store added to our distribution network, as well as the non-capitalized freight costs associated with Freshpet Fridge replacements. The expense enhances the overall marketing spend to support our growing distribution network. |
|
(b) |
Represents additional operating costs incurred in connection with the start-up of our new manufacturing lines as part of the Freshpet Kitchens expansion project in 2016 that included adding two additional product lines. |
|
(c) |
Represents the change of fair value for the outstanding common stock warrants. All outstanding warrants were converted to common stock in September 2017. |
|
(d) |
Represents fees associated with secondary public offerings of our common stock. |
|
(e) |
Represents charges associated with our former Chief Executive Officer’s separation agreement as well as changes in estimates associated with leadership transition costs. |
|
(f) |
Represents fees associated with two securities lawsuits. |
The following table provides a reconciliation of Adjusted Gross Profit to Gross Profit, the most directly comparable financial measure presented in accordance with U.S. GAAP:
|
|
|
Twelve Months Ended |
|
|
|||||||||||||||||
|
|
|
December 31, |
|
|
|||||||||||||||||
|
|
|
2019 |
|
|
2018 |
|
|
2017 |
|
|
2016 |
|
|
2015 |
|
|
|||||
|
|
|
(Dollars in thousands) |
|
|
|||||||||||||||||
|
Gross Profit |
|
$ |
114,197 |
|
|
$ |
89,990 |
|
|
$ |
72,416 |
|
|
$ |
60,371 |
|
|
$ |
54,649 |
|
|
|
Depreciation expense (a) |
|
|
6,370 |
|
|
|
6,089 |
|
|
|
5,791 |
|
|
|
4,028 |
|
|
|
2,566 |
|
|
|
Plant start-up expense (b) |
|
|
— |
|
|
|
— |
|
|
|
— |
|
|
|
1,628 |
|
|
|
— |
|
|
|
Non-cash share-based compensation (c) |
|
|
922 |
|
|
|
859 |
|
|
|
243 |
|
|
|
221 |
|
|
|
201 |
|
|
|
Adjusted Gross Profit |
|
$ |
121,489 |
|
|
$ |
96,938 |
|
|
$ |
78,450 |
|
|
$ |
66,248 |
|
|
$ |
57,416 |
|
|
|
Adjusted Gross Profit as a % of Net Sales |
|
|
49.4 |
% |
|
|
50.2 |
% |
|
|
51.5 |
% |
|
|
51.1 |
% |
|
|
50.6 |
% |
|
33
(a) Represents depreciation and amortization expense included in cost of goods sold.
|
(b) |
Represents additional operating costs incurred in connection with the start-up of our new manufacturing lines as part of the Freshpet Kitchens expansion project in 2016 that included adding two additional product lines. |
(c) Represents non-cash share-based compensation expense included in cost of goods sold.
The following table provides a reconciliation of Adjusted SG&A to SG&A expenses, the most directly comparable financial measure presented in accordance with U.S. GAAP:
|
|
|
Twelve Months Ended |
|
|||||||||||||||||
|
|
|
December 31, |
|
|||||||||||||||||
|
|
|
2019 |
|
|
2018 |
|
|
2017 |
|
|
2016 |
|
|
2015 |
|
|||||
|
|
|
(Dollars in thousands) |
|
|||||||||||||||||
|
SG&A expenses |
|
$ |
114,450 |
|
|
$ |
94,876 |
|
|
$ |
75,167 |
|
|
$ |
62,586 |
|
|
$ |
58,297 |
|
|
Depreciation and amortization expense (a) |
|
|
9,551 |
|
|
|
7,977 |
|
|
|
6,901 |
|
|
|
5,859 |
|
|
|
5,008 |
|
|
Non-cash share-based compensation (b) |
|
|
6,912 |
|
|
|
5,949 |
|
|
|
4,195 |
|
|
|
3,972 |
|
|
|
3,723 |
|
|
Launch expense (c) |
|
|
4,563 |
|
|
|
3,540 |
|
|
|
3,066 |
|
|
|
2,813 |
|
|
|
2,626 |
|
|
Loss on disposal of equipment |
|
|
649 |
|
|
|
— |
|
|
|
— |
|
|
|
— |
|
|
|
— |
|
|
Secondary offering expenses (d) |
|
|
302 |
|
|
|
362 |
|
|
|
— |
|
|
|
— |
|
|
|
593 |
|
|
Leadership transition expenses (e) |
|
|
— |
|
|
|
— |
|
|
|
63 |
|
|
|
1,291 |
|
|
|
— |
|
|
Litigation expense (f) |
|
|
— |
|
|
|
348 |
|
|
|
145 |
|
|
|
— |
|
|
|
— |
|
|
Adjusted SG&A Expenses |
|
$ |
92,473 |
|
|
$ |
76,698 |
|
|
$ |
60,797 |
|
|
$ |
48,651 |
|
|
$ |
46,347 |
|
|
Adjusted SG&A Expenses as a % of Net Sales |
|
|
37.6 |
% |
|
|
39.7 |
% |
|
|
39.9 |
% |
|
|
37.5 |
% |
|
|
40.8 |
% |
(a) Represents depreciation and amortization expense included in SG&A.
(b) Represents non-cash share-based compensation expense included in SG&A.
|
(c) |
Represents new store marketing allowance of $1,000 for each store added to our distribution network, as well as the non-capitalized freight costs associated with Freshpet Fridge replacements. The expense enhances the overall marketing spend to support our growing distribution network. |
|
(d) |
Represents fees associated with secondary public offerings of our common stock. |
|
(e) |
Represents charges associated with our former Chief Executive Officer’s separation agreement, as well as changes in estimates associated with leadership transition costs. |
|
(f) |
Represents fees associated with two securities lawsuits. |
Liquidity and Capital Resources
Developing our business will require significant capital in the future. We expect to make future capital expenditures of approximately $370.0 million in connection with the development of Freshpet Kitchens 2.0, Freshpet Kitchens South and Freshpet Kitchens 3.0. To meet our capital needs, we expect to rely on our current and future cash flow from operations, our current available borrowing capacity, and access to the debt and equity markets, if appropriate. Our ability to obtain additional funding will be subject to various factors, including general market conditions, our operating performance, the market’s perception of our growth potential, lender sentiment and our ability to incur additional debt in compliance with other contractual restrictions, such as financial covenants under our debt agreements.
Additionally, our ability to make payments on, and to refinance, any indebtedness under our Credit Facilities and to fund any necessary expenditures for our growth will depend on our ability to generate cash in the future. If our business does not achieve the levels of profitability or generate the amount of cash that we anticipate or if we expand faster than anticipated, we may need to seek additional debt or equity financing to operate and expand our business. Future third-party financing may not be available on favorable terms or at all.
Our primary cash needs, in addition to our plant expansions, are for ingredients, purchases and operating expenses, marketing expenses and capital expenditures to procure Freshpet Fridges. We believe that cash and cash equivalents, expected cash flow from operations, planned borrowing capacity and our ability to access the capital markets, if appropriate, are adequate to fund debt service requirements, operating lease obligations, capital expenditures and working capital obligations for the foreseeable future. However, our ability to continue to meet these requirements and obligations will depend on, among other things, our ability to achieve anticipated levels of revenue and cash flow from
34
operations and our ability to manage costs and working capital successfully. Additionally, our cash flow generation ability is subject to general economic, financial, competitive, legislative and regulatory factors and other factors that are beyond our control. We cannot assure you that our business will generate cash flow from operations in an amount sufficient to enable us to fund our liquidity needs. Further, our capital requirements may vary materially from those currently planned if, for example, our revenues do not reach expected levels, or we have to incur unforeseen capital expenditures and make investments to maintain our competitive position. If this is the case, we may seek alternative financing, such as selling additional debt or equity securities, and we cannot assure you that we will be able to do so on favorable terms, if at all. Moreover, if we issue new debt securities, the debt holders would have rights senior to common stockholders to make claims on our assets, and the terms of any debt could restrict our operations, including our ability to pay dividends on our common stock. If we issue additional equity or convertible debt securities, existing stockholders may experience dilution, and such new securities could have rights senior to those of our common stock. These factors may make the timing, amount, terms and conditions of additional financings unattractive. Our inability to raise capital could impede our growth or otherwise require us to forego growth opportunities and could materially adversely affect our business, financial condition and results of operations.
The following table sets forth, for the periods indicated, our working capital:
|
|
For the Twelve Months Ended |
|
|||||
|
|
December 31, |
|
|||||
|
|
2019 |
|
|
2018 |
|
||
|
|
(Dollars in thousands) |
|
|||||
|
Cash and cash equivalents |
|
9,472 |
|
|
|
7,554 |
|
|
Accounts receivable, net of allowance for doubtful accounts |
|
18,581 |
|
|
|
12,327 |
|
|
Inventories, net |
|
12,542 |
|
|
|
9,317 |
|
|
Prepaid expenses |
|
3,276 |
|
|
|
1,078 |
|
|
Other current assets |
|
10,453 |
|
|
|
682 |
|
|
Accounts payable |
|
(18,668 |
) |
|
|
(9,166 |
) |
|
Accrued expenses |
|
(22,133 |
) |
|
|
(9,051 |
) |
|
Current operating lease liabilities |
|
(1,185 |
) |
|
|
— |
|
|
Total Working Capital |
$ |
12,338 |
|
|
$ |
12,741 |
|
Working Capital consists of current assets net of current liabilities. Working capital decreased $0.4 million to $12.3 million at December 31, 2019 compared with $12.7 million at December 31, 2018. The decrease was primarily a result of an increase of cash, accounts receivable, and inventory offset by an increase in accounts payable, accrued expenses and current operating lease liabilities.
We normally carry three to four weeks of finished goods inventory. The average duration of our accounts receivable is approximately 25 days.
For the year ended December 31, 2019 our capital resources consisted of primarily $9.5 million cash on hand and $33.0 million available under our credit facilities, net of $2.0 million reserved for two letters of credit. For the year ended December 31, 2018, our capital resources consisted primarily of $7.5 million cash on hand and $30.0 million available under our credit facilities. The Credit Facilities will mature in May 2024.
We borrowed $72.3 million under our credit facilities during 2019, of which $18.5 million was repaid prior to the end of the year. As of December 31, 2019, we had $54.5 million of debt outstanding (including $0.7 million of debt issuance costs) under our credit facilities. There was no debt outstanding under the credit facilities as of December 31, 2018.
35
The following table sets forth, for the periods indicated, our beginning balance of cash, net cash flows provided by operating, investing and financing activities and our ending balance of cash.
|
|
|
|
|||||||||
|
|
December 31, |
|
|
December 31, |
|
|
December 31, |
|
|||
|
|
2019 |
|
|
2018 |
|
|
2017 |
|
|||
|
|
(Dollars in thousands) |
|
|||||||||
|
Cash at the beginning of period |
$ |
7,554 |
|
|
$ |
2,184 |
|
|
$ |
3,908 |
|
|
Net cash provided by operating activities |
|
16,317 |
|
|
|
18,575 |
|
|
|
10,270 |
|
|
Net cash used in investing activities |
|
(70,633 |
) |
|
|
(16,274 |
) |
|
|
(13,004 |
) |
|
Net cash provided by financing activities |
|
56,234 |
|
|
|
3,069 |
|
|
|
1,010 |
|
|
Cash at the end of period |
$ |
9,472 |
|
|
$ |
7,554 |
|
|
$ |
2,184 |
|
|
|
|
|
|
|
|
|
|
|
|
|
|
Net Cash Provided by Operating Activities
Cash provided by operating activities consists primarily of net income adjusted for certain non-cash items (provision for gain/loss on receivables, loss on disposal of assets, depreciation and amortization, share-based compensation, deferred financing costs and loan discounts and the fair valuation of warrants).
2019
Net cash provided by operating activities of $16.3 million in 2019 was primarily attributable to:
|
|
• |
$23.5 million of net income adjusted for reconciling non-cash items, which excludes $24.9 million of non-cash items primarily related to $15.9 million in depreciation and amortization, $7.8 million in share-based compensation and $0.8 million in loss on disposal of assets. |
This was partially offset by:
|
|
• |
$7.2 million decrease in working capital due to a decrease in accounts receivable, inventory and prepaid expenses and other current assets, and an increase in accrued expenses and accounts payable. This activity reflects the timing of expenditures and the related payments of cash, and timing of production versus sales. |
2018
Net cash provided by operating activities of $18.6 million in 2018 was primarily attributable to:
|
|
• |
$15.9 million of net income adjusted for reconciling non-cash items, which excludes $21.2 million of non-cash items primarily related to $14.1 million in depreciation and amortization and $6.8 million in share-based compensation. |
|
|
• |
$3.0 million decrease in working capital due to an increase in accrued expenses and accounts payable, as well as a decrease in inventory and accounts receivable. This activity reflects the timing of expenditures and the related payments of cash, and timing of production versus sales. |
This was partially offset by:
|
|
• |
$0.3 million decrease in other assets. |
Net Cash Used in Investing Activities
2019
Net cash used in investing activities of $70.6 million in 2019 relates primarily to:
|
|
• |
$48.5 million capital expenditures related to the Freshpet Kitchens, which includes $36.8 million related to the expansion project Kitchens 2.0, $7.5 million related to other expansion projects and $4.7 million related to non-expansion capital expenditures. |
36
|
|
• |
$20.8 million capital expenditures related to investments in fridges. |
|
|
• |
$1.3 million related to other capital spend that includes office equipment, computers and miscellaneous office expenses. |
2018
Net cash used in investing activities of $16.3 million in 2018 relates primarily to:
|
|
• |
$5.2 million capital expenditures related to the Freshpet Kitchens. |
|
|
• |
$11.1 million capital expenditures related to investments in fridges as well as other miscellaneous capital spend. |
Net Cash Provided by Financing Activities
2019
Net cash provided by financing activities was $56.2 million in 2019 mainly attributable to:
|
|
• |
$72.3 million of proceeds from borrowing under our Credit Facilities. |
|
|
• |
$4.4 million of proceeds from the exercise of stock options. |
This was partially offset by:
|
|
• |
$18.5 million repayment of borrowing under our Credit Facilities. |
|
|
• |
$1.3 million of purchase of stock for tax withholding. |
|
|
• |
$0.7 million in financing fees in connection with borrowing |
2018
Net cash provided by financing activities was $3.1 million in 2018 mainly attributable to:
|
|
• |
$6.0 million of proceeds from borrowing under our Credit Facilities. |
|
|
• |
$3.3 million of proceeds from the exercise of stock options. |
This was partially offset by:
|
|
• |
$6.0 million repayment of borrowing under our Credit Facilities. |
|
|
• |
$0.2 million of purchase of stock for tax withholding. |
Indebtedness
See Note 7 to our Consolidated Financial Statements for a discussion of our debt obligations.
37
Contractual Obligations and Commitments
The following table sets forth our expected contractual obligations as of December 31, 2019:
|
|
|
Payments Due by Period |
|
|||||||||||||||||
|
|
|
Total |
|
|
Less than 1 Year |
|
|
Between 1-3 Years |
|
|
Between 3-5 Years |
|
|
More than 5 Years |
|
|||||
|
|
|
(Dollars in thousands) |
|
|||||||||||||||||
|
Long term debt |
|
$ |
55,067 |
|
|
$ |
— |
|
|
$ |
11,800 |
|
|
$ |
43,267 |
|
|
$ |
— |
|
|
Interest on long term debt |
|
|
8,404 |
|
|
|
2,168 |
|
|
|
4,010 |
|
|
|
2,226 |
|
|
|
— |
|
|
Operating lease obligations |
|
|
11,355 |
|
|
|
1,724 |
|
|
|
3,532 |
|
|
|
3,313 |
|
|
|
2,786 |
|
|
Manufacturing processing obligations |
|
|
1,717 |
|
|
|
387 |
|
|
|
878 |
|
|
|
452 |
|
|
|
— |
|
|
Utility servicing obligations |
|
|
7,127 |
|
|
|
417 |
|
|
|
872 |
|
|
|
925 |
|
|
|
4,913 |
|
|
Total |
|
$ |
83,670 |
|
|
$ |
4,696 |
|
|
$ |
21,092 |
|
|
$ |
50,183 |
|
|
$ |
7,699 |
|
Critical Accounting Policies
Our management’s discussion and analysis of financial condition and results of operations is based on our financial statements, which have been prepared in accordance with accounting principles generally accepted in the United States, or GAAP. The preparation of these financial statements requires us to make estimates and assumptions that affect the reported amounts of assets and liabilities and the disclosure of contingent assets and liabilities at the date of the financial statements, as well as the revenue and expenses incurred during the reported periods. On an ongoing basis, we evaluate our estimates and judgments, including those related to accrued expenses and share-based compensation. We base our estimates on historical experience and on various other factors that we believe are reasonable under the circumstances, the results of which form the basis for making judgments about the carrying value of assets and liabilities that are not apparent from other sources. Changes in estimates are reflected in reported results for the period in which they become known. Actual results may differ from these estimates under different assumptions or conditions.
While our significant accounting policies are described in the notes to our financial statements appearing in this report, we believe that the following critical accounting policies are most important to understanding and evaluating our reported financial results.
The preparation of financial statements in conformity with GAAP requires management to make estimates and assumptions that affect the reported amounts of assets and liabilities and disclosure of contingent assets and liabilities at the date of the financial statements, and the reported amounts of net sales and expenses during the reporting period.
We believe that the accounting policies discussed below are critical to understanding our historical and future performance, as these policies related to the more significant areas involving management’s judgments and estimates. We base our estimates on historical experience and on various assumptions that we believe to be reasonable under the circumstances. Actual results, as determined at a later date, could differ from those estimates. To the extent that there are differences between our estimate and the actual results, our future financial statement presentation, financial condition, results of operations and cash flows will be affected.
The following critical accounting policies reflect significant judgments and estimates used in preparation of our consolidated financial statements:
Revenue Recognition and Incentives — Revenue is reported net of applicable trade incentives and allowances. Amounts billed and due from our customers are classified as receivables and require payment on a short-term basis. The Company applies judgment in the determination of the amount of consideration the Company receives from its customers. Revenue is measured as the amount of consideration the Company expects to receive in exchange for transferring goods. Revenue the Company recognizes varies with changes in trade incentives the Company offers to its customers and their consumers. Trade incentives consist primarily of customer pricing allowances and merchandising funds, and consumer coupons are offered through various programs to customers and consumers. Estimates of trade promotion expense and coupon redemption costs are based upon programs offered, timing of those offers, estimated redemption/usage rates from historical performance, management’s experience and current economic trends.
38
Share-based Compensation—We account for all share-based compensation payments issued to employees, directors and nonemployees using a fair value method. Accordingly, share-based compensation expense is measured based on the estimated fair value of the awards on the date of grant. We recognize compensation expense for the portion of the award that is ultimately expected to vest over the period during which the recipient renders the required services to us using the straight-line single option method.
We have outstanding share-based awards that have performance-based vesting conditions in addition to time-based vesting. Awards with performance-based vesting conditions require the achievement of certain financial and other performance criteria as a condition to the vesting. The performance-based awards with financial criteria either have a Net Sales or Adjusted EBITDA target within FY 2020 or FY 2022. We recognize the estimated fair value of performance-based awards as share-based compensation expense over the performance period based upon our determination of whether it is probable that the performance targets will be achieved. At each reporting period, we reassess the probability of achieving the performance criteria and the performance period required to meet those targets. Determining whether the performance criteria will be achieved involves judgment, and the share-based compensation expense may be revised periodically based on changes in the probability of achieving the performance criteria. Revisions are reflected in the period in which the probability assessment is changed. If performance goals are not met, no share-based compensation expense is recognized for the cancelled shares, and, to the extent share-based compensation expense was previously recognized for those cancelled shares, such share-based compensation expense is reversed.
Recent Accounting Pronouncements
For a discussion of recent accounting pronouncements, see Note 2 (Recently Issued Accounting Standards) to our audited consolidated financial statements included in this report.
Segment
We have determined we operate in one segment: the manufacturing, marketing and distribution of pet food and pet treats for dogs and cats.
Inflation
Our profitability is dependent, among other things, on our ability to anticipate and react to changes in the costs of key operating resources, including food and other raw materials, labor, energy and other supplies and services. Substantial increases in costs and expenses could impact our operating results to the extent that such increases cannot be passed along to our customers. The impact of inflation on food, labor and energy costs can significantly affect the profitability of our Company.
While we have been able to offset inflation and other changes in the costs of key operating resources through price increases, productivity improvements and greater economies of scale, there can be no assurance that we will be able to continue to do so in the future. From time to time, competitive conditions could limit our pricing flexibility. In addition, macroeconomic conditions could make additional price increases imprudent. There can be no assurance that all future cost increases can be offset by increased prices or that increased prices will be fully absorbed without any resulting changes in their purchasing patterns.
Off Balance Sheet Arrangements
We have no off balance sheet arrangements or any holdings in variable interest entities.
ITEM 7a. QUANTITATIVE AND QUALITATIVE DISCLOSURES ABOUT MARKET RISK
Interest Rate Risk
We are sometimes exposed to market risks from changes in interest rates on debt and changes in commodity prices. Our exposure to interest rate fluctuations is limited to our outstanding indebtedness under our credit agreements, which bears interest at variable rates. During the year ended December 31, 2019, we borrowed $72.3 million under our credit facilities, of which $18.5 million was repaid as of December 31, 2019. A change in interest rates of 100 basis points would cause a $0.1 million increase or decrease in annual interest expense for every $10.0 million in borrowings.
39
Commodity Price Risk
We purchase certain products that are affected by commodity prices and are, therefore, subject to price volatility caused by weather, market conditions and other factors which are not considered predictable or within our control. In many cases, we believe we will be able to address material commodity cost increases by either increasing prices or reducing operating expenses. However, increases in commodity prices, without adjustments to pricing or reduction to operating expenses, could increase our operating costs as a percentage of our net sales.
40
ITEM 8. FINANCIAL STATEMENTS AND SUPPLEMENTARY DATA
FRESHPET, INC.
INDEX TO THE CONSOLIDATED FINANCIAL STATEMENTS
|
|
|
|
|
Page |
|
|
|
|
||
|
|
|
|
42 |
|
|
|
|
|
||
|
Consolidated Balance Sheets as of December 31, 2019 and 2018 |
|
|
|
45 |
|
|
|
|
||
|
|
|
|
46 |
|
|
|
|
|
||
|
|
|
|
47 |
|
|
|
|
|
||
|
Consolidated Statements of Cash Flows for the years ended December 31, 2019, 2018, and 2017 |
|
|
|
48 |
|
|
|
|
||
|
|
|
|
49 |
|
41
Report of Independent Registered Public Accounting Firm
To the Stockholders and Board of Directors
Freshpet, Inc.:
Opinions on the Consolidated Financial Statements and Internal Control Over Financial Reporting
We have audited the accompanying consolidated balance sheets of Freshpet, Inc. and subsidiaries (the Company) as of December 31, 2019 and 2018, the related consolidated statements of operations and comprehensive loss, changes in stockholders’ equity, and cash flows for each of the years in the three-year period ended December 31, 2019, and the related notes (collectively, the consolidated financial statements). We also have audited the Company’s internal control over financial reporting as of December 31, 2019, based on criteria established in Internal Control – Integrated Framework (2013) issued by the Committee of Sponsoring Organizations of the Treadway Commission.
In our opinion, the consolidated financial statements referred to above present fairly, in all material respects, the financial position of the Company as of December 31, 2019 and 2018, and the results of its operations and its cash flows for each of the years in the three-year period ended December 31, 2019, in conformity with U.S. generally accepted accounting principles. Also, in our opinion, the Company maintained, in all material respects, effective internal control over financial reporting as of December 31, 2019 based on criteria established in Internal Control – Integrated Framework (2013) issued by the Committee of Sponsoring Organizations of the Treadway Commission.
The Company’s management is responsible for these consolidated financial statements, for maintaining effective internal control over financial reporting, and for its assessment of the effectiveness of internal control over financial reporting, included in the accompanying Management’s Report on Internal Control Over Financial Reporting. Our responsibility is to express an opinion on the Company’s consolidated financial statements and an opinion on the Company’s internal control over financial reporting based on our audits. We are a public accounting firm registered with the Public Company Accounting Oversight Board (United States) (PCAOB) and are required to be independent with respect to the Company in accordance with the U.S. federal securities laws and the applicable rules and regulations of the Securities and Exchange Commission and the PCAOB.
We conducted our audits in accordance with the standards of the PCAOB. Those standards require that we plan and perform the audits to obtain reasonable assurance about whether the consolidated financial statements are free of material misstatement, whether due to error or fraud, and whether effective internal control over financial reporting was maintained in all material respects.
Our audits of the consolidated financial statements included performing procedures to assess the risks of material misstatement of the consolidated financial statements, whether due to error or fraud, and performing procedures that respond to those risks. Such procedures included examining, on a test basis, evidence regarding the amounts and disclosures in the consolidated financial statements. Our audits also included evaluating the accounting principles used and significant estimates made by management, as well as evaluating the overall presentation of the consolidated financial statements. Our audit of internal control over financial reporting included obtaining an understanding of internal control over financial reporting, assessing the risk that a material weakness exists, and testing and evaluating the design and operating effectiveness of internal control based on the assessed risk. Our audits also included performing such other procedures as we considered necessary in the circumstances. We believe that our audits provide a reasonable basis for our opinions.
Definition and Limitations of Internal Control Over Financial Reporting
A company’s internal control over financial reporting is a process designed to provide reasonable assurance regarding the reliability of financial reporting and the preparation of financial statements for external purposes in accordance with generally accepted accounting principles. A company’s internal control over financial reporting includes those policies and procedures that (1) pertain to the maintenance of records that, in reasonable detail, accurately and fairly reflect the transactions and dispositions of the assets of the company;
42
(2) provide reasonable assurance that transactions are recorded as necessary to permit preparation of financial statements in accordance with generally accepted accounting principles, and that receipts and expenditures of the company are being made only in accordance with authorizations of management and directors of the company; and (3) provide reasonable assurance regarding prevention or timely detection of unauthorized acquisition, use, or disposition of the company’s assets that could have a material effect on the financial statements.
Because of its inherent limitations, internal control over financial reporting may not prevent or detect misstatements. Also, projections of any evaluation of effectiveness to future periods are subject to the risk that controls may become inadequate because of changes in conditions, or that the degree of compliance with the policies or procedures may deteriorate.
Critical Audit Matter
The critical audit matter communicated below is a matter arising from the current period audit of the consolidated financial statements that was communicated or required to be communicated to the audit committee and that: (1) relates to accounts or disclosures that are material to the consolidated financial statements and (2) involved our especially challenging, subjective, or complex judgment. The communication of a critical audit matter does not alter in any way our opinion on the consolidated financial statements, taken as a whole, and we are not, by communicating the critical audit matter below, providing a separate opinion on the critical audit matter or on the accounts or disclosures to which it relates.
Assessment of the probability of achieving the vesting performance criteria of share-based awards
As discussed in Notes 1 and 10 to the consolidated financial statements, the Company recognizes share-based compensation based on the value of the number of share-based payment awards that are ultimately expected to vest during the period. Share-based awards with performance-based vesting conditions require the achievement of certain financial and other performance criteria as a condition to the vesting. The performance-based awards with financial criteria either have 1) an annual or cumulative revenue or 2) an adjusted earnings before interest, taxes, depreciation and amortization (EBITDA) target within fiscal years 2020, 2021 or 2022. At each reporting period, the Company reassesses the probability of achieving the performance criteria required to meet those vesting targets. When achievement of the vesting criteria is considered probable, compensation cost is recognized As of December 31, 2019, there were 35,000 unvested performance-based options outstanding that were deemed not probable, with an aggregate fair value of $0.2 million.
We identified the assessment of the probability of achieving the vesting performance criteria of share-based awards as a critical audit matter. Evaluating the assumptions relating to the Company’s determination, at each reporting date, of the probability that the performance criteria will be achieved for the share-based awards involved subjective auditor judgment. The significant assumptions included forecasted revenue and EBITDA, which were impacted by the timing of the Company’s future growth plans including facility expansion.
The primary procedures we performed to address this critical audit matter included the following. We tested certain internal controls over the Company’s share-based compensation process, including a control related to the Company’s assessment of events and assumptions that are used in the determination that a performance criteria is probable of achievement. We compared the Company’s historical revenue and EBITDA forecasts to actual results to assess the Company’s ability to accurately forecast revenue and EBITDA. We compared forecasted revenue and EBITDA and expansion plan assumptions to those in communications to the Board of Directors, press releases and analyst reports. We evaluated the timing of the Company’s expansion plans by comparing the progress of the Company’s plans to the construction milestones achieved.
43
/s/ KPMG LLP
We have served as the Company’s auditor since 2012.
Short Hills, New Jersey
February 25, 2020
44
FRESHPET, INC. AND SUBSIDIARIES
CONSOLIDATED BALANCE SHEETS
|
|
December 31, 2019 |
|
|
December 31, 2018 |
|
||
|
|
|
|
|
|
|
|
|
|
ASSETS |
|
|
|
|
|
|
|
|
CURRENT ASSETS: |
|
|
|
|
|
|
|
|
Cash and cash equivalents |
$ |
|
|
|
$ |
|
|
|
Accounts receivable, net of allowance for doubtful accounts |
|
|
|
|
|
|
|
|
Inventories, net |
|
|
|
|
|
|
|
|
Prepaid expenses |
|
|
|
|
|
|
|
|
Other current assets(1) |
|
|
|
|
|
|
|
|
Total Current Assets |
|
|
|
|
|
|
|
|
Property, plant and equipment, net |
|
|
|
|
|
|
|
|
Deposits on equipment |
|
|
|
|
|
|
|
|
Operating lease right of use assets |
|
|
|
|
|
— |
|
|
Other assets |
|
|
|
|
|
|
|
|
Total Assets |
$ |
|
|
|
$ |
|
|
|
LIABILITIES AND STOCKHOLDERS' EQUITY |
|
|
|
|
|
|
|
|
CURRENT LIABILITIES: |
|
|
|
|
|
|
|
|
Accounts payable |
$ |
|
|
|
$ |
|
|
|
Accrued expenses(1) |
|
|
|
|
|
|
|
|
Current operating lease liabilities |
|
|
|
|
|
— |
|
|
Total Current Liabilities |
$ |
|
|
|
$ |
|
|
|
Long term debt |
|
|
|
|
|
— |
|
|
Long term operating lease liabilities |
|
|
|
|
|
— |
|
|
Other liabilities |
|
— |
|
|
|
|
|
|
Total Liabilities |
$ |
|
|
|
$ |
|
|
|
STOCKHOLDERS' EQUITY: |
|
|
|
|
|
|
|
|
Common stock — voting, $ |
|
|
|
|
|
|
|
|
Additional paid-in capital |
|
|
|
|
|
|
|
|
Accumulated deficit |
|
( |
) |
|
|
( |
) |
|
Accumulated other comprehensive loss |
|
( |
) |
|
|
( |
) |
|
Treasury stock, at cost — |
|
( |
) |
|
|
( |
) |
|
Total Stockholders' Equity |
|
|
|
|
|
|
|
|
Total Liabilities and Stockholders' Equity |
$ |
|
|
|
$ |
|
|
See accompanying notes to the consolidated financial statements.
|
|
(1) |
|
|
|
(1) |
45
FRESHPET, INC. AND SUBSIDIARIES
CONSOLIDATED STATEMENTS OF OPERATIONS AND COMPREHENSIVE LOSS
|
|
|
December 31, |
|
|||||||||
|
|
|
2019 |
|
|
2018 |
|
|
2017 |
|
|||
|
|
|
|
|
|
|
|
|
|
|
|
|
|
|
NET SALES |
|
$ |
|
|
|
$ |
|
|
|
$ |
|
|
|
COST OF GOODS SOLD |
|
|
|
|
|
|
|
|
|
|
|
|
|
GROSS PROFIT |
|
|
|
|
|
|
|
|
|
|
|
|
|
SELLING, GENERAL, AND ADMINISTRATIVE EXPENSES |
|
|
|
|
|
|
|
|
|
|
|
|
|
LOSS FROM OPERATIONS |
|
|
( |
) |
|
|
( |
) |
|
|
( |
) |
|
OTHER INCOME/(EXPENSES): |
|
|
|
|
|
|
|
|
|
|
|
|
|
Other Income/(Expenses), net |
|
|
|
|
|
|
( |
) |
|
|
( |
) |
|
Interest Expense |
|
|
( |
) |
|
|
( |
) |
|
|
( |
) |
|
|
|
|
( |
) |
|
|
( |
) |
|
|
( |
) |
|
LOSS BEFORE INCOME TAXES |
|
|
( |
) |
|
|
( |
) |
|
|
( |
) |
|
INCOME TAX EXPENSE |
|
|
|
|
|
|
|
|
|
|
|
|
|
LOSS ATTRIBUTABLE TO COMMON STOCKHOLDERS |
|
$ |
( |
) |
|
$ |
( |
) |
|
$ |
( |
) |
|
OTHER COMPREHENSIVE INCOME (LOSS): |
|
|
|
|
|
|
|
|
|
|
|
|
|
Change in foreign currency translation |
|
$ |
( |
) |
|
$ |
( |
) |
|
$ |
|
|
|
TOTAL OTHER COMPREHENSIVE (LOSS) |
|
|
( |
) |
|
|
( |
) |
|
|
|
|
|
TOTAL COMPREHENSIVE LOSS |
|
$ |
( |
) |
|
$ |
( |
) |
|
$ |
( |
) |
|
NET LOSS PER SHARE ATTRIBUTABLE TO COMMON STOCKHOLDERS |
|
|
|
|
|
|
|
|
|
|
|
|
|
-BASIC |
|
$ |
( |
) |
|
$ |
( |
) |
|
$ |
( |
) |
|
-DILUTED |
|
$ |
( |
) |
|
$ |
( |
) |
|
$ |
( |
) |
|
WEIGHTED AVERAGE SHARES OF COMMON STOCK OUTSTANDING USED IN COMPUTING NET INCOME (LOSS) PER SHARE ATTRIBUTABLE TO COMMON STOCKHOLDERS |
|
|
|
|
|
|
|
|
|
|
|
|
|
-BASIC |
|
|
|
|
|
|
|
|
|
|
|
|
|
-DILUTED |
|
|
|
|
|
|
|
|
|
|
|
|
See accompanying notes to the consolidated financial statements.
46
FRESHPET, INC. AND SUBSIDIARIES
CONSOLIDATED STATEMENTS OF CHANGES IN STOCKHOLDERS’ EQUITY
|
|
Common Stock - Voting |
|
|
|
|
|
|
|
|
|
|
|
|
|
|
Treasury Stock |
|
|
|
|
|
||||||||||
|
|
Number of Shares Issued |
|
|
Amount |
|
|
Additional Paid-in Capital |
|
|
Accumulated Deficit |
|
|
Accumulated Other Comprehensive Income |
|
|
Number of Shares |
|
|
Amount |
|
|
Total Stockholders' Equity |
|
||||||||
|
BALANCES, DECEMBER 31, 2016 |
|
|
|
|
$ |
|
|
|
$ |
|
|
|
$ |
( |
) |
|
$ |
— |
|
|
|
— |
|
|
$ |
— |
|
|
$ |
|
|
|
Exercise of options to purchase common stock |
|
|
|
|
|
|
|
|
|
|
|
|
|
— |
|
|
|
— |
|
|
|
— |
|
|
|
— |
|
|
|
|
|
|
Issuance of restricted stock units |
|
|
|
|
|
|
|
|
|
( |
) |
|
|
— |
|
|
|
— |
|
|
|
— |
|
|
|
— |
|
|
|
— |
|
|
Conversion of warrants to common stock |
|
|
|
|
|
|
|
|
|
|
|
|
|
— |
|
|
|
— |
|
|
|
— |
|
|
|
— |
|
|
|
|
|
|
Share-based compensation expense |
|
— |
|
|
|
— |
|
|
|
|
|
|
|
— |
|
|
|
— |
|
|
|
— |
|
|
|
— |
|
|
|
|
|
|
Foreign Currency Translation |
|
— |
|
|
|
— |
|
|
|
— |
|
|
|
— |
|
|
|
|
|
|
|
|
|
|
|
|
|
|
|
|
|
|
Net loss |
|
— |
|
|
|
— |
|
|
|
— |
|
|
|
( |
) |
|
|
— |
|
|
|
— |
|
|
|
— |
|
|
|
( |
) |
|
BALANCES, December 31, 2017 |
|
|
|
|
|
|
|
|
|
|
|
|
|
( |
) |
|
|
|
|
|
|
— |
|
|
|
— |
|
|
$ |
|
|
|
Exercise of options to purchase common stock |
|
|
|
|
|
|
|
|
|
|
|
|
|
— |
|
|
|
— |
|
|
|
— |
|
|
|
— |
|
|
|
|
|
|
Issuance of restricted stock units |
|
|
|
|
|
|
|
|
|
( |
) |
|
|
— |
|
|
|
— |
|
|
|
— |
|
|
|
( |
) |
|
|
( |
) |
|
Share-based compensation expense |
|
— |
|
|
|
— |
|
|
|
|
|
|
|
— |
|
|
|
— |
|
|
|
— |
|
|
|
— |
|
|
|
|
|
|
Foreign Currency Translation |
|
— |
|
|
|
— |
|
|
|
— |
|
|
|
— |
|
|
|
( |
) |
|
|
— |
|
|
|
— |
|
|
|
( |
) |
|
Net loss |
|
— |
|
|
|
— |
|
|
|
— |
|
|
|
( |
) |
|
|
— |
|
|
|
— |
|
|
|
— |
|
|
|
( |
) |
|
BALANCES, December 31, 2018 |
|
|
|
|
$ |
|
|
|
$ |
|
|
|
$ |
( |
) |
|
$ |
( |
) |
|
|
|
|
|
$ |
( |
) |
|
$ |
|
|
|
Exercise of options to purchase common stock |
|
|
|
|
|
|
|
|
|
|
|
|
|
— |
|
|
|
— |
|
|
|
— |
|
|
|
— |
|
|
|
|
|
|
Issuance of restricted stock units |
|
|
|
|
|
|
|
|
|
( |
) |
|
|
— |
|
|
|
— |
|
|
|
— |
|
|
|
— |
|
|
|
( |
) |
|
Share-based compensation expense |
|
— |
|
|
|
— |
|
|
|
|
|
|
|
— |
|
|
|
— |
|
|
|
— |
|
|
|
— |
|
|
|
|
|
|
Foreign Currency Translation |
|
— |
|
|
|
— |
|
|
|
— |
|
|
|
— |
|
|
|
( |
) |
|
|
— |
|
|
|
— |
|
|
|
( |
) |
|
Net loss |
|
— |
|
|
|
— |
|
|
|
— |
|
|
|
( |
) |
|
|
— |
|
|
|
— |
|
|
|
— |
|
|
|
( |
) |
|
BALANCES, December 31, 2019 |
|
|
|
|
$ |
|
|
|
$ |
|
|
|
$ |
( |
) |
|
$ |
( |
) |
|
|
|
|
|
$ |
( |
) |
|
$ |
|
|
|
|
|
|
|
|
|
|
|
|
|
|
|
|
|
|
|
|
|
|
|
|
|
|
|
|
|
|
|
|
|
|
|
See accompanying notes to the consolidated financial statements.
47
FRESHPET, INC. AND SUBSIDIARIES
CONSOLIDATED STATEMENT OF CASH FLOWS
|
|
For the Twelve Months Ended |
|
|||||||||
|
|
December 31, |
|
|||||||||
|
|
|
2019 |
|
|
|
2018 |
|
|
|
2017 |
|
|
CASH FLOWS FROM OPERATING ACTIVITIES: |
|
|
|
|
|
|
|
|
|
|
|
|
Net loss |
$ |
( |
) |
|
$ |
( |
) |
|
$ |
( |
) |
|
Adjustments to reconcile net loss to net cash flows provided by operating activities: |
|
|
|
|
|
|
|
|
|
|
|
|
Provision for loss/(gains) on accounts receivable |
|
|
|
|
|
( |
) |
|
|
|
|
|
Loss on disposal of equipment |
|
|
|
|
|
|
|
|
|
|
|
|
Share-based compensation |
|
|
|
|
|
|
|
|
|
|
|
|
Inventory obsolescence |
|
|
|
|
|
|
|
|
|
|
|
|
Depreciation and amortization |
|
|
|
|
|
|
|
|
|
|
|
|
Amortization of deferred financing costs and loan discount |
|
|
|
|
|
|
|
|
|
|
|
|
Changes in operating assets and liabilities: |
|
|
|
|
|
|
|
|
|
|
|
|
Accounts receivable |
|
( |
) |
|
|
|
|
|
|
( |
) |
|
Inventories |
|
( |
) |
|
|
|
|
|
|
( |
) |
|
Prepaid expenses and other current assets |
|
( |
) |
|
|
|
|
|
|
( |
) |
|
Operating lease right of use |
|
|
|
|
|
— |
|
|
|
— |
|
|
Other assets |
|
|
|
|
|
( |
) |
|
|
( |
) |
|
Accounts payable |
|
|
|
|
|
|
|
|
|
|
|
|
Accrued expenses |
|
|
|
|
|
|
|
|
|
|
|
|
Other lease liabilities |
|
( |
) |
|
|
( |
) |
|
|
|
|
|
Net cash flows provided by operating activities |
|
|
|
|
|
|
|
|
|
|
|
|
CASH FLOWS FROM INVESTING ACTIVITIES: |
|
|
|
|
|
|
|
|
|
|
|
|
Acquisitions of property, plant and equipment, software and deposits on equipment |
|
( |
) |
|
|
( |
) |
|
|
( |
) |
|
Net cash flows used in investing activities |
|
( |
) |
|
|
( |
) |
|
|
( |
) |
|
CASH FLOWS FROM FINANCING ACTIVITIES: |
|
|
|
|
|
|
|
|
|
|
|
|
Debt issuance costs |
|
— |
|
|
|
— |
|
|
|
( |
) |
|
Proceeds from exercise of options to purchase common stock |
|
|
|
|
|
|
|
|
|
|
|
|
Tax withholdings related to net shares settlements of restricted stock units |
|
( |
) |
|
|
( |
) |
|
|
— |
|
|
Proceeds from borrowings under Credit Facilities |
|
|
|
|
|
|
|
|
|
|
|
|
Repayment of borrowings under Credit Facilities |
|
( |
) |
|
|
( |
) |
|
|
( |
) |
|
Financing fees paid in connection with borrowings |
|
( |
) |
|
|
— |
|
|
|
— |
|
|
Net cash flows provided by financing activities |
|
|
|
|
|
|
|
|
|
|
|
|
NET CHANGE IN CASH AND CASH EQUIVALENTS |
|
|
|
|
|
|
|
|
|
( |
) |
|
CASH AND CASH EQUIVALENTS, BEGINNING OF YEAR |
|
|
|
|
|
|
|
|
|
|
|
|
CASH AND CASH EQUIVALENTS, END OF PERIOD |
$ |
|
|
|
$ |
|
|
|
$ |
|
|
|
SUPPLEMENTAL CASH FLOW INFORMATION: |
|
|
|
|
|
|
|
|
|
|
|
|
Taxes paid |
$ |
|
|
|
|
|
|
|
|
|
|
|
Interest paid |
$ |
|
|
|
$ |
|
|
|
$ |
|
|
|
NON-CASH FINANCING AND INVESTING ACTIVITIES: |
|
|
|
|
|
|
|
|
|
|
|
|
Property, plant and equipment purchases in accounts payable |
$ |
|
|
|
$ |
|
|
|
$ |
|
|
|
Non-cash acquisitions of property, plant and equipment |
$ |
|
|
|
$ |
— |
|
|
$ |
— |
|
|
Conversion of warrants to common stock |
$ |
— |
|
|
$ |
— |
|
|
$ |
|
|
See accompanying notes to the consolidated financial statements.
48
FRESHPET, INC. AND SUBSIDIARIES
NOTES TO CONSOLIDATED FINANCIAL STATEMENTS
Note 1 – Nature of the Business and Summary of Significant Accounting Policies:
Nature of the Business – Freshpet, Inc. (hereafter referred to as “Freshpet” or the “Company”), a Delaware corporation, manufactures and markets natural fresh, refrigerated meals and treats for dogs and cats. The Company’s products are distributed throughout the United States and other international markets into major retail classes including Grocery and Mass (which includes club), and Online, as well as Pet Specialty, and Natural retail.
Basis of Presentation – The accompanying consolidated financial statements have been prepared in accordance with accounting principles generally accepted in the U.S. (“U.S. GAAP”).
Principles of Consolidation – The financial statements include the accounts of the Company as well as the Company’s wholly-owned subsidiaries. All intercompany accounts and transactions have been eliminated in consolidation.
Segments – The Company operates as a operating segment reporting to its chief operating decision maker.
Estimates and Uncertainties – The preparation of financial statements in conformity with U.S. GAAP requires management to make estimates and assumptions that affect the reported amounts of assets and liabilities and disclosure of contingent assets and liabilities at the date of the financial statements, and the reported amounts of revenues and expenses during the reporting period. Estimates are used in determining, among other items, trade incentives, share-based compensation and useful lives for long-lived assets. Actual results, as determined at a later date, could differ from those estimates.
Cash and Cash Equivalents – The Company at times considers money market funds and all other highly liquid debt instruments purchased with an original maturity of three months or less to be cash equivalents.
Accounts Receivable – The Company records trade accounts receivable at net realizable value. This value includes an appropriate allowance for estimated uncollectible accounts. On a periodic basis, the Company evaluates its accounts receivable and establishes an allowance for doubtful accounts based on its history of write-offs and collections and current credit conditions. Accounts receivable are written off when management deems them to be uncollectible.
Inventories – Inventories are stated at the lower of cost or market, using the first-in, first-out method. When necessary, the Company provides allowances to adjust the carrying value of its inventories to the lower of cost or net realizable value, including any costs to sell or dispose and consideration for obsolescence, excessive inventory levels, product deterioration and other factors in evaluating net realizable value.
Property, Plant and Equipment – Property, plant and equipment are recorded at cost.
Long-Lived Assets – The Company evaluates all long-lived assets for impairment. Long-lived assets are evaluated for impairment whenever events or changes in circumstances indicate the carrying value of an asset may not be recoverable. Recoverability of assets to be held and used is measured by a comparison of the carrying amount of an asset to estimated undiscounted future net cash flows expected to be generated by the asset. If the carrying amount of an asset exceeds its estimated undiscounted future net cash flows, an impairment charge is recognized by the amount by which the carrying amount of the asset exceeds the fair value of the asset. Recoverability of assets held for sale is measured by a comparison of the carrying amount of an asset or asset group to their fair value less estimated costs to sell. Estimating future cash flows and calculating fair value of assets requires significant estimates and assumptions by management. If the carrying amount is not fully recoverable, an impairment loss is recognized to reduce the carry amount to fair value and is charged to expense in the period of impairment.
49
FRESHPET, INC. AND SUBSIDIARIES
NOTES TO CONSOLIDATED FINANCIAL STATEMENTS
Income Taxes – The Company provides for deferred income taxes for temporary differences between financial and income tax reporting, principally net operating loss carryforwards, depreciation, and share-based compensation. Deferred tax assets and liabilities are measured using enacted tax rates in effect for the years in which those temporary differences are expected to be recovered or settled.
A valuation allowance is appropriate when management believes it is more likely than not, the deferred tax asset will not be realized. At December 31, 2019, and 2018, the Company determined that a valuation allowance of
Treasury Stock – The Company may purchase or withhold shares of stock to satisfy statutory employee tax obligations upon the issuance of restricted stock units to employees. Such repurchased or withheld shares are treated as treasury stock and carried at cost on the Consolidated Balance Sheet in Stockholders’ equity. During the twelve months ended December 31, 2018, the Company accumulated $
Revenue Recognition and Incentives – Revenues primarily consist of the sale of pet food products that are sold to retailers through broker and distributor arrangements. These revenue contracts generally have single performance obligations. Revenue, which includes shipping and handling charges billed to the customer, is reported net of applicable trade incentives and allowances. Amounts billed and due from our customers are classified as receivables and require payment on a short-term basis and, therefore, we do not have any significant financing components.
Revenue from product sales is recognized when obligations under the terms of the contract with the customer are satisfied, which occurs once control is transferred upon delivery to the customer. Revenue is measured as the amount of consideration the Company expects to receive in exchange for transferring goods.
The amount of consideration the Company receives and revenue the Company recognizes varies with changes in trade incentives the Company offers to its customers and their consumers. Trade incentives consists primarily of customer pricing allowances and merchandising funds, and consumer coupons are offered through various programs to customers and consumers. Estimates of trade promotion expense and coupon redemption costs are based upon programs offered, timing of those offers, estimated redemption/usage rates from historical performance, management’s experience and current economic trends.
Sales taxes and other similar taxes are excluded from revenue. Costs associated with shipping and handling activities, such as merchandising, are included in SG&A expenses as revenue is recognized.
There were
Information about the Company’s net sales by class of retailer is as follows:
|
|
|
|
|
|
|
|
|
|
|
|
|
|
|
|
|
Twelve Months Ended |
|
|||||||||
|
|
|
December 31, |
|
|||||||||
|
|
|
2019 |
|
|
2018 |
|
|
2017 |
|
|||
|
Grocery (including Online), Mass and Club |
|
$ |
|
|
|
$ |
|
|
|
$ |
|
|
|
Pet Specialty and Natural |
|
|
|
|
|
$ |
|
|
|
|
|
|
|
Net Sales |
|
$ |
|
|
|
$ |
|
|
|
$ |
|
|
Advertising – Advertising costs are expensed when incurred, with the exception of production costs which are expensed the first time advertising takes place. Advertising costs, consisting primarily of media ads, were $
50
FRESHPET, INC. AND SUBSIDIARIES
NOTES TO CONSOLIDATED FINANCIAL STATEMENTS
Research & Development – Research and development costs consist of expenses to develop and test new products. The costs are expensed as incurred. Research and development costs totaled $
Share-based Compensation – The Company recognizes share-based compensation based on the value of the portion of share-based payment awards that is ultimately expected to vest during the period. The Company estimates grant date fair value of its options using the Black-Scholes Merton option-pricing model. Share awards are amortized under the straight-line method over the requisite service period of the entire award. The Company accounts for forfeitures as they occur.
Fair Value of Financial Instruments – Financial Accounting Standards Board (“FASB”) guidance specifies a hierarchy of valuation techniques based on whether the inputs to those valuation techniques are observable or unobservable. Observable inputs reflect market data obtained from independent sources, while unobservable inputs reflect market assumptions. The hierarchy gives the highest priority to unadjusted quoted prices in active markets for identical assets or liabilities (Level 1 measurement) and the lowest priority to unobservable inputs (Level 3 measurement).
The three levels of the fair value hierarchy are as follows:
|
|
• |
Level 1 – Unadjusted quoted prices in active markets for identical assets or liabilities that the reporting entity has the ability to access at the measurement date. Level 1 primarily consists of financial instruments whose value is based on quoted market prices such as exchange-traded instruments and listed equities. |
|
|
• |
Level 2 – Inputs other than quoted prices included within Level 1 that are observable for the asset or liability, either directly or indirectly (e.g., quoted prices of similar assets or liabilities in active markets, or quoted prices for identical or similar assets or liabilities in markets that are not active). Level 2 includes financial instruments that are valued using models or other valuation methodologies. |
|
|
• |
Level 3 – Unobservable inputs for the asset or liability. Financial instruments are considered Level 3 when their fair values are determined using pricing models, discounted cash flows or similar techniques and at least one significant model assumption or input is unobservable. |
The carrying amounts reported in the balance sheets for cash and cash equivalents, other receivables, accounts payable and accrued expenses approximate their fair value based on the short-term maturity of these instruments. The warrant liability is recorded at fair value with changes in fair value reflected in the statement of operations and comprehensive loss.
As of December 31, 2019, the Company only maintained Level 1 assets and liabilities.
Note 2 – Recently Issued Accounting Standards:
Recently Adopted Standards
In February 2016, the Financial Accounting Standards Board (FASB) issued Accounting Standards Update No. 2016-02 (Topic 842) "Leases." Topic 842 supersedes the lease requirements in Accounting Standards Codification (ASC) Topic 840, "Leases." Under Topic 842, lessees are required to recognize assets and liabilities on the balance sheet for most leases and provide enhanced disclosures. Leases will continue to be classified as either finance or operating. In July 2018, the FASB issued ASU 2018-11, “Leases (ASC 842): Targeted Improvements,” which provides companies an optional adoption method to ASU 2016-02 whereby a company does not have to adjust comparative period financial statements for the new standard.
The reported results as of December 31, 2019 reflect the application of ASC 842, while the comparative information has not been restated and continues to be reported under the related lease accounting standards in effect for those periods. The adoption of this update represents a change in accounting principle and resulted in the recognition of right-of-use ("ROU") assets and operating lease liabilities. We elected the package of practical expedients, which permits us not to reassess our prior conclusions about lease identification, lease classification and initial direct costs incurred. We also elected the practical expedient to combine lease and non-lease components when determining the ROU asset and lease liability, as well as the practical expedient to exclude leases with an initial term of 12 months or less. The primary effect of
51
FRESHPET, INC. AND SUBSIDIARIES
NOTES TO CONSOLIDATED FINANCIAL STATEMENTS
adopting this standard relates to the recognition of our operating leases on our Consolidated Balance Sheets and providing additional disclosures about our leasing activities.
The Company is a lessee in several noncancellable operating leases, primarily for office and warehouse space, as well as office equipment.
The Company determines if an arrangement is or contains a lease at contract inception. The Company recognizes a ROU asset and a lease liability at the lease commencement date. The operating lease liability is initially and subsequently measured at the present value of the unpaid lease payments at the lease commencement date.
Key estimates and judgments include how the Company determines (1) the discount rate it uses to discount the unpaid lease payments to present value, (2) lease term and (3) lease payments.
|
|
• |
ASC 842 requires a lessee to discount its unpaid lease payments using the interest rate implicit in the lease or, if that rate cannot be readily determined, its incremental borrowing rate. Generally, the Company cannot determine the interest rate implicit in the lease because it does not have access to the lessor’s estimated residual value or the amount of the lessor’s deferred initial direct costs. Therefore, at the date of adoption, we used our incremental borrowing rate based on the information available at January 1, 2019. |
|
|
• |
The lease term for all of the Company’s leases includes the noncancellable period of the lease plus any additional periods covered by either a Company option to extend (or not to terminate) the lease that the Company is reasonably certain to exercise. |
|
|
• |
Lease payments included in the measurement of the lease liability comprise of fixed payments based on the terms of the lease. Certain arrangements have free rent periods or escalating rent payment provisions. We recognize rent expense on a straight-line basis over the lease term, including any periods of free rent. |
ROU assets are initially and subsequently measured at cost, which comprises the initial amount of the lease liability adjusted for lease payments made at or before the lease commencement date, plus any initial direct costs incurred less any lease incentives received.
The ROU asset is subsequently measured throughout the lease term at the carrying amount of the lease liability, plus initial direct costs, plus (minus) any prepaid (accrued) lease payments, less the unamortized balance of lease incentives received. Lease expense for lease payments is recognized on a straight-line basis over the lease term.
ROU assets for operating leases are periodically reviewed for impairment losses. The Company uses the long-lived assets impairment guidance in “ASC Subtopic 360-10, Property, Plant, and Equipment – Overall”, to determine whether a ROU asset is impaired, and if so, the amount of the impairment loss to recognize.
The Company monitors for events or changes in circumstances that require a reassessment of one of its leases. When a reassessment results in the remeasurement of a lease liability, a corresponding adjustment is made to the carrying amount of the corresponding ROU asset unless doing so would reduce the carrying amount of the ROU asset to an amount less than zero.
Operating lease ROU assets are presented as operating lease right of use assets on the consolidated balance sheet. The current portion of operating lease liabilities and the long-term portion are presented separately as current and long term operating lease liabilities on the consolidated balance sheet.
Standards Effective in Future Years
We consider the applicability and impact of all Accounting Standards Updates (ASUs) issued by the Financial Accounting Standards Board (FASB). In 2016, the FASB issued guidance that changes the impairment model used to measure credit losses for most financial assets. For our trade, certain other receivables and certain other financial instruments, we will be required to use a new forward-looking expected credit loss model that will replace the existing incurred credit loss model, which would generally result in earlier recognition of allowances for credit losses. We will adopt the guidance when it becomes effective in the first quarter of 2020. We are currently evaluating the impact of this guidance and do not expect it will have a material impact on our financial statements or disclosures.
52
FRESHPET, INC. AND SUBSIDIARIES
NOTES TO CONSOLIDATED FINANCIAL STATEMENTS
Note 3 – Inventories:
Inventories are summarized as follows:
|
|
|
December 31, |
|
|||||
|
|
|
2019 |
|
|
2018 |
|
||
|
Raw Materials and Work in Process |
|
$ |
|
|
|
$ |
|
|
|
Packaging Components Material |
|
|
|
|
|
|
|
|
|
Finished Goods |
|
|
|
|
|
|
|
|
|
|
|
|
|
|
|
|
|
|
|
Reserve for Obsolete Inventory |
|
|
( |
) |
|
|
( |
) |
|
|
|
$ |
|
|
|
$ |
|
|
Note 4 – Property, Plant and Equipment:
|
|
|
December 31, |
|
|||||
|
|
|
2019 |
|
|
2018 |
|
||
|
Refrigeration Equipment |
|
$ |
|
|
|
$ |
|
|
|
Machinery and Equipment |
|
|
|
|
|
|
|
|
|
Building, Land, and Improvements |
|
|
|
|
|
|
|
|
|
Furniture and Office Equipment |
|
|
|
|
|
|
|
|
|
Leasehold Improvements |
|
|
|
|
|
|
|
|
|
Automotive Equipment |
|
|
|
|
|
|
|
|
|
Construction in Progress |
|
|
|
|
|
|
|
|
|
|
|
|
|
|
|
|
|
|
|
Less: Accumulated Depreciation |
|
|
( |
) |
|
|
( |
) |
|
|
|
$ |
|
|
|
$ |
|
|
|
|
|
|
|
|
|
|
|
|
Depreciation and amortization expense related to property, plant and equipment totaled approximately $
Note 5 – Income Taxes:
A summary of income taxes as follows:
|
|
|
December 31, |
|
|||||||||
|
|
|
2019 |
|
|
2018 |
|
|
2017 |
|
|||
|
Current: |
|
|
|
|
|
|
|
|
|
|
|
|
|
Federal |
$ |
— |
|
|
— |
|
|
— |
|
|||
|
State |
|
|
|
|
|
|
|
|
|
|
|
|
|
International |
|
— |
|
|
— |
|
|
— |
|
|||
|
|
|
$ |
|
|
|
$ |
|
|
|
$ |
|
|
The provisions for income taxes do not bear a normal relationship to loss before income taxes primarily as a result of the valuation allowance on deferred tax assets.
53
FRESHPET, INC. AND SUBSIDIARIES
NOTES TO CONSOLIDATED FINANCIAL STATEMENTS
The reconciliation of the statutory federal income tax rate to the Company’s effective tax is presented below:
|
|
|
Year Ended December 31, |
|
|||||||||
|
|
|
2019 |
|
|
2018 |
|
|
2017 |
|
|||
|
Tax at federal statutory rate |
|
|
|
% |
|
|
|
% |
|
|
|
% |
|
State taxes, net of federal |
|
|
|
% |
|
|
( |
) |
|
|
( |
) |
|
Permanent items |
|
|
|
% |
|
|
( |
) |
|
|
( |
) |
|
Other |
|
|
|
% |
|
|
( |
) |
|
|
( |
) |
|
State rate change |
|
|
( |
% |
|
|
|
|
|
|
— |
|
|
Valuation allowance |
|
|
( |
% |
|
|
( |
) |
|
|
|
|
|
Effective tax rate |
|
|
( |
)% |
|
|
( |
)% |
|
|
( |
)% |
In assessing the realizability of the net deferred tax assets, the Company considers all relevant positive and negative evidence to determine whether it is more likely than not that some portion or all of the deferred income tax assets will not be realized. The realization of the gross deferred tax assets is dependent on several factors, including the generation of sufficient taxable income prior to the expiration of the net operating loss carryforwards. The Company believes that it is more likely than not that the Company’s deferred income tax assets will not be realized. The Company has experienced taxable losses from inception. As such, there is a full valuation allowance against the net deferred tax assets as of December 31, 2019 and 2018.
The tax effects of temporary differences that give rise to significant portions of the deferred tax assets and deferred tax liabilities are as follows:
|
|
|
December 31, |
|
|||||
|
|
|
2019 |
|
|
2018 |
|
||
|
Net operating loss |
|
|
|
|
|
|
|
|
|
Stock option expense |
|
|
|
|
|
|
|
|
|
Property and equipment |
|
|
( |
) |
|
|
( |
) |
|
Other |
|
|
|
|
|
|
|
|
|
Less: Valuation allowance |
|
|
( |
) |
|
|
( |
) |
|
Net deferred tax |
|
|
— |
|
|
|
— |
|
|
|
|
|
|
|
|
|
|
|
At December 31, 2019, the Company had federal net operating loss (“NOL”) carryforwards of $
Entities are also required to evaluate, measure, recognize and disclose any uncertain income tax provisions taken on their income tax returns. The Company has analyzed its tax positions and has concluded that as of December 31, 2018, there were
54
FRESHPET, INC. AND SUBSIDIARIES
NOTES TO CONSOLIDATED FINANCIAL STATEMENTS
Net deferred tax assets and liabilities are summarized as follows:
|
|
|
December 31, |
|
|||||
|
|
|
2019 |
|
|
2018 |
|
||
|
Total deferred tax assets |
|
$ |
|
|
|
$ |
|
|
|
Total deferred tax liabilities |
|
|
( |
) |
|
|
( |
) |
|
Valuation allowance |
|
|
( |
) |
|
|
( |
) |
|
Net deferred income tax assets |
|
$ |
— |
|
|
$ |
— |
|
On December 22, 2017, the Tax Cuts and Jobs Act of 2017 (the “2017 Tax Act”) was signed into law making significant changes to the Internal Revenue Code. Changes included, but were not limited to, a federal corporate tax rate decrease from
The Company considered the impact of the disallowance of certain incentive based compensation tax deductibility under Internal Revenue Code Section 162(m); however, to the extent an adjustment to the deferred tax asset is required the impact will be offset by a corresponding adjustment to the valuation allowance.
Note 6 – Accrued Expenses:
|
|
|
December 31, |
|
|||||
|
|
|
2019 |
|
|
2018 |
|
||
|
Legal Contingency (1) |
|
|
|
|
|
|
— |
|
|
Accrued Compensation and Employee Related Costs |
|
|
|
|
|
|
|
|
|
Accrued Chiller Cost |
|
|
|
|
|
|
|
|
|
Accrued Customer Consideration |
|
|
|
|
|
|
|
|
|
Accrued Freight |
|
|
|
|
|
|
|
|
|
Accrued Production Expenses |
|
|
|
|
|
|
|
|
|
Accrued Marketing |
|
|
|
|
|
|
|
|
|
Other Accrued Expenses |
|
|
|
|
|
|
|
|
|
|
|
$ |
|
|
|
$ |
|
|
|
|
(1) |
See Note 8 for additional information. |
Note 7 – Debt:
On May 15, 2019, the Company entered into the Fourth Amended and Restated Loan and Security Agreement (as amended, the “New Loan Agreement”), which amended and restated in full the Company’s Third Amended and Restated Loan and Security Agreement, dated as of September 21, 2017. The New Loan Agreement provides for a $
The New Credit Facility will mature on
55
FRESHPET, INC. AND SUBSIDIARIES
NOTES TO CONSOLIDATED FINANCIAL STATEMENTS
Borrowings under the New Credit Facility are secured by substantially all of the Company’s and certain of its subsidiaries’ assets. The New Loan Agreement requires compliance with various covenants customary for agreements of this type, including financial covenants and negative covenants that limit, among other things, the Company’s ability to incur additional debt, create or incur liens, engage in mergers or consolidations, sell, transfer or otherwise dispose of assets, make voluntary prepayments to subordinated debt, permit a change of control, pay dividends or distributions, make investments, and enter into certain transactions with affiliates. The New Loan Agreement also includes events of default customary for agreements of this type.
Net borrowings under our credit facilities totaled $
Interest expense and fees totaled $
The Company incurred amortization of debt issuance cost of $
Note 8 – Commitments and Contingencies:
Commitments – The Company’s obligations include leases for office space under non-cancelable operating leases, manufacturing processing and utility servicing that expire at various dates through January 1, 2033.
Leases:
We have various noncancellable lease agreements for office and warehouse space, as well as office equipment, with original remaining lease terms of
Weighted-average remaining lease term (in years) and discount rate related to operating leases were as follows:
|
Weighted-average remaining lease term |
|
|
|
|
|
Weighted-average discount rate |
|
|
|
% |
As most of our leases do not provide an implicit rate, we use our incremental borrowing rate based on the information available at the date of adoption to determine the present value of lease payments.
Costs related to lease obligations for the years ended December 31, 2019, 2018 and 2017 were as follows:
|
|
|
For the Twelve Months Ended |
|
|
|
|
|
December 31, |
|
|
|
|
|
2019 |
|
|
|
Operating lease cost |
|
$ |
|
|
56
FRESHPET, INC. AND SUBSIDIARIES
NOTES TO CONSOLIDATED FINANCIAL STATEMENTS
Supplemental cash flow information and non-cash activity relating to operating leases are as follows:
|
|
|
December 31, 2019 |
|
|
|
Operating cash flow information: |
|
|
|
|
|
Cash paid for amounts included in the measurement of lease liabilities |
|
$ |
|
|
|
Right-of-use assets obtained in exchange for lease obligations |
|
|
|
|
As of December 31, 2019, future minimum payments due under lease obligations for five years were as follows:
|
|
|
December 31, 2019 |
|
|
|
|
|
|
|
|
|
2020 |
|
|
|
|
|
2021 |
|
|
|
|
|
2022 |
|
|
|
|
|
2023 |
|
|
|
|
|
2024 and beyond |
|
|
|
|
|
Total lease payments |
|
|
|
|
|
Less: Imputed interest |
|
|
( |
) |
|
Present value of lease liabilities |
|
$ |
|
|
|
|
|
|
|
|
Rent expense for operating leases, in accordance with the leasing standard was $
Future minimum lease payments due under lease obligations as of December 31, 2018, in accordance with the superseded leasing standard, are as follows:
|
|
|
December 31, |
|
|
|
|
|
2018 |
|
|
|
|
|
|
|
|
|
2019 |
|
|
|
|
|
2020 |
|
|
|
|
|
2021 |
|
|
|
|
|
2022 |
|
|
|
|
|
2023 |
|
|
|
|
|
2024 and thereafter |
|
|
|
|
|
|
|
$ |
|
|
|
|
|
|
|
|
57
FRESHPET, INC. AND SUBSIDIARIES
NOTES TO CONSOLIDATED FINANCIAL STATEMENTS
As of December 31, 2019, future minimum payments due under manufacturing and service obligations for five years were as follows:
|
Manufacturing and Servicing Obligations |
|
December 31, |
|
|
|
|
|
2019 |
|
|
|
|
|
|
|
|
|
2020 |
|
|
|
|
|
2021 |
|
|
|
|
|
2022 |
|
|
|
|
|
2023 |
|
|
|
|
|
2024 |
|
|
|
|
|
2025 and thereafter |
|
|
|
|
|
|
|
$ |
|
|
|
|
|
|
|
|
|
|
|
|
|
|
Manufacturing and servicing obligations in manufacturing process obligations and utility servicing obligations.
Certain of the Company’s executives are covered by employment contracts requiring the Company to pay severance in the event of certain terminations.
|
|
|
|
Legal Obligations:
A securities lawsuit, Curran v. Freshpet, Inc. et al, Docket No. 2:16-cv-02263, was instituted April 21, 2016 in the United States District Court for the District of New Jersey against us and certain of our current and former executive officers and directors on behalf of certain purchasers of our common stock. We were served with a copy of the complaint in June 2016. The plaintiffs have sought to recover damages for investors under the federal securities laws. The parties filed briefing on class certification and engaged in fact and expert discovery. The parties then entered into mediation and settlement discussions, after which the parties entered into stipulation of settlement to amicably resolve the dispute. All parties to the agreement believed that it was in their respective best interests to settle the dispute in order to avoid the risk, uncertainty, and costs associated with litigation. Under the settlement, Freshpet and its related defendants agreed to settle the litigation for $
58
FRESHPET, INC. AND SUBSIDIARIES
NOTES TO CONSOLIDATED FINANCIAL STATEMENTS
Note 9 – Warrant:
In connection with a loan transaction with a bank prior to 2011, and in consideration thereof, the Company issued to a bank a warrant to purchase up to an aggregate of
The warrant was exercised upon surrender to the Company, on a net basis, such that, without the exchange of any funds, such holder purchased that number of shares otherwise issuable upon exercise of its warrant less that number of shares having a current market price at the time of exercise equal to the aggregate exercise price that would otherwise have been paid by such holder upon the exercise of the warrant.
The outstanding warrants were converted to common stock in
Note 10 – Equity Incentive Plans and Equity:
Total compensation cost for share-based payments recognized for the years ended December 31, 2019, 2018, and 2017 was approximately $
2010 Stock Plan—In December 2010, the Company approved the 2010 Stock Plan (the “2010 Plan”) under which options to purchase approximately
The options granted have maximum contractual terms of
2014 Omnibus Incentive Plan—In November 2014, the Company approved the 2014 Omnibus Incentive Plan (the “2014 Plan”) under which
At December 31, 2019, there were
NASDAQ Marketplace Rules Inducement Award—During the year ended December 31, 2016,
59
FRESHPET, INC. AND SUBSIDIARIES
NOTES TO CONSOLIDATED FINANCIAL STATEMENTS
Service Period Stock Options—A summary of service period stock options outstanding and changes under the plans during the year ended December 31, 2019 is presented below:
|
Options |
|
Shares |
|
|
Weighted Average Exercise Price |
|
|
Average Remaining Contractual Term |
|
|
Aggregate Intrinsic Value |
|
||||
|
Outstanding at December 31, 2018 |
|
|
|
|
|
$ |
|
|
|
|
|
|
|
|
|
|
|
Granted |
|
|
|
|
|
|
|
|
|
|
|
|
|
|
|
|
|
Exercised |
|
|
( |
) |
|
|
|
|
|
|
|
|
|
|
|
|
|
Forfeited |
|
|
( |
) |
|
|
|
|
|
|
|
|
|
|
|
|
|
Expired |
|
|
( |
) |
|
|
|
|
|
|
|
|
|
|
|
|
|
Outstanding at December 31, 2019 |
|
|
|
|
|
$ |
|
|
|
|
|
|
|
$ |
|
|
|
Exercisable at December 31, 2019 |
|
|
|
|
|
$ |
|
|
|
|
|
|
|
$ |
|
|
All of the options exercisable at December 31, 2019 were in-the-money, which account for the entire aggregate intrinsic value. The total intrinsic value of options exercised during the years ended December 31, 2019, 2018, and 2017 were $
A summary of the nonvested service period stock options as of December 31, 2019, and changes during the year ended December 31, 2019, is presented below:
|
|
|
Number of Options |
|
|
Weighted-Average Grant-Date Fair Value Per Share |
|
||
|
Nonvested as of December 31, 2018 |
|
|
|
|
|
$ |
|
|
|
Granted |
|
|
|
|
|
|
|
|
|
Vested |
|
|
( |
) |
|
|
|
|
|
Forfeited |
|
|
( |
) |
|
|
|
|
|
Expired |
|
|
( |
) |
|
|
|
|
|
Nonvested as of December 31, 2019 |
|
|
|
|
|
$ |
|
|
|
|
|
|
|
|
|
|
|
|
As of December 31, 2019, there was $
Performance Based Options—Performance based option vesting is contingent upon the Company achieving certain annual or cumulative revenue or Adjusted EBITDA goals.
|
Options |
|
Shares |
|
|
Weighted Average Exercise Price |
|
|
Average Remaining Contractual Term |
|
|
Aggregate Intrinsic Value |
|
||||
|
Outstanding at December 31, 2018 |
|
|
|
|
|
$ |
|
|
|
|
|
|
|
|
|
|
|
Granted |
|
|
|
|
|
|
|
|
|
|
|
|
|
|
|
|
|
Exercised |
|
|
( |
) |
|
|
|
|
|
|
|
|
|
|
|
|
|
Forfeited |
|
|
( |
) |
|
|
|
|
|
|
|
|
|
|
|
|
|
Outstanding at December 31, 2019 |
|
|
|
|
|
$ |
|
|
|
|
|
|
|
$ |
|
|
|
Exercisable at December 31, 2019 |
|
|
|
|
|
$ |
|
|
|
|
|
|
|
$ |
|
|
60
FRESHPET, INC. AND SUBSIDIARIES
NOTES TO CONSOLIDATED FINANCIAL STATEMENTS
|
|
|
Number of Options |
|
|
Weighted-Average Grant-Date Fair Value Per Share |
|
||
|
Nonvested as of December 31, 2018 |
|
|
|
|
|
$ |
|
|
|
Granted |
|
|
|
|
|
|
|
|
|
Vested |
|
|
( |
) |
|
|
|
|
|
Forfeited |
|
|
( |
) |
|
|
|
|
|
Nonvested as of December 31, 2019 |
|
|
|
|
|
$ |
|
|
|
|
|
|
|
|
|
|
|
|
As of December 31, 2019, unrecognized compensation costs related to the
As of December 31, 2019, there were
Restricted Stock Units—The following table includes activity related to outstanding restricted stock units during the twelve months ended December 31, 2019.
|
|
|
Shares |
|
|
Weighted-Average Grant-Date Fair Value Per Unit |
|
||
|
Outstanding at December 31, 2018 |
|
|
|
|
|
$ |
|
|
|
Granted |
|
|
|
|
|
|
|
|
|
Issued Upon Vesting |
|
|
( |
) |
|
|
|
|
|
Forfeited |
|
|
( |
) |
|
|
|
|
|
Expired |
|
|
( |
) |
|
|
|
|
|
Outstanding at December 31, 2019 |
|
|
|
|
|
$ |
|
|
|
|
|
|
|
|
|
|
|
|
As of December 31, 2019, there was approximately $
Grant Date Fair Value of Options—The weighted average grant date fair value of options (service period options and performance based options) granted during the years ended December 31, 2019, 2018, and 2017 were $
Expected Volatility—Expected volatility was based on the historical volatility of the Company’s common stock.
Weighted Average Expected Term—The Company determined the expected term based on the “shortcut method” described in FASB ASC 718, Compensation—Stock Compensation (an expected term based on the midpoint between the vesting date and the end of the contractual term).
Risk-Free Interest Rate—The risk-free interest rates are based on the U.S. Treasury yield for a period consistent with the expected term of the option in effect at the time of the grant.
61
FRESHPET, INC. AND SUBSIDIARIES
NOTES TO CONSOLIDATED FINANCIAL STATEMENTS
Expected Dividend Yield—The Company has not historically declared dividends, and no future dividends are expected to be available to benefit option holders. Accordingly, the Company used an expected dividend yield of zero in the valuation model.
|
|
|
Year Ended December 31, |
|
|||||||||
|
|
|
|
2019 |
|
|
|
2018 |
|
|
|
2017 |
|
|
Weighted average exercise price of options granted |
|
$ |
|
|
|
$ |
|
|
|
$ |
|
|
|
Expected volatility |
|
47.6% - 48.5% |
|
|
48.9% - 50.0% |
|
|
45.6% - 50.1% |
|
|||
|
Average expected terms in years |
|
6 - 6.6 |
|
|
6 - 6.6 |
|
|
6.5 - 6.6 |
|
|||
|
Risk-free interest rate |
|
|
|
|
2.62% - 2.96% |
|
|
1.92% - 1.93% |
|
|||
|
Expected dividend yield |
|
|
|
|
|
|
|
|
|
|||
Note 11 – Net Loss Attributable to Common Stockholders:
Basic net loss per common share is calculated by dividing net loss attributable to common stockholders by the weighted-average number of common share outstanding for the period. Diluted net loss per common share is computed by giving effect to all potentially dilutive securities. Diluted net loss per common share is the same as basic net loss per common share, due to the fact that potentially dilutive securities would have an antidilutive effect as the Company incurred a net loss for the years ended December 31, 2019, 2018 and 2017.
In the years ended December 31, 2019, 2018, and 2017, there were
The potentially dilutive securities excluded from the determination of diluted loss per share, as their effect is antidilutive, are as follows:
|
|
|
Twelve Months Ended |
|
|||||||||
|
|
|
December 31, |
|
|||||||||
|
|
|
2019 |
|
|
2018 |
|
|
2017 |
|
|||
|
Service Period Stock Options |
|
|
|
|
|
|
|
|
|
|
|
|
|
Restricted Stock Units |
|
|
|
|
|
|
|
|
|
|
|
|
|
Performance Stock Options |
|
|
|
|
|
|
|
|
|
|
|
|
|
Total |
|
|
|
|
|
|
|
|
|
|
|
|
Note 12 – Retirement Plan:
The Company sponsors a safe harbor 401(k) plan covering all employees. All employees are eligible to participate. Active participants in the plan may make contributions of up to
Note 13 – Related Party Transactions:
In September 2018, one of the Company’s raw material vendors was purchased by a significant stockholder of the Company. The purchase of the vendor by the stockholder, had no impact on the cadence or amount of the raw materials that the Company purchased from the vendor. As of June 10, 2019, the significant stockholder sold
During 2017, $
The Company believes that all payments made to both vendors were at market value and thus at arms-length.
62
FRESHPET, INC. AND SUBSIDIARIES
NOTES TO CONSOLIDATED FINANCIAL STATEMENTS
Note 14 – Concentrations:
Concentration of Credit Risk—The Company maintains its cash balances in financial institutions that are insured by the Federal Deposit Insurance Corporation up to $
Major Customers—In 2019, 2018, and 2017, net sales to one of our distributors which sells directly to
Major Suppliers—The Company purchased approximately
The Company purchased approximately
Note 15 – Unaudited Quarterly Results:
Unaudited quarterly results for the years ended December 31, 2019, 2018, and 2017 were as follows:
|
|
|
First Quarter |
|
|
Second Quarter |
|
|
Third Quarter |
|
|
Fourth Quarter |
|
||||
|
2019: |
|
|
|
|
|
|
|
|
|
|
|
|
|
|
|
|
|
Net sales |
|
|
|
|
|
|
|
|
|
|
|
|
|
|
|
|
|
Income/(loss) from operations |
|
|
( |
) |
|
|
( |
) |
|
|
|
|
|
|
|
|
|
Net Income/(loss) |
|
|
( |
) |
|
|
( |
) |
|
|
|
|
|
|
|
|
|
Net Income/(loss) attributable to common stockholders |
|
|
( |
) |
|
|
( |
) |
|
|
|
|
|
|
|
|
|
Basic earnings/(loss) per common share |
|
|
( |
) |
|
|
( |
) |
|
|
|
|
|
|
|
|
|
Diluted earnings/(loss) per common share |
|
|
( |
) |
|
|
( |
) |
|
|
|
|
|
|
|
|
|
2018: |
|
|
|
|
|
|
|
|
|
|
|
|
|
|
|
|
|
Net sales |
|
|
|
|
|
|
|
|
|
|
|
|
|
|
|
|
|
Income/(loss) from operations |
|
|
( |
) |
|
|
( |
) |
|
|
|
|
|
|
|
|
|
Net Income/(loss) |
|
|
( |
) |
|
|
( |
) |
|
|
( |
) |
|
|
|
|
|
Net Income/(loss) attributable to common stockholders |
|
|
( |
) |
|
|
( |
) |
|
|
( |
) |
|
|
|
|
|
Basic earnings/(loss) per common share |
|
|
( |
) |
|
|
( |
) |
|
|
( |
) |
|
|
|
|
|
Diluted earnings/(loss) per common share |
|
|
( |
) |
|
|
( |
) |
|
|
( |
) |
|
|
|
|
|
2017: |
|
|
|
|
|
|
|
|
|
|
|
|
|
|
|
|
|
Net sales |
|
|
|
|
|
|
|
|
|
|
|
|
|
|
|
|
|
Income/(loss) from operations |
|
|
( |
) |
|
|
( |
) |
|
|
|
|
|
|
|
|
|
Net Income/(loss) |
|
|
( |
) |
|
|
( |
) |
|
|
( |
) |
|
|
|
|
|
Net Income/(loss) attributable to common stockholders |
|
|
( |
) |
|
|
( |
) |
|
|
( |
) |
|
|
|
|
|
Basic earnings/(loss) per common share |
|
|
( |
) |
|
|
( |
) |
|
|
( |
) |
|
|
|
|
|
Diluted earnings/(loss) per common share |
|
|
( |
) |
|
|
( |
) |
|
|
( |
) |
|
|
|
|
Note 16 – Subsequent Events:
The Company evaluates events that have occurred after the balance sheet date but before the financial statements are issued.
With the Company’s continuing expansion of its manufacturing capacity, the Company’s borrowings under the new credit facilities increased by an additional $
63
FRESHPET, INC. AND SUBSIDIARIES
NOTES TO CONSOLIDATED FINANCIAL STATEMENTS
Based upon further evaluation, the Company did not identify any additional recognized or unrecognized subsequent events that have required adjustment or disclosure in the financial statements.
64
ITEM 9. — CHANGES IN AND DISAGREEMENTS WITH ACCOUNTANTS ON ACCOUNTING AND FINANCIAL DISCLOSURE
None
ITEM 9a. CONTROL AND PROCEDURES
Evaluation of Disclosure Controls and Procedures
We maintain “disclosure controls and procedures,” as defined in Rules 13a-15(e) and 15d-15(e) under the Exchange Act, that are designed to ensure that information required to be disclosed by a company in the reports that it files or submits under the Exchange Act is recorded, processed, summarized and reported, within the time periods specified in the SEC’s rules and forms. Disclosure controls and procedures include, without limitation, controls and procedures designed to ensure that information required to be disclosed by a company in the reports that it files or submits under the Exchange Act is accumulated and communicated to the company’s management, including its principal executive and principal financial officers, as appropriate to allow timely decisions regarding required disclosure.
Our management, with the participation of our Chief Executive Officer and our Chief Financial Officer, evaluated the effectiveness of our disclosure controls and procedures as of December 31, 2019. Based on the evaluation of our disclosure controls and procedures as of December 31, 2019, our Chief Executive Officer and Chief Financial Officer concluded that, as of such date, our disclosure controls and procedures were effective at the reasonable assurance level.
Management’s Report on Internal Control Over Financial Reporting
Our management is responsible for establishing and maintaining adequate internal control over financial reporting as defined in Rules 13a-15(f) and 15d-15(f) under the Exchange Act. The Company’s internal control over financial reporting is a process designed to provide reasonable assurance regarding the reliability of financial reporting and the preparation of the Company’s financial statements for external reporting purposes in accordance with generally accepted accounting principles.
Management assessed the effectiveness of the Company’s internal control over financial reporting as of December 31, 2019. In making this assessment, management used the criteria set forth by the Committee of Sponsoring Organizations of the Treadway Commission ("COSO") in its Internal Control-Integrated Framework (2013). This evaluation was carried out under the supervision and with the participation of our management, including our Chief Executive Officer and Chief Financial Officer. Based on this assessment, management concluded that as of December 31, 2019, the Company’s internal control over financial reporting was effective.
Our independent registered public accounting firm that audited the consolidated financial statements included in this annual report has issued an audit report on the effectiveness of our internal control over financial reporting, which is included herein under "Report of Independent Registered Public Accounting Firm".
Changes in Internal Control over Financial Reporting
There were no changes in our internal control over financial reporting identified in management’s evaluation pursuant to Rules 13a-15(d) and 15d-15(d) of the Exchange Act during the three months ended December 31, 2019 that have materially affected, or are reasonably likely to materially affect, our internal control over financial reporting.
Inherent Limitations on Effectiveness of Controls
Our management, including our Chief Executive Officer and Chief Financial Officer, believes that our disclosure controls and procedures and internal control over financial reporting are designed to provide reasonable assurance of achieving their objectives and are effective at the reasonable assurance level. However, our management does not expect that our disclosure controls and procedures or our internal control over financial reporting will prevent all errors and all fraud. A control system, no matter how well conceived and operated, can provide only reasonable, not absolute, assurance that the objectives of the control system are met. Further, the design of a control system must reflect the fact that there are resource constraints, and the benefits of controls must be considered relative to their costs. Because of the inherent limitations in all control systems, no evaluation of controls can provide absolute assurance that all control issues and instances of fraud, if any, have been detected. These inherent limitations include the realities that judgments in decision making can be faulty, and that breakdowns can occur because of a simple error or mistake. Additionally, controls can be circumvented by the individual acts of some persons, by collusion of two or more people or by management override of
65
the controls. The design of any system of controls also is based in part upon certain assumptions about the likelihood of future events, and there can be no assurance that any design will succeed in achieving its stated goals under all potential future conditions; over time, controls may become inadequate because of changes in conditions, or the degree of compliance with policies or procedures may deteriorate. Because of the inherent limitations in a cost-effective control system, misstatements due to error or fraud may occur and not be detected.
ITEM 9b. OTHER INFORMATION
None.
66
PART III
ITEM 10. DIRECTORS, EXECUTIVE OFFICERS AND CORPORATE GOVERNANCE
The information required by this item will be furnished (and is hereby incorporated by reference) by an amendment hereto or pursuant to a definitive proxy statement pursuant to Regulation 14A that will contain such information.
ITEM 11. EXECUTIVE COMPENSATION
The information required by this item will be furnished (and is hereby incorporated by reference) by an amendment hereto or pursuant to a definitive proxy statement pursuant to Regulation 14A that will contain such information.
ITEM 12. SECURITY OWNERSHIP OF CERTAIN BENEFICIAL OWNERS AND MANAGEMENT AND RELATED STOCKHOLDER MATTERS
The information required by this item will be furnished (and is hereby incorporated by reference) by an amendment hereto or pursuant to a definitive proxy statement pursuant to Regulation 14A that will contain such information.
ITEM 13. CERTAIN RELATIONSHIPS AND RELATED TRANSACTIONS, DIRECTOR INDEPENDENCE
The information required by this item will be furnished (and is hereby incorporated by reference) by an amendment hereto or pursuant to a definitive proxy statement pursuant to Regulation 14A that will contain such information.
ITEM 14. PRINCIPAL ACCOUNTANT FEES AND SERVICES
The information required by this item will be furnished (and is hereby incorporated by reference) by an amendment hereto or pursuant to a definitive proxy statement pursuant to Regulation 14A that will contain such information.
67
PART IV
ITEM 15. EXHIBITS AND FINANCIAL STATEMENT SCHEDULES
The following documents are filed as a part of this report:
|
(1) |
Financial Statements – See Index to the Consolidated Financial Statements appearing on page 46. |
|
(2) |
Financial Statement Schedules – None. |
|
(3) |
Exhibits – The exhibits listed on the accompanying Exhibit Index are filed or incorporated by reference as part of this report. |
68
EXHIBIT INDEX
|
Exhibit No. |
|
Description |
|
3.1 |
|
|
|
3.2 |
|
|
|
3.3 |
|
|
|
4.1* |
|
Description of Securities Registered Pursuant to Section 12 of the Securities Exchange Act of 1934. |
|
10.1 |
|
|
|
10.2 |
|
|
|
10.3 |
|
|
|
10.4 |
|
|
|
10.5 |
|
|
|
10.6 |
|
|
|
10.7 |
|
|
|
10.8 |
|
|
|
10.9 |
|
|
|
10.10 |
|
|
|
10.11 |
|
|
|
10.12 |
|
|
|
10.13 |
|
69
|
Exhibit No. |
|
Description |
|
10.14 |
|
|
|
10.15 |
|
|
|
10.16 |
|
|
|
10.17 |
|
|
|
10.18 |
|
|
|
21.1* |
|
|
|
23.1* |
|
|
|
31.1* |
|
Certification of Chief Executive Officer pursuant to Section 302 of the Sarbanes-Oxley Act of 2002 |
|
31.2* |
|
Certification of Chief Financial Officer pursuant to Section 302 of the Sarbanes-Oxley Act of 2002 |
|
32.1* |
|
|
|
101.INS* |
|
Inline XBRL Instance Document |
|
101.SCH* |
|
Inline XBRL Schema Documents |
|
101.CAL* |
|
Inline XBRL Calculation Linkbase Document |
|
101.LAB* |
|
Inline XBRL Labels Linkbase Document |
|
101.PRE* |
|
Inline XBRL Presentation Linkbase Document |
|
101.DEF* |
|
Inline XBRL Definition Linkbase Document |
|
EX-104 |
|
Inline XBRL Formatted Cover Page |
|
* Filed herewith. |
|
|
|
|
|
|
|
|
|
|
|
|
|
|
|
|
|
|
70
SIGNATURES
Pursuant to the requirements of Section 13 or 15(d) of the Securities Exchange Act of 1934, the registrant has duly caused this report to be signed on its behalf by the undersigned, thereunto duly authorized on February 25, 2020.
FRESHPET, INC.
By: /s/ Richard Kassar
Name: Richard Kassar
Title: Chief Financial Officer
* * * *
Power of Attorney
Each person whose signature appears below constitutes and appoints Richard Kassar as his true and lawful attorney-in-fact and agent, with full power of substitution and resubstitution, for him and in his name, place and stead, in any and all capacities, to sign any and all amendments to this Annual Report on Form 10-K, and to file the same, with all exhibits thereto, and other documents in connection therewith, with the Securities and Exchange Commission, granting unto said attorney-in-fact and agent full power and authority to do and perform each and every act and thing requisite and necessary to be done in connection therewith, as fully to all intents and purposes as he might or could do in person, hereby ratifying and confirming all that said attorney-in-fact and agent or his substitute or substitutes may lawfully do or cause to be done by virtue hereof.
Pursuant to the requirements of the Securities Exchange Act of 1934, this report has been signed below by the following persons on behalf of the registrant and in the capacities indicated on February 25, 2020.
|
Signature |
Title |
|
|
|
|
/s/ William B. Cyr |
Chief Executive Officer and Director |
|
|
|
|
/s/ Richard Kassar |
Chief Financial Officer |
|
|
|
|
/s/ Charles A. Norris |
Director |
|
|
|
|
/s/ J. David Basto |
Director |
|
|
|
|
/s/ Daryl G. Brewster |
Director |
|
|
|
|
/s/ Lawrence S. Coben |
Director |
|
|
|
|
/s/ Walter N. George III |
Director |
|
|
|
71
|
|
|
|
|
|
|
/s/ Robert C. King |
Director |
|
|
|
|
/s/ Craig D. Steeneck |
Director
|
|
/s/ Leta D. Priest |
Director |
|
/s/ Jacki S. Kelley |
Director |
|
/s/ Olu Beck |
Director |
72