UNITED STATES
SECURITIES AND EXCHANGE COMMISSION
WASHINGTON, D.C. 20549
____________________________
FORM 10-K
____________________________
For the fiscal year ended December 31, 2019
or
Commission File Number: 001-38897
____________________________
(Exact name of registrant as specified in its charter)
____________________________
(State or other jurisdiction of incorporation or organization) | (I.R.S. Employer Identification Number) | |
(Address of principal executive offices) (Zip code)
(844 ) 432-7859
(Registrant's telephone number, including area code)
Not Applicable
(Former name, former address, or former fiscal year, if changed since last report)
____________________________
Securities registered pursuant to Section 12(b) of the Act:
Title of each class | Trading Symbol(s) | Name of each exchange on which registered | ||
Securities registered pursuant to Section 12(g) of the Act: None
Indicate by check mark if the registrant is a well-known seasoned issuer, as defined in Rule 405 of the Securities Act. Yes ☐ No ☒
Indicate by check mark if the registrant is not required to file reports pursuant to Section 13 or 15(d) of the Act. Yes ☐ No ☒
Indicate by check mark whether the registrant (1) has filed all reports required to be filed by Section 13 or 15(d) of the Securities Exchange Act of 1934 during the preceding 12 months (or for such shorter period that the registrant was required to file such reports), and (2) has been subject to such filing requirements for the past 90 days. Yes ☒ No ☐
Indicate by check mark whether the registrant has submitted electronically every Interactive Data File required to be submitted pursuant to Rule 405 of Regulation S-T (§232.405 of this chapter) during the preceding 12 months (or for such shorter period that the registrant was required to submit such files). Yes ☒ No ☐
Indicate by check mark whether the registrant is a large accelerated filer, an accelerated filer, a non-accelerated filer, a smaller reporting company, or an emerging growth company. See the definitions of "large accelerated filer," "accelerated filer," "smaller reporting company," and "emerging growth company" in Rule 12b-2 of the Exchange Act.
Large accelerated filer | ☐ | Accelerated filer | ☐ | |
☒ | Smaller reporting company | |||
Emerging growth company | ||||
If an emerging growth company, indicate by check mark if the registrant has elected not to use the extended transition period for complying with any new or revised financial accounting standards provided pursuant to Section 13(a) of the Exchange Act. ☐
Indicate by check mark whether the registrant is a shell company (as defined in Rule 12b-2 of the Exchange Act). Yes ☐ No ☒
1
The aggregate market value of the voting and non-voting common equity held by non-affiliates of the registrant, based on the closing price of $20.28 for a share of the Registrant’s Class A common stock on June 28, 2019 (the last business day of the registrant's most recently completed second quarter), as reported by the New York Stock Exchange on such date, was approximately $263.5 million.
As of February 28, 2020, 71.4 million shares of the registrants’ Class A common stock were outstanding and 24.5 million shares of registrant's Class B common stock were outstanding.
Portions of the registrant’s Definitive Proxy Statement relating to the 2020 Annual Meeting of Stockholders are incorporated by reference into Part III of this Annual Report on Form 10-K where indicated. Such Definitive Proxy Statement will be filed with the Securities and Exchange Commission within 120 days after the end of the registrant’s fiscal year ended December 31, 2019.
2
TABLE OF CONTENTS
Page | ||
3
SPECIAL NOTE REGARDING FORWARD-LOOKING STATEMENTS
This Annual Report on Form 10-K contains forward-looking statements within the meaning of Section 27A of the Securities Act of 1933, as amended, (the "Securities Act"), and Section 21E of the Securities Exchange Act of 1934, as amended, (the "Exchange Act"), about us and our industry that involve substantial risks and uncertainties. All statements other than statements of historical facts contained in this report, including statements regarding our future results of operations and financial condition, business strategy, and plans and objectives of management for future operations, are forward-looking statements. In some cases, forward-looking statements may be identified by words such as "anticipate," "believe," "continue," "could," "design," "estimate," "expect," "intend," "may," "plan," "potentially," "predict," "project," "should," "will," or the negative of these terms or other similar expressions.
Forward-looking statements are based on our management’s beliefs and assumptions and on information currently available. These forward-looking statements are subject to a number of known and unknown risks, uncertainties and assumptions, including risks described in the section titled "Risk Factors" and elsewhere in this Annual Report on Form 10-K, regarding, among other things:
• | our ability to attract and retain customers; |
• | our ability to increase the usage of our platform by existing customers; |
• | defects, interruptions, security breaches, delays in performance, or similar problems with our platform; |
• | our financial performance, including our revenue, cost of revenue, operating expenses, and our ability to attain and sustain profitability; |
• | our ability to adapt and respond effectively to rapidly changing technology, evolving industry standards, changing regulations, and changing customer needs, requirements, or preferences; |
• | the growth of our relevant markets; |
• | our platform’s functionality, scalability, performance, ease of use, reliability, and cost effectiveness relative to that of our competitors’ products and services; |
• | our ability to compete effectively with existing competitors and new market entrants; |
• | our ability to attract and retain qualified employees and key personnel; |
• | our ability to maintain, protect, and enhance our intellectual property; and |
• | our ability to comply with laws and regulations that currently apply or may become applicable to our business both in the United States and internationally. |
We caution you that the foregoing list may not contain all of the forward-looking statements made in this Annual Report on Form 10-K.
Other sections of this Annual Report on Form 10-K may include additional factors that could harm our business and financial performance. Moreover, we operate in a very competitive and rapidly changing environment. New risk factors emerge from time to time, and it is not possible for our management to predict all risk factors nor can we assess the impact of all factors on our business or the extent to which any factor, or combination of factors, may cause actual results to differ from those contained in, or implied by, any forward-looking statements.
You should not rely upon forward-looking statements as predictions of future events. We cannot assure you that the events and circumstances reflected in the forward-looking statements will be achieved or occur. Although we believe that the expectations reflected in the forward-looking statements are reasonable, we cannot guarantee future results, levels of activity, performance or achievements. Except as required by law, we undertake no obligation to update publicly any forward-looking statements for any reason after the date of this report or to conform these statements to actual results or to changes in our expectations. You should
4
read this Annual Report on Form 10-K and the documents that we reference in this Annual Report on Form 10-K and have filed as exhibits to this report with the understanding that our actual future results, levels of activity, performance, and achievements may be materially different from what we expect. We qualify all of our forward-looking statements by these cautionary statements.
Investors and others should note that we may announce material business and financial information to our investors using our investor relations website (www.investors.fastly.com), our filings with the Securities and Exchange Commission, webcasts, press releases, and conference calls. We use these mediums, including our website, to communicate with investors and the general public about our company, our products, and other issues. It is possible that the information that we make available on our website may be deemed to be material information. We therefore encourage investors and others interested in our company to review the information that we make available on our website.
PART I
Item 1. Business
Overview
Developers are reinventing the way we live, work, and play online. Yet they repeatedly encounter innovation barriers when delivering modern digital experiences. Expectations for digital experiences are at an all-time high; they must be fast, secure, and highly personalized. If they aren’t reliable, end-users simply take their business elsewhere. The challenge today is enabling developers to deliver a modern digital experience while simultaneously providing scale, security, and performance. We built our edge cloud platform to solve this problem.
The edge cloud is a new category of Infrastructure as a Service ("IaaS") that enables developers to build, secure, and deliver digital experiences, at the edge of the internet. This service represents the convergence of the Content Delivery Network ("CDN") with functionality that has been traditionally delivered by hardware-centric appliances such as Application Delivery Controllers ("ADC"), Web Application Firewalls ("WAF"), Bot Detection, and Distributed Denial of Services ("DDoS") solutions. It also includes the emergence of a new, but growing, edge computing market which aims to move compute power and logic as close to the end-user as possible. The edge cloud uses the emerging cloud computing, serverless paradigm in which the cloud provider runs the server and dynamically manages the allocation of machine resources. When milliseconds matter, processing at the edge is an ideal way to handle highly dynamic and time-sensitive data. The edge cloud complements data center, central cloud, and hybrid solutions.
Our mission is to fuel the next modern digital experience by providing developers with a programmable and reliable edge cloud platform that they adopt as their own.
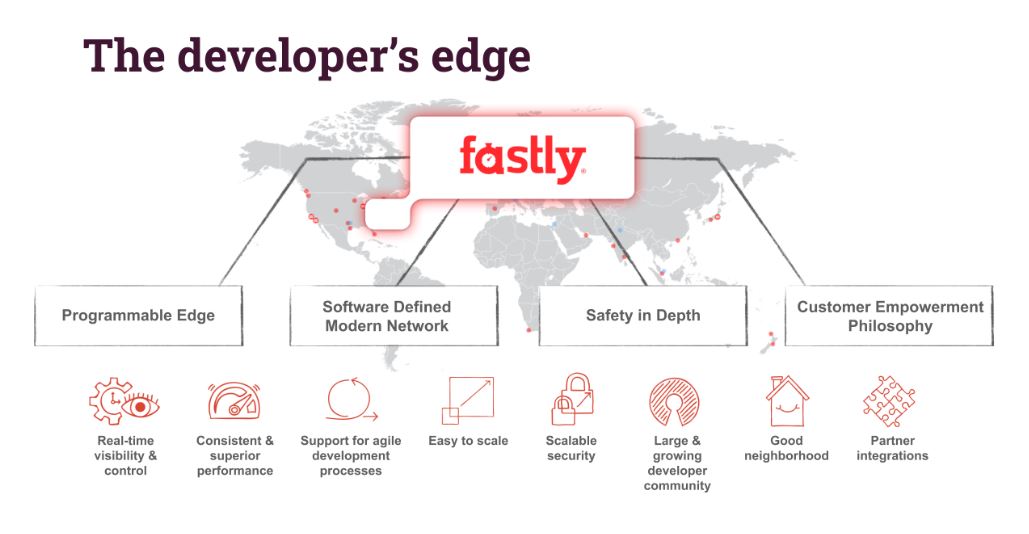
Organizations must keep up with complex and ever-evolving end-user requirements. We help them surpass their end-users’ expectations by powering fast, secure, and scalable digital experiences. We built a powerful edge cloud platform, designed from the ground up to be programmable and support agile software development. We believe our platform gives our customers a significant competitive advantage, whether they were born into the digital age or are just embarking on their digital transformation journey. Our platform consists of four key components: a programmable edge, a software-defined modern network, safety in depth, and a philosophy of customer empowerment. Our programmable edge provides developers with real-time visibility and control, where they can write and deploy code to push application logic to the edge. It supports modern application delivery processes, freeing developers to innovate without constraints. Our software-defined modern network is built for the software-defined future. It is powerful, efficient, and flexible, designed to enable us to rapidly scale to meet the needs of the most demanding customers and never be a barrier to their growth. Our 74 terabit software-centric network is located in 68 uniquely designed Points of Presence ("POPs") across 53 markets as of December 31, 2019. We define markets as unique metropolitan areas where we have one or more POPs. Our safety in depth approach integrates security into multiple layers of development: architecture, engineering, and operations. That's why we invest in building security into the fabric of our platform, alongside performance. We provide developers and security operations teams with a fast, safe environment to create, build, and run modern applications.
5
Our platform provides developers and security operations teams with solutions that foster innovation without impacting performance. Finally, being developers ourselves, we empower customers to build great things while supporting their efforts through frictionless tools and a deeply technical support team that facilitates ongoing collaboration.
We serve both established enterprises and technology-savvy organizations. Our customers represent a diverse set of organizations across many industries with one thing in common: they are competing by using the power of software to build differentiation at the edge. With our edge cloud platform, our customers are disrupting existing industries and creating new ones. For example, several of our customers have reinvented digital publishing by connecting readers through subscription models to indispensable content, helping people understand the world through deeply reported independent journalism. Our customers’ software applications use our edge cloud platform to ensure concert goers can buy tickets to the live events they love, travelers can book flights seamlessly and embark on their next great adventure, and sports fans can stream events in real time, across all devices. The range of applications that developers build with our edge cloud platform continues to expand rapidly.
So where do we go from here? Our vision is to create a trustworthy internet, where good thrives. We want all developers to have the ability to deliver the next transformative digital experience on a global scale. And because big ideas often start small, we love it when developers experiment and iterate on our edge cloud platform, coming up with exciting new ways to solve today’s complex problems.
Our usage-based revenue grows as our customers’ websites and applications deliver, process, and protect more traffic, as they adopt more features of our edge platform and as they more broadly adopt our platform across their organizations. A meaningful indicator of the increased activity from our existing customers is our Dollar-Based Net Expansion Rate ("DBNER"), a metric used in measuring the revenue growth from existing customers attributed to increased usage of our platform and purchase of additional services. Our DBNER was 135.5%, 132.0%, and 147.3% for the years ended December 31, 2019, December 31, 2018, and December 31, 2017, respectively. See “Management’s Discussion and Analysis of Financial Condition and Results of Operations—Key Business Metrics—Dollar-Based Net Expansion Rate” for further discussion of DBNER.
We have achieved significant growth in recent periods. For the years ended December 31, 2019, December 31, 2018, and December 31, 2017, our revenue was $200.5 million, $144.6 million, and $104.9 million, respectively. We incurred a net loss of $51.6 million, $30.9 million, and $32.5 million for the years ended December 31, 2019, December 31, 2018, and December 31, 2017, respectively.
Our Solution: The Developer’s Edge
We have built a powerful, serverless edge cloud platform, designed from the ground up to be programmable and support agile software development. We process, serve, and secure our customers’ applications as close to their end-users as possible, at the edge of the internet for enhanced performance and protection. We call this platform the Developer’s Edge and we believe it gives our customers a significant competitive advantage whether they are just embarking on their digital transformation journey or natively born into the new digital age.
6
Our edge cloud platform is based on several core tenets:
• | Developers must be empowered to innovate; |
• | Platforms must innovate ahead of market demands while still being reliable, scalable, and secure; and |
• | Vendors must provide exceptional flexibility and support. |
With this in mind, our platform, the Developer’s Edge, consists of four key components: a programmable edge, a software-defined modern network, safety in depth, and a philosophy of customer empowerment.
Programmable Edge
Our programmable edge sits in an extremely privileged position, between our customers’ applications and their end-users, placing our services closer to those users. It is designed to create a space for developers to innovate at their own pace, by providing:
• | Full programmability. Our powerful platform allows developers to write and deploy their custom code to push application logic to the edge. We believe that logic like A/B testing, URL redirects, paywall authentication, and location/language customization can all be executed faster and more efficiently at the edge; |
• | Reusable modules. Our platform includes reusable modules based on commonly deployed custom code examples. We package and add these reusable modules to our platform, which do not require developer experience to implement. |
• | Real-time visibility and control. Our edge cloud platform is built with instant visibility and control as a core tenet. We stream log data from our network edge in real time so developers can instantly see the impact of new code in production, troubleshoot issues as they occur and rapidly identify suspicious traffic. We also empower developers to make and roll back their own configuration or code changes on the fly; and |
• | Agile development. Developers can build Fastly into their technology stack to power continuous integration and continuous deployment (“CI/CD") efforts. They can use our edge cloud platform to help |
7
push new code to production multiple times a day as they test new features, fix bugs, or enhance existing offerings.
Edge Use Cases. Below are some examples of use cases our customers have solved for using Fastly’s programmable edge:
• | API acceleration. Accelerate and secure critical application programming interface (“API") responses at the edge for delightful application experiences, such as instant hotel lookup based on location and real-time inventory updates between retail stores and their online storefronts; |
• | Internet of things ("IoT"). Process and secure data from connected devices at the edge for instant results for time-sensitive applications; |
• | Cloud migration. Seamlessly migrate from data center to cloud, hybrid or multi-cloud environments, enabling the customer to take advantage of the functionality and cost savings of one or more cloud providers; and |
• | Enabling blockchain. Cache and accelerate individual transactions on the blockchain in real time. |
Software-Defined Modern Network
Our edge cloud platform is designed to take advantage of the modern internet. Our philosophy has been to differentiate through software by building one powerful software-centric network composed of unique and proprietary components. Our approach is designed to give us the flexibility to innovate and build so we will never be a barrier to our customers’ growth, and consists of the following key elements:
• | Software-centric approach at global scale. From the start, we realized that single purpose hardware-based solutions that rely on custom-designed chips are inflexible. Custom hardware, like routers, load balancers, and security appliances, do not have the flexibility to support the dynamic needs of the modern internet. We started with open source software like Varnish and Linux, then rewrote it to support the use cases of a multi-tenant, high-performance edge cloud. We created our own proprietary software-defined networking stack with built-in routing and load balancing, a storage system for optimal storage usage and performance, a massive data pipeline to send customer logs, a cache invalidation system that purges content around the world in an average of 150 milliseconds or less, and a proprietary control panel that allows our customers to update their edge application logic and configurations in seconds around the world. We architect the software to run on custom-designed servers built upon commodity components and network hardware so that we can control every aspect of the network, from request to response and drive as much utilization and scale as possible. Our software-centric approach is designed for better network efficiency and greater flexibility to scale as we add more services. |
• | POP design. We built Fastly for the internet of today—meaning fewer POPs, each with massive scale and located at the key interconnection points of the internet. Our POPs are connected directly to the core internet, each connecting directly to core Internet Service Provider ("ISPs") and 78 Internet Exchange Points as of December 31, 2019 to offer high performance in long-tail content caching. We run fewer clusters of more powerful servers that provide superior performance for customers who expect updates to be pushed out to their global end-users nearly instantaneously. Legacy CDNs do not offer this benefit, as it is extremely difficult to update hundreds of thousands of servers around the world; |
• | Server efficiency. We have a highly efficient global server footprint because we combine advanced server and network hardware with our world class software at each of our POPs. As of December 31, 2019, we had 2,216 servers. Our servers are optimized to handle the complex workloads of compute at the edge by using high-end Central Processing Units and significant amount of Random Access Memory to process Varnish Configuration Language ("VCL"). We use solid-state drives, for fast and constant lookup times, and modern 25 Gigabit Ethernet for robust bandwidth. This, combined with our algorithms and custom software, gives us the flexibility to scale while dramatically reducing operating burden; and |
• | One network. We have built a single powerful, compliant network to support customers’ security and delivery needs: |
8
◦ | Our single network is designed to provide the massive scale needed to defend against today’s growing DDoS threats without sacrificing performance. The servers in our platform provide all of the features of our product suite, allowing rapid and predictable scaling; and |
◦ | We help meet customers’ Payment Card Industry ("PCI"), Health Insurance Portability and Accountability Act ("HIPAA"), and Service Organization Control ("SOC") needs without impacting performance. Because of our flexible routing and server architecture, we do not need to send PCI traffic off to a separate sub-optimal network. |
Common Use Cases. Our powerful network along with our operational efficiency can easily handle use cases that are traditionally solved by CDNs. Some of these examples include:
• | Infrastructure-agnostic traffic distribution. Support enterprise hybrid and multi-cloud strategies by intelligently routing traffic across different cloud providers, or between cloud and on-premise data centers, regardless of location; |
• | Efficient traffic spike management. Allow enterprises to accommodate traffic spikes by intelligently and rapidly distributing content requests across their network; |
• | Live streaming at scale. Deliver highly-reliable live streaming experiences with minimal interruptions, even when concurrently streaming to large global audiences; |
• | Responsive mobile applications. Serve rapidly-changing mobile content from the edge, enabling end-users to instantly access the very latest news updates, weather forecast, hotel availability, or store inventory from their mobile applications; |
Safety in Depth
We believe that security should be integrated seamlessly into every layer of development: architecture, programming, and operations. That’s why we built security into the fabric of our platform, alongside performance. We provide developers and security operations teams with a fast, safe environment to create, build, and run modern applications with:
• | Operational agility. Our edge cloud platform minimizes risk through instant visibility and control. Security operation teams can use our real-time data feeds to see threats and exposures to vulnerabilities as they emerge. Our products are designed to make rule changes on the fly and update policies around the globe in seconds based on real-time traffic insights, without having to engage professional services. These features allow our security offerings to integrate into enterprise security software development cycles, thereby supporting modern DevSecOps practices. |
• | Performance centric. Fastly’s security offerings allow developers to iterate and test code quickly, while providing security teams with tools that reduce risk without impeding performance. Our high-bandwidth, globally distributed network naturally scales to absorb disruptive DDoS attacks. Our WAF and bot detection solutions are built into our edge cloud platform, allowing us to protect web-based applications with minimal latency. |
• | Serverless security. Fastly’s platform provides a secure, serverless development platform at the edge. It is designed to deploy custom applications, without impacting production traffic or having to worry about patching servers for the latest operating system vulnerabilities. Customers can spin up a sandbox environment which automatically executes code for a limited period of time and rapidly decommission it, significantly reducing the attack surface. |
Customer Empowerment Philosophy
Fastly was built by developers, for developers. We believe in empowering our customers to build great things, while collaborating with them to promote their success. We have a unique understanding of what it takes to deliver a frictionless customer experience by providing:
9
• | Freedom to try. Our free trial allows developers to sign up and start experimenting with our edge cloud platform in a frictionless, self-service manner; |
• | Flexible support model. Developers are free to program on our edge cloud platform, taking advantage of our rich documentation and expertise of our developer community. For customers who require more guidance, we provide a range of support packages and access to deep technical expertise from front-of-line support staff to technical account managers; and |
• | Partner friendly. Just as we expose the ability to program at the edge to our customer base, we extend that power and functionality to our partners as well. This allows our partners to build out applications that run at the edge, and provide a feature or service that is complementary to our platform. We enable these integrations with a focus on API-support and a large number of code libraries. |
Growth Strategy
Key elements of our growth strategy include the following:
• | Invest in our technology platform. We intend to continue to invest in our large-scale, enterprise-grade edge cloud platform which is both developer-friendly and fully programmable. We will strengthen our investment in research and development so that we can add new and differentiated products on top of our edge cloud platform. Since the end of 2014, we have grown our research and development team by a factor of five, from 36 to 191 people as of December 31, 2019, deepening our talent across multiple functional groups; |
• | Expansion into additional vertical markets. Our platform offers a broad range of capabilities, and our customers have diverse needs. To best serve these needs we have successfully adopted a vertical approach to our sales and marketing efforts. We intend to build upon our initial success in digital publishing, media and entertainment, technology, online retail, travel and hospitality, and financial technology services, while expanding into new markets over time; |
• | Further enable channel partners. Our edge cloud platform is the backend of choice for many of the largest Platform as a Service ("PaaS") vendors serving the developer community. These PaaS vendors aggregate millions of unique web properties under one brand, using Fastly as their edge cloud. We believe that more and more web applications will be built on convenient and powerful out-of-the-box solutions offered by large PaaS vendors. Many of our solution partners are PaaS providers who built us into their platform to offer faster, more secure and scalable experience. Current examples include Brightcove, Shopify, Drupal, Magento, WIX, and Adobe Portfolio. As our partners expand their customer base, we will grow alongside them, providing us with exposure to millions of developers who will become familiar with us, and potentially become customers themselves; |
• | Invest in marketing. Our developer customers have been our best marketers. Historically, we have grown based on word-of-mouth and delivering a great product, and have invested relatively small amounts in marketing. In year ended December 31, 2019, we spent a total of $71.1 million in sales and marketing. As we look towards our next stage of growth, we plan on significantly increasing our brand and digital marketing efforts, running campaigns that target both developers and business decision makers across different verticals; |
• | Expand existing customer relationships. Over time, our customers have expanded their use of our platform. For the years ended December 31, 2019, December 31, 2018, and December 31, 2017, our DBNER was 135.5%, 132.0%, and 147.3%, respectively, highlighting the strength of our platform. Many of our largest customers have grown through a "land and expand" strategy. On average, our customers have increased their annual spend by more than 20% year over year since 2014, growing from an average last 12-months revenue of $35,000 to over $110,000 as of December 31, 2019. In more technically savvy organizations, developers have championed our solution, paving the way for us to engage with business decision makers. For more traditional organizations, we are often brought in to initially help facilitate a move to the cloud and from there we extend our product to support many other use cases. We plan to continually increase wallet-share over time for existing customers as we build out new products and features, and as customers continue to fully recognize the value of our platform; |
10
• | Grow our technology ecosystem. We operate between the "big 3" origin cloud platforms and a growing community of companies that provide big data, machine learning, and security solutions. In this sense, we act as the unifying layer for a growing number of cloud services. Current partnerships and integrations include Sumo Logic, Amazon Web Services ("AWS"), Azure, and Google Cloud Platform. As customers consume more cloud and software as a service (“SaaS") offerings, we can create additional value and grow with our partners; and |
• | Extend our global footprint. As our customer base grows, we plan to aggressively scale our network accordingly. For the years ended December 31, 2019 and December 31, 2018, 29% and 23%, respectively, of our revenue was generated from customers headquartered outside of the United States. We are expanding our global corporate footprint to support these international customers. As of December 31, 2019, we had 68 POPs strategically located in 53 markets, with more additions planned. We believe significant opportunity exists for further international growth. |
Our Products
Our edge cloud is a globally distributed, programmable platform designed for highly performant and secure web and application delivery. Our platform supports modern software development processes. We call it the Developer’s Edge, because it empowers developers to innovate without constraints, as they lead the charge for their organizations’ digital transformation.
We operate a single, software-centric network. Our POPs reside between a customer’s end-users and computing and data storage solutions, whether on-premise, in the cloud or a mixture of both. Our position on the network allows us to move functionality closer to end-users at the network edge for faster, more secure experiences. This includes edge compute, edge delivery, edge security, edge applications like load balancing and image optimization, video on demand, and managed edge delivery.
Edge Compute
We enable developers to write their own custom logic to solve complex business problems at the network edge.
• | Compute@Edge. Launched in beta in November 2019, this next generation serverless offering is intended to provide developers with a powerful new language-agnostic compute environment. From our inception, we have given developers the ability to use VCL to build more complex applications on our edge cloud platform. Compute@Edge is designed to support other popular coding languages. Like all our offerings, Compute@Edge is built to be secure, performant and scalable; at 35.4 microseconds it offers a 100x faster startup times than other solutions on the market. |
• | Build on Fastly. This is a collection of 80+ code-based solutions designed to help developers solve problems faster and safer at the edge. Developers can take advantage of pre-built code developed by Fastly experts (and other customers) to do A/B testing, waiting rooms, website redirects, geofencing and much more on the edge. Step-by-step tutorials walk them through both simple configurations and more advanced solutions. |
• | Edge Features. These are the building blocks which developers can use alongside our Build on Fastly solution library. Combining edge features with pre-built code from our library empowers developers to create complete solutions to solve problems at the edge. |
• | Client Insights. Gives developers the ability to rapidly adjust the content served to end-users based on location, device type, and language detection. |
• | Edge Dictionaries. Empower developers to make real-time decisions from every server in our network. Edge dictionaries act as a distributed database at the edge, made up of key-value pairs. For example, Edge Dictionaries allow customers to redirect end-users to a specific country site or update large referrer spam blacklists in real time. |
• | Edge Access Control Lists ("ACLs"). Help mitigate evolving threats from attackers by letting developers make changes at scale. ACLs block bad internet protocol ("IP") addresses from visiting customer sites, and for added security, they can create their own allow-lists. |
11
Edge Delivery
Our edge delivery offerings include full site delivery and streaming for high value media.
Full Site Delivery
• | Dynamic Site Acceleration. Speeds up requests and responses between cache nodes in our POPs and customers’ origin servers, so their web and mobile content is served faster; |
• | Origin Shield. Allows us to designate a specific POP to serve as a shield for a customer’s origin servers. When web content is refreshed, and multiple end-users request the new content simultaneously, it can lead to a deluge of requests hitting a customer’s origin server. This can result in poor web or application performance. With Origin Shield, we collapse all these content requests into a single request and hold it in queue at the Origin Shield POP. That allows us to go back to the customer’s origin server only once to retrieve the new content, then serve it to all end-users who requested it. This approach reduces costs for our customers, while improving performance for their end-users; |
• | Instant Purge. Lets customers clear the cached copy of their content in an average of 150 milliseconds or less. We allow customers to send a command to our platform that invalidates an old version of their content throughout our global edge infrastructure. This causes a new version of content be retrieved from the application server the next time it is requested. This feature enables our customers to serve highly dynamic content at the edge more quickly and allows for delightful application experiences. Rapidly changing content like shopping cart items, flight search results, sports scores, or current weather conditions in any given location can all be served faster from the network edge; |
• | Surrogate Keys. Allow customers to fine-tune purging by tagging related objects across their site with a key name and description, then purging by that key. They can purge their entire site of a given object or objects at once, without impacting performance. For example, they could purge any images and content related to discontinued sale items, discounted products, or outdated news across their site all in one go; and |
• | Real-time Logging and Stats. Provide metrics and full visibility into end-user requests in real time from the network edge. Log traffic is encrypted using Transport Layer Security ("TLS") and logs can be streamed to most major logging endpoint solutions. |
Streaming
• | Live Streaming. Our platform is designed to concurrently deliver millions of near real-time, high-quality live streams to our customers’ viewers. Our edge cloud supports the delivery of all major HTTP video streaming formats, and we partner with multiple online video platform vendors to improve the flexibility and scale of live streaming workflows, while also reducing total cost of ownership; |
• | Media Shield. Large streaming customers often route traffic across multiple CDNs for redundancy. Our Media Shield solution supports these efforts, while reducing total cost of ownership and improving visibility and performance. It does so by collapsing requests for the same video streaming content across all CDNs into one single request to the customer’s origin server. This reduces requests to origin and allows us to serve streaming content faster; and |
• | Origin Connect. Ideal for companies moving more than one gigabyte of data, such as media, video, and streaming companies, Origin Connect provides a direct private network connection between an organization’s origin server and an Origin Shield POP. It is an effective way to lower transit costs, reduce engineering complexity, and improve reliability for high-volume streaming content. |
Edge Security
• | DDoS. Our high-bandwidth, globally distributed network is built to absorb DDoS attacks without impacting performance. Customers can respond to attacks in real time, filtering malicious requests at the network edge, before they reach their origin. |
12
• | WAF. Our WAF is designed to protect applications from malicious attacks that would otherwise compromise web servers. It is integrated into our edge cloud platform, minimizing the impact on performance, since we only inspect requests going to a customer’s origin. Customers get real-time access to security events and notifications from the edge and can make instant changes to their WAF rules via our API. |
• | TLS. As part of our standard product, our platform terminates HTTPS connections at our network edge, offloading encrypted traffic from customer’s web servers for better performance. We provide a number of different certificate hosting options. |
• | Platform TLS. Our Platform TLS offering is designed to allow customers with multiple web properties to manage TLS certificates at scale, while enabling a fast, secure experience for their end-users. It supports delivery and management of hundreds of thousands of certificates, supported by our worldwide TLS termination and acceleration solution. |
• | Compliance. We speed up the caching and delivery of sensitive content at the edge, helping customers meet data compliance and privacy regulations such as HIPAA and the General Data Protection Regulation ("GDPR"), in addition to industry standards such as PCI Data Security Standard and SOC. Our Assurance Services offering includes support for additional documentation and audit procedures for customers with these needs. |
Edge Applications
• | Load Balancer. Our Layer 7 load balancer manages HTTP/HTTPS requests to a customer’s origin using granular content-aware routing decisions. We allow customers to manage traffic across multiple IaaS providers, data centers, and hybrid clouds. We also provide improved performance and cost savings over ADCs, especially during a spike or surge in traffic. |
• | Image Optimizer. We offer a real-time image manipulation and delivery service and store transformations at the edge. When an image is requested, we resize it, adjust quality, crop/trim, change orientations, convert formats, and more, all on demand. Transforming images at the edge eliminates latency and reduces traffic to a customer’s origin servers, allowing them to save on infrastructure and egress costs. |
Video on Demand
• | Our edge cloud platform is designed to cache and rapidly deliver both frequently and infrequently requested on-demand videos. We significantly reduce the load on a customer’s origin servers while accelerating time to first frame. Our on-the-fly-packaging feature facilitates immediate playback, enhancing viewer experiences across multiple devices and platforms. |
Managed Edge Delivery
• | Our managed delivery service provides customers with maximum flexibility and control. We deploy our edge cloud platform on dedicated POPs within a customer’s private network, at locations of their choosing. This service can be used exclusively, or as part of a hybrid, multi-CDN strategy. |
Partner Ecosystem
Our partner ecosystem consists of companies who build edge applications to integrate with our platform, logging and analytics providers, and PaaS providers. Our partners are all looking to extend the power of our edge cloud platform to their customers.
Edge Application Partners
Our edge cloud platform exposes blocks of code that allow trusted partners to develop real-time analysis and enforcement applications. Building out a massive edge presence is beyond the financial and technical capabilities of all but a handful of companies. By opening our platform to third parties, we allow these partners to focus on building new and innovative edge applications, without the capital outlay and complexity of doing it themselves. It opens up new markets and business models for them.
13
Logging and Analytics Partners
Logging and analytics partners integrate with our edge cloud platform to deliver enhanced functionality to our joint customers. Our logging feature provides insights into web and mobile requests and response, such as slow or missing URLs, most requested URLs, site performance by region, and much more. Our statistics provide insights into things like percentage of requests per second, request misses, errors, latency, traffic spikes, and global traffic profiles. Both logs and statistics can be streamed in real time to our logging and analytics partners. This empowers our joint customers to monitor performance, troubleshoot issues as they occur, and view this data alongside other metrics in consolidated dashboards. Logging and analytics partners include the following:
• | Google. A tight integration with Google Cloud Platform allows real-time logs to be streamed to any Google Cloud Platform big data service, including Google Cloud Storage, BigQuery, and Bigtable; |
• | Microsoft. Our integration with Microsoft Azure allows real-time logs to be streamed to both Azure Blob Storage and Kusto; |
• | Datadog. Datadog uses our API to pull in real-time stats and analytics for display in their dashboard; |
• | Looker. Looker combines log data with other data sources in BigQuery, such as Google Analytics, Google Ads data, or security and firewall data. Customers can then run multiple queries against these data sets and present findings in Looker dashboards; |
• | Sumo Logic. Sumo Logic integrates with our platform to offer more granular logging data for customers with large-scale analytics. Customers gain real-time insights into slow URLs, missing or most requested URLs, site performance by region, and more; and |
• | Logentries. Logentries provides a one-click integration with our platform, making it easy for customers to quickly set up real-time logs. |
PaaS Partners
PaaS partners integrate with our edge cloud platform to make it easier for their developers to scale and secure websites.
• | Heroku. Heroku empowers companies to build, deliver, monitor, and scale applications. Our Heroku add-on lets developers seamlessly integrate their Heroku hosted applications with our edge cloud platform through the click of a button; |
• | Magento. Magento, an Adobe company, provides a commerce platform that enables merchants to integrate digital and physical shopping experiences. Our Magento extension lets developers manage their entire content caching strategy from the Magento control panel while maintaining fast, reliable performance; and |
• | Drupal and Wordpress. Drupal and Wordpress are CMS partners. They provide self-hosted solutions for customers to create and manage all the content on their websites. Our Drupal and Wordpress extensions allow developers to easily configure and manage their content caching strategy from within these CMS dashboards. |
14
Our Culture and Employees
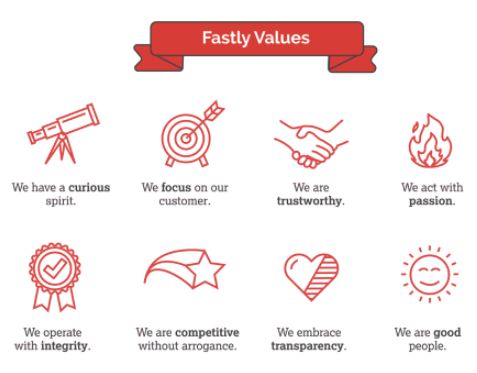
Our Values
Technology has the potential to make a radically positive impact on the world, and we aspire to improve human lives through our work. We were founded on strong ethical principles, and have intentionally grown values-first, scaling our workforce, services, customer portfolio, and investment partners purposefully. We are only as good as the company we keep, and this guides our hiring practices as well as the ethics we are committed to upholding as we scale. We believe that as a result of our values, we have been able to attract great people. We want to serve the very best of the internet. We choose to work with customers that we believe have integrity, are trustworthy, and do not promote violence or hate. Our eight core values define who we are and how we choose to grow, hire, train, work, communicate, make decisions, support each other, and serve our customers.
Hiring Strategy
We are dedicated to building a diverse workforce and leadership team that reflects our values and the unique needs of our global customer base. We strive to be a company full of kind, honest, passionate, and high-integrity people. We believe in investing in our people and providing talented individuals with a strong growth path. Our U.S. support engineers are often hired from code schools, and many code school graduates transition from support into other organizations within the company, championing the customer voice and infusing our teams with a strong, service-focused mindset. Our engineering staff recruits world-class experts in every part of the technology stack that makes up the internet, which inspires great developers to join us. We are building a diverse workforce and inclusive culture that empowers and supports our employees and customers.
Employees
As of December 31, 2019, we had a total of 630 employees worldwide, including 116 employees located outside of the United States. Our remote-friendly culture allows us to recruit and retain skilled professionals wherever we find them, so our employees are spread across multiple cities in 16 different countries. Approximately 32% of our employees were based in our headquarters in San Francisco, California as of December 31, 2019.
15
Organization
Sales & Marketing
Our go-to-market model initially focused on reaching and serving the needs of developers. We reach developers through working groups, community events, conferences, and word-of-mouth. Our platform was built to empower developers to innovate at their own pace, so our platform is accessible, transparent, and self-service.
Our self-serve pricing matrix is publicly available and allows for customers to receive automatic tiered discounts as their usage of our products increases. Some organizations choose to enter into negotiated contracts with us. These contracts typically include specific pricing and a minimum monthly commitment. As developers have expanded their usage of our platform, our relationships have evolved to include business leaders within their organizations.
Our sales and marketing organizations work together closely to cultivate customer relationships with developers and business leaders at enterprises and technology-savvy organizations to drive revenue growth. We have vertically-based sales teams that continue to enhance our value-based selling methodology. Our land and expand sales strategy for enterprise customers has successfully demonstrated our platform’s capabilities, and our customer support enables broad adoption of our technology within an organization.
We also offer a trial to developers who sign up, which includes a free balance for testing and experimentation. We do this in order to strengthen our relationship and reputation within the developer community by providing these developers with the ability to familiarize themselves with our platform without first becoming a paying customer. Once signed up, developers can easily access our programmable interface, extensive self-service documentation, and customer support team. Our low-friction trial experience allows developers to validate that our edge platform works for them at no cost or risk.
Research & Development
Our research and development team members are responsible for the design, development, and reliability of all aspects of our edge cloud platform. Continuous improvement and innovation are core to our DNA, and these efforts are baked directly into our service life cycle. Scale, performance, security, and reliability are core functional requirements of everything we build into our platform to serve our customers.
Our philosophy of customer empowerment guides our research processes. Our product managers regularly engage with customers and the developer, DevOps and site reliability engineering communities, as well as our internal stakeholders and subject matter experts, in order to understand customer needs. Our engineering team is comprised of experts with deep experience, who intimately understand customers’ technical challenges and build solutions accordingly.
Throughout the strategic, design, and build phases of our product life cycle, our development organization works closely with our product, infrastructure, operations, and compliance teams to design, develop, test, and launch any given solution. We strive for a balance of rapid iteration without compromise on the core functional requirements that our customers expect: scale, performance, security, and reliability.
As of December 31, 2019, we had 191 employees in our research and development group. Our research and development expenses were $46.5 million in the year ended December 31, 2019. Approximately 28% of our research and development group were based in our headquarters in San Francisco, California as of December 31, 2019.
16
Infrastructure
Our infrastructure team is responsible for the design, deployment, and maintenance of the servers and network hardware that form the foundation of our mission critical environment in 68 POPs in 53 markets as of December 31, 2019. We invest in research into global internet geography to identify optimal colocation site selection, network partner identification, and network-to-network interconnection opportunities. These activities allow us to connect in close proximity to core internet backbones and ISPs, thereby enhancing network performance. We carefully evaluate and test hardware from leading server, network, and component manufacturers to ensure they comply with our workload performance, system efficiency, and mean time-to-repair standards. In our process, we evaluate commodity server and network platforms to avoid vendor lock-in, while optimizing the mix of components in an effort to improve efficiency and optimize our capital expenditures. We intend to grow the number of data center colocation sites as traffic on our network grows and as demands for new markets justify investment.
Trust
We uphold transparency and trustworthiness as company values. Our security, compliance and data governance teams, as well as other departments across the company, continually iterate on our trust programs to better meet growing customer needs, updated regulatory requirements, and the evolving security threat landscape. To help validate the controls that safeguard our platform and the data moving through it, we have expanded our portfolio of security and compliance-related assessments and certifications over time.
Customer Support
We have designed our products and platform to be self-service and require minimal customer support. Customers are automatically covered by our standard support plan, free of charge, as soon as they sign up with us. They can file a ticket with the support team, access documentation including online FAQs, API references, and configuration guidelines. Our support approach is unique as we have built it with developers in mind. Our first-line support employee typically has an engineering background and is highly technical.
We also provide several options for premier, hands-on support from a team of highly-technical senior support engineers and technical account managers. They act as a single point of contact for our support, product and engineering teams. Our support model is global, with 24/7 coverage and support offices located throughout the United States, the United Kingdom, and Japan.
Partnerships & Strategic Relationships
We believe that building a strong partner ecosystem helps amplify our reach and time-to-market, while providing our customers with enhanced value from our joint offerings. By investing in these partnerships, we hope to improve customer satisfaction and retention rates. Our partners and strategic alliances include:
• | Integration Partners |
• | Solutions Partners |
• | Referral and Reseller Partners |
• | Central Cloud Partners |
Competition
Our platform spans several markets from cloud computing and cloud security to CDNs. We segment the competitive landscape into four key categories:
• | Legacy CDNs like Akamai, Limelight, EdgeCast (part of Verizon Digital Media), Level3, and Imperva (for security); |
• | Small business focused CDNs like InStart, Cloudflare, StackPath, and Section.io; |
17
• | Cloud providers who are starting to offer compute functionality at the edge like Amazon’s CloudFront, AWS Lambda, and Google Cloud Platform; and |
• | Traditional data center and appliance vendors like F5, Citrix, A10 Networks, Cisco, Imperva, Radware, and Arbor, as well as networks that offer a range of on-premise solutions for load balancing, WAF, and DDoS. |
The principle competitive factors in our market include:
• | Platform scalability and performance; |
• | Global network coverage; |
• | Platform reliability and security; |
• | Ease of integration and programmability; |
• | Credibility with developers; |
• | Ability to support modern application development processes; |
• | Brand awareness, reputation, and trust; |
• | Strength of our sales and marketing efforts; |
• | Quality of customer support; and |
• | Price and network cost savings. |
We believe we generally compete favorably with our competitors on the basis of these factors. Our edge cloud platform integrates many of the point products offered by our competitors which is a key differentiator. However, many of our competitors have substantially greater financial and technical resources in addition to larger sales and marketing budgets, broader market distribution, and more mature intellectual property portfolios.
Intellectual Property
We rely on a combination of patent, copyright, trademark, and trade secret laws in the United States and other jurisdictions, as well as license agreements and other contractual protections, to protect our proprietary technology. We also rely on a number of registered and unregistered trademarks to protect our brand.
As of December 31, 2019, in the United States, we had 40 issued patents, which expire between September 2033 and June 2037, 47 patent applications pending for examination, as well as 10 pending provisional applications. As of such date, we also had nine issued patents and 32 patent applications pending for examination in foreign jurisdictions and 26 Patent Cooperation Treaty patent applications pending for examination, all of which are related to U.S. patents and patent applications. In addition, as of December 31, 2019, we had 10 registered trademarks in the United States.
In addition, we seek to protect our intellectual property rights by requiring our employees and independent contractors involved in development of intellectual property on our behalf to enter into agreements acknowledging that all works or other intellectual property generated or conceived by them on our behalf are our property, and assigning to us any rights, including intellectual property rights, that they may claim or otherwise have in those works or property, to the extent allowable under applicable law.
Despite our efforts to protect our technology and proprietary rights through intellectual property rights, licenses, and other contractual protections, unauthorized parties may still copy or otherwise obtain and use our software and other technology. In addition, we intend to continue to expand our international operations, and effective intellectual property, copyright, trademark, and trade secret protection may be unavailable or limited in foreign countries. Any significant impairment of our intellectual property rights could harm our business or our ability to compete. Further, companies in the communications and technology industries own large numbers of patents, copyrights, and trademarks and frequently threaten litigation, or file suit based on allegations of infringement or other violations of intellectual property rights. We are currently subject to, and
18
expect to face in the future, allegations that we have infringed the intellectual property rights of third parties. From time to time, we also receive demands for indemnification from our customers under the terms of our contracts with them for infringement of a third-party’s intellectual property rights.
Legal Proceedings
From time to time, we have been and will continue to be subject to legal proceedings and claims. We are not presently a party to any legal proceedings that, if determined adversely to us, would individually or taken together have a material adverse effect on our business, results of operations, financial condition, or cash flows. We have received, and may in the future continue to receive, claims from third parties asserting, among other things, infringement of their intellectual property rights. Future litigation may be necessary to defend ourselves, our partners, and our customers by determining the scope, enforceability, and validity of third-party proprietary rights, or to establish our proprietary rights. The results of any current or future litigation cannot be predicted with certainty, and regardless of the outcome, litigation can have an adverse impact on us because of defense and settlement costs, diversion of management resources, and other factors.
Corporate Information
We were initially incorporated under the laws of the State of Delaware in March 2011 under the name SkyCache, Inc. We changed our name to Fastly, Inc. in May 2012. Our principal executive offices are located at 475 Brannan Street, Suite 300, San Francisco, California 94107. Our telephone number is 1-844-432-7859. Our website address is www.fastly.com. The information contained on, or that can be accessed through, our website does not constitute part of this Annual Report on Form 10-K.
We file annual reports on Form 10-K, quarterly reports on Form 10-Q, current reports on Form 8-K, and amendments to reports filed or furnished pursuant to Sections 13(a), 14 and 15(d) of the Exchange Act. The SEC maintains a website at https://www.sec.gov that contains reports, and other information regarding us and other companies that file materials with the SEC electronically. Copies of our reports on Forms 10-K, Forms 10-Q, and Forms 8-K, may be obtained, free of charge, electronically through our investor relations website at https://fastly.com/investors as soon as reasonably practicable after we file such material with, or furnish such material to, the SEC.
19
Item 1A. Risk Factors
Investing in our Class A common stock involves a high degree of risk. Investors should carefully consider the risks and uncertainties described below, together with all of the other information contained in this Annual Report on Form 10-K, including the section titled "Management's Discussion and Analysis of Financial Condition and Results of Operations" and our consolidated financial statements and related notes, before deciding to invest in our Class A common stock. Unless otherwise indicated, references to our business being harmed in these risk factors will include harm to our business, reputation, customer growth, results of operations, financial condition, or prospects. Any of these events could cause the trading price of our Class A common stock to decline, which would cause our stockholders to lose all or part of their investment. Our business, results of operations, financial condition, or prospects could also be harmed by risks and uncertainties not currently known to us or that we currently do not believe are material.
Risks Related to Our Business and Industry
If we are unable to attract new customers, our business will be harmed.
To grow our business, we must continue to attract new customers. To do so, we must successfully convince potential customers of the benefits and the value of our platform. This may require significant and costly sales efforts that are targeted at larger enterprises and senior management of these potential customers. These factors significantly impact our ability to add new customers and increase the time, resources, and sophistication required to do so. In addition, numerous other factors, many of which are out of our control, may now or in the future impact our ability to acquire new customers, including potential customers’ commitments to other providers, real or perceived costs of switching to our platform, our failure to expand, retain, and motivate our sales and marketing personnel, our failure to develop or expand relationships with potential customers and channel partners, failure by us to help our customers to successfully deploy our platform, negative media or industry or financial analyst commentary regarding us or our solutions, litigation, and deteriorating general economic conditions. Any of these factors could impact our ability to attract new customers to our platform. As a result of these and other factors, we may be unable to attract new customers, which would harm our business.
Our business depends on customers increasing their use of our platform, and any loss of customers or decline in their use of our platform could harm our business.
Our ability to grow and generate incremental revenue depends, in part, on our ability to maintain and grow our relationships with existing customers and to have them increase their usage of our platform. If our customers do not increase their use of our platform, our revenue may decline and our results of operations may be harmed. Customers are charged based on the usage of our platform. Most of our customers do not have long-term contractual financial commitments to us, and therefore, most of our customers may reduce or cease their use of our products at any time without penalty or termination charges. Customers may terminate or reduce their use of our platform for any number of reasons.
In order for us to maintain or improve our results of operations, it is important that our customers use our platform in excess of their commitment levels, if any, and continue to use our platform on the same or more favorable terms. Our ability to retain our customers and expand their usage could be impaired for a variety of reasons. For example, our customers may choose to use other providers. Because our customers’ minimum usage commitments for our platform are relatively low compared to their expected usage, it can be easy for certain customers to reallocate usage or switch from our platform to an alternative platform altogether. In addition, even if our customers expand their usage of our platform, we cannot guarantee that they will maintain those usage levels for any meaningful period of time. If any of these events were to occur, our business may be harmed.
Our usage and revenue may decline or fluctuate as a result of a number of factors, including customer budget constraints, customer satisfaction, changes in our customers’ underlying businesses, changes in the type and size of our customers, pricing changes, competitive conditions, the acquisition of our customers by other companies, and general economic conditions. In addition, our customers currently have no obligation to renew their commitments for our platform after the expiration of their contract term, and a majority of our current customer contracts are only one year in duration. The loss of customers or reductions in their usage of our platform may each have a negative impact on our business, results of operations, and financial condition. If our customers reduce their usage of or do not continue to use our platform, our revenue and other results of operations will decline and our business will suffer. In addition, existing customers may negotiate lower rates for their usage in exchange for an agreement to renew, expand their usage in the future, or adopt new products. As a result, these customers may
20
not reduce their usage of our platform, but the revenue we derive from that usage will decrease. If our usage or revenue fall significantly below the expectations of the public market, securities analysts, or investors, our business would be harmed.
Our future success also depends in part on our ability to expand our existing customer relationships by selling additional products to our existing customers. The rate at which our customers purchase products from us depends on a number of factors, including general economic conditions and pricing and services offered by our competitors. If our efforts to sell additional products to our customers are not successful, our business may be harmed.
If our platform fails to perform properly due to defects, interruptions, delays in performance. or similar problems, and if we fail to develop enhancements to resolve any defect, interruption, delay, or other problems, we could lose customers, become subject to service performance or warranty claims or incur significant costs.
Our operations are dependent upon our ability to prevent system interruption. The applications underlying our edge cloud computing platform are inherently complex and may contain material defects or errors, which may cause disruptions in availability or other performance problems. We have from time to time found defects and errors in our platform and may discover additional defects or errors in the future that could result in data unavailability, unauthorized access to, loss, corruption, or other harm to our customers’ data. These defects or errors could also be found in third-party applications or open source software on which we rely. We may not be able to detect and correct defects or errors before implementing our products. Consequently, we or our customers may discover defects or errors after our products have been deployed.
We currently serve our customers from our POPs located in 53 markets. Our customers need to be able to access our platform at any time, without interruption or degradation of performance. However, we have not developed redundancies for all aspects of our platform. We depend, in part, on our third-party facility providers’ ability to protect these facilities against damage or interruption from natural disasters, power or telecommunications failures, criminal acts, public health issues, such as the recent outbreak of coronavirus (COVID-2019), and similar events. In some cases, third-party cloud providers run their own platforms that we access, and we are, therefore, vulnerable to their service interruptions. In the event that there are any defects or errors in software, failures of hardware, damages to a facility, or misconfigurations of any of our services, we may have to divert resources away from other planned work, could experience lengthy interruptions in our platform, and also incur delays and additional expenses in arranging new facilities and services. Our customers may choose to divert their traffic away from our platform as a result of interruptions or delays. Disaster recovery arrangements, including the existence of redundant data centers that are designed to become active during certain lapses of service, may not function as intended, and any disruptions to our service could harm our business.
We design our system infrastructure and procure and own or lease the computer hardware used for our platform. Design and mechanical errors, spikes in usage volume, and failure to follow system protocols and procedures could cause our systems to fail, resulting in interruptions on our platform. Moreover, we have experienced and may in the future experience system failures or interruptions in our platform as a result of human error. Any interruptions or delays in our platform, whether caused by our products or our data centers, third-party error, our own error, natural disasters, public health issues, or security breaches, or whether accidental or willful, could harm our relationships with customers, reduce customers’ usage of our platform, cause our revenue to decrease and/or our expenses to increase, and divert resources away from product development. Also, in the event of damage or interruption, our insurance policies may not adequately compensate us for any losses that we may incur. These factors in turn could further reduce our revenue, subject us to liability and cause us to issue service credits or cause customers to fail to renew their customer contracts, any of which could harm our business.
The occurrence of any defects, errors, disruptions in service, failures involving redundant data centers, or other performance problems, interruptions, or delays with our platform, whether in connection with the day-to-day operations or otherwise, could result in:
• | loss of customers; |
• | reduced customer usage of our platforms; |
• | lost or delayed market acceptance and sales of our products, or the failure to launch products or features on anticipated timelines; |
• | delays in payment to us by customers; |
21
• | injury to our reputation and brand; |
• | legal claims, including warranty and service level agreement claims, against us; or |
• | diversion of our resources, including through increased service and warranty expenses or financial concessions, and increased insurance costs. |
The costs incurred in correcting any material defects, errors, or other performance problems in our platform may be substantial and could harm our business.
If we fail to forecast our revenue accurately, or if we fail to manage our expenditures, our operating results could be adversely affected.
Because our recent growth has resulted in the rapid expansion of our business and revenues, we do not have a long history upon which to base forecasts of future revenue and operating results. We cannot accurately predict customers’ usage or renewal rates given the diversity of our customer base across industries, geographies and size, and other factors. Accordingly, we may be unable to accurately forecast our revenues notwithstanding our substantial investments in sales and marketing, infrastructure, and research and development in anticipation of continued growth in our business. If we do not realize returns on these investments in our growth, our results of operations could differ materially from our forecasts, which would adversely affect our results of operations and could disappoint analysts and investors, causing our stock price to decline.
Our limited operating history and our history of operating losses makes it difficult to evaluate our current business and prospects and may increase the risks associated with your investment.
We were founded in 2011 and have experienced net losses and negative cash flows from operations since inception. Our limited operating history makes it difficult to evaluate our current business and our future prospects, including our ability to plan for and model future growth. We have encountered and will continue to encounter risks and difficulties frequently experienced by rapidly growing companies in constantly evolving industries, including the risks described in this prospectus. If we do not address these risks successfully, our business may be harmed.
We generated a net loss of $51.6 million for the year ended December 31, 2019, and as of December 31, 2019, we had an accumulated deficit of $192.0 million. We will need to generate and sustain increased revenue levels and manage costs in future periods in order to become profitable; even if we achieve profitability, we may not be able to maintain or increase our level of profitability. We intend to continue to expend significant funds to support further growth and further develop our platform, including expanding the functionality of our platform, expanding our technology infrastructure and business systems to meet the needs of our customers, expanding our direct sales force and partner ecosystem, increasing our marketing activities, and growing our international operations. We will also face increased compliance costs associated with growth, expansion of our customer base, and the costs of being a public company. Our efforts to grow our business may be costlier than we expect, and we may not be able to increase our revenue enough to offset our increased operating expenses. We may incur significant losses in the future for a number of reasons, including the other risks described herein, and unforeseen expenses, difficulties, complications and delays, and other unknown events. If we are unable to achieve and sustain profitability, our business may be harmed.
Further, we have limited historical financial data and operate in a rapidly evolving market. As such, any predictions about our future revenue and expenses may not be as accurate as they would be if we had a longer operating history or operated in a more predictable market.
If we fail to adapt and respond effectively to rapidly changing technology, evolving industry standards, changing regulations, and changing customer needs, requirements, or preferences, our products may become less competitive.
The market in which we compete is relatively new and subject to rapid technological change, evolving industry standards and regulatory changes, as well as changing customer needs, requirements, and preferences. The success of our business will depend, in part, on our ability to adapt and respond effectively to these changes on a timely basis. If we are unable to develop and sell new products that satisfy our customers and provide enhancements, new features, and capabilities to our platform that keep pace with rapid technological and industry change, our revenue and operating results could be adversely affected. If new technologies emerge that enable our competitors to deliver competitive products and applications at lower prices, more efficiently, more conveniently, or more securely, such technologies could adversely impact our ability to compete. If our
22
platform does not allow us or our customers to comply with the latest regulatory requirements, our existing customers may decrease their usage on our platform and new customers will be less likely to adopt out platform.
Our platform must also integrate with a variety of network, hardware, mobile, and software platforms and technologies, and we need to continuously modify and enhance our products and platform capabilities to adapt to changes and innovation in these technologies. If developers widely adopt new software platforms, we would have to attempt to develop new versions of our products and enhance our platform’s capabilities to work with those new platforms. These development efforts may require significant engineering, marketing, and sales resources, all of which would affect our business and operating results. Any failure of our platform’s capabilities to operate effectively with future infrastructure platforms, technologies, and software platforms could reduce the demand for our platform. If we are unable to respond to these changes in a cost-effective manner, our products may become less marketable and less competitive or obsolete, and our business may be harmed.
Moreover, our platform is highly technical and complex and relies on the Varnish Configuration Language ("VCL"). Potential developers may be unfamiliar or opposed to working with VCL and therefore decide to not adopt our platform, which may harm our business.
Failure to effectively develop and expand our marketing and sales capabilities could harm our ability to increase our customer base and achieve broader market acceptance of our platform.
We have historically benefited from word-of-mouth and other organic marketing to attract new customers. Through this word-of-mouth marketing, we have been able to build our brand with relatively low marketing and sales costs. This strategy has allowed us to build a substantial customer base and community of users who use our products and act as advocates for our brand and our platform, often within their own corporate organizations. However, our ability to further increase our customer base and achieve broader market acceptance of our edge cloud platform will significantly depend on our ability to expand our marketing and sales operations. We plan to continue expanding our sales force and strategic partners, both domestically and internationally. We also plan to dedicate significant resources to sales, marketing, and demand-generation programs, including various online marketing activities as well as targeted account-based advertising. The effectiveness of our targeted account-based advertising has varied over time and may vary in the future. All of these efforts will require us to invest significant financial and other resources and if they fail to attract additional customers our business will be harmed. We have also used a strategy of offering free trial versions of our platform in order to strengthen our relationship and reputation within the developer community by providing these developers with the ability to familiarize themselves with our platform without first becoming a paying customer. However, most trial accounts do not convert to paid versions of our platform, and to date, only a few users who have converted to paying customers have gone on to generate meaningful revenue. If our other lead generation methods do not result in broader market acceptance of our platform and the users of trial versions of our platform do not become, or are unable to convince their organizations to become, paying customers, we will not realize the intended benefits of this strategy, and our business will be harmed.
We believe that there is significant competition for sales personnel, including sales representatives, sales managers, and sales engineers, with the skills and technical knowledge that we require. Our ability to achieve significant revenue growth will depend, in large part, on our success in recruiting, training, and retaining sufficient numbers of sales personnel to support our growth. New hires require significant training and may take significant time before they achieve full productivity. Our recent hires may not become productive as quickly as we expect, if at all, and we may be unable to hire or retain sufficient numbers of qualified individuals in the markets where we do business or plan to do business. In addition, particularly if we continue to grow rapidly, new members of our sales force will have relatively little experience working with us, our platform, and our business model. If we are unable to hire and train sufficient numbers of effective sales personnel, our sales personnel do not reach significant levels of productivity in a timely manner, or our sales personnel are not successful in acquiring new customers or expanding usage by existing customers, our business will be harmed.
The markets in which we participate are competitive, and if we do not compete effectively, our business will be harmed.
The market for cloud computing platforms, particularly enterprise grade products, is highly fragmented, competitive, and constantly evolving. With the introduction of new technologies and market entrants, we expect that the competitive environment in which we compete will remain intense going forward. Legacy Content Delivery Networks ("CDNs"), such as Akamai, Limelight, EdgeCast (part of Verizon Digital Media), Level3, and Imperva, and small business-focused CDNs, such as Cloudflare, InStart, StackPath, and Section.io, offer products that compete with ours. We also compete with cloud providers who are starting to offer compute functionality at the edge like Amazon’s CloudFront, AWS Lambda, and Google Cloud
23
Platform, as well as traditional data center and appliance vendors like F5, Citrix, A10 Networks, Cisco, Imperva, Radware, and Arbor Networks, who offer a range of on-premise solutions for load balancing, WAF, and DDoS. Some of our competitors have made or may make acquisitions or may enter into partnerships or other strategic relationships that may provide more comprehensive offerings than they individually had offered. Such acquisitions or partnerships may help competitors achieve greater economies of scale than us. In addition, new entrants not currently considered to be competitors may enter the market through acquisitions, partnerships, or strategic relationships. We compete on the basis of a number of factors, including:
• | our platform’s functionality, scalability, performance, ease of use, reliability, security availability, and cost effectiveness relative to that of our competitors’ products and services; |
• | our global network coverage; |
• | our ability to utilize new and proprietary technologies to offer services and features previously not available in the marketplace; |
• | our ability to identify new markets, applications, and technologies; |
• | our ability to attract and retain customers; |
• | our brand, reputation, and trustworthiness; |
• | our credibility with developers; |
• | the quality of our customer support; |
• | our ability to recruit software engineers and sales and marketing personnel; and |
• | our ability to protect our intellectual property. |
We face substantial competition from legacy CDNs, small business-focused CDNs, cloud providers, traditional data center, and appliance vendors. In addition, existing and potential customers may not use our platform, or may limit their use, because they pursue a “do-it-yourself” approach by putting in place equipment, software, and other technology products for content and application delivery within their internal systems; enter into relationships directly with network providers instead of relying on an overlay network like ours; or implement multi-vendor policies to reduce reliance on external providers like us.
Our competitors vary in size and in the breadth and scope of the products and services offered. Many of our competitors and potential competitors have greater name recognition, longer operating histories, more established customer relationships and installed customer bases, larger marketing budgets, and greater resources than we do. While some of our competitors provide a platform with applications to support one or more use cases, many others provide point-solutions that address a single use case. Other potential competitors not currently offering competitive applications may expand their product offerings to compete with our platform. Our competitors may be able to respond more quickly and effectively than we can to new or changing opportunities, technologies, standards, and customer requirements. An existing competitor or new entrant could introduce new technology that reduces demand for our platform. In addition to application and technology competition, we face pricing competition. Some of our competitors offer their applications or services at a lower price, which has resulted in pricing pressures. Some of our larger competitors have the operating flexibility to bundle competing applications and services with other offerings, including offering them at a lower price or for no additional cost to customers as part of a larger sale of other products. For all of these reasons, we may not be able to compete successfully and competition could result in the failure of our platform to achieve or maintain market acceptance, any of which could harm our business.
If we fail to maintain and enhance our brand, our ability to expand our customer base will be impaired and our business, results of operations and financial condition may suffer.
We believe that maintaining and enhancing our brand is important to continued market acceptance of our existing and future products, attracting new customers, and retaining existing customers. We also believe that the importance of brand recognition will increase as competition in our market increases. Successfully maintaining and enhancing our brand will depend largely on the effectiveness of our marketing efforts, our ability to provide reliable products that continue to meet the needs of our customers at competitive prices, our ability to maintain our customers’ trust, our ability to continue to develop new functionality and products, and our ability to successfully differentiate our platform from competitive products and services. Additionally, our brand and reputation may be affected if customers do not have a positive experience with our partners’ services. Our brand promotion activities may not generate customer awareness or yield increased revenue, and even if they do,
24
any increased revenue may not offset the expenses we incurred in building our brand. If we fail to successfully promote and maintain our brand, our business may be harmed.
We receive a substantial portion of our revenues from a limited number of customers, and the loss of, or a significant reduction in usage by, one or more of our major customers would result in lower revenues and could harm our business.
Our future success is dependent on establishing and maintaining successful relationships with a diverse set of customers. We currently receive a substantial portion of our revenues from a limited number of customers. For trailing 12 months ended December 31, 2019, our top ten customers accounted for approximately 29% of our revenue, respectively. It is likely that we will continue to be dependent upon a limited number of customers for a significant portion of our revenues for the foreseeable future and, in some cases, the portion of our revenues attributable to individual customers may increase in the future. The loss of one or more key customers or a reduction in usage by any major customers would reduce our revenues. If we fail to maintain existing customers or develop relationships with new customers, our business would be harmed.
We may not be able to scale our business quickly enough to meet our customers’ growing needs. If we are not able to grow efficiently, our business could be harmed.
As usage of our edge cloud computing platform grows and as the breadth of use cases for our platform expands, we will need to devote additional resources to improving our platform architecture, integrating with third-party applications and maintaining infrastructure performance. In addition, we will need to appropriately scale our processes and procedures that support our growing customer base, including increasing our number of POPs around the world and investments in systems, training, and customer support.
Any failure of or delay in these efforts could cause impaired system performance and reduced customer satisfaction. These issues could reduce the attractiveness of our platform to customers, resulting in decreased sales to new customers, lower renewal rates by existing customers, the issuance of service credits, or requested refunds, which would hurt our revenue growth and our reputation. Even if we are able to upgrade our systems and expand our staff, any such expansion will be expensive and complex, and require the dedication of significant management time and attention. We could also face inefficiencies or operational failures as a result of our efforts to scale our cloud infrastructure. We cannot be sure that the expansion and improvements to our cloud infrastructure will be effectively implemented on a timely basis, if at all, and such failures would harm our business.
We may have insufficient transmission bandwidth and colocation space, which could result in disruptions to our platform and loss of revenue.
Our operations are dependent in part upon transmission bandwidth provided by third-party telecommunications network providers and access to colocation facilities to house our servers. There can be no assurance that we are adequately prepared for unexpected increases in bandwidth demands by our customers, particularly when customers experience cyber-attacks. The bandwidth we have contracted to purchase may become unavailable for a variety of reasons, including service outages, payment disputes, network providers going out of business, natural disasters, networks imposing traffic limits, or governments adopting regulations that impact network operations. In some regions, bandwidth providers have their own services that compete with us, or they may choose to develop their own services that will compete with us. These bandwidth providers may become unwilling to sell us adequate transmission bandwidth at fair market prices, if at all. This risk is heightened where market power is concentrated with one or a few major networks. We also may be unable to move quickly enough to augment capacity to reflect growing traffic or security demands. Failure to put in place the capacity we require could result in a reduction in, or disruption of, service to our customers and ultimately a loss of those customers. Such a failure could result in our inability to acquire new customers demanding capacity not available on our platform.
Security incidents and attacks on our platform could lead to significant costs and disruptions that could harm our business, financial results, and reputation.
Our business is dependent on providing our customers with fast, efficient, and reliable distribution of applications and content over the internet. We transmit and store our customers’ information, data, and encryption keys as well as our own; customer information and data may include personally identifiable data of and about their end-users. Maintaining the security and availability of our platform, network, and internal IT systems and the security of information we hold on behalf of our customers is a critical issue for us and our customers. Attacks on our customers and our own network are frequent and take a
25
variety of forms, including DDoS attacks, infrastructure attacks, botnets, malicious file attacks, cross-site scripting, credential abuse, ransomware, bugs, viruses, worms, and malicious software programs. Malicious actors can attempt to fraudulently induce employees or suppliers to disclose sensitive information through spamming, phishing, or other tactics. In addition, unauthorized parties may attempt to gain physical access to our facilities in order to infiltrate our information systems. We have in the past been subject to cyber-attacks from third parties, including parties who we believe are sponsored by government actors. Since our customers share our multi-tenant architecture, an attack on any one of our customers could have a negative effect on other customers. These attacks have significantly increased the bandwidth used on our platform and have strained our network. If attacks like these were to occur in the future and if we do not have the systems and processes in place to respond to them, our business could be harmed.
Security incidents, whether as a result of third-party action, employee or customer error, technology impairment or failure, malfeasance or criminal activity, or hostile state actors, could result in unauthorized access to, or loss or unauthorized disclosure of, customer information and data, including personally identifiable data of and about their end-users. Security incidents involving customer information have in the past resulted in pricing and other concessions, decreased customer usage and terminations by affected customers, and similar security incidents could occur in the future that result in pricing concessions, indemnity obligations, and other possible liabilities related to such unauthorized access, loss or disclosure, including litigation. Further, certain of our insurance policies and the laws of some states may limit or prohibit insurance coverage for punitive or certain other types of damages or liability arising from gross negligence or intentional misconduct of us and our suppliers and we cannot assure you that we are adequately insured against the risks that we face.
In recent years, cyber-attacks have increased in size, sophistication, and complexity, increasing exposure for our customers and us. In addition, as we expand our emphasis on selling security-related products, we may become a more attractive target for attacks on our infrastructure intended to destabilize, overwhelm, or shut down our platform. For example, we have had security incidents in the past that have tested the limits of our infrastructure and impacted the performance of our platform. The costs to us to avoid or alleviate cyber or other security problems and vulnerabilities are significant. However, our efforts to address these problems and vulnerabilities may not be successful. Any significant breach of our security measures could:
• | lead to the dissemination of proprietary information or sensitive, personal, or confidential data about us, our employees, or our customers—including personally identifiable information of individuals involved with our customers and their end-users; |
• | lead to interruptions or degradation of performance in our platform; |
• | threaten our ability to provide our customers with access to our platform; |
• | generate negative publicity about us; |
• | result in litigation and increased legal liability or fines; or |
• | lead to governmental inquiry or oversight. |
The occurrence of any of these events could harm our business or damage our brand and reputation, lead to customer credits, loss of customers, higher expenses, and possibly impede our present and future success in retaining and attracting new customers. A successful security breach or attack on our infrastructure would be damaging to our reputation and could harm our business.
Similar security risks exist with respect to our business partners and the third-party vendors that we rely on for aspects of our information technology support services and administrative functions. As a result, we are subject to the risk that cyber-attacks on our business partners and third-party vendors may adversely affect our business even if an attack or breach does not directly impact our systems. It is also possible that security breaches sustained by our competitors could result in negative publicity for our entire industry that indirectly harms our reputation and diminishes demand for our platform.
The nature of our business exposes us to inherent liability risks.
Our platform and related applications, including our WAF and DDoS solutions, are designed to provide rapid protection against web application vulnerabilities and cyber-attacks. However, no security product can provide absolute protection against all vulnerabilities and cyber-attacks. Our platform is subject to cyber-attacks, and the failure of our platform and related applications to adequately protect against these cyber-attacks may allow our customers to be attacked. Any adverse
26
consequences of these attacks, and our failure to meet our customers’ expectations as they relate to such attacks, could harm our business.
Due to the nature of our applications, we are potentially exposed to greater risks of liability for product or system failures than may be inherent in other businesses. Although substantially all of our customer agreements contain provisions that limit our liability to our customers, these limitations may not be sufficient, and we cannot assure you that these limitations will be enforced or the costs of any litigation related to actual or alleged omissions or failures would not have a material adverse effect on us even if we prevail.
Failure to comply with U.S. and foreign governmental laws and regulations could harm our business.
Our business is subject to regulation by various federal, state, local, and foreign governments. If we do not comply with these laws or regulations or if we become liable under these laws or regulations due to the failure of our customers to comply with these laws, we could face direct liability or delivery of content by our platform may be blocked by certain governments. In certain jurisdictions, these regulatory requirements may be more stringent than those in the United States. Noncompliance with applicable regulations or requirements could subject us to investigations, sanctions, enforcement actions, disgorgement of profits, fines, damages, civil and criminal penalties, injunctions, or other collateral consequences. If any governmental sanctions are imposed, or if we do not prevail in any possible civil or criminal litigation, our business could be harmed. In addition, responding to any action will likely result in a significant diversion of management’s attention and resources and an increase in professional fees. Enforcement actions and sanctions could harm our business. Certain federal statutes in the United States may apply to us with respect to various activities of our customers, including the Digital Millennium Copyright Act (the “DMCA”), which provides recourse for owners of copyrighted material who believe their rights under U.S. copyright law have been infringed on the Internet, and section 230 of the Communications Decency Act (the “CDA”), which addresses blocking and screening of content on the Internet. Although these and other similar legal provisions provide limited protections from liability for service providers like us, if we are found not to be protected by the safe harbor provisions of the DMCA, CDA or other similar laws, or if we are deemed subject to laws in other countries that may not have the same protections or that may impose more onerous obligations on us, we may owe substantial damages and our brand, reputation, and financial results may be harmed.
If the U.S. government prohibits our current or potential customers from doing business with us, whether through policy, regulations or laws, we could face direct liability or our delivery of content by our platform may be blocked. For example, the U.S. government has expressed concerns about the ability of companies operating in China to do business in the U.S. or with U.S. companies, and 29% of our total revenue was generated from customers outside of the United States for the year ended December 31, 2019. As a result, we could lose the ability to contract with current or potential customers, which could harm our business and reputation.
Our sales to highly regulated organizations and government entities are subject to a number of challenges and risks.
We sell to customers in highly regulated industries such as financial services, insurance, and healthcare, as well as to various governmental agency customers, including state and local agency customers, and foreign governmental agency customers. Sales to such entities are subject to a number of challenges and risks. Selling to such entities can be highly competitive, expensive, and time-consuming, often requiring significant upfront time and expense without any assurance that these efforts will generate a sale. Government contracting requirements may change and in doing so restrict our ability to sell into the government sector until we comply with the revised requirements. Government demand and payment for our offerings are affected by public sector budgetary cycles and funding authorizations, with funding reductions or delays adversely affecting public sector demand for our offerings.
Further, highly regulated and governmental entities may demand shorter contract terms or other contractual provisions that differ from our standard arrangements, including terms that can lead those customers to obtain broader rights in our offerings than would be standard. Such entities may have statutory, contractual, or other legal rights to terminate contracts with us or our partners due to a default or for other reasons, and any such termination may harm our business. In addition, these governmental agencies may be required to publish the rates we negotiate with them, which could harm our negotiating leverage with other potential customers and in turn harm our business.
27
Our dedication to our values may negatively influence our financial results.
We have taken, and may continue to take, actions that we believe are in the best interests of our customers, our employees, and our business, even if those actions do not maximize financial results in the short term. For instance, we do not knowingly allow our platform to be used to deliver content from groups that promote violence or hate, and that conflict with our values like strong ethical principles of integrity and trustworthiness, among others. However, this approach may not result in the benefits that we expect, and our employees or third parties may disagree with our interpretation of our values, or take issue with how we execute on our values, which may result in us becoming a target for negative publicity, increased scrutiny, lawsuits, or network attacks, in which case our business could be harmed.
We have taken certain precautions due to the recent outbreak of coronavirus (COVID-19) that could harm our business.
In light of the uncertain and rapidly evolving situation relating to the spread of the coronavirus (COVID-19), we have taken temporary precautionary measures intended to help minimize the risk of the virus to our employees, our customers, and the communities in which we participate, which could negatively impact our business. As a company with employees, customers, partners and investors across the globe, we believe in upholding our company value of being good people by doing our part to help slow the spread of the virus. To this end, we are temporarily requiring all employees to work remotely, have suspended all non-essential travel worldwide for our employees, are canceling or postponing Fastly-sponsored events, and are discouraging employee attendance at industry events and in-person work-related meetings. While we have a distributed workforce and our employees are accustomed to working remotely or working with other remote employees, our workforce is not fully remote. Our employees travel frequently to establish and maintain relationships with one another and with our customers, partners, and investors, and some of our business processes assume that employees can review and sign documents in person. Although we continue to monitor the situation and may adjust our current policies as more information and guidance become available, temporarily suspending travel and doing business in-person could negatively impact our marketing efforts, challenge our ability to enter into customer contracts in a timely manner, slow down our recruiting efforts, or create operational or other challenges as we adjust to a fully-remote workforce, any of which could harm our business. The extent to which the coronavirus (COVID-19) and our precautionary measures may impact our business will depend on future developments, which are highly uncertain and cannot be predicted at this time.
If we cannot maintain our company culture as we grow, our success and our business may be harmed.
We believe our culture has been a key contributor to our success to date and that the critical nature of the products that we provide promotes a sense of greater purpose and fulfillment in our employees. We have invested in building a strong corporate culture and believe it is one of our most important and sustainable sources of competitive advantage. Any failure to preserve our culture could negatively affect our ability to recruit and retain personnel and to effectively focus on and pursue our corporate objectives. As we grow and develop the systems and processes associated with being a public company, we may find it difficult to maintain these important aspects of our culture. In addition, while we have historically benefited from having a dispersed workforce, as we grow and our resources become more globally dispersed and our organizational management structures become more complex, we may find it increasingly difficult to maintain these beneficial aspects of our corporate culture. If we fail to maintain our company culture, our business may be harmed.
Slower usage growth on our platform and numerous other factors could cause our revenue growth rate to slow.
Increasing usage on our platform is key to our revenue growth. Numerous factors can impact the usage growth of our platform, including:
• | the popularity of our customers’ offerings as compared to those offered by companies that do not use our platform; |
• | adoption of new technologies that allow end-users to access content from a core cloud without having to access our network; |
• | customers, particularly large internet platform companies, utilizing their own data centers and implementing delivery approaches that limit or eliminate reliance on third-party providers like us; and |
• | macro-economic market and industry pressures. |
28
We base our decisions about expense levels and investments on estimates of our future revenue and future anticipated rate of growth. Many of our expenses are fixed cost in nature for some minimum amount of time, such as with colocation and bandwidth providers, so it may not be possible to reduce costs in a timely manner or without the payment of fees to exit certain obligations early. If we experience slower usage growth on our platform than we expect or than we have experienced in recent years, our revenue growth rate will slow down and our business may be harmed.
Our growth depends in large part on the success of our partner relationships.
We maintain a partner ecosystem of companies who build edge applications to integrate with our platform. We are dependent on these partner relationships to amplify our reach and provide our customers with enhanced value from our platform. Our future growth will be increasingly dependent on the success of our partner relationships, including their development of useful applications for our platform. If those partnerships do not provide these benefits or if our partners are unable to serve our customers effectively, we may need to allocate resources internally to provide these services or our customers may not realize the full value of our platform, which could harm our business.
Moreover, our partners’ business partners may not completely align with our core values and therefore may do business with companies that we otherwise would not. Our association with these companies could damage our brand and reputation and potentially harm our business.
We operate in an emerging and evolving market, which may develop more slowly or differently than we expect. If our market does not grow as we expect, or if we cannot expand our services to meet the demands of this market, our revenue may decline, or fail to grow, and we may incur operating losses.
The market for edge computing is in an early stage of development. There is considerable uncertainty over the size and rate at which this market will grow, as well as whether our platform will be widely adopted. Our success will depend, to a substantial extent, on the widespread adoption of our platform as an alternative to other solutions, such as legacy CDNs, enterprise data centers, central cloud, and small business-focused CDNs. Some organizations may be reluctant or unwilling to use our platform for a number of reasons, including concerns about additional costs, uncertainty regarding the reliability, and security of cloud-based offerings or lack of awareness of the benefits of our platform. Moreover, many organizations have invested substantial personnel and financial resources to integrate traditional on-premise services into their businesses, and therefore may be reluctant or unwilling to migrate to cloud-based services. Our ability to expand sales of our product into new and existing markets depends on several factors, including potential customer awareness of our platform; the timely completion of data centers in those markets; introduction and market acceptance of enhancements to our platform or new applications that we may introduce; our ability to attract, retain and effectively train sales and marketing personnel; our ability to develop relationships with partners; the effectiveness of our marketing programs; the pricing of our services; and the success of our competitors. If we are unsuccessful in developing and marketing our product into new and existing markets, or if organizations do not perceive or value the benefits of our platform, the market for our product might not continue to develop or might develop more slowly than we expect, either of which may harm our business.
The estimates of market opportunity, forecasts of market growth included in this prospectus may prove to be inaccurate, and any real or perceived inaccuracies may harm our reputation and negatively affect our business. Even if the market in which we compete achieves the forecasted growth, our business could fail to grow at similar rates, if at all.
Market opportunity estimates and growth forecasts included in this prospectus are subject to significant uncertainty and are based on assumptions and estimates that may not prove to be accurate. The variables that go into the calculation of our market opportunity are subject to change over time, and there is no guarantee that any particular number or percentage of addressable companies or end-users covered by our market opportunity estimates will purchase our products at all or generate any particular level of revenues for us. Even if the market in which we compete meets the size estimates and growth forecasted in this prospectus, our business could fail to grow for a variety of reasons, including reasons outside of our control, such as competition in our industry.
Usage of our platform accounts for substantially all of our revenue.
We expect that we will be substantially dependent on our edge cloud platform to generate revenue for the foreseeable future. As a result, our operating results could suffer due to:
29
• | any decline in demand for our edge cloud platform; |
• | the failure of our edge cloud platform to achieve continued market acceptance; |
• | the market for edge cloud computing services not continuing to grow, or growing more slowly than we expect; |
• | the introduction of products and technologies that serve as a replacement or substitute for, or represent an improvement over, our edge cloud platform; |
• | technological innovations or new standards that our edge cloud platform does not address; |
• | sensitivity to current or future prices offered by us or our competitors; |
• | our customers’ development of their own edge cloud platform; and |
• | our inability to release enhanced versions of our edge cloud platform on a timely basis. |
If the market for our edge cloud platform grows more slowly than anticipated or if demand for our edge cloud platform does not grow as quickly as anticipated, whether as a result of competition, pricing sensitivities, product obsolescence, technological change, unfavorable economic conditions, uncertain geopolitical environment, budgetary constraints of our customers, or other factors, our business would be harmed.
We expect fluctuations in our financial results and key metrics, making it difficult to project future results, and if we fail to meet the expectations of securities analysts or investors, our stock price and the value of your investment could decline.
Our operating results, as well as our key metrics (including our DBNER) have fluctuated in the past and are expected to fluctuate in the future due to a variety of factors, many of which are outside of our control. As a result, our past results may not be indicative of our future performance and period-to-period comparisons of our operating results and key metrics may not be meaningful. In addition to the other risks described herein, factors that may affect our operating results include the following:
• | fluctuations in demand for or pricing of our platform; |
• | our ability to attract new customers; |
• | our ability to retain our existing customers; |
• | fluctuations in the usage of our platform by our customers, which is directly related to the amount of revenue that we recognize from our customers; |
• | fluctuations in customer delays in purchasing decisions in anticipation of new products or product enhancements by us or our competitors; |
• | changes in customers’ budgets and in the timing of their budget cycles and purchasing decisions; |
• | the timing of customer payments and any difficulty in collecting accounts receivable from customers; |
• | timing of new functionality of our existing platform; |
• | our ability to control costs, including our operating expenses; |
• | the amount and timing of payment for operating expenses, particularly research and development and sales and marketing expenses, including commissions; |
• | the amount and timing of costs associated with recruiting, training, and integrating new employees; |
• | the effects of acquisitions or other strategic transactions; |
• | expenses in connection with acquisitions or other strategic transactions; |
30
• | our ability to successfully deploy POPs in new regions; |
• | general economic conditions, both domestically and internationally, as well as economic conditions specifically affecting industries in which our customers participate; |
• | the ability to maintain our partnerships; |
• | the impact of new accounting pronouncements; |
• | changes in the competitive dynamics of our market, including consolidation among competitors or customers; |
• | significant security breaches of, technical difficulties with, or interruptions to, the delivery and use of our platform; and |
• | awareness of our brand and our reputation in our target markets. |
Additionally, certain large scale events, such as major elections and sporting events, can significantly impact usage of our platform, which could cause fluctuations in our results of operations. While increased usage of our platform during these events could result in increased revenue, these seasonal and one-time events could also impact the performance of our platform during those events and lead to a sub-optimal experience for some customers. Such annual and one-time events may cause fluctuations in our results of operations as they would impact both our revenue and our operating expenses.
Any of the foregoing and other factors may cause our results of operations to vary significantly. If our quarterly results of operations fall below the expectations of investors and securities analysts who follow our stock, the price of our Class A common stock could decline substantially, and our business could be harmed.
Our recent rapid growth may not be indicative of our future growth and, if we continue to grow rapidly, we may not be able to manage our growth effectively.
We have experienced substantial growth in our business since inception. We are rapidly expanding, and expect to continue to expand in the future, our international operations. For example, we have also experienced significant growth in the number of customers, usage, and amount of data delivered across our platform. In addition, our headcount has grown from 449 employees as of December 31, 2018 to 630 employees as of December 31, 2019. This growth has placed and may continue to place significant demands on our corporate culture, operational infrastructure, and management. We may not continue to grow as rapidly in the future. Overall growth of our revenue depends on a number of factors, including our ability to:
• | address new and developing markets, such as large enterprise customers outside the United States; |
• | control expenses; |
• | recruit, hire, train, and manage additional qualified engineers; |
• | recruit, hire, train, and manage additional sales and marketing personnel; |
• | maintain our corporate culture; |
• | expand our international operations; |
• | implement and improve our administrative, financial and operational systems, procedures, and controls; |
• | attract new customers and increase our existing customers’ usage on our platform; |
• | expand the functionality and use cases for the products we offer on our platform; |
• | provide our customers with customer support that meets their needs; and |
• | successfully identify and acquire or invest in businesses, products, or technologies that we believe could complement or expand our products. |
31
We may not successfully accomplish any of the above objectives. We expect to continue to expend substantial financial and other resources on:
• | sales and marketing, including a significant expansion of our sales organization; |
• | our infrastructure, including POP deployments, systems architecture, management tools, scalability, availability, performance, and security, as well as disaster recovery measures; |
• | product development, including investments in our product development team and the development of new products and new functionality for our existing products; |
• | acquisitions or strategic investments; |
• | international expansion; and |
• | general administration, including increased legal and accounting expenses associated with being a public company. |
We employ a pricing model that subjects us to various challenges that could make it difficult for us to derive sufficient value from our customers.
We generally charge our customers for their usage of our platform based on the combined total usage, as well as the features and functionality enabled. Additionally, once our product is purchased, customers can also buy any combination of our add-on products. We do not know whether our current or potential customers or the market in general will continue to accept this pricing model going forward and, if it fails to gain acceptance, our business could be harmed. We also generally purchase bandwidth from internet service providers and server colocation space from third parties based on expected usage from our customers. Moreover, if our customers use our platform in a manner that is inconsistent with how we have purchased bandwidth, servers, and colocation space, our business could be harmed.
We do not have sufficient history with our pricing model to accurately predict the optimal pricing necessary to attract new customers and retain existing customers.
We have limited experience with respect to determining the optimal prices for our products and, as a result, we have in the past and expect that we will need to change our pricing model from time to time in the future. As the market for our products matures, or as new competitors introduce new products or services that compete with ours, we may be unable to attract new customers at the same price or based on the same pricing models as we have used historically. Pricing decisions may also impact the mix of adoption among our customers and negatively impact our overall revenue. Moreover, larger organizations may demand substantial price concessions. As a result, in the future we may be required to reduce our prices or develop new pricing models, which could adversely affect our revenue, gross margin, profitability, financial position, and cash flow.
Our sales and onboarding cycles with customers can be long and unpredictable, and our sales and onboarding efforts require considerable time and expense.
The timing of our sales with our enterprise customers and related revenue recognition is difficult to predict because of the length and unpredictability of the sales cycle for these customers. In addition, for our enterprise customers, the lengthy sales cycle for the evaluation and implementation of our products may also cause us to experience a delay between expenses for such sales efforts and the generation of corresponding revenue. The length of our sales cycle for these customers, from initial evaluation to payment, can range from several months to well over a year and can vary substantially from customer to customer. Similarly, the onboarding and ramping process with new enterprise customers can take several months. As the purchase of our products can be dependent upon customer initiatives, our sales cycle can extend to even longer periods of time. Customers often view a switch to our platform as a strategic decision requiring significant investment and, as a result, frequently require considerable time to evaluate, test, and qualify our product offering prior to entering into or expanding a contract commitment. During the sales cycle, we expend significant time and money on sales and marketing and contract negotiation activities, which may not result in a completed sale. Additional factors that may influence the length and variability of our sales cycle include:
• | the effectiveness of our sales force, particularly new salespeople, as we increase the size of our sales force and train our new salespeople to sell to enterprise customers; |
32
• | the discretionary nature of customers’ purchasing decisions and budget cycles; |
• | customers’ procurement processes, including their evaluation of competing products; |
• | economic conditions and other factors affecting customer budgets; |
• | the regulatory environment in which our customers operate; |
• | integration complexity for a customer deployment; |
• | the customer’s familiarity with edge cloud computing platforms; |
• | evolving customer demands; and |
• | competitive conditions. |
Given these factors, it is difficult to predict whether and when a customer will switch to our platform.
Given that it can take several months for our customers to ramp up their usage of our platform, during that time, we may not be able to generate enough revenue from a particular customer or that customer may not increase their usage in a meaningful way. Moreover, because the switching costs are fairly low, our customers are able to switch from our platform to alternative services relatively easily.
We rely on the performance of highly skilled personnel, including our management and other key employees, and the loss of one or more of such personnel, or of a significant number of our team members, could harm our business.
We believe our success has depended, and continues to depend, on the efforts and talents of senior management and key personnel, including Artur Bergman, our Chief Architect and Executive Chairman and Joshua Bixby, our Chief Executive Officer. From time to time, there may be changes in our management team resulting from the hiring or departure of executives and key employees, which could disrupt our business. We also are dependent on the continued service of our existing software engineers because of the complexity of our platform. Our senior management and key employees are employed on an at-will basis. We cannot ensure that we will be able to retain the services of any member of our senior management or other key employees or that we would be able to timely replace members of our senior management or other key employees should any of them depart. The loss of one or more of our senior management or other key employees could harm our business.
The failure to attract and retain additional qualified personnel could prevent us from executing our business strategy.
To execute our business strategy, we must attract and retain highly qualified personnel. Competition for executive officers, software developers, sales personnel, and other key employees in our industry is intense. In particular, we compete with many other companies for software developers with high levels of experience in designing, developing, and managing cloud-based software, as well as for skilled sales and operations professionals. In addition, we believe that the success of our business and corporate culture depends on employing people with a variety of backgrounds and experiences, and the competition for such diverse personnel is significant. While the market for such talented personnel is particularly competitive in the San Francisco Bay Area, where our headquarters is located, it is also competitive in other markets where we maintain operations. Many of the companies with which we compete for experienced personnel have greater resources than we do and can frequently offer such personnel substantially greater compensation than we can offer. If we fail to attract new personnel or fail to retain and motivate our current personnel, our business would be harmed.
If our platform does not achieve sufficient market acceptance, our financial results and competitive position will suffer.
To meet our customers’ rapidly evolving demands, we invest substantial resources in research and development of enhanced products to incorporate additional functionality or expand the use cases that our platform addresses. Maintaining adequate research and development resources, such as the appropriate personnel and development technology, to meet the demands of the market is essential. If we are unable to develop products internally due to inadequate research and development resources, we may not be able to address our customers’ needs on a timely basis or at all. In addition, if we seek to supplement our research and development capabilities or the breadth of our products through acquisitions, such acquisitions could be expensive and we may not successfully integrate acquired technologies or businesses into our business. When we develop or
33
acquire new or enhanced products, we typically incur expenses and expend resources upfront to develop, market, promote, and sell the new offering. Therefore, when we develop or acquire and introduce new or enhanced products, they must achieve high levels of market acceptance in order to justify the amount of our investment in developing or acquiring and bringing them to market. Our new products or enhancements and changes to our existing products could fail to attain sufficient market acceptance for many reasons, including:
• | failure to predict market demand accurately in terms of functionality and a failure to supply products that meet this demand in a timely fashion; |
• | defects, errors, or failures; |
• | negative publicity about our platform’s performance or effectiveness; |
• | changes in the legal or regulatory requirements, or increased legal or regulatory scrutiny, adversely affecting our platform; |
• | emergence of a competitor that achieves market acceptance before we do; |
• | delays in releasing enhancements to our platform to the market; and |
• | introduction or anticipated introduction of competing products by our competitors. |
If our platform and any future enhancements do not achieve adequate acceptance in the market, or if products and technologies developed by others achieve greater acceptance in the market, our business could be harmed.
Beyond overall acceptance of our platform by our customers, it is important that we maintain and grow acceptance of our platform among the developers that work for our customers. We rely on developers to choose our platform over other options they may have, and to continue to use and promote our platform as they move between companies. These developers often make design decisions and influence the product and vendor processes within our customers. If we fail to gain or maintain their acceptance of our platform, our business would be harmed.
We rely on third-party hosting providers that may be difficult to replace.
We rely on third-party hosting services such as Amazon Web Services ("AWS"), Google, Softlayer (acquired by IBM), and other cloud providers that facilitate the offering of our platform. Some of these third-party hosting services offer competing products to ours and therefore may not continue to be available on commercially reasonable terms, or at all. These providers may be unwilling to do business with us if they view our platform as a threat. Any loss of the right to use any of the hosting providers could impair our ability to offer our platform until we are able to obtain alternative hosting providers.
If we do not or cannot maintain the compatibility of our platform with third-party applications that our customers use in their businesses, our business will be harmed.
Because our customers choose to integrate our products with certain capabilities provided by third-party providers, the functionality and popularity of our platform depends, in part, on our ability to integrate our platform and applications with third-party applications. These third parties may change the features of their technologies, restrict our access to their applications, or alter the terms governing use of their applications in a manner that is adverse to our business. Such changes could functionally limit or prevent our ability to use these third-party technologies in conjunction with our platform, which would negatively affect adoption of our platform and harm our business. If we fail to integrate our platform with new third-party applications that our customers use, we may not be able to offer the functionality that our customers need, which would harm our business.
The success of our business depends on customers’ continued and unimpeded access to our platform on the internet.
Our customers must have internet access in order to use our platform. Some internet providers may take measures that affect their customers’ ability to use our platform, such as degrading the quality of the content we transmit over their lines, giving that content lower priority, giving other content higher priority than ours, blocking our content entirely, or attempting to charge their customers more for using our platform.
34
In December 2010, the Federal Communications Commission ("FCC") adopted net neutrality rules barring internet providers from blocking or slowing down access to online content, protecting services like ours from such interference. The FCC has repealed the net neutrality rules, and it is currently uncertain how the U.S. Congress will respond to this decision. To the extent network operators attempt to interfere with our platform, extract fees from us to deliver our platform, or otherwise engage in discriminatory practices, our business could be adversely impacted. Within such a regulatory environment, we could experience discriminatory or anti-competitive practices that could impede our domestic and international growth, cause us to incur additional expense, or otherwise harm our business.
We provide service level commitments under our customer agreements. If we fail to meet these contractual commitments, we could be obligated to provide credits for future service, or face contract termination with refunds of prepaid amounts, which could harm our business.
Most of our customer agreements contain service level commitments. If we are unable to meet the stated service level commitments, including failure to meet the uptime and delivery requirements under our customer agreements, we may be contractually obligated to provide the affected customers with service credits which could significantly affect our revenues in the periods in which the uptime and/or delivery failure occurs and the credits are applied. We could also face customer terminations, which could significantly affect both our current and future revenues. Any service level failures could harm our business.
If we fail to offer high quality support, our business may be harmed.
Our customers rely on our support team to assist them in deploying our products effectively and resolve technical and operational issues. High-quality support is important for the renewal and expansion of our agreements with existing customers. The importance of maintaining high quality support will increase as we expand our business and pursue new customers. If we do not help our customers quickly resolve issues and provide effective ongoing support, our ability to maintain and expand our relationships with existing and new customers could suffer and our business could be harmed. Further, increased demand for customer support, without corresponding revenue, could increase costs and adversely affect our business. In addition, as we continue to grow our operations and expand internationally, we will need to be able to provide efficient customer support that meets our customers’ needs globally at scale and our customer support team will face additional challenges, including those associated with delivering support and documentation in multiple languages. Our failure to do so could harm our business.
Future acquisitions, strategic investments, partnerships, or alliances could be difficult to identify and integrate, divert the attention of management, disrupt our business, and dilute stockholder value.
We may in the future seek to acquire or invest in businesses, products, or technologies that we believe could complement or expand our platform, enhance our technical capabilities, or otherwise offer growth opportunities. The pursuit of potential acquisitions may divert the attention of management and cause us to incur various expenses in identifying, investigating, and pursuing acquisitions, whether or not such acquisitions are completed. In addition, we have only limited experience in acquiring other businesses and we may not successfully identify desirable acquisition targets or, if we acquire additional businesses, we may not be able to integrate them effectively following the acquisition. Acquisitions could also result in dilutive issuances of equity securities or the incurrence of debt, which could adversely affect our operating results, may cause unfavorable accounting treatment, may expose us to claims and disputes by third parties, including intellectual property claims, and may not generate sufficient financial returns to offset additional costs and expenses related to the acquisitions. In addition, if an acquired business fails to meet our expectations, our business may be harmed.
Because we recognize revenue from usage on our platform over the term of the relevant contract, downturns or upturns in sales contracts are not immediately reflected in full in our operating results.
Revenue for usage on our platform accounts for substantially all of our total revenue. We recognize revenue over the term of each of our customer contracts, which are typically one year in length but may be longer in length. As a result, much of our revenue is generated from contracts entered into during previous periods. Consequently, a decline in new or renewed contracts in any one quarter may not significantly reduce our revenue for that quarter but could negatively affect our revenue in future quarters. Our revenue recognition model also makes it difficult for us to rapidly increase our revenue through new contracts in any period, as revenue from customers is recognized over the applicable term of their contracts.
35
Seasonality may cause fluctuations in our sales and operating results.
We have experienced, and expect to continue to experience in the future, seasonality in our business, and our operating results and financial condition may be affected by such trends in the future. We generally experience seasonal fluctuations in demand for our platform. For example, we typically have customers who increase their usage and requests when they need more capacity during busy periods, especially in the fourth quarter of the year, and then subsequently scale back. We believe that the seasonal trends that we have experienced in the past may continue for the foreseeable future, particularly as we expand our sales to larger enterprises. To the extent we experience this seasonality, it may cause fluctuations in our operating results and financial metrics, and make forecasting our future operating results and financial metrics difficult. Additionally, we do not have sufficient experience in selling certain of our products to determine if demand for these products are or will be subject to material seasonality.
Unfavorable conditions in our industry or the global economy or reductions in information technology spending could harm our business.
Our results of operations may vary based on the impact of changes in our industry or the global economy on us or our customers and potential customers. Current or future economic uncertainties or downturns could adversely affect our business and results of operations. Negative conditions in the general economy both in the United States and abroad, including conditions resulting from changes in gross domestic product growth, financial and credit market fluctuations, political turmoil, natural catastrophes, warfare, public health issues, such as the recent outbreak of coronavirus (COVID-2019), and terrorist attacks on the United States, Europe, the Asia Pacific region, or elsewhere, could cause a decrease in business investments, including spending on information technology, which would harm our business. To the extent that our platform and our products are perceived by customers and potential customers as too costly, or difficult to deploy or migrate to, our revenue may be disproportionately affected by delays or reductions in general information technology spending. Also, our competitors, many of whom are larger and have greater financial resources than we do, may respond to market conditions by lowering prices and attempting to lure away our customers. In addition, the increased pace of consolidation in certain industries may result in reduced overall spending on our products. We cannot predict the timing, strength, or duration of any economic slowdown, instability, or recovery, generally or within any particular industry.
Our ability to use our net operating losses to offset future taxable income may be subject to certain limitations.
Our net operating loss ("NOL") carryforwards could expire unused and be unavailable to offset future income tax liabilities because of their limited duration or because of restrictions under U.S. tax law. Our NOLs generated in tax years ending on or prior to December 31, 2019 are only permitted to be carried forward for 20 years under applicable U.S. tax law. Under the Tax Cuts and Jobs Act (the "Tax Act"), our federal NOLs generated in tax years ending after December 31, 2019 may be carried forward indefinitely, but the deductibility of such federal NOLs is limited (as described below under "The Tax Act could adversely affect our business and financial condition"). It is uncertain if and to what extent various states will conform to the Tax Act.
In addition, under Section 382 of the United States Internal Revenue Code of 1986, as amended (the "Code"), a corporation that undergoes an "ownership change" is generally subject to limitations on its ability to utilize its pre-change NOLs to offset future taxable income. We may have experienced ownership changes in the past and may experience ownership changes in the future as a result of subsequent shifts in our stock ownership (some of which shifts are outside our control). Furthermore, our ability to utilize NOLs of companies that we have acquired or may acquire in the future may be subject to limitations. For these reasons, we may not be able to utilize a material portion of the NOLs, even if we were to achieve profitability.
Our current operations are international in scope and we plan on further geographic expansion, creating a variety of operational challenges.
A component of our growth strategy involves the further expansion of our operations and customer base internationally. For the year ended December 31, 2019, the percentage of revenue generated from customers outside the United States was 29% of our total revenue, respectively. We currently have offices in Japan, the United Kingdom, and the United States, as well as employees located throughout the world. We are continuing to adapt to and develop strategies to address international markets but there is no guarantee that such efforts will have the desired effect. As of December 31, 2019, approximately 18% of our full-time employees were located outside of the United States. We expect that our international activities will continue to grow
36
over the foreseeable future as we continue to pursue opportunities in existing and new international markets, which will require significant management attention and financial resources. In connection with such expansion, we may face difficulties including costs associated with, varying seasonality patterns, potential adverse movement of currency exchange rates, longer payment cycle difficulties in collecting accounts receivable in some countries, tariffs and trade barriers, a variety of regulatory or contractual limitations on our ability to operate, adverse tax events, reduced protection of intellectual property rights in some countries, and a geographically and culturally diverse workforce and customer base. Failure to overcome any of these difficulties could harm our business.
Our current and future international business and operations involve a variety of risks, including:
• | changes in a specific country’s or region’s political or economic conditions; |
• | greater difficulty collecting accounts receivable and longer payment cycles; |
• | potential or unexpected changes in trade relations, regulations, or laws; |
• | more stringent regulations relating to privacy and data security and the unauthorized use of, or access to, commercial and personal information, particularly in Europe; |
• | differing labor regulations, especially in Europe and Japan, where labor laws are generally more advantageous to employees as compared to the United States, including deemed hourly wage and overtime regulations in these locations; |
• | challenges inherent in efficiently managing an increased number of employees over large geographic distances, including the need to implement appropriate systems, policies, benefits, and compliance programs; |
• | challenges to our corporate culture resulting from a dispersed workforce; |
• | difficulties in managing a business in new markets with diverse cultures, languages, customs, legal systems, alternative dispute systems, and regulatory systems; |
• | increased travel, real estate, infrastructure, and legal compliance costs associated with international operations; |
• | currency exchange rate fluctuations and the resulting effect on our revenue and expenses, and the cost and risk of entering into hedging transactions if we chose to do so in the future; |
• | challenges related to providing support and developing products in foreign languages; |
• | limitations on our ability to reinvest earnings from operations in one country to fund the capital needs of our operations in other countries; |
• | laws and business practices favoring local competitors or general market preferences for local vendors; |
• | potential tariffs and trade barriers; |
• | limited or insufficient intellectual property protection or difficulties enforcing our intellectual property; |
• | political instability or terrorist activities; |
• | limitations in the ability to travel caused by public health issues, such as the recent outbreak of coronavirus (COVID-2019); |
• | exposure to liabilities under anti-corruption and anti-money laundering laws, and similar laws and regulations in other jurisdictions; and |
• | adverse tax burdens and foreign exchange controls that could make it difficult to repatriate earnings and cash. |
37
Our limited experience in operating our business internationally increases the risk that any potential future expansion efforts that we may undertake will not be successful. If we invest substantial time and resources to further expand our international operations and are unable to do so successfully and in a timely manner, our business may be harmed.
Our business is dependent upon the timely supply of certain parts and components manufactured in China to construct our servers. To the extent that our suppliers are impacted by the coronavirus (COVID-19), it likely will reduce the availability, or result in delays, of parts and components to us, which in turn could interrupt our ability to complete the construction of our servers to meet the usage needs of our customers.
Our international operations may subject us to potential adverse tax consequences.
We are expanding our international operations and staff to better support our growth into international markets. Our corporate structure and associated transfer pricing policies contemplate future growth into the international markets, and consider the functions, risks, and assets of the various entities involved in the intercompany transactions. The amount of taxes we pay in different jurisdictions may depend on: the application of the tax laws of the various jurisdictions, including the United States, to our international business activities; changes in tax rates; new or revised tax laws or interpretations of existing tax laws and policies; and our ability to operate our business in a manner consistent with our corporate structure and intercompany arrangements. The taxing authorities of the jurisdictions in which we operate may challenge our methodologies for pricing intercompany transactions pursuant to our intercompany arrangements or disagree with our determinations as to the income and expenses attributable to specific jurisdictions. If such a challenge or disagreement were to occur, and our position was not sustained, we could be required to pay additional taxes, interest, and penalties, which could result in one-time tax charges, higher effective tax rates, reduced cash flows, and lower overall profitability of our operations. Our financial statements could fail to reflect adequate reserves to cover such a contingency.
Legal, political, and economic uncertainty surrounding the planned exit of the United Kingdom ("UK") from the European Union ("EU") may be a source of instability in international markets, create significant currency fluctuations, adversely affect our operations in the UK, and pose additional risks to our business, revenue, financial condition, and results of operations.
Following the result of a referendum in 2016, the United Kingdom left the European Union on January 31, 2020, commonly referred to as Brexit.
Pursuant to the formal withdrawal arrangements agreed between the United Kingdom and the European Union, the UK will be subject to a transition period until December 31, 2020 (the "Transition Period") during which EU rules will continue to apply. Negotiations between the UK and the EU are expected to continue in relation to the customs and trading relationship between the UK and the EU following the expiry of the Transition Period.
The uncertainty concerning the UK’s legal, political, and economic relationship with the EU after the Transition Period may continue to be a source of instability in the international markets, create significant currency fluctuations, or otherwise adversely affect trading agreements or similar cross-border co-operation arrangements (whether economic, tax, fiscal, legal, regulatory, or otherwise).
These developments, or the perception that any of them could occur, have had and may continue to have a significant adverse effect on global economic conditions and the stability of global financial markets, and could significantly reduce global market liquidity and limit the ability of key market participants to operate in certain financial markets. In particular, it could also lead to a period of considerable uncertainty in relation to the UK financial and banking markets, as well as on the regulatory process in Europe. Asset valuations, currency exchange rates, and credit ratings may also be subject to increased market volatility.
If the UK and the EU are unable to negotiate acceptable trading and customs terms or if other EU Member States pursue withdrawal, barrier-free access between the UK and other EU Member States or among the European Economic Area (EEA) overall could be diminished or eliminated. The long-term effects of Brexit will depend on any agreements (or lack thereof) between the UK and the EU and, in particular, any arrangements for the UK to retain access to EU markets either during a transitional period or more permanently after the Transition Period.
38
Such a withdrawal from the EU is unprecedented, and it is unclear how the UK’s access to the European single market for goods, capital, services, and labor within the EU, or single market, and the wider commercial, legal, and regulatory environment, will impact our UK operations and customers. Our UK operations service customers in the UK as well as in other countries in the EU and EEA and these operations could be disrupted by Brexit, particularly if there is a change in the UK’s relationship to the single market.
We may also face new regulatory costs and challenges as a result of Brexit that could have an adverse effect on our operations. For example, the UK could lose the benefits of global trade agreements negotiated by the EU on behalf of its members, which may result in increased trade barriers that could make our doing business in the EU and the EEA more difficult. There may continue to be economic uncertainty surrounding the consequences of Brexit that adversely impact customer confidence resulting in customers reducing their spending budgets on our solutions, which could harm our business.
Our ability to timely raise capital may be limited, or may be unavailable on acceptable terms, if at all, and our failure to raise capital when needed could harm our business, and debt or equity issued to raise additional capital may reduce the value of our Class A common stock.
We have funded our operations since inception primarily through payments received from our customers, sales of equity securities, and borrowings under our credit facilities. We cannot be certain when or if our operations will generate sufficient cash to fully fund our ongoing operations or the growth of our business. We intend to continue to make investments to support our business and may require additional funds. Additional financing may not be available on favorable terms, if at all. If adequate funds are not available on acceptable terms, we may be unable to invest in future growth opportunities, which could harm our business, operating results, and financial condition. Furthermore, if we issue additional equity securities, stockholders will experience dilution, and the new equity securities could have rights senior to those of our common stock. Because our decision to issue securities in future offerings will depend on numerous considerations, including factors beyond our control, we cannot predict or estimate the amount, timing, or nature of any future issuances of debt or equity securities. As a result, our stockholders bear the risk of future issuances of debt or equity securities reducing the value of our Class A common stock and diluting their interests.
We are exposed to fluctuations in currency exchange rates.
Our sales contracts are primarily denominated in U.S. dollars, and therefore substantially all of our revenue is not subject to foreign currency risk. However, a strengthening of the U.S. dollar could increase the real cost of our platform to our customers outside of the United States, which could adversely affect our operating results. In addition, an increasing portion of our operating expenses is incurred and an increasing portion of our assets is held outside the United States. These operating expenses and assets are denominated in foreign currencies and are subject to fluctuations due to changes in foreign currency exchange rates. While we do not currently engage in hedging efforts, if we do not successfully hedge against the risks associated with currency fluctuations, our business may be harmed.
Changes in our effective tax rate or tax liability may harm our business.
Our effective tax rate could be adversely impacted by several factors, including:
• | Changes in the relative amounts of income before taxes in the various jurisdictions in which we operate that have differing statutory tax rates; |
• | Changes in tax laws, tax treaties, and regulations or the interpretation of them, including the Tax Act; |
• | Changes to our assessment about our ability to realize our deferred tax assets that are based on estimates of our future results, the prudence and feasibility of possible tax planning strategies, and the economic and political environments in which we do business; |
• | The outcome of current and future tax audits, examinations, or administrative appeals; and |
• | Limitations or adverse findings regarding our ability to do business in some jurisdictions. |
Should our effective tax rate rise, our business could be harmed.
39
We could be required to collect additional sales taxes or be subject to other tax liabilities that may increase the costs our clients would have to pay for our offering and harm our business.
An increasing number of states have considered or adopted laws that attempt to impose tax collection obligations on out-of-state companies. Additionally, the Supreme Court of the United States recently ruled in South Dakota v. Wayfair, Inc. et al ("Wayfair") that online sellers can be required to collect sales and use tax despite not having a physical presence in the buyer’s state. In response to Wayfair, or otherwise, states or local governments may adopt, or begin to enforce, laws requiring us to calculate, collect, and remit taxes on sales in their jurisdictions. A successful assertion by one or more states requiring us to collect taxes where we presently do not do so, or to collect more taxes in a jurisdiction in which we currently do collect some taxes, could result in substantial tax liabilities, including taxes on past sales, as well as penalties and interest. The imposition by state governments or local governments of sales tax collection obligations on out-of-state sellers could also create additional administrative burdens for us, put us at a competitive disadvantage if they do not impose similar obligations on our competitors and decrease our future sales, which could harm our business.
Adverse tax laws or regulations could be enacted or existing laws could be applied to us, which could adversely affect our business and financial condition.
We operate and are subject to taxes in the United States and numerous other jurisdictions throughout the world. Changes to federal, state, local, or international tax laws on income, sales, use, indirect, or other tax laws, statutes, rules, regulations, or ordinances on multinational corporations are currently being considered by the United States and other countries where we do business. These contemplated legislative initiatives include, but are not limited to, changes to transfer pricing policies and definitional changes to permanent establishment that could be applied solely or disproportionately to services provided over the internet. These contemplated tax initiatives, if finalized and adopted by countries, may ultimately impact our effective tax rate and could adversely affect our sales activity resulting in a negative impact on our operating results and cash flows.
In addition, existing tax laws, statutes, rules, regulations, or ordinances could be interpreted, changed, modified, or applied adversely to us (possibly with retroactive effect), which could require us to pay additional tax amounts, fines or penalties, and interest for past amounts. The additional tax obligations could relate to our taxes or obligations to report or withhold on customer taxes. We could take steps to collect customer related taxes, but if we are unsuccessful in collecting such taxes from our customers, we could be held liable for such costs, thereby adversely impacting our operating results and cash flows. Further, if our customers must pay additional fines or penalties, it could adversely affect demand for our services.
On December 22, 2017, President Trump signed into law H.R. 1, “An Act to provide for reconciliation pursuant to titles II and V of the concurrent resolution on the budget for fiscal year 2018,” informally titled the Tax Act, which significantly revises the Code. The Tax Act, among other things, reduces the corporate tax rate from a top marginal rate of 35% to a flat rate of 21%, limits the tax deduction for interest expense to 30% of adjusted taxable income (except for certain small businesses), limits the deduction for net operating losses carried forward from taxable years beginning after December 31, 2017 to 80% of current year taxable income, eliminates net operating loss carrybacks, imposes a one-time tax on offshore earnings at reduced rates regardless of whether they are repatriated, eliminates U.S. tax on foreign earnings (subject to certain important exceptions), allows immediate deductions for certain new investments instead of deductions for depreciation expense over time, and modifies or repeals many business deductions and credits. Notwithstanding the reduction in the corporate income tax rate, the U.S. Department of Treasury has broad authority to issue regulations and interpretative guidance that may significantly impact how we will apply the law and impact our results of operations in the period issued. In addition, it is uncertain if and to what extent various states will conform to the Tax Act. The impact of the Tax Act on holders of our Class A common stock is also uncertain and could be adverse. We urge our stockholders to consult with their legal and tax advisors with respect to this legislation and the potential tax consequences of investing in or holding our Class A common stock.
We are subject to anti-corruption, anti-bribery, anti-money laundering and similar laws, and non-compliance with such laws can subject us to criminal and/or civil liability and harm our business.
We are subject to the U.S. Foreign Corrupt Practices Act, the U.S. domestic bribery statute contained in 18 U.S.C. § 201, the U.S. Travel Act, the UK Bribery Act, and other anti-bribery and anti-money laundering laws in the countries in which we conduct activities. Anti-corruption and anti-bribery laws have been enforced aggressively in recent years and are interpreted broadly to generally prohibit companies and their employees and third-party intermediaries from authorizing, offering or
40
providing, directly or indirectly, improper payments, or benefits to recipients in the public or private sector. As we increase our international sales and business and sales to the public sector, we may engage with business partners and third-party intermediaries to market our platform and to obtain necessary permits, licenses, and other regulatory approvals. In addition, we or our third-party intermediaries may have direct or indirect interactions with officials and employees of government agencies or state-owned or affiliated entities. We can be held liable for the corrupt or other illegal activities of these third-party intermediaries, our employees, representatives, contractors, partners, and agents, even if we do not explicitly authorize such activities.
While we have policies and procedures to address compliance with such laws, we cannot assure you that all of our employees and agents will not take actions in violation of our policies and applicable laws, for which we may be ultimately held responsible. As we increase our international sales and business, our risks under these laws may increase.
Detecting, investigating, and resolving actual or alleged violations can require a significant diversion of time, resources, and attention from senior management. In addition, noncompliance with anti-corruption, anti-bribery, or anti-money laundering laws could subject us to whistleblower complaints, investigations, sanctions, settlements, prosecution or other enforcement actions, disgorgement of profits, significant fines, damages, other civil and criminal penalties or injunctions, suspension or debarment from contracting with certain persons, the loss of export privileges, reputational harm, adverse media coverage, and other collateral consequences. If any subpoenas or investigations are launched, or governmental or other sanctions are imposed or if we do not prevail in any possible civil or criminal litigation, our business could be harmed. In addition, responding to any action will likely result in a materially significant diversion of management’s attention and resources and significant defense costs and other professional fees. Enforcement actions and sanctions could further harm our business.
Our financial results may be adversely affected by changes in accounting principles applicable to us.
Generally accepted accounting principles in the United States ("U.S. GAAP") are subject to interpretation by the Financial Accounting Standards Board ("FASB"), the SEC and other various bodies formed to promulgate and interpret appropriate accounting principles. For example, in May 2014, the FASB issued accounting standards update No. 2014-09 ("Topic 606"), Revenue from Contracts with Customers, which supersedes nearly all existing revenue recognition guidance under U.S. GAAP. The core principle of Topic 606 is that an entity should recognize revenue to depict the transfer of promised goods or services to customers in an amount that reflects the consideration to which the entity expects to be entitled in exchange for those goods or services; this new accounting standard also impacts the recognition of sales commissions. As an “emerging growth company,” the JOBS Act allows us to delay adoption of new or revised accounting pronouncements applicable to public companies until such pronouncements are made applicable to private companies. We have elected to use this extended transition period under the JOBS Act with respect to new or revised accounting pronouncements, including Topic 606, and as a result Topic 606 became applicable to us on January 1, 2019.
We have adopted this standard as of January 1, 2019 using the modified retrospective method. The adoption of this standard did not have a material impact on revenue. As a result of adopting this standard we have recorded an adjustment to deferred contract costs of $5.7 million as of January 1, 2019, to reflect a reduction in the amount of commission expense previously recorded. The application of this new guidance could have an adverse effect on our operating results in one or more periods as compared to what they would have been under previous standards.
Under Topic 606, more estimates, judgments, and assumptions are required within the revenue recognition process than were previously required. Our reported financial position and financial results may be adversely affected if our estimates or judgments prove to be wrong, assumptions change, or actual circumstances differ from those in our assumptions. We currently believe the most significant impact of the standard on our financial results relates to sales commissions. These or other changes in accounting principles could adversely affect our financial results. Any difficulties in implementing these pronouncements could cause us to fail to meet our financial reporting obligations, which could result in regulatory discipline and harm our business.
If our estimates or judgments relating to our critical accounting policies prove to be incorrect, our results of operations could be adversely affected.
The preparation of financial statements in conformity with U.S. GAAP requires management to make estimates and assumptions that affect the amounts reported in the consolidated financial statements and accompanying notes. We base our estimates on historical experience and on various other assumptions that we believe to be reasonable under the circumstances, as provided in the section titled “Management’s Discussion and Analysis of Financial Condition and Results of Operations—
41
Critical Accounting Policies.” The results of these estimates form the basis for making judgments about the carrying values of assets, liabilities, and equity and the amount of revenue and expenses that are not readily apparent from other sources. Significant assumptions and estimates used in preparing our consolidated financial statements include those related to allowance for doubtful accounts, fair value of financial instruments, valuation of stock-based compensation, valuation of warrant liabilities, and the valuation allowance for deferred income taxes. Our results of operations may be adversely affected if our assumptions change or if actual circumstances differ from those in our assumptions, which could cause our results of operations to fall below the expectations of securities analysts and investors, resulting in a decline in the trading price of our Class A common stock.
Current and future indebtedness could restrict our operations, particularly our ability to respond to changes in our business or to take specified actions.
Our current credit facilities contain, and any future indebtedness would likely contain, a number of restrictive covenants that impose significant operating and financial restrictions on us, including restrictions on our ability to take actions that may otherwise be in our best interests. Our ability to meet those financial covenants can be affected by events beyond our control, and we may not be able to continue to meet those covenants. In addition, a breach of a covenant under any one of our credit facilities may result cross-default under a separate credit facility. If we seek to enter into a credit facility we may not be able to obtain debt financing on terms that are favorable to us, if at all. If we incur additional debt, the debt holders would have rights senior to holders of common stock to make claims on our assets, and the terms of any debt could restrict our operations, including our ability to pay dividends on our common stock. If we are unable to obtain adequate financing or financing on terms that are satisfactory to us when we require it, our ability to continue to support our business growth and to respond to business challenges could be significantly impaired, and our business may be harmed.
We have previously identified material weaknesses in our internal control over financial reporting, and if we are unable to implement and maintain effective internal control over financial reporting in the future, investors may lose confidence in the accuracy and completeness of our financial reports, and the market price of our Class A common stock may be seriously harmed.
As a public company, we are required to maintain internal control over financial reporting and to report any material weaknesses in those internal controls, subject to any exemptions that we avail ourselves to under the JOBS Act. For example, we are required to perform system and process evaluation and testing of our internal control over financial reporting to allow management to report on the effectiveness of our internal control over financial reporting, as required by Section 404. We are in the process of designing, implementing, and testing internal control over financial reporting required to comply with this obligation. That process is time-consuming, costly, and complicated.
We and our independent registered public accounting firm identified material weaknesses in our internal control over financial reporting for the years ended December 31, 2019, 2018 and 2017, related to the lack of sufficient qualified accounting and information systems personnel, which led to incorrect application of generally accepted accounting principles, and insufficiently designed segregation of duties, information technology access security and change management, and controls over business processes, including the financial statement close and reporting processes with respect to the development of accounting policies, procedures, and estimates. Management has been actively engaged in remediating the above described material weakness. The following remedial actions have been taken during the year ended December 31, 2019:
• | hired additional full-time accounting resources with appropriate levels of experience; |
• | continue to actively recruit for open positions within the accounting department and will, as necessary, supplement any interim staffing needs with temporary resources; |
• | reallocated responsibilities across the accounting organization to ensure that the appropriate level of knowledge and experience is applied based on risk and complexity of transactions and tasks under review; |
• | strengthened our internal policies, processes and reviews, including substantial completion of the formal documentation thereof; |
• | implemented a formal financial month-end close policy and process; and |
• | engaged a professional accounting services firm to help us assess and commence documentation of our internal controls for complying with the Sarbanes-Oxley Act. |
The process of implementing an effective financial reporting system is a continuous effort that requires us to anticipate and react to changes in our business and the economic and regulatory environments and to expend significant resources to
42
maintain a financial reporting system that is adequate to satisfy our reporting obligations. As we continue to evaluate and take actions to improve our internal control over financial reporting, we may take additional actions to address control deficiencies or modify certain of the remediation measures described above.
While significant progress has been made to enhance our internal control over financial reporting, we are still in the process of implementing, documenting and testing these processes, procedures and controls. Additional time is required to complete implementation and to assess and ensure the sustainability of these procedures. We believe the above actions will be effective in remediating the material weaknesses described above and we will continue to devote significant time and attention to these remedial efforts. However, the material weaknesses cannot be considered remediated until the applicable remedial controls operate for a sufficient period of time and management has concluded, through testing, that these controls are operating effectively.
If we identify future material weaknesses in our internal control over financial reporting, if we are unable to comply with the requirements of Section 404 in a timely manner or assert that our internal control over financial reporting is effective, or if our independent registered public accounting firm is unable to express an opinion or expresses a qualified or adverse opinion about the effectiveness of our internal control over financial reporting, investors may lose confidence in the accuracy and completeness of our financial reports and the market price of our Class A common stock could be negatively affected. In addition, we could become subject to investigations by the stock exchange on which our securities are listed, the SEC, and other regulatory authorities, which could require additional financial and management resources.
We may not be able to successfully manage the growth of our business if we are unable to improve our internal systems, processes and controls.
We need to continue to improve our internal systems, processes, and controls to effectively manage our operations and growth. We may not be able to successfully implement and scale improvements to our systems and processes in a timely or efficient manner or in a manner that does not negatively affect our operating results. For example, we may not be able to effectively monitor certain extraordinary contract requirements or provisions that are individually negotiated by our sales force as the number of transactions continues to grow. In addition, our systems and processes may not prevent or detect all errors, omissions, or fraud. We may experience difficulties in managing improvements to our systems, processes, and controls or in connection with third-party software, which could impair our ability to offer our platform to our customers in a timely manner, causing us to lose customers, limit us to smaller deployments of our products, or increase our technical support costs.
We could incur substantial costs in protecting or defending our proprietary rights, and any failure to adequately protect our rights could impair our competitive position and we may lose valuable assets, experience reduced revenue, and incur costly litigation to protect our rights.
Our success is dependent, in part, upon protecting our proprietary technology. We rely on a combination of patents, copyrights, trademarks, service marks, trade secret laws, and contractual provisions in an effort to establish and protect our proprietary rights. However, the steps we take to protect our intellectual property may be inadequate. While we have issued patents in the United States and other countries and have additional pending patent applications, we may be unable to obtain patent protection for the technology covered in our patent applications. In addition, any patents issued in the future may not provide us with competitive advantages, or may be successfully challenged by third parties. Any of our patents, trademarks, or other intellectual property rights may be challenged or circumvented by others or invalidated through administrative process or litigation. There can be no guarantee that others will not independently develop similar products, duplicate any of our products, or design around our patents. Furthermore, legal standards relating to the validity, enforceability, and scope of protection of intellectual property rights are uncertain. Despite our precautions, it may be possible for unauthorized third parties to copy our products and use information that we regard as proprietary to create products and services that compete with ours. Some license provisions protecting against unauthorized use, copying, transfer, and disclosure of our products may be unenforceable under the laws of jurisdictions outside the United States. To the extent we expand our international activities, our exposure to unauthorized copying and use of our products and proprietary information may increase.
We enter into confidentiality and invention assignment agreements with our employees and consultants and enter into confidentiality agreements with the parties with whom we have strategic relationships and business alliances. No assurance can be given that these agreements will be effective in controlling access to and distribution of our products and proprietary information. Further, these agreements do not prevent our competitors or partners from independently developing technologies that are substantially equivalent or superior to our platform.
43
In order to protect our intellectual property rights, we may be required to spend significant resources to monitor and protect these rights. Litigation may be necessary in the future to enforce our intellectual property rights and to protect our trade secrets. Litigation brought to protect and enforce our intellectual property rights could be costly, time consuming, and distracting to management and could result in the impairment or loss of portions of our intellectual property. Furthermore, our efforts to enforce our intellectual property rights may be met with defenses, counterclaims, and countersuits attacking the validity and enforceability of our intellectual property rights. Our inability to protect our proprietary technology against unauthorized copying or use, as well as any costly litigation or diversion of our management’s attention and resources, could delay further sales or the implementation of our platform, impair the functionality of our platform, delay introductions of new products, result in our substituting inferior or more costly technologies into our products, or injure our reputation. We will not be able to protect our intellectual property if we are unable to enforce our rights or if we do not detect unauthorized use of our intellectual property. Moreover, policing unauthorized use of our technologies, trade secrets, and intellectual property may be difficult, expensive, and time-consuming, particularly in foreign countries where the laws may not be as protective of intellectual property rights as those in the United States and where mechanisms for enforcement of intellectual property rights may be weak. If we fail to meaningfully protect our intellectual property and proprietary rights, our business may be harmed.
We may in the future be subject to legal proceedings and litigation, including intellectual property disputes, which are costly and may subject us to significant liability and increased costs of doing business. Our business may suffer if it is alleged or determined that our technology infringes the intellectual property rights of others.
The software industry is characterized by the existence of a large number of patents, copyrights, trademarks, trade secrets, and other intellectual property rights. Companies in the software industry are often required to defend against litigation claims based on allegations of infringement or other violations of intellectual property rights. Our technologies may not be able to withstand any third-party claims or rights against their use. In addition, many of these companies have the capability to dedicate substantially greater resources to enforce their intellectual property rights and to defend claims that may be brought against them. Any litigation may also involve patent holding companies or other adverse patent owners that have no relevant product revenue and against which our patents may therefore provide little or no deterrence. If a third party is able to obtain an injunction preventing us from accessing such third-party intellectual property rights, or if we cannot license or develop technology for any infringing aspect of our business, we would be forced to limit or stop selling products impacted by the claim or injunction or cease business activities covered by such intellectual property, and may be unable to compete effectively. Any inability to license third party technology in the future would have an adverse effect on our business or operating results, and would adversely affect our ability to compete. We may also be contractually obligated to indemnify our customers in the event of infringement of a third party’s intellectual property rights. We receive demands for such indemnification from time to time and expect to continue to do so. Responding to such claims, including those currently pending, regardless of their merit, can be time consuming, costly to defend in litigation, and damage our reputation and brand.
Lawsuits are time-consuming and expensive to resolve and they divert management’s time and attention. Although we carry insurance, our insurance may not cover potential claims of this type or may not be adequate to indemnify us for all liability that may be imposed. We cannot predict the outcome of lawsuits, and the results of any such actions may harm our business.
Elements of our platform use open source software, which may restrict the functionality of our platform or require that we release the source code of certain products subject to those licenses.
Our platform incorporates software licensed under open source licenses. Such open source licenses typically require that source code subject to the license be made available to the public and that any modifications or derivative works to open source software continue to be licensed under open source licenses. Few courts have interpreted open source licenses, and the manner in which these licenses may be interpreted and enforced is therefore subject to some uncertainty. We rely on multiple software programmers to design our proprietary technologies, and we do not exercise complete control over the development efforts of our programmers and we cannot be certain that our programmers have not incorporated open source software into our proprietary products and technologies or that they will not do so in the future. In the event that portions of our proprietary technology are determined to be subject to an open source license, we could be required to publicly release the affected portions of our source code, re-engineer all or a portion of our technologies, or otherwise be limited in the licensing of our technologies, each of which could reduce or eliminate the value of our platform and technologies and materially and adversely affect our ability to sustain and grow our business.
44
Provisions in various agreements potentially expose us to substantial liability for intellectual property infringement, data protection, and other losses.
Our agreements with customers and other third parties generally include provisions under which we are liable or agree to indemnify them for losses suffered or incurred as a result of claims of intellectual property infringement, data protection, damages caused by us to property or persons, or other liabilities relating to or arising from our platform, services, or other contractual obligations. Some of these agreements provide for uncapped liability for which we would be responsible, and some provisions survive termination or expiration of the applicable agreement. Large liability payments could harm our business, results of operations, and financial condition. Although we normally contractually limit our liability with respect to such obligations, we may still incur substantial liability related to them, and in case of an intellectual property infringement indemnification claim, we may be required to cease use of certain functions of our platform as a result of any such claims. Any dispute with a customer with respect to such obligations could have adverse effects on our relationship with that customer and other existing customers and new customers and harm our business. Even when we have contractual protections against such customer claims, we may choose to honor a customer’s request for indemnification or otherwise seek to maintain customer satisfaction by issuing customer credits, assisting our customer in defending against claims, or in other ways.
We are subject to governmental regulation and other legal obligations, particularly those related to privacy, data protection, and information security, and our actual or perceived failure to comply with such obligations could harm our business, by resulting in litigation, fines, penalties, or adverse publicity and reputational damage that may negatively affect the value of our business and decrease the price of our common stock. Compliance with such laws could also result in additional costs and liabilities to us or inhibit sales of our products.
We receive, store, and process personal information and other data from and about actual and prospective customers and users, in addition to our employees and service providers. In addition, our customers use our platform to collect personally identifiable information, personal health information, and personal financial information from their end-users. Our handling of data is subject to a variety of laws and regulations, including regulation by various government agencies, such as the U.S. Federal Trade Commission ("FTC"), and various state, local, and foreign agencies. Our data handling also is subject to contractual obligations and industry standards.
The U.S. federal and various state and foreign governments have adopted or proposed limitations on the collection, distribution, use, and storage of data relating to individuals and businesses, including the use of contact information and other data for marketing, advertising, and other communications with individuals and businesses. In the United States, various laws and regulations apply to the collection, processing, disclosure, and security of certain types of data, including the Electronic Communications Privacy Act, the Computer Fraud and Abuse Act, the Health Insurance Portability and Accountability Act of 1996, the Gramm Leach Bliley Act, and state laws relating to privacy and data security, including the California Consumer Privacy Act (the “CCPA”), which became effective on January 1, 2020. The CCPA requires companies that process information on California residents to make new disclosures to consumers about their data collection, use and sharing practices, allows consumers to opt out of certain data sharing with third parties and provides a new cause of action for data breaches. It remains unclear how the CCPA will be interpreted and the extent of its impact on our business. Additionally, the FTC and many state attorneys general are interpreting federal and state consumer protection laws as imposing standards for the online collection, use, dissemination, and security of data. The laws and regulations relating to privacy and data security are evolving, can be subject to significant change and may result in ever-increasing regulatory and public scrutiny and escalating levels of enforcement and sanctions.
In addition, several foreign countries and governmental bodies, including the EU, have laws and regulations dealing with the handling and processing of personal information obtained from their residents, which in certain cases are more restrictive than those in the United States. Laws and regulations in these jurisdictions apply broadly to the collection, use, storage, disclosure, and security of various types of data, including data that identifies or may be used to identify an individual, such as names, email addresses, and in some jurisdictions, Internet Protocol ("IP") addresses. Such laws and regulations may be modified or subject to new or different interpretations, and new laws and regulations may be enacted in the future.
Within the EU, the General Data Protection Regulation ("GDPR") significantly increases the level of sanctions for non-compliance from those in existing EU data protection law and imposes direct obligations on data processors in addition to data controllers and may require us to make further changes to our policies and procedures in the future, beyond what we have already done. EU data protection authorities will have the power to impose administrative fines for violations of the GDPR of up to a maximum of €20 million or 4% of the data controller’s or data processor’s total worldwide global turnover for the
45
preceding fiscal year, whichever is higher, and violations of the GDPR may also lead to damages claims by data controllers and data subjects. Such penalties are in addition to any civil litigation claims by data controllers, customers, and data subjects. Since we act as a data processor for our customers, we are taking steps to cause our processes to be compliant with applicable portions of the GDPR, but we cannot assure you that such steps will be effective. In particular, although the UK enacted a Data Protection Act in May 2018 that is designed to be consistent with the GDPR, due to Brexit (see "—Legal, political, and economic uncertainty surrounding the planned exit of the United Kingdom ("UK"), from the European Union ("EU"), may be a source of instability in international markets, create significant currency fluctuations, adversely affect our operations in the UK, and pose additional risks to our business, revenue, financial condition, and results of operations"), uncertainty remains regarding how data transfers to and from the UK will be regulated.
The scope and interpretation of the laws that are or may be applicable to us are often uncertain and may be conflicting, particularly laws outside the United States, as a result of the rapidly evolving regulatory framework for privacy issues worldwide. For example, laws relating to the liability of providers of online services for activities of their users and other third parties are currently being tested by a number of claims, including actions based on invasion of privacy and other torts, unfair competition, copyright and trademark infringement, and other theories based on the nature and content of the materials searched, the ads posted, or the content provided by users. As a result of the laws that are or may be applicable to us, and due to the sensitive nature of the information we collect, we have implemented policies and procedures to preserve and protect our data and our customers’ data against loss, misuse, corruption, misappropriation caused by systems failures, unauthorized access, or misuse. If our policies, procedures, or measures relating to privacy, data protection, marketing, or customer communications fail to comply with laws, regulations, policies, legal obligations, or industry standards, we may be subject to governmental enforcement actions, litigation, regulatory investigations, fines, penalties, and negative publicity and could cause our application providers, customers, and partners to lose trust in us, and have an adverse effect on our business, operating results, and financial condition.
In addition to government regulation, privacy advocates, and industry groups may propose new and different self regulatory standards that may apply to us. Because the interpretation and application of privacy and data protection laws, regulations, rules, and other standards are still uncertain, it is possible that these laws, rules, regulations, and other actual or alleged legal obligations, such as contractual or self-regulatory obligations, may be interpreted and applied in a manner that is inconsistent with our existing data management practices or the functionality of our platform. If so, in addition to the possibility of fines, lawsuits, and other claims, we could be required to fundamentally change our business activities and practices or modify our software, which could have an adverse effect on our business.
Any failure or perceived failure by us to comply with laws, regulations, policies, legal, or contractual obligations, industry standards, or regulatory guidance relating to privacy or data security, may result in governmental investigations and enforcement actions (including, for example, a ban by EU Supervisory Authorities on the processing of EU personal data under the GDPR), litigation, fines and penalties, or adverse publicity, and could cause our customers and partners to lose trust in us, which could have an adverse effect on our reputation and business. Our obligation to assist our customers in their compliance with laws, regulations, and policies, like data processing and data protection requirements under the GDPR may also result in government enforcement actions litigation, fines and penalties, or adverse publicity. We expect that there will continue to be new proposed laws, regulations, and industry standards relating to privacy, data protection, marketing, consumer communications, and information security in the United States, the EU, and other jurisdictions, and we cannot determine the impact such future laws, regulations, and standards may have on our business. Future laws, regulations, standards, and other obligations or any changed interpretation of existing laws or regulations could impair our ability to develop and market new functionality and maintain and grow our customer base and increase revenue. Future restrictions on the collection, use, sharing, or disclosure of data or additional requirements for express or implied consent of our customers, partners, or end-users for the use and disclosure of such information could require us to incur additional costs or modify our platform, possibly in a material manner, and could limit our ability to develop new functionality.
If we are not able to comply with these laws or regulations or if we become liable under these laws or regulations, we could be directly harmed, and we may be forced to implement new measures to reduce our exposure to this liability. This may require us to expend substantial resources or to discontinue certain products, which would negatively affect our business, financial condition, and results of operations. In addition, the increased attention focused upon liability issues as a result of lawsuits and legislative proposals could harm our reputation or otherwise adversely affect the growth of our business. Furthermore, any costs incurred as a result of this potential liability could harm our operating results.
46
We are subject to governmental export and import controls that could impair our ability to compete in international markets or subject us to liability if we violate such controls.
Our products are subject to U.S. export controls, including the Export Administration Regulations administered by the U.S. Commerce Department, and economic sanctions administered by the Office of Foreign Assets Control of the U.S. Treasury Department ("OFAC"), and we incorporate encryption technology into certain of our products. These encryption products and the underlying technology may be exported outside of the United States only with the required export authorizations.
Furthermore, our activities are subject to U.S. economic sanctions laws and regulations that generally prohibit the direct or indirect exportation or provision of products and services without the required export authorizations to countries, governments, and individuals and entities targeted by U.S. embargoes or sanctions, except to the extent authorized by OFAC or exempt from sanctions. Additionally, the Trump administration has been critical of existing trade agreements and may impose more stringent export and import controls. Obtaining the necessary export license or other authorization for a particular sale may not always be possible, and, even if the export license is ultimately granted, the process may be time-consuming and may result in the delay or loss of sales opportunities. Violations of U.S. sanctions or export control laws can result in significant fines or penalties, and possible incarceration for responsible employees and managers could be imposed for criminal violations of these laws.
Other countries also regulate the import and export of certain encryption products and technology through import and export licensing requirements, and have enacted laws that could limit our ability to distribute our products or could limit our customers’ ability to implement our products in those countries. Changes in our products or future changes in export and import regulations may create delays in the introduction of our products in international markets, prevent our customers with international operations from deploying our products globally, or, in some cases, prevent the export or import of our products to certain countries, governments, or persons altogether. From time to time, various governmental agencies have proposed additional regulation of encryption products and technology, including the escrow and government recovery of private encryption keys. Any change in export or import regulations, economic sanctions or related legislation, increased export and import controls, or change in the countries, governments, persons, or technologies targeted by such regulations could result in decreased use of our products by, or in our decreased ability to export or sell our products to, existing or potential customers with international operations. Any decreased use of our products or limitation on our ability to export or sell our products would harm our business.
Risks Related to Ownership of Our Class A Common Stock
The dual class structure of our common stock has the effect of concentrating voting control with the holders of our Class B common stock, including our executive officers, employees, and directors and their affiliates, and limiting your ability to influence corporate matters.
Our Class B common stock has 10 votes per share, and our Class A common stock has one vote per share. As of December 31, 2019, our Class B common stock held by stockholders, including our executive officers and directors and their affiliates, represents approximately 84.8% of the voting power of our outstanding capital stock, and our Chief Architect and Executive Chairman, Artur Bergman, holds approximately 12.0% of our outstanding classes of common stock as a whole, but controls approximately 27.8% of the voting power of our outstanding common stock. As a result, our executive officers, directors, and other affiliates and our Chief Architect and Executive Chairman on his own currently have and will continue to have significant influence over our management and affairs and over all matters requiring stockholder approval, including election of directors and significant corporate transactions, such as a merger or other sale of the company or our assets, for the foreseeable future. If Mr. Bergman’s employment with us is terminated, he will continue to have the same influence over matters requiring stockholder approval.
In addition, the holders of Class B common stock collectively will continue to be able to control all matters submitted to our stockholders for approval even if their stock holdings represent less than 50% of the outstanding shares of our common stock. Because of the 10-to-1 voting ratio between our Class B and Class A common stock, the holders of our Class B common stock collectively will continue to control a majority of the combined voting power of our common stock even when the shares of Class B common stock represent as little as 10% of the combined voting power of all outstanding shares of our Class A and Class B common stock. This concentrated control limits the ability for holders of Class A common stock to influence corporate matters for the foreseeable future, and, as a result, the market price of our Class A common stock could be adversely affected.
47
Transfers by holders of Class B common stock will generally result in those shares converting to Class A common stock, which will have the effect, over time, of increasing the relative voting power of those holders of Class B common stock who retain their shares in the long term. If, for example, Mr. Bergman retains a significant portion of his holdings of Class B common stock for an extended period of time, he could, in the future, control a majority of the combined voting power of our Class A and Class B common stock. As a board member, Mr. Bergman owes a fiduciary duty to our stockholders and must act in good faith in a manner he reasonably believes to be in the best interests of our stockholders. As a stockholder, even a controlling stockholder, Mr. Bergman is entitled to vote his shares in his own interests, which may not always be in the interests of our stockholders generally.
Our stock price may be volatile, and the value of our Class A common stock may decline.
The market price of our Class A common stock may be highly volatile and may fluctuate or decline substantially as a result of a variety of factors, some of which are beyond our control or are related in complex ways, including:
• | actual or anticipated fluctuations in our financial condition and operating results; |
• | variance in our financial performance from expectations of securities analysts or investors; |
• | changes in the pricing we offer our customers; |
• | changes in our projected operating and financial results; |
• | changes in laws or regulations applicable to our platform or related products; |
• | announcements by us or our competitors of significant business developments, acquisitions, or new offerings; |
• | publicity associated with network downtime and problems; |
• | our involvement in litigation; |
• | changes in senior management or key personnel; |
• | the trading volume of our Class A common stock; |
• | changes in the anticipated future size and growth rate of our market; and |
• | general economic, regulatory, and market conditions. |
Broad market and industry fluctuations, as well as general economic, political, regulatory, and market conditions, may negatively impact the market price of our Class A common stock. In addition, given the relatively small public float of shares of our Class A common stock on the New York Stock Exchange ("NYSE"), the trading market for our shares may be subject to increased volatility. In the past, companies that have experienced volatility in the market price of their securities have been subject to securities class action litigation. We may be the target of this type of litigation in the future, which could result in substantial costs and divert our management’s attention.
Future sales and issuances of our capital stock or rights to purchase capital stock could result in dilution of the percentage ownership of our stockholders and could cause the price of our Class A common stock to decline.
Future sales and issuances of our capital stock or rights to purchase our capital stock could result in substantial dilution to our existing stockholders. We may sell Class A common stock, convertible securities, and other equity securities in one or more transactions at prices and in a manner as we may determine from time to time. If we sell any such securities in subsequent transactions, investors may be materially diluted. New investors in such subsequent transactions could gain rights, preferences, and privileges senior to those of holders of our Class A common stock.
48
Future sales of our Class A common stock by existing holders in the public market could cause the market price of our Class A common stock to decline.
Sales of a substantial number of shares of our Class A common stock in the public market, or the perception that these sales might occur, could depress the market price of our Class A common stock and could impair our ability to raise capital through the sale of additional equity securities. We are unable to predict the effect that such sales may have on the prevailing market price of our Class A common stock.
As of December 31, 2019, we have outstanding a total of 60,954,694 shares of Class A common stock and 34,062,916 shares of Class B common stock. All of our outstanding shares are eligible for sale in the public market, other than shares and options held by directors, executive officers, and other affiliates that are subject to volume limitations under Rule 144 of the Securities Act, and various vesting agreements.
Certain holders of shares of our Class B common stock (including shares issuable upon the exercise of outstanding warrants) have rights, subject to some conditions, to require us to file registration statements for the public resale of the Class A common stock issuable upon conversion of such shares or to include such shares in registration statements that we may file on our behalf or for other stockholders.
Future sales also could cause the trading price of our Class A common stock to decline and make it more difficult for investors to sell shares of our Class A common stock.
If securities or industry analysts do not publish research or publish unfavorable or inaccurate research about our business, our Class A common stock price and trading volume could decline.
Our stock price and trading volume are heavily influenced by the way analysts and investors interpret our financial information and other disclosures. If securities or industry analysts do not publish research or reports about our business, delay publishing reports about our business, or publish negative reports about our business, regardless of accuracy, our Class A common stock price and trading volume could decline.
The trading market for our Class A common stock depends, in part, on the research and reports that securities or industry analysts publish about us or our business. We do not have any control over these analysts. We expect that only a limited number of analysts will cover our company following our initial public offering. If the number of analysts that cover us declines, demand for our Class A common stock could decrease and our Class A common stock price and trading volume may decline.
Even if our Class A common stock is actively covered by analysts, we do not have any control over the analysts or the measures that analysts or investors may rely upon to forecast our future results. Over-reliance by analysts or investors on any particular metric to forecast our future results may result in forecasts that differ significantly from our own.
Regardless of accuracy, unfavorable interpretations of our financial information and other public disclosures could have a negative impact on our stock price. If our financial performance fails to meet analyst estimates, for any of the reasons discussed above or otherwise, or one or more of the analysts who cover us downgrade our Class A common stock or change their opinion of our Class A common stock, our stock price would likely decline.
We do not intend to pay dividends for the foreseeable future.
We have never declared or paid any cash dividends on our capital stock, and we do not intend to pay any cash dividends in the foreseeable future. Any determination to pay dividends in the future will be at the discretion of our board of directors and may be restricted by the terms of any then-current credit facility. Accordingly, investors must rely on sales of their Class A common stock after price appreciation, which may never occur, as the only way to realize any future gains on their investments.
We are an "emerging growth company" and our compliance with the reduced reporting and disclosure requirements applicable to emerging growth companies could make our Class A common stock less attractive to investors.
We are an "emerging growth company," as defined in the JOBS Act, and we expect to take advantage of certain exemptions from various reporting requirements that are applicable to other public companies that are not "emerging growth companies" including, the auditor attestation requirements of Section 404, reduced disclosure obligations regarding executive compensation in our periodic reports and proxy statements, exemptions from the requirements of holding a nonbinding advisory
49
vote on executive compensation and stockholder approval of any golden parachute payments not previously approved and extended adoption period for accounting pronouncements. We cannot predict whether investors will find our Class A common stock less attractive as a result of our reliance on these exemptions. If some investors find our Class A common stock less attractive as a result, there may be a less active trading market for our Class A common stock and our stock price may be more volatile.
We will incur increased costs as a result of operating as a public company, and our management will be required to devote substantial time to compliance with our public company responsibilities and corporate governance practices.
As a public company, we have incurred and expect to continue to incur significant legal, accounting, and other expenses that we did not incur as a private company. We expect such expenses to further increase after we are no longer an “emerging growth company.” The Sarbanes-Oxley Act, the Dodd-Frank Wall Street Reform and Consumer Protection Act, the listing requirements of the NYSE, and other applicable securities rules and regulations impose various requirements on public companies. Furthermore, the senior members of our management team do not have significant experience with operating a public company. As a result, our management and other personnel will have to devote a substantial amount of time to compliance with these requirements. Moreover, these rules and regulations will increase our legal and financial compliance costs and will make some activities more time-consuming and costly. We cannot predict or estimate the amount of additional costs we will incur as a public company or the timing of such costs.
As a result of being a public company, we are obligated to develop and maintain proper and effective internal controls over financial reporting and any failure to maintain the adequacy of these internal controls may adversely affect investor confidence in our company and, as a result, the value of our Class A common stock.
We are required, pursuant to Section 404 to furnish a report by management on, among other things, the effectiveness of our internal control over financial reporting. This assessment will need to include disclosure of any material weaknesses identified by our management in our internal control over financial reporting. In addition, our independent registered public accounting firm will be required to attest to the effectiveness of our internal control over financial reporting in our first annual report required to be filed with the SEC following the date we are no longer an “emerging growth company.” Over the last year, we have taken and continue to take additional steps to upgrade our finance and accounting function, including the hiring of additional financing and accounting personnel, and implement additional policies and procedures associated with the financial statement close process. Our compliance with Section 404 requires that we incur substantial accounting expense and expend significant management efforts. We currently have a small internal audit group, and we will need to hire additional accounting and financial staff with appropriate public company experience and technical accounting knowledge and compile the system and process documentation necessary to perform the evaluation needed to comply with Section 404.
We have identified a material weakness over financial reporting for the years ended December 31, 2019, 2018 and 2017, related to the lack of sufficient qualified accounting and information systems personnel, which led to incorrect application of generally accepted accounting principles, and insufficiently designed segregation of duties, information technology access security and change management, and controls over business processes, including the financial statement close and reporting processes with respect to the development of accounting policies, procedures, and estimates. While we are actively working on remediating these identified weaknesses, we may discover additional weaknesses in our system of internal financial and accounting controls and procedures that could result in a material misstatement of our financial statements. In addition, our internal control over financial reporting will not prevent or detect all errors and all fraud. A control system, no matter how well designed and operated, can provide only reasonable, not absolute, assurance that the control system’s objectives will be met. Because of the inherent limitations in all control systems, no evaluation of controls can provide absolute assurance that misstatements due to error or fraud will not occur or that all control issues and instances of fraud will be detected.
The rules governing the standards that must be met for our management to assess our internal control over financial reporting are complex and require significant documentation, testing, and possible remediation. If we are not able to comply with the requirements of Section 404 in a timely manner, or if we are unable to maintain proper and effective internal controls, we may not be able to produce timely and accurate financial statements. In addition, in connection with the future attestation process by our independent registered public accounting firm, we may encounter problems or delays in completing the implementation of any requested improvements and receiving a favorable attestation. If we cannot favorably assess the effectiveness of our internal control over financial reporting, or if our independent registered public accounting firm is unable to provide an unqualified attestation report on our internal controls, our stockholders could lose confidence in our reporting, and
50
the market price of our stock could decline. In addition, we could be subject to sanctions or investigations by the NYSE, or SEC, or other regulatory authorities.
Anti-takeover provisions in our charter documents and under Delaware law could make an acquisition of our company more difficult, limit attempts by our stockholders to replace or remove our current management and limit the market price of our Class A common stock.
Provisions in our amended and restated certificate of incorporation and amended and restated bylaws may have the effect of delaying or preventing a change of control or changes in our management. Our amended and restated certificate of incorporation and amended and restated bylaws include provisions that:
• | authorize our board of directors to issue, without further action by the stockholders, shares of undesignated preferred stock with terms, rights, and preferences determined by our board of directors that may be senior to our common stock; |
• | require that any action to be taken by our stockholders be effected at a duly called annual or special meeting and not by written consent; |
• | specify that special meetings of our stockholders can be called only by our board of directors, the chairperson of our board of directors, or our chief executive officer; |
• | establish an advance notice procedure for stockholder proposals to be brought before an annual meeting, including proposed nominations of persons for election to our board of directors; |
• | establish that our board of directors is divided into three classes, with each class serving three-year staggered terms; |
• | prohibit cumulative voting in the election of directors; |
• | provide that our directors may be removed for cause only upon the vote of the holders of a majority of our outstanding shares of common stock; |
• | provide that vacancies on our board of directors may be filled only by a majority of directors then in office, even though less than a quorum; |
• | reflect our two classes of common stock as described above. |
These provisions may frustrate or prevent any attempts by our stockholders to replace or remove our current management by making it more difficult for stockholders to replace members of our board of directors, which is responsible for appointing the members of our management. In addition, because we are incorporated in Delaware, we are governed by the provisions of Section 203 of the Delaware General Corporation Law, which generally, subject to certain exceptions, prohibits a Delaware corporation from engaging in any of a broad range of business combinations with any “interested” stockholder for a period of three years following the date on which the stockholder became an “interested” stockholder. Any delay or prevention of a change of control transaction or changes in our management could cause the market price of our Class A common stock to decline.
Our amended and restated certificate of incorporation provides that the Court of Chancery of the State of Delaware and, to the extent enforceable, the federal district courts of the United States of America will be the exclusive forums for substantially all disputes between us and our stockholders, which could limit our stockholders’ ability to obtain a favorable judicial forum for disputes with us or our directors, officers, or employees.
Our amended and restated certificate of incorporation provides that the Court of Chancery of the State of Delaware is the exclusive forum for the following types of actions or proceedings under Delaware statutory or common law for:
• | any derivative action or proceeding brought on our behalf; |
• | any action asserting a breach of fiduciary duty; |
• | any action asserting a claim against us arising under the Delaware General Corporation Law, |
51
• | our amended and restated certificate of incorporation, or our amended and restated bylaws; and |
• | any action asserting a claim against us that is governed by the internal-affairs doctrine. |
In addition, our amended and restated certificate of incorporation provides that the federal district courts of the United States of America will be the exclusive forum for resolving any complaint asserting a cause of action arising under the Securities Act, subject to and contingent upon a final adjudication in the State of Delaware of the enforceability of such exclusive forum provision. These exclusive-forum provisions may limit a stockholder’s ability to bring a claim in a judicial forum that it finds favorable for disputes with us or our directors, officers, or other employees, which may discourage lawsuits against us and our directors, officers, and other employees. If a court were to find either exclusive-forum provision in our amended and restated certificate of incorporation to be inapplicable or unenforceable, we may incur additional costs associated with resolving the dispute in other jurisdictions. For example, the Court of Chancery of the State of Delaware recently determined that the exclusive forum provision of federal district courts of the United States of America for resolving any complaint asserting a cause of action arising under the Securities Act is not enforceable. However, this decision may be reviewed and ultimately overturned by the Delaware Supreme Court. If this ultimate adjudication were to occur, the federal district court exclusive forum provision in our amended and restated certificate of incorporation would no longer be contingent.
52
Item 1B. Unresolved Staff Comments
None.
Item 2. Properties
Our corporate headquarters is located in San Francisco, California and consists of approximately 71,343 square feet of space under a lease that expires on July 31, 2027. We also maintain offices in Portland, Denver, New York, London, and Tokyo. We lease all of our facilities and do not own any real property. We expect to add facilities as we grow our employee base and expand geographically. We believe that our facilities are sufficient to meet our needs for the immediate future, and that, should it be needed, suitable additional space will be available to accommodate expansion of our operations.
Item 3. Legal Proceedings
From time to time, we have been and will continue to be subject to legal proceedings and claims. We are not presently a party to any legal proceedings that, if determined adversely to us, would individually or taken together have a material adverse effect on our business, results of operations, financial condition, or cash flows. We have received, and may in the future continue to receive, claims from third parties asserting, among other things, infringement of their intellectual property rights. Future litigation may be necessary to defend ourselves, our partners, and our customers by determining the scope, enforceability, and validity of third-party proprietary rights, or to establish our proprietary rights. The results of any current or future litigation cannot be predicted with certainty, and regardless of the outcome, litigation can have an adverse impact on us because of defense and settlement costs, diversion of management resources, and other factors.
Item 4. Mine Safety Disclosures
Not applicable.
53
PART II
Item 5. Market for Registrant's Common Equity, Related Stockholder Matters, and Issuer Purchases of Equity Securities
Market Information
Our Class A common stock has traded on The New York Stock Exchange ("NYSE") under the symbol "FSLY" since May 17, 2019. Prior to that date, there was no public trading market for our Class A common stock. Our initial public offering was priced at $16.00 per share on May 17, 2019. On December 31, 2019, the closing price per share of our common stock as reported on the NYSE was $20.07.
Holders of Record
As of December 31, 2019, there were 52 holders of record of our Class A and 157 holders of our Class B common stock. The number of beneficial stockholders is substantially greater than the number of holders of record because a large portion of our common stock is held through brokerage firms.
Dividend Policy
We have never declared or paid any cash dividends on our capital stock. We currently intend to retain any future earnings and do not expect to pay any dividends in the foreseeable future. Any future determination to declare cash dividends will be made at the discretion of our Board of Directors, subject to applicable laws, and will depend on a number of factors, including our financial condition, results of operations, capital requirements, contractual restrictions, general business conditions, and other factors that our Board of Directors may deem relevant. In addition, the terms of our revolving credit facility place certain limitations on the amount of cash dividends we can pay, even if no amounts are currently outstanding.
Stock Performance Graph
This performance graph shall not be deemed “soliciting material” or to be “filed” with the Securities and Exchange Commission, or the SEC, for purposes of Section 18 of the Securities Exchange Act of 1934, as amended, or the Exchange Act, or otherwise subject to the liabilities under that Section, and shall not be deemed to be incorporated by reference into any of our filings under the Securities Act of 1933, as amended, or the Securities Act.
We have presented below the cumulative total return to our stockholders between May 17, 2019 (the date our Class A common stock commenced trading on the NYSE) through December 31, 2019 in comparison to the S&P 500 Index and S&P 500 Information Technology Index. The graph assumes a $100 initial investment at the market close on May 17, 2019 which was our initial trading day in our Class A common stock. Our offering price of our Class A common stock in our IPO, which had a closing stock price of $23.99 on May 17, 2019, was $16.00 per share. Data for the S&P 500 Index and S&P 500 Information Technology Index assume reinvestment of dividends. The comparisons are based on historical data and are not indicative of, nor intended to forecast, the future performance of our Class A common stock.
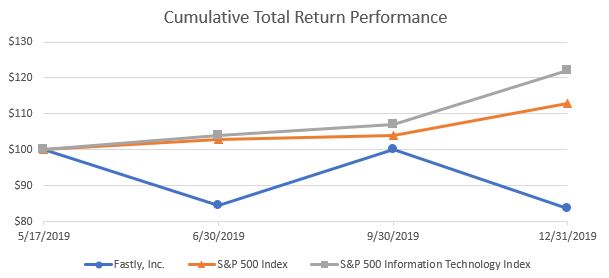
54
Unregistered Sales of Equity Securities
The following sets forth information regarding all unregistered securities sold between January 1, 2019 and May 17, 2019, our initial public offering ("IPO") date (share and per share amounts give effect to the 1-for-2 reverse stock split of our common stock and preferred stock effected on May 3, 2019):
• | From January 1, 2019 to May 17, 2019, we granted stock options to purchase an aggregate of 2,119,092 shares of Class B common stock at exercise prices ranging from $8.42 to $15.00 per share to a total of 258 employees under our 2011 Equity Incentive Plan; and |
• | From January 1, 2019 to May 17, 2019, we issued an aggregate of 1,330,318 shares of Class B common stock upon the exercise of options under our 2011 Equity Incentive Plan at exercise prices ranging from $0.03 to $8.24 per share, for an aggregate purchase price of $2.5 million. |
The offers, sales, and issuances of the securities described above were deemed to be exempt from registration under the Securities Act in reliance on Section 4(2) of the Securities Act or Regulation D promulgated thereunder or Rule 701 promulgated under the Securities Act as transactions by an issuer not involving a public offering or under benefit plans and contracts relating to compensation as provided under Rule 701. The recipients of securities in each of these transactions acquired the securities for investment only and not with a view to or for sale in connection with any distribution thereof and appropriate legends were affixed to the securities issued in these transactions. Each of the recipients of securities in these transactions was an accredited or sophisticated person and had adequate access, through employment, business, or other relationships, to information about us.
Use of Proceeds from Public Offering of Class A Common Stock
On May 21, 2019, we closed our initial public offering ("IPO"), in which we sold 12,937,500 shares of Class A common stock at a price to the public of $16.00 per share, including 1,687,500 shares sold in connection with the exercise of the underwriters’ option to purchase additional shares. The offer and sale of all of the shares in the IPO were registered under the Securities Act pursuant to a registration statement on Form S-1 (File No. 333-230953), which was declared effective by the SEC on May 16, 2019. We raised $192.5 million in net proceeds after deducting underwriting discounts and commissions. No payments were made by us to directors, officers, or persons owning 10 percent or more of our capital stock or to their associates, or to our affiliates, other than payments in the ordinary course of business to officers for salaries. There has been no material change in the planned use of proceeds from our IPO as described in our final prospectus filed with the SEC on May 17, 2019 pursuant to Rule 424(b). We invested the funds received in accordance with our board approved investment policy, which provides for investments in obligations of the U.S. government, money market instruments, registered money market funds, and corporate bonds. The managing underwriters of our IPO were BofA Merrill Lynch, Citigroup, and Credit Suisse. Following the sale of the shares in connection with the IPO, the offering terminated.
Issuer Purchases of Equity Securities
None.
55
Item 6. Selected Consolidated Financial Data
We have derived the selected consolidated statements of operations data for the years ended December 31, 2019, 2018, and 2017 and the Balance Sheet data as of December 31, 2019 and 2018 from our audited consolidated financial statements included elsewhere in this Annual Report on Form 10-K. Our historical results are not necessarily indicative of the results that may be expected in the future. The following selected consolidated financial and other data should be read in conjunction with "Item 7--Management's Discussion and Analysis of Financial Condition and Results of Operations", and our consolidated financial statements and the related notes appearing in "Item 8--Financial Statements and Supplementary Data", of this Annual Report on Form 10-K to fully understand factors that may affect the comparability of the information presented below.
Consolidated Statements of Operations Data (in thousands, except per share data)
Year ended December 31, | ||||||||||||
2019 | 2018 | 2017 | ||||||||||
Revenue | $ | 200,462 | $ | 144,563 | $ | 104,900 | ||||||
Cost of revenue(1) | 88,322 | 65,499 | 48,672 | |||||||||
Gross profit | 112,140 | 79,064 | 56,228 | |||||||||
Operating expenses: | ||||||||||||
Research and development(1) | 46,492 | 34,618 | 28,989 | |||||||||
Sales and marketing(1) | 71,097 | 50,134 | 40,818 | |||||||||
General and administrative(1) | 41,099 | 23,450 | 17,451 | |||||||||
Total operating expenses | 158,688 | 108,202 | 87,258 | |||||||||
Loss from operations | (46,548 | ) | (29,138 | ) | (31,030 | ) | ||||||
Interest income | 3,287 | 939 | 443 | |||||||||
Interest expense | (5,236 | ) | (1,810 | ) | (1,116 | ) | ||||||
Other income (expense), net | (2,561 | ) | (741 | ) | (539 | ) | ||||||
Loss before income taxes | (51,058 | ) | (30,750 | ) | (32,242 | ) | ||||||
Income taxes | 492 | 185 | 208 | |||||||||
Net loss | $ | (51,550 | ) | $ | (30,935 | ) | $ | (32,450 | ) | |||
Net loss per share attributable to common stockholders, basic and diluted | $ | (0.75 | ) | $ | (1.27 | ) | $ | (1.39 | ) | |||
Weighted-average shares used in computing net loss per share attributable to common stockholders, basic and diluted | 68,350 | 24,376 | 23,402 | |||||||||
(1) Includes stock-based compensation expense as follows (in thousands):
Year ended December 31, | ||||||||||||
2019 | 2018 | 2017 | ||||||||||
Cost of revenue | $ | 1,410 | $ | 265 | $ | 190 | ||||||
Research and development | 2,920 | 1,332 | 1,040 | |||||||||
Sales and marketing | 3,497 | 1,023 | 493 | |||||||||
General and administrative | 4,318 | 1,459 | 1,086 | |||||||||
Total stock-based compensation expense | $ | 12,145 | $ | 4,079 | $ | 2,809 | ||||||
56
Consolidated Balance Sheet Data (in thousands)
As of December 31, | ||||||||
2019 | 2018 | |||||||
Cash, cash equivalents, and marketable securities | $ | 131,109 | $ | 83,642 | ||||
Working capital(1) | 212,202 | 85,517 | ||||||
Total assets | $ | 320,969 | $ | 162,754 | ||||
Convertible preferred stock warrant liabilities | — | 3,261 | ||||||
Convertible preferred stock | — | 219,584 | ||||||
Common Stock | 2 | 1 | ||||||
Additional paid-in capital | 449,463 | 16,403 | ||||||
Accumulated deficit | (192,009 | ) | (146,186 | ) | ||||
Total stockholders' equity (deficit) | $ | 257,652 | $ | (131,927 | ) | |||
(1) Working capital is defined as current assets less current liabilities.
57
ITEM 7. Management's Discussion and Analysis of Financial Condition and Results of Operations
You should read the following discussion and analysis of our financial condition and results of operations together with the consolidated financial statements and related notes that are included elsewhere in this Annual Report on Form 10-K. This discussion contains forward-looking statements based upon current plans, expectations, and beliefs that involve risks and uncertainties. Our actual results may differ materially from those anticipated in these forward-looking statements as a result of various factors, including those set forth under “Risk Factors” and in other parts of this Annual Report on Form 10-K. Our fiscal year ends on December 31.
As used herein, "Fastly," "we," "our," "the Company" and similar terms include Fastly, Inc. and its subsidiaries, unless the context indicates otherwise.
Overview
Developers are reinventing the way we live, work, and play online. Yet they repeatedly encounter innovation barriers when delivering modern digital experiences. Expectations for digital experiences are at an all-time high; they must be fast, secure, and highly personalized. If they aren’t reliable, end-users simply take their business elsewhere. The challenge today is enabling developers to deliver a modern digital experience while simultaneously providing scale, security, and performance. We built our edge cloud platform to solve this problem.
The edge cloud is a new category of Infrastructure as a Service ("IaaS") that enables developers to build, secure, and deliver digital experiences, at the edge of the internet. This service represents the convergence of the Content Delivery Network ("CDN") with functionality that has been traditionally delivered by hardware-centric appliances such as Application Delivery Controllers ("ADC"), Web Application Firewalls ("WAF"), Bot Detection, and Distributed Denial of Service ("DDoS") solutions. It also includes the emergence of a new, but growing, edge computing market which aims to move compute power and logic as close to the end-user as possible. The edge cloud uses the emerging cloud computing, serverless paradigm in which the cloud provider runs the server and dynamically manages the allocation of machine resources. When milliseconds matter, processing at the edge is an ideal way to handle highly dynamic and time-sensitive data. The edge cloud complements data center, central cloud, and hybrid solutions.
Our mission is to fuel the next modern digital experience by providing developers with a programmable and reliable edge cloud platform that they adopt as their own.
Organizations must keep up with complex and ever-evolving end-user requirements. We help them surpass their end-users’ expectations by powering fast, secure, and scalable digital experiences. We built a powerful edge cloud platform, designed from the ground up to be programmable and support agile software development. We believe our platform gives our customers a significant competitive advantage, whether they were born into the digital age or are just embarking on their digital transformation journey. Our platform consists of four key components: a programmable edge, a software-defined modern network, safety in depth, and a philosophy of customer empowerment. Our programmable edge provides developers with real-time visibility and control, where they can write and deploy code to push application logic to the edge. It supports modern application delivery processes, freeing developers to innovate without constraints. Our software-defined modern network is built for the software-defined future. It is powerful, efficient, and flexible, designed to enable us to rapidly scale to meet the needs of the most demanding customers and never be a barrier to their growth. Our 74 terabit software-centric network is located in 68 uniquely designed Points-of-Presence ("POPs") across 53 markets, as of December 31, 2019. Our safety in depth approach integrates security into multiple layers of development: architecture, engineering, and operations. That's why we invest in building security into the fabric of our platform, alongside performance. We believe our platform provides developers and security operations teams with a fast, safe environment to create, build, and run modern applications. Finally, being developers ourselves, we empower customers to build great things while supporting their efforts through frictionless tools and a deeply technical support team that facilitates ongoing collaboration.
We serve both established enterprises and technology-savvy organizations. Our customers represent a diverse set of organizations across many industries with one thing in common: they are competing by using the power of software to build differentiation at the edge. With our edge cloud platform, our customers are disrupting existing industries and creating new ones. For example, several of our customers have reinvented digital publishing by connecting readers through subscription models to indispensable content, helping people understand the world through deeply reported independent journalism. Our customers’ software applications use our edge cloud platform to ensure concert goers can buy tickets to the live events they
58
love, travelers can book flights seamlessly and embark on their next great adventure, and sports fans can stream events in real time, across all devices. The range of applications that developers build with our edge cloud platform continues to surpass our expectations.
We generate substantially all of our revenue from charging our customers based on their usage of our platform. Initially, customers typically choose to become platform customers, for which we charge fees based on their committed or actual use of our platform, as measured in gigabytes and requests. Many of our customers generate billings in excess of their minimum commitment. We also generate revenue from additional products as well as professional and other services, such as implementation. We charge a flat one-time or recurring fee for these additional products and services.
Potential customers have the opportunity to test our platform for free. If they choose to make use of our platform for live production delivery, they have the ability to sign up online by providing their credit card information and agreeing to a minimum monthly fee of $50.
We focus our direct selling efforts on medium to large organizations as well as smaller companies that are exhibiting significant growth. We engage with and support these customers with our field sales representatives, account managers, and technical account managers who focus on customer satisfaction and drive expansion of their usage of our platform and products. These teams work with technical and business leaders to help our customers’ end-users receive the best possible digital experience, while also lowering our customers’ total cost of ownership. We have established and continue to maintain our position by improving upon our programmable edge platform and software-defined modern network architecture. We continue to focus on empowering our developer community through events and conferences, including our Altitude conferences. The success of these direct selling efforts is reflected by our 288 enterprise customers as of December 31, 2019 that generated 87% of our total revenue for the trailing 12 months ended December 31, 2019.
As our customers become more successful and grow, they typically increase their usage of our platform and adopt additional Fastly products. A meaningful indicator of the increased activity from our existing customer accounts and overall customer satisfaction is our Dollar-Based Net Expansion Rate ("DBNER"), which was 135.5%, 132.0%, and 147.3% for the trailing 12 months ended December 31, 2019, 2018, and 2017 respectively.
We believe that an annual cohort analysis of our customers, as depicted in the chart below, demonstrates our success in customer expansion. Once a customer begins to generate revenue for us, they tend to increase their usage of our platform, in particular in their second year. Customer accounts acquired in 2015, 2016, 2017, 2018, and 2019 are referred to as the Cohort, 2015 Cohort, 2016 Cohort, 2017 Cohort, 2018 Cohort, and 2019 Cohort, respectively. Our 2015 Cohort increased its revenue 2.5 times after its first year and has grown at approximately a 44% CAGR over the last four years.
In 2015, we generated $7.8 million of revenue from the 2015 Cohort. Revenue from the 2015 Cohort grew to $20.1 million in 2016, representing a year-over-year growth rate of 157%. In 2016, we generated $6.6 million of revenue from the 2016 Cohort. Revenue from the 2016 Cohort grew to $22.0 million in 2017, representing 233% year-over-year growth. In 2017, we generated $5.6 million of revenue from the 2017 Cohort. Revenue from the 2017 Cohort grew to $16.8 million in 2018, representing 200% year-over-year growth. In 2018, we generated $11.2 million of revenue from the 2018 Cohort. Revenue from the 2018 Cohort grew to $34.4 million in 2019, representing 207% year-over-year growth.
59
Summary of Revenue Generated by Customer Cohorts Over Time (in millions):
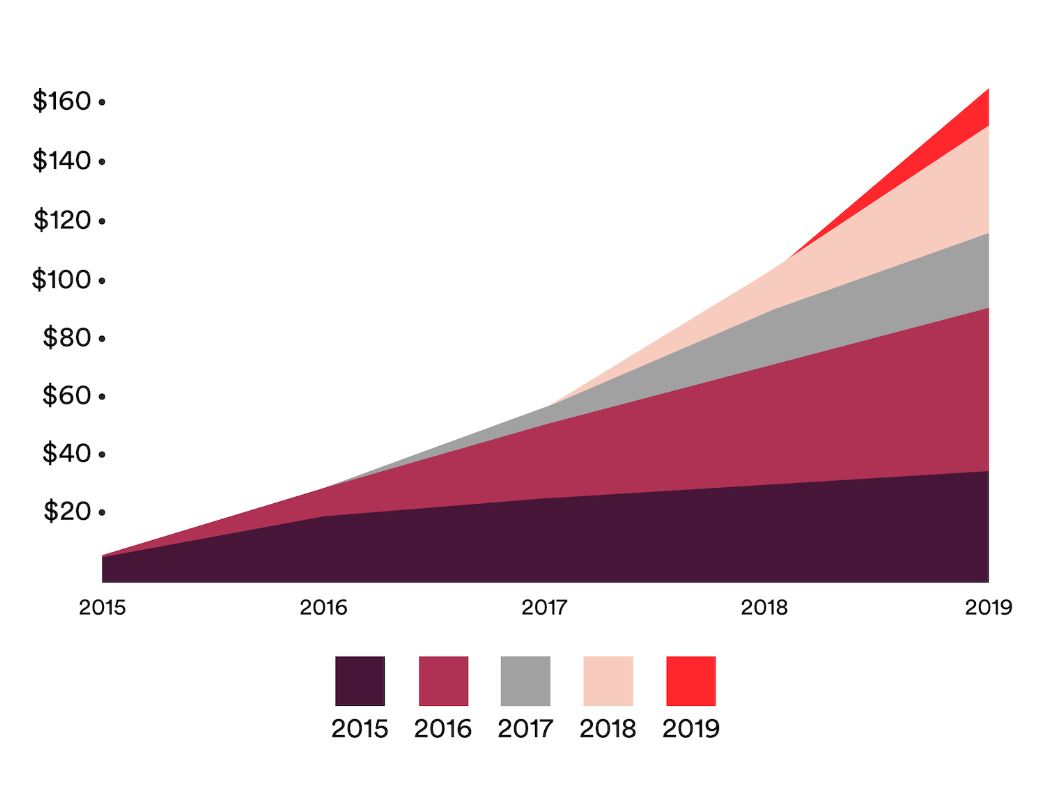
Customers that have negotiated contracts with us generate a substantial majority of our revenue. These customers typically purchase one or more products, for which we charge a monthly recurring or one-time fee depending on the products selected. Some of these customers also choose to purchase various levels of account management and enhanced customer support for a monthly fee. Typically, the term of these contracts is 12 months and includes a minimum monthly billing commitment in exchange for more favorable pricing terms. Many of these customers generate billings in excess of their minimum commitment. In addition, customers can sign up online by providing their credit card information and agreeing to a minimum monthly fee.
The timing of our sales is difficult to predict. The length of our sales cycle, from initial evaluation to payment, can range from several months to well over a year and can vary substantially from customer to customer. Similarly, the onboarding and ramping process with new enterprise customers can take several months.
We have achieved significant growth in recent periods. For the years ended December 31, 2019 and 2018, our revenue was $200.5 million and $144.6 million, respectively. Our 10 largest customers generated an aggregate of 29% and 32% of our revenue in the trailing 12 months ended December 31, 2019 and 2018, respectively. We incurred a net loss of $51.6 million and $30.9 million in the years ended December 31, 2019 and 2018, respectively.
Factors Affecting Our Performance
Winning New Customers
We are focused on continuing to attract new customers. Our customer base includes both large, established enterprises that are undergoing digital transformation and emerging companies spanning a wide array of industries and verticals. In both instances, developers within these companies often use and advocate the adoption of our platform by their companies. We also benefit from word-of-mouth promotion across the broader developer community. We will continue to invest in our developer outreach, leveraging it as a cost-efficient approach to attracting new customers. We also plan to dedicate significant resources to sales and marketing programs, including various online marketing activities as well as targeted account-based advertising.
60
This will require us to dedicate significant resources to further develop the market for our platform and differentiate our platform from competitive products and services. We will also need to expand, retain, and motivate our sales and marketing personnel in order to target our sales efforts at larger enterprises and senior management of these potential customers.
Expanding within our Existing Customer Base
We emphasize retaining our customers and expanding their usage of our platform and adoption of our other products. Customers often begin with smaller deployments of our programmable edge platform and then expand their usage over time. In addition, our programmable edge platform includes a variety of other offerings, such as load balancing, shielding, web security, and WAF. As our customers mature, we assist them in expanding their use of our platform, including the use of additional offerings beyond edge cloud delivery. As enterprises grow and experience increased traffic, their needs evolve, leading them to find additional use cases for our platform and expand their usage accordingly. In addition, given that customer acquisition costs are incurred largely for acquiring and initial onboarding, we gain operating leverage to the extent that existing customers expand their use of our platform and products.
Our ability to retain our customers and expand their usage could be impaired for a variety of reasons, including a customer moving to another provider or reducing usage within the term of their contract to their minimum usage commitment. Even if our customers expand their usage of our platform, we cannot guarantee that they will maintain those usage levels for any meaningful period of time or that they will renew their commitments.
International Customer Growth
We intend to continue expanding our efforts to attract customers outside of the United States by augmenting our sales teams and strategically increasing the number of POPs in select international markets. As of December 31, 2019 and 2018, 49% and 46% of our customers were headquartered outside of the United States, respectively.
Our international expansion, including our global sales efforts, will add increased complexity and cost to our business. This will require us to significantly expand our sales and marketing capabilities outside of the United States, as well as increase the number of POPs in select international markets to support our customers. We have limited experience managing the administrative aspects of a global organization, and we have only recently begun to establish and operate offices in foreign countries, which could place a strain on our business and culture.
Investing in Sales and Marketing
Our customers have been pivotal in driving brand awareness and broadening our reach. While we continue to leverage our self-service approach to drive adoption by developers, we intend to continue to expand our sales and marketing efforts, with an increased focus on sales to enterprises globally. Utilizing our direct sales force, we have multiple selling points within organizations to acquire new customers and increase usage from our existing customers. We intend to increase our discretionary marketing spend, including account based and brand spend, to drive the effectiveness of our sales teams. As a result, we expect our total operating expenses to increase as we continue to expand. Our investments in our sales and marketing teams are intended to help accelerate our sales, onboarding, and ramp cycles. As of December 31, 2019, we had 69 sales representatives and sales managers across our company.
These efforts will require us to invest significantly in financial and other resources. Furthermore, we believe that there is significant competition for sales personnel with the skills and technical knowledge that we require. Our ability to achieve significant revenue growth will depend, in large part, on our success in recruiting, training, and retaining sufficient numbers of sales personnel to support our growth.
Continued Investment in Our Platform and Network Infrastructure
We must continue to invest in our platform and network infrastructure to maintain our position in the market. We expect our revenue growth to be dependent on an expanding customer base and continued adoption of our edge cloud platform. In anticipation of winning new customers and staying ahead of our customers’ needs, we plan to continue to invest in order to expand the scale and capacity of our software-defined modern network, resulting in increased network service provider fees, which could adversely affect our gross margins if we are unable to offset these costs with revenue from new customers and increased revenue from existing customers. Our customers require constant innovation within their own organizations and
61
expect the same from us. Therefore, we will continue to invest in resources to enhance our development capabilities and introduce new products and features on our platform. We believe that investment in research and development will contribute to our long-term growth but may also negatively impact our short-term profitability. For the years ended December 31, 2019 and 2018, our research and development expenses as a percentage of revenue was 23% and 24%, respectively.
Developers use our platform to build custom applications and require a state-of-the-art infrastructure to test and run these applications. We will continue to invest in our network infrastructure by strategically increasing our POPs. We also anticipate making investments in upgrading our technology and hardware to continue providing our customers a fast and secure platform. Our total investment in property and equipment for the years ended December 31, 2019 and 2018 were $30.3 million and $18.7 million, respectively, representing 15% and 13% of our revenue in such periods. We expect our investment in property and equipment to increase on an absolute basis and may increase as a percentage of revenue in future periods. Our gross margins and operating results are impacted by these investments. As of December 31, 2019, we had 68 POPs in 53 markets across 26 countries.
In the event that there are errors in software, failures of hardware, damages to a facility or misconfigurations of any of our services—whether caused by our products, third-party error, our own error, natural disasters, or security breaches—we could experience lengthy interruptions in our platform as well as delays and additional expenses in arranging new facilities and services. In addition, there can be no assurance that we are adequately prepared for unexpected increases in bandwidth demands by our customers, particularly when customers experience cyber-attacks. The bandwidth we have contracted to purchase may become unavailable for a variety of reasons, including service outages, payment disputes, network providers going out of business, natural disasters, networks imposing traffic limits, or governments adopting regulations that impact network operations.
Uncertainty of the Coronavirus (COVID-19) Outbreak
The extent that the coronavirus (COVID-19) outbreak will spread widely and its impact on our results will depend on future developments, which are highly uncertain and unpredictable. Although uncertain at this time, the outbreak could impede our ability to sell, grow and attract new domestic and international customers. Our employees travel frequently to establish and maintain relationships with our customers. Although we continue to monitor the situation and may adjust our current policies as more information and guidance become available, suspending travel and doing business in-person could negatively impact our marketing efforts and also challenge our ability to enter into customer contracts in a timely manner, which in turn could harm our business performance.
Our business is dependent upon the timely supply of certain parts and components manufactured in China to construct our servers. To the extent that our suppliers are impacted by the coronavirus (COVID-19) outbreak, it likely will reduce the availability, or result in delays, of parts and components to us, which in turn could interrupt our ability to timely complete the construction of our servers to meet the intended usage and needs of our customers.
For additional details, refer to our risk factors included in Part I. Item 1A. of this Annual Report on Form 10-K.
Key Business Metrics
We regularly review a number of metrics, including the key metrics presented in the table below, to evaluate our business, measure our performance, identify trends affecting our business, prepare financial projections, and make strategic decisions. The calculation of the key metrics and other measures discussed below may differ from other similarly titled metrics used by other companies, securities analysts, or investors.
As of December 31, | ||||||
2019 | 2018 | |||||
Number of customers (as of end of period) | 1,743 | 1,582 | ||||
Number of enterprise customers (as of end of period) | 288 | 227 | ||||
Dollar-Based Net Expansion Rate ("DBNER") (trailing 12 months) | 135.5 | % | 132.0 | % | ||
62
Number of Customers
We believe that the number of customers is an important indicator of the adoption of our platform. Our definition of a customer consists of identifiable operating entities with which we have a billing relationship in good standing, from which we recognized revenue during the period, and are active as of the end of the period. In addition to our paying customers, we also have trial, developer, nonprofit and open source program, and other non-paying accounts that are excluded from our customer count metric. As of December 31, 2019 and 2018, we had 1,743 and 1,582 customers, respectively.
Number of Enterprise Customers
Historically our revenue has been driven primarily by a subset of customers who have leveraged our platform substantially from a usage standpoint. These enterprise customers are defined as customers with revenue in excess of $100,000 over the previous 12-month period. As of December 31, 2019, we had 288 enterprise customers which generated 87% of our revenue for the trailing 12 months ended December 31, 2019. As of December 31, 2018, we had 227 enterprise customers which generated 84% of our revenue for the trailing 12 months ended December 31, 2018. We believe the recruitment and cultivation of enterprise customers is critical to our long-term success.
Dollar-Based Net Expansion Rate ("DBNER")
Our ability to generate and increase our revenue is dependent upon our ability to increase the number of new customers and usage of our platform and increase the purchase of additional products by our existing customers. We track our performance in this area by measuring our DBNER. Our DBNER increases when customers increase their usage of our platform or purchase additional products, and declines when they reduce their usage, benefit from lower pricing on their existing usage, or curtail their purchases of additional products. We believe DBNER is a key metric in measuring the long-term value of our customer relationships and our ability to grow our revenue through increased usage of our platform and purchase of additional products by our existing customers. However, our calculation of DBNER indicates only expansion among continuing customers and does not indicate any decrease in revenue attributable to former customers, which may differ from similar metrics of other companies.
We calculate DBNER by dividing the revenue for a given period from customers who remained customers as of the last day of the given period ("current period") by the revenue from the same customers for the same period measured one year prior ("base period"). The revenue included in the current period excludes revenue from (i) customers that churned after the end of the base period and (ii) new customers that entered into a customer agreement after the end of the base period. For example, to calculate our DBNER for the trailing 12 months ended December 31, 2019, we divide (i) revenue for the trailing 12 months ended December 31, 2019, from customers that entered into a customer agreement prior to January 1, 2019, and that remained customers as of December 31, 2019, by (ii) revenue for the trailing 12 months ended December 31, 2018 from the same set of customers.
For the trailing 12 months ended December 31, 2019 and 2018 our DBNER was 135.5% and 132.0%, respectively. We believe that an annual cohort analysis of our customers demonstrates our success in customer expansion. Once a customer begins to generate revenue for us, they tend to increase their usage of our platform, in particular in their second year. Customer accounts acquired in 2017, 2018, and 2019 are referred to as the 2017 Cohort, 2018 Cohort, and 2019 Cohort, respectively. As described above, our customers tend to increase their usage of our platform in their second year, which is typically followed by more modest increases in usage, if any, in ensuing years. For example, the DBNER for the 2017 Cohort was 305.5% for the year ended December 31, 2018. However, the DBNER for the 2017 Cohort was 144.3% for the year ended December 31, 2019, which generally represents their third year as a customer, depending on when they entered into a customer agreement. While DBNER may fluctuate from quarter to quarter based on, among other things, the timing associated with new customer accounts, we expect our DBNER to decrease as customers that have used our platform for more than two years become a larger portion of both our overall customer base and the revenue that we use to calculate DBNER.
We separately monitor customer retention and churn on an annual basis by measuring our annual revenue retention rate, which we calculate by multiplying the final full month of revenue from a customer that terminated its contract with us (a "Churned Customer") by the number of months remaining in the same calendar year ("Annual Revenue Churn"). The quotient of the Annual Revenue Churn from all of our Churned Customers divided by our annual revenue of the same calendar year is then subtracted from 100% to determine our annual revenue retention rate. We believe this calculation is helpful in that it is based on the amount of revenue that we would expect to have received in the remaining portion of a particular period had a
63
customer not terminated its contract with us. It is not indicative of the actual revenue contribution from churned customers in past periods. By comparing this amount to actual revenue for the period, we are able to assess our ability to replace terminated revenue by generating revenue from new and continuing customers. Our annual revenue retention rate for the years ended December 31, 2019 and 2018 was 99.3% and 98.9%, respectively.
Key Components of Statement of Operations
Revenue
We derive our revenue primarily from usage-based fees earned from customers using our platform. We also earn flat fees from certain products and services.
Customers are generally invoiced in arrears on a monthly basis. Many customers have tiered usage pricing which reflects discounted rates as usage increases. For most contracts, usage charges are determined on a monthly basis based on actual usage within the month and do not impact usage charges within any other month. Our larger customers often enter into contracts that contain minimum billing commitments and reflect discounted pricing associated with such usage levels.
We define U.S. revenue as revenue from customers that have a billing address in the United States, and we define international revenue as revenue from customers that have a billing address outside of the United States. Our revenue has been and will continue to be impacted by new and existing customers’ usage of our products, international expansion, and the success of our sales efforts.
Cost of Revenue and Gross Margin
Cost of revenue consists primarily of fees paid for bandwidth, peering, and colocation. Cost of revenue also includes personnel costs, such as salaries, benefits, bonuses, and stock-based compensation for our customer support and infrastructure employees, and non-personnel costs, such as amortization of capitalized internal-use software development costs and depreciation of our network equipment. Our arrangements with network service providers require us to pay fees based on bandwidth use, in some cases subject to minimum commitments, which may be underutilized. We expect our cost of revenue to continue to increase on an absolute basis and may increase as a percentage of revenue, including as a result of depreciation and amortization associated with capital expenditures in future periods.
Our gross margin has been and will continue to be affected by a number of factors, including the timing and extent of our investments in our operations, our ability to manage our network service providers and cloud infrastructure-related fees, the timing of amortization of capitalized software development costs, depreciation of our network equipment, and the extent to which we periodically choose to pass on our cost savings from network optimization efforts to our customers in the form of lower usage rates.
Research and Development
Research and development expenses consist primarily of personnel costs, including salaries, benefits, bonuses, and stock-based compensation. Research and development expenses also include cloud infrastructure fees for development and testing, amortization of capitalized internal-use software development costs, and an allocation of our general overhead expenses. We capitalize the portion of our software development costs that meet the criteria for capitalization.
We continue to focus our research and development efforts on adding new features and products including new use cases, improving the efficiency and performance of our network, and increasing the functionality of our existing products. We expect our research and development expenses to continue to increase on an absolute basis and may increase as a percentage of revenue in future periods.
Sales and Marketing
Sales and marketing expenses consist primarily of personnel costs, including commissions for our sales employees, salaries, benefits, bonuses, and stock-based compensation. Sales and marketing expenses also include expenditures related to
64
advertising, marketing, our brand awareness activities, costs related to our Altitude conferences, professional services fees, and an allocation of our general overhead expenses.
We focus our sales and marketing efforts on generating awareness of our company, platform and products, creating sales leads, and establishing and promoting our brand, both domestically and internationally. We plan to increase our investment in sales and marketing by hiring additional sales and marketing personnel, expanding our sales channels, driving our go-to-market strategies, building our brand awareness, and sponsoring additional marketing events. We expect our sales and marketing expenses to continue to increase on an absolute basis and may increase as a percentage of revenue in future periods.
General and Administrative
General and administrative expenses consist primarily of personnel costs, including salaries, benefits, bonuses, and stock-based compensation for our accounting, finance, legal, human resources and administrative support personnel, and executives. General and administrative expenses also include costs related to legal and other professional services fees, sales and other taxes, depreciation and amortization, an allocation of our general overhead expenses, and bad debt expense. We expect that we will incur costs associated with supporting the growth of our business, our operation as a public company, and to meet the increased compliance requirements associated with our international expansion.
Our general and administrative expenses include a significant amount of sales and other taxes to which we are subject based on the manner we sell and deliver our products. Historically, we have not collected such taxes from our customers and have therefore recorded such taxes as general and administrative expenses. We expect that these expenses will decline in future years as we continue to implement our sales tax collection mechanisms and start collecting these taxes from our customers. We expect our general and administrative expenses to continue to increase on an absolute basis and may increase as a percentage of revenue in future periods.
Income Taxes
Our income tax expense consists primarily of income taxes in certain foreign jurisdictions where we conduct business and state minimum income taxes in the United States. We have a valuation allowance for deferred tax assets, including net operating loss carryforwards. We expect to maintain this valuation allowance for the foreseeable future.
65
Results of Operations
The following tables set forth our results of operations for the period presented and as a percentage of our revenue for that period.
Year ended December 31, | ||||||||||||
2019 | 2018 | 2017 | ||||||||||
(in thousands) | ||||||||||||
Consolidated Statement of Operations: | ||||||||||||
Revenue | $ | 200,462 | $ | 144,563 | $ | 104,900 | ||||||
Cost of revenue(1) | 88,322 | 65,499 | 48,672 | |||||||||
Gross profit | 112,140 | 79,064 | 56,228 | |||||||||
Operating expenses: | ||||||||||||
Research and development(1) | 46,492 | 34,618 | 28,989 | |||||||||
Sales and marketing(1) | 71,097 | 50,134 | 40,818 | |||||||||
General and administrative(1) | 41,099 | 23,450 | 17,451 | |||||||||
Total operating expenses | 158,688 | 108,202 | 87,258 | |||||||||
Loss from operations | (46,548 | ) | (29,138 | ) | (31,030 | ) | ||||||
Interest income | 3,287 | 939 | 443 | |||||||||
Interest expense | (5,236 | ) | (1,810 | ) | (1,116 | ) | ||||||
Other expenses, net | (2,561 | ) | (741 | ) | (539 | ) | ||||||
Loss before income taxes | (51,058 | ) | (30,750 | ) | (32,242 | ) | ||||||
Income taxes | 492 | 185 | 208 | |||||||||
Net loss attributable to common stockholders | $ | (51,550 | ) | $ | (30,935 | ) | $ | (32,450 | ) | |||
__________
(1) | Includes stock-based compensation expense as follows: |
Year ended December 31, | ||||||||||||
2019 | 2018 | 2017 | ||||||||||
(in thousands) | ||||||||||||
Cost of revenue | $ | 1,410 | $ | 265 | $ | 190 | ||||||
Research and development | 2,920 | 1,332 | 1,040 | |||||||||
Sales and marketing | 3,497 | 1,023 | 493 | |||||||||
General and administrative | 4,318 | 1,459 | 1,086 | |||||||||
Total | $ | 12,145 | $ | 4,079 | $ | 2,809 | ||||||
66
Year ended December 31, | |||||||||
2019 | 2018 | 2017 | |||||||
Consolidated Statements of Operations, as a percentage of revenue:* | |||||||||
Revenue | 100 | % | 100 | % | 100 | % | |||
Cost of revenue | 44 | 45 | 46 | ||||||
Gross profit | 56 | 55 | 54 | ||||||
Operating expenses: | |||||||||
Research and development | 23 | 24 | 28 | ||||||
Sales and marketing | 35 | 35 | 39 | ||||||
General and administrative | 21 | 16 | 17 | ||||||
Total operating expenses | 79 | 75 | 83 | ||||||
Loss from operations | (23 | ) | (20 | ) | (30 | ) | |||
Interest income | 2 | 1 | — | ||||||
Interest expense | (3 | ) | (1 | ) | (1 | ) | |||
Other expenses, net | (1 | ) | (1 | ) | (1 | ) | |||
Loss before income taxes | (25 | ) | (21 | ) | (31 | ) | |||
Income taxes | — | — | — | ||||||
Net loss attributable to common stockholders | (25 | )% | (21 | )% | (31 | )% | |||
__________
* Columns may not add up to 100% due to rounding.
Revenue
Year ended December 31, | ||||||||||||||||||
2019 | 2018 | 2017 | 2018 to 2019 Change | 2017 to 2018 Change | ||||||||||||||
(in thousands) | ||||||||||||||||||
Revenue | $ | 200,462 | $ | 144,563 | $ | 104,900 | 39 | % | 38 | % | ||||||||
2019 compared to 2018
Revenue was $200.5 million for the year ended December 31, 2019 compared to $144.6 million for the year ended December 31, 2018, an increase of $55.9 million, or 39%. We had 1,743 customers and 288 enterprise customers as of December 31, 2019. We had 1,582 customers and 227 enterprise customers as of December 31, 2018. This represents an increase of 161, or 10%, in customers and 61, or 27%, in enterprise customers from December 31, 2018. Approximately 93% of our revenue in the year ended December 31, 2019 was driven by usage on our platform. The remainder of our revenue was generated by our other products and services, including support and professional services.
U.S. revenue was $142.8 million and 71% of revenue for the year ended December 31, 2019, and $110.8 million and 77% of revenue for the year ended December 31, 2018. This represents an increase of $32.0 million, or 29%. International revenue was $57.6 million and 29% of revenue for the year ended December 31, 2019, and $33.7 million and 23% of revenue for the year ended December 31, 2018. This represents an increase of $23.9 million, or 71%. We had 891 domestic customers and 852 international customers as of December 31, 2019. We had 861 domestic customers and 721 international customers as of December 31, 2018. This is an increase in domestic customers of 30, or 3%, and an increase in international customers of 131, or 18%, compared to December 31, 2018.
2018 compared to 2017
Revenue was $144.6 million for the year ended December 31, 2018 compared to $104.9 million for the year ended December 31, 2017, an increase of $39.7 million, or 38%. We had 1,582 customers and 227 enterprise customers as of
67
December 31, 2018. We had 1,439 customers and 170 enterprise customers as of December 31, 2017. This was an increase of 143, or 10%, in customers and 57, or 34%, in enterprise customers from December 31, 2017. Approximately 95% of our revenue in 2018 was driven by usage on our platform. The remainder of our revenue was generated by our other products and services, including support and professional services.
U.S. revenue was $110.9 million and 77% of revenue for the year ended December 31, 2018. U.S. revenue was $82.7 million and 79% of revenue for the year ended December 31, 2017. This was an increase of $28.2 million, or 34%, from U.S. revenue for the year ended December 31, 2017. International revenue was $33.7 million and 23% of revenue for the year ended December 31, 2018. International revenue was $22.2 million and 21% of revenue for the year ended December 31, 2017. This was an increase of $11.5 million, or 52%, from international revenue for the year ended December 31, 2017. We had 830 domestic customers and 609 international customers in 2017. We had 861 domestic customers and 721 international customers in 2018. This was an increase in domestic customers of 31, or 4%, from 2017 and an increase in international customers of 112, or 18%, from 2017.
Cost of Revenue
Year ended December 31, | |||||||||||||||||
2019 | 2018 | 2017 | 2018 to 2019 Change | 2017 to 2018 Change | |||||||||||||
(in thousands) | |||||||||||||||||
Cost of revenue | $ | 88,322 | $ | 65,499 | 48,672 | 35 | % | 35 | % | ||||||||
For the years ended December 31, 2019, 2018, and 2017, our cost of revenue consisted of bandwidth, peering, and colocation fees, as well as personnel costs including salaries, benefits, bonuses, and stock-based compensation for employees who support the build out and operation of the network. Our cost of revenue also includes depreciation expense for network equipment, amortization of capitalized internal-use software, and other network costs.
2019 compared to 2018
Cost of revenue was $88.3 million for the year ended December 31, 2019 compared to $65.5 million for the year ended December 31, 2018, an increase of $22.8 million, or 35%. The increase in cost of revenue was primarily due to an increase in bandwidth costs of $6.2 million, an increase in colocation costs of $3.9 million, and an increase in other network costs of $2.5 million due to increased traffic on our platform. Personnel costs increased by $5.5 million due to an increase in headcount. Depreciation and amortization expense increased by $2.9 million due to increased investments in our platform. Travel costs increased by $0.7 million due to travel associated with the deployment of new POPs. Software licenses increased by $0.5 million.
2018 compared to 2017
Cost of revenue was $65.5 million for the year ended December 31, 2018 compared to $48.7 million for the year ended December 31, 2017, an increase of $16.8 million, or 35%. The increase in cost of revenue was due to an increase in bandwidth costs of $3.5 million, an increase of colocation costs of $2.3 million, and an increase in other network costs of $2.3 million due to increased traffic on our platform. Depreciation and amortization expense increased by $3.2 million due to increased investments in our platform. Personnel costs increased by $2.7 million due to an increase in headcount.
Gross Profit and Gross Margin
Year ended December 31, | ||||||||||||||||||
2019 | 2018 | 2017 | 2018 to 2019 Change | 2017 to 2018 Change | ||||||||||||||
(in thousands) | ||||||||||||||||||
Gross profit | $ | 112,140 | $ | 79,064 | $ | 56,228 | 42 | % | 41 | % | ||||||||
Gross margin | 56 | % | 55 | % | 54 | % | 1 | % | 1 | % | ||||||||
68
2019 compared to 2018
Gross profit was $112.1 million for the year ended December 31, 2019 compared to $79.1 million for the year ended December 31, 2018, an increase of $33.1 million, or 42%. The increase in gross profit in the year ended December 31, 2019 compared to 2018 is due to the increase in revenue from usage of our platform.
Gross margin was 56% for the year ended December 31, 2019 compared to 55% for the year ended December 31, 2018, an increase of 1%. The increase is due to better utilization of our platform.
2018 compared to 2017
Gross profit was $79.1 million for the year ended December 31, 2018 compared to $56.2 million for the year ended December 31, 2017, an increase of $22.8 million, or 41%. The increase in gross profit is due to an increase in revenue from usage of our platform.
Gross margin was 55% for the year ended December 31, 2018 compared to 54% for the year ended December 31, 2017, an increase of 1%. The increase is due to better utilization of our platform.
Operating Expenses
Year ended December 31, | ||||||||||||||||||
2019 | 2018 | 2017 | 2018 to 2019 Change | 2017 to 2018 Change | ||||||||||||||
(in thousands) | ||||||||||||||||||
Research and development | $ | 46,492 | $ | 34,618 | $ | 28,989 | 34 | % | 19 | % | ||||||||
Sales and marketing | 71,097 | 50,134 | 40,818 | 42 | % | 23 | % | |||||||||||
General and administrative | 41,099 | 23,450 | 17,451 | 75 | % | 34 | % | |||||||||||
Total operating expenses | $ | 158,688 | $ | 108,202 | $ | 87,258 | 47 | % | 24 | % | ||||||||
Percentage of revenue: | ||||||||||||||||||
Research and development | 23 | % | 24 | % | 28 | % | 1 | % | 4 | % | ||||||||
Sales and marketing | 35 | % | 35 | % | 39 | % | — | % | 4 | % | ||||||||
General and administrative | 21 | % | 16 | % | 17 | % | (5 | )% | 1 | % | ||||||||
Research and development—2019 compared to 2018
Research and development expenses were $46.5 million for the year ended December 31, 2019 compared to $34.6 million for the year ended December 31, 2018, an increase of $11.9 million, or 34%. This is primarily due to an increase of $8.1 million of personnel related costs, such as salaries, benefits, bonuses, and stock-based compensation due to an increase in headcount and an increase in stock-based compensation expense related to the increase in the fair value of our stock options, the issuance of restricted stock units ("RSUs"), and expense associated with the Employee Stock Purchase Plan ("ESPP"). Software licenses increased by $1.6 million. Travel costs increased by $1.2 million. Facilities and information system costs increased by $0.9 million. These increases were offset by an increase in the capitalization for internal-use software of $1.2 million.
Research and development—2018 compared to 2017
Research and development expenses were $34.6 million for the year ended December 31, 2018 compared to $29.0 million for the year ended December 31, 2017, an increase of $5.6 million, or 19%. This growth in expenses is due to an increase of $6.2 million of personnel related costs, such as salaries, benefits, bonuses, and stock-based compensation. This was offset by an increase in capitalized internal-use software of $1.9 million.
69
Sales and marketing—2019 compared to 2018
Sales and marketing expenses were $71.1 million for the year ended December 31, 2019 compared to $50.1 million for the year ended December 31, 2018, an increase of $21.0 million, or 42%. This is primarily due to a $13.2 million increase in personnel related costs, such as salaries, sales commissions, benefits, and stock-based compensation, due to an increase in headcount, and an increase in stock-based compensation expense related to the increase in the fair value of our stock options, the issuance of RSUs, and expense associated with the ESPP. Facilities and information costs increased by $2.4 million. Marketing costs increased by $1.6 million. Professional services increased by $1.5 million. Travel costs increased by $1.3 million. Software licenses increased by $0.8 million.
Sales and marketing—2018 compared to 2017
Sales and marketing expenses were $50.1 million for the year ended December 31, 2018 compared to $40.8 million for the year ended December 31, 2017, an increase of $9.3 million, or 23%. This is primarily due to an increase of $5.1 million in personnel related costs, such as salaries, sales commissions, benefits and stock-based compensation, due to an increase in headcount. Facilities and information system costs increased by $1.5 million. Travel costs increased by $1.1 million. External marketing costs for marketing events, including our Altitude conferences, sponsorships, and advertising increased by $0.8 million.
General and administrative—2019 compared to 2018
General and administrative costs were $41.1 million for the year ended December 31, 2019 compared to $23.5 million for the year ended December 31, 2018, an increase of $17.6 million, or 75%. This is primarily due to an increase of $8.5 million of personnel related costs, such as salaries, benefits, and stock-based compensation, due to an increase in headcount, and an increase in stock-based compensation expense related to the increase in the fair value of our stock options, the issuance of RSUs, and expense associated with the ESPP. The increase is also due to an increase of $2.6 million in external professional services such as legal, accounting, and enterprise systems, an increase of $2.1 million business insurance costs associated with becoming a public company, an increase of $1.9 million in transaction taxes primarily due to the release of a reserve in the prior period, and an increase of $1.2 million costs for software licenses, and an increase of $1.1 million in travel costs.
General and administrative—2018 compared to 2017
General and administrative costs were $23.5 million for the year ended December 31, 2018 compared to $17.5 million for the year ended December 31, 2017, an increase of $6.0 million, or 34%. This increase is due to an increase of $6.2 million of personnel related costs, such as salaries, benefits, and stock-based compensation due to an increase in headcount, and an increase of $1.0 million in external professional services such as legal, accounting, and enterprise systems. Transaction taxes decreased by $1.3 million primarily due to the release of a reserve of $1.9 million that was no longer required.
Other Income and Expense
Interest Income
Year ended December 31, | ||||||||||||||||||
2019 | 2018 | 2017 | 2018 to 2019 Change | 2017 to 2018 Change | ||||||||||||||
(in thousands) | ||||||||||||||||||
Interest income | $ | 3,287 | $ | 939 | $ | 443 | 250 | % | 112 | % | ||||||||
2019 compared to 2018
Interest income was $3.3 million for the year ended December 31, 2019 compared to $0.9 million for the year ended December 31, 2018, an increase of $2.3 million, or 250%. This increase is due to interest on proceeds raised from our IPO.
70
2018 compared to 2017
Interest income was $0.9 million for the year ended December 31, 2018 compared to $0.4 million for the year ended December 31, 2017, an increase of $0.5 million, or 112%. This increase is due to interest on cash raised from our Series F convertible Preferred Stock financing in 2018.
Interest Expense
Year ended December 31, | ||||||||||||||||||
2019 | 2018 | 2017 | 2018 to 2019 Change | 2017 to 2018 Change | ||||||||||||||
(in thousands) | ||||||||||||||||||
Interest expense | $ | 5,236 | $ | 1,810 | $ | 1,116 | 189 | % | 62 | % | ||||||||
2019 compared to 2018
Interest expense was $5.2 million for the year ended December 31, 2019 compared to $1.8 million for the year ended December 31, 2018, an increase of $3.4 million, or 189%. This increase is primarily due to the acceleration of the amortization of debt issuance costs due to the early payment of the $20.0 million outstanding loan on our Credit Facility as well as an increase in average outstanding debt.
2018 compared to 2017
Interest expense was $1.8 million for the year ended December 31, 2018 compared to $1.1 million for the year ended December 31, 2017, an increase of $0.7 million, or 62%. This increase is due to additional borrowings during 2018.
Other income (expense), net
Year ended December 31, | ||||||||||||||||||
2019 | 2018 | 2017 | 2018 to 2019 Change | 2017 to 2018 Change | ||||||||||||||
(in thousands) | ||||||||||||||||||
Other expense, net | $ | 2,561 | $ | 741 | $ | 539 | 246 | % | 37 | % | ||||||||
2019 compared to 2018
Other expense, net was $2.6 million for the year ended December 31, 2019 compared to $0.7 million for the year ended December 31, 2018, an increase in other expense, net of $1.8 million, or 246%. This increase is primarily due to mark-to-market adjustments for warrant liabilities prior to the conversion to additional paid in capital upon the IPO.
2018 compared to 2017
Other expense, net was $0.7 million for the year ended December 31, 2018 compared to $0.5 million for the year ended December 31, 2017, an increase of $0.2 million, or 37%. This increase is primarily due to mark-to-market adjustments for warrant liabilities.
Quarterly Results of Operations
The following table sets forth our unaudited quarterly statements of operations data for each of the quarters indicated. The unaudited quarterly statements of operations data set forth below have been prepared on the same basis as our audited consolidated financial statements and, in the opinion of management, reflect all adjustments, consisting only of normal recurring adjustments, that are necessary for the fair statement of such data. Our historical results are not necessarily indicative of the results that may be expected in the future, and the results for any quarter are not necessarily indicative of results to be
71
expected for a full year or any other period. The following quarterly financial data should be read in conjunction with our consolidated financial statements and the related notes included elsewhere in this Annual Report on Form 10-K.
Three months ended | ||||||||||||||||||||||||||||||||
March 31, 2018 | June 30, 2018 | September 30, 2018 | December 31, 2018 | March 31, 2019 | June 30, 2019 | September 30, 2019 | December 31, 2019 | |||||||||||||||||||||||||
(unaudited) (in thousands) | ||||||||||||||||||||||||||||||||
Consolidated Statement of Operations: | ||||||||||||||||||||||||||||||||
Revenue | $ | 32,498 | $ | 34,448 | $ | 36,820 | $ | 40,797 | $ | 45,556 | $ | 46,173 | $ | 49,797 | $ | 58,936 | ||||||||||||||||
Cost of revenue(1) | 15,384 | 15,695 | 16,711 | 17,709 | 19,718 | 20,784 | 22,292 | 25,528 | ||||||||||||||||||||||||
Gross profit | 17,114 | 18,753 | 20,109 | 23,088 | 25,838 | 25,389 | 27,505 | 33,408 | ||||||||||||||||||||||||
Operating expenses: | ||||||||||||||||||||||||||||||||
Research and development(1) | 7,979 | 8,099 | 9,233 | 9,307 | 10,176 | 11,244 | 12,121 | 12,951 | ||||||||||||||||||||||||
Sales and marketing(1) | 12,343 | 11,973 | 12,331 | 13,487 | 15,039 | 16,906 | 17,560 | 21,592 | ||||||||||||||||||||||||
General and administrative(1) | 5,702 | 4,130 | 6,265 | 7,353 | 8,700 | 8,920 | 10,583 | 12,896 | ||||||||||||||||||||||||
Total operating expenses | 26,024 | 24,202 | 27,829 | 30,147 | 33,915 | 37,070 | 40,264 | 47,439 | ||||||||||||||||||||||||
Loss from operations | (8,910 | ) | (5,449 | ) | (7,720 | ) | (7,059 | ) | (8,077 | ) | (11,681 | ) | (12,759 | ) | (14,031 | ) | ||||||||||||||||
Interest income | 137 | 147 | 293 | 362 | 416 | 861 | 1,154 | 856 | ||||||||||||||||||||||||
Interest expense | (381 | ) | (359 | ) | (479 | ) | (591 | ) | (1,235 | ) | (2,989 | ) | (621 | ) | (391 | ) | ||||||||||||||||
Other income (expense), net | (94 | ) | (140 | ) | (530 | ) | 23 | (776 | ) | (1,696 | ) | 109 | (198 | ) | ||||||||||||||||||
Loss before income taxes | (9,248 | ) | (5,801 | ) | (8,436 | ) | (7,265 | ) | (9,672 | ) | (15,505 | ) | (12,117 | ) | (13,764 | ) | ||||||||||||||||
Income taxes | 58 | 35 | 51 | 41 | 55 | 82 | 46 | 309 | ||||||||||||||||||||||||
Net loss attributable to common stockholders | $ | (9,306 | ) | $ | (5,836 | ) | $ | (8,487 | ) | $ | (7,306 | ) | $ | (9,727 | ) | $ | (15,587 | ) | $ | (12,163 | ) | $ | (14,073 | ) | ||||||||
Weighted-average shares | 23,936 | 24,127 | 24,529 | 24,784 | 25,290 | 59,781 | 93,240 | 94,045 | ||||||||||||||||||||||||
Per share data based upon income (loss) from continuing operations, basic and diluted | $ | (0.37 | ) | $ | (0.23 | ) | $ | (0.31 | ) | $ | (0.28 | ) | $ | (0.32 | ) | $ | (0.20 | ) | $ | (0.14 | ) | $ | (0.15 | ) | ||||||||
Net loss per share attributable to common stockholders, basic and diluted | $ | (0.39 | ) | $ | (0.24 | ) | $ | (0.35 | ) | $ | (0.29 | ) | $ | (0.38 | ) | $ | (0.26 | ) | $ | (0.13 | ) | $ | (0.15 | ) | ||||||||
__________
(1) | Includes stock-based compensation expense as follows: |
Three months ended | ||||||||||||||||||||||||||||||||
March 31, 2018 | June 30, 2018 | September 30, 2018 | December 31, 2018 | March 31, 2019 | June 30, 2019 | September 30, 2019 | December 31, 2019 | |||||||||||||||||||||||||
(unaudited) (in thousands) | ||||||||||||||||||||||||||||||||
Cost of revenue | $ | 52 | $ | 71 | $ | 55 | $ | 87 | $ | 144 | $ | 293 | $ | 438 | $ | 535 | ||||||||||||||||
Research and development | 276 | 324 | 307 | 425 | 432 | 714 | 968 | 806 | ||||||||||||||||||||||||
Sales and marketing | 225 | 226 | 242 | 330 | 369 | 596 | 929 | 1,603 | ||||||||||||||||||||||||
General and administrative | 295 | 369 | 357 | 438 | 522 | 640 | 1,505 | 1,651 | ||||||||||||||||||||||||
Total stock-based compensation | $ | 848 | $ | 990 | $ | 961 | $ | 1,280 | $ | 1,467 | $ | 2,243 | $ | 3,840 | $ | 4,595 | ||||||||||||||||
72
Three months ended | ||||||||||||||||||||||||
March 31, 2018 | June 30, 2018 | September 30, 2018 | December 31, 2018 | March 31, 2019 | June 30, 2019 | September 30, 2019 | December 31, 2019 | |||||||||||||||||
(unaudited) (percentage values) | ||||||||||||||||||||||||
Consolidated Statement of Operations: | ||||||||||||||||||||||||
Revenue | 100 | % | 100 | % | 100 | % | 100 | % | 100 | % | 100 | % | 100 | % | 100 | % | ||||||||
Cost of revenue(1) | 47 | % | 46 | % | 45 | % | 43 | % | 43 | % | 45 | % | 45 | % | 43 | % | ||||||||
Gross profit | 53 | % | 54 | % | 55 | % | 57 | % | 57 | % | 55 | % | 55 | % | 57 | % | ||||||||
Operating expenses: | ||||||||||||||||||||||||
Research and development(1) | 25 | % | 24 | % | 25 | % | 23 | % | 22 | % | 24 | % | 24 | % | 22 | % | ||||||||
Sales and marketing(1) | 38 | % | 35 | % | 33 | % | 33 | % | 33 | % | 37 | % | 35 | % | 37 | % | ||||||||
General and administrative(1) | 18 | % | 12 | % | 17 | % | 18 | % | 19 | % | 19 | % | 21 | % | 22 | % | ||||||||
Total operating expenses | 80 | % | 70 | % | 76 | % | 74 | % | 74 | % | 80 | % | 81 | % | 80 | % | ||||||||
Loss from operations | (27 | )% | (16 | )% | (21 | )% | (17 | )% | (18 | )% | (25 | )% | (26 | )% | (24 | )% | ||||||||
Interest income | — | % | — | % | 1 | % | 1 | % | 1 | % | 2 | % | 2 | % | 1 | % | ||||||||
Interest expense | (1 | )% | (1 | )% | (1 | )% | (1 | )% | (3 | )% | (6 | )% | (1 | )% | (1 | )% | ||||||||
Other income (expense), net | — | % | — | % | (1 | )% | — | % | (2 | )% | (4 | )% | — | % | — | % | ||||||||
Loss before income taxes | (28 | )% | (17 | )% | (23 | )% | (18 | )% | (21 | )% | (34 | )% | (24 | )% | (23 | )% | ||||||||
Income taxes | — | % | — | % | — | % | — | % | — | % | — | % | — | % | 1 | % | ||||||||
Net loss attributable to common stockholders | (28 | )% | (17 | )% | (23 | )% | (18 | )% | (21 | )% | (34 | )% | (24 | )% | (24 | )% | ||||||||
Three months ended | ||||||||||||||||||||||||
March 31, 2018 | June 30, 2018 | September 30, 2018 | December 31, 2018 | March 31, 2019 | June 30, 2019 | September 30, 2019 | December 31, 2019 | |||||||||||||||||
Key Business Metrics(1) | ||||||||||||||||||||||||
Number of customers (as of end of period) | 1,444 | 1,529 | 1,516 | 1,582 | 1,621 | 1,627 | 1,684 | 1,743 | ||||||||||||||||
Number of enterprise customers (as of end of period) | 183 | 190 | 213 | 227 | 243 | 262 | 274 | 288 | ||||||||||||||||
DBNER (trailing 12 months) | 140.3 | % | 139.1 | % | 136.1 | % | 132.0 | % | 130.4 | % | 132.3 | % | 134.8 | % | 135.5 | % | ||||||||
__________
(1) | See “Management’s Discussion and Analysis of Financial Condition and Results of Operations—Key Business Metrics” for our definitions of these metrics. |
Quarterly Revenue Trends
Our quarterly revenue increased in each period presented, primarily due to an increase in the usage of our platform by our existing customers and the addition of new customers.
Quarterly Cost of Revenue Trends
Our cost of revenue increased sequentially in each of the quarters presented, primarily driven by expanded use of our platform by existing and new customers, which resulted in increased network costs. We expect our cost of revenue to continue to increase on an absolute basis in future quarters and may periodically increase as a percentage of revenue based on the timing of investments made in our network.
73
Quarterly Gross Margin Trends
Our gross margin can fluctuate quarter to quarter due to the timing of investments made in our network.
Quarterly Operating Expense Trends
Our operating expenses generally have increased in almost every fiscal quarter primarily due to increases in headcount and other related expenses to support our growth. Our research and development costs increased sequentially in each of the quarters presented, primarily driven by increased hiring and investment in our growth as a company. Our sales and marketing costs can fluctuate based on the timing of our external conferences, such as Altitude. Our general and administrative expenses for the quarter ended June 30, 2018 reflect the release of $1.9 million of reserves related to a transaction tax matter that was favorably resolved. We expect our operating expenses to continue to increase on an absolute basis in future quarters.
Liquidity and Capital Resources
As of December 31, 2019, we had cash, cash equivalents, and marketable securities totaling $131.1 million, and restricted cash totaling $70.1 million. Our cash, cash equivalents, and marketable securities primarily consisted of bank deposits and money market funds held at major financial institutions and investment-grade commercial paper and corporate debt securities.
On May 21, 2019, upon the completion of our IPO, we received net proceeds of $192.5 million, after deducting underwriting discounts and commissions, from sales of 12,937,500 shares of our Class A common stock in the IPO. The net proceeds include additional proceeds of $25.1 million, net of underwriters' discounts and commissions, from the exercise of the underwriters' option to purchase an additional 1,687,500 shares of our Class A common stock.
To date, we have financed our operations primarily through equity issuances, payments received from customers, the net proceeds we received through sales of equity securities, and borrowings under our credit facilities.
Our principal uses of cash in recent periods have been funding our operations and capital expenditures.
We believe that our cash and cash equivalents balances, our credit facilities, and the cash flows generated by our operations will be sufficient to satisfy our anticipated cash needs for working capital and capital expenditures for at least the next 12 months.
Credit Facility
On November 4, 2019, we entered into a Revolving Credit Agreement for an aggregate commitment amount of $70.0 million with a maturity date of November 3, 2022. The amount of borrowings available under the Revolving Credit Agreement at any time are collateralized by our cash. As of December 31, 2019, $20.3 million had been drawn on the Revolving Credit Agreement.
The interest rate associated with each advance under the Revolving Credit Agreement is equal to the sum of LIBOR for the applicable interest period plus 1.50%, which is a per annum rate based on outstanding borrowings. The commitment fee is 0.20% per annum based on the average daily unused amount of the commitment amount. Interest payments on outstanding borrowings are due on the last day of each interest period and payments for the commitment fee are due at the end of each calendar quarter.
74
Cash Flows
The following table summarizes our cash flows for the period indicated:
Year ended December 31, | ||||||||||||
2019 | 2018 | 2017 | ||||||||||
(in thousands) | ||||||||||||
Cash used in operating activities | $ | (31,303 | ) | $ | (16,985 | ) | $ | (25,861 | ) | |||
Cash used in investing activities | (87,678 | ) | (47,107 | ) | (15,780 | ) | ||||||
Cash provided by financing activities | 168,148 | 69,637 | 55,406 | |||||||||
Cash Flows from Operating Activities
For the year ended December 31, 2019, cash used in operating activities consisted primarily of our net loss of $51.6 million adjusted for non-cash items, including $16.6 million of depreciation and amortization, $12.1 million of stock-based compensation expense, $0.7 million of amortization of deferred rent, an increase in the fair value of our common stock warrants of $2.4 million, and amortization of debt issuance costs of $1.9 million. With respect to changes in operating assets and liabilities, there was an increase in accounts receivable of $12.8 million, primarily due to the growth of our business and the timing of cash receipts from certain of our larger customers, an increase in other long-term assets of $2.2 million due to the adoption of Accounting Standards Update No. 2014-09, Revenue from Contracts with Customers, and an increase of $2.1 million in prepaid expenses and other assets due to pre-payments for SaaS licenses. This was partially offset by an increase of $5.5 million in accounts payable, accrued expenses, and other liabilities due to timing of payments.
For the year ended December 31, 2018, cash used in operating activities consisted primarily of our net loss of $30.9 million adjusted for non-cash items, including $13.4 million of depreciation and amortization, $4.1 million of stock-based compensation expense, and an increase in our bad debt expense of $0.6 million. With respect to changes in operating assets and liabilities, accounts payable, accrued expenses, and other liabilities increased by $4.7 million. This was partially offset by an increase in accounts receivable of $6.2 million and prepaid expenses and other assets of $2.3 million, primarily due to the growth of our business and the timing of cash receipts from certain of our larger customers, pre-payments for insurance, rent, and software licenses, as well as an increase in VAT receivable.
For the year ended December 31, 2017, cash used in operating activities consisted primarily of our net loss of $32.5 million adjusted for non-cash items, including $2.8 million of stock-based compensation expense, $9.6 million of depreciation and amortization, and an increase in our bad debt expense of $1.0 million. With respect to changes in operating assets and liabilities, accounts payable, accrued expenses, and other liabilities increased $2.2 million. This was partially offset by an increase in accounts receivable and prepaid expenses of $9.6 million, which primarily resulted from the growth of our business and the timing of cash receipts from certain of our larger customers, pre-payments for travel, benefits, and commissions as well as an increase in short-term deposits and VAT receivables.
Cash Flows from Investing Activities
For the year ended December 31, 2019, cash used in investing activities was $87.7 million, primarily consisting of $191.0 million in purchases of marketable securities, $14.6 million of payments related to purchases of property and equipment to expand our network, and $4.9 million of additions to capitalized internal-use software. This was offset by $123.4 million of maturities and sales of marketable securities.
For the year ended December 31, 2018, cash used in investing activities was $47.1 million, primarily consisting of $62.7 million in purchases of marketable securities and $16.7 million of payments related to purchases of property and equipment to expand our network, offset by $35.2 million of maturities of marketable securities.
For the year ended December 31, 2017, cash used in investing activities was $15.8 million, primarily consisting of $46.1 million in purchases of marketable securities and $13.2 million of payments related to purchases of property and equipment to expand our network, offset by $43.5 million of maturities of marketable securities.
75
Cash Flows from Financing Activities
For the year ended December 31, 2019, cash provided by financing activities was $168.1 million, primarily consisting of $192.5 million in proceeds from our IPO, net of underwriting fees, $5.4 million in proceeds from the ESPP, $6.1 million in proceeds from stock option exercises by our employees and directors. This was partially offset by $30.5 million of net debt repayments and $5.5 million of payments of costs related to our IPO.
For the year ended December 31, 2018, cash provided by financing activities was $69.6 million, primarily consisting of $39.9 million of proceeds from our sales of Series F convertible preferred stock, net of issuance expenses, $27.1 million of net borrowings, and $2.6 million in proceeds from stock option exercises by our employees and directors.
For the year ended December 31, 2017, cash provided by financing activities was $55.4 million, primarily consisting of $49.8 million in proceeds from our sale of Series E convertible preferred stock, net of issuance expenses, $4.9 million of net borrowings, and $0.6 million in proceeds from stock option exercises by our employees.
Contractual Obligations and Other Commitments
The following table summarizes our non-cancelable contractual obligations as of December 31, 2019:
Less than 1 Year | 1-3 Years | 3-5 Years | More than 5 Years | Total | ||||||||||||||||
(in thousands) | ||||||||||||||||||||
Operating lease obligations(1) | $ | 3,637 | $ | 17,233 | $ | 11,766 | $ | 9,824 | $ | 42,460 | ||||||||||
Purchase obligations(2) | 46,929 | 17,479 | 63 | — | 64,471 | |||||||||||||||
Debt(3) | 5,682 | 27,163 | — | — | 32,845 | |||||||||||||||
Total | $ | 56,248 | $ | 61,875 | $ | 11,829 | $ | 9,824 | $ | 139,776 | ||||||||||
__________
(1) | Operating lease represent total future minimum rent payments under non-cancelable operating lease agreements, net of sublease income of $1.2 million. |
(2) | Purchase obligations represent total future minimum payments under contracts with our cloud infrastructure provider, network service providers, and other vendors. Purchase obligations exclude agreements that are cancelable without penalty. |
(3) | Debt represents principal and interest payments under our loan and security agreements. |
Off-Balance Sheet Arrangements
We have not entered into any off-balance sheet arrangements and do not have any holdings in variable interest entities.
Critical Accounting Policies and Estimates
We prepare our consolidated financial statements in accordance with U.S. GAAP. The preparation of our consolidated financial statements requires us to make estimates, judgments, and assumptions that affect the reported amounts of assets, liabilities, revenue, costs, expenses, and related disclosures. Actual results and outcomes could differ significantly from our estimates, judgments, and assumptions. To the extent that there are material differences between these estimates and actual results, our future financial statement presentation, financial condition, results of operations, and cash flows will be affected.
Revenue Recognition
Revenue is recognized upon transfer of control of promised products or services to customers in an amount that reflects the consideration we expect to receive in exchange for those products or services. We enter into contracts that can include various combinations of products and services, each of which are distinct and accounted for as separate performance obligations. Revenue is recognized net of any taxes collected from customers, which are subsequently remitted to governmental authorities.
We primarily derive revenue from the sale of services to customers executing contracts in which the standard contract term is one year, although terms may vary by contract. Most of our contracts are non-cancelable over the contractual term.
76
These contracts can commit the customer to a minimum monthly level of usage and specify the rate at which the customer must pay for actual usage above the monthly minimum.
A performance obligation is a promise in a contract to transfer a distinct good or service to the customer and is the unit of account in Topic 606. Our contracts with customers often include promises to transfer multiple products and services to a customer. Determining whether products and services are considered distinct performance obligations that should be accounted for separately versus together may require significant judgment. For contracts with multiple performance obligations, we allocate the contract transaction price to each performance obligation using our estimate of the standalone selling price ("SSP") of each distinct good or service in the contract.
Judgment is required to determine the SSP for each distinct performance obligation. We analyze separate sales of our products and services as a basis for estimating the SSP of our products and services. We then use that SSP as the basis for allocating the transaction price when our product and services are sold together in a contract with multiple performance obligations. In instances where SSP is not directly observable, such as when we do not sell the product or service separately, we determine the SSP using information that may include market conditions and other observable inputs. We typically have more than one SSP for individual products and services due to the stratification of those products and services by customers and circumstances. In these instances, we may use information, such geographic region and distribution channel, in determining the SSP.
The transaction price in a contract is typically equal to the minimum commit price in the contract less any discounts provided. Because our typical contracts represent distinct services delivered over time with the same pattern of transfer to the customer, usage-based consideration primarily related to actual consumption over the minimum commit levels is allocated to the period to which it relates. The amount of consideration recognized for usage above the minimum commit price is limited to the amount we expect to be entitled to receive in exchange for providing services. We have elected to apply the practical expedient for estimating and disclosing the variable consideration when variable consideration is allocated entirely to a wholly unsatisfied performance obligation or to a wholly unsatisfied promise to transfer a distinct good or service that forms part of a single performance obligation from our remaining performance obligations under these contracts.
Performance obligations represent stand-ready obligations that are satisfied over time as the customer simultaneously receives and consumes the benefits provided by us. These obligations can be content delivery, security, professional services, support, edge cloud platform services, and others. Accordingly, our revenue is recognized over time, consistent with the pattern of benefit provided to the customer over the term of the agreement.
At times, customers may request changes that either amend, replace, or cancel existing contracts. Judgment is required to determine whether the specific facts and circumstances within the contracts should be accounted for as a separate contract or as a modification.
In contracts where there are timing differences between when we transfer a promised good or service to the customer and when the customer pays for that good or service, we have determined our contracts do not include a significant financing component. We have also elected the practical expedient to not measure financing components for any contract where the timing difference is less than one year.
From time to time we enter into arrangements to establish and run private POPs for customers. These arrangements include content delivery services as well as professional services and the provision of hardware. For accounting purposes, we have determined that the provisioning of hardware is an operating lease. We recognize the revenue from these leases monthly on a straight-line basis over the term of the relevant customer agreements.
On January 1, 2019, we adopted Accounting Standards Update 2014-09, Revenue from Contracts with Customers (ASU 2014-09 or Topic 606) using the modified retrospective method applied to those contracts which were not completed as of January 1, 2019. Results for reporting periods beginning after January 1, 2019 are presented under Topic 606, while prior period amounts are not adjusted, and continue to be reported in accordance with our historical accounting under Topic 605. We recorded a net increase in stockholders’ equity (retained earnings) of $5.7 million as of January 1, 2019 due to the cumulative impact of adopting Topic 606 and Topic 340, Other Assets and Deferred Costs. The area most significantly impacted was related to the treatment of incremental costs of obtaining contracts with customers.
Using Topic 606, we determine revenue recognition through the following steps:
77
• | Identification of the contract, or contracts, with a customer; |
• | Identification of the performance obligations in the contract; |
• | Determination of the transaction price; |
• | Allocation of the transaction price to the performance obligations in the contract; and |
• | Recognition of revenue when, or as, we satisfy a performance obligation. |
Stock-Based Compensation—Restricted Stock Units ("RSUs") and Stock Options
We account for stock-based compensation in accordance with the authoritative guidance on stock compensation. Under the fair value recognition provisions of this guidance, stock-based compensation is measured at the grant date based on the fair value of the award and is recognized as expense in the statement of operations over the requisite service period, which is generally the vesting period of the respective award. We account for forfeitures as they occur.
Determining the fair value of stock-based awards at the grant date requires judgment. We estimate the fair value of RSUs at our stock price on the grant date. We use the Black-Scholes option-pricing model to determine the fair value of stock options and purchase rights under our Employee Stock Purchase Plan ("ESPP") granted to our employees and directors. The determination of the grant date fair value of options using an option-pricing model is affected by our estimated common stock fair value as well as assumptions regarding a number of other complex and subjective variables. These variables include the fair value of our common stock, the expected term of the options, our expected stock price volatility over the expected term of the options, risk-free interest rates for the expected term of the award, and expected dividends.
Internal-Use Software Development Costs
We capitalize certain costs related to the development of our platform and other software applications for internal use. In accordance with authoritative guidance, we begin to capitalize our costs to develop software when preliminary development efforts are successfully completed, management has authorized and committed project funding, and it is probable that the project will be completed and the software will be used as intended. We stop capitalizing these costs when the software is substantially complete and ready for its intended use, including the completion of all significant testing. These costs are amortized on a straight-line basis over the estimated useful life of the related asset, generally estimated to be three years. We also capitalize costs related to specific enhancements when it is probable the expenditure will result in additional functionality and expense costs incurred for maintenance and minor enhancements. Costs incurred prior to meeting these criteria together with costs incurred for training and maintenance are expensed as incurred and recorded within research and development expenses in our consolidated statement of operations. We exercise judgment in determining the point at which various projects may be capitalized, in assessing the ongoing value of the capitalized costs and in determining the estimated useful lives over which the costs are amortized. To the extent that we change the manner in which we develop and test new features and functionalities related to our platform, assess the ongoing value of capitalized assets, or determine the estimated useful lives over which the costs are amortized, the amount of internal-use software development costs we capitalize and amortize could change in future periods.
Legal and Other Contingencies
From time to time, we have been and will continue to be subject to legal proceedings and claims. Periodically, we evaluate the status of each legal matter and assess our potential financial exposure. If the potential loss from any legal proceeding or litigation is considered probable and the amount can be reasonably estimated, we accrue a liability for the estimated loss. Significant judgment is required to determine the probability of a loss and whether the amount of the loss is reasonably estimable. The outcome of any proceeding is not determinable in advance. As a result, the assessment of a potential liability and the amount of accruals recorded are based only on the information available to us at the time. As additional information becomes available, we reassess the potential liability related to the legal proceeding or litigation, and may revise our estimates. Any revisions could have a material effect on our results of operations.
We conduct operations in many tax jurisdictions throughout the United States. In many of these jurisdictions, non-income-based taxes, such as sales and use and telecommunications taxes are assessed on our operations. We are subject to
78
indirect taxes, and may be subject to certain other taxes, in some of these jurisdictions. Historically, we have not billed or collected these taxes and, in accordance with U.S. GAAP, we have recorded a provision for our tax exposure in these jurisdictions when it is both probable that a liability has been incurred and the amount of the exposure can be reasonably estimated. As a result, we have recorded a liability of $3.9 million as of December 31, 2019. These estimates are based on several key assumptions, including the taxability of our products, the jurisdictions in which we believe we have nexus and the sourcing of revenues to those jurisdictions. In the event these jurisdictions challenge our assumptions and analysis, our actual exposure could differ materially from our current estimates.
Recent Accounting Pronouncements
Refer to "Note 2--Summary of Significant Accounting Policies" included in the Notes to the Consolidated Financial Statements.
JOBS Act Accounting Election
We are an emerging growth company, as defined in the JOBS Act. Under the JOBS Act, emerging growth companies can delay adopting new or revised accounting standards issued subsequent to the enactment of the JOBS Act until such time as those standards apply to private companies. We have elected to use this extended transition period for complying with new or revised accounting standards that have different effective dates for public and private companies until the earlier of the date we (1) are no longer an emerging growth company or (2) affirmatively and irrevocably opt out of the extended transition period provided in the JOBS Act. As a result, our financial statements may not be comparable to companies that comply with new or revised accounting pronouncements as of public company effective dates.
79
Item 7A. Quantitative and Qualitative Disclosures about Market Risk
We are exposed to certain market risks in the ordinary course of our business. These risks primarily include interest rate and currency exchange risks as follows:
Interest Rate Risk
We had cash, cash equivalents, and marketable securities of $131.1 million, and restricted cash of $70.1 million, as of December 31, 2019, which consisted of bank deposits, money market funds, corporate notes and bonds, commercial paper, U.S. Treasury securities, and asset-backed securities. The cash and cash equivalents are held for working capital purposes. The restricted cash is held as cash collateral in connection with our Cash Collateralized Revolving Credit Agreement. Such interest-earning instruments carry a degree of interest rate risk. To date, fluctuations in interest income have not been significant. The primary objective of our investment activities is to preserve principal while generating income without significantly increasing risk. We do not enter into investments for trading or speculative purposes and have not used any derivative financial instruments to manage our interest rate risk exposure. Due to the short-term nature of our investments, we have not been exposed to, nor do we anticipate being exposed to, material risks due to changes in interest rates. Amounts borrowed under the Cash Collateralized Revolving Credit Agreement bear the same interest throughout the initial interest period, which ends in November 2020, at a rate of LIBOR as of October 31, 2019 plus 1.5%. A hypothetical 10% change in interest rates during the period presented would not have had a material impact on our consolidated financial statements.
Currency Exchange Risks
The functional currency of our foreign subsidiaries is the U.S. dollar. Therefore, we are exposed to foreign exchange rate fluctuations as we convert the financial statements of our foreign subsidiaries into U.S. dollars. The local currencies of our foreign subsidiaries are the British pound and Japanese Yen. Our subsidiaries remeasure monetary assets and liabilities at period-end exchange rates, while non-monetary items are remeasured at historical rates. Revenue and expense accounts are remeasured at the average exchange rate in effect during the period. If there is a change in foreign currency exchange rates, the conversion of our foreign subsidiaries’ financial statements into U.S. dollars would result in a realized gain or loss which is recorded in our consolidated statements of operations. We do not currently engage in any hedging activity to reduce our potential exposure to currency fluctuations, although we may choose to do so in the future. A hypothetical 10% change in foreign exchange rates during the period presented would not have had a material impact on our consolidated financial statements.
80
Item 8. Financial Statements and Supplementary Data
FASTLY, INC.
INDEX TO CONSOLIDATED FINANCIAL STATEMENTS
The following financial statements are filed as part of this Annual Report on form 10-K:
The supplementary financial information required by this Item 8 is included in Part II, Item 7 under the caption “Quarterly Results of Operations”, which is incorporated herein by reference.
81
Report of Independent Registered Public Accounting Firm
To the Stockholders and Board of Directors of Fastly, Inc.
Opinion on the Financial Statements
We have audited the accompanying consolidated balance sheets of Fastly, Inc. and subsidiaries (the "Company") as of December 31, 2019 and 2018, the related consolidated statements of operations, comprehensive loss, convertible preferred stock and stockholders' equity (deficit), cash flows, for each of the three years in the period ended December 31, 2019, and the related notes (collectively referred to as the "financial statements"). In our opinion, the financial statements present fairly, in all material respects, the financial position of the Company as of December 31, 2019 and 2018, and the results of its operations and its cash flows for each of the three years in the period ended December 31, 2019, in conformity with accounting principles generally accepted in the United States of America.
Basis for Opinion
These financial statements are the responsibility of the Company's management. Our responsibility is to express an opinion on the Company's financial statements based on our audits. We are a public accounting firm registered with the Public Company Accounting Oversight Board (United States) (PCAOB) and are required to be independent with respect to the Company in accordance with the U.S. federal securities laws and the applicable rules and regulations of the Securities and Exchange Commission and the PCAOB.
We conducted our audits in accordance with the standards of the PCAOB. Those standards require that we plan and perform the audit to obtain reasonable assurance about whether the financial statement is free of material misstatement, whether due to error or fraud. The Company is not required to have, nor were we engaged to perform, an audit of its internal control over financial reporting. As part of our audits, we are required to obtain an understanding of internal control over financial reporting but not for the purpose of expressing an opinion on the effectiveness of the Company's internal control over financial reporting. Accordingly, we express no such opinion.
Our audits included performing procedures to assess the risks of material misstatement of the financial statements, whether due to error or fraud, and performing procedures that respond to those risks. Such procedures included examining, on a test basis, evidence regarding the amounts and disclosures in the financial statements. Our audits also included evaluating the accounting principles used and significant estimates made by management, as well as evaluating the overall presentation of the financial statements. We believe that our audit provides a reasonable basis for our opinion.
/s/ Deloitte & Touche LLP
March 3, 2020
San Francisco, California
We have served as the Company's auditor since 2014.
82
FASTLY, INC.
CONSOLIDATED BALANCE SHEETS
(in thousands)
As of December 31, 2019 | As of December 31, 2018 | |||||||
ASSETS | ||||||||
Current assets: | ||||||||
Cash and cash equivalents | $ | $ | ||||||
Marketable securities | ||||||||
Accounts receivable, net of allowance for doubtful accounts of $1,816 and $1,679 as of December 31, 2019 and December 31, 2018, respectively | ||||||||
Restricted cash | ||||||||
Prepaid expenses and other current assets | ||||||||
Total current assets | ||||||||
Property and equipment, net | ||||||||
Goodwill | ||||||||
Intangible assets, net | ||||||||
Other assets | ||||||||
Total assets | $ | $ | ||||||
LIABILITIES, CONVERTIBLE PREFERRED STOCK AND STOCKHOLDERS’ EQUITY (DEFICIT) | ||||||||
Current liabilities: | ||||||||
Accounts payable | $ | $ | ||||||
Accrued expenses | ||||||||
Current portion of long-term debt | ||||||||
Other current liabilities | ||||||||
Total current liabilities | ||||||||
Long-term debt, less current portion | ||||||||
Convertible preferred stock warrant liabilities | ||||||||
Other long-term liabilities | ||||||||
Total liabilities | ||||||||
Commitments and contingencies (Note 9) | ||||||||
Convertible preferred stock series Seed, A, B, C, D, E and F in aggregate, $0.00002 par value; 0 and 54,148,643 shares authorized as of December 31, 2019 and 2018, respectively; 0 and 53,630,213 issued and outstanding at December 31, 2019 and 2018, respectively | ||||||||
Stockholders’ equity (deficit): | ||||||||
Class A and Class B common stock, $0.00002 par value; 1,094,129,050 and 97,500,000 shares authorized as of December 31, 2019 and 2018, respectively; 94,817,715 and 25,025,836 shares issued and outstanding at December 31, 2019 and 2018, respectively | ||||||||
Additional paid-in capital | ||||||||
Treasury stock | ( | ) | ||||||
Accumulated other comprehensive income (loss) | ( | ) | ||||||
Accumulated deficit | ( | ) | ( | ) | ||||
Total stockholders’ equity (deficit) | ( | ) | ||||||
Total liabilities, convertible preferred stock, and stockholders’ equity (deficit) | $ | $ | ||||||
The accompanying notes are an integral part of the consolidated financial statements.
83
FASTLY, INC.
CONSOLIDATED STATEMENTS OF OPERATIONS
(in thousands, except per share data)
Year ended December 31, | ||||||||||||
2019 | 2018 | 2017 | ||||||||||
Revenue | $ | $ | $ | |||||||||
Cost of revenue | ||||||||||||
Gross profit | ||||||||||||
Operating expenses: | ||||||||||||
Research and development | ||||||||||||
Sales and marketing | ||||||||||||
General and administrative | ||||||||||||
Total operating expenses | ||||||||||||
Loss from operations | ( | ) | ( | ) | ( | ) | ||||||
Interest income | ||||||||||||
Interest expense | ( | ) | ( | ) | ( | ) | ||||||
Other income (expense), net | ( | ) | ( | ) | ( | ) | ||||||
Loss before income taxes | ( | ) | ( | ) | ( | ) | ||||||
Income taxes | ||||||||||||
Net loss | $ | ( | ) | $ | ( | ) | $ | ( | ) | |||
Net loss per share attributable to common stockholders, basic and diluted | $ | ( | ) | $ | ( | ) | $ | (1.39 | ) | |||
Weighted-average shares used in computing net loss per share attributable to common stockholders, basic and diluted | 23,402 | |||||||||||
The accompanying notes are an integral part of the consolidated financial statements.
84
FASTLY, INC.
CONSOLIDATED STATEMENTS OF COMPREHENSIVE LOSS
(in thousands)
Year ended December 31, | ||||||||||||
2019 | 2018 | 2017 | ||||||||||
Net loss | $ | ( | ) | $ | ( | ) | $ | ( | ) | |||
Other comprehensive (loss) income: | ||||||||||||
Foreign currency translation adjustment | $ | $ | ( | ) | $ | |||||||
Gain (loss) on investments in available-for-sale-securities | ( | ) | ( | ) | ||||||||
Total other comprehensive income (loss) | $ | $ | ( | ) | $ | |||||||
Comprehensive loss | $ | ( | ) | $ | ( | ) | $ | ( | ) | |||
The accompanying notes are an integral part of the consolidated financial statements.
85
FASTLY, INC.
CONSOLIDATED STATEMENTS OF CONVERTIBLE PREFERRED STOCK AND STOCKHOLDERS’ EQUITY (DEFICIT)
(in thousands, except share amounts)
Convertible Preferred Shares | Common Stock—Class A | Common Stock—Class B | Additional Paid-in Capital | Treasury Stock | Accumulated Other Comprehensive Income (Loss) | Accumulated Deficit | Total Stockholders’ Equity (Deficit) | |||||||||||||||||||||||||||||||||||
Shares | Amount | Shares | Amount | Shares | Amount | |||||||||||||||||||||||||||||||||||||
Balance as of January 1, 2017 | $ | $ | $ | $ | $ | ( | ) | $ | ( | ) | $ | ( | ) | $ | ( | ) | ||||||||||||||||||||||||||
Exercise of stock options | — | — | — | — | — | — | ||||||||||||||||||||||||||||||||||||
Vesting of early exercised stock options | — | — | — | — | — | — | — | — | ||||||||||||||||||||||||||||||||||
Stock-based compensation | — | — | — | — | — | — | — | — | — | |||||||||||||||||||||||||||||||||
Issuance of Series E Preferred Stock, net of issuance costs of $137 | — | — | — | — | — | — | — | — | — | — | ||||||||||||||||||||||||||||||||
Vesting of restricted stock units | — | — | — | — | — | — | — | — | ||||||||||||||||||||||||||||||||||
Net loss | — | — | — | — | — | — | — | — | — | ( | ) | ( | ) | |||||||||||||||||||||||||||||
Other comprehensive income | — | — | — | — | — | — | — | — | — | |||||||||||||||||||||||||||||||||
Balance as of December 31, 2017 | $ | $ | $ | ( | ) | $ | ( | ) | ( | ) | ( | ) | ||||||||||||||||||||||||||||||
Exercise of stock options | — | — | — | — | — | — | — | — | ||||||||||||||||||||||||||||||||||
Vesting of early exercised stock options | — | — | — | — | — | — | — | — | ||||||||||||||||||||||||||||||||||
Stock-based compensation | — | — | — | — | — | — | — | — | — | |||||||||||||||||||||||||||||||||
Issuance of Series F Preferred Stock, net of issuance costs of $121 | — | — | — | — | — | — | — | — | — | |||||||||||||||||||||||||||||||||
Repayment of shareholder note | — | — | — | — | — | — | — | — | ||||||||||||||||||||||||||||||||||
Net loss | — | — | — | — | — | — | — | — | — | ( | ) | ( | ) | |||||||||||||||||||||||||||||
Other comprehensive loss | — | — | — | — | — | — | — | — | ( | ) | — | ( | ) | |||||||||||||||||||||||||||||
Balance as of December 31, 2018 | $ | $ | $ | $ | ( | ) | $ | ( | ) | $ | ( | ) | ( | ) | ||||||||||||||||||||||||||||
Impact of change in accounting policy | — | — | — | — | — | — | — | — | — | |||||||||||||||||||||||||||||||||
Conversion of convertible preferred stock to Class B common stock | ( | ) | ( | ) | — | — | — | — | — | |||||||||||||||||||||||||||||||||
Conversion of convertible preferred stock warrants to Class B common stock warrants | — | — | — | — | — | — | — | — | — | |||||||||||||||||||||||||||||||||
Conversion of Class B common stock to Class A common stock | — | — | ( | ) | ( | ) | — | — | — | — | — | |||||||||||||||||||||||||||||||
Issuance of Class A common stock in connection with the IPO, net of underwriting discounts | — | — | — | — | — | — | — | — | ||||||||||||||||||||||||||||||||||
Exercise of stock options | — | — | — | — | — | — | — | |||||||||||||||||||||||||||||||||||
Exercise of common stock warrants | — | — | — | — | — | — | — | — | — | — | ||||||||||||||||||||||||||||||||
Vesting of early exercised stock options | — | — | — | — | — | — | — | — | ||||||||||||||||||||||||||||||||||
Issuance of common stock under ESPP | — | — | — | — | — | — | — | — | ||||||||||||||||||||||||||||||||||
Stock-based compensation | — | — | — | — | — | — | — | — | — | |||||||||||||||||||||||||||||||||
Repayment of shareholder note | — | — | — | — | — | — | — | — | ||||||||||||||||||||||||||||||||||
Retirement of treasury stock | — | — | — | — | — | — | ( | ) | — | — | — | |||||||||||||||||||||||||||||||
Net loss | — | — | — | — | — | — | — | — | — | ( | ) | ( | ) | |||||||||||||||||||||||||||||
Other comprehensive income | — | — | — | — | — | — | — | — | — | |||||||||||||||||||||||||||||||||
Balance as of December 31, 2019 | $ | $ | $ | $ | $ | $ | $ | ( | ) | $ | ||||||||||||||||||||||||||||||||
The accompanying notes are an integral part of the consolidated financial statements.
86
FASTLY, INC.
CONSOLIDATED STATEMENTS OF CASH FLOWS
(in thousands)
Year ended December 31, | ||||||||||||
2019 | 2018 | 2017 | ||||||||||
Cash flows from operating activities: | ||||||||||||
Net loss | $ | ( | ) | $ | ( | ) | $ | ( | ) | |||
Adjustments to reconcile net loss to net cash used in operating activities: | ||||||||||||
Depreciation and amortization | ||||||||||||
Amortization of deferred rent | ( | ) | ( | ) | ||||||||
Amortization of debt issuance costs | ||||||||||||
Stock-based compensation | ||||||||||||
Provision for doubtful accounts | ||||||||||||
Change in fair value of preferred stock warrant liabilities | ||||||||||||
Other adjustments | ( | ) | ( | ) | ( | ) | ||||||
Interest paid on capital leases | ( | ) | ( | ) | ( | ) | ||||||
Loss on disposals of property and equipment | ||||||||||||
Changes in operating assets and liabilities: | ||||||||||||
Accounts receivable | ( | ) | ( | ) | ( | ) | ||||||
Prepaid expenses and other current assets | ( | ) | ( | ) | ( | ) | ||||||
Other assets | ( | ) | ( | ) | ||||||||
Accounts payable | ( | ) | ||||||||||
Accrued expenses | ||||||||||||
Other liabilities | ( | ) | ||||||||||
Net cash used in operating activities | ( | ) | ( | ) | ( | ) | ||||||
Cash flows from investing activities: | ||||||||||||
Purchases of marketable securities | ( | ) | ( | ) | ( | ) | ||||||
Sales of marketable securities | ||||||||||||
Maturities of marketable securities | ||||||||||||
Purchases of property and equipment | ( | ) | ( | ) | ( | ) | ||||||
Capitalized internal-use software | ( | ) | ( | ) | ( | ) | ||||||
Purchases of intangible assets | ( | ) | ||||||||||
Net cash used in investing activities | ( | ) | ( | ) | ( | ) | ||||||
Cash flows from financing activities: | ||||||||||||
Proceeds from initial public offering, net of underwriting discounts | ||||||||||||
Payments of costs related to initial public offering | ( | ) | ||||||||||
Proceeds from borrowings under notes payable | ||||||||||||
Payments of debt issuance costs | ( | ) | ( | ) | — | |||||||
Repayments of notes payable | ( | ) | ( | ) | ( | ) | ||||||
Repayments of capital leases | ( | ) | ( | ) | ( | ) | ||||||
Proceeds from Series E financing | ||||||||||||
Series E issuance costs | ( | ) | ||||||||||
Proceeds from Series F financing | ||||||||||||
Series F issuance costs | ( | ) | ||||||||||
Proceeds from Employee Stock Purchase Plan | ||||||||||||
Proceeds from exercise of vested stock options | ||||||||||||
Proceeds from early exercise of stock options | ||||||||||||
Proceeds from payment of stockholder note | ||||||||||||
Repurchase of early exercised shares | ( | ) | ||||||||||
Net cash provided by financing activities | ||||||||||||
Effects of exchange rate changes on cash, cash equivalents, and restricted cash | ( | ) | ||||||||||
Net increase in cash, cash equivalents, and restricted cash | ||||||||||||
Cash, cash equivalents, and restricted cash at beginning of period | ||||||||||||
Cash, cash equivalents, and restricted cash at end of period | $ | $ | $ | |||||||||
The accompanying notes are an integral part of the consolidated financial statements.
87
FASTLY, INC.
CONSOLIDATED STATEMENTS OF CASH FLOWS—Continued
(in thousands)
Year ended December 31, | ||||||||||||
2019 | 2018 | 2017 | ||||||||||
Supplemental disclosure of cash flow information: | ||||||||||||
Cash paid for interest | $ | $ | $ | |||||||||
Cash paid for income taxes, net of refunds received | $ | $ | $ | |||||||||
Property and equipment additions not yet paid in cash | $ | $ | $ | |||||||||
Vesting of early-exercised stock options | $ | $ | $ | |||||||||
Capital lease outstanding from current year addition | $ | $ | $ | |||||||||
Warrant issued in connection with debt | $ | $ | $ | |||||||||
Change in other assets from change in accounting principle | $ | $ | $ | |||||||||
Conversion of convertible preferred stock warrants to convertible common stock warrants | $ | $ | $ | |||||||||
Cashless exercise of common stock warrants | $ | $ | $ | |||||||||
Costs related to initial public offering, accrued but not yet paid | $ | $ | $ | |||||||||
Stock-based compensation capitalized to internal-use software | $ | $ | $ | |||||||||
Reconciliation of cash, cash equivalents, and restricted cash as shown in the statements of cash flows | ||||||||||||
Cash and cash equivalents | $ | $ | $ | |||||||||
Restricted cash | ||||||||||||
Total cash, cash equivalents, and restricted cash | $ | $ | $ | |||||||||
The accompanying notes are an integral part of the consolidated financial statements.
88
1. Nature of Business
Fastly, Inc. has built an edge cloud platform that can process, serve, and secure its customer’s applications as close to their end users as possible. Our edge network spans 68 Points-of-Presence ("POPs") across 53 markets, as of December 31, 2019. We were incorporated in Delaware in 2011 and are headquartered in San Francisco, California.
As used herein, "Fastly," "we," "our," "the Company," and similar terms include Fastly, Inc. and its subsidiaries, unless the context indicates otherwise.
Stock Split
On May 3, 2019, we implemented a 1-for-2 reverse stock split of our stock. All shares of common stock, stock-based instruments, and per-share data included in these financial statements give effect to the stock split and the changes in authorized shares have been adjusted retroactively for all periods presented.
Initial Public Offering ("IPO")
2. Summary of Significant Accounting Policies
Basis of Presentation
The consolidated financial statements have been prepared in accordance with United States generally accepted accounting principles ("U.S. GAAP").
Certain changes in presentation have been made to conform the prior period presentation to the current period reporting. We have reclassified a portion of sales from marketable securities to maturities of marketable securities line item in the Consolidated Statements of Cash Flows. We have also reclassified a portion of purchases of property and equipment to the capitalized internal-use software line item of the Consolidated Statements of Cash Flows. We have also reclassified a portion of the proceeds from borrowings under notes payable to the payments of debt issuance costs line item of the Consolidated Statement of Cash Flows. In addition, as a result of the adoption of ASU 2016-18 (Topic 230), we have shown the changes in the total of cash, cash equivalents, and restricted cash in the Consolidated Statements of Cash Flows. We have also reclassified a portion of other accrued liabilities to the accrued colocation and bandwidth costs line in the Accrued Expenses section of Footnote 5, "Balance Sheet Information".
Principles of Consolidation
The accompanying consolidated financial statements include the accounts of the Company and its wholly-owned subsidiaries. All intercompany transactions and balances have been eliminated in consolidation.
Use of Estimates
The preparation of our consolidated financial statements requires us to make estimates, judgments, and assumptions that affect the reported amounts of assets, liabilities, revenue, costs and expenses, and related disclosures. Actual results and outcomes could differ significantly from our estimates, judgments, and assumptions. Significant estimates, judgments, and assumptions used in these financial statements include, but are not limited to, those related to revenue, accounts receivable and related reserves, useful lives and realizability of long-lived assets, income tax reserves, and accounting for stock-based
89
compensation. Estimates are periodically reviewed in light of changes in circumstances, facts, and experience. The effects of material revisions in estimates are reflected in the consolidated financial statements in the period of change and prospectively from the date of the change in estimate.
Cash, Cash Equivalents and Marketable Securities
We invest our excess cash primarily in short-term fixed income securities, including government and investment-grade debt securities and money market funds. We classify all liquid investments with stated maturities of three months or less from date of purchase as cash equivalents. Marketable securities with original maturities greater than three months from purchase date and remaining maturities less than one year are classified as short-term marketable securities. Marketable securities with remaining maturities greater than one year as of the balance sheet date and which we intend to hold for greater than one year, are classified as long-term marketable securities. The fair market value of cash equivalents at December 31, 2019 and 2018 approximated their carrying value. Marketable securities are carried at fair market value, with unrealized gains and losses considered to be temporary in nature reported in accumulated other comprehensive loss. Cost of securities sold is based on specific identification. We determine the appropriate classification of our investments in marketable securities at the time of purchase and reevaluate such designation at each balance sheet date. We have classified and accounted for our marketable securities as available-for-sale. After considering our capital preservation objectives, as well as our liquidity requirements, we may sell securities prior to their stated maturities. We carry our available-for-sale securities at fair value, and report the unrealized gains and losses as a component of other comprehensive loss, except for unrealized losses determined to be other-than-temporary which are recorded as other expense, net. We determine any realized gains or losses on the sale of marketable securities on a specific identification method and record such gains and losses as a component of other expense, net. Interest earned on cash, cash equivalents, and marketable securities was approximately $3.1 million and $0.9 million during the years ended December 31, 2019 and 2018, respectively. These balances are recorded in interest income in the accompanying Consolidated Statement of Operations and Comprehensive Loss.
We evaluate the investments periodically for possible other-than-temporary impairment. A decline in fair value below the amortized costs of debt securities is considered an other-than-temporary impairment if we have the intent to sell the security or it is more likely than not that we will be required to sell the security before recovery of the entire amortized cost basis. In those instances, an impairment charge equal to the difference between the fair value and the amortized cost basis is recognized in other expense. Regardless of our intent or requirement to sell a debt security, impairment is considered other-than-temporary if we do not expect to recover the entire amortized cost basis.
Restricted Cash
As of December 31, 2019, we had recorded a restricted cash balance of approximately $70.1 million on the accompanying Consolidated Balance Sheet. This restricted cash balance primarily consists of cash deposited and held in money market funds as collateral underlying the Cash Collateralized Revolving Credit Agreement ("Credit Agreement") entered into on November 4, 2019. See Note 7, "Debt Instruments" for further details on the Credit Agreement. Interest income earned on restricted cash was approximately $0.1 million during the year ended December 31, 2019. These balances are recorded in interest income in the accompanying Consolidated Statement of Operations and Comprehensive Loss. There was no restricted cash as of December 31, 2018.
Accounts Receivable, net
Accounts receivable are recorded and carried at the original invoiced amount less an allowance for any potential uncollectible amounts. We record allowances based upon its assessment of various factors, such as: historical experience, credit quality of our customers, age of the accounts receivable balances, geographic related risks, economic conditions, and other factors that may affect a customer's ability to pay. Increases and decreases in the allowance for doubtful accounts are included as a component of General and administrative expense in the Consolidated Statements of Operations and Comprehensive Loss. We do not have any off-balance sheet credit exposure related to our customers.
Incremental Costs to Obtain a Contract with a Customer
We capitalize incremental costs associated with obtaining customer contracts, specifically certain commission payments. We pay commissions based on contract value upon signing a new arrangement with a customer and upon renewal and upgrades of existing contracts with customers only if the renewal and upgrades result in an incremental increase in contract value. To the
90
extent that renewals and upgrades do not result in an increase in contract value, no additional commissions are paid. We also incur commission expense on an ongoing basis based upon revenue recognized. In these cases, no incremental costs are deferred, as the commissions are earned and expensed in the same period for which the associated revenue is recognized. Based on the nature of our unique technology and services, and the rate at which we continually enhances and updates our technology, the expected life of the customer arrangement is determined to be approximately five years . Commissions for new arrangements and renewals are both amortized over five years . Amortization is primarily included in sales and marketing
expense in the consolidated statements of income. The current portion of deferred commission and incentive payments is included in prepaid expenses and other current assets, and the long-term portion is included in other assets on our Consolidated Balance Sheets.
Concentrations of Credit Risk
Financial instruments that potentially subject us to significant concentration of credit risk consist primarily of cash, cash equivalents, marketable securities, and accounts receivable. The primary focus of our investment strategy is to preserve capital and meet liquidity requirements. Our investment policy addresses the level of credit exposure by limiting the concentration in any one corporate issuer or sector and establishing a minimum allowable credit rating. To manage the risk exposure, we invest cash equivalents and marketable securities in a variety of fixed income securities, including government and investment-grade debt securities and money market funds. We place our cash primarily in checking and money market accounts with reputable financial institutions. Deposits held with these financial institutions may exceed the amount of insurance provided on such deposits, if any.
Fair Value of Financial Instruments
Our financial instruments consist of cash and cash equivalents, marketable securities, accounts receivable, accounts payable, accrued expenses, debt and convertible preferred stock warrant liabilities. Cash equivalents, marketable securities, and convertible preferred stock warrant liabilities are carried at fair value. Accounts receivable, accounts payable, and accrued expenses are stated at their carrying value, which approximates fair value due to the short time to the expected receipt or payment date. The carrying amount of our debt approximates fair value as the stated interest rate approximates market rates currently available to us.
Property and Equipment
Property and equipment are stated at cost less accumulated depreciation and amortization. Depreciation and amortization are computed on a straight-line basis over the estimated useful lives of the assets. The estimated useful life of each asset category is as follows:
Computer and networking equipment | 3-5 years |
Leasehold improvements | Shorter of lease term or 5 years |
Furniture and fixtures | 3 years |
Office equipment | 3 years |
Internal-use software | 3 years |
We periodically review the estimated useful lives of property and equipment and any changes to the estimated useful lives are recorded prospectively from the date of the change.
Upon retirement or sale, the cost of the assets disposed of and the related accumulated depreciation are removed from the accounts, and any resulting gain or loss is included in other expense, net in the Consolidated Statements of Operations and Consolidated Statements of Comprehensive Loss. Repairs and maintenance costs are expensed as incurred.
91
Internal-Use Software Development Costs
Labor and related costs associated with internal-use software during the application development stage are capitalized. Capitalization of costs begins when the preliminary project stage is completed, management has committed to funding the project, and it is probable that the project will be completed and the software will be used to perform the function intended. Capitalization ceases at the point when the project is fully tested and substantially complete and is ready for its intended purpose. The capitalized amounts are included in property and equipment, net on the Consolidated Balance Sheets. We amortize such costs over the estimated useful life of the software; completed internal-use software that is used on our network is amortized to cost of revenue over its estimated useful life. Costs incurred during the planning, training, and post-implementation stages of the software development life-cycle are expensed as incurred.
Goodwill, Intangible Assets, and Long-lived Assets
Goodwill is the amount by which the cost of acquired net assets in a business combination exceeds the fair value of the net identifiable assets on the date of purchase and is carried at its historical cost. We test goodwill for impairment on an annual basis or more frequently if events or changes in circumstances indicate that the asset might be impaired. We perform our annual impairment test of goodwill as of October 31 and whenever events or circumstances indicate that the asset might be impaired. Prior to September 30, 2019, we performed our annual impairment test of goodwill as of December 31 and whenever events or circumstances indicated that the asset might be impaired. We did not have any impairments to goodwill during the years ended December 31, 2019, 2018, and 2017.
Intangible assets consist of internet protocol addresses and domain names and are amortized over their estimated useful lives based upon the estimated economic value derived from the related intangible asset.
Long-lived assets, including property and equipment and intangible assets, are reviewed for impairment whenever events or changes in circumstances, such as service discontinuance, technological obsolescence, significant decreases in our market capitalization, facility closures, or work-force reductions indicate that the carrying amount of the long-lived asset or asset group may not be recoverable. When such events occur, we compare the carrying amount of the asset or asset group to the undiscounted expected future cash flows related to the asset or asset group. If this comparison indicates that an impairment is present, the amount of the impairment is calculated as the difference between the carrying amount and the fair value of the asset or asset group. We did not have any impairments during the years ended December 31, 2019 and 2018.
Deferred Offering Costs
Deferred Rent and Lease Accounting
We lease most of our data center facilities and office space under non-cancelable operating lease agreements. Total rent payments, inclusive of rent increases, rent holidays, rent concessions, leasehold incentives, or any other unusual provisions or conditions, are expensed on a straight-line basis over the lease term. The difference between the straight-line expense and the cash payment is recorded as deferred rent.
Convertible Preferred Stock Warrant Liabilities
We recorded our warrants to purchase convertible preferred stock as a liability on the Consolidated Balance Sheets at fair value upon issuance because the warrants were exercisable for contingently redeemable preferred stock which was classified outside of stockholders' deficit. The liability associated with these warrants was subject to remeasurement at each balance sheet date, with changes in fair value recorded in the Consolidated Statement of Operations and Comprehensive Loss as other expense, net. Immediately upon closing of the IPO, our warrants to purchase convertible preferred stock were automatically converted to warrants to purchase an equal number of shares of our Class B common stock. As a result, the warrant was remeasured a final time, immediately prior to the closing of the IPO, and reclassified to additional paid-in capital within stockholders' equity. Changes in the fair value were recorded within other expense, net on the Consolidated Statement of Operations.
92
Revenue Recognition
Refer to Note 3, "Revenues" in the Notes to Consolidated Financial Statements for our Revenue Recognition policy.
Cost of Revenue
Cost of revenue consists primarily of fees paid to network providers for bandwidth and to third-party network data centers for housing servers, also known as colocation costs. Cost of revenue also includes employee costs for network operation, build-out and support and services delivery, network storage costs, cost of managed services and software-as-a-service, depreciation of network equipment used to deliver our services, and amortization of network-related internal-use software. The Company enters into contracts for bandwidth with third-party network providers with terms of typically one year . These contracts generally commit us to pay minimum monthly fees plus additional fees for bandwidth usage above the committed level. We enter into contracts for colocation services with third-party providers with terms of typically three years .
Research and Development Costs
Research and development costs consist of primarily payroll and related personnel costs for the design, development, deployment, testing, and enhancement of our edge cloud platform. Costs incurred in the development of our edge cloud platform are expensed as incurred, excluding those expenses which met the criteria for development of internal-use software.
Advertising Expense
Accounting for Stock-Based Compensation
We account for stock-based employee compensation plans under the fair value recognition and measurement provisions, which require all stock-based payments, including grants of stock options, restricted stock units ("RSUs"), and shares issued under our Employee Stock Purchase Plan ("ESPP") to be measured based on the grant-date fair value of the award and recognized as expense over the requisite service period, which is generally the vesting period of the respective award. We account for forfeitures as they occur.
The fair value of RSUs granted to our employees and directors is based on the grant date fair value. The fair value of stock options granted to our employees and directors, and of the shares to be issued under our ESPP are based on the Black-Scholes option-pricing model. The determination of the fair value of a stock-based award is affected by the deemed fair value of the underlying stock price on the grant date, as well as assumptions regarding a number of other complex and subjective variables. These variables include the fair value of our common stock, the expected stock price volatility over the expected term of the options, stock option exercise and cancellation behaviors, risk-free interest rates, and expected dividends:
These assumptions and estimates are as follows:
• | Fair Value of Common Stock. Because our common stock was not publicly traded until the completion of the IPO, the Board considered numerous objective and subjective factors to determine the fair value of our Common Stock at each meeting at which awards were approved. These factors included, but were not limited to (i) contemporaneous third-party valuations of Common Stock; (ii) the rights and preferences of Series Preferred relative to Common Stock; (iii) the lack of marketability of Common Stock; (iv) developments in the business; and (v) the likelihood of achieving a liquidity event, such as an IPO or sale of the Company, given prevailing market conditions. |
• | Expected Term. The expected term represents the period that our stock-based awards are expected to be outstanding. The expected term assumptions were determined based on the vesting terms, exercise terms, and contractual lives of the options. The expected term was estimated using the simplified method allowed under Securities and Exchange Commission (SEC) guidance. |
• | Volatility. Since we do not have a long trading history of our common stock, the expected volatility is determined based on the historical stock volatilities of its comparable companies. Comparable companies consist of public |
93
companies in the Company’s industry, which are similar in size, stage of life cycle, and financial leverage. We intend to continue to apply this process using the same or similar public companies until a sufficient amount of historical information regarding the volatility of its share price becomes available, or unless circumstances change such that the identified companies are no longer similar to us, in which case, more suitable companies whose share prices are publicly available would be used in the calculation.
• | Risk-free Interest Rate. The risk-free interest rate used in the Black-Scholes option pricing model is the implied yield available on U.S. Treasury zero-coupon issues with a remaining term equivalent to that of the options for each expected term. |
• | Dividend Yield. The expected dividend assumption is based on our current expectations of our anticipated dividend policy. We have no history of paying any dividends and therefore used an expected dividend yield of zero. |
Foreign Currency Translation
Local currencies of foreign subsidiaries are the functional currencies for financial reporting purposes. Our non-U.S. subsidiaries have either the British pound or the Japanese yen as the functional currency. For operations outside the United States that have functional currencies other than the U.S. dollar, the assets and liabilities of our subsidiaries are translated at the applicable exchange rate as of the balance sheet date, and revenue and expenses are translated at an average rate over the period. Resulting currency translation adjustments are recorded as a component of accumulated other comprehensive loss, a separate component of stockholders’ equity (deficit). Gains and losses on intercompany and other non-functional currency transactions are recorded in other income (expense), net.
Income Taxes
We account for income taxes under the asset and liability method, which requires the recognition of deferred tax assets and liabilities for the expected future tax consequences of events that have been included in the financial statements. Under this method, we determine deferred tax assets and liabilities on the basis of the differences between the financial statement and tax bases of assets and liabilities by using enacted tax rates for the year in which the differences are expected to reverse. The effect of a change in tax rates on deferred tax assets and liabilities is recognized in income in the period that includes the enactment date.
We recognize deferred tax assets to the extent that it believes that these assets are more likely than not to be realized. In making such a determination, we consider all available positive and negative evidence, including future reversals of existing taxable temporary differences, projected future taxable income, tax-planning strategies, and results of recent operations. If we determine that it would be able to realize its deferred tax assets in the future in excess of their net recorded amount, we would make an adjustment to the deferred tax asset valuation allowance, which would reduce the provision for income taxes.
We record uncertain tax positions in accordance with ASC 740 on the basis of a two-step process in which (1) it determines whether it is more likely than not that the tax positions will be sustained on the basis of the technical merits of the position and (2) for those tax positions that meet the more-likely-than-not recognition threshold, we recognize the largest amount of tax benefit that is more than 50 percent likely to be realized upon ultimate settlement with the related tax authority.
We recognize interest and penalties related to unrecognized tax benefits on the income tax expense line in the accompanying Consolidated Statement of Operations and Comprehensive Loss. Accrued interest and penalties are included in accrued expenses on the Consolidated Balance Sheet.
Comprehensive Loss
Comprehensive loss consists of two components: net loss and other comprehensive income (loss). Other comprehensive income (loss) refers to gains and losses that are recorded as an element of stockholders' equity (deficit) and are excluded from net loss. Our other comprehensive income (loss) is comprised of foreign currency translation adjustments and gain (loss) on investments in available-for-sale securities.
94
Net Loss Per Share Attributable to Common Stockholders
Recently Adopted Accounting Pronouncements
In May 2014, the Financial Accounting Standards Board ("FASB") issued Accounting Standards Update No. 2014-09, Revenue from Contracts with Customers ("Topic 606") ("ASU 2014-09"), which amends the existing accounting standards for revenue recognition, Topic 605, and outlines a single set of comprehensive principles for recognizing revenue under U.S. GAAP. Among other things ASU 2014-09 requires entities to assess the products or services promised in contracts with customers at contract inception to determine the appropriate unit at which to record revenue, which is referred to as a performance obligation. Revenue is recognized when or as control of the promised products or services is transferred to customers at an amount that reflects the consideration to which the entity expects to be entitled to in exchange for those products or services. We have adopted ASU 2014-09 as of January 1, 2019 using the modified retrospective method applied to those contracts which were not completed as of January 1, 2019. Revenues and contract assets or liabilities for contracts completed prior to January 1, 2019 are presented under Topic 605, and revenues and contract assets and liabilities from contracts which were not completed or started after December 31, 2018 are presented under Topic 606. We recorded a net increase in stockholders’ equity (retained earnings) of $5.7 million as of January 1, 2019 due to the cumulative impact of adopting Topic 606 and Topic 340, Other Assets and Deferred Costs. Refer to Note 3, "Revenue", in the Notes to the Consolidated Financial Statements for further information.
In January 2016, FASB issued new guidance, ASU 2016-01, Financial Instruments-Overall (Subtopic 825-10) Recognition and Measurement of Financial Assets and Financial Liabilities, which addresses certain aspects of recognition, measurement, presentation, and disclosure of financial instruments, and requires equity securities to be measured at fair value with changes in fair value recognized through net income. The guidance is effective for financial statements issued for fiscal years beginning after December 15, 2018. We adopted this guidance effective January 1, 2019, using the prospective approach. The adoption of ASU 2016-01 did not have a material impact on our consolidated financial statements.
In August 2016, FASB issued Accounting Standards Update No. 2016-15, Statement of Cash Flows (Topic 230) Classification of Certain Cash Receipts and Cash Payments ("ASU 2016-15"), which clarifies how entities should classify cash receipts and cash payments related to eight specific cash flow matters on the statement of cash flows, with the objective of reducing existing diversity in practice. ASU 2016-15 designates the appropriate class flow classification, including requirements to allocate certain components of these cash receipts and payments among operating, investing, and financing activities. The guidance is effective for financial statements issued for fiscal years beginning after December 15, 2018. We adopted this guidance effective January 1, 2019 using the retrospective transition approach for all periods presented. The adoption of ASU 2016-15 did not have a material impact on our consolidated financial statements.
In November 2016, the FASB issued Accounting Standards Update No. 2016-18, Statement of Cash Flows (Topic 230) ("ASU 2016-18"), which requires companies to include amounts generally described as restricted cash and restricted cash equivalents in cash and cash equivalents when reconciling beginning-of-period and end-of-period total amounts shown on the statement of cash flows. We adopted this guidance effective January 1, 2019, using the retrospective transition approach for all periods presented. The adoption of ASU 2016-18 did not have a material impact on our consolidated financial statements.
In January 2017, the FASB issued Accounting Standards Update No. 2017-01, Business Combinations (Topic 805): Clarifying the Definition of a Business ("ASU 2017-01"), which changes the definition of a business to assist entities with evaluating whether transactions should be accounted for as transfers of assets or business combinations. The guidance is effective for financial statements issued for fiscal years beginning after December 15, 2018. We adopted this guidance effective
95
January 1, 2019, using the prospective approach. The adoption of ASU 2017-01 did not have a material impact on our consolidated financial statements.
In January 2017, the FASB issued Accounting Standards Update No. 2017-04, Intangibles—Goodwill and Other (Topic 350): Simplifying the Test for Goodwill Impairment ("ASU 2017-04"), which eliminates step two from the goodwill impairment test. Under this guidance, an entity should recognize an impairment charge for the amount by which the carrying amount of a reporting unit exceeds its fair value up to the amount of goodwill allocated to that reporting unit. The guidance is effective for financial statements issued for fiscal years beginning after December 15, 2020, although early adoption is permitted for annual and interim goodwill impairment testing dates following January 1, 2017. We have elected to early adopt this guidance beginning in the second quarter of 2019 using the prospective method. The adoption of ASU 2017-04 did not have a material impact on our consolidated financial statements.
In June 2018, the FASB issued Accounting Standards Update No. 2018-07, Improvements to Nonemployee Share-Based Payment Accounting ("ASU 2018-07"), which simplifies the accounting for share-based payments granted to nonemployees for goods and services. Under ASU 2018-07, certain guidance such as payments to nonemployees would be aligned with the requirements for share-based payments granted to employees. The guidance is effective for fiscal years beginning after December 15, 2019, and interim periods within that fiscal year, although early adoption is permitted. We have elected to early adopt the guidance beginning January 1, 2019. The adoption of ASU 2018-07 did not have a material impact on our consolidated financial statements.
Recently Issued Accounting Standards
We qualify as an "emerging growth company" as defined in the Jumpstart Our Business Startups Act of 2012 ("JOBS Act") and therefore have elected to continue to take advantage of certain exemptions from various public company reporting requirements, including delaying adoption of new or revised accounting standards until those standards apply to private companies. We have elected to use this extended transition period under the JOBS Act. The effective dates shown below reflect the election to use the extended transition period.
In February 2016, the FASB issued new guidance, Accounting Standard Update No. 2016-02, Leases (Topic 842) ("ASU 2016-02"), which establishes the principles to report transparent and economically neutral information about the assets and liabilities that arise from leases. Accordingly, this new standard introduces a lessee model that brings most operating leases on the balance sheet and also aligns certain of the underlying principles of the new lessor model with those in the new revenue recognition standard. The guidance is effective for financial statements issued for fiscal years beginning after December 15, 2020 using the modified retrospective method, although the optional transition method can also be applied. We are currently evaluating the appropriate transition method and impact of this guidance on our consolidated financial statements and related disclosures.
In June 2016, FASB issued new guidance, ASU 2016-13, Financial Instruments-Credit Losses (Topic 326): Measurement of Credit Losses on Financial Instruments, which introduces a new methodology for accounting for credit losses on financial instruments, including available-for-sale debt securities. The guidance establishes a new “expected loss model” that requires entities to estimate current expected credit losses on financial instruments by using all practical and relevant information. Any expected credit losses are to be reflected as allowances rather than reductions in the amortized cost of available-for-sale debt securities. The guidance is effective for financial statements issued for fiscal years beginning after December 15, 2020. The Company does not expect the adoption of this standard to have a material impact on its consolidated financial statements.
In August 2018, the FASB issued Accounting Standards Update No. 2018-15, Intangibles—Goodwill and Other—Internal-Use Software (ASC 350-40): Customer’s Accounting for Implementation Costs Incurred in a Cloud Computing Arrangement ("ASU 2018-15"). This guidance provides that implementation costs be evaluated for capitalization using the same criteria as that used for internal-use software development costs, with amortization expense being recorded in the same income statement expense line as the hosted service costs and over the expected term of the hosting arrangement. The guidance is effective for financial statements issued for fiscal years beginning after December 15, 2020, and interim periods within annual periods beginning after December 15, 2021, using the prospective method. Early adoption is permitted, including adoption in any interim period. We are currently evaluating the potential impact of this guidance on our consolidated financial statements and related disclosures.
96
3. Revenue
Adoption of ASC Topic 606, "Revenue from Contracts with Customers"
On January 1, 2019, we adopted ASU 2014-09, ("Topic 606"), Revenue from Contracts with Customers, which replaced the existing revenue recognition guidance, ("ASC 605"), and outlines a single set of comprehensive principles for recognizing revenue under U.S. GAAP. Under Topic 606, revenue is recognized when control of the promised goods or services is transferred to our customers, in an amount that reflects the consideration we expect to be entitled to in exchange for those goods or services. We determine revenue recognition through the following five-step approach:
• | identification of the contract, or contracts, with a customer; |
• | identification of the performance obligations in the contract; |
• | determination of the transaction price; |
• | allocation of the transaction price to the performance obligations in the contract; and |
• | recognition of revenue when, or as, we satisfy a performance obligation. |
Consolidated Balance Sheets
As of December 31, 2019 | ||||||||||||
As currently reported | Impact of adopting ASC 606 and ASC 340-40 | As would have been reported under previous revenue standards | ||||||||||
(in thousands) | ||||||||||||
Other assets | $ | $ | ( | ) | $ | |||||||
Total assets | ( | ) | ||||||||||
Accumulated deficit | ( | ) | ( | ) | ( | ) | ||||||
Total stockholders’ equity (deficit) | ( | ) | ||||||||||
Total liabilities and stockholders’ equity (deficit) | $ | $ | ( | ) | $ | |||||||
97
Consolidated Statements of Operations
Year ended December 31, 2019 | ||||||||||||
As currently reported | Impact of adopting ASC 606 and ASC 340-40 | As would have been reported under previous revenue standards | ||||||||||
(in thousands) | ||||||||||||
Sales and marketing | $ | $ | ( | ) | $ | |||||||
Total operating expenses | ( | ) | ||||||||||
Loss from operations | ( | ) | ( | ) | ||||||||
Loss before income taxes | ( | ) | ( | ) | ||||||||
Net loss | ( | ) | ( | ) | ||||||||
Comprehensive loss | $ | ( | ) | $ | $ | ( | ) | |||||
Revenue is recognized upon transfer of control of promised products or services to customers in an amount that reflects the consideration we expect to receive in exchange for those products or services. We enter into contracts that can include various combinations of products and services, each of which are distinct and accounted for as separate performance obligations. Revenue is recognized net of any taxes collected from customers, which are subsequently remitted to governmental authorities.
A performance obligation is a promise in a contract to transfer a distinct good or service to the customer and is the unit of account in Topic 606. Our contracts with customers often include promises to transfer multiple products and services to a customer. Determining whether products and services are considered distinct performance obligations that should be accounted for separately versus together may require significant judgment. For contracts with multiple performance obligations, we allocate the contract transaction price to each performance obligation using our estimate of the standalone selling price ("SSP") of each distinct good or service in the contract.
Judgment is required to determine the SSP for each distinct performance obligation. We analyze separate sales of our products and services as a basis for estimating the SSP of our products and services. We then use that SSP as the basis for allocating the transaction price when our product and services are sold together in a contract with multiple performance obligations. In instances where SSP is not directly observable, such as when we do not sell the product or service separately, we determine the SSP using information that may include market conditions and other observable inputs. We typically have more than one SSP for individual products and services due to the stratification of those products and services by customers and circumstances. In these instances, we may use information, such geographic region and distribution channel, in determining the SSP.
The transaction price in a contract is typically equal to the minimum commit price in the contract less any discounts provided. Because our typical contracts represent distinct services delivered over time with the same pattern of transfer to the customer, usage-based consideration primarily related to actual consumption over the minimum commit levels is allocated to the period to which it relates. The amount of consideration recognized for usage above the minimum commit price is limited to the amount we expect to be entitled to receive in exchange for providing services. We have elected to apply the practical expedient for estimating and disclosing the variable consideration when variable consideration is allocated entirely to a wholly unsatisfied performance obligation or to a wholly unsatisfied promise to transfer a distinct good or service that forms part of a single performance obligation from our remaining performance obligations under these contracts.
Performance obligations represent stand-ready obligations that are satisfied over time as the customer simultaneously receives and consumes the benefits provided by us. These obligations can be content delivery, security, professional services, support, edge cloud platform services, and others. Accordingly, our revenue is recognized over time, consistent with the pattern of benefit provided to the customer over the term of the agreement.
At times, customers may request changes that either amend, replace, or cancel existing contracts. Judgment is required to determine whether the specific facts and circumstances within the contracts should be accounted for as a separate contract or as a modification.
98
In contracts where there are timing differences between when we transfer a promised good or service to the customer and when the customer pays for that good or service, we have determined our contracts do not include a significant financing component. We have also elected the practical expedient to not measure financing components for any contract where the timing difference is less than one year.
From time to time we enter into arrangements to establish and run private POPs for customers. These arrangements include content delivery services as well as professional services and the provision of hardware. For accounting purposes, we have determined that the provisioning of hardware is an operating lease. We recognize the revenue from these leases monthly on a straight-line basis over the term of the relevant customer agreements.
Nature of products and services
We primarily derive revenue from the sale of services to customers executing contracts in which the standard contract term is one year, although terms may vary by contract. Most of our contracts are non-cancelable over the contractual term. These contracts commit the customer to a minimum monthly level of usage and specify the rate at which the customer must pay for actual usage above the monthly minimum.
Revenue by geography is based on the billing address of the customer. The following table presents our net revenue by geographic region:
Year ended December 31, | ||||||||||||
2019 | 2018 | 2017 | ||||||||||
(in thousands) | ||||||||||||
United States | $ | $ | $ | |||||||||
All other countries | ||||||||||||
Total revenue | $ | $ | $ | |||||||||
The majority of our revenue is derived from enterprise customers, which are defined as customers with revenue in excess of $100,000 over the previous 12-month period. The following table presents our net revenue for enterprise and non-enterprise customers:
Year ended December 31, | ||||||||||||
2019 | 2018 | 2017 | ||||||||||
(in thousands) | ||||||||||||
Enterprise customers | $ | $ | $ | |||||||||
Non-enterprise customers | ||||||||||||
Total revenue | $ | $ | $ | |||||||||
Contract balances
The timing of revenue recognition may differ from the timing of invoicing to customers. We have an unconditional right to consideration when we invoice our customers and record a receivable. We record a contract asset when revenue is recognized prior to invoicing, or a contract liability (deferred revenue) when revenue is recognized subsequent to invoicing.
Deferred revenue includes amounts billed to customers for which revenue has not been recognized and consists of the unearned portions of edge cloud platform usage. Our payment terms and conditions vary by contract type, but our standard terms are that payments are due within 15 days from the date of invoice.
99
The following tables present our contract assets, contract liabilities, and certain information related to these balances as of and for the year ended December 31, 2019:
As of December 31, 2019 | As of January 1, 2019 | ||||||
(in thousands) | |||||||
Contract assets | $ | $ | |||||
Contract liabilities(1) | $ | $ | |||||
(1) The balance as of January 1, 2019, represents contract liabilities as adjusted for Topic 606.
Year ended December 31, 2019 | |||
(in thousands) | |||
Revenue recognized in the period from: | |||
Amounts included in contract liability at the beginning of the period | $ | ||
Remaining performance obligations
As of December 31, 2019, we had $70.7 million of remaining performance obligations, which includes deferred revenue and amounts that will be invoiced and recognized in future periods. The remaining performance obligations are limited only to arrangements that meet the definition of a contract under Topic 606 as of December 31, 2019. In addition to the practical expedient discussed above, we applied the practical expedient giving the optional exemption from disclosing the information about our remaining performance obligations for our service contracts for which the original contract duration is one year or less. The typical contract term is one year, although terms may vary by contract. We expect to recognize 89 % of this balance over the next 12 months and the remainder within the following year.
Costs to obtain a contract
We capitalize incremental costs associated with obtaining customer contracts, specifically for sales commissions. These costs are deferred on our Consolidated Balance Sheets and amortized over the expected period of benefit on a straight-line basis. Based on the nature of our unique technology and services, the rate at which we continually enhance and update our technology, and our historical customer retention, the expected period of benefit is determined to be approximately five years . Amortization is recorded within the sales and marketing line item on the accompanying Consolidated Statements of Operations. The incremental costs associated with obtaining customer contracts, the majority of which are deferred commissions, are included in other assets on the accompanying Consolidated Balance Sheets.
As of December 31, 2019 and January 1, 2019, our costs to obtain contracts were as follows:
As of December 31, 2019 | As of January 1, 2019 | ||||||
(in thousands) | |||||||
Deferred commissions(1) | $ | $ | |||||
__________
(1) |
During the year ended December 31, 2019, we recognized $2.3 million of amortization related to deferred commissions. These costs are recorded within the sales and marketing line item on the accompanying Consolidated Statements of Operations.
100
4. Investments and Fair Value Measurements
Our total cash, cash equivalents and marketable securities consisted of the following:
As of December 31, | ||||||||
2019 | 2018 | |||||||
(in thousands) | ||||||||
Cash and cash equivalents: | ||||||||
Cash | $ | $ | ||||||
Money market funds | ||||||||
U.S. Treasury securities | ||||||||
Commercial paper | ||||||||
Total cash and cash equivalents | $ | $ | ||||||
Marketable securities: | ||||||||
Corporate notes and bonds | $ | $ | ||||||
Commercial paper | ||||||||
U.S. Treasury securities | ||||||||
Asset-backed securities | ||||||||
Total marketable securities | $ | $ | ||||||
Available-for-Sale Investments
The following table summarizes adjusted cost, gross unrealized gains and losses, and fair value related to available-for-sale securities classified as marketable securities on the accompanying Consolidated Balance Sheets as of December 31, 2019 and December 31, 2018:
As of December 31, 2019 | ||||||||||||||||
Amortized Cost | Gross Unrealized Gain | Gross Unrealized Loss | Fair Value | |||||||||||||
(in thousands) | ||||||||||||||||
Corporate notes and bonds | $ | $ | $ | ( | ) | $ | ||||||||||
Commercial paper | ||||||||||||||||
U.S. Treasury securities | ||||||||||||||||
Asset-backed securities | ||||||||||||||||
Total available-for-sale investments | $ | $ | $ | ( | ) | $ | ||||||||||
As of December 31, 2018 | ||||||||||||||||
Amortized Cost | Gross Unrealized Gain | Gross Unrealized Loss | Fair Value | |||||||||||||
(in thousands) | ||||||||||||||||
Corporate notes and bonds | $ | $ | $ | ( | ) | $ | ||||||||||
Commercial paper | ||||||||||||||||
U.S. Treasury securities | ( | ) | ||||||||||||||
Asset-backed securities | ( | ) | ||||||||||||||
Total available-for-sale investments | $ | $ | $ | ( | ) | $ | ||||||||||
The majority of our securities classified as available-for-sale as of December 31, 2019 have contractual maturities of one year or less. Certain securities held and classified as available-for-sale as of December 31, 2019 have contractual maturities
101
greater than one year; however, we do not intend to hold these securities to maturity. Consistent with our intentions to hold the securities for less than 12 months we classify all securities as short-term. As of December 31, 2018, all securities classified as available-for-sale had contractual maturities of one year or less. There were no securities in a continuous loss position for 12 months or longer as of December 31, 2019 and December 31, 2018. Investments are reviewed periodically to identify possible other-than-temporary impairments. No impairment loss has been recorded on the securities included in the tables above, as we believe that the decrease in fair value of these securities is temporary and we expect to recover at least up to the initial cost of investment for these securities.
Fair Value of Financial Instruments
For certain of our financial instruments, including cash held in banks, accounts receivable, and accounts payable, the carrying amounts approximate fair value due to their short maturities, and are therefore excluded from the fair value tables below.
Fair value is defined as the exchange price that would be received for an asset or paid to transfer a liability (an exit price) in the principal or most advantageous market for the asset or liability in an orderly transaction between market participants on the measurement date. There is a three-tier fair value hierarchy, which prioritizes the inputs used in measuring fair value as follows:
Level 1—Observable inputs such as quoted prices in active markets for identical assets or liabilities;
Level 2—Inputs other than Level 1 that are observable, either directly or indirectly, such as quoted prices for similar assets or liabilities, quoted prices in markets that are not active, or other inputs that are observable or can be corroborated by observable market data for substantially the full term of the assets or liabilities; and
Level 3—Unobservable inputs that are supported by little or no market activity, which require management judgment or estimation.
We measure our cash equivalents, marketable securities, and convertible preferred stock warrant liabilities at fair value. We classify our cash equivalents and marketable securities within Level 1 or Level 2 because we value these investments using quoted market prices or alternative pricing sources and models utilizing market observable inputs. The fair value of our Level 1 financial assets is based on quoted market prices of the identical underlying security. The fair value of our Level 2 financial assets is based on inputs that are directly or indirectly observable in the market, including the readily available pricing sources for the identical underlying security that may not be actively traded. Prior to our IPO, we historically classified our convertible preferred stock warrant liabilities as Level 3. The convertible preferred stock warrant liabilities were valued using the Black-Scholes option-pricing model to determine the expected payout to calculate the fair value.
Financial assets and liabilities measured and recorded at fair value on a recurring basis consisted of the following types of instruments:
102
As of December 31, 2019 | ||||||||||||||||
Level 1 | Level 2 | Level 3 | Total | |||||||||||||
(in thousands) | ||||||||||||||||
Cash equivalents: | ||||||||||||||||
Money market funds | $ | $ | $ | $ | ||||||||||||
Commercial paper | ||||||||||||||||
Total cash equivalents | ||||||||||||||||
Marketable securities: | ||||||||||||||||
Corporate notes and bonds | ||||||||||||||||
Commercial paper | ||||||||||||||||
U.S. Treasury securities | ||||||||||||||||
Asset-backed securities | ||||||||||||||||
Total marketable securities | ||||||||||||||||
Restricted cash: | ||||||||||||||||
Money market funds | ||||||||||||||||
Total restricted cash | ||||||||||||||||
Total financial assets | $ | $ | $ | $ | ||||||||||||
As of December 31, 2018 | ||||||||||||||||
Level 1 | Level 2 | Level 3 | Total | |||||||||||||
(in thousands) | ||||||||||||||||
Cash equivalents: | ||||||||||||||||
Money market funds | $ | $ | $ | $ | ||||||||||||
U.S. Treasury securities | ||||||||||||||||
Total cash equivalents | ||||||||||||||||
Marketable securities: | ||||||||||||||||
Corporate notes and bonds | ||||||||||||||||
Commercial paper | ||||||||||||||||
U.S. Treasury securities | ||||||||||||||||
Asset-backed securities | ||||||||||||||||
Total marketable securities | ||||||||||||||||
Total financial assets | $ | $ | $ | $ | ||||||||||||
Convertible preferred stock warrant liabilities | $ | $ | $ | $ | ||||||||||||
Total financial liabilities | $ | $ | $ | $ | ||||||||||||
The convertible preferred warrant liability is related to the warrants to purchase shares of preferred stock. The fair value of the warrant liability was determined based on significant inputs not observable in the market, which represents a Level 3 measurement within the fair value hierarchy. Upon the closing of the IPO, the warrant to purchase shares of preferred stock was converted into a warrant to purchase shares of our common stock. As a result, the warrant liability was remeasured a final time immediately prior to the IPO and reclassified to additional paid in capital within stockholders' equity.
103
The following table sets forth a summary of the changes in the fair value of our Level 3 financial liabilities:
As of December 31, 2019 | ||||
(in thousands) | ||||
Fair value as of December 31, 2018 | $ | |||
Change in fair value of Level 3 financial liabilities | ||||
Conversion of convertible preferred stock warrants into Class B common stock warrants | ( | ) | ||
Fair value as of December 31, 2019 | $ | |||
The gains and losses from re-measurement of Level 3 financial liabilities are recorded as part of other expense, net in the accompanying Consolidated Statements of Operations.
There were no transfers of assets and liabilities measured at fair value between Level 1 and Level 2, or between Level 2 and Level 3, during the years ended December 31, 2019 and 2018.
5. Balance Sheet Information
Allowance for Doubtful Accounts
The activity in the accounts receivable reserves was as follows:
As of December 31, | ||||||||
2019 | 2018 | |||||||
(in thousands) | ||||||||
Beginning balance | $ | $ | ||||||
Additions to the reserves | ||||||||
Write-offs/adjustments | ( | ) | ( | ) | ||||
Ending balance | $ | $ | ||||||
Property and Equipment, Net
Property and equipment, net consisted of the following:
As of December 31, | ||||||||
2019 | 2018 | |||||||
(in thousands) | ||||||||
Computer and networking equipment | $ | $ | ||||||
Leasehold improvements | ||||||||
Furniture and fixtures | ||||||||
Office equipment | ||||||||
Internal-use software | ||||||||
Property and equipment, gross | ||||||||
Accumulated depreciation and amortization | ( | ) | ( | ) | ||||
Property and equipment, net | $ | $ | ||||||
Depreciation and amortization expense on property and equipment for the years ended December 31, 2019 and 2018 was approximately $16.4 million and $13.3 million, respectively. Included in these amounts was amortization expense for capitalized internal-use software costs of approximately $2.2 million and $1.8 million for the years ended December 31, 2019
104
and 2018, respectively. As of December 31, 2019 and December 31, 2018, the unamortized balance of capitalized internal-use software costs on our Consolidated Balance Sheets was approximately $8.5 million and $5.4 million, respectively.
Accrued Expenses
Accrued expenses consisted of the following:
As of December 31, | ||||||||
2019 | 2018 | |||||||
(in thousands) | ||||||||
Accrued compensation and related benefits | ||||||||
Sales and use tax payable | ||||||||
Accrued colocation and bandwidth costs | ||||||||
Other accrued liabilities | ||||||||
Total accrued expenses | $ | $ | ||||||
Other Current Liabilities
Other current liabilities consisted of the following:
As of December 31, | ||||||||
2019 | 2018 | |||||||
(in thousands) | ||||||||
Liability for early-exercised stock options (see Note 11) | $ | $ | ||||||
Deferred revenue | ||||||||
Accrued computer and networking equipment | ||||||||
Other current liabilities | ||||||||
Total other current liabilities | $ | $ | ||||||
Other Long-Term Liabilities
Other long-term liabilities consisted of the following:
As of December 31, | ||||||||
2019 | 2018 | |||||||
(in thousands) | ||||||||
Deferred rent | $ | $ | ||||||
Other long-term liabilities | ||||||||
Total other long-term liabilities | $ | $ | ||||||
Accumulated Other Comprehensive Loss
The following table summarizes the changes in accumulated other comprehensive loss, which is reported as a component of stockholders’ equity (deficit):
105
Foreign Currency Translation | Available-for-sale investments | Accumulated Other Comprehensive Income (Loss) | ||||||||||
(in thousands) | ||||||||||||
Balance at January 1, 2017 | $ | ( | ) | $ | ( | ) | $ | ( | ) | |||
Other comprehensive income (loss) | ( | ) | ||||||||||
Balance at December 31, 2017 | ( | ) | ( | ) | ( | ) | ||||||
Other comprehensive income (loss) | ( | ) | ( | ) | ( | ) | ||||||
Balance at December 31, 2018 | ( | ) | ( | ) | ( | ) | ||||||
Other comprehensive income (loss) | ||||||||||||
Balance at December 31, 2019 | $ | $ | ||||||||||
6. Goodwill and Intangible Assets
The changes in the carrying amount of goodwill for the years ended December 31, 2019 and 2018 are as follows:
Year ended December 31, 2019 | ||||||||
2019 | 2018 | |||||||
(in thousands) | ||||||||
Balance, beginning of period | $ | $ | ||||||
Foreign currency translation | ( | ) | ||||||
Balance, end of period | $ | $ | ||||||
Intangible assets are comprised of internet protocol address costs and domain name costs that are subject to amortization. During the year ended December 31, 2019, we purchased additional internet protocol addresses and domain names for a gross carrying value of $0.6 million and $38.8 thousand, respectively. As of December 31, 2019 and December 31, 2018, our intangible assets consisted of the following:
As of December 31, 2019 | As of December 31, 2018 | |||||||||||||||||||||||
Gross carrying value | Accumulated amortization | Net carrying value | Gross carrying value | Accumulated amortization | Net carrying value | |||||||||||||||||||
(in thousands) | ||||||||||||||||||||||||
Finite-lived intangible assets | ||||||||||||||||||||||||
Internet protocol addresses | $ | $ | ( | ) | $ | $ | $ | ( | ) | $ | ||||||||||||||
Domain name | ||||||||||||||||||||||||
Total finite-lived intangible assets | $ | $ | ( | ) | $ | $ | $ | ( | ) | $ | ||||||||||||||
106
As of December 31, 2019 | |||
(in thousands) | |||
2020 | |||
2021 | |||
2022 | |||
2023 | |||
2024 | |||
Thereafter | |||
Total | $ | ||
We perform tests for impairment of goodwill and long-lived assets on an annual basis as of October 31 or more frequently if events or changes in circumstances indicate that the long-lived assets might be impaired. We did not record any impairment charges during the years ended December 31, 2019 and 2018.
Aggregate expense related to amortization of intangible assets was $0.1 million for both the years ended December 31, 2019 and 2018.
7. Debt Instruments
Loan and Security Agreement
In July 2013, we entered into a Loan and Security Agreement (the "Facility") with a bank related to an equipment facility providing us with an equipment line for advances of up to $2.5 million. The Facility was amended in September 2013 to increase the equipment line for advances up to $5.0 million (as amended, the "Prior Loan Agreement"), November 2014 to increase the equipment line for advances up to $15.0 million, and August 2016 to increase the equipment line for advances up to $17.5 million and allowed for reborrowing of amounts repaid under the equipment loan (as amended, the "Senior Loan Agreement"). The Senior Loan Agreement was additionally amended in February 2017 and March 2017, which extended the draw period to January 2018.
In November 2017, we entered into a Second Amended and Restated Loan and Security Agreement, which amended the Senior Loan Agreement and increased the additional equipment line for advances up to an aggregate of $30.0 million through November 2018. As of December 31, 2018, $29.2 million had been drawn on this Second Amended and Restated Loan and Security Agreement. The interest rate associated with each advance under the Senior Loan Agreement was 1.75 % above the floating prime rate. Beginning November 2018, we were obligated to make equal monthly payments of principal plus interest with repayment no later than November 1, 2021.
On November 4, 2019, the outstanding loan of $20.0 million, which was due and payable on November 1, 2021, was paid in full, in accordance with the terms of the agreement.
107
Capital Lease Agreement
In June 2017, we entered into a Capital Lease Agreement with an equipment provider for $5.0 million in network equipment, at an annual interest rate of 5.24 % over a term of four years . In March 2018, we entered into an additional agreement with the equipment provider for $0.5 million in network equipment at an annual interest rate of 5.38 % over a term of four years . In February 2019 and March 2019, we entered into additional agreements with the equipment provider for $2.9 million and $1.3 million, respectively, in network equipment, at an annual interest rate of 5.38 % over terms of three years . In August 2019, we entered into an additional agreement with the equipment provider for $1.3 million in network equipment at an annual interest rate of 6.33 % over a term of three years. In November 2019, we entered into an additional capital lease agreement with the equipment provider for $2.2 million in network equipment at an annual interest rate of 5.69 % over a term of three years . In December 2019, we entered into an additional capital lease agreement with the equipment provider for $1.0 million in network equipment at an annual interest rate of 5.42 % over a term of three years . The agreement provides for a bargain purchase price at the end of the term. The amortization of leased assets is included in depreciation and amortization expense. The additional agreements incorporate the same terms and conditions as those under the Capital Lease Agreement entered into in June 2017. As of December 31, 2019 and December 31, 2018, $9.5 million and $3.5 million was outstanding under the Capital Lease Agreement.
Credit Facility
In December 2018, we entered into a Second Lien Credit Agreement under which were permitted to borrow up to $30.0 million ("Credit Facility"). As part of this agreement, the Second Amendment to Amended and Restated Loan was amended to allow for this additional indebtedness. The advances under the Credit Facility were subject to interest at a rate of prime plus 4.25 %. As of December 31, 2018, $20.0 million had been drawn on this Credit Facility. On July 8, 2019, the $20.0 million outstanding loan, which was due and payable on December 24, 2021, was paid in full, in accordance with the terms of the Credit Facility. Upon payment, the Credit Facility was closed.
Cash Collateralized Revolving Credit Agreement ("Revolving Credit Agreement")
In November 2019, we entered into a Revolving Credit Agreement for an aggregate commitment amount of $70.0 million and a maturity date of November 3, 2022. The amount of borrowings available under the Revolving Credit Agreement at any time are collateralized by our cash.
The interest rate associated with each advance under the Revolving Credit Agreement is equal to the sum of LIBOR for the applicable interest period plus 1.50 %, which is a per annum rate based on outstanding borrowings. The commitment fee is 0.20 % per annum based on the average daily unused amount of the commitment amount. Interest payments on outstanding borrowings are due on the last day of each interest period and payments for the commitment fee are due at the end of each calendar quarter. As of December 31, 2019, $20.3 million had been drawn on the Revolving Credit Agreement.
108
The following table reflects the carrying values of the debt agreements as of December 31, 2019 and December 31, 2018:
As of December 31, | ||||||||
2019 | 2018 | |||||||
(in thousands) | ||||||||
Liability component: | ||||||||
Principal amount—Cash Collateralized Revolving Credit Agreement | $ | $ | ||||||
Less: unamortized debt issuance costs | ( | ) | ||||||
Less: current portion of long-term debt | ||||||||
Long-term debt, less current portion—Cash Collateralized Revolving Credit Agreement | $ | $ | ||||||
Principal amount—Second Amendment to Amended and Restated Loan and Security Agreement | ||||||||
Less: unamortized debt issuance costs | ( | ) | ||||||
Less: current portion of long-term debt | ( | ) | ||||||
Long-term debt, less current portion—Second Amendment to Amended and Restated Loan and Security Agreement | $ | $ | ||||||
Principal amount—Capital Lease Agreement | ||||||||
Less: current portion of long-term debt | ( | ) | ( | ) | ||||
Long-term debt, less current portion—Capital Lease Agreement | $ | $ | ||||||
Total long-term debt, less current portion | $ | $ | ||||||
Contractual future repayments for the above as of December 31, 2019 are as follows:
Principal | Interest | Total | ||||||||||
(in thousands) | ||||||||||||
2020 | $ | $ | $ | |||||||||
2021 | ||||||||||||
2022 | ||||||||||||
2023 | ||||||||||||
Total | $ | $ | $ | |||||||||
Interest expense related to debt for the years ended December 31, 2019, 2018, and 2017 was $5.2 million, $1.9 million, and $1.1 million, respectively.
109
8. Common Stock Warrant Liabilities
We issued convertible preferred stock warrants in connection with debt agreements entered into on various dates as described in Note 7, "Debt Instruments". Immediately upon closing of the IPO, our warrants to purchase convertible preferred stock were automatically converted to warrants to purchase an equal number of shares of our Class B common stock. As a result, the warrant liability was remeasured a final time, immediately prior to the closing of the IPO, and reclassified to additional paid in capital within stockholders' equity. Changes in the fair value were recorded within other expense, net on the accompanying Consolidated Statements of Operations.
The fair value of the warrants as of May 17, 2019 was estimated using the following assumptions:
Series B | Series C | Series D | Series F | Total | ||||||||||||||||
Fair value (in thousands) | $ | $ | $ | $ | $ | |||||||||||||||
Expected remaining term (in years) | ||||||||||||||||||||
Risk-free interest rate | % | % | % | % | ||||||||||||||||
Expected volatility | % | % | % | % | ||||||||||||||||
Dividend yield | ||||||||||||||||||||
The fair value of the warrants as of December 31, 2018 was estimated using the following assumptions:
Series B | Series C | Series D | Series F | Total | ||||||||||||||||
Fair value (in thousands) | $ | $ | $ | $ | $ | |||||||||||||||
Expected remaining term (in years) | ||||||||||||||||||||
Risk-free interest rate | % | % | % | % | ||||||||||||||||
Expected volatility | % | % | % | % | ||||||||||||||||
Dividend yield | ||||||||||||||||||||
In the year ended December 31, 2019, Class B common stock warrants were exercised under the cashless exercise method pursuant to the corresponding warrant agreements. As a result of such exercises, we issued 224,102 shares of our Class B common stock in the year ended December 31, 2019.
110
9. Commitments and Contingencies
Operating Lease Commitments
We lease our facilities under non-cancelable operating leases. These operating leases expire at various dates through July 2027 and generally require the payment of real estate taxes, insurance, maintenance, and operating costs.
The minimum aggregate future obligations under non-cancelable leases as of December 31, 2019 are as follows:
Gross Lease Commitments | Sublease Income | Net Lease Commitment | |||||||||
(in thousands) | |||||||||||
2020 | $ | $ | ( | ) | $ | ||||||
2021 | |||||||||||
2022 | |||||||||||
2023 | |||||||||||
2024 | |||||||||||
Thereafter | |||||||||||
Total | $ | $ | ( | ) | $ | ||||||
We recognize rent expense on a straight-line basis over the lease period and have accrued for rent expense incurred but not paid. Rent expense for the years ended December 31, 2019 and 2018 was $7.2 million and $6.9 million, respectively. During the year ended December 31, 2019 and 2018, we had sublease agreements with tenants of various properties vacated by us. The amount paid to us by these sublease tenants was approximately $1.2 million and $0.9 million during the years ended December 31, 2019 and 2018, respectively.
Purchase Commitments
As of December 31, 2019, we had long-term commitments for cost of revenue related agreements (i.e., bandwidth usage, colocation, peering and other managed services with various networks, internet service providers ("ISPs") and other third-party vendors), and various non-cancelable software as a service ("SaaS") agreements. Additionally, as of December 31, 2019, we had entered into purchase orders with various vendors. There have been no material changes to our purchase commitments related to SaaS agreements as compared to those described in the Prospectus. The minimum future purchase commitments as of December 31, 2019 were as follows:
Cost of Revenue Commitments | SaaS Agreements | Total Purchase Commitments | ||||||||||
(in thousands) | ||||||||||||
2020 | $ | $ | ||||||||||
2021 | ||||||||||||
2022 | ||||||||||||
2023 | ||||||||||||
2024 | ||||||||||||
Total | $ | $ | $ | |||||||||
111
Legal Matters
We are party to various disputes that management considers routine and incidental to its business. Management does not expect the results of any of these routine actions to have a material effect on our business, results of operations, financial condition, or cash flows.
Indemnification
We enter into standard indemnification agreements in the ordinary course of business. Pursuant to these agreements, we agree to indemnify, hold harmless, and reimburse the indemnified party for losses suffered or incurred by the indemnified party, generally our business partners or customers, in connection with our provision of its services. Generally, these obligations are limited to claims relating to infringement of a patent, copyright, or other intellectual property right, breach of our security or data protection obligations, or our negligence, willful misconduct, or violation of law. Subject to applicable statutes of limitation, the term of these indemnification agreements is generally for the duration of the agreement. The maximum potential amount of future payments we could be required to make under these indemnification agreements is unlimited; however, we carry insurance that covers certain third-party claims relating to our services and could limit our exposure in that respect.
We have agreed to indemnify each of our officers and directors during his or her lifetime for certain events or occurrences that happen by reason of the fact that the officer or director is, was, or has agreed to serve as an officer or director of the Company. We have director and officer insurance policies that may limit our exposure and may enable us to recover a portion of certain future amounts paid.
To date, we have not encountered material costs as a result of such indemnification obligations and have not accrued any related liabilities in our financial statements. In assessing whether to establish an accrual, we consider such factors as the degree of probability of an unfavorable outcome and the ability to make a reasonable estimate of the amount of loss.
10. Convertible Preferred Stock
As of December 31, 2018, we had seven outstanding series of Preferred Stock ("Series Preferred") each with a par value of $0.00002 per share, which were convertible at the option of the holder. The Series Preferred was classified as temporary equity on the accompanying Consolidated Balance Sheets as of December 31, 2018. Immediately upon closing of the IPO, our convertible preferred stock was automatically converted to shares of our Class B common stock. We had no convertible preferred stock issued or outstanding as of December 31, 2019.
A summary of the Preferred Stock outstanding as of December 31, 2018 and other related information is as follows:
As of December 31, 2018 | ||||||||||||||
Shares Authorized | Shares Issued and Outstanding | Net Carrying Amount | Liquidation Preference | |||||||||||
(in thousands except share data) | ||||||||||||||
Series Seed Preferred Stock | $ | $ | ||||||||||||
Series A Preferred Stock | ||||||||||||||
Series B Preferred Stock | ||||||||||||||
Series C Preferred Stock | ||||||||||||||
Series D Preferred Stock | ||||||||||||||
Series E Preferred Stock | ||||||||||||||
Series F Preferred Stock | ||||||||||||||
Total | $ | $ | ||||||||||||
112
11. Stockholders' Equity
Common Stock
Our Amended and Restated Certificate of Incorporation, as amended and restated in May 2019, authorizes the issuance of 1,000,000,000 shares of Class A common stock and 94,129,050 shares of Class B common stock, each at a par value per share of $0.00002 . Holders of Class A common stock are entitled to one vote per share and holders of Class B common stock are entitled to 10 votes per share. As of December 31, 2019 and December 31, 2018, 33,863,021 and 25,026,001 shares of Class B common stock were issued and outstanding, respectively. As of December 31, 2019, 60,954,694 shares of Class A common stock were issued and outstanding. There were no shares of Class A common stock issued and outstanding as of December 31, 2018.
Preferred Stock
Our Amended and Restated Certificate of Incorporation, as amended and restated in May 2019, authorizes the issuance of 10,000,000 shares of Preferred Stock, at a par value per share of $0.00002 , with rights and preferences, including voting rights, designated from time to time by the Board of Directors (the "Board"). As of December 31, 2019, there were no shares of preferred stock issued or outstanding.
Equity Incentive Plans
In March 2011, our stockholders approved the Fastly, Inc. 2011 Equity Incentive Plan ("2011 Plan"). The 2011 Plan was amended in February 2013, May 2014, July 2015, December 2016, April 2017, and June 2018. The 2011 Plan allows for the issuance of incentive stock options, nonstatutory stock options, stock appreciation rights, restricted stock awards, and restricted stock unit awards ("RSUs") to employees, directors, and consultants of the Company. There were 23,578,923 shares of Class B common stock reserved for issuance under the 2011 Plan as of December 31, 2019. There were 21,689,410 shares of common stock reserved for issuance under the 2011 Plan as of December 31, 2018. Options granted under the 2011 Plan generally expire within 10 years from the date of grant and generally vest over four years , at the rate of 25 % on the first anniversary of the date of grant and ratably on a monthly basis over the remaining 36-month period thereafter based on continued service. Options granted under our 2011 Plan are exercisable for shares of our Class B common stock. As of December 31, 2019, there were no shares of Class B common stock available for issuance pursuant to future grants under the 2011 Plan. As of December 31, 2018, there were 609,804 shares of common stock available for issuance pursuant to future grants under the 2011 Plan.
In May 2019, the Board adopted our 2019 Equity Incentive Plan (the "2019 Plan"), and our stockholders approved the 2019 Plan. The 2019 Plan allows for the issuance of incentive stock options, nonstatutory stock options, stock appreciation rights, restricted stock awards, RSUs, performance-based stock awards, and other forms of equity compensation, which are collectively referred to as stock awards. Additionally, the 2019 Plan provides for the grant of performance cash awards. Incentive stock options may be granted only to employees. All other awards may be granted to employees, including officers, and to non-employee directors and consultants. Options granted under the 2019 Plan generally expire within 10 years from the date of grant and generally vest over four years , at the rate of 25 % on the first anniversary of the date of grant and ratably on a monthly basis over the remaining 36-month period thereafter based on continued service. Options are exercisable for shares of our Common Stock. RSUs granted under the 2019 Plan generally vest over four years , at the rate of 25 % on the first anniversary of the vest date and ratably on a quarterly basis over the remaining 36 -month period thereafter based on continued service. There were 14,400,000 shares of Class A common stock reserved for issuance under the 2019 Plan as of December 31, 2019. There were 12,367,582 shares of Class A common stock available for issuance under the 2019 Plan as of December 31, 2019. No further shares will be issued under the 2011 Plan following the effectiveness of the 2019 Plan.
In May 2019, the Board approved the Employee Stock Purchase Plan ("ESPP"), which was approved by our stockholders in May 2019. The ESPP allows eligible employees to purchase shares of our Class A common stock through payroll deductions of up to 15 % of their eligible compensation, subject to a maximum of $25,000 per calendar year. Shares reserved for issuance under the ESPP include 2,500,000 shares of Class A common stock. The ESPP provides for six-month offering periods, commencing in May and November of each year. At the end of each offering period employees are able to purchase shares at 85 % of the lower of the fair market value of our Class A common stock on the first trading day of the offering period or on the last day of the offering period.
113
Stock Option Activity
The following table summarizes stock option activity during the year ended December 31, 2019:
Number of Shares | Weighted-Average Exercise Price | Weighted-Average Remaining Contractual Term | Aggregate Intrinsic Value | ||||||||||
(in thousands) | (in years) | (in thousands) | |||||||||||
Outstanding at January 1, 2017 | $ | $ | |||||||||||
Granted | |||||||||||||
Exercised | ( | ) | |||||||||||
Cancelled/forfeited | ( | ) | |||||||||||
Outstanding at December 31, 2017 | $ | ||||||||||||
Granted | |||||||||||||
Exercised | ( | ) | |||||||||||
Cancelled/forfeited | ( | ) | |||||||||||
Outstanding at December 31, 2018 | $ | ||||||||||||
Granted | |||||||||||||
Exercised | ( | ) | |||||||||||
Cancelled/forfeited | ( | ) | |||||||||||
Outstanding at December 31, 2019 | $ | $ | |||||||||||
Vested and exercisable at December 31, 2019 | $ | $ | |||||||||||
The total pre-tax intrinsic value of options exercised during the years ended December 31, 2019, 2018, and 2017 was $32.6 million, $3.0 million, and $0.7 million, respectively.
The total grant date fair value of employee options vested for the years ended December 31, 2019, 2018, 2017 was $6.1 million, $3.6 million, and $2.9 million, respectively.
The weighted-average grant date fair value for options granted to employees during the years ended December 31, 2019, 2018, and 2017 was $5.77 , $1.78 , and $1.56 , respectively.
Early Exercise of Stock Options
Certain stock options granted by us are exercisable at the date of grant, with unvested shares subject to repurchase by us in the event of voluntary or involuntary termination of employment of the stockholder. Such exercises are recorded as a liability on the accompanying Consolidated Balance Sheets and reclassified into equity as the options vest. As of December 31, 2019, December 31, 2018, and December 31, 2017, a total of 199,895 , 244,658 , and 137,831 shares of Class B Common Stock were subject to repurchase by us at the lower of (i) the fair market value of such shares on the date of repurchase, or (ii) the original exercise price of such shares. The corresponding exercise value of approximately $0.9 million, $1.0 million, and $0.3 million as of December 31, 2019, December 31, 2018, and December 31, 2017, respectively, is recorded in other current liabilities and other liabilities on the accompanying Consolidated Balance Sheets.
114
The activity of non-vested shares as a result of early exercise of options granted to employees and non-employees, is as follows:
Year ended December 31, | |||||||||
2019 | 2018 | 2017 | |||||||
(in thousands) | |||||||||
Beginning balance | |||||||||
Early exercise of options | |||||||||
Vested | ( | ) | ( | ) | ( | ) | |||
Repurchased | ( | ) | |||||||
Ending balance | |||||||||
Employee Stock Options
We estimate the fair value of stock options on the date of grant using the Black-Scholes option-pricing model. Each of the Black-Scholes inputs is subjective and generally requires significant judgments to determine. We estimated the fair value of stock option awards during the years ended December 31, 2019, 2018, and 2017 on the date of the grant using the Black-Scholes option pricing model with the following weighted-average assumptions:
Year ended December 31, | |||||||
2019 | 2018 | 2017 | |||||
Fair value of common stock | $8.24 - $22.70 | $3.86 - $8.16 | $2.98 - $3.58 | ||||
Expected term (in years) | |||||||
Risk-free interest rate | 1.55% - 2.5% | 2.62% - 3.0% | 1.9% - 2.1% | ||||
Expected volatility | 39.1% - 42.7% | 40.2% - 41.5% | 41% - 45% | ||||
Dividend yield | % | ||||||
During the years ended December 31, 2019 and 2018, and 2017, we recognized stock-based compensation expense from stock options of approximately $7.9 million, $4.1 million, and $2.8 million, respectively. There were no vested RSUs as of December 31, 2019, 2018 and 2017.
As of December 31, 2019, total unrecognized stock-based compensation cost related to outstanding unvested stock options that are expected to vest was $18.2 million. This unrecognized stock-based compensation cost is expected to be recognized over a weighted-average period of approximately 2.8 years.
RSUs
We began granting RSUs under the 2019 Plan during the year ended December 31, 2019. The fair value of RSUs is based on the grant date fair value and is expensed on a straight-line basis over the applicable vesting period. RSUs typically vest over four years , at the rate of 25 % on the first anniversary of the vest date and ratably on a quarterly basis over the remaining 36-month period thereafter, based on continued service. The following table summarizes RSU activity during the year ended December 31, 2019:
Number of Shares | Weighted-Average Grant Date Fair Value Per Share | ||||||
(in thousands) | |||||||
Nonvested RSUs as of December 31, 2018 | $ | ||||||
Granted | |||||||
Cancelled/forfeited | ( | ) | |||||
Nonvested RSUs as of December 31, 2019 | $ | ||||||
115
During the year ended December 31, 2019, we recognized stock-based compensation expense related to RSUs of $2.2 million. There was no stock-based compensation expense recognized related to RSUs during the year ended December 31, 2018 or December 31, 2017.
As of December 31, 2019, total unrecognized stock-based compensation cost related to non-vested RSUs was $30.0 million. This unrecognized stock-based compensation cost is expected to be recognized over a weighted-average period of approximately 3.6 years.
ESPP
The ESPP allows eligible employees to purchase shares of our common stock through payroll deductions of up to 15 % of their eligible compensation. The ESPP provides for six-month offering periods, commencing in May and November of each year.
We estimate the fair value of shares to be issued under the ESPP on the first day of the offering period using the Black-Scholes valuation model. The inputs to the Black-Scholes option pricing model are our stock price on the first date of the offering period, the risk-free interest rate, the estimated volatility of our stock price over the term of the offering period, the expected term of the offering period and the expected dividend rate. Stock-based compensation expense related to the ESPP is recognized on a straight-line basis over the offering period. Forfeitures are recognized as they occur.
We estimated the fair value of shares granted under the ESPP on the first date of the offering period using the Black-Scholes option pricing model with the following assumptions:
Year ended December 31, | ||||
2019 | 2018 | |||
Fair value of common stock | $6.02 - $6.92 | N/A | ||
Expected term (in years) | 0.47-0.50 | N/A | ||
Risk-free interest rate | 1.59% - 2.35% | N/A | ||
Expected volatility | 36% - 43% | N/A | ||
Dividend yield | N/A | |||
During the year ended December 31, 2019, we withheld $5.5 million in contributions from employees, respectively, and recognized $2.5 million in stock-based compensation expense related to the ESPP, respectively. During the year ended December 31, 2019, 305,194 shares of our Class A common stock were purchased under the 2019 ESPP. No contributions were withheld, and no stock-based compensation expense was recognized related to the ESPP in the year ended December 31, 2018 or December 31, 2017. No common stock was issued under the ESPP in the year ended December 31, 2018 or December 31, 2017.
Stock-based Compensation Expense
The following table summarizes the components of total stock-based compensation expense included in the accompanying Consolidated Statements of Operations:
Year ended December 31, | ||||||||||||
2019 | 2018 | 2017 | ||||||||||
(in thousands) | ||||||||||||
Stock-based compensation expense by caption: | ||||||||||||
Cost of revenue | $ | $ | $ | |||||||||
Research and development | ||||||||||||
Sales and marketing | ||||||||||||
General and administrative | ||||||||||||
Total | $ | $ | $ | |||||||||
116
12. Net Loss Per Share Attributable to Common Stockholders
We compute net loss per share using the two-class method required for multiple classes of common stock and participating securities. The rights of the holders of the Class A common stock and Class B common stock are identical, except with respect to voting and conversion. Accordingly, the Class A common stock and Class B common stock share equally in our net losses. Prior to the IPO, our participating securities also included convertible preferred stock. The holders of convertible preferred stock did not have a contractual obligation to share in our losses, and as a result net losses were not allocated to these participating securities.
The following table sets forth the calculation of basic and diluted net loss per share attributable to common stockholders during the periods presented. The shares issued in the IPO, the shares issued pursuant to the exercise by the underwriters of an option to purchase additional shares, and the shares of Class A and Class B common stock issued upon conversion of the outstanding shares of convertible preferred stock in the IPO are included in the table below weighted for the period outstanding:
Year ended December 31, | |||||||||||||||||||
2019 | 2018 | 2017 | |||||||||||||||||
Class A(1) | Class B(2) | Class A | Class B(2) | Class A | Class B(2) | ||||||||||||||
(in thousands, except per share amounts) | |||||||||||||||||||
Net loss attributable to common stockholders | $ | ( | ) | $ | ( | ) | N/A | $ | ( | ) | N/A | $ | ( | ) | |||||
Weighted-average shares used in computing net loss per share attributable to common stockholders, basic and diluted | N/A | N/A | |||||||||||||||||
Net loss per share attributable to common stockholders, basic and diluted | $ | ( | ) | $ | ( | ) | N/A | $ | ( | ) | N/A | $ | ( | ) | |||||
__________
(1) | Class A common stock includes the issuance of |
(2) |
Since we were in a loss position for the periods presented, basic net loss per share is the same as diluted net loss per share, as the inclusion of all potential common shares outstanding would have been anti-dilutive. The potential shares of common stock that were excluded from the computation of diluted net loss per share attributable to common stockholders for the period presented because including them would have been antidilutive are as follows:
Number of Shares | ||||||
As of December 31, | ||||||
2019 | 2018 | |||||
(in thousands) | ||||||
Convertible preferred stock | ||||||
Stock options | ||||||
RSUs | ||||||
Early exercised stock options | ||||||
Convertible common stock warrants | — | |||||
Convertible preferred stock warrants | — | |||||
Shares issuable pursuant to the ESPP | ||||||
Total | ||||||
117
13. Income Taxes
Loss before income taxes includes the following components:
Year ended December 31, | ||||||||||||
2019 | 2018 | 2017 | ||||||||||
(in thousands) | ||||||||||||
United States | $ | ( | ) | $ | ( | ) | $ | ( | ) | |||
Foreign | ( | ) | ( | ) | ( | ) | ||||||
Loss before income taxes | $ | ( | ) | $ | (30,935 | ) | $ | ( | ) | |||
The expense for income taxes consists of the following:
Year ended December 31, | ||||||||||||
2019 | 2018 | 2017 | ||||||||||
(in thousands) | ||||||||||||
Current tax provision (benefit): | ||||||||||||
Federal | $ | $ | $ | |||||||||
State | ||||||||||||
Foreign | ||||||||||||
Deferred tax provision (benefit): | ||||||||||||
Federal | ||||||||||||
State | ||||||||||||
Foreign | ||||||||||||
Total tax expense | $ | $ | $ | |||||||||
Reconciliation between our effective tax rate on income from continuing operations and the U.S. federal statutory rate is as follows:
Year ended December 31, | |||||||||
2019 | 2018 | 2017 | |||||||
Provision at federal statutory tax rate | % | % | % | ||||||
State taxes, net of federal tax impact | % | % | ( | )% | |||||
Change in valuation allowance | ( | )% | ( | )% | % | ||||
Foreign tax rate differential | ( | )% | ( | )% | ( | )% | |||
Federal statutory tax rate change | % | % | ( | )% | |||||
Other | ( | )% | ( | )% | ( | )% | |||
Net deferred tax (liabilities) assets | ( | )% | ( | )% | ( | )% | |||
118
Our deferred tax assets and liabilities were as follows:
Year ended December 31, | ||||||||
2019 | 2018 | |||||||
(in thousands) | ||||||||
Reserves and accruals | $ | $ | ||||||
Stock-based compensation | ||||||||
Net operating losses | ||||||||
Other | ||||||||
Amortization | ||||||||
Deferred tax assets | ||||||||
Depreciation | ( | ) | ( | ) | ||||
State tax | ( | ) | ( | ) | ||||
Deferred tax liabilities | ( | ) | ( | ) | ||||
Valuation allowance | ( | ) | ( | ) | ||||
Net deferred tax (liabilities) assets | $ | $ | ||||||
As of December 31, 2019, we had net operating loss carryforwards for U.S. federal income tax purposes of approximately $106.0 million and for state income tax purposes of approximately $100.0 million, respectively. The federal net operating loss carryforwards, if not utilized, will begin to expire in 2031. The state net operating loss carryforward, if not utilized, will begin to expire on various dates starting in 2021.
Based on all available evidence on a jurisdictional basis the Company believes that it is more likely than not that its deferred tax assets will not be utilized and has recorded a full valuation allowance against its net deferred tax assets. The Company assesses on a periodic basis the likelihood that it will be able to recover its deferred tax assets. The Company considers all available evidence, both positive and negative, including historical losses, the Company determined that it is more likely than not that the net deferred tax assets will not be fully realizable for the years ended December 31, 2019 and 2018.
Utilization of the net operating loss carryforwards may be subject to a substantial annual limitation due to the ownership change limitations provided by the Internal Revenue Code of 1986, as amended (the "Code") and similar state provisions. A detailed analysis to determine whether an ownership change under Section 382 of the Code has occurred has been performed, and as a result, there is no limitation on the use of net operating loss carryforwards attributable to periods before the change.
As of December 31, 2019 and 2018, there were no undistributed earnings of non-U.S. subsidiaries. No provision for U.S. income and foreign withholding taxes has been made for these permanently reinvested foreign earnings because it is management’s intention to permanently reinvest such undistributed earnings outside the United States.
As of December 31, 2019 and 2018, we had no uncertain tax positions. Our policy is to recognize interest and penalties associated with uncertain tax benefits as part of the income tax provision and include accrued interest and penalties with the related income tax liability on its consolidated balance sheet. To date, we have not recognized any interest and penalties in its consolidated statements of operations, nor has it accrued for or made payments for interest and penalties. We have no unrecognized tax benefits as of December 31, 2019 and 2018.
Generally, in the U.S. federal and state taxing jurisdictions, tax periods in which certain loss and credit carryovers are generated remain open for audit until such time as the limitation period ends for the year in which such losses or credits are utilized.
119
14. Information About Revenue and Geographic Areas
We consider operating segments to be components of the Company in which separate financial information is available and is evaluated regularly by our Chief Operating Decision Maker ("CODM") in deciding how to allocate resources and in assessing performance. Our CODM is the Chief Executive Officer ("CEO"). The CEO reviews financial information presented on a consolidated basis, accompanied by information about revenue, customer size, and industry vertical for purposes of allocating resources and evaluating financial performance.
We have determined that we operate under one business activity with no segment managers who are held accountable for operations, operating results, or plans for levels or components below the consolidated unit level. Accordingly, we have determined that we have a single reporting segment and operating unit structure.
Revenue
Revenue by geography is based on the billing address of the customer. Refer to Note 3, "Revenue" for more information on net revenue by geographic region.
Long-Lived Assets
The following table presents long-lived assets by geographic region:
As of December 31, | As of December 31, | |||||||
2019 | 2018 | |||||||
(in thousands) | ||||||||
United States | $ | $ | ||||||
All other countries | ||||||||
Total long-lived assets | $ | $ | ||||||
15. Related Party Transactions
In July 2016, a stockholder borrowed approximately $0.1 million to exercise stock options for 53,125 shares of common stock pursuant to a promissory note from the stockholder. The note bears interest at a rate of 1.77 %. In June 2019, the promissory note was repaid in full. Prior to repayment, for the purposes of the financial statements, the shares were not reported as exercised, issued, or outstanding. This stockholder is not one of our executive officers or directors. Approximately $75,000 was outstanding as of December 31, 2018. There was no outstanding balance as of December 31, 2019.
120
16. Subsequent Events
Capital Lease Agreement
On January 24, 2020, we entered into an additional capital lease agreement with the equipment provider for $1.0 million in network equipment at an annual interest rate of 5.42 % over a term of three years . The agreement provides for a bargain purchase price at the end of the term. The amortization of leased assets is included in depreciation and amortization expense. Please refer to Note 7, "Debt Instruments", for more information on our capital lease agreements.
Executive Leadership Change
On February 18, 2020, Artur Bergman ceased to be our Chief Executive Officer and was appointed as our Chief Architect and Executive Chairperson. Mr. Bergman will continue to serve as a member of our Board of Directors, and was appointed as Chairperson of the Board on February 18, 2020.
In connection with Mr. Bergman's appointment as Chief Architect and Executive Chairperson, we and Mr. Bergman entered into a Modification to his Offer Letter Agreement (the “Bergman Employment Agreement”). Under the Bergman Employment Agreement, Mr. Bergman will receive an initial annual base salary of $35,568 . Starting as of January 1, 2021, Mr. Bergman’s base salary will be increased to an annual rate of $504,000 per year. However, on or before the last day of November, he may make an irrevocable election to reduce his salary for the following year (but in any case no lower than the applicable minimum wage), and instead receive restricted stock units covering shares of the Company’s Class A Common Stock with a value based on the amount of such reduction (each, an “Annual RSU”). Any Annual RSU will be granted in February of the applicable year and the number of RSUs subject to each Annual RSU will be based on the average trading price of the Company’s Class A common stock in January of that year. Each Annual RSU will vest in four equal quarterly installments following the date of grant commencing on February 15th and quarterly thereafter (May, August, and November), in each case subject to Mr. Bergman’s continued service with the Company.
Pursuant to the Bergman Employment Agreement, we granted Mr. Bergman the following restricted stock unit awards to acquire up to an aggregate of 170,009 shares of our Class A common stock (each, an “RSU”) under our 2019 Equity Incentive Plan, which will vest and settle in the following manner:
• | The first award for |
• | The second award for |
• | The third award for |
On February 18, 2020, the Board concurrently appointed Joshua Bixby as our Chief Executive Officer. In connection with Mr. Bixby’s appointment, the Board also expanded the size of the Board from six (6 ) to seven (7 ) members and appointed Mr. Bixby to serve as a Class I director. Mr. Bixby’s term as a member of the Board will expire at the meeting of stockholders to be held in 2020. Mr. Bixby will not serve on any committees of the Board.
In connection with Mr. Bixby's appointment, our subsidiary, Fastly International (Holdings) Ltd., and Mr. Bixby entered into an Employment Agreement (the “Bixby Employment Agreement”). Under the Bixby Employment Agreement, Mr. Bixby will receive an initial annual base salary of $35,568 . Starting as of January 1, 2021, Mr. Bixby’s base salary will be increased to an annual rate of $504,000 per year. However, on or before the last day of November, he may make an irrevocable election to reduce his salary for the following year (but in any case no lower than the applicable minimum wage). We have separately entered into an Equity Offer Letter with Mr. Bixby (the “Equity Offer Letter”), which provides that, if he makes such an election to reduce his salary, he will receive an Annual RSU. Each Annual RSU will be granted in February of the applicable year and the number of RSUs subject to each Annual RSU will be based on the average trading price of the Company’s Class A
121
common stock in January of such year. Each Annual RSU will vest in 4 equal quarterly installments following the date of grant commencing on February 15th and quarterly thereafter (May, August, and November), in each case subject to Mr. Bixby’s continued service with the Company.
Pursuant to the Equity Offer Letter, we granted Mr. Bixby the following RSUs to acquire up to an aggregate of 235,425 shares of our Class A common stock under our Plan, which will vest and settle in the following manner:
• | The first award for |
• | The second award for |
• | The third award for |
The number of shares of Class A common stock granted to both Mr. Bergman and Mr. Bixby pursuant to each RSU was determined in accordance with the Company’s standard practice by the Board based on the average trading price of the Company’s Class A common stock in January 2020. Each RSU will be subject to the provisions of our Plan and each related award agreement.
122
Item 9. Changes in and Disagreements with Accountants on Accounting and Financial Disclosure
None.
Item 9A. Controls and Procedures
Evaluation of Disclosure Controls and Procedures
The Company's management, with the participation of our principal executive officer and principal financial officer, has evaluated the effectiveness of our disclosure controls and procedures (as defined in Rules 13a-15(e) and 15d-15(e) under the Securities Exchange Act of 1934, as amended (the "Exchange Act")), as of the end of the period covered by this Annual Report on Form 10-K. Based on the evaluation of our disclosure controls and procedures as of December 31, 2019, our principal executive officer and principal financial officer concluded that, as of such date, due to the material weakness described below, our disclosure controls and procedures were not effective.
Management's Annual Report on Internal Control Over Financial Reporting
Our management is responsible for establishing and maintaining adequate internal control over financial reporting and for the assessment of the effectiveness of internal control over financial reporting as defined in Rule 13a-15(f) and 15d-15(f) under the Exchange Act. Internal control over financial reporting is a process designed under the supervision and with the participation of our management, including our Chief Executive Officer and our Chief Financial Officer, to provide reasonable assurance regarding the reliability of financing reporting and the preparation of financial statements for external purposes in accordance with accounting principles generally accepted in the United States of America.
Under the supervision and with the participation of our Chief Executive Officer and our Chief Financial Officer and oversight of the board of directors, our management conducted an evaluation of the effectiveness of our internal control over financial reporting as of December 31, 2019, based on the criteria set forth in Internal Control-Integrated Framework issued by the Committee of Sponsoring Organizations of the Treadway Commission (2013 framework). Based on this evaluation, due to the material weakness described below, management concluded that our disclosure controls and procedures were not effective.
The effectiveness of our internal control over financial reporting as of December 31, 2019 has been audited by Deloitte & Touche LLP, an independent registered public accounting firm, as stated in their report which is included in Part II, Item 8, "Financial Statements and Supplementary Data", of this Annual Report on Form 10-K.
Material Weakness
Management identified material weaknesses in our internal control over financial reporting for the years ended December 31, 2019, 2018 and 2017, related to the lack of sufficient qualified accounting and information systems personnel, which led to incorrect application of generally accepted accounting principles, and insufficiently designed segregation of duties, information technology access security and change management, and controls over business processes, including the financial statement close and reporting processes with respect to the development of accounting policies, procedures, and estimates. Management has been actively engaged in remediating the above described material weakness. The following remedial actions have been taken during the year ended December 31, 2019:
• | hired additional full-time accounting resources with appropriate levels of experience |
• | continue to actively recruit for open positions within the accounting department and will, as necessary, supplement any interim staffing needs with temporary resources; |
• | reallocated responsibilities across the accounting organization to ensure that the appropriate level of knowledge and experience is applied based on risk and complexity of transactions and tasks under review; |
• | strengthened our internal policies, processes and reviews, including substantial completion of the formal documentation thereof; |
• | implemented a formal financial month-end close policy and process; and |
• | engaged a professional accounting services firm to help us assess and commence documentation of our internal controls for complying with the Sarbanes-Oxley Act. |
123
The process of implementing an effective financial reporting system is a continuous effort that requires us to anticipate and react to changes in our business and the economic and regulatory environments and to expend significant resources to maintain a financial reporting system that is adequate to satisfy our reporting obligations. As we continue to evaluate and take actions to improve our internal control over financial reporting, we may take additional actions to address control deficiencies or modify certain of the remediation measures described above.
While significant progress has been made to enhance our internal control over financial reporting, we are still in the process of implementing, documenting and testing these processes, procedures and controls. Additional time is required to complete implementation and to assess and ensure the sustainability of these procedures. We believe the above actions will be effective in remediating the material weaknesses described above and we will continue to devote significant time and attention to these remedial efforts. However, the material weaknesses cannot be considered remediated until the applicable remedial controls operate for a sufficient period of time and management has concluded, through testing, that these controls are operating effectively.
Notwithstanding the material weaknesses, management has concluded that the financial statements included elsewhere in this Annual Report present fairly, in all material respects, our financial position, results of operations and cash flows in conformity with GAAP.
Changes in Internal Control
Other than as described above, there have been no changes in our internal control over financial reporting in connection with the evaluation required by Rules 13a-15(d) and 15d-15(d) of the Exchange Act that occurred during the period covered by this Annual Report on Form 10-K that materially affected, or are reasonably likely to materially affect, our internal control over financial reporting.
Inherent Limitations on Effectiveness of Controls
Our management, including our Chief Executive Officer and Chief Financial Officer, does not expect that our disclosure controls and procedures or our internal control over financial reporting will prevent or detect all errors and all fraud. A control system, no matter how well conceived and operated, can provide only reasonable, not absolute, assurance that the objectives of the control system are met. Because of the inherent limitations in all control systems, no evaluation of controls can provide absolute assurance that all control issues and instances of fraud, if any, within the Company have been detected. The design of any system of controls also is based in part upon certain assumptions about the likelihood of future events, and there can be no assurance that any design will succeed in achieving its stated goals under all potential future conditions. Over time, controls may become inadequate because of changes in conditions, or the degree of compliance with the policies or procedures may deteriorate. Because of the inherent limitations in a cost-effective control system, misstatements due to error or fraud may occur and not be detected.
Item 9B. Other Information
Not applicable.
124
PART III
Item 10. Directors, Executive Officers, and Corporate Governance
Information required by this Item is incorporated by reference to the sections of our proxy statement to be filed with the SEC no later than 120 days after December 31, 2019 in connection with our 2020 Annual Meeting of Stockholders (the "Proxy Statement").
We have adopted a Code of Business Conduct and Ethics that applies to our officers, directors and employees, which is available on our website at www.fastly.com. The Code of Business Conduct and Ethics is intended to qualify as a "code of ethics" within the meaning of Section 406 of the Sarbanes-Oxley Act of 2002 and Item 406 of Regulation S-K. In addition, we intend to promptly disclose (1) the nature of any amendment to our Code of Business Conduct and Ethics that applies to our principal executive officer, principal financial officer, principal accounting officer or controller or persons performing similar functions and (2) the nature of any waiver, including an implicit waiver, from a provision of our code of ethics that is granted to one of these specified officers, the name of such person who is granted the waiver and the date of the waiver on our website in the future.
Item 11. Executive Compensation
Information required by this Item is incorporated by reference to our Proxy Statement.
Item 12. Security Ownership of Certain Beneficial Owners and Management and Related Stockholder Matters
Information required by this Item is incorporated by reference to our Proxy Statement.
Item 13. Certain Relationships and Related Transactions and Director Independence
Information required by this Item is incorporated by reference to our Proxy Statement.
Item 14. Principal Accountant Fees and Services
Information required by this Item is incorporated by reference to our Proxy Statement.
125
PART IV
Item 15. Exhibits
(a)(1) Financial statements
The information concerning Fastly’s financial statements and the Report of Independent Registered Public Accounting Firm required by this Item 15(a)(1) is incorporated by reference herein to the section of this Annual Report on Form 10-K in Part II, Item 8, "Financial Statements and Supplementary Data."
(a)(2) Financial statement schedules
All financial statement schedules have been omitted as the information is not required under the related instructions or is not applicable or because the information required is already included in the financial statements or the notes to those financial statements.
(a)(3) Exhibits
We have filed, or incorporated into this Annual Report on Form 10-K by reference, the exhibits listed on the accompanying Exhibit Index immediately preceding the signature page of this Annual Report on Form 10-K.
Exhibit Number | Exhibit Description | Form | File No. | Exhibit | Filing Date | Filed Herewith | |
3.1 | 8-K | 001-38897 | 3.1 | May 21, 2019 | |||
3.2 | S-1/A | 333-230953 | 3.4 | May 6, 2019 | |||
4.1 | S-1/A | 333-230953 | 4.1 | May 6, 2019 | |||
4.2 | Reference is made to Exhibits 3.1 through 3.2 | ||||||
4.3 | X | ||||||
10.1 | S-1/A | 333-230953 | 10.1 | May 6, 2019 | |||
10.2+ | S-1/A | 333-230953 | 10.2 | May 6, 2019 | |||
10.3+ | S-1/A | 333-230953 | 10.3 | May 6, 2019 | |||
10.4+ | S-1/A | 333-230953 | 10.4 | May 6, 2019 | |||
10.5+ | S-1/A | 333-230953 | 10.5 | May 6, 2019 | |||
10.6+ | 10-Q | 001-38897 | 10.3 | August 9, 2019 | |||
10.7+ | S-1/A | 333-230953 | 10.7 | May 6, 2019 | |||
10.8 | S-1/A | 333-230953 | 10.8 | May 6, 2019 | |||
10.9+ | S-1/A | 333-230953 | 10.9 | May 6, 2019 | |||
10.10+ | S-1/A | 333-230953 | 10.10 | May 6, 2019 | |||
10.11+ | S-1/A | 333-230953 | 10.11 | May 6, 2019 | |||
126
Exhibit Number | Exhibit Description | Form | File No. | Exhibit | Filing Date | Filed Herewith | |
10.12+ | S-1/A | 333-230953 | 10.12 | May 6, 2019 | |||
10.13+ | S-1/A | 333-230953 | 10.13 | May 6, 2019 | |||
10.14+ | S-1/A | 333-230953 | 10.14 | May 6, 2019 | |||
10.15 | S-1/A | 333-230953 | 10.15 | May 6, 2019 | |||
10.16 | S-1/A | 333-230953 | 10.16 | May 6, 2019 | |||
10.17 | S-1/A | 333-230953 | 10.20 | May 6, 2019 | |||
10.18 | S-1/A | 333-230953 | 10.26 | May 6, 2019 | |||
10.19 | S-1/A | 333-230953 | 10.27 | May 6, 2019 | |||
10.20 | S-1/A | 333-230953 | 10.30 | May 6, 2019 | |||
10.21+ | S-1/A | 333-230953 | 10.31 | May 6, 2019 | |||
10.22+ | S-1/A | 333-230953 | 10.32 | May 6, 2019 | |||
10.23 | S-1/A | 333-230953 | 10.33 | May 6, 2019 | |||
10.24 | X | ||||||
21.1 | S-1/A | 333-230953 | 21.1 | May 6, 2019 | |||
23.1 | X | ||||||
24.1 | Power of Attorney (contained on the signature page of this report) | X | |||||
31.1 | X | ||||||
31.2 | X | ||||||
32.1* | |||||||
32.2* | |||||||
127
Exhibit Number | Exhibit Description | Form | File No. | Exhibit | Filing Date | Filed Herewith | |
101. INS | Inline XBRL Instance Document - the instance document does not appear in the Interactive Data File because its XBRL tags are embedded within the Inline XBRL document | X | |||||
101.SCH | Inline XBRL Taxonomy Schema Linkbase Document | X | |||||
101.CAL | Inline XBRL Taxonomy Calculation Linkbase Document | X | |||||
101.DEF | Inline XBRL Taxonomy Definition Linkbase Document | X | |||||
101.LAB | Inline XBRL Taxonomy Labels Linkbase Document | X | |||||
101.PRE | Inline XBRL Taxonomy Presentation Linkbase Document | X | |||||
104 | Cover Page Interactive Data File (formatted as inline XBRL and contained in Exhibit 101) | ||||||
__________
+ | Indicates management contract or compensatory plan. |
* The certifications furnished in Exhibit 32.1 and 32.2 hereto are deemed to be furnished with this Annual Report on Form 10-K and will not be deemed to be “filed” for purposes of Section 18 of the Exchange Act, except to the extent that the Registrant specifically incorporates it by reference.
Item 16. Form 10-K Summary
None.
128
SIGNATURES
Pursuant to the requirements of the Securities Exchange Act of 1934, as amended, Fastly, Inc. has duly caused this Annual Report on Form 10-K to be signed on its behalf by the undersigned, thereunto duly authorized.
FASTLY, INC. | ||||
Date: | March 3, 2020 | By: | /s/ Joshua Bixby | |
Joshua Bixby Chief Executive Officer (Principal Executive Officer) | ||||
Date: | March 3, 2020 | By: | /s/ Adriel Lares | |
Adriel Lares Chief Financial Officer (Principal Financial and Accounting Officer) | ||||
129
POWER OF ATTORNEY
KNOW ALL PERSONS BY THESE PRESENTS, that each person whose signature appears below constitutes and appoints Artur Bergman and Adriel Lares, and each of them, as his or her true and lawful attorney-in-fact and agent with full power of substitution and resubstitution, for such individual in any and all capacities, to sign any and all amendments to this Annual Report on Form 10-K, and to file the same, with all exhibits thereto and other documents in connection therewith, with the Securities and Exchange Commission, granting unto said attorneys-in-fact and agents, and each of them, full power and authority to do and perform each and every act and thing requisite and necessary to be done in connection therewith, as fully for all intents and purposes as he or she might or could do in person, hereby ratifying and confirming all that said attorneys-in-fact and agents, or any of them, or the individual’s substitute, may lawfully do or cause to be done by virtue hereof.
Pursuant to the requirements of the Securities Exchange Act of 1934, as amended, this report has been signed by the following persons on behalf of the Company and in the capacities and on the dates indicated.
Signature | Title | Date | ||
/s/ Joshua Bixby | Chief Executive Officer and Director | March 3, 2020 | ||
Joshua Bixby | (Principal Executive Officer) | |||
/s/ Adriel Lares | Chief Financial Officer | March 3, 2020 | ||
Adriel Lares | (Principal Financial Officer and Principal Accounting Officer) | |||
/s/ Artur Bergman | Chief Architect, Executive Chairperson and Chairperson of the | March 3, 2020 | ||
Artur Bergman | Board of Directors | |||
/s/ Aida Álvarez | Director | March 3, 2020 | ||
Aida Álvarez | ||||
/s/ Sunil Dhaliwal | Director | March 3, 2020 | ||
Sunil Dhaliwal | ||||
/s/ David Hornik | Director | March 3, 2020 | ||
David Hornik | ||||
/s/ Christopher B. Paisley | Director | March 3, 2020 | ||
Christopher B. Paisley | ||||
/s/ Kelly Wright | Director | March 3, 2020 | ||
Kelly Wright | ||||
130