UNITED STATES
SECURITIES AND EXCHANGE COMMISSION
WASHINGTON, D.C. 20549
__________________________________________________
FORM 10-K
ANNUAL REPORT PURSUANT TO SECTION 13 OR 15(d) OF THE SECURITIES EXCHANGE ACT OF 1934 | ||
For the fiscal year ended December 31, 2019
OR
TRANSITION REPORT PURSUANT TO SECTION 13 OR 15(d) OF THE SECURITIES EXCHANGE ACT OF 1934 | ||
For the transition period from to
Commission file number 001-34819

(Exact name of Registrant as specified in its charter)
(State or other jurisdiction of incorporation or organization) | (IRS Employer Identification No.) | ||||||||
(Address of principal executive offices, including zip code) | (Registrant's telephone number, including area code) | ||||||||
Securities registered pursuant to Section 12(b) of the Act: | ||
Title of each class: | Trading Symbol(s): | Name of each exchange on which registered: |
Securities registered pursuant to Section 12(g) of the Act: None | ||
Indicate by check mark if the registrant is a well-known seasoned issuer, as defined in Rule 405 of the Securities Act. Yes ☑ No ☐
Indicate by check mark if the registrant is not required to file reports pursuant to Section 13 or Section 15(d) of the Act. Yes ☐ No ☑
Indicate by check mark whether the registrant (1) has filed all reports required to be filed by Section 13 or 15(d) of the Securities Exchange Act of 1934 during the preceding 12 months (or for such shorter period that the registrant was required to file such reports), and (2) has been subject to such filing requirements for the past 90 days. Yes ☑ No ☐
Indicate by check mark whether the registrant has submitted electronically every Interactive Data File required to be submitted pursuant to Rule 405 of Regulation S-T (§ 232.405 of this chapter) during the preceding 12 months (or for such shorter period that the registrant was required to submit such files). Yes ☑ No ☐
Indicate by check mark whether the registrant is a large accelerated filer, an accelerated filer, a non-accelerated filer, a smaller reporting company, or an emerging growth company. See the definitions of “large accelerated filer,” “accelerated filer,” “smaller reporting company,” and "emerging growth company" in Rule 12b-2 of the Exchange Act.
☑ | Accelerated filer | ☐ | Non-accelerated filer | ☐ | Smaller reporting company | Emerging growth company | |||
If an emerging growth company, indicate by check mark if the registrant has elected not to use the extended transition period for complying with any new or revised financial accounting standards provided pursuant to Section 13(a) of the Exchange Act. ☐
Indicate by check mark whether the registrant is a shell company (as defined in Rule 12b-2 of the Exchange Act). Yes ☐ No ☑
The aggregate market value of the common equity held by non-affiliates of the registrant (assuming for these purposes, but without conceding, that all executive officers, directors and 10% or greater stockholders are "affiliates" of the registrant) as of June 30, 2019, the last business day of the registrant's most recently completed second fiscal quarter, was approximately $2.1 billion (based on the closing sale price of the registrant's common stock on that date as reported on the New York Stock Exchange).
There were 52,784,584 shares of Class A common stock, par value $0.001 per share, as of January 31, 2020.
DOCUMENTS INCORPORATED BY REFERENCE
Portions of the registrant’s proxy statement relating to the registrant’s 2020 Annual Meeting of Stockholders are incorporated by reference into Part III of this Annual Report on Form 10-K where indicated.
GREEN DOT CORPORATION
TABLE OF CONTENTS
Page | ||
PART I. | ||
PART II. | ||
PART III. | ||
PART IV. | ||
FORWARD-LOOKING STATEMENTS
This report contains forward-looking statements regarding future events and our future results that are subject to the safe harbors created under the Securities Act of 1933 (the “Securities Act”) and the Securities Exchange Act of 1934 (the “Exchange Act”). All statements other than statements of historical facts are statements that could be deemed to be forward-looking statements. These statements are based on current expectations, estimates, forecasts and projections about the industries in which we operate and the beliefs and assumptions of our management. Words such as “expects,” “anticipates,” “targets,” “goals,” “projects,” “intends,” “plans,” “believes,” “seeks,” “estimates,” “continues,” “endeavors,” “strives,” “may” and “assumes,” variations of such words and similar expressions are intended to identify forward-looking statements. In addition, any statements that refer to projections of our future financial performance, our anticipated growth and trends in our businesses, and other characterizations of future events or circumstances are forward-looking statements. Readers are cautioned that these forward-looking statements are subject to risks, uncertainties, and assumptions that are difficult to predict, including those identified below, under “Part I, Item 1A. Risk Factors,” and elsewhere herein. Therefore, actual results may differ materially and adversely from those expressed in any forward-looking statements. We undertake no obligation to revise or update any forward-looking statements for any reason.
In this report, unless otherwise specified or the context otherwise requires, “Green Dot,” “we,” “us,” and “our” refer to Green Dot Corporation and its consolidated subsidiaries, the term “GPR cards” refers to general purpose reloadable prepaid debit cards, the term “prepaid cards” refers to prepaid debit cards and the term “our cards” refers to our Green Dot-branded and co-branded GPR cards. In addition, “prepaid financial services” refers to GPR cards and associated reload services, a segment of the prepaid card industry.
PART I
ITEM 1. Business
Overview
Green Dot Corporation is a financial technology leader and bank holding company with a mission to reinvent banking for the masses. Our company’s long-term strategy is to create a unique, sustainable and highly valuable fintech ecosystem, in part through the continued evolution of Green Dot’s innovative Banking as a Service (“BaaS”) platform, that’s intended to fuel the engine of innovation and growth for Green Dot and its business partners.
Enabled by proprietary technology, our commercial bank charter and our high-scale program management operating capability, our vertically integrated technology and banking platform is used by a growing list of America’s most prominent consumer and technology companies to design and deploy their own bespoke financial services solutions to their customers and partners, while we use that same integrated platform for our own leading collection of banking and financial services products marketed directly to consumers through what we believe to be the most broadly distributed, omni-channel branchless banking platforms in the United States.
We earn revenues primarily through fees assessed to merchants for purchase transactions initiated by our cardholders (commonly known as interchange), fees charged to cardholders for certain transactions and usage of our products, interest income earned from deposits held at Green Dot Bank (our wholly-owned subsidiary bank), fees charged to consumers for money movement services, and platform fees we earn from our partners for use of our technology platform and our program management capabilities.
As the regulated entity and issuing bank for the substantial majority of products and services we provide, whether our own or on behalf of a BaaS platform partner, we are directly accountable for all aspects of each program’s integrity, inclusive of ensuring the program’s compliance with all applicable banking regulations, state and federal law and our various internal governance policies and procedures, in addition to deploying enterprise-class risk management practices and procedures to ensure each program’s initial and ongoing safety and soundness.
We are headquartered in Pasadena, California, with additional facilities throughout the United States and in Shanghai, China.
Our Products and Services
Our products and services are divided among our two reportable segments: 1) Account Services and 2) Processing and Settlement Services.
Account Services
We offer several deposit account programs that can be acquired through our omni-channel “branchless" distribution platform. These products include:
• | Innovative consumer and small business checking account products that allow customers to acquire and manage their checking account entirely through a mobile application available on smartphone devices; |
• | Network-branded reloadable prepaid debit cards marketed under several leading consumer brand names, collectively referred to as General Purpose Reloadable or GPR cards; |
• | Network-branded gift cards (known as open-loop) that are sold at participating retail stores; and |
• | Secured credit programs designed to help people establish or rehabilitate their national credit bureau score. These programs are backed by the customer's own security deposit held on deposit at Green Dot Bank or other banks in accounts held under our control and therefore, we have no risk of material loss resulting from the customer's non-payment of their obligation. |
Processing and Settlement Services
We offer several products and services that all specialize in facilitating the movement of funds on behalf of consumers and businesses, referred to as Money Processing and Tax Processing services.
Money Processing
Our Money Processing products and services include:
• | Our “Reload@TheRegister” swipe reload service allows consumers to add funds at the point-of-sale at any participating retailer to accounts we issue or manage and accounts issued by any third-party bank or program |
1
manager, which we refer to as network acceptance members, that has enabled its cards to accept funds through our processing system.
• | Our MoneyPak PIN product provides consumers the ability to add funds at the point-of-sale at any participating retailer to accounts we issue or manage and accounts issued by any third party bank or program manager that has enabled its cards to accept funds through our processing system. |
• | Our e-cash remittance service enables consumers to add funds at the point-of-sale at any participating retailer to accounts we issue or manage and accounts issued by any third party bank or program manager that has enabled its accounts to accept funds through our processing system. Consumers can also cash-out money sent to them by a business through the use of our e-cash remittance service when Green Dot sends a unique barcode to the customer’s smartphone, which is then presented to a cashier at a participating retailer who then scans the barcode to fulfill the transfer. |
We refer to the services above collectively as our cash transfer products.
We also provide our Simply Paid Disbursement service that enables wages and any type of authorized funds disbursement to be sent to accounts we issue or manage and accounts issued by any third-party bank or program manager that has enabled its cards to accept funds through our processing system.
Tax Processing
We offer several services designed for participants in the tax industry, referred to as Tax Processing services. Those services include:
• | Tax refund transfers that provide the processing technology to facilitate receipt of a taxpayers' refund proceeds. When a customer of a third-party tax preparation provider chooses to pay their tax preparation fees using our processing services, we deduct the tax preparation service fee and our processing service fee from the customer's refund and remit the remaining balance to the customer's account; |
• | Small business lending to independent tax preparation providers that seek small advances in order to help provide working capital prior to generating income during the tax filing season; |
• | Fast Cash Advance, a consumer-friendly loan that enables tax refund recipients utilizing our tax processing services the opportunity to receive a portion of their expected tax refund amount in advance of receiving their actual tax refund. |
Our Market Strategy
In addition to how we organize our two reportable segments, we also consider our product and service offerings based on our market distribution strategies, as follows:
Consumer Business
We offer our branded card programs and the Walmart MoneyCard to a broad group of consumers, ranging from never-banked to fully-banked consumers. We focus our sales and marketing efforts on acquisition of long-term users of our products, enhancing our brands and image, building market adoption and awareness of our products, improving customer retention, and increasing card usage.
Our products can be acquired through our omni-channel “branchless" distribution platform that consists of:
• | distribution arrangements with more than 100,000 mostly major chain retail locations, which we refer to as “retail distributors” and thousands of neighborhood Financial Service Center locations; |
• | several differently branded, Green Dot-owned and operated direct-to-consumer online and direct mail customer acquisition platforms; |
• | card offerings that are integrated into the tax preparation software that enables a tax preparation provider to offer its customers a Green Dot Bank-issued GPR card for the purpose of receiving tax refunds more rapidly and securely than check disbursements; and |
• | apps compatible with the iOS and Android operating systems downloaded through the corresponding app store. |
Platform Services Business
We partner with enterprises to make our banking products and services available to their consumers, partners and workforce through integration with our technology platform. Our platform service offerings include the following:
2
• | Card programs offered by our BaaS partners through their channels of trade (our "BaaS" account programs); |
• | Card programs offered by corporate enterprises that provide payroll cards to their employees to receive wage disbursements (our "PayCard" programs); |
• | Money Processing services offered to consumers through our Consumer Business, our BaaS partners and other third-party bank or program managers; |
• | Tax Processing services through more than 25,000 small and large tax preparation companies and individual tax preparers, which are sometimes referred to as electronic return originators, or “EROs”, who are able to offer our products and services to their customers through the use of various tax preparation industry software packages with which our products are integrated; and |
• | Capital and deposit taking services provided by Green Dot Bank. |
Through Green Dot Bank, we offer issuing, settlement and capital management services principally to support those applicable products across both reporting segments. Our banking services include:
• | Issuing services as the payment network member bank and settlement bank for our GPR card, spend-based P2P programs, gift card and checking account products; |
• | Credit card issuing and capital lending services for our Green Dot Platinum Visa Secured Credit Card; and |
• | Settlement bank for our reload and tax refund services within our Processing and Settlement Services segment. |
Green Dot Bank also generates interest income through the investment of funds from its capital and the increasing deposits it receives in respect of our products and services, as well as the products and services we enable for our BaaS platform partners.
Products within our Account Services segment are generally issued by Green Dot Bank. As a result of acquisitions over the past few years, we also manage programs issued by third-party issuing banks.
Our Technology Platform
Our vertically integrated technology and banking platform utilizes a combination of proprietary and third-party technologies and services to power a large ecosystem of financial service solutions through numerous distribution channels. This platform, which is used by several of America’s largest retail, consumer, technology and financial services companies, offers many products, services and bespoke capabilities, including the following:
Consumer features | ||
Early direct deposit | Bill pay | |
Custom reward programs | Back-up balance | |
Savings | Mobile P2P services | |
Free ATM networks | Mobile banking | |
Retail cash solutions | ||
Platform capabilities | ||
Consumer checking accounts | Instant payment and wage disbursements | |
Small business checking accounts | Mobile app/UX development | |
Loan disbursement accounts | Product innovation | |
GPR cards | Card production and fulfillment | |
Payroll cards | Real-time data and webhooks | |
Network branded "open loop" gift cards | Fraud management | |
Money transfer services | Customer support | |
Tax solutions | Custom settlement procedures | |
3
Our Relationship with Walmart
Walmart is our largest retail distributor. Green Dot Corporation has been the provider of Walmart-branded GPR cards sold at Walmart since the initiation of the Walmart MoneyCard pilot program in 2006 and that product's national launch in 2007, and Green Dot Bank has been the issuer of those card accounts since early 2014. Pursuant to our agreement with Walmart, Green Dot designs and delivers the Walmart MoneyCard product and provides all ongoing program support, including network IT, regulatory and legal compliance, website functionality, customer service and loss management. Walmart provides us with shelf space to display and offer the card accounts to consumers. As the issuing bank, Green Dot Bank holds the associated FDIC-insured deposits. All Walmart MoneyCard products are reloadable exclusively on the Green Dot Network. In addition to Walmart MoneyCards, we offer our Green Dot-branded cards and our GoBank checking account product at Walmart, providing consumers the choice to purchase either Green Dot-branded products or Walmart MoneyCard products. Our operating revenues derived from the several products and services we offer through Walmart stores and other Walmart distribution avenues in aggregate represented approximately 34%, 36%, and 40% of our total operating revenues for the years ended December 31, 2019, 2018, and 2017, respectively.
Seasonality
We experience seasonal fluctuations in revenue, with the first half of each year being favorably affected by large numbers of taxpayers electing to receive their tax refunds via direct deposit on our cards. Additionally, our tax refund processing services business is highly seasonal as it generates the majority of its revenue in the first quarter, and substantially all of its revenue in the first half of each calendar year. We expect our revenue in future periods to continue to fluctuate due to the seasonal factors described above.
Competition
We compete against companies and financial institutions across the retail banking, financial services, transaction processing, consumer technology and financial technology services industries and may compete with others in the market who may in the future provide offerings similar to ours. Furthermore, many of our competitors are entities substantially larger in size, more highly diversified in revenue and substantially more established with significantly more broadly known brand awareness than ours. As such, many of our competitors can leverage their size, robust networks, financial wherewithal, brand awareness, pricing power and technological assets to compete with us. Additionally, some of our current and potential competitors are subject to fewer regulations and restrictions than we are and thus may be able to respond more quickly in the face of regulatory and technological changes. We are also experiencing increased price competition as a result of new entrants offering free or low-cost alternatives to our products and services.
We compete primarily on the basis of the following:
• | breadth of distribution; |
• | speed and quality of innovation; |
• | reliability of system performance and security; |
• | scalability of platform services; |
• | quality of service; |
• | compliance and regulatory capabilities; |
• | brand recognition and reputation; and |
• | pricing. |
We believe our products or platform services compete favorably with respect to these factors.
Intellectual Property
We rely on a combination of patent, trademark and copyright laws and trade secret protections in the United States, as well as confidentiality procedures and contractual provisions, to protect the intellectual property rights related to our products and services.
We own several trademarks, including Green Dot and GoBank. Through agreements with our network acceptance members, retail distributors and customers, we authorize and monitor the use of our trademarks in connection with their activities with us.
4
Our patent portfolio currently consists of 12 issued patents and 6 patent applications pending. The term of the patents we hold is, on average, 20 years. We feel our patents and applications are important to our business and help to differentiate our products and services from those of our competitors.
The industries in which we compete are characterized by rapidly changing technology, a large number of patents, and frequent claims and related litigation regarding patent and other intellectual property rights. There can be no assurance that our patents and other proprietary rights will not be challenged, invalidated, or circumvented; that others will not assert intellectual property rights to technologies that are relevant to us; or that our rights will give us a competitive advantage. In addition, the laws of some foreign countries may not protect our proprietary rights to the same extent as the laws of the United States. The risks associated with patents and intellectual property are more fully discussed in “Item 1A. Risk Factors,” including the risk factors entitled “We may be unable to adequately protect our brand and our intellectual property rights related to our products and services or third parties may allege that we are infringing their intellectual property rights.”
Regulation and Supervision
General
Our business is heavily regulated by both federal and state agencies. We and our subsidiaries are subject to supervision, regulation and examination by various federal and state regulators, including the Board of Governors of the Federal Reserve System (the “Federal Reserve”), the Utah Department of Financial Institutions (the “Utah DFI”) and various other state regulatory agencies. The statutory and regulatory framework that governs us is generally intended to protect depositors and customers, the FDIC’s Deposit Insurance Fund (“DIF”), the U.S. banking and financial system, and financial markets as a whole.
Banking statutes, regulations and policies are continually under review by Congress, state legislatures and federal and state regulatory agencies. In addition to laws and regulations, federal and state bank regulatory agencies may issue policy statements, interpretive letters and similar written guidance applicable to Green Dot Corporation and its subsidiaries. Any change in the statutes, regulations or regulatory policies applicable to us, including changes in their interpretation or implementation, could have a material effect on our business.
Both the scope of the laws and regulations and the intensity of the supervision to which bank holding companies such as Green Dot Corporation are subject increased in response to the global financial crisis of 2008, as well as other factors such as technological and market changes. Regulatory enforcement and fines have also increased across the banking and financial services sector. Many of these changes occurred as a result of the Dodd-Frank Wall Street Reform and Consumer Protect Act (the “Dodd-Frank Act”) and its implementing regulations, most of which are now in place. While the regulatory environment has entered a period of tailoring and rebalancing of the post financial crisis framework, we expect that our business will remain subject to extensive regulation and supervision.
We are also subject to the disclosure and regulatory requirements of the Securities Act of 1933, as amended, and the Securities Exchange Act of 1934, as amended, both as administered by the SEC, as well as the rules of the New York Stock Exchange that apply to companies with securities listed on the New York Stock Exchange.
The following discussion describes certain elements of the comprehensive regulatory framework applicable to us. This discussion is not intended to describe all laws and regulations applicable to Green Dot Corporation, Green Dot Bank and our other subsidiaries. Any changes in applicable laws, regulations or the interpretations thereof could have a material adverse effect on our business.
Regulatory Agencies
In 2011 we completed our acquisition of Bonneville Bancorp and became a bank holding company (“BHC”) registered with the Federal Reserve under the Bank Holding Company Act of 1956 (“BHC Act”). As a BHC, Green Dot Corporation is subject to the requirements of the BHC Act as well as supervision, regulation and examination by the Federal Reserve, which serves as the primary federal banking regulator of our consolidated organization.
As an FDIC-insured commercial bank that is chartered under the laws of Utah and a member of the Federal Reserve System, Green Dot Bank and its subsidiaries are subject to regulation, supervision and examination by the Federal Reserve and the Utah DFI.
The Consumer Financial Protection Bureau (“CFPB”) has broad rulemaking authority over a wide range of federal consumer protection laws applicable to the business of Green Dot Bank. Because Green Dot Bank currently has less than $10 billion in total consolidated assets, Green Dot Bank is subject to regulations adopted by the CFPB, but the Federal Reserve is primarily responsible for examining Green Dot Bank’s compliance with federal consumer financial laws and those CFPB regulations. The Utah DFI is responsible for examining and supervising Green Dot Bank’s compliance with state consumer protection laws and regulations.
5
Permissible Activities for Green Dot Corporation as a Financial Holding Company
In general, the BHC Act limits the business of BHCs to banking, managing or controlling banks and other activities that the Federal Reserve has determined to be so closely related to banking as to be a proper incident thereto. Under the BHC Act, BHCs that have qualified and elected to be treated as a financial holding company (“FHC”) generally may engage in a broader range of additional activities that are (i) financial in nature or incidental to such financial activities or (ii) complementary to a financial activity and do not pose a substantial risk to the safety and soundness of depository institutions or the financial system generally. A BHC qualifies to become an FHC if it and its subsidiary depository institutions are “well capitalized” and “well managed” and its subsidiary depository institutions have a rating under the Community Reinvestment Act (“CRA”) of at least “Satisfactory” at their most recent examination. We have qualified and elected to be an FHC under the BHC Act, although all the activities we currently conduct are permissible for a BHC.
If at any time we or Green Dot Bank fail to be “well capitalized” or “well managed,” the Federal Reserve may impose limitations or conditions on the conduct of our activities and we may not commence, or acquire any shares of a company engaged in, any activities only permissible for an FHC, without prior Federal Reserve approval. The restriction on our ability to commence, or acquire any shares of a company engaged in, any activities only permissible for an FHC, without prior Federal Reserve approval would also generally apply if Green Dot Bank received a CRA rating of less than “Satisfactory.”
In connection with our acquisition of Bonneville Bancorp in 2011 and our subsequent acquisition of certain assets and certain deposit liabilities of GE Capital Retail Bank in 2013, we submitted business plans to the Federal Reserve. Under commitments made to the Federal Reserve and the Utah DFI, we must obtain prior approval from the Federal Reserve for any major deviation or material change from the business plan we submitted in 2013. Accordingly, commitments made in connection with our business plan may limit our activities.
Permissible Activities for Banks
The activities of Green Dot Bank are limited to those specifically authorized under Utah banking laws and Utah DFI regulations and permissible under applicable federal law and Federal Reserve regulations.
Supervision, Examination and Enforcement
Bank regulators regularly examine the operations of BHCs and banks. Examination results are confidential and generally may not be disclosed. In addition, BHCs and banks are subject to periodic reporting and filing requirements. The Federal Reserve and Utah DFI have broad supervisory and enforcement authority with regard to BHCs and banks, including the power to conduct examinations and investigations, impose nonpublic supervisory agreements, issue cease and desist orders, impose fines and other civil and criminal penalties, terminate deposit insurance and appoint a conservator or receiver.
Bank regulators have various remedies available if they determine that the financial condition, capital resources, asset quality, earnings prospects, management, liquidity or other aspects of a banking organization’s operations are unsatisfactory. The regulators may also take action if they determine that the banking organization or its management is violating or has violated any law or regulation. The regulators have the power to, among other things, prohibit unsafe or unsound practices, require affirmative actions to correct any violation or practice, issue administrative orders that can be judicially enforced, direct increases in capital, direct the sale of subsidiaries or other assets, limit dividends and distributions, restrict growth, assess civil monetary penalties, remove officers and directors, and terminate deposit insurance.
Engaging in unsafe or unsound practices or failing to comply with applicable laws, regulations and supervisory agreements could subject Green Dot Corporation, its subsidiaries, including Green Dot Bank, and their respective officers, directors and institution-affiliated parties to the remedies described above and other sanctions. In addition, the FDIC may terminate a bank’s deposit insurance upon a finding that the bank’s financial condition is unsafe or unsound or that the bank has engaged in unsafe or unsound practices or has violated an applicable rule, regulation, order or condition enacted or imposed by the bank’s regulatory agency.
Bank and BHC Acquisitions and Mergers
The BHC Act, the Bank Merger Act, Utah’s Financial Institutions Act and other federal and state statutes regulate acquisitions of banks and other FDIC-insured depository institutions. Green Dot Corporation must obtain the prior approval of the Federal Reserve before (i) acquiring direct or indirect ownership or control of any voting shares of any bank or BHC, if after such acquisition, it will directly or indirectly own or control 5% or more of any class of voting shares of the institution, (ii) acquiring all or substantially all of the assets of any bank (other than directly through Green Dot Bank) or (iii) merging or consolidating with any other BHC. Under the Bank Merger Act, the prior approval of the Federal
6
Reserve is required for Green Dot Bank to merge with another bank or purchase all or substantially all of the assets or assume any of the deposits of another FDIC-insured depository institution. In reviewing applications seeking approval of merger and acquisition transactions, bank regulators consider, among other things, the competitive effect and public benefits of the transactions, the capital position and managerial resources of the combined organization, the risks to the stability of the U.S. banking or financial system, the applicant's performance record under the CRA, the applicant's compliance with fair housing and other consumer protection laws and the effectiveness of all organizations involved in combating money laundering activities. In addition, failure to implement or maintain adequate compliance programs could cause bank regulators not to approve an acquisition where regulatory approval is required or to prohibit an acquisition even if approval is not required.
Acquisitions of Ownership of Green Dot Corporation
The ability of a third party to acquire our stock is also limited under applicable U.S. banking laws, including regulatory approval requirements.
Federal Banking Law. The BHC Act requires any BHC to obtain the approval of the Federal Reserve before acquiring, directly or indirectly, more than 5% of our outstanding common stock. Any “company,” as defined in the BHC Act, other than a BHC is required to obtain the approval of the Federal Reserve before acquiring "control" of us. "Control" generally means (i) the ownership or control of 25% or more of a class of voting securities, (ii) the ability to elect a majority of the directors or (iii) the ability otherwise to exercise a controlling influence over management and policies. An entity that controls us for purposes of the BHC Act is subject to regulation and supervision as a BHC under the BHC Act. In addition, under the Change in Bank Control Act of 1978, as amended (the “CIBC Act”), and the Federal Reserve’s regulations thereunder, any person, either individually or acting through or in concert with one or more persons, is required to provide notice to the Federal Reserve prior to acquiring control, directly or indirectly, of a BHC such as Green Dot Corporation. For purposes of the CIBC Act, a rebuttable presumption of control applies to acquisitions of more than 10% of any class of a BHC’s voting stock under certain circumstances including if, as is the case with Green Dot Corporation, the issuer has registered securities under Section 12 of the Securities Exchange Act of 1934.
Utah Change in Control Restrictions. Utah’s Financial Institutions Act generally requires prior approval of the Utah DFI before a person or entity may acquire, directly or indirectly, control of a depository institution or a depository institution holding company subject to its jurisdiction. The Utah DFI defines control to include, among other things, the power, directly or indirectly, or through or in concert with one or more persons, to vote more than 10% of any class of voting securities by a person other than an individual or to vote 20% or more of any class of voting securities by an individual.
Capital and Liquidity Requirements
In General. The U.S. banking agencies have adopted regulatory capital rules to implement the Basel III regulatory capital framework developed by the Basel Committee on Banking Supervision and related provisions in the Dodd-Frank Act (“U.S. Basel III Rules”). Under the U.S. Basel III Rules, Green Dot Corporation and Green Dot Bank are required to maintain minimum risk-based and leverage capital ratios. Green Dot Corporation and Green Dot Bank must also maintain a capital conservation buffer of 2.5% to avoid becoming subject to restrictions on capital distributions and certain discretionary bonus payments to management. For a discussion of applicable regulatory minimum and well-capitalized minimum capital ratios, as well as a description of relevant definitions related to capital amounts and ratios, see “Management's Discussion and Analysis of Financial Condition and Results of Operations--Capital Requirements for Bank Holding Companies” and Note 22 — Regulatory Requirements to the Consolidated Financial Statements included herein, which are incorporated by reference in this Item 1.
The Federal Reserve may require BHCs, including us, to maintain capital substantially in excess of mandated minimum levels, depending upon general economic conditions and a BHC’s particular condition, risk profile and growth plans. The Federal Reserve may also require BHCs or their subsidiaries to make other capital or liquidity commitments. For example, in addition the above generally applicable requirements, Green Dot Bank is subject to commitments that it and Green Dot Corporation have made to the Federal Reserve and the Utah DFI. These commitments require Green Dot Bank to maintain cash and/or cash equivalents in an amount equal to no less than 100 percent of insured deposits generated by Green Dot Bank related to GPR cards, a subset of its total deposits.
Failure to be well-capitalized, to meet minimum capital requirements or to comply with the other commitments to which we and Green Dot Bank are subject could result in certain mandatory and possible additional discretionary actions by regulators, including restrictions on our and Green Dot Bank’s ability to pay dividends or otherwise distribute capital or to receive regulatory approval of applications, or other restrictions on growth.
As of December 31, 2019, our and Green Dot Bank’s regulatory capital ratios were above the well-capitalized standards and met the then-applicable capital conservation buffer. Based on current estimates, we believe that Green
7
Dot Corporation and Green Dot Bank will continue to exceed all applicable well-capitalized regulatory capital requirements and the capital conservation buffer, on a fully phased-in basis.
FDICIA and Prompt Corrective Action
The Federal Deposit Insurance Corporation Improvement Act of 1991 (“FDICIA”) requires the federal bank regulatory agencies to take “prompt corrective action” in respect of FDIC-insured depository institutions that do not meet certain capital adequacy standards. FDICIA establishes five capital categories ("well-capitalized", "adequately capitalized", "undercapitalized", "significantly undercapitalized" and "critically undercapitalized"), with a depository institution’s categorization for purposes of the prompt corrective action provisions depending upon its level of capitalization and certain other factors. An institution that fails to remain well-capitalized becomes subject to a series of restrictions that increase in severity as its capital condition weakens. Such restrictions may include a prohibition on capital distributions, restrictions on asset growth or restrictions on the ability to receive regulatory approval of applications. FDICIA also provides for enhanced supervisory authority over undercapitalized institutions, including authority for the appointment of a conservator or receiver for the institution. In certain instances, a BHC may be required to guarantee the performance of an undercapitalized subsidiary bank’s capital restoration plan.
Brokered Deposits
As discussed above under “Part I, Item 1A. Risk Factors,” current FDIC guidance classifies the majority of Green Dot Bank’s deposits as brokered. Under FDIC regulations, only banks that are well-capitalized may accept brokered deposits without restriction. A bank that is adequately capitalized may not accept, renew or roll over any brokered deposit unless it has been granted a waiver by the FDIC. If such waiver is granted, the bank may not pay an interest rate on any deposit in excess of 75 basis points over certain prevailing market rates. Undercapitalized banks may not accept, renew or roll over any brokered deposits. Because a majority of Green Dot Bank’s deposits are brokered deposits, failure by Green Dot Bank to remain well-capitalized could negatively affect our operations or financial condition.
In February 2020, the FDIC released a notice of proposed rulemaking seeking comment on proposed revisions to its regulations relating to the brokered deposits restrictions that apply to less than well capitalized insured depository institutions. The FDIC states in the notice of proposed rulemaking that through the proposed changes, it intends to modernize its brokered deposit regulations to reflect recent technological changes and innovations. The proposed rule would create a new framework for analyzing certain provisions of the “deposit broker” definition, which will affect the classification of deposits as “brokered”. We cannot predict whether or when the proposed rule will be implemented and whether it will result in a change in the way our deposits are classified.
Safety and Soundness Guidelines
The federal banking agencies have adopted guidelines prescribing safety and soundness standards relating to internal controls, risk management, information systems, internal audit systems, loan documentation, credit underwriting, interest rate exposure, asset growth and compensation, fees and benefits. These guidelines in general require appropriate systems and practices to identify and manage specified risks and exposures. The guidelines also prohibit excessive compensation as an unsafe and unsound practice and characterize compensation as excessive when the amounts paid are unreasonable or disproportionate to the services performed by an executive officer or employee, director or principal shareholder. In addition, the agencies have adopted regulations that authorize but do not require an agency to order an institution that has been given notice by the agency that it is not in compliance with any of the safety and soundness standards to submit a compliance plan. If after being so notified, an institution fails to submit an acceptable compliance plan, the agency must issue an order directing action to correct the deficiency and may issue an order directing other actions of the types, including those that may limit growth or capital distributions. If an institution fails to comply with such an order, the bank regulator may seek to enforce such order in judicial proceedings and to impose civil money penalties.
Dividend and Share Repurchase Restrictions
Green Dot Corporation is a legal entity separate and distinct from Green Dot Bank and its other subsidiaries. There are limitations on the payment of dividends by Green Dot Bank to Green Dot Corporation, as well as by Green Dot Corporation to its shareholders, under applicable banking laws and regulations. In addition, under the U.S. Basel III Rules we must obtain prior approval from the Federal Reserve before we may redeem or repurchase our common stock.
Federal banking regulators are authorized to determine, under certain circumstances relating to the financial condition of a BHC or a bank, that the payment of dividends would be an unsafe or unsound practice and to prohibit payment thereof. In particular, federal banking regulators have stated that paying dividends that deplete a banking
8
organization's capital base to an inadequate level would be an unsafe and unsound banking practice and that banking organizations should generally pay dividends only out of current operating earnings.
Under Utah’s Financial Institutions Act, Utah-chartered commercial banks, such as Green Dot Bank, may, subject to certain conditions, declare and pay dividends out of their net profits, after providing for all expenses, losses, interest, and taxes accrued or due from the bank.
Green Dot Corporation and Green Dot Bank must maintain the applicable capital conservation buffer to avoid becoming subject to restrictions on capital distributions, including dividends and share repurchases. The capital conservation buffer is currently at its fully phased-in level of 2.5%.
In addition, Federal Reserve policy provides that BHC, such as Green Dot Corporation, should generally pay dividends to shareholders only if (i) the organization’s net income available to common shareholders over the past year has been sufficient to fully fund the dividends; (ii) the prospective rate of earnings retention appears consistent with the organization’s capital needs, asset quality and overall financial condition and (iii) the organization will continue to meet minimum capital adequacy ratios. The policy also provides that a BHC should inform the Federal Reserve reasonably in advance of declaring or paying a dividend that exceeds earnings for the period for which the dividend is being paid or that could result in a material adverse change to the BHC’s capital structure. BHCs also are required to consult with the Federal Reserve before materially increasing dividends and must receive approval before redeeming or repurchasing capital instruments. In addition, the Federal Reserve could prohibit or limit the payment of dividends by a BHC if it determines that payment of the dividend would constitute an unsafe or unsound practice.
Source of Strength
Green Dot Corporation is required to serve as a source of financial and managerial strength to Green Dot Bank and, under appropriate conditions, to commit resources to support Green Dot Bank. This support may be required by the Federal Reserve at times when we might otherwise determine not to provide it or when doing so is not otherwise in the interests of Green Dot Corporation or our shareholders or creditors. The Federal Reserve may require a BHC to make capital injections into a troubled subsidiary bank and may charge the BHC with engaging in unsafe and unsound practices if the BHC fails to commit resources to such a subsidiary bank or if it undertakes actions that the Federal Reserve believes might jeopardize the BHC’s ability to commit resources to such subsidiary bank.
Under these requirements, Green Dot Corporation may in the future be required to provide financial assistance to Green Dot Bank should it experience financial distress. Capital loans by Green Dot Corporation to Green Dot Bank, if any, would be subordinate in right of payment to deposits and certain other debts of Green Dot Bank. In the event of Green Dot Corporation’s bankruptcy, any commitment by Green Dot Corporation to a federal banking regulator to maintain the capital of Green Dot Bank would be assumed by the bankruptcy trustee and entitled to a priority of payment.
Receivership or Conservatorship of Green Dot Bank
Upon the insolvency of an insured depository institution, such as Green Dot Bank, the FDIC may be appointed as the conservator or receiver of the institution. Acting as a conservator or receiver, the FDIC would have broad powers to transfer any assets or liabilities of the institution without the approval of the institution’s creditors or shareholders.
Separately, the Commissioner of the Utah DFI also has the authority to take possession of or appoint a receiver or liquidator of any Utah state-chartered bank, such as Green Dot Bank, under specified circumstances, including where the bank (i) is not in a safe and sound condition to transact its business, (ii) has failed to maintain an adequate level of capital or (iii) is conducting its business in an unauthorized or unsafe manner.
Depositor Preference
The Federal Deposit Insurance Act provides that, in the event of the liquidation or other resolution of an insured depository institution, including Green Dot Bank, the claims of depositors of the institution (including the claims of the FDIC as subrogee of insured depositors) and certain claims for administrative expenses of the FDIC as a receiver would have priority over other general unsecured claims against the institution. If Green Dot Bank were to fail, insured and uninsured depositors, along with the FDIC, would have priority in payment ahead of unsecured, non-deposit creditors, including Green Dot Bank if it were a creditor at that time, with respect to any extensions of credit they have made to such insured depository institution.
Transactions between a Bank and its Affiliates
Federal banking laws and regulations impose qualitative standards and quantitative limitations upon certain transactions between a bank, such as Green Dot Bank, and its affiliates, including between a bank and its holding company and companies that control the BHC or that the BHC may be deemed to control for these purposes. Transactions covered by these provisions must be on terms that are at least as favorable to the bank as those that it
9
could obtain in a comparable transaction with a non-affiliate, and cannot exceed certain amounts that are determined with reference to the bank’s regulatory capital. Moreover, if the transaction is a loan or other extension of credit, it must be secured by collateral in an amount and quality expressly prescribed by statute, and if the affiliate is unable to pledge sufficient collateral, the BHC may be required to provide it.
Federal banking laws also place similar restrictions on loans and other extensions of credit by FDIC-insured banks, such as Green Dot Bank, and their subsidiaries to their directors, executive officers and principal shareholders, as well as to entities controlled by such persons.
Community Reinvestment Act
Under the CRA, an insured depository institution, such as Green Dot Bank, has a continuing and affirmative obligation to help meet the credit needs of its entire community, including low and moderate-income neighborhoods. The CRA does not establish specific lending requirements or programs for insured depository institutions, nor does it limit an insured depository institution’s discretion to develop the types of products and services that it believes are best suited to its particular community, consistent with the CRA. However, insured depository institutions are rated on their performance in meeting the needs of their communities.
The CRA requires the appropriate federal banking agency to take an insured depository institution’s CRA record into account when evaluating certain applications by the insured depository institution or its holding company, including applications for charters, branches and other deposit facilities, relocations, mergers, consolidations, acquisitions of assets or assumptions of liabilities, and bank and savings association acquisitions. An unsatisfactory record of performance may be the basis for denying or conditioning approval of an application by an insured depository institution or its holding company. The CRA also requires that all institutions publicly disclose their CRA ratings.
Green Dot Bank’s CRA compliance is currently evaluated under a CRA strategic plan. Green Dot Bank’s strategic plan for 2018 through 2020 focuses on supporting the credit needs of its defined assessment area primarily through direct community development lending, small business lending, and investments and services in Green Dot Bank’s designated Metropolitan Statistical Area of Utah and Juab Counties and the state of Utah.
Leaders of the federal banking agencies recently have indicated their support for revising the CRA regulatory framework, and on December 12, 2019, the Office of the Comptroller of the Currency and the Federal Deposit Insurance Corporation approved for publication in the Federal Register a joint Notice of Proposed Rulemaking to modernize the regulations that implement the CRA. We cannot predict whether any changes will be made to applicable CRA requirements.
Insurance of Deposit Accounts
The deposits of Green Dot Bank are insured by the DIF up to the standard maximum deposit insurance amount of $250,000 per depositor. Green Dot Bank is subject to deposit insurance assessments based on the risk it poses to the DIF, as determined by the capital category and supervisory category to which it is assigned. Brokered deposits are subject to an assessment rate adjustment of up to 10 basis points, and therefore are generally assessed at a higher rate. The FDIC has authority to raise or lower assessment rates on insured deposits in order to achieve statutorily required reserve ratios in the DIF and to impose special additional assessments. There is a risk that Green Dot Bank’s deposit insurance premiums will increase if failures of insured depository institutions deplete the DIF or if the FDIC changes its view of the risk Green Dot Bank poses to the DIF or increases the assessment rate adjustment applicable to Green Dot Bank’s brokered deposits.
Relationships with Third-Party Issuing Banks
While Green Dot Bank acts as our banking partner for most of our products and services, we offer some products and services through arrangements with federally- or state-chartered third-party banks. We are subject to contractual requirements with those banks and are indirectly subject to the oversight of our banking partners’ regulators with respect to the laws and regulations that apply to each such product or service. These types of third-party relationships are subject to increasingly demanding regulatory requirements and attention by federal banking regulators. Regulatory guidance requires financial institutions to enhance their due diligence, ongoing monitoring and control over their third-party vendors and other ongoing third-party business relationships.
As a result, our relationships with third-party banks may require us to undertake compliance actions similar to those that we or Green Dot Bank must perform for the products and services issued by Green Dot Bank.
10
Anti-Money Laundering Rules
The Bank Secrecy Act (“BSA”), the USA PATRIOT Act of 2001 and other laws and regulations require financial institutions, among other duties, to institute and maintain an effective anti-money laundering (“AML”) program and file suspicious activity and currency transaction reports when appropriate. Among other things, these laws and regulations require Green Dot Corporation and Green Dot Bank to take steps to prevent the use of Green Dot Bank to facilitate the flow of illegal or illicit money, to report large currency transactions and to file suspicious activity reports. We also are required to develop and implement a comprehensive AML compliance program and must also have in place appropriate “know your customer” policies and procedures. We have adopted policies and procedures to comply with these requirements.
The bank regulatory agencies have increased the regulatory scrutiny of the BSA and anti-money laundering programs maintained by financial institutions. Significant penalties and fines, as well as other supervisory orders may be imposed on a financial institution for non-compliance with BSA/AML requirements.
Office of Foreign Assets Control Regulation
OFAC is responsible for administering economic sanctions that affect transactions with designated foreign countries, nationals and others, as defined by various Executive Orders and Acts of Congress. OFAC-administered sanctions take many different forms. OFAC also publishes lists of persons, organizations and countries suspected of aiding, harboring or engaging in terrorist acts, known as Specially Designated Nationals and Blocked Persons. Blocked assets (e.g., property and bank deposits) cannot be paid out, withdrawn, set off or transferred in any manner without a license from OFAC. Failure to comply with these sanctions could have serious legal and reputational consequences.
Privacy and Data Security Laws
Green Dot Bank is subject to a variety of federal and state privacy and data security laws, which govern the collection, safeguarding, sharing and use of customer information, and require that financial institutions have in place policies regarding information privacy and security. For example, the Gramm-Leach-Bliley Act of 1999 (“GLBA”) requires all financial institutions offering financial products or services to retail customers to provide such customers with the financial institution’s privacy policy and practices for sharing nonpublic information with third parties, provide advance notice of any changes to the policies and provide such customers the opportunity to “opt out” of the sharing of certain personal financial information with unaffiliated third parties. It also requires banks to safeguard personal information of consumer customers.
Some state laws also protect the privacy of information of state residents and require adequate security for such data, and certain state laws may, in some circumstances, require Green Dot Bank to notify affected individuals of security breaches of computer databases that contain their personal information. These laws may also require Green Dot Bank to notify law enforcement, regulators or consumer reporting agencies in the event of a data breach, as well as businesses and governmental agencies that own data.
Data privacy and data security are areas of increasing state legislative focus. For example, in June of 2018, the Governor of California signed into law the California Consumer Privacy Act of 2018 (“CCPA”). The CCPA, which became effective on January 1, 2020, applies to for-profit businesses that conduct business in California and meet certain revenue or data collection thresholds. The CCPA gives consumers the right to request disclosure of information collected about them, and whether that information has been sold or shared with others, the right to request deletion of personal information (subject to certain exceptions), the right to opt out of the sale of the consumer’s personal information and the right not to be discriminated against for exercising these rights. The CCPA contains several exemptions, including an exemption applicable to information that is collected, processed, sold or disclosed pursuant to the GLBA. The California Attorney General has not yet proposed or adopted regulations implementing the CCPA, and the California State Legislature has amended the Act since its passage. Because we have a physical footprint in California, we will be required to comply with the CCPA. The full impact of the CCPA on our business is yet to be determined. In addition, laws similar to the CCPA may be adopted by other states where we do business and the federal government may also pass data privacy or data security legislation.
Like other lenders, Green Dot Bank and other of our subsidiaries use credit bureau data in their underwriting activities. Use of such data is regulated under the Fair Credit Reporting Act (“FCRA”), and the FCRA also regulates reporting information to credit bureaus, prescreening individuals for credit offers, sharing of information between affiliates and using affiliate data for marketing purposes. Similar state laws may impose additional requirements on Green Dot Corporation and Green Dot Bank.
11
Consumer Protection Laws
The CFPB has broad rulemaking authority over a wide range of federal consumer protection laws that apply to banks and other providers of financial products and services, including the authority to prohibit “unfair, deceptive or abusive” acts and practices. For example, our deposit products and operations are subject to the following federal laws, among others:
• | the Truth in Savings Act and Regulation DD issued by the CFPB, which require disclosure of deposit terms to consumers; |
• | Regulation CC issued by the Federal Reserve, which relates to the availability of deposit funds to consumers; |
• | the Right to Financial Privacy Act, which imposes a duty to maintain the confidentiality of consumer financial records and prescribes procedures for complying with administrative subpoenas of financial records; and |
• | the Electronic Fund Transfer Act and Regulation E issued by the CFPB, which govern automatic deposits to and withdrawals from deposit accounts and customers’ rights and liabilities arising from the use of automated teller machines and other electronic banking services. |
The CFPB has also adopted amendments to Regulation E and Regulation Z to add protections for prepaid accounts (“CFPB Prepaid Rule”). The CFPB Prepaid Rule includes requirements related to treatment of funds on lost or stolen cards, error resolution and investigation, upfront fee disclosures, access to account information, and overdraft features if offered in conjunction with prepaid accounts. The CFPB Prepaid Rule became effective April 1, 2019.
Because Green Dot Bank has less than $10 billion in total consolidated assets, the Federal Reserve, and not the CFPB, is responsible for examining and supervising Green Dot Bank’s compliance with these and other federal consumer financial laws and regulations. In addition, the Dodd-Frank Act authorizes state attorneys general and state regulators to enforce consumer protection rules issued by the CFPB. State authorities have recently increased their focus on and enforcement of consumer protection rules.
Money Transmission Licensing and Regulation
Most U.S. states require licenses for persons engaged in the business of money transmission. These U.S. state licensing laws may subject money transmitters to periodic examinations and may require them and their agents to comply with federal and/or state anti-money laundering laws and regulations. We have obtained licenses to operate as a money transmitter in all U.S. jurisdictions in which such a license is required for us to conduct our business.
Payment Networks
In order to provide our products and services, we, as well as Green Dot Bank, are contracted members with Visa and MasterCard. Therefore, we and Green Dot Bank are subject to Visa and MasterCard’s respective payment network rules and standards. These rules and standards implicate a variety of our activities and services, including by imposing data security obligations, allocating liability for certain acts or omissions (including liability in the event of a data breach) and providing rules governing how consumers and merchants may use their cards. Payment networks may, and routinely do, modify these rules and standards as they determine in their sole discretion and with or without advance notice to us. These modifications may impose additional costs and expenses on, or may otherwise be disadvantageous to, our business. In addition, we are subject to audit by various payment networks. The payment networks may fine or penalize us or suspend our registration if those audits find that we have failed to comply with applicable rules and standards.
Escheatment Laws
Unclaimed property laws of every U.S. jurisdiction require that we track certain information on our card products and services and that, if customer funds are unclaimed at the end of an applicable statutory abandonment period, the proceeds of the unclaimed property be remitted to the appropriate jurisdiction. We manage escheatment law compliance with respect to our card products and services and have an ongoing program to comply with those laws. Statutory abandonment periods applicable to our card products and services typically range from three to seven years.
Employees
As of December 31, 2019, we had approximately 1,200 employees globally. None of our employees is represented by a labor union or is covered by a collective bargaining agreement. We have never experienced any employment-related work stoppages and consider relations with our employees to be good.
12
Other Information
We were incorporated in Delaware in 1999 and became a bank holding company under the BHC Act and a member bank of the Federal Reserve System in December 2011.
Our principal executive offices are located at 3465 East Foothill Boulevard, Pasadena, California 91107, and our telephone number is (626) 765-2000.
We maintain a website at www.greendot.com. We make available free of charge, on or through our website via the Investor Relations section at ir.greendot.com, our annual report on Form 10-K, quarterly reports on Form 10-Q, current reports on Form 8-K, and all amendments to those reports filed or furnished pursuant to Section 13(a) or 15(d) of the Exchange Act as soon as reasonably practicable after filing such material electronically or otherwise furnishing it to the Securities and Exchange Commission, or the SEC. References to website addresses in this report are intended to be inactive textual references only, and none of the information contained on our website is part of this report or incorporated in this report by reference.
13
ITEM 1A. Risk Factors
Risks Related to Our Business
Our operating results may fluctuate in the future, which could cause our stock price to decline.
Our quarterly and annual results of operations may fluctuate in the future as a result of a variety of factors, many of which are outside of our control. If our results of operations fall below the expectations of investors or any securities analysts who follow our Class A common stock, the trading price of our Class A common stock could decline substantially. Fluctuations in our quarterly or annual results of operations might result from a number of factors, including, but not limited to:
• | the timing and volume of purchases and use of our products and services; |
• | the timing and volume of tax refunds processed by us, including the impact of any general delays in tax refund disbursements from the U.S. and State Treasuries; |
• | the timing and success of new product or service introductions by us or our competitors; |
• | seasonality in the purchase or use of our products and services; |
• | changes in the level of interchange rates that can be charged; |
• | fluctuations in customer retention rates; |
• | changes in the mix of products and services that we sell; |
• | changes in the mix of retail distributors through which we sell our products and services; |
• | the timing of commencement, renegotiation or termination of relationships with significant retail distributors and BaaS platform partners; |
• | the timing of commencement of new product development and initiatives, the timing of costs of existing product roll-outs and the length of time we must invest in those new products, channels or retail distributors before they generate material operating revenues; |
• | our ability to effectively sell our products through direct-to-consumer initiatives; |
• | changes in our or our competitors’ pricing policies or sales terms; |
• | new product offerings from our competitors; |
• | costs associated with significant changes in our risk policies and controls; |
• | the amount and timing of costs related to fraud losses; |
• | the amount and timing of commencement and termination of major advertising campaigns, including sponsorships; |
• | the amount and timing of costs related to the acquisition of complementary businesses; |
• | the amount and timing of costs of any major litigation to which we are a party; |
• | disruptions in the performance of our products and services, including interruptions in the services we provide to other businesses, and the associated financial impact thereof; |
• | the amount and timing of capital expenditures and operating costs related to the maintenance and expansion of our business, operations and infrastructure; |
• | interest rate volatility; |
• | changes in our executive leadership team; |
• | accounting charges related to impairment of goodwill and other intangible assets; |
• | our ability to control costs, including third-party service provider costs and sales and marketing expenses in an increasingly competitive market; |
• | volatility in the trading price of our Class A common stock, which may lead to higher or lower stock-based compensation expenses; and |
• | changes in the political or regulatory environment affecting the banking, electronic payments or tax refund processing industries. |
14
The loss of operating revenues from Walmart or any of our largest retail distributors would adversely affect our business.
A significant portion of our operating revenues are derived from the products and services sold at our four largest retail distributors. As a percentage of total operating revenues, operating revenues derived from products and services sold at the store locations of Walmart was approximately 34% for the year ended December 31, 2019. We expect that Walmart will continue to have a significant impact on our operating revenues in future periods, particularly in our Account Services segment. It would be difficult to replace Walmart and the operating revenues derived from products and services sold at their stores. Accordingly, the loss of Walmart would have a material adverse effect on our business and results of operations. In addition, any publicity associated with the loss of any of our large retail distributors could harm our reputation, making it more difficult to attract and retain consumers and other retail distributors, and could lessen our negotiating power with our remaining and prospective retail distributors.
The term of our Walmart Money Card agreement (which governs the MoneyCard program) expires on January 31, 2027, unless renewed under its automatic renewal provision which provides for a one-year extension. Our contracts with our three other largest retail distributors have terms that expire at various dates between 2020 and 2022, with some subject to automatic renewal provisions. Our contracts with Walmart and our three other largest retail distributors can in limited circumstances, such as our material breach or insolvency or, in the case of Walmart, our failure to meet agreed-upon service levels, certain changes in control, and our inability or unwillingness to agree to requested pricing changes, be terminated by these retail distributors on relatively short notice. There can be no assurance that we will be able to continue our relationships with our largest retail distributors on the same or more favorable terms in future periods or that our relationships will continue beyond the terms of our existing contracts with them. Our operating revenues and results of operations could suffer if, among other things, any of our retail distributors renegotiates, terminates or fails to renew, or to renew on similar or favorable terms, its agreement with us or otherwise chooses to modify the level of support it provides for our products.
Our base of tax preparation partners is concentrated and the performance of our Processing and Settlement Services segment depends in part on our ability to retain existing partners.
If one or more of our major tax preparation partners were to substantially reduce or stop offering our services to their customers, our tax refund processing services business, a component of our Processing and Settlement Services segment, results of operations and financial condition would be harmed. Substantially all the revenues we generate from our tax refund processing services business have come from sales through a relatively small number of tax preparation firms. We do not have long-term contractual commitments from any of our current tax preparation partners and our tax preparation partners may elect to not renew their contracts with us with little or no advance notice. As a result, we cannot be assured that any of our current tax preparation partners will continue to partner with us past the terms in their current agreements. A termination of our relationships with certain tax preparation partners that provide commercial tax preparation software would result in lost revenue and the loss of the ability to secure future relationships with new or existing tax preparation firms that use such tax software.
Our future success depends upon the active and effective promotion of our products and services by retail distributors and tax preparation partners, but their interests and operational decisions might not always align with our interests.
Most of our operating revenues are derived from our products and services sold at the stores of our retail distributors. In addition, a large portion of our Processing and Settlement Services revenues is dependent on tax preparation partners as the revenues we generate from our tax refund processing services are largely derived from products and services sold through retail tax preparation businesses and income tax software providers. Revenues from our retail distributors and tax preparation partners depend on a number of factors outside our control and may vary from period to period. Because we compete with many other providers of products and services, including competing prepaid cards and tax refund processing services, for placement and promotion of products in the stores of our retail distributors or in conjunction with the delivery of tax preparation services by our tax preparation providers, our success depends on our retail distributors and tax preparation partners and their willingness to promote our products and services successfully. In general, our contracts with these third parties allow them to exercise significant discretion over the placement and promotion of our products and services; they could give higher priority to the products and services of other companies for a variety of reasons. Accordingly, losing the support of our retail distributors and tax preparation partners might limit or reduce the sales of our products and services. Our operating revenues and operating expenses may also be negatively affected by operational decisions by our retail distributors and tax preparation partners. For example, if a retail distributor reduces shelf space for our products or implements changes in its systems that disrupt the integration between its systems and ours, our product sales could be reduced or decline and we may incur additional merchandising costs to ensure our products are appropriately stocked. Similarly, for a variety of reasons, many of our tax preparation partners that provide commercial income tax preparation software offer their customers several types
15
for tax refund processing services, including those of our competitors. Even if our retail distributors and tax preparation partners actively and effectively promote our products and services, there can be no assurance that their efforts will maintain or result in growth of our operating revenues.
We make significant investments in products and services that may not be successful.
Our prospects for growth depend on our ability to innovate by offering new, and adding value to our existing, product and service offerings and on our ability to effectively commercialize such innovations. We will continue to make investments in research, development, and marketing for new products and services. Investments in new products and services are speculative. Commercial success depends on many factors, including innovativeness, price, the competitive environment and effective distribution and marketing. If customers do not perceive our new offerings as providing significant value, they may fail to accept our new products and services, which would negatively impact our operating revenues. We may not achieve significant operating revenues from new product and service investments for a number of years, if at all. Moreover, new products and services may not be profitable, and even if they are profitable, operating margins for new products and services may not be as high as the margins we have experienced in the past.
Future revenue growth depends on our ability to retain and attract new long-term users of our products.
Our ability to increase account usage and account holder retention and to attract new long-term users of our products can have a significant impact on our operating revenues. We may be unable to generate increases in account usage, account holder retention or attract new long-term users of our products for a number of reasons, including if we are unable to maintain our existing distribution channels, predict accurately consumer preferences or industry changes and modify our products and services on a timely basis in response thereto, produce new features and services that appeal to existing and prospective customers, and influence account holder behavior through cardholder retention and usage incentives. Our results of operations could vary materially from period to period based on the degree to which we are successful in increasing usage and retention and attracting long-term users of our products. Additionally, while the impact on our total operating revenues from the decline in total number of active accounts in our Account Services segment in recent periods has been limited, if this trend persists over a long period or deteriorates more rapidly in the short term, our financial results would be materially impacted.
Seasonal fluctuations in the use of our products and services impact our results of operations and cash flows.
Our results of operations and cash flows vary from quarter to quarter, and periodically decline, due to the seasonal nature of the use of our products and services. For example, our results of operations for the first half of each year have been favorably affected by large numbers of taxpayers electing to receive their tax refunds via direct deposit on our accounts, which caused our operating revenues to be typically higher in the first half of those years than they were in the corresponding second half of those years. Our tax refund processing services business is also highly seasonal as it generates the substantial majority of its revenue in the first quarter, and substantially all of its revenue in the first half of each calendar year. To the extent that seasonal fluctuations become more pronounced, or are not offset by other factors, our results of operations and cash flows from operating activities could fluctuate materially from period to period.
The industries in which we compete are highly competitive, which could adversely affect our results of operations.
The industries in which we compete are highly competitive and subject to rapid and significant changes. We compete against companies and financial institutions across the retail banking, financial services, transaction processing, consumer technology and financial technology services industries and may compete with others in the market who may in the future provide offerings similar to ours, particularly vendors who may provide program management and other services though a platform similar to our BaaS platform. These and other competitors in the banking and electronic payments industries are introducing innovative products and services that may compete with ours. We expect that this competition will continue as banking and electronic payments industries continue to evolve, particularly if non-traditional payments processors and other parties gain greater market share in these industries. If we are unable to differentiate our products and platform from and successfully compete with those of our competitors, our business, results of operations and financial condition will be materially and adversely affected.
Many existing and potential competitors are entities substantially larger in size, more highly diversified in revenue and substantially more established with significantly more broadly known brand awareness than ours. As such, many of our competitors can leverage their size, robust networks, financial wherewithal, brand awareness, pricing power and technological assets to compete with us. Additionally, some of our current and potential competitors are subject to fewer regulations and restrictions than we are, and thus may be able to respond more quickly in the face of regulatory
16
and technological changes. We are also experiencing increased price competition as a result of new entrants offering free or low-cost alternatives to our products and services. To the extent these new entrants gain market share, we expect that the purchase and use of our products and services would decline. If price competition materially intensifies, we may have to increase the incentives that we offer to our retail distributors and our tax preparation partners and decrease the prices of our products and services, any of which would likely adversely affect our results of operations.
Our long-term success depends on our ability to compete effectively against existing and potential competitors that seek to provide banking and electronic payment products and services or tax refund processing services. If we fail to compete effectively against these competitors, our revenues, results of operations, prospects for future growth and overall business could be materially and adversely affected.
Our business is dependent on the efficient and uninterrupted operation of computer network systems and data centers, including third party systems, and any disruption in the operations of these systems and data centers could materially and adversely affect our business.
Our ability to provide reliable service to customers and other network participants depends on the efficient and uninterrupted operation of our computer network systems and data centers as well as those of our retail distributors, network acceptance members and third-party processors. Our business involves the movement of large sums of money, processing of large numbers of transactions and management of the data necessary to do both. Our success in our account programs, including our BaaS programs, as well as our processing and settlement services, depends upon the efficient and error-free handling of the money that is collected, remitted or deposited in connection with the provision of our products and services. We rely on the ability of our employees, systems and processes and those of the banks that issue our cards, our retail distributors, tax refund preparation partners, other business partners and third-party processors to process and facilitate these transactions in an efficient, uninterrupted and error-free manner. Their failure to do so could materially and adversely impact our operating revenues and results of operations, particularly during the tax season, when we derive substantially all of our operating revenues for our tax refund processing services and a significant portion of our other operating revenues.
Our systems and the systems of third-party processors are susceptible to outages and interruptions due to fire, natural disaster, power loss, telecommunications failures, software or hardware defects, terrorist attacks and similar events. We use both internally developed and third-party systems, including cloud computing and storage systems, for our services and certain aspects of transaction processing. Interruptions in our service may result for a number of reasons. For example, the data center hosting facilities that we use could be closed without adequate notice or suffer unanticipated problems resulting in lengthy interruptions in our service. Moreover, as we continue to add data centers and add capacity in our existing data centers, we could experience problems transferring customer accounts and data, impairing the delivery of our service.
Any damage to, or failure of, our processes or systems generally, or those of our vendors (including as a result of disruptions at our third-party data center hosting facilities and cloud providers), or an improper action by our employees, agents or third-party vendors, could result in interruptions in our service, causing customers, retail distributors and other partners to become dissatisfied with our products and services or obligate us to issue credits or pay fines or other penalties to them. Sustained or repeated process or system failures could reduce the attractiveness of our products and services, including our BaaS platform, and result in contract terminations, thereby reducing operating revenue and harming our results of operations. Further, negative publicity arising from these types of disruptions could be damaging to our reputation and may adversely impact use of our products and services, including our BaaS platform, and adversely affect our ability to attract new customers and business partners. Additionally, some of our contracts with retail distributors, including our contract with Walmart, contain service level standards pertaining to the operation of our systems, and provide the retail distributor with the right to collect damages and potentially to terminate its contract with us for system downtime exceeding stated limits. If we face system interruptions or failures, our business interruption insurance may not be adequate to cover the losses or damages that we incur.
If we are unable to keep pace with the rapid technological developments in our industry and the larger electronic payments industry necessary to continue providing our BaaS platform partners and cardholders with new and innovative products and services, the use of our cards and other products and services could decline.
The electronic payments industry is subject to rapid and significant technological changes. We cannot predict the effect of technological changes on our business. We rely in part on third parties for the development of, and access to, new technologies. We expect that new services and technologies applicable to our industry will continue to emerge, and these new services and technologies may be superior to, or render obsolete, the technologies we currently utilize in our products and services. Additionally, we may make future investments in, or enter into strategic alliances to develop, new technologies and services or to implement infrastructure change to further our strategic objectives,
17
strengthen our existing businesses and remain competitive. However, our ability to transition to new services and technologies that we develop may be inhibited by a lack of industry-wide standards, by resistance from our retail distributors, BaaS platform partners, third-party processors or consumers to these changes, or by the intellectual property rights of third parties. Our future success will depend, in part, on our ability to develop new technologies and adapt to technological changes and evolving industry standards. These initiatives are inherently risky, and they may not be successful or may have an adverse effect on our business, financial condition and results of operations.
Fraudulent and other illegal activity involving our products and services could lead to reputational damage to us, reduce the use and acceptance of our cards and reload network, reduce the use of our tax refund processing services, and may adversely affect our financial position and results of operations.
Criminals are using increasingly sophisticated methods to engage in illegal activities using deposit account products (including prepaid cards), reload products, or customer information. Illegal activities involving our products and services often include malicious social engineering schemes. Illegal activities may also include fraudulent payment or refund schemes and identity theft. We rely upon third parties for transaction processing services, which subjects us and our customers to risks related to the vulnerabilities of those third parties. A single significant incident of fraud, or increases in the overall level of fraud, involving our cards and other products and services, have in the past and could in the future, result in reputational damage to us. Such damage could reduce the use and acceptance of our cards and other products and services, cause retail distributors to cease doing business with us, or lead to greater regulation that would increase our compliance costs. Fraudulent activity could also result in the imposition of regulatory sanctions, including significant monetary fines, which could adversely affect our business, results of operations and financial condition.
In addition, to address the challenges we face with respect to fraudulent activity, we have implemented risk control mechanisms that have made it more difficult for all customers, including legitimate customers, to obtain and use our products and services. We believe it is likely that our risk control mechanisms may continue to adversely affect our new card activations for the foreseeable future and that our operating revenues will be negatively impacted as a result.
As a bank holding company, we are subject to extensive and potentially changing regulation and may be required to serve as a source of strength for Green Dot Bank, which may adversely affect our business, financial position and results of operations.
As a bank holding company, we are subject to comprehensive supervision and examination by the Federal Reserve Board and the State of Utah Department of Financial Institutions and must comply with applicable regulations and other commitments we have agreed to, including financial commitments in respect to minimum capital and leverage requirements. If we fail to comply with any of these requirements, we may become subject to formal or informal enforcement actions, proceedings, or investigations, which could result in regulatory orders, restrictions on our business operations or requirements to take corrective actions, which may, individually or in the aggregate, affect our results of operations and restrict our ability to grow. If we fail to comply with the applicable capital and leverage requirements, or if our subsidiary bank fails to comply with its applicable capital and leverage commitments, the Federal Reserve Board may limit our ability to pay dividends or fund stock repurchases, or if we become less than adequately capitalized, require us to raise additional capital. In addition, as a bank holding company and a financial holding company, we are generally prohibited from engaging, directly or indirectly, in any activities other than those permissible for bank holding companies and financial holding companies. This restriction might limit our ability to pursue future business opportunities which we might otherwise consider but which might fall outside the scope of permissible activities.
A substantial portion of Green Dot Bank’s deposit liabilities are currently classified as brokered deposits, and the failure by Green Dot Bank to maintain its status as a "well-capitalized" institution could have a serious adverse effect on Green Dot Bank’s ability to conduct key portions of its current deposit-taking activity.
A vast majority of Green Dot Bank’s deposits are currently classified as brokered. If Green Dot Bank ceases to be categorized as “well capitalized” under banking regulations, it could be prohibited from accepting, renewing or rolling over brokered deposits without the consent of the FDIC. In such a case, the FDIC’s refusal to grant consent to our accepting, renewing or rolling over brokered deposits could materially adversely affect the financial condition and operations of Green Dot Bank and the Company and could effectively restrict the ability of Green Dot Bank to operate its business lines as presently conducted.
In February 2020, the FDIC released a notice of proposed rulemaking seeking comment on proposed revisions to its regulations relating to the brokered deposits restrictions that apply to less than well capitalized insured depository institutions. The FDIC states in the notice of proposed rulemaking that through the proposed changes, it intends to modernize its brokered deposit regulations to reflect recent technological changes and innovations. The proposed rule would create a new framework for analyzing certain provisions of the “deposit broker” definition, which will affect the classification of deposits as “brokered”. We cannot predict whether or when the proposed rule will be implemented and whether it will result in a change in the way our deposits are classified.
18
We operate in a highly regulated environment, and failure by us, the banks that issue our cards, the businesses that participate in our reload network, the banks that assist with our tax refund processing services, and our tax preparation partners to comply with applicable laws and regulations could have an adverse effect on our business, financial position and results of operations.
We operate in a highly regulated environment, and failure by us, the banks that issue our cards or the businesses that participate in our reload network or other business partners to comply with the laws and regulations to which we are subject could negatively impact our business. We are subject to state money transmission licensing requirements and a wide range of federal and other state laws and regulations. In particular, our products and services are subject to an increasingly strict set of legal and regulatory requirements intended to protect consumers and to help detect and prevent money laundering, terrorist financing and other illicit activities. For example, we are subject to the anti-money laundering reporting and recordkeeping requirements of the Bank Secrecy Act (“BSA”), as amended by the PATRIOT Act. In addition, legal requirements relating to the collection, storage, handling, use, disclosure, transfer, and security of personal data continue to increase, along with enforcement actions and investigations by regulatory authorities related to data security incidents and privacy violations.
Many of these laws and regulations are evolving, can be unclear and inconsistent across various jurisdictions, and ensuring compliance with them is difficult and costly. Failure by us or those businesses to comply with the laws and regulations to which we are or may become subject could result in fines, penalties or limitations on our ability to conduct our business, or federal or state actions, any of which could significantly harm our reputation with consumers, banks that issue our cards and regulators, and could materially and adversely affect our business, operating results and financial condition.
Changes in laws and regulations to which we are subject, or to which we may become subject, may increase our costs of operation, decrease our operating revenues and disrupt our business.
The banking, financial technology, transaction processing and tax refund processing services industries are highly regulated and, from time to time, the federal and state laws and regulations affecting these industries, and the manner in which they are interpreted, are subject to change and legal action. Accordingly, changes in laws and regulations or the interpretation or enforcement thereof may occur that could increase our compliance and other costs of doing business, require significant systems redevelopment, or render our products or services less profitable or obsolete, any of which could have an adverse effect on our results of operations. For example, we could face more stringent anti-money laundering rules and regulations, as well as more stringent licensing rules and regulations, compliance with which could be expensive and time consuming. In addition, adverse rulings relating to the industries in which we participate could cause our products and services to be subject to additional laws and regulations, which could make our products and services less profitable.
If additional regulatory requirements were imposed on the sale of our products and services and our bank, the requirements could lead to a loss of retail distributors, tax preparation partners or other business partners, which, in turn, could materially and adversely impact our operations. Moreover, if our products are adversely impacted by the interpretation or enforcement of these regulations or if we or any of our retail distributors or tax preparation partners were unwilling or unable to make any such operational changes to comply with the interpretation or enforcement thereof, we would no longer be able to sell our products and services through that noncompliant retail distributor or tax preparation partner, which could have a material adverse effect on our business, financial position and results of operations.
From time to time, federal and state legislators and regulatory authorities, including state attorney generals, increase their focus on the banking, consumer financial services and tax preparation industries and may propose and adopt new legislation that could result in significant adverse changes in the regulatory landscape for financial institutions and financial services companies.
If new regulations or laws result in changes in the way we are regulated, these regulations could expose us to increased regulatory oversight, more burdensome regulation of our business, and increased litigation risk, each of which could increase our costs and decrease our operating revenues. Furthermore, limitations placed on the fees we charge or the disclosures that must be provided with respect to our products and services could increase our costs and decrease our operating revenues.
Changes in rules or standards set by the payment networks, such as Visa and MasterCard, or changes in debit network fees or products or interchange rates, could adversely affect our business, financial position and results of operations.
We are subject to association rules that could subject us to a variety of fines or penalties that may be levied by the card associations or networks for acts or omissions by us or businesses that work with us, including card processors,
19
such as MasterCard PTS. The termination of the card association registrations held by us or any changes in card association or other debit network rules or standards, including interpretation and implementation of existing rules or standards, that increase the cost of doing business or limit our ability to provide our products and services could have an adverse effect on our business, operating results and financial condition. In addition, from time to time, card associations may increase the fees that they charge, which could increase our operating expenses, reduce our profit margin and adversely affect our business, results of operations and financial condition.
Furthermore, a substantial portion of our operating revenues is derived from interchange fees. For the year ended December 31, 2019, interchange revenues represented 29.8% of our total operating revenues, and we expect interchange revenues to continue to represent a significant percentage of our total operating revenues. The amount of interchange revenues that we earn is highly dependent on the interchange rates that the payment networks set and adjust from time to time.
The enactment of the Dodd-Frank Act required the Federal Reserve Board to implement regulations that have substantially limited interchange fees for many issuers. While the interchange rates that may be earned by us and our subsidiary bank are exempt from the limitations imposed by the Dodd-Frank Act, there can be no assurance that future regulation or changes by the payment networks will not impact our interchange revenues substantially. If interchange rates decline, whether due to actions by the payment networks or future regulation, we would likely need to change our fee structure to offset the loss of interchange revenues. However, our ability to make these changes is limited by the terms of our contracts and other commercial factors, such as price competition. To the extent we increase the pricing of our products and services, we might find it more difficult to acquire consumers and to maintain or grow card usage and customer retention, and we could suffer reputational damage and become subject to greater regulatory scrutiny. We also might have to discontinue certain products or services. As a result, our total operating revenues, operating results, prospects for future growth and overall business could be materially and adversely affected.
Our actual operating results may differ significantly from our guidance.
From time to time, we issue guidance in our quarterly earnings conference calls, or otherwise, regarding our future performance that represents our management’s estimates as of the date of release. This guidance, which constitutes forward-looking statements, is based upon a number of management's assumptions and estimates that, while presented with numerical specificity, are inherently subject to significant business, economic and competitive uncertainties and contingencies, many of which are beyond our control, and are based upon specific assumptions with respect to future business decisions, some of which will change. While we have stated and we intend to continue to state possible outcomes as high and low ranges that are intended to provide a sensitivity analysis as variables are changed, we can provide no assurances that actual results will not fall outside of the suggested ranges.
The principal reason that we release guidance is to provide a basis for our management to discuss our business outlook with analysts and investors. We do not accept any responsibility for any projections or reports published by any of these persons.
Guidance is necessarily speculative in nature, and it can be expected that some or all of the assumptions underlying the guidance furnished by us will prove to be incorrect or will vary significantly from actual results. For example, on a number of occasions over the last several years we adjusted our revenue guidance when actual results varied from our assumptions. Accordingly, our guidance is only an estimate of what management believes is realizable as of the date of release. Actual results will vary from our guidance and the variations may be material.
Any failure to implement our operating strategy successfully or the occurrence of any of the events or circumstances set forth in this Item 1A could result in our actual operating results being different from our guidance, and such differences may be adverse and material.
We receive important services from third-party vendors. Replacing them would be difficult and disruptive to our business.
Some services relating to our business, including fraud management and other customer verification services, transaction processing and settlement, card production, and customer service, are outsourced to third-party vendors. We also depend on third-party banks to assist with our tax refund processing services. It would be difficult to replace some of our third-party vendors in a timely manner if they were unwilling or unable to provide us with these services during the term of their agreements with us and our business and operations could be adversely affected. In particular, due to the seasonality in our business, any material service interruptions or service delays with key vendors during the tax season could result in losses that have an even greater adverse effect on that business than would be the case with our overall business.
20
Our business could suffer if there is a decline in the use of prepaid cards as a payment mechanism or there are adverse developments with respect to the prepaid financial services industry in general.
As the prepaid financial services industry evolves, consumers may find prepaid financial services to be less attractive than traditional or other financial services. Consumers might not use prepaid financial services for any number of reasons, including the general perception of our industry, new technologies and a decrease in our distribution partners’ willingness to sell these products as a result of a more challenging regulatory environment. If consumers do not continue or increase their usage of prepaid cards, including making changes in the way prepaid cards are loaded, our operating revenues may decline. Any projected growth for the industry may not occur or may occur more slowly than estimated. If consumer acceptance of prepaid financial services does not continue to develop or develops more slowly than expected or if there is a shift in the mix of payment forms, such as cash, credit cards, traditional debit cards and prepaid cards, away from our products and services, it could have a material adverse effect on our financial position and results of operations.
A data security breach could expose us to liability and protracted and costly litigation, and could adversely affect our reputation and operating revenues.
We and our retail distributors, tax preparation partners, network acceptance members, third-party processors and the merchants that accept our cards receive, transmit and store confidential customer and other information in connection with the sale and use of our products and services. Our encryption software and the other technologies we use to provide security for storage, processing and transmission of confidential customer and other information may not be effective to protect against data security breaches by third parties. The risk of unauthorized circumvention of our security measures has been heightened by advances in computer capabilities and the increasing sophistication of hackers. Our retail distributors, tax preparation partners, network acceptance members, other business partners, third-party processors and the merchants that accept our cards also may experience similar security breaches involving the receipt, transmission and storage of our confidential customer and other information. Improper access to our or these third parties’ systems or databases could result in the theft, publication, deletion or modification of confidential customer and other information.
A data security breach of the systems on which sensitive cardholder or other customer or end-customer data and account information are stored could lead to fraudulent activity involving our products and services, reputational damage and claims or regulatory actions against us. If we are sued in connection with any data security breach, we could be involved in protracted and costly litigation. If unsuccessful in defending that litigation, we might be forced to pay damages and/or change our business practices, any of which could have a material adverse effect on our operating revenues and profitability. We would also likely have to pay (or indemnify the banks that issue our cards for) fines, penalties and/or other assessments imposed by Visa or MasterCard as a result of any data security breach. Further, a significant data security breach could lead to additional regulation, which could impose new and costly compliance obligations. In addition, a data security breach at one of the third-party banks that issue our cards or at our retail distributors, tax preparation partners, network acceptance members, other business partners, third-party processors or the merchants that accept our cards could result in significant reputational harm to us and cause the use and acceptance of our cards or other products and services to decline, either of which could have a significant adverse impact on our operating revenues and future growth prospects. Moreover, it may require substantial financial resources to address and remediate any such breach, including additional costs for replacement cards, manufacturing, distribution, re-stocking fees, fraud monitoring and other added security measures, among others, which could have a significant adverse impact on our operating results.
Litigation or investigations could result in significant settlements, fines or penalties.
We are subject to regulatory oversight in the normal course of our business and have been and from time to time may be subject to securities class actions and other litigation or regulatory or judicial proceedings or investigations. The outcome of litigation and regulatory or judicial proceedings or investigations is difficult to predict. Plaintiffs or regulatory agencies or authorities in these matters may seek recovery of very large or indeterminate amounts, seek to have aspects of our business suspended or modified or seek to impose sanctions, including significant monetary fines. The monetary and other impact of these actions, litigations, proceedings or investigations may remain unknown for substantial periods of time. The cost to defend, settle or otherwise resolve these matters may be significant. Further, an unfavorable resolution of litigation, proceedings or investigations against us could have a material adverse effect on our business, operating results, or financial condition. In this regard, such costs could make it more difficult to maintain the capital, leverage and other financial commitments at levels we have agreed to with the Federal Reserve Board and the Utah Department of Financial Institutions. If regulatory or judicial proceedings or investigations were to be initiated against us by private or governmental entities, adverse publicity that may be associated with these proceedings or investigations could negatively impact our relationships with retail distributors, tax preparation partners, network acceptance members, other business partners and card processors and decrease acceptance and use of,
21
and loyalty to, our products and related services, and could impact the price of our Class A common stock. In addition, such proceedings or investigations could increase the risk that we will be involved in litigation. The outcome of any such litigation is difficult to predict and the cost to defend, settle or otherwise resolve these matters may be significant. For the foregoing reasons, if regulatory or judicial proceedings or investigations were to be initiated against us by private or governmental entities, our business, results of operations and financial condition could be adversely affected or our stock price could decline.
We may be unable to adequately protect our brand and our intellectual property rights related to our products and services or third parties may allege that we are infringing their intellectual property rights.
The Green Dot, GoBank, MoneyPak, TPG and other brands and marks are important to our business, and we utilize trademark registrations and other means to protect them. Our business would be harmed if we were unable to protect our brand against infringement and its value was to decrease as a result.
We rely on a combination of patent, trademark and copyright laws, trade secret protection and confidentiality and license agreements to protect the intellectual property rights related to our products and services. We currently have 12 issued patents and 6 patent applications pending. Although we generally seek patent protection for inventions and improvements that we anticipate will be incorporated into our products and services, there is always a chance that our patents or patent applications could be challenged, invalidated or circumvented, or that an issued patent will not adequately cover the scope of our inventions or improvements incorporated into our products or services. Additionally, our patents could be circumvented by third-parties.
We may unknowingly violate the intellectual property or other proprietary rights of others and, thus, may be subject to claims by third parties. These assertions may increase over time as a result of our growth and the general increase in the pace of patent claims assertions, particularly in the United States. Because of the existence of a large number of patents in the mobile technology field, the secrecy of some pending patents, and the rapid rate of issuance of new patents, it is not economically practical or even possible to determine in advance whether a product or any of its elements infringes or will infringe on the patent rights of others. Regardless of the merit of these claims, we may be required to devote significant time and resources to defending against these claims or to protecting and enforcing our own rights. We might also be required to develop a non-infringing technology or enter into license agreements and there can be no assurance that licenses will be available on acceptable terms and conditions, if at all. Some of our intellectual property rights may not be protected by intellectual property laws, particularly in foreign jurisdictions. The loss of our intellectual property or the inability to secure or enforce our intellectual property rights or to defend successfully against an infringement action could harm our business, results of operations, financial condition and prospects.
We are exposed to losses from customer accounts.
Fraudulent activity involving our products may lead to customer disputed transactions, for which we may be liable under banking regulations and payment network rules. Our fraud detection and risk control mechanisms may not prevent all fraudulent or illegal activity. To the extent we incur losses from disputed transactions, our business, results of operations and financial condition could be materially and adversely affected.
Additionally, our cardholders can incur charges in excess of the funds available in their accounts, and we may become liable for these overdrafts. While we decline authorization attempts for amounts that exceed the available balance in a cardholder’s account, the application of card association rules, the timing of the settlement of transactions and the assessment of the card’s monthly maintenance fee, among other things, can result in overdrawn accounts.
Maintenance fee assessment overdrafts occur as a result of our charging a cardholder, pursuant to the card’s terms and conditions, the monthly maintenance fee at a time when he or she does not have sufficient funds in his or her account. Our remaining overdraft exposure arises primarily from late-posting. A late-post occurs when a merchant posts a transaction within a payment network-permitted timeframe but subsequent to our release of the authorization for that transaction, as permitted by card association rules. Under card association rules, we may be liable for the amount of the transaction even if the cardholder has made additional purchases in the intervening period and funds are no longer available on the card at the time the transaction is posted.
We consider overdrawn account balances to be our receivables due from cardholders. We maintain reserves to cover the risk that we may not recover these receivables due from our cardholders, but our exposure may increase above these reserves for a variety of reasons, including our failure to predict the actual recovery rate accurately. To the extent we incur losses from overdrafts above our reserves or we determine that it is necessary to increase our reserves substantially, our business, results of operations and financial condition could be materially and adversely affected.
22
Acquisitions or investments could disrupt our business and harm our financial condition.
We have in the past acquired, and we expect to acquire in the future, other businesses and technologies. The process of integrating an acquired business, product, service or technology can involve a number of special risks and challenges, including:
• | increased regulatory and compliance requirements; |
• | implementation or remediation of controls, procedures and policies at the acquired company; |
• | diversion of management time and focus from operation of our then-existing business; |
• | integration and coordination of product, sales, marketing, program and systems management functions; |
• | transition of the acquired company’s users and customers onto our systems; |
• | integration of the acquired company’s accounting, information management, human resource and other administrative systems and operations generally with ours; |
• | integration of employees from the acquired company into our organization; |
• | loss or termination of employees, including costs associated with the termination or replacement of those employees; |
• | liability for activities of the acquired company prior to the acquisition, including violations of law, commercial disputes, and tax and other known and unknown liabilities; and |
• | increased litigation or other claims in connection with the acquired company, including claims brought by terminated employees, customers, former stockholders or other third parties. |
If we are unable to successfully integrate an acquired business or technology or otherwise address these special risks and challenges or other problems encountered in connection with an acquisition, we might not realize the anticipated benefits of that acquisition, we might incur unanticipated liabilities or we might otherwise suffer harm to our business generally. Unanticipated costs, delays or other operational or financial problems related to integrating the acquired company and business with our company may result in the diversion of our management's attention from other business issues and opportunities. To integrate acquired businesses, we must implement our technology systems in the acquired operations and integrate and manage the personnel of the acquired operations. We also must effectively integrate the different cultures of acquired business organizations into our own in a way that aligns various interests and may need to enter new markets in which we have no or limited experience and where competitors in such markets have stronger market positions. Failures or difficulties in integrating the operations of the businesses that we acquire, including their personnel, technology, compliance programs, risk management systems, financial systems, distribution and general business operations and procedures, marketing, promotion and other relationships, may affect our ability to grow and may result in us incurring asset impairment or restructuring charges. Furthermore, acquisitions and investments are often speculative in nature and the actual benefits we derive from them could be lower or take longer to materialize than we expect.
To the extent we pay the consideration for any future acquisitions or investments in cash, it would reduce the amount of cash available to us for other purposes. Future acquisitions or investments could also result in dilutive issuances of our equity securities or the incurrence of debt, contingent liabilities, amortization expenses, or goodwill impairment charges, any of which could harm our financial condition and negatively impact our stockholders.
An impairment charge of goodwill or other intangible assets could have a material adverse impact on our financial condition and results of operations.
Because we have grown in part through acquisitions, our net goodwill and intangible assets represent a significant portion of our consolidated assets. Our net goodwill and intangible assets were $521.0 million as of December 31, 2019. Under accounting principles generally accepted in the United States, or U.S. GAAP, we are required to test the carrying value of goodwill and intangible assets at least annually or sooner if events occur that indicate impairment could exist. These events or circumstances could include a significant change in the business climate, including a significant sustained decline in a reporting unit’s fair value, legal and regulatory factors, operating performance indicators, competition and other factors.
U.S. GAAP requires us to assign and then test goodwill at the reporting unit level. If over a sustained period of time we experience a decrease in our stock price and market capitalization, which may serve as an estimate of the fair value of our reporting unit, this may be an indication of impairment. If the fair value of our reporting unit is less than its net book value, we may be required to record goodwill impairment charges in the future. In addition, if the
23
revenue and cash flows generated from any of our other intangible assets is not sufficient to support its net book value, we may be required to record an impairment charge. The amount of any impairment charge could be significant and could have a material adverse impact on our financial condition and results of operations for the period in which the charge is taken.
We face settlement risks from our distributors and banking partners, which may increase during an economic downturn.
The majority of our business is conducted through retail distributors that sell our products and services to consumers at their store locations. Our retail distributors collect funds from the consumers who purchase our products and services and then must remit these funds directly to accounts established for the benefit of these consumers at the banks that issue our cards. The remittance of these funds by the retail distributor takes on average two business days. If a retail distributor becomes insolvent, files for bankruptcy, commits fraud or otherwise fails to remit proceeds to our card issuing bank from the sales of our products and services, we are liable for any amounts owed to our customers. As of December 31, 2019, we had assets subject to settlement risk of $239.2 million. Given the possibility of recurring volatility in global financial markets, the approaches we use to assess and monitor the creditworthiness of our retail distributors may be inadequate, and we may be unable to detect and take steps to mitigate an increased credit risk in a timely manner.
Economic downturns could result in settlement losses, whether or not directly related to our business. We are not insured against these risks. Significant settlement losses could have a material adverse effect on our business, results of operations and financial condition.
Economic, political and other conditions may adversely affect trends in consumer spending.
The electronic payments industry, including the prepaid financial services segment within that industry, depends heavily upon the overall level of consumer spending. If conditions in the United States become uncertain or deteriorate, we may experience a reduction in the number of our accounts that are purchased or reloaded, the number of transactions involving our cards and the use of our reload network and related services. A sustained reduction in the use of our products and related services, either as a result of a general reduction in consumer spending or as a result of a disproportionate reduction in the use of card-based payment systems, would materially harm our business, results of operations and financial condition.
We must be able to operate and scale our technology effectively.
Our ability to continue to provide our products and services to network participants, as well as to enhance our existing products and services and offer new products and services, is dependent on our information technology systems. If we are unable to manage and scale the technology associated with our business effectively, we could experience increased costs, reductions in system availability and losses of our network participants. Any failure of our systems in scalability and functionality would adversely impact our business, financial condition and results of operations.
Our future success depends on our ability to attract, integrate, retain and incentivize key personnel.
Our future success will depend, to a significant extent, on our ability to attract, integrate, retain and recognize key personnel, namely our management team and experienced sales, marketing and program and technology development personnel. Replacing departing key personnel can involve organizational disruption and uncertainty. We have experienced transitions among our executive officers, including the departures of our founder, President and Chief Executive Officer, Steven W. Streit, as well as our Chief Revenue Officer and Chief Financial Officer since December 31, 2019. We are currently searching for a permanent Chief Executive Officer and Chief Financial Officer. If we fail to manage these transitions successfully, we could experience significant delays or difficulty in the achievement of our development and strategic objectives and our business, financial condition and results of operations could be materially and adversely harmed. We must retain and motivate existing personnel, and we must also attract, assimilate and motivate additional highly-qualified employees. We may experience difficulty in managing transitions and assimilating our newly-hired personnel, which may adversely affect our business. Competition for qualified management, sales, marketing and program and technology development personnel can be intense. Competitors have in the past and may in the future attempt to recruit our top management and employees. If we fail to attract, integrate, retain and incentivize key personnel, our ability to manage and grow our business could be harmed. If we fail to manage any future transitions successfully, we could experience significant delays or difficulty in the achievement of our development and strategic objectives and our business, financial condition and results of operations could be materially and adversely harmed. We must retain and motivate existing personnel, and we must also attract, assimilate and motivate additional highly-qualified employees. We may experience difficulty in managing transitions and assimilating our newly-hired personnel, which may adversely affect our business. Competition for qualified management, sales, marketing and program and
24
technology development personnel can be intense. In order to attract and retain personnel in a competitive marketplace, we must provide competitive pay packages, including cash and equity-based compensation and the volatility in our stock price may from time to time adversely affect our ability to recruit or retain employees. Competitors have in the past and may in the future attempt to recruit our top management and employees. If we fail to attract, integrate, retain and incentivize key personnel, our ability to manage and grow our business could be harmed.
We might require additional capital to support our business in the future, and this capital might not be available on acceptable terms, or at all.
If our unrestricted cash and cash equivalents balances and any cash generated from operations are not sufficient to meet our future cash requirements, we will need to access additional capital to fund our operations. We may also need to raise additional capital to take advantage of new business or acquisition opportunities. We may seek to raise capital by, among other things:
• | issuing additional shares of our Class A common stock or other equity securities; |
• | issuing convertible or other debt securities; and |
• | borrowing funds under a credit facility. |
We may not be able to raise needed cash in a timely basis on terms acceptable to us or at all. Financings, if available, may be on terms that are dilutive or potentially dilutive to our stockholders. The holders of new securities may also receive rights, preferences or privileges that are senior to those of existing holders of our Class A common stock. In addition, if we were to raise cash through a debt financing, the terms of the financing might impose additional conditions or restrictions on our operations that could adversely affect our business. If we require new sources of financing but they are insufficient or unavailable, we would be required to modify our operating plans to take into account the limitations of available funding, which would harm our ability to maintain or grow our business.
Some of our operations, including a significant portion of our software development operations, are located outside of the United States, which subjects us to additional risks, including increased complexity and costs of managing international operations and geopolitical instability.
We have significantly expanded our software development operations in Shanghai, China and we expect to continue to increase headcount and infrastructure as we scale our operations in this region. A prolonged disruption at our China facility for any reason due to natural- or man-made disasters, natural disasters, outbreaks of pandemic disease, climate change or other events outside of our control, such as equipment malfunction or large-scale outages or interruptions of service from utilities or telecommunications providers, could potentially delay our ability to launch new products or services, which could materially and adversely affect our business. In December 2019, a novel strain of the coronavirus was first identified in Wuhan, China and has resulted in an outbreak of respiratory illness. While our operations in China are not based in Wuhan, it is possible that the spread of the coronavirus in China could adversely impact our business by, among other things, resulting in temporary closures of our facilities. At this point, the extent to which the coronavirus may impact our business is uncertain.
Additionally, as a result of our international operations, we face numerous other challenges and risks, including:
• | increased complexity and costs of managing international operations; |
• | regional economic instability; |
• | geopolitical instability and military conflicts; |
• | limited protection of our intellectual property and other assets; |
• | compliance with local laws and regulations and unanticipated changes in local laws and regulations, including tax laws and regulations; |
• | foreign currency exchange fluctuations relating to our international operating activities; |
• | local business and cultural factors that differ from our normal standards and practices; and |
• | differing employment practices and labor relations. |
25
The occurrence of catastrophic events could damage our facilities or the facilities of third parties on which we depend, which could force us to curtail our operations.
We and some of the third-party service providers on which we depend for various support functions, such as customer service and card processing, are vulnerable to damage from catastrophic events, such as power loss, natural disasters, terrorism, outbreaks of pandemic disease, such as the coronavirus, and similar unforeseen events beyond our control. Our principal offices, for example, are situated in southern California near known earthquake fault zones. If any catastrophic event were to occur, our ability to operate our business could be seriously impaired. In addition, we might not have adequate insurance to cover our losses resulting from catastrophic events or other significant business interruptions. Any significant losses that are not recoverable under our insurance policies, as well as the damage to, or interruption of, our infrastructure and processes, could seriously impair our business and financial condition.
If we fail to maintain proper and effective internal controls, our ability to produce accurate financial statements on a timely basis could be impaired, which could result in a loss of investor confidence in our financial reports and have an adverse effect on our stock price.
Our management is responsible for establishing and maintaining adequate internal control over financial reporting to provide reasonable assurance regarding the reliability of our financial reporting and the preparation of financial statements for external purposes in accordance with U.S. GAAP. If we are unable to maintain adequate internal control over financial reporting, we might be unable to report our financial information on a timely basis and might suffer adverse regulatory consequences or violate NYSE listing standards. There could also be a negative reaction in the financial markets due to a loss of investor confidence in us and the reliability of our financial statements. We have in the past and may in the future discover areas of our internal financial and accounting controls and procedures that need improvement. Our internal control over financial reporting will not prevent or detect all error and all fraud. A control system, no matter how well conceived and operated, can provide only reasonable, not absolute, assurance that the objectives of the control system will be met. Because of the inherent limitations in all control systems, no evaluation of controls can provide absolute assurance that all control issues and instances of fraud, if any, within our company will be detected. If we are unable to maintain proper and effective internal controls, we may not be able to produce accurate financial statements on a timely basis, which could adversely affect our ability to operate our business and could result in regulatory action, and could require us to restate, our financial statements. Any such restatement could result in a loss of public confidence in the reliability of our financial statements and sanctions imposed on us by the SEC.
Changes in accounting standards or inaccurate estimates or assumptions in the application of accounting policies could adversely affect our financial condition and results of operations.
Our accounting policies and methods are fundamental to how we record and report our financial condition and results of operations. Some of these policies require use of estimates and assumptions that may affect the reported value of our assets or liabilities and results of operations and are critical because they require management to make difficult, subjective and complex judgments about matters that are inherently uncertain. If those assumptions, estimates or judgments were incorrectly made, we could be required to correct and restate prior period financial statements. Accounting standard-setters and those who interpret the accounting standards (such as the Financial Accounting Standards Board, the SEC and banking regulators) may also amend or even reverse their previous interpretations or positions on how various standards should be applied. These changes can be difficult to predict and can materially impact how we record and report our financial condition and results of operations. In some cases, we could be required to apply a new or revised standard retroactively, resulting in the need to revise and republish prior period financial statements.
Our debt agreements contain restrictive covenants and financial ratio tests that restrict or prohibit our ability to engage in or enter into a variety of transactions. If we fail to comply with these covenants or tests, our indebtedness under these agreements could become accelerated, which could adversely affect us.
Under our $100 million five-year revolving facility, we are subject to various covenants that may have the effect of limiting, among other things, our ability and the ability of certain of our subsidiaries to: merge with other entities, enter into a transaction resulting in a change in control, create new liens, incur additional indebtedness, sell assets outside of the ordinary course of business, enter into transactions with affiliates (other than subsidiaries) or substantially change the general nature of our and our subsidiaries’ business, taken as a whole, make certain investments, enter into restrictive agreements, or make certain dividends or other distributions. These restrictions could limit our ability to take advantage of financing, merger, acquisition or other opportunities, to fund our business operations or to fully implement our current and future operating strategies.
Under the agreement, we have agreed to maintain compliance with a maximum consolidated leverage ratio and a minimum consolidated fixed charge coverage ratio of 2.50 and 1.25, respectively, at the end of any fiscal quarter.
26
Our ability to meet these financial ratios and tests will be dependent upon our future performance and may be affected by events beyond our control (including factors discussed in this “Risk Factors" section). If we fail to satisfy these requirements, our indebtedness under these agreements could become accelerated and payable at a time when we are unable to pay them. This would adversely affect our ability to implement our operating strategies and would have a material adverse effect on our financial condition.
Changes in the method of determining LIBOR, or the replacement of LIBOR with an alternative reference rate, may adversely affect interest rates on our future indebtedness and may otherwise adversely affect our financial condition and results of operations.
Certain of our indebtedness is made at variable interest rates that use the London Interbank Offered Rate, or LIBOR (or metrics derived from or related to LIBOR), as a benchmark for establishing the interest rate. On July 27, 2017, the United Kingdom’s Financial Conduct Authority announced that it intends to stop persuading or compelling banks to submit LIBOR rates after 2021. These reforms may cause LIBOR to cease to exist, new methods of calculating LIBOR to be established, or alternative reference rates to be established. The potential consequences cannot be fully predicted and could have an adverse impact on the market value for or value of LIBOR-linked securities, loans, and other financial obligations or extensions of credit held by or due to us. Changes in market interest rates may influence our financing costs, returns on financial investments and the valuation of derivative contracts and could reduce our earnings and cash flows. In addition, any transition process may involve, among other things, increased volatility or illiquidity in markets for instruments that rely on LIBOR, reductions in the value of certain instruments or the effectiveness of related transactions such as hedges, increased borrowing costs, uncertainty under applicable documentation, or difficult and costly consent processes. This could materially and adversely effect our results of operations, cash flows, and liquidity. We cannot predict the effect of the potential changes to LIBOR or the establishment and use of alternative rates or benchmarks.
Risks Related to Ownership of Our Class A Common Stock
The price of our Class A common stock may be volatile.
In the recent past, stocks generally, and financial services company stocks in particular, have experienced high levels of volatility. The trading price of our Class A common stock has been highly volatile since our initial public offering and may continue to be subject to wide fluctuations. The trading price of our Class A common stock depends on a number of factors, including those described in this “Risk Factors” section, many of which are beyond our control and may not be related to our operating performance. Factors that could cause fluctuations in the trading price of our Class A common stock include the following:
• | price and volume fluctuations in the overall stock market from time to time; |
• | significant volatility in the market prices and trading volumes of financial services company stocks; |
• | actual or anticipated changes in our results of operations or fluctuations in our operating results; |
• | actual or anticipated changes in the expectations of investors or the recommendations of any securities analysts who follow our Class A common stock; |
• | actual or anticipated developments in our business or our competitors’ businesses or the competitive landscape generally; |
• | the public’s reaction to our press releases, other public announcements and filings with the SEC; |
• | business disruptions and costs related to shareholder activism; |
• | litigation and investigations or proceedings involving us, our industry or both or investigations by regulators into our operations or those of our competitors; |
• | new laws or regulations or new interpretations of existing laws or regulations applicable to our business; |
• | changes in accounting standards, policies, guidelines, interpretations or principles; |
• | general economic conditions; |
• | changes to the indices in which our Class A common stock is included; and |
• | sales of shares of our Class A common stock by us or our stockholders. |
In the past, many companies that have experienced volatility in the market price of their stock have become subject to securities class action litigation. We may be the target of this type of litigation in the future. Securities litigation against
27
us could result in substantial costs and divert our management’s attention from other business concerns, which could seriously harm our business.
Our business could be negatively affected by actions of stockholders.
The actions of stockholders could adversely affect our business. Specifically, certain actions of certain types of stockholders, including without limitation public proposals, requests to pursue a strategic combination or other transaction or special demands or requests, could disrupt our operations, be costly and time-consuming or divert the attention of our management and employees and increase the volatility of our stock. In addition, perceived uncertainties as to our future direction in relation to the actions of our stockholders may result in the loss of potential business opportunities or the perception that we are unstable and need to make changes, which may be exploited by our competitors and make it more difficult to attract and retain personnel as well as customers, service providers and partners. Actions by our stockholders may also cause fluctuations in our stock price based on speculative market perceptions or other factors that do not necessarily reflect the underlying fundamentals and prospects of our business.
Our charter documents, Delaware law and our status as bank holding company could discourage, delay or prevent a takeover that stockholders consider favorable and could also reduce the market price of our stock.
Our certificate of incorporation and bylaws contain provisions that could delay or prevent a change in control of our company. These provisions could also make it more difficult for stockholders to nominate directors for election to our Board of Directors and take other corporate actions. These provisions, among other things:
• | provide for non-cumulative voting in the election of directors; |
• | authorize our Board of Directors, without stockholder approval, to issue preferred stock with terms determined by our Board of Directors and to issue additional shares of our Class A common stock; |
• | limit the voting power of a holder, or group of affiliated holders, of more than 24.9% of our common stock to 14.9%; |
• | provide that only our Board of Directors may set the number of directors constituting our Board of Directors or fill vacant directorships; |
• | prohibit stockholder action by written consent and limit who may call a special meeting of stockholders; and |
• | require advance notification of stockholder nominations for election to our Board of Directors and of stockholder proposals. |
These and other provisions in our certificate of incorporation and bylaws, as well as provisions under Delaware law, could discourage potential takeover attempts, reduce the price that investors might be willing to pay in the future for shares of our Class A common stock, and result in the trading price of our Class A common stock being lower than it otherwise would be.
In addition to the foregoing, under the BHC Act and the Change in Bank Control Act, and their respective implementing regulations, Federal Reserve Board approval is necessary prior to any person or company acquiring control of a bank or bank holding company, subject to certain exceptions. Control, among other considerations, exists if an individual or company acquires 25% or more of any class of voting securities, and may be presumed to exist if a person acquires 10% or more of any class of voting securities. These restrictions could affect the willingness or ability of a third party to acquire control of us for so long as we are a bank holding company.
If securities analysts do not continue to publish research or reports about our business or if they publish negative evaluations of our Class A common stock, the trading price of our Class A common stock could decline.
We expect that the trading price for our Class A common stock will be affected by any research or reports that securities analysts publish about us or our business. If one or more of the analysts who currently cover us or our business downgrade their evaluations of our Class A common stock, the price of our Class A common stock would likely decline. If one or more of these analysts cease coverage of our company, we could lose visibility in the market for our Class A common stock, which in turn could cause our stock price to decline.
28
ITEM 1B. Unresolved Staff Comments
None.
ITEM 2. Properties
Our headquarters is located in Pasadena, California where we lease approximately 140,000 square feet. We own the real property where our subsidiary bank's only office is located in Provo, Utah. Through our wholly owned subsidiaries, we lease office facilities in San Diego, California; San Ramon, California; Cincinnati, Ohio; Sandy, Utah; and Shanghai, China. We also lease additional technology development and sale and support offices in Tampa, Florida; Rogers, Arkansas; Kingston, New Jersey; West Chester, Pennsylvania and Manila, Philippines. We believe that our existing and planned facilities are adequate to support our existing operations and that, as needed, we will be able to obtain suitable additional facilities on commercially reasonable terms.
ITEM 3. Legal Proceedings
Information with respect to this item may be found under the caption "Litigation and Claims" in Note 20 — Commitments and Contingencies to the Consolidated Financial Statements included herein, which information is incorporated into this Item 3 by reference.
ITEM 4. Mine Safety Disclosures
Not applicable.
29
PART II
ITEM 5. Market for Registrant's Common Equity, Related Stockholder Matters and Issuer Purchases of Equity Securities
Market Information
Our Class A common stock is listed on the NYSE under the symbol “GDOT.”
Holders of Record
As of January 31, 2020, we had 64 holders of record of our Class A common stock. The actual number of stockholders is greater than this number of record holders, and includes stockholders who are beneficial owners, but whose shares are held in street name by brokers and other nominees. This number of holders of record also does not include stockholders whose shares may be held in trust by other entities.
Dividends
We have never declared or paid any cash dividends on our capital stock, and we do not currently intend to pay any cash dividends on our Class A common stock for the foreseeable future. We expect to retain future earnings, if any, to fund the development and future growth of our business. Any future determination to pay dividends on our Class A common stock, if permissible, will be at the discretion of our board of directors and will depend upon, among other factors, our financial condition, operating results, current and anticipated cash needs, plans for expansion and other factors that our board of directors may deem relevant.
Unregistered Sales of Equity Securities
The information required to be disclosed by paragraph (a) of Item 5 to Form 10-K has been included in a current report on Form 8-K and, therefore, is not furnished herein, pursuant to the last sentence in that paragraph.
Purchases of Equity Securities by the Issuer and Affiliated Purchasers
Period | Total Number of Shares Purchased | Average Price Paid Per Share | Total Number of Shares Purchased as Part of Publicly Announced Plans or Programs | Approximate Dollar Value of Shares That May Yet Be Purchased Under the Plans or Programs (In thousands) | |||||||||
October 1, 2019 to October 31, 2019 | — | — | — | $ | 50,000 | ||||||||
November 1, 2019 to November 30, 2019 | — | — | — | 50,000 | |||||||||
December 1, 2019 to December 31, 2019 | — | — | — | 50,000 | |||||||||
Total | — | — | $ | 50,000 | |||||||||
In May 2017, our Board of Directors authorized, subject to regulatory approval, expansion of our stock repurchase program by an additional $150 million. We sought and received regulatory approval during the second quarter of 2019, at which point we made an up-front payment of $100 million to enter into an accelerated share repurchase agreement. In August 2019, we completed final settlement of shares purchased under this agreement, receiving in total approximately 2.1 million shares at an average repurchase price of $48.26. We have an authorized $50 million remaining under our current stock repurchase program for any additional repurchases. There was no repurchase activity during the three months ended December 31, 2019.
For the majority of restricted stock units (including performance-based restricted stock units) granted, the number of shares issued on the date the restricted stock units vest is net of shares withheld to meet applicable tax withholding requirements. Although these withheld shares are not issued or considered common stock repurchases under our stock repurchase program and therefore are not included in the table above, they are treated as common stock repurchases in our financial statements as they reduce the number of shares that would have been issued upon vesting.
30
Stock Performance Graph
This performance graph shall not be deemed “filed” for purposes of section 18 of the Exchange Act, or otherwise subject to the liabilities under that section and shall not be deemed to be incorporated by reference into any filing of Green Dot Corporation under the Securities Act or the Exchange Act.
The graph and table below compare the cumulative total stockholder return of Green Dot Corporation Class A common stock, the Russell 2000 Index, the S&P Small Cap 600 Index and the S&P 500 Financials Index for the period beginning on the close of trading on the NYSE on December 31, 2014 and ending on the close of trading on the NYSE on December 31, 2019. The graph assumes a $100 investment in our Class A common stock and each of the indices, and the reinvestment of dividends.
The comparisons in the graph and table below are based on historical data and are not intended to forecast the possible future performance of our Class A common stock.
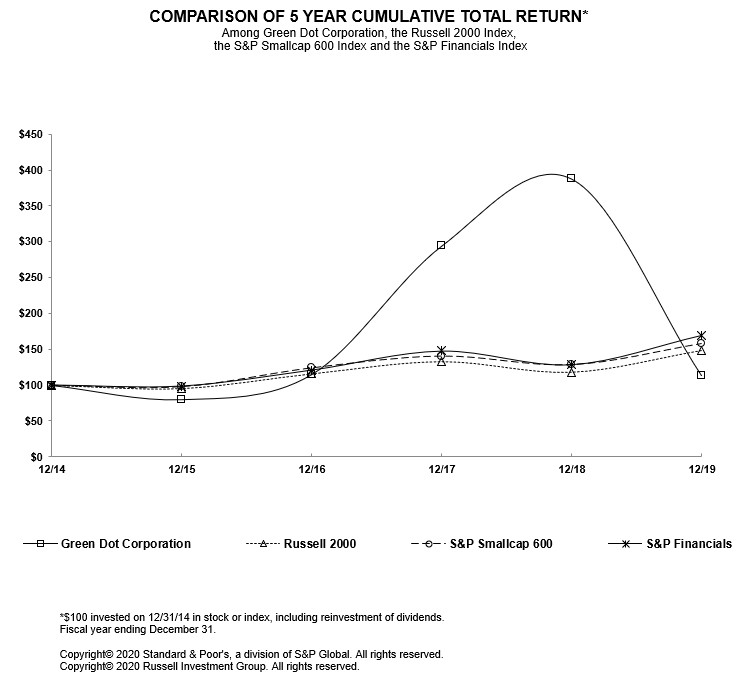
Total Return to Shareholders (Includes reinvestment of dividends)
Company/ Index | Base Period 12/31/14 | 2015 | 2016 | 2017 | 2018 | 2019 | ||||||||||||||||||
Green Dot Corporation | $ | 100 | $ | 80 | $ | 115 | $ | 294 | $ | 388 | $ | 114 | ||||||||||||
Russell 2000 | $ | 100 | $ | 96 | $ | 116 | $ | 133 | $ | 118 | $ | 148 | ||||||||||||
S&P Smallcap 600 | $ | 100 | $ | 98 | $ | 124 | $ | 140 | $ | 129 | $ | 158 | ||||||||||||
S&P Financials | $ | 100 | $ | 98 | $ | 121 | $ | 148 | $ | 129 | $ | 170 | ||||||||||||
31
ITEM 6. Selected Financial Data
The following tables present selected historical financial data for our business. This information should be read in conjunction with Item 7. Management’s Discussion and Analysis of Financial Condition and Results of Operations and Item 8. Financial Statements and Supplementary Data of this report. The selected consolidated financial data in this section is not intended to replace the financial statements and is qualified in its entirety by the consolidated financial statements and related notes.
We derived the statements of operations data for the years ended December 31, 2019, 2018, and 2017, respectively, and the balance sheet data as of December 31, 2019 and 2018 from our audited consolidated financial statements included in Item 8 of this report. We derived the statements of operations data for the years ended December 31, 2016 and 2015, and balance sheet data as of December 31, 2017, 2016 and 2015, from our audited consolidated financial statements not included in this report. Our historical results are not necessarily indicative of our results to be expected in any future period.
Year Ended December 31, | |||||||||||||||||||
2019 | 2018 | 2017 | 2016 | 2015 | |||||||||||||||
(In thousands, except per share data) | |||||||||||||||||||
Consolidated Statements of Operations Data: | |||||||||||||||||||
Operating revenues: | |||||||||||||||||||
Card revenues and other fees | $ | 459,357 | $ | 482,881 | $ | 414,775 | $ | 337,821 | $ | 318,083 | |||||||||
Processing and settlement service revenues | 287,064 | 247,958 | 217,454 | 184,342 | 182,614 | ||||||||||||||
Interchange revenues | 330,233 | 310,919 | 257,922 | 196,611 | 196,523 | ||||||||||||||
Interest income, net | 31,941 | 23,817 | 10,972 | 7,280 | 4,678 | ||||||||||||||
Stock-based retailer incentive compensation(1) | — | — | — | — | (2,520 | ) | |||||||||||||
Total operating revenues | 1,108,595 | 1,065,575 | 901,123 | 726,054 | 699,378 | ||||||||||||||
Operating expenses: | |||||||||||||||||||
Sales and marketing expenses | 386,840 | 326,333 | 280,561 | 249,096 | 230,441 | ||||||||||||||
Compensation and benefits expenses(2) | 198,412 | 221,627 | 194,654 | 159,456 | 168,226 | ||||||||||||||
Processing expenses | 200,674 | 181,160 | 161,011 | 107,556 | 102,144 | ||||||||||||||
Other general and administrative expenses | 199,751 | 206,040 | 155,601 | 139,350 | 134,560 | ||||||||||||||
Total operating expenses | 985,677 | 935,160 | 791,827 | 655,458 | 635,371 | ||||||||||||||
Operating income | 122,918 | 130,415 | 109,296 | 70,596 | 64,007 | ||||||||||||||
Interest expense, net | 1,837 | 6,598 | 5,838 | 9,035 | 5,885 | ||||||||||||||
Income before income taxes | 121,081 | 123,817 | 103,458 | 61,561 | 58,122 | ||||||||||||||
Income tax expense | 21,184 | 5,114 | 17,571 | 19,961 | 19,707 | ||||||||||||||
Net income | 99,897 | 118,703 | 85,887 | 41,600 | 38,415 | ||||||||||||||
Income attributable to preferred stock | — | — | — | (802 | ) | (1,102 | ) | ||||||||||||
Net income allocated to common stockholders | $ | 99,897 | $ | 118,703 | $ | 85,887 | $ | 40,798 | $ | 37,313 | |||||||||
Basic earnings per common share: | |||||||||||||||||||
Class A common stock | $ | 1.91 | $ | 2.27 | $ | 1.70 | $ | 0.82 | $ | 0.73 | |||||||||
Basic weighted-average common shares issued and outstanding: | |||||||||||||||||||
Class A common stock | 52,195 | 52,222 | 50,482 | 49,535 | 51,332 | ||||||||||||||
Diluted earnings per common share: | |||||||||||||||||||
Class A common stock | $ | 1.88 | $ | 2.18 | $ | 1.61 | $ | 0.80 | $ | 0.72 | |||||||||
Diluted weighted-average common shares issued and outstanding: | |||||||||||||||||||
Class A common stock | 53,138 | 54,481 | 53,198 | 50,797 | 51,875 | ||||||||||||||
32
As of December 31, | |||||||||||||||||||
2019 | 2018 | 2017 | 2016 | 2015 | |||||||||||||||
(In thousands) | |||||||||||||||||||
Consolidated Balance Sheet Data: | |||||||||||||||||||
Cash, cash equivalents and restricted cash(3) | $ | 1,066,154 | $ | 1,095,218 | $ | 1,010,095 | $ | 744,761 | $ | 777,922 | |||||||||
Investment securities, available-for-sale | 277,439 | 201,183 | 153,509 | 208,426 | 181,539 | ||||||||||||||
Settlement assets(4) | 239,222 | 153,992 | 209,399 | 137,083 | 69,165 | ||||||||||||||
Loans to bank customers | 21,417 | 21,363 | 18,570 | 6,059 | 6,279 | ||||||||||||||
Total assets | 2,460,590 | 2,287,118 | 2,197,531 | 1,740,344 | 1,691,448 | ||||||||||||||
Deposits | 1,175,341 | 1,005,485 | 1,022,180 | 737,414 | 652,145 | ||||||||||||||
Obligations to customers(4) | 69,377 | 58,370 | 95,354 | 46,043 | 61,300 | ||||||||||||||
Settlement obligations(4) | 13,251 | 5,788 | 6,956 | 4,877 | 5,074 | ||||||||||||||
Short-term debt | 35,000 | 58,705 | 20,906 | 20,966 | 20,966 | ||||||||||||||
Long-term debt | — | — | 58,705 | 79,720 | 100,686 | ||||||||||||||
Total liabilities | 1,533,234 | 1,377,306 | 1,432,981 | 1,056,611 | 1,028,126 | ||||||||||||||
Total stockholders' equity | 927,356 | 909,812 | 764,550 | 683,733 | 663,322 | ||||||||||||||
(1) | Represents the recorded fair value of the shares for which our right to repurchase lapsed during the specified period pursuant to the terms of the agreement under which we issued 2,208,552 shares of our Class A common stock to Walmart. Our right to repurchase these shares fully lapsed in May 2015. |
(2) | Includes stock-based compensation expense of $29.6 million, $50.1 million, $40.7 million, $28.3 million, and $27.0 million for the years ended December 31, 2019, 2018, 2017, 2016 and 2015, respectively. |
(3) | Includes $2.7 million, $0.5 million, $90.9 million, $12.1 million, and $5.8 million of restricted cash as of December 31, 2019, 2018, 2017, 2016, and 2015, respectively. |
(4) | Our retail distributors collect customer funds for purchases of new cards and reloads at the point of sale and then remit these funds directly to bank accounts established for the benefit of these customers by the banks that issue our cards. Our retail distributors’ remittance of these funds takes an average of two business days. Settlement assets represent the amounts due from our retail distributors and partners for customer funds collected at the point of sale that have not yet been received by our subsidiary bank. Also included in this balance are payroll amounts funded in advance (up to two days early) to certain cardholders who are eligible to participate in our early direct deposit programs. Obligations to customers represent customer funds collected from or to be remitted by our retail distributors for which the underlying products have not been activated. Settlement obligations represent the customer funds received by our subsidiary bank that are due to third-party card issuing banks upon activation. |
33
ITEM 7. Management’s Discussion and Analysis of Financial Condition and Results of Operations
This Annual Report on Form 10-K, including this Management’s Discussion and Analysis of Financial Condition and Results of Operations, contains forward-looking statements regarding future events and our future results that are subject to the safe harbors created under the Securities Act of 1933 and the Securities Exchange Act of 1934 (the “Exchange Act”). All statements other than statements of historical facts are statements that could be deemed to be forward-looking statements. These statements are based on current expectations, estimates, forecasts and projections about the industries in which we operate and the beliefs and assumptions of our management. Words such as “expects,” “anticipates,” “targets,” “goals,” “projects,” “intends,” “plans,” “believes,” “seeks,” “estimates,” “continues,” “endeavors,” “strives,” “may” and “assumes,” variations of such words and similar expressions are intended to identify forward-looking statements. In addition, any statements that refer to projections of our future financial performance, our anticipated growth and trends in our businesses, and other characterizations of future events or circumstances are forward-looking statements. Readers are cautioned that these forward-looking statements are subject to risks, uncertainties, and assumptions that are difficult to predict, including those identified below, under “Part I, Item 1A. Risk Factors,” and elsewhere herein. Therefore, actual results may differ materially and adversely from those expressed in any forward-looking statements. We undertake no obligation to revise or update any forward-looking statements for any reason.
In this Annual Report, unless otherwise specified or the context otherwise requires, “Green Dot,” “we,” “us,” and “our” refer to Green Dot Corporation and its consolidated subsidiaries.
Overview
Green Dot Corporation is a financial technology leader and bank holding company with a mission to reinvent banking for the masses. Our company’s long-term strategy is to create a unique, sustainable and highly valuable fintech ecosystem, in part through the continued evolution of Green Dot’s innovative Banking as a Service (“BaaS”) platform, that’s intended to fuel the engine of innovation and growth for Green Dot and its business partners.
Enabled by proprietary technology, our commercial bank charter and our high-scale program management operating capability, our vertically integrated technology and banking platform is used by a growing list of America’s most prominent consumer and technology companies to design and deploy their own bespoke financial services solutions to their customers and partners, while we use that same integrated platform for our own leading collection of banking and financial services products marketed directly to consumers through what we believe to be the most broadly distributed, omni-channel branchless banking platforms in the United States.
Our products and services are divided among our two reportable segments: 1) Account Services and 2) Processing and Settlement Services. We also consider our product and service offerings based on our market distribution strategies, which we refer to as our Consumer Business and Platform Services Business. Refer to "Part 1, Item 1. Business" for more detailed information.
Financial Results and Trends
Our results of operations for the years ended December 31, 2019 and 2018 were as follows:
Year Ended December 31, | ||||||||||||||
2019 | 2018 | Change | % | |||||||||||
(In thousands, except percentages) | ||||||||||||||
Total operating revenues | $ | 1,108,595 | $ | 1,065,575 | $ | 43,020 | 4.0 | % | ||||||
Total operating expenses | 985,677 | 935,160 | 50,517 | 5.4 | % | |||||||||
Net income | 99,897 | 118,703 | (18,806 | ) | (15.8 | )% | ||||||||
34
Total operating revenues
Our total operating revenues for the year ended December 31, 2019 increased $43.0 million, or 4.0% over the prior year comparable period. The year-over-year increase was driven by revenue growth in certain Platform Services within our Processing and Settlement Services segment, principally from growth in the total number of cash transfers, disbursements through our Simply Paid platform and tax refunds processed.
This increase was partially offset by a slight decrease in revenues from our Account Services segment, primarily attributable to an overall decline of 5.6% in our number of total active accounts. Within Account Services, our Consumer business experienced a year-over-year decline in active accounts, partially offset by growth in the number of active accounts from our BaaS and PayCard programs under our Platform Services category. This growth of active accounts from our Platform Services powered year-over-year growth of 4.9% in the number of direct deposit active accounts, which contributed to year-over-year growth of 8.6% in gross dollar volume and 3.9% in purchase volume, and corresponding growth in interchange revenue of 6.2% during the year ended December 31, 2019. Accounts enrolled in direct deposit tend to generate higher levels of gross dollar volume and purchase volume than other active accounts, and consequently have a greater impact on the amount of interchange revenue we earn.
Our Account Services revenue during the year ended December 31, 2019 also benefited from a strong year-over-year increase in net interest income due to higher yields on our cash and investment balances as a result of the full year impact in 2019 of the rate increases by the Federal Reserve over the course of 2018 and higher average balances thereof. In future periods we may experience declines in our net interest income due to an evolving interest rate environment. As a result of uncertainties around global economic growth and trade, the Federal Reserve recently announced a reduction in short-term interest rates, with additional reductions possible in the future. Further reductions in short-term interest rates could result in a decrease in the amount of net interest income we earn for the remainder of the year and in the near term.
The decline in our active accounts in recent periods is in part attributable to changes in our competitive environment within our Consumer business, particularly as new entrants market largely free bank account offerings. While we expect these trends to continue to negatively impact our number of active accounts in the short term, we believe the early adoption rates for our new products, our innovative product roadmap and our strong infrastructural competitive advantages make us well positioned to address these competitive pressures.
Total operating expenses
Our total operating expenses for the year ended December 31, 2019 increased $50.5 million, or 5.4% over the prior year comparable period. This increase was primarily the result of several factors, including higher sales and marketing expenses attributable to the year-over-year increases in operating revenues generated from products that are subject to revenue-sharing arrangements with our distributors and partners, our marketing investment in the recent launch of our Green Dot Unlimited Cash Back Bank Account ("Green Dot Unlimited"), and higher processing expenses as a result of increased transactional usage. These increases were offset by a decrease in compensation and benefits expenses primarily due to lower employee stock-based compensation expense as a result of the modification of certain performance-based equity awards and adjustments for the estimated payouts thereof. We also experienced an overall decrease in other general and administrative expenses principally related to a prior year expense associated with the resolution of an earn-out for our tax refund processing business, which did not recur in the current year.
As previously announced we renewed our Walmart MoneyCard agreement in October 2019. The term of the agreement began on January 1, 2020 and expires on January 31, 2027, with an automatic renewal clause for an additional period of one year, subject to certain terms as discussed in the agreement. Revenues generated under the MoneyCard program have represented a substantial, but declining portion of our total operating revenues. Under this new agreement, the sales commission rate we pay to Walmart for the MoneyCard program increased from the prior agreement. Consequently, we expect our sales and marketing expenses in 2020 to be negatively impacted by the increased commission rate.
Income taxes
Income tax expense for the year ended December 31, 2019 increased $16.1 million from the prior year comparable period. The increase was principally due to a $18.5 million decline in benefit from the recognition of excess tax benefits of stock-based compensation and additional expenses related to state taxes, net of federal benefits.
35
Key Metrics
We review a number of metrics to help us monitor the performance of, and identify trends affecting, our business. We believe the following measures are the primary indicators of our revenues:
Year Ended December 31, | Year Ended December 31, | ||||||||||||||||||||||||||||
2019 | 2018 | Change | % | 2018 | 2017 | Change | % | ||||||||||||||||||||||
(In millions, except percentages) | |||||||||||||||||||||||||||||
Gross Dollar Volume | $ | 43,459 | $ | 40,029 | $ | 3,430 | 8.6 | % | $ | 40,029 | $ | 31,104 | $ | 8,925 | 28.7 | % | |||||||||||||
GDV from Direct Deposit Sources | $ | 31,380 | $ | 29,755 | $ | 1,625 | 5.5 | % | $ | 29,755 | $ | 22,934 | $ | 6,821 | 29.7 | % | |||||||||||||
Number of Active Accounts* | 5.04 | 5.34 | (0.3 | ) | (5.6 | )% | 5.34 | 5.30 | 0.04 | 0.8 | % | ||||||||||||||||||
Direct Deposit Active Accounts* | 2.14 | 2.04 | 0.1 | 4.9 | % | 2.04 | 1.85 | 0.19 | 10.3 | % | |||||||||||||||||||
Purchase Volume | $ | 27,004 | $ | 25,989 | $ | 1,015 | 3.9 | % | $ | 25,989 | $ | 21,634 | $ | 4,355 | 20.1 | % | |||||||||||||
Cash Transfers | 46.04 | 42.25 | 3.79 | 9.0 | % | 42.25 | 38.60 | 3.65 | 9.5 | % | |||||||||||||||||||
Tax Refunds Processed | 12.09 | 11.71 | 0.38 | 3.2 | % | 11.71 | 11.17 | 0.54 | 4.8 | % | |||||||||||||||||||
* Represents number of active and direct deposit active accounts as of December 31, 2019, 2018, and 2017 respectively.
Gross Dollar Volume — represents the total dollar volume of funds loaded to our account products from direct deposit and non-direct deposit sources. A substantial portion of our gross dollar volume is generated from direct deposit sources. We use both aggregate gross dollar volume and gross dollar volume from direct deposit sources to analyze the total amount of money moving onto our account programs, determine the overall engagement and usage patterns of our account holder base. These metrics also serve as leading indicators of revenue generated through our Account Services segment products, inclusive of interest income generated on deposits held at Green Dot Bank, fees charged to account holders and interchange revenues generated through the spending of account balances. The increases in gross dollar volume in the aggregate and from direct deposit sources during the year ended December 31, 2019 from the comparable prior year period were principally driven by the increase in the number of direct deposit active accounts over the same period.
Number of Active Accounts — represents accounts in our portfolio that had a purchase, deposit or ATM withdrawal transaction during the applicable quarter. Any bank account within our Account Services segment that is subject to United States Patriot Act compliance and, therefore, requires customer identity verification prior to use and is intended to accept ongoing customer cash or ACH deposits (including without limitation general purpose reloadable prepaid card accounts, demand deposit or checking accounts, and credit cards) qualifies as an account for purposes of this metric. We use both aggregate active accounts and direct deposit active accounts to analyze the overall size of our active customer base and to analyze multiple metrics expressed as an average across this active account base. In particular, we monitor the mix of direct deposit accounts and non-direct deposit accounts. Our direct deposit active accounts, on average, have the longest tenure and generate the majority of our gross dollar volume in any period and thus, generate more revenue over their lifetime than other active accounts. Despite our year-over-year decrease in the number of active accounts, resulting principally from lower unit sales of prepaid accounts within our retail and digital Consumer business, we had an increase in direct deposit active accounts of 4.9% as of December 31, 2019 on a year-over-year basis, primarily driven by growth in the number of active accounts from our BaaS and PayCard programs within our Platform Services category, which tend to enroll in direct deposit at a higher rate as compared to accounts generated under other programs.
Purchase Volume — represents the total dollar volume of purchase transactions made by our account holders. This metric excludes the dollar volume of ATM withdrawals. We use this metric to analyze interchange revenue, which is a key component of our results of operations. The increase in purchase volume of 3.9% during the year ended December 31, 2019, from the comparable prior year period was driven by an increase in Gross Dollar Volume, as described above.
Number of Cash Transfers — represents the total number of cash transfer transactions conducted by consumers, such as a point-of-sale swipe reload transaction, the purchase of a MoneyPak or an e-cash mobile remittance transaction marketed under various brand names, that we conducted through our retail distributors in a specified period. This metric excludes disbursements made through our Simply Paid wage disbursement platform. We review this metric as a measure of the size and scale of our retail cash processing network, as an indicator of customer engagement and usage of our products and services, and to analyze cash transfer revenue, which is a key component of our financial performance. Our cash transfers increased 9.0% during the year ended December 31, 2019 over the comparable prior year period primarily due to the number of third-party account programs that utilize the Green Dot Network to accept funds through our cash processing network.
36
Number of Tax Refunds Processed — represents the total number of tax refunds processed in a specified period. We review this metric as a measure of the size and scale of our tax refund processing platform and as an indicator of consumer engagement and usage of its products and services. The increase in the number of tax refunds processed of 3.2% for the year ended December 31, 2019 from the comparable prior year period was primarily driven by increased volumes from certain online consumer tax filing software platforms.
Key components of our results of operations
Operating Revenues
We classify our operating revenues into the following four categories:
Card Revenues and Other Fees — Card revenues consist of monthly maintenance fees, ATM fees, new card fees and other revenues. We charge maintenance fees on GPR cards, checking accounts and certain cash transfer products, such as MoneyPak, pursuant to the terms and conditions in our customer agreements. We charge ATM fees to cardholders when they withdraw money at certain ATMs in accordance with the terms and conditions in our cardholder agreements. We charge new card fees, if applicable, when a consumer purchases a GPR card, gift card, or a checking account product. Other revenues consist primarily of revenue associated with our gift card program, annual fees associated with our secured credit card portfolio, transaction-based fees, fees associated with optional products or services, and cash-back rewards we offer to cardholders. Our cash-back rewards are recorded as a reduction to card revenues and other fees. Also included in card revenues and other fees are program management fees earned from our BaaS partners for programs we manage on their behalf.
Our aggregate monthly maintenance fee revenues vary primarily based upon the number of active accounts in our portfolio and the average fee assessed per account. Our average monthly maintenance fee per active account depends upon the mix of products in our portfolio at any given point in time and upon the extent to which fees are waived based on various incentives provided to customers in an effort to encourage higher usage and retention. Our aggregate ATM fee revenues vary based upon the number of cardholder ATM transactions and the average fee per ATM transaction. The average fee per ATM transaction depends upon the mix of products in our portfolio at any given point in time and the extent to which cardholders use ATMs within our free network that carry no fee for cash withdrawal transactions. Our aggregate new card fee revenues vary based upon the number of GPR cards and checking accounts activated and the average new card fee. The average new card fee depends primarily upon the mix of products that we sell since there are variations in new account fees based on the product and/or the location or source where our products are purchased. The revenue we earn from each of these fees may also vary depending upon the channel in which the active accounts were acquired. For example, certain BaaS programs may not assess monthly maintenance fees and as a result, these accounts may generate lower fee revenue than other active accounts. Our aggregate other fees vary primarily based upon account sales of all types, gift card sales, purchase transactions and the number of active accounts in our portfolio.
Processing and Settlement Service Revenues — Processing and settlement service revenues consist of cash transfer revenues, tax refund processing service revenues and Simply Paid disbursement revenues. We earn cash transfer revenues when consumers fund their cards through a reload transaction at a Green Dot Network retail location. Our aggregate cash transfer revenues vary based upon the mix of locations where reload transactions occur, since reload fees vary by location. We earn tax refund processing service revenues at the point in time when a customer of a third-party tax preparation company chooses to pay his or her tax preparation fee through the use of our tax refund processing services. We earn Simply Paid disbursement fees from our business partners at the point in time payment disbursements are made.
Interchange Revenues — We earn interchange revenues from fees remitted by the merchant’s bank, which are based on rates established by the payment networks, at the point in time when customers make purchase transactions using our products. Our aggregate interchange revenues vary based primarily on the number of active accounts in our portfolio, the average transactional volume of the active accounts in our portfolio and on the mix of cardholder purchases between those using signature identification technologies and those using personal identification numbers and the corresponding rates.
Interest Income, net — Net interest income represents the difference between the interest income earned on our interest-earning assets and the interest expense on our interest-bearing liabilities held at Green Dot Bank. Interest-earning assets include customer deposits, loans, and investment securities. Our interest-bearing liabilities held at Green Dot Bank include interest-bearing deposits. Our net interest income and our net interest margin fluctuate based on changes in the federal funds interest rates and changes in the amount and composition of our interest-bearing assets and liabilities.
37
Operating Expenses
We classify our operating expenses into the following four categories:
Sales and Marketing Expenses — Sales and marketing expenses consist primarily of the commissions we pay to our retail distributors, brokers and platform partners, advertising and marketing expenses, and the costs of manufacturing and distributing card packages, placards and promotional materials to our retail distributors and personalized GPR and GoBank cards to consumers who have activated their cards. We generally establish commission percentages in long-term distribution agreements with our retail distributors and platform partners. Aggregate commissions with our retail distributors are determined by the number of prepaid cards, checking account products and cash transfers sold at their respective retail stores. Commissions with our platform partners and, in certain cases, our retail distributors are determined by the revenue generated from the ongoing use of the associated card programs. We incur advertising and marketing expenses for television, sponsorships, online and in-store promotions. Advertising and marketing expenses are recognized as incurred and typically deliver a benefit over an extended period of time. For this reason, these expenses do not always track changes in our operating revenues. Our manufacturing and distribution costs vary primarily based on the number of GPR and GoBank accounts activated by consumers.
Compensation and Benefits Expenses — Compensation and benefits expenses represent the compensation and benefits that we provide to our employees and the payments we make to third-party contractors. While we have an in-house customer service function, we employ third-party contractors to conduct call center operations, handle routine customer service inquiries and provide consulting support in the area of IT operations and elsewhere. Compensation and benefits expenses associated with our customer service and loss management functions generally vary in line with the size of our active account portfolio, while the expenses associated with other functions do not.
Processing Expenses — Processing expenses consist primarily of the fees charged to us by the payment networks, which process transactions for us, the third-party card processors that maintain the records of our customers' accounts and process transaction authorizations and postings for us and the third-party banks that issue our accounts. These costs generally vary based on the total number of active accounts in our portfolio and gross dollar volume transacted by those accounts. Also included in processing expenses are bank fees associated with our tax refund processing services and gateway and network fees associated with our Simply Paid disbursement services. Bank fees generally vary based on the total number of tax refund transfers processed and gateway and network fees vary based on the numbers of disbursements made.
Other General and Administrative Expenses — Other general and administrative expenses consist primarily of professional service fees, telephone and communication costs, depreciation and amortization of our property and equipment and intangible assets, changes in contingent consideration, transaction losses (losses from customer disputed transactions, unrecovered customer purchase transaction overdrafts and fraud), rent and utilities, and insurance. We incur telephone and communication costs primarily from customers contacting us through our toll-free telephone numbers. These costs vary with the total number of active accounts in our portfolio, as do losses from customer disputed transactions, unrecovered customer purchase transaction overdrafts and fraud. Costs associated with professional services, depreciation and amortization of our property and equipment, amortization of our acquired intangible assets, rent and utilities vary based upon our investment in infrastructure, business development, risk management and internal controls and are generally not correlated with our operating revenues or other transaction metrics.
Income Tax Expense
Our income tax expense consists of the federal and state corporate income taxes accrued on income resulting from the sale of our products and services.
Critical Accounting Policies and Estimates
We prepare our consolidated financial statements in accordance with GAAP. The preparation of our consolidated financial statements requires our management to make estimates and assumptions that affect the reported amounts of assets, liabilities, revenues, costs and expenses and related disclosures. We base our estimates on historical experience, current circumstances and various other assumptions that our management believes to be reasonable under the circumstances. In many instances, we could reasonably use different accounting estimates, and in some instances changes in the accounting estimates are reasonably likely to occur from period to period. Accordingly, actual results could differ significantly from the estimates made by our management. To the extent that there are differences between our estimates and actual results, our future financial statement presentation, financial condition, results of operations and cash flows will be affected. We believe that the accounting policies discussed below are critical to understanding our historical and future performance, as these policies relate to the more significant areas involving management’s judgments and estimates.
38
Revenue Recognition
As prescribed under our recent adoption of Accounting Standards Codification 606, Revenue from Contracts with Customers, we recognize revenues when control of the promised goods or services is transferred to our customers in an amount that reflects the consideration we expect to be entitled to in exchange for those goods or services, as determined under a five-step process.
Our new card fee provides our cardholders a material right and accordingly we defer and recognize new card fee revenues on a straight-line basis over the period commensurate with our performance obligation to our customers. We consider the performance obligation period to be the average card lifetime, which is currently less than one year for our GPR cards and gift cards. For GPR cards, average card lifetime is determined based on recent historical data using the period from sale (or activation) of the card through the date of last positive balance. We reassess average card lifetime quarterly. Average card lifetimes may vary in the future as cardholder behavior changes relative to historical experience because customers are influenced by changes in the pricing of our services, the availability of substitute products, and other factors.
We also defer commissions paid to retail distributors related to new card sales as costs to obtain contracts and expense ratably over the average card lifetime commensurate with our GPR and gift cards.
Transaction prices related to our account services are based on stand-alone fees stated within the terms and conditions and may also include certain elements of variable consideration depending upon the product’s features, such as cardholder incentives, cash-back rewards, monthly fee concessions and reserves on accounts that may become overdrawn. We estimate such amounts using historical data and customer behavior patterns to determine these estimates which are recorded as a reduction to the corresponding fee revenue. Additionally, while the number of transactions that a cardholder may perform is unknown, any uncertainty is resolved at the end of each daily service contract.
We report our different types of revenues on a gross or net basis based on our assessment of whether we act as a principal or an agent in the transaction. To the extent we act as a principal in the transaction, we report revenues on a gross basis. In concluding whether or not we act as a principal or an agent, we evaluate whether we obtain control of the good or service prior to the good or service being transferred to the customer. For all our significant revenue-generating arrangements, we record revenues on a gross basis except for our tax refund processing service revenues which are recorded on a net basis.
Stock-Based Compensation
We record employee stock-based compensation expense based on the grant-date fair value. For stock options and stock purchases under our employee stock purchase plan, we base compensation expense on fair values estimated at the grant date using the Black-Scholes option-pricing model. For stock awards, including restricted stock units, we base compensation expense on the fair value of our Class A common stock at the grant date. We recognize compensation expense for awards with only service conditions that have graded vesting schedules on a straight-line basis over the vesting period of the award. Vesting is based upon continued service to our company.
For performance based awards, we recognize compensation cost for the restricted stock units if and when we conclude it is probable that the performance will be satisfied, over the requisite service period based on the grant-date fair value of the stock. We reassess the probability of vesting at each reporting period and adjust compensation expense based on the probability assessment. For market based restricted stock units, we base compensation expense on the fair value estimated at the date of grant using a Monte Carlo simulation or similar lattice model. We recognize compensation expense over the requisite service period regardless of the market condition being satisfied, provided that the requisite service has been provided, since the estimated grant date fair value already incorporates the probability of outcomes that the market condition will be achieved.
Based on our recent adoption of Accounting Standards Update No. 2018-07, Compensation – Stock Compensation (Topic 718): Improvements to Non-employee Share-Based Payment Accounting, we measure the fair value of equity instruments issued to non-employees based on the grant-date fair value, and recognize the related expense in the same periods that the goods or services are received.
Reserve for Uncollectible Overdrawn Accounts
Our cardholder accounts may become overdrawn as a result of maintenance fee assessments or from purchase transactions that we honor, in each case in excess of the funds in the cardholder’s account. While we decline authorization attempts for amounts that exceed the available balance in a cardholder’s account, the application of card association rules, the timing of the settlement of transactions and the assessment of the card’s monthly maintenance fee, among other things, can result in overdrawn accounts. Overdrawn account balances are deemed to be our
39
receivables due from cardholders, and we include them as a component of accounts receivable, net, on our consolidated balance sheets. We generally recover overdrawn account balances from those cardholders that perform a reload transaction. In addition, we recover some overdrawn account balances related to purchase transaction through enforcement of payment network rules, which allow us to recover the amounts from the merchant where the purchase transaction was conducted. However, we are exposed to losses from any unrecovered overdrawn account balances. The probability of recovering these amounts is primarily related to the number of days that have elapsed since an account had activity, such as a purchase, ATM transaction or fee assessment. Generally, we recover 50-60% of overdrawn account balances in accounts that have had activity in the last 30 days, less than 15% in accounts that have had activity in the last 30 to 60 days, and less than 10% when more than 60 days have elapsed.
We establish a reserve for uncollectible overdrawn accounts. We classify overdrawn accounts into age groups based on the number of days since the account last had repayment activity. We then calculate a reserve factor for each age group based on the average recovery rate for the most recent six months. These factors are applied to these age groups to estimate our overall reserve. We rely on these historical rates because they have remained relatively consistent over time. When more than 90 days have passed without any activity in an account, we consider recovery to be remote and charge off the full amount of the overdrawn account balance against the reserve for uncollectible overdrawn accounts. Our actual recovery rates and related estimates thereof may change in the future in response to factors such as customer behavior, product pricing and features that impact the frequency and velocity of reloads and other deposits to such accounts.
We include our provision for uncollectible overdrawn accounts related to maintenance fees and purchase transactions as an offset to card revenues and other fees and in other general and administrative expenses, respectively, in our consolidated statements of operations.
Goodwill and Intangible Assets
We review the recoverability of goodwill at least annually or whenever significant events or changes occur, which might impair the recovery of recorded costs. Factors that may be considered a change in circumstances indicating that the carrying value of our goodwill may not be recoverable include a decline in our stock price and market capitalization, declines in the market conditions of our products, reductions in our future cash flow estimates, and significant adverse industry or economic market trends. We test for impairment of goodwill by assessing various qualitative factors with respect to developments in our business and the overall economy and calculating the fair value of a reporting unit using the discounted cash flow method, as necessary. In the event that the carrying value of assets is determined to be unrecoverable, we would estimate the fair value of the reporting unit and record an impairment charge for the excess of the carrying value over the fair value. The estimate of fair value requires management to make a number of assumptions and projections, which could include, but would not be limited to, future revenues, earnings and the probability of certain outcomes. We completed our annual goodwill impairment test as of September 30, 2019. Based on the results of step one of the annual goodwill impairment test, we determined that step two was not required for each of our reporting units as their fair values exceeded their carrying values indicating there was no impairment.
Intangible and other long lived-assets subject to amortization are reviewed for impairment whenever events or changes in circumstances indicate that the carrying amount may not be recoverable. Certain factors which may occur and indicate that an impairment exists include, but are not limited to, the following: significant underperformance relative to expected historical or projected future operating results; significant changes in the manner of use of the underlying assets; and significant adverse industry or market economic trends. In reviewing for impairment, we compare the carrying value of such assets to the estimated undiscounted future net cash flows expected from the use of the assets and their eventual disposition. In the event that the carrying value of assets is determined to be unrecoverable, we would estimate the fair value of the assets and record an impairment charge for the excess of the carrying value over the fair value. The estimate of fair value requires management to make a number of assumptions and projections, which could include, but would not be limited to, future revenues, earnings and the probability of certain outcomes. No impairment charges were recognized related to our intangible assets for the years ended December 31, 2019 and 2018.
40
Results of Operations
Pursuant to instruction 1 of the instructions to paragraph 303(a) of Regulation S-K, discussion of the results of operations for the fiscal year ended December 31, 2018 to fiscal year ended December 31, 2017 has been omitted. Such omitted discussion can be found under Item 7 “Management’s Discussion and Analysis of Financial Condition and Results of Operations” in our Annual Report on Form 10-K for the fiscal year ended December 31, 2018, filed with the SEC on February 26, 2019.
Comparison of Consolidated Results for the Years Ended December 31, 2019 and 2018
Operating Revenues
The following table presents a breakdown of our operating revenues among card revenues and other fees, processing and settlement service revenues, interchange revenues and net interest income:
Year Ended December 31, | |||||||||||||
2019 | 2018 | ||||||||||||
Amount | % of Total Operating Revenues | Amount | % of Total Operating Revenues | ||||||||||
(In thousands, except percentages) | |||||||||||||
Operating revenues: | |||||||||||||
Card revenues and other fees | $ | 459,357 | 41.4 | % | $ | 482,881 | 45.3 | % | |||||
Processing and settlement service revenues | 287,064 | 25.9 | 247,958 | 23.3 | |||||||||
Interchange revenues | 330,233 | 29.8 | 310,919 | 29.2 | |||||||||
Interest income, net | 31,941 | 2.9 | 23,817 | 2.2 | |||||||||
Total operating revenues | $ | 1,108,595 | 100.0 | % | $ | 1,065,575 | 100.0 | % | |||||
Card Revenues and Other Fees — Card revenues and other fees totaled $459.4 million for the year ended December 31, 2019, a decrease of $23.5 million, or 5%, from the comparable prior year period. Our card revenues and other fees decreased primarily as a result of a decline in monthly maintenance fees and an increase in estimated cash back rewards that we record as a reduction to card revenues and other fees. The decline in monthly maintenance fees is associated with the decline in the number of active accounts in our Consumer business. Our estimate of cash rewards varies based on multiple factors including the terms and conditions of the cash back program, customer activity and customer redemption rates. Cash rewards have increased steadily year-over-year as our cash-back programs have grown, principally from those launched in 2016 and to a lesser extent, new cash-back programs launched in 2019. These decreases were partially offset by program management fees earned from our BaaS partners.
Processing and Settlement Service Revenues — Processing and settlement service revenues totaled $287.1 million for the year ended December 31, 2019, an increase of $39.1 million, or 16%, from the comparable prior year period. The increase was driven primarily by year-over-year growth in transaction volume associated with cash transfers and disbursement services through our Simply Paid disbursement service.
Interchange Revenues — Interchange revenues totaled $330.2 million for the year ended December 31, 2019, an increase of $19.3 million, or 6%, from the comparable prior year period. The increase was primarily due to an increase in purchase volume during the year ended December 31, 2019.
Interest Income, net — Net interest income totaled $31.9 million for the year ended December 31, 2019, an increase of $8.1 million, or 34%, from the comparable prior year period. The increase was principally the result of higher interest rates earned compared to the prior year period, and to a lesser extent, higher average balances in our investment securities portfolio and customer funds on deposit.
Operating Expenses
The following table presents a breakdown of our operating expenses among sales and marketing, compensation and benefits, processing, and other general and administrative expenses:
41
Year Ended December 31, | |||||||||||||
2019 | 2018 | ||||||||||||
Amount | % of Total Operating Revenues | Amount | % of Total Operating Revenues | ||||||||||
(In thousands, except percentages) | |||||||||||||
Operating expenses: | |||||||||||||
Sales and marketing expenses | $ | 386,840 | 34.9 | % | $ | 326,333 | 30.6 | % | |||||
Compensation and benefits expenses | 198,412 | 17.9 | 221,627 | 20.8 | |||||||||
Processing expenses | 200,674 | 18.1 | 181,160 | 17.0 | |||||||||
Other general and administrative expenses | 199,751 | 18.0 | 206,040 | 19.4 | |||||||||
Total operating expenses | $ | 985,677 | 88.9 | % | $ | 935,160 | 87.8 | % | |||||
Sales and Marketing Expenses — Sales and marketing expenses totaled $386.8 million for the year ended December 31, 2019, an increase of $60.5 million, or 19% compared to the year ended December 31, 2018. This increase was primarily driven by an increase in advertising expenses in support of our recent Green Dot Unlimited product launch and in sales commissions associated with higher revenues generated from products that are subject to revenue-sharing agreements. Under our new agreement with Walmart, the sales commission rate we pay for the MoneyCard program increased from the prior agreement. We expect our sales and marketing expenses in 2020 to be negatively impacted by the increased commission rate.
Compensation and Benefits Expenses — Compensation and benefits expenses totaled $198.4 million for the year ended December 31, 2019, a decrease of $23.2 million, or 10%, compared to the year ended December 31, 2018. The decrease was primarily the result of a $20.5 million decrease in employee stock-based compensation as a result of the modification of certain performance based equity awards and adjustments for the estimated payouts thereof as of December 31, 2019, as well as lower salaries and wages of $7.7 million due to a decrease in accrued bonus compensation. These decreases were partially offset by an increase of $3.2 million in third-party contractor expenses, primarily related to call center support.
Processing Expenses — Processing expenses totaled $200.7 million for the year ended December 31, 2019, an increase of $19.5 million, or 11%, compared to the year ended December 31, 2018. This increase was principally the result of higher volume of ATM and purchase transactions initiated by our account holders and higher merchant acquiring costs associated with peer-to-peer payment activity on our mobile-only accounts by our account holders within our Account Services segment. The year-over-year increase was also attributable to the growth in disbursement transactions processed by our Simply Paid platform within our Processing and Settlement Services segment.
Other General and Administrative Expenses — Other general and administrative expenses totaled $199.8 million for the year ended December 31, 2019, a decrease of $6.2 million, or 3%, from the comparable prior year period. Other general and administrative expenses decreased principally due to the $13.5 million expense recorded during the prior year period for the resolution of the final earn-out calculation related to the acquisition of our tax refund processing business, which did not recur for the year ended December 31, 2019. Other general and administrative expenses were also impacted favorably by lower dispute and purchase transaction losses compared with the prior year period, offset by higher depreciation and amortization of property and equipment of $10.1 million, higher professional expenses of $4.1 million and higher other administrative expenses.
Income Tax Expense
The following table presents a breakdown of our effective tax rate among federal, state and other:
Year Ended December 31, | |||||
2019 | 2018 | ||||
U.S. federal statutory tax rate | 21.0 | % | 21.0 | % | |
State income taxes, net of federal tax benefit | 0.1 | (0.5 | ) | ||
General business credits | (2.1 | ) | (2.2 | ) | |
Employee stock-based compensation | (2.2 | ) | (17.1 | ) | |
Tax Cuts and Jobs Act remeasurement | — | 0.2 | |||
IRC 162(m) limitation | 0.1 | 2.2 | |||
Other | 0.6 | 0.5 | |||
Effective tax rate | 17.5 | % | 4.1 | % | |
42
Our income tax expense amounted to $21.2 million for the year ended December 31, 2019, an increase of $16.1 million from the prior year period due to an increase in our effective tax rate from 4.1% to 17.5%. This increase is primarily due to the decrease in benefit on the recognition of excess tax benefits from stock-based compensation expense and additional expenses related to state taxes, net of federal benefits.
The "Other" category in our effective tax rate consists of a variety of permanent differences, none of which were individually significant.
Results of Operations by Segment
Information with respect to the results of operations for each of our reportable segments may be found under Note 24 — Segment Information to the Consolidated Financial Statements included herein, which information is incorporated herein by reference.
43
Capital Requirements for Bank Holding Companies
Our subsidiary bank, Green Dot Bank, is a member bank of the Federal Reserve System and our primary regulators are the Federal Reserve Board and the Utah Department of Financial Institutions. We and Green Dot Bank are subject to various regulatory capital requirements administered by the banking agencies. Failure to meet minimum capital requirements can initiate certain mandatory actions by regulators that, if undertaken, could have a direct material effect on our financial statements. Under capital adequacy guidelines, we and Green Dot Bank must meet specific capital guidelines that involve quantitative measures of the assets, liabilities and certain off-balance sheet items as calculated under regulatory accounting practices. The capital amounts and classification are also subject to qualitative judgments by the regulators about components, risk weightings and other factors.
In July 2013, the Federal Reserve and other U.S. banking regulators approved final rules regarding new risk-based capital, leverage and liquidity standards, known as “Basel III.” The Basel III rules, which became effective for us and our bank on January 1, 2015, are subject to certain phase-in periods that occur over several years. The U.S. Basel III rules contain new capital standards that change the composition of capital, increase minimum capital ratios and strengthen counter-party credit risk capital requirements. The Basel III rules also include a new definition of common equity Tier 1 capital and require that certain levels of such common equity Tier 1 capital be maintained. The rules also include a new capital conservation buffer, which impose a common equity requirement above the new minimum that can be depleted under stress and could result in restrictions on capital distributions and discretionary bonuses under certain circumstances, as well as a new standardized approach for calculating risk-weighted assets. Under the Basel III rules, we must maintain a ratio of common equity Tier 1 capital to risk-weighted assets of at least 4.5%, a ratio of Tier 1 capital to risk-weighted assets of at least 6%, a ratio of total capital to risk-weighted assets of at least 8% and a minimum Tier 1 leverage ratio of 4.0%.
As of December 31, 2019 and 2018, we and Green Dot Bank were categorized as "well capitalized" under applicable regulatory standards. To be categorized as "well capitalized," we and Green Dot Bank must maintain specific total risk-based, Tier 1 risk-based and Tier 1 leverage ratios as set forth in the table below. There were no conditions or events since December 31, 2019 which management believes would have changed our category as "well capitalized."
The definitions associated with the amounts and ratios below are as follows:
Ratio | Definition | |
Tier 1 leverage ratio | Tier 1 capital divided by average total assets | |
Common equity Tier 1 capital ratio | Common equity Tier 1 capital divided by risk-weighted assets | |
Tier 1 capital ratio | Tier 1 capital divided by risk-weighted assets | |
Total risk-based capital ratio | Total capital divided by risk-weighted assets | |
Terms | Definition | |
Tier 1 capital and Common equity Tier 1 capital | Primarily includes common stock, retained earnings and accumulated OCI, net of deductions and adjustments primarily related to goodwill, deferred tax assets and intangibles. Under the regulatory capital rules, certain deductions and adjustments to these capital figures are phased in through January 1, 2018. | |
Total capital | Tier 1 capital plus supplemental capital items such as the allowance for loan losses, subject to certain limits | |
Average total assets | Average total consolidated assets during the period less deductions and adjustments primarily related to goodwill, deferred tax assets and intangibles assets | |
Risk-weighted assets | Represents the amount of assets or exposure multiplied by the standardized risk weight (%) associated with that type of asset or exposure. The standardized risk weights are prescribed in the bank capital rules and reflect regulatory judgment regarding the riskiness of a type of asset or exposure | |
44
The actual amounts and ratios, and required "well capitalized" minimum capital amounts and ratios at December 31, 2019 and 2018, were as follows:
December 31, 2019 | ||||||||||||
Amount | Ratio | Regulatory Minimum | "Well-capitalized" Minimum | |||||||||
(In thousands, except ratios) | ||||||||||||
Green Dot Corporation: | ||||||||||||
Tier 1 leverage | $ | 400,445 | 22.2 | % | 4.0 | % | n/a | |||||
Common equity Tier 1 capital | $ | 400,445 | 70.5 | % | 4.5 | % | n/a | |||||
Tier 1 capital | $ | 400,445 | 70.5 | % | 6.0 | % | 6.0 | % | ||||
Total risk-based capital | $ | 404,469 | 71.2 | % | 8.0 | % | 10.0 | % | ||||
Green Dot Bank: | ||||||||||||
Tier 1 leverage | $ | 204,141 | 13.9 | % | 4.0 | % | 5.0 | % | ||||
Common equity Tier 1 capital | $ | 204,141 | 82.8 | % | 4.5 | % | 6.5 | % | ||||
Tier 1 capital | $ | 204,141 | 82.8 | % | 6.0 | % | 8.0 | % | ||||
Total risk-based capital | $ | 205,548 | 83.4 | % | 8.0 | % | 10.0 | % | ||||
December 31, 2018 | ||||||||||||
Amount | Ratio | Regulatory Minimum | "Well-capitalized" Minimum | |||||||||
(In thousands, except ratios) | ||||||||||||
Green Dot Corporation: | ||||||||||||
Tier 1 leverage | $ | 353,047 | 20.1 | % | 4.0 | % | n/a | |||||
Common equity Tier 1 capital | $ | 353,047 | 88.8 | % | 4.5 | % | n/a | |||||
Tier 1 capital | $ | 353,047 | 88.8 | % | 6.0 | % | 6.0 | % | ||||
Total risk-based capital | $ | 357,092 | 89.8 | % | 8.0 | % | 10.0 | % | ||||
Green Dot Bank: | ||||||||||||
Tier 1 leverage | $ | 172,518 | 11.7 | % | 4.0 | % | 5.0 | % | ||||
Common equity Tier 1 capital | $ | 172,518 | 100.8 | % | 4.5 | % | 6.5 | % | ||||
Tier 1 capital | $ | 172,518 | 100.8 | % | 6.0 | % | 8.0 | % | ||||
Total risk-based capital | $ | 173,838 | 101.5 | % | 8.0 | % | 10.0 | % | ||||
45
Liquidity and Capital Resources
The following table summarizes our major sources and uses of cash for the periods presented:
Year Ended December 31, | |||||||
2019 | 2018 | ||||||
(In thousands) | |||||||
Total cash provided by (used in) | |||||||
Operating activities | $ | 189,914 | $ | 251,051 | |||
Investing activities | (153,853 | ) | (114,967 | ) | |||
Financing activities | (65,125 | ) | (50,961 | ) | |||
(Decrease) increase in unrestricted cash, cash equivalents and restricted cash | $ | (29,064 | ) | $ | 85,123 | ||
During the years ended December 31, 2019 and 2018 we financed our operations primarily through our cash flows provided by operating activities. From time to time, we may also finance short term working capital activities through our borrowings under our credit facility. At December 31, 2019, our primary source of liquidity was unrestricted cash and cash equivalents totaling $1.1 billion. We also consider our $277.4 million of investment securities available-for-sale to be highly-liquid instruments.
We use trend and variance analysis as well as our detailed budgets and forecasts to project future cash needs, making adjustments to the projections when needed. We believe that our current unrestricted cash and cash equivalents, cash flows from operations and borrowing capacity under our credit facility will be sufficient to meet our working capital, capital expenditure, equity method investee capital commitment, and debt service requirements and any other capital needs for at least the next 12 months.
Cash Flows from Operating Activities
Our $189.9 million of net cash provided by operating activities in the year ended December 31, 2019 principally resulted from $99.9 million of net income, adjusted for certain non-cash operating expenses of $118.5 million, and a decrease in working capital assets and liabilities of $28.5 million, driven principally by changes in accounts receivables and prepaid and other assets. Our $251.1 million of net cash provided by operating activities in the year ended December 31, 2018 principally resulted from $118.7 million of net income, adjusted for certain non-cash operating expenses of $128.1 million, and an increase in net changes in working capital assets and liabilities of $4.3 million, driven principally by the timing of payments of our accounts payable and accrued liabilities and the settlement of outstanding accounts receivables.
Cash Flows from Investing Activities
Our $153.9 million of net cash used in investing activities in the year ended December 31, 2019 primarily reflects payments for acquisition of property and equipment of $78.2 million and purchases of available-for-sale investment securities, net of proceeds from sales and maturities of $73.2 million. Our $115.0 million of net cash used in investing activities in the year ended December 31, 2018 primarily reflects payments for acquisition of property and equipment of $61.0 million and purchases of available-for-sale investment securities, net of proceeds from sales and maturities of $48.1 million.
Cash Flows from Financing Activities
Our $65.1 million of net cash used in financing activities for the year ended December 31, 2019 was principally the result of $100.0 million used for stock repurchases under our stock repurchase program, $60.0 million in repayments of our note payable, a net decrease in obligations to customers of $66.8 million and $21.3 million in taxes paid from net settled equity awards, offset by a net increase in customer deposits of $146.1 million and borrowings on our revolving credit facility of $35.0 million. Our $51.0 million of net cash used in financing activities for the year ended December 31, 2018 was primarily the result of $46.0 million in taxes paid from net settled equity awards and $22.5 million in repayments of our note payable, offset by $21.9 million from stock option exercise and employee stock purchase plan proceeds.
Commitments
We anticipate that we will continue to purchase property and equipment as necessary in the normal course of our business. The amount and timing of these purchases and the related cash outflows in future periods is difficult to predict and is dependent on a number of factors including the hiring of employees, the rate of change of computer hardware and software used in our business and our business outlook. We intend to continue to invest in new products and programs, new features for our existing products and IT infrastructure to scale and operate effectively to meet our
46
strategic objectives. We expect these capital expenditures will be similar to the amount of our capital expenditures in 2019 as we reinvest a portion of the incremental cash flow generated from operations.
We have used cash to acquire businesses and technologies and we anticipate that we may continue to do so in the future. The nature of these transactions makes it difficult to predict the amount and timing of such cash requirements. We may also be required to raise additional financing to complete future acquisitions. On February 28, 2017, we completed our acquisition of all the membership interests of UniRush LLC, which included a minimum $4 million annual earn-out payment for five years following the closing. The earn-out payments will be made each year, with the minimum payment potentially becoming greater if certain revenue growth targets for the RushCard GPR card program are met in a given year, although any potential increase is not expected to be material to the overall purchase price.
Additionally, we may make periodic cash contributions to our subsidiary bank, Green Dot Bank, to maintain its capital, leverage and other financial commitments at levels we have agreed to with our regulators.
Senior Credit Facility
In October 2014, we entered into a $225 million credit agreement with Bank of America, N.A., as administrative agent, Wells Fargo Bank, National Association, and other lenders party thereto. The agreement provided for (i) a $75 million five-year revolving facility (the “Revolving Facility”) and (ii) a five-year $150 million term loan facility (the “Term Facility” and, together with the Revolving Facility, the “Senior Credit Facility”). At our election, loans made under the credit agreement carried interest at (1) a LIBOR rate or (2) a base rate as defined in the agreement, plus an applicable margin. Quarterly principal payments of $5.6 million were payable on the loans under the Term Facility. In March 2019, we elected to make a voluntary prepayment of $60.0 million to retire our Term Facility without penalty or additional premium. The Revolving Facility remained available for use until October 2019, at which point we entered into a new revolving facility.
The Senior Credit Facility subjected us to certain financial covenants, which included maintaining a minimum fixed charge coverage ratio and a maximum consolidated leverage ratio at the end of each fiscal quarter, as defined in the agreement, as amended. We were in compliance with all such covenants for the duration of the agreement.
2019 Revolving Facility
In October 2019, we entered into a new revolving credit agreement with Wells Fargo Bank, National Association, and other lenders party thereto. The new credit agreement provides for a $100 million five-year revolving facility and matures in October 2024. Borrowings available under the 2019 Revolving Facility as of December 31, 2019 amounted to $65.0 million. At our election, loans made under the credit agreement bear interest at 1) a LIBOR rate (the “LIBOR Rate") or 2) a base rate determined by reference to the highest of (a) the United States federal funds rate plus 0.50%, (b) the Wells Fargo prime rate, and (c) one-month LIBOR rate plus 1.0% (the “Base Rate"), plus in either case an applicable margin. The applicable margin for borrowings depends on our total leverage ratio and varies from 1.25% to 2.00% for LIBOR Rate loans and 0.25% to 1.00% for Base Rate loans (3.05% as of December 31, 2019). We remain subject to certain financial covenants, which include maintaining a minimum fixed charge coverage ratio and a maximum consolidated leverage ratio at the end of each fiscal quarter, as defined in the agreement. As of December 31, 2019, we were in compliance with all such covenants.
Share Repurchase Program
In previous years, we have repurchased shares of our Class A Common Stock under an authorized stock repurchase program. In May 2017, our Board of Directors authorized, subject to regulatory approval, expansion of our stock repurchase program by an additional $150 million. We sought and received regulatory approval during the second quarter of 2019, at which point we made an up-front payment of $100 million to enter into an accelerated share repurchase agreement. In August 2019, we completed final settlement of shares purchased under this agreement, receiving in total approximately 2.1 million shares at an average repurchase price of $48.26. We have an authorized $50 million remaining under our current stock repurchase program for any additional repurchases.
Contractual Obligations
Our contractual commitments will have an impact on our future liquidity. The following table summarizes our contractual obligations, including both on and off-balance sheet transactions that represent material expected or contractually committed future obligations, at December 31, 2019. We believe that we will be able to fund these obligations through cash generated from operations and from our existing cash balances.
47
Payments Due by Period | |||||||||||||||||||
Total | Less than 1 Year | 1-3 Years | 3-5 Years | More than 5 Years | |||||||||||||||
(In thousands) | |||||||||||||||||||
Debt obligations | $ | 35,000 | $ | 35,000 | $ | — | $ | — | $ | — | |||||||||
Operating lease obligations | 36,977 | 9,846 | 21,935 | 5,196 | — | ||||||||||||||
Purchase obligations(1) | 32,566 | 17,008 | 14,733 | 825 | — | ||||||||||||||
Total | $ | 104,543 | $ | 61,854 | $ | 36,668 | $ | 6,021 | $ | — | |||||||||
(1) | Primarily future minimum payments under agreements with vendors and our retail distributors. See Note 20 — Commitments and Contingencies of the Notes to our Consolidated Financial Statements. |
In addition to the above contractual obligations, our definitive agreement to acquire all of the equity interests of UniRush provides for a minimum $4 million annual earn-out payment for five years following the closing, ending in February 2022.
Off-Balance Sheet Arrangements
During the years ended December 31, 2019 and 2018 we did not have any relationships with unconsolidated organizations or financial partnerships, such as structured finance or special purpose entities that would have been established for the purpose of facilitating off-balance sheet arrangements or other contractually narrow or limited purposes.
On January 2, 2020, we effectuated our agreement with Walmart to jointly establish a new fintech accelerator under the name TailFin Labs, LLC, with a mission to develop innovative products, services and technologies that sit at the intersection of retail shopping and consumer financial services. See Note 25- Subsequent Events of the Notes to our Consolidated Financial Statements for additional information.
48
Statistical Disclosure by Bank Holding Companies
As discussed in Part I, Item 1. Business, we became a bank holding company in December 2011. This section presents information required by the SEC’s Industry Guide 3, “Statistical Disclosure by Bank Holding Companies.” The tables in this section include Green Dot Bank information only.
Distribution of Assets, Liabilities and Stockholders' Equity
The following table presents average balance data and interest income and expense data for our banking operations, as well as the related interest yields and rates for the years ended December 31, 2019 and 2018 and average balance data for the period ended December 31, 2017:
Year ended December 31, | Period ended December 31, | ||||||||||||||||||||||||
2019 | 2018 | 2017 | |||||||||||||||||||||||
Average balance | Interest income/ interest expense | Yield/ rate | Average balance | Interest income/ interest expense | Yield/ rate | Average balance | |||||||||||||||||||
(In thousands, except percentages) | |||||||||||||||||||||||||
Assets | |||||||||||||||||||||||||
Interest-bearing assets | |||||||||||||||||||||||||
Loans (1) | $ | 23,656 | $ | 2,050 | 8.7 | % | $ | 21,742 | $ | 1,847 | 8.5 | % | $ | 11,835 | |||||||||||
Taxable investment securities | 229,575 | 6,722 | 2.9 | 208,359 | 3,958 | 1.9 | 153,276 | ||||||||||||||||||
Non-taxable investment securities | 399 | 10 | 2.5 | 423 | 15 | 3.5 | 296 | ||||||||||||||||||
Federal reserve stock | 5,377 | 273 | 5.1 | 3,722 | 199 | 5.3 | 3,512 | ||||||||||||||||||
Fee advances | 6,301 | 1,296 | 20.6 | 7,641 | 931 | 12.2 | 689 | ||||||||||||||||||
Cash | 1,124,979 | 24,616 | 2.2 | 992,138 | 18,940 | 1.9 | 590,203 | ||||||||||||||||||
Total interest-bearing assets | 1,390,287 | 34,967 | 2.5 | % | 1,234,025 | 25,890 | 2.1 | % | 759,811 | ||||||||||||||||
Non-interest bearing assets | 255,997 | 236,254 | 147,530 | ||||||||||||||||||||||
Total assets | $ | 1,646,284 | $ | 1,470,279 | $ | 907,341 | |||||||||||||||||||
Liabilities | |||||||||||||||||||||||||
Interest-bearing liabilities | |||||||||||||||||||||||||
Checking accounts | $ | 80,642 | $ | 1,750 | 2.2 | % | $ | 75,674 | $ | 1,346 | 1.8 | % | $ | 21,645 | |||||||||||
Savings deposits | 23,598 | 242 | 1.0 | 15,244 | 112 | 0.7 | 9,983 | ||||||||||||||||||
Time deposits, denominations greater than or equal to $100 | 2,234 | 31 | 1.4 | 4,172 | 32 | 0.8 | 4,946 | ||||||||||||||||||
Time deposits, denominations less than $100 | 2,105 | 9 | 0.4 | 1,297 | 9 | 0.7 | 1,489 | ||||||||||||||||||
Total interest-bearing liabilities | 108,579 | 2,032 | 1.9 | % | 96,387 | 1,499 | 1.6 | % | 38,063 | ||||||||||||||||
Non-interest bearing liabilities | 1,225,023 | 1,214,396 | 760,922 | ||||||||||||||||||||||
Total liabilities | 1,333,602 | 1,310,783 | 798,985 | ||||||||||||||||||||||
Total stockholders' equity | 312,682 | 159,496 | 108,356 | ||||||||||||||||||||||
Total liabilities and stockholders' equity | $ | 1,646,284 | $ | 1,470,279 | $ | 907,341 | |||||||||||||||||||
Net interest income/yield on earning assets | $ | 32,935 | 0.6 | % | $ | 24,391 | 0.5 | % | |||||||||||||||||
___________
(1) | Non-performing loans are included in the respective average loan balances. Income, if any, on such loans is recognized on a cash basis. |
49
The following table presents the rate/volume variance in interest income and expense for the year ended December 31, 2019:
December 31, 2019 | |||||||||||
Total Change in Interest Income/ Expense | Change Due to Rate (1) | Change Due to Volume (1) | |||||||||
(In thousands) | |||||||||||
Loans | $ | 203 | $ | 37 | $ | 166 | |||||
Taxable investment securities | 2,764 | 2,143 | 621 | ||||||||
Non-taxable investment securities | (5 | ) | (4 | ) | (1 | ) | |||||
Federal reserve stock | 74 | (10 | ) | 84 | |||||||
Fee advances | 365 | 640 | (275 | ) | |||||||
Cash | 5,676 | 2,769 | 2,907 | ||||||||
$ | 9,077 | $ | 5,575 | $ | 3,502 | ||||||
Checking accounts | $ | 404 | $ | 295 | $ | 109 | |||||
Savings deposits | 130 | 44 | 86 | ||||||||
Time deposits, denominations greater than or equal to $100 | (1 | ) | 26 | (27 | ) | ||||||
Time deposits, denominations less than $100 | — | (3 | ) | 3 | |||||||
$ | 533 | $ | 362 | $ | 171 | ||||||
___________
(1) | The change in interest income and expense not solely due to changes in volume or rate has been allocated on a pro-rata basis to the volume and rate columns. |
Investment Portfolio
The following table presents the amortized cost and fair value of Green Dot Bank’s investment portfolio at December 31, 2019, 2018 and 2017:
December 31, 2019 | December 31, 2018 | December 31, 2017 | |||||||||||||||||||||
Amortized Cost | Fair Value | Amortized Cost | Fair Value | Amortized Cost | Fair Value | ||||||||||||||||||
(In thousands) | |||||||||||||||||||||||
Corporate bonds | $ | 10,000 | $ | 10,012 | $ | — | $ | — | $ | 1,000 | $ | 999 | |||||||||||
Negotiable certificate of deposit | — | — | 15,000 | 15,000 | — | — | |||||||||||||||||
Agency bond securities | 19,980 | 20,000 | 19,723 | 19,693 | — | — | |||||||||||||||||
Agency mortgage-backed securities | 208,821 | 211,033 | 87,156 | 86,813 | 121,036 | 120,034 | |||||||||||||||||
Municipal bonds | 4,342 | 4,342 | 507 | 483 | 742 | 739 | |||||||||||||||||
Asset-backed securities | 31,814 | 32,052 | 79,274 | 79,194 | 20,952 | 20,861 | |||||||||||||||||
Total fixed-income securities | $ | 274,957 | $ | 277,439 | $ | 201,660 | $ | 201,183 | $ | 143,730 | $ | 142,633 | |||||||||||
The following table shows the scheduled maturities, by amortized cost, and average yields for Green Dot Bank’s investment portfolio at December 31, 2019:
Due in one year or less | Due after one year through five years | Due after five years through ten years | Due after ten years | Total | |||||||||||||||
(In thousands, except percentages) | |||||||||||||||||||
Corporate bonds | $ | — | $ | 10,000 | $ | — | $ | — | $ | 10,000 | |||||||||
Agency bond securities | 10,000 | — | 9,980 | — | 19,980 | ||||||||||||||
Agency mortgage-backed securities | — | — | 5,716 | 203,105 | 208,821 | ||||||||||||||
Municipal bonds | — | — | — | 4,342 | 4,342 | ||||||||||||||
Asset-backed securities | — | 21,904 | 9,910 | — | 31,814 | ||||||||||||||
Total fixed-income securities | $ | 10,000 | $ | 31,904 | $ | 25,606 | $ | 207,447 | $ | 274,957 | |||||||||
Weighted-average yield | 2.36 | % | 2.96 | % | 2.65 | % | 2.75 | % | 2.75 | % | |||||||||
50
Deposits
The following table shows Green Dot Bank’s average deposits and the annualized average rate paid on those deposits for the years ended December 31, 2019, 2018, and 2017:
December 31, 2019 | December 31, 2018 | December 31, 2017 | ||||||||||||||||||
Average Balance | Weighted-Average Rate | Average Balance | Weighted-Average Rate | Average Balance | Weighted-Average Rate | |||||||||||||||
(In thousands, except percentages) | ||||||||||||||||||||
Interest-bearing deposit accounts | ||||||||||||||||||||
Checking accounts | $ | 80,642 | 2.2 | % | $ | 75,674 | 1.8 | % | $ | 21,645 | 0.1 | % | ||||||||
Savings deposits | 23,598 | 1.0 | 15,244 | 0.7 | 9,983 | 0.2 | ||||||||||||||
Time deposits, denominations greater than or equal to $100 | 2,234 | 1.4 | 4,172 | 0.8 | 4,946 | 0.7 | ||||||||||||||
Time deposits, denominations less than $100 | 2,105 | 0.4 | 1,297 | 0.7 | 1,489 | 0.6 | ||||||||||||||
Total interest-bearing deposit accounts | 108,579 | 1.9 | % | 96,387 | 1.6 | % | 38,063 | 0.2 | % | |||||||||||
Non-interest bearing deposit accounts | 839,657 | 943,464 | 527,202 | |||||||||||||||||
Total deposits | $ | 948,236 | $ | 1,039,851 | $ | 565,265 | ||||||||||||||
The following table shows the scheduled maturities for Green Dot Bank’s time deposits portfolio greater than $100,000 at December 31, 2019:
December 31, 2019 | |||
(In thousands) | |||
Less than 3 months | $ | 1,279 | |
3 through 6 months | 489 | ||
6 through 12 months | 210 | ||
Greater than 12 months | 1,876 | ||
$ | 3,854 | ||
Key Financial Ratios
The following table shows certain of Green Dot Bank’s key financial ratios for the years ended December 31, 2019, 2018, and 2017:
December 31, 2019 | December 31, 2018 | December 31, 2017 | ||||||
Net return on assets | 3.4 | % | 2.3 | % | 1.7 | % | ||
Net return on equity | 17.7 | 21.0 | 14.0 | |||||
Equity to assets ratio | 19.0 | 10.9 | 11.9 | |||||
ITEM 7A. Quantitative and Qualitative Disclosures about Market Risk
Market risk is the potential for economic losses from changes in market factors such as foreign currency exchange rates, credit, interest rates and equity prices. We believe that we have limited exposure to risks associated with changes in foreign currency exchange rates, interest rates and equity prices. We have no significant foreign operations. We do not hold or enter into derivatives or other financial instruments for trading or speculative purposes.
Interest rates
While operating net interest income has become a more meaningful component to our consolidated operating results, we do not consider our cash and cash equivalents or our investment securities to be subject to material interest rate risk due to their short duration. However, the Federal Open Market Committee (FOMC) decreased the federal funds target rate multiple times in 2019 to end the year, with additional reductions possible in the future. Further reductions in short-term interest rates could result in a decrease in the amount of net interest income we earn.
As of December 31, 2019, we had $35.0 million outstanding under our $100.0 million line of credit agreement. Refer to Note 10 — Debt to the Consolidated Financial Statements included herein for additional information. Our revolving credit facility is, and is expected to be, at variable rates of interest and expose us to interest rate risk. Although any short-term borrowings under our revolving credit facility would likely be insensitive to interest rate changes, interest expense on short-term borrowings will increase and decrease with changes in the underlying short-term interest rates. For example, assuming our credit agreement is drawn up to its maximum borrowing capacity of $100.0 million, based
51
on the applicable LIBOR and margin in effect as of December 31, 2019, each quarter point of change in interest rates would result in a $0.3 million change in our annual interest expense.
We actively monitor our interest rate exposure and our objective is to reduce, where we deem appropriate to do so, fluctuations in earnings and cash flows associated with changes in interest rates. In order to accomplish this objective, we may enter into derivative financial instruments, such as forward contracts and interest rate hedge contracts only to the extent necessary to manage our exposure. We do not hold or enter into derivatives or other financial instruments for trading or speculative purposes.
Credit and liquidity risk
We do have exposure to credit and liquidity risk associated with the financial institutions that hold our cash and cash equivalents, restricted cash, available-for-sale investment securities, settlement assets due from our Simply Paid distribution partners and retail distributors that collect funds and fees from our customers, and amounts due from our issuing banks for fees collected on our behalf.
We manage the credit and liquidity risk associated with our cash and cash equivalents, available-for-sale investment securities, loans and amounts due from issuing banks by maintaining an investment policy that restricts our correspondent banking relationships to approved, well capitalized institutions and restricts investments to highly liquid, low credit risk assets. Our policy has limits related to liquidity ratios, the concentration that we may have with a single institution or issuer and effective maturity dates as well as restrictions on the type of assets that we may invest in. The management Asset Liability Committee is responsible for monitoring compliance with our Capital Asset Liability Management policy and related limits on an ongoing basis, and reports regularly to the risk committee of our Board of Directors.
Our exposure to credit risk associated with our retail distributors and Simply Paid distribution partners is mitigated due to the short time period, currently an average of two days that retailer settlement assets are outstanding. We perform an initial credit review and assign a credit limit to each new retail distributor and Simply Paid distribution partner. We monitor each retail distributor’s and Simply Paid distribution partner's settlement asset exposure and its compliance with its specified contractual settlement terms on a daily basis and assess their credit limit and financial condition on a periodic basis. Our management's Enterprise Risk Management Committee is responsible for monitoring our retail distributor and Simply Paid distribution partner exposure and assigning credit limits and reports regularly to the risk committee of our Board of Directors.
52
ITEM 8. Financial Statements and Supplementary Data
Index to Consolidated Financial Statements
Page | |
All financial statement schedules have been omitted, since the required information is not applicable or is not present in amounts sufficient to require submission of the schedule, or because the information required is included in the consolidated financial statements and notes thereto.
53
Report of Independent Registered Public Accounting Firm
To the Stockholders and the Board of Directors of Green Dot Corporation
Opinion on Internal Control over Financial Reporting
We have audited Green Dot Corporation’s internal control over financial reporting as of December 31, 2019, based on criteria established in Internal Control- Integrated Framework issued by the Committee of Sponsoring Organizations of the Treadway Commission (2013 framework) (the “COSO criteria”). In our opinion, Green Dot Corporation (the “Company”) maintained, in all material respects, effective internal control over financial reporting as of December 31, 2019, based on the COSO criteria.
We also have audited, in accordance with the standards of the Public Company Accounting Oversight Board (United States) (“PCAOB”), the 2019 consolidated financial statements of the Company and our report dated February 28, 2020 expressed an unqualified opinion thereon.
Basis for Opinion
The Company’s management is responsible for maintaining effective internal control over financial reporting and for its assessment of the effectiveness of internal control over financial reporting included in the accompanying report of management on internal control over financial reporting. Our responsibility is to express an opinion on the Company’s internal control over financial reporting based on our audit. We are a public accounting firm registered with the PCAOB and are required to be independent with respect to the Company in accordance with the U.S. federal securities laws and the applicable rules and regulations of the Securities and Exchange Commission and the PCAOB.
We conducted our audit in accordance with the standards of the PCAOB. Those standards require that we plan and perform the audit to obtain reasonable assurance about whether effective internal control over financial reporting was maintained in all material respects.
Our audit included obtaining an understanding of internal control over financial reporting, assessing the risk that a material weakness exists, testing and evaluating the design and operating effectiveness of internal control based on the assessed risk, and performing such other procedures as we considered necessary in the circumstances. We believe that our audit provides a reasonable basis for our opinion.
Definition and Limitations of Internal Control Over Financial Reporting
A company’s internal control over financial reporting is a process designed to provide reasonable assurance regarding the reliability of financial reporting and the preparation of financial statements for external purposes in accordance with generally accepted accounting principles. A company’s internal control over financial reporting includes those policies and procedures that (1) pertain to the maintenance of records that, in reasonable detail, accurately and fairly reflect the transactions and dispositions of the assets of the company; (2) provide reasonable assurance that transactions are recorded as necessary to permit preparation of financial statements in accordance with generally accepted accounting principles, and that receipts and expenditures of the company are being made only in accordance with authorizations of management and directors of the company; and (3) provide reasonable assurance regarding prevention or timely detection of unauthorized acquisition, use, or disposition of the company’s assets that could have a material effect on the financial statements.
Because of its inherent limitations, internal control over financial reporting may not prevent or detect misstatements. Also, projections of any evaluation of effectiveness to future periods are subject to the risk that controls may become inadequate because of changes in conditions, or that the degree of compliance with the policies or procedures may deteriorate.
/s/ Ernst & Young LLP
Los Angeles, California
February 28, 2020
54
Report of Independent Registered Public Accounting Firm
To the Stockholders and the Board of Directors of Green Dot Corporation
Opinion on the Financial Statements
We have audited the accompanying consolidated balance sheets of Green Dot Corporation (the “Company”) as of December 31, 2019 and 2018, the related consolidated statements of operations, comprehensive income, changes in stockholders’ equity and cash flows for each of the three years in the period ended December 31, 2019, and the related notes (collectively referred to as the “consolidated financial statements”). In our opinion, the consolidated financial statements present fairly, in all material respects, the financial position of the Company at December 31, 2019 and 2018, and the results of its operations and its cash flows for each of the three years in the period ended December 31, 2019, in conformity with U.S. generally accepted accounting principles.
We also have audited, in accordance with the standards of the Public Company Accounting Oversight Board (United States) (“PCAOB”), the Company's internal control over financial reporting as of December 31, 2019, based on criteria established in Internal Control-Integrated Framework issued by the Committee of Sponsoring Organizations of the Treadway Commission (2013 framework) and our report dated February 28, 2020 expressed an unqualified opinion thereon.
Basis for Opinion
These financial statements are the responsibility of the Company's management. Our responsibility is to express an opinion on the Company’s financial statements based on our audits. We are a public accounting firm registered with the PCAOB and are required to be independent with respect to the Company in accordance with the U.S. federal securities laws and the applicable rules and regulations of the Securities and Exchange Commission and the PCAOB.
We conducted our audits in accordance with the standards of the PCAOB. Those standards require that we plan and perform the audit to obtain reasonable assurance about whether the financial statements are free of material misstatement, whether due to error or fraud. Our audits included performing procedures to assess the risks of material misstatement of the financial statements, whether due to error or fraud, and performing procedures that respond to those risks. Such procedures included examining, on a test basis, evidence regarding the amounts and disclosures in the financial statements. Our audits also included evaluating the accounting principles used and significant estimates made by management, as well as evaluating the overall presentation of the financial statements. We believe that our audits provide a reasonable basis for our opinion.
Critical Audit Matter
The critical audit matter communicated below is a matter arising from the current period audit of the financial statements that was communicated or required to be communicated to the audit committee and that: (1) relates to accounts or disclosures that are material to the financial statements and (2) involved our especially challenging, subjective or complex judgments. The communication of the critical audit matter does not alter in any way our opinion on the consolidated financial statements, taken as a whole, and we are not, by communicating the critical audit matter below, providing a separate opinion on the critical audit matter or on the accounts or disclosures to which it relates.
Revenue Recognition | |
Description of the Matter | As discussed in Note 2 and Note 3 of the consolidated financial statements, the Company recorded card revenues and other fees of $459.4 million, interchange revenues of $330.2 million, and processing and settlement services revenues of $287.1 million in operating revenues for the year ended December 31, 2019. Card revenues and other fees consist of monthly maintenance fees, new card fees, ATM fees, and other card revenues, which include revenue associated with the Company’s gift card program. Processing and settlement services revenues include cash transfer revenues, Simply Paid disbursement revenues and tax refund processing service revenues. The Company’s revenue recognition differs between each of these discrete revenue streams. The Company recognizes revenue when control of the promised goods or services is transferred to customers in an amount that reflects the consideration the Company expects to be entitled to in exchange for the goods or services. |
55
Auditing card revenues and other fees, interchange revenues, and cash transfer revenues was complex due to the high aggregate dollar value and large volume of revenue-generating transactions, the number of contracts involved with each revenue stream, the number of systems and processes involved in the processing of such transactions, including third-party service organizations, and the judgment required by management in estimating the average card lifetime used to recognize new card fees. | |
How We Addressed the Matter in Our Audit | We obtained an understanding, evaluated the design and tested the operating effectiveness of the Company’s processes, systems and controls related to the recognition of card revenues and other fees, interchange revenues, and cash transfer revenues, including, among others, controls related to management’s assessment of when control of goods and services is transferred to customers, the Company’s use of relevant third-party service organizations, and management’s review of significant assumptions and underlying data used to estimate the average card lifetime. Our audit procedures included, among others, assessing a sample of contracts to determine whether terms that may impact revenue recognition were identified and properly considered in the Company’s evaluation of the accounting for the contracts, calculating revenue per transaction based upon the card revenues and other fees, interchange revenues, and cash transfer revenues recognized and relevant non-financial metrics for each revenue stream (e.g., purchase volumes and number of card activations) and comparing the revenue per transaction for each revenue stream to historical trends and expectations based on contractual rates and historical data. We tested revenue transaction details on a sample basis for certain card revenues and other fees by agreeing such revenues and fees to third party supporting documentation. In addition, we tested the methodology and significant assumptions and underlying data used in management’s estimate of the average card lifetime by comparing the assumptions and data to the Company’s historical data involving the period from activation of the card through the date of last positive balance. |
/s/ Ernst & Young LLP
We have served as the Company’s auditor since 2005.
Los Angeles, California
February 28, 2020
56
GREEN DOT CORPORATION
CONSOLIDATED BALANCE SHEETS
December 31, | |||||||
2019 | 2018 | ||||||
Assets | (In thousands, except par value) | ||||||
Current assets: | |||||||
Unrestricted cash and cash equivalents | $ | $ | |||||
Restricted cash | |||||||
Investment securities available-for-sale, at fair value | |||||||
Settlement assets | |||||||
Accounts receivable, net | |||||||
Prepaid expenses and other assets | |||||||
Income tax receivable | |||||||
Total current assets | |||||||
Investment securities available-for-sale, at fair value | |||||||
Loans to bank customers, net of allowance for loan losses of $1,166 and $1,144 as of December 31, 2019 and 2018, respectively | |||||||
Prepaid expenses and other assets | |||||||
Property and equipment, net | |||||||
Operating lease right-of-use assets | — | ||||||
Deferred expenses | |||||||
Net deferred tax assets | |||||||
Goodwill and intangible assets | |||||||
Total assets | $ | $ | |||||
Liabilities and Stockholders’ Equity | |||||||
Current liabilities: | |||||||
Accounts payable | $ | $ | |||||
Deposits | |||||||
Obligations to customers | |||||||
Settlement obligations | |||||||
Amounts due to card issuing banks for overdrawn accounts | |||||||
Other accrued liabilities | |||||||
Operating lease liabilities | — | ||||||
Deferred revenue | |||||||
Debt | |||||||
Income tax payable | |||||||
Total current liabilities | |||||||
Other accrued liabilities | |||||||
Operating lease liabilities | — | ||||||
Net deferred tax liabilities | |||||||
Total liabilities | |||||||
Commitments and contingencies (Note 20) | |||||||
Stockholders’ equity: | |||||||
Class A common stock, $0.001 par value; 100,000 shares authorized as of December 31, 2019 and 2018; 51,807 and 52,917 shares issued and outstanding as of December 31, 2019 and 2018, respectively | |||||||
Additional paid-in capital | |||||||
Retained earnings | |||||||
Accumulated other comprehensive income (loss) | ( | ) | |||||
Total stockholders’ equity | |||||||
Total liabilities and stockholders’ equity | $ | $ | |||||
See notes to consolidated financial statements
57
GREEN DOT CORPORATION
CONSOLIDATED STATEMENTS OF OPERATIONS
Year Ended December 31, | |||||||||||
2019 | 2018 | 2017 | |||||||||
(In thousands, except per share data) | |||||||||||
Operating revenues: | |||||||||||
Card revenues and other fees | $ | $ | $ | ||||||||
Processing and settlement service revenues | |||||||||||
Interchange revenues | |||||||||||
Interest income, net | |||||||||||
Total operating revenues | |||||||||||
Operating expenses: | |||||||||||
Sales and marketing expenses | |||||||||||
Compensation and benefits expenses | |||||||||||
Processing expenses | |||||||||||
Other general and administrative expenses | |||||||||||
Total operating expenses | |||||||||||
Operating income | |||||||||||
Interest expense, net | |||||||||||
Income before income taxes | |||||||||||
Income tax expense | |||||||||||
Net income | $ | $ | $ | ||||||||
Basic earnings per common share: | $ | $ | $ | ||||||||
Diluted earnings per common share: | $ | $ | $ | ||||||||
Basic weighted-average common shares issued and outstanding: | |||||||||||
Diluted weighted-average common shares issued and outstanding: | |||||||||||
See notes to consolidated financial statements
58
GREEN DOT CORPORATION
CONSOLIDATED STATEMENTS OF COMPREHENSIVE INCOME
Year Ended December 31, | |||||||||||
2019 | 2018 | 2017 | |||||||||
(In thousands) | |||||||||||
Net income | $ | $ | $ | ||||||||
Other comprehensive income (loss) | |||||||||||
Unrealized holding gain (loss), net of tax | ( | ) | |||||||||
Comprehensive income | $ | $ | $ | ||||||||
See notes to consolidated financial statements
59
GREEN DOT CORPORATION
CONSOLIDATED STATEMENTS OF CHANGES IN STOCKHOLDERS' EQUITY
Class A Common Stock | Additional Paid-in Capital | Retained Earnings | Accumulated Other Comprehensive Income (Loss) | Total Stockholders' Equity | ||||||||||||||||||
Shares | Amount | |||||||||||||||||||||
(In thousands) | ||||||||||||||||||||||
Balance at December 31, 2016 | $ | $ | $ | $ | ( | ) | $ | |||||||||||||||
Common stock issued under stock plans, net of withholdings and related tax effects | — | — | ||||||||||||||||||||
Stock-based compensation | — | — | — | — | ||||||||||||||||||
Repurchases of Class A common stock | ( | ) | ( | ) | ( | ) | — | — | ( | ) | ||||||||||||
Net income | — | — | — | — | ||||||||||||||||||
Other comprehensive loss | — | — | — | — | ( | ) | ( | ) | ||||||||||||||
Cumulative effect of accounting change and tax reform | — | — | ( | ) | — | |||||||||||||||||
Balance at December 31, 2017 | $ | $ | $ | $ | ( | ) | $ | |||||||||||||||
Common stock issued under stock plans, net of withholdings and related tax effects | ( | ) | — | — | ( | ) | ||||||||||||||||
Stock-based compensation | — | — | — | — | ||||||||||||||||||
Net income | — | — | — | — | ||||||||||||||||||
Other comprehensive income | — | — | — | — | ||||||||||||||||||
Balance at December 31, 2018 | $ | $ | $ | $ | ( | ) | $ | |||||||||||||||
Common stock issued under stock plans, net of withholdings and related tax effects | ( | ) | — | — | ( | ) | ||||||||||||||||
Stock-based compensation | — | — | — | — | ||||||||||||||||||
Repurchases of Class A common stock | ( | ) | ( | ) | ( | ) | — | — | ( | ) | ||||||||||||
Net income | — | — | — | — | ||||||||||||||||||
Other comprehensive income | — | — | — | — | ||||||||||||||||||
Balance at December 31, 2019 | $ | $ | $ | $ | $ | |||||||||||||||||
See notes to consolidated financial statements
60
GREEN DOT CORPORATION
CONSOLIDATED STATEMENTS OF CASH FLOWS
Year Ended December 31, | |||||||||||
2019 | 2018 | 2017 | |||||||||
(In thousands) | |||||||||||
Operating activities | |||||||||||
Net income | $ | $ | $ | ||||||||
Adjustments to reconcile net income to net cash provided by operating activities: | |||||||||||
Depreciation and amortization of property, equipment and internal-use software | |||||||||||
Amortization of intangible assets | |||||||||||
Provision for uncollectible overdrawn accounts | |||||||||||
Employee stock-based compensation | |||||||||||
Amortization of (discount) premium on available-for-sale investment securities | ( | ) | |||||||||
Change in fair value of contingent consideration | ( | ) | ( | ) | |||||||
Amortization of deferred financing costs | |||||||||||
Impairment of capitalized software | |||||||||||
Deferred income tax expense (benefit) | ( | ) | |||||||||
Changes in operating assets and liabilities: | |||||||||||
Accounts receivable, net | ( | ) | ( | ) | ( | ) | |||||
Prepaid expenses and other assets | ( | ) | ( | ) | ( | ) | |||||
Deferred expenses | ( | ) | |||||||||
Accounts payable and other accrued liabilities | ( | ) | |||||||||
Deferred revenue | ( | ) | |||||||||
Income tax receivable/payable | ( | ) | |||||||||
Other, net | |||||||||||
Net cash provided by operating activities | |||||||||||
Investing activities | |||||||||||
Purchases of available-for-sale investment securities | ( | ) | ( | ) | ( | ) | |||||
Proceeds from maturities of available-for-sale securities | |||||||||||
Proceeds from sales of available-for-sale securities | |||||||||||
Payments for acquisition of property and equipment | ( | ) | ( | ) | ( | ) | |||||
Net increase in loans | ( | ) | ( | ) | ( | ) | |||||
Business acquisition, net of cash acquired | ( | ) | |||||||||
Net cash used in investing activities | ( | ) | ( | ) | ( | ) | |||||
Financing activities | |||||||||||
Borrowings from notes payable | |||||||||||
Repayments of borrowings from notes payable | ( | ) | ( | ) | ( | ) | |||||
Borrowings on revolving line of credit | |||||||||||
Repayments on revolving line of credit | ( | ) | |||||||||
Proceeds from exercise of options | |||||||||||
Taxes paid related to net share settlement of equity awards | ( | ) | ( | ) | ( | ) | |||||
Net increase (decrease) in deposits | ( | ) | |||||||||
Net (decrease) increase in obligations to customers | ( | ) | ( | ) | |||||||
Contingent consideration payments | ( | ) | ( | ) | ( | ) | |||||
Repurchase of Class A common stock | ( | ) | ( | ) | |||||||
Deferred financing costs | ( | ) | ( | ) | |||||||
Net cash used in financing activities | ( | ) | ( | ) | |||||||
Net (decrease) increase in unrestricted cash, cash equivalents and restricted cash | ( | ) | |||||||||
Unrestricted cash, cash equivalents and restricted cash, beginning of period | |||||||||||
Unrestricted cash, cash equivalents and restricted cash, end of period | $ | $ | $ | ||||||||
Cash paid for interest | $ | $ | $ | ||||||||
Cash paid for income taxes | $ | $ | $ | ||||||||
Reconciliation of unrestricted cash, cash equivalents and restricted cash at end of period: | |||||||||||
Unrestricted cash and cash equivalents | $ | $ | $ | ||||||||
Restricted cash | |||||||||||
Total unrestricted cash, cash equivalents and restricted cash, end of period | $ | $ | $ | ||||||||
See notes to consolidated financial statements
61
Note 1—Organization
Green Dot Corporation (“we,” “our,” or “us” refer to Green Dot Corporation and its consolidated subsidiaries) is a financial technology leader and bank holding company with a mission to reinvent banking for the masses. Our company’s long-term strategy is to create a unique, sustainable and highly valuable fintech ecosystem, in part through the continued evolution of our innovative Banking as a Service (“BaaS”) platform, that’s intended to fuel the engine of innovation and growth for us and our business partners.
Enabled by proprietary technology, our commercial bank charter and our high-scale program management operating capability, our vertically integrated technology and banking platform is used by a growing list of America’s most prominent consumer and technology companies to design and deploy their own bespoke financial services solutions to their customers and partners, while we use that same integrated platform for our own leading collection of banking and financial services products marketed directly to consumers through what we believe to be the most broadly distributed, omni-channel branchless banking platforms in the United States.
We were incorporated in Delaware in 1999 and became a bank holding company under the Bank Holding Company Act and a member bank of the Federal Reserve System in December 2011. We are headquartered in Pasadena, California, with additional facilities throughout the United States and in Shanghai, China.
Note 2—Summary of Significant Accounting Policies
Principles of Consolidation and Basis of Presentation
Our consolidated financial statements include the results of Green Dot Corporation and our wholly-owned subsidiaries. We prepared the accompanying consolidated financial statements in accordance with generally accepted accounting principles in the United States of America, or GAAP. We eliminate all significant intercompany balances and transactions on consolidation. We include the results of operations of acquired companies from the date of acquisition.
Reclassifications
Beginning with the first quarter of 2019, we present net interest income generated from operations at Green Dot Bank, our subsidiary bank, as a component of our total operating revenues. Prior year amounts, formerly reported below operating income on our consolidated statements of operations, have been reclassified to conform to our current year presentation on our consolidated statements of operations. This reclassification changed our previously reported total operating revenues, but had no impact on our previously reported consolidated net income or cash flows for any comparative periods presented.
Net interest income at Green Dot Bank has become an increasingly important revenue component as Green Dot Bank's ability to invest its growing customer balances and generate interest income is one of several unique advantages we have as both a leading financial technology company and a federally regulated bank. Net interest income or expense generated outside of Green Dot Bank continues to be reported below operating income on our consolidated statements of operations.
The preparation of financial statements in conformity with GAAP requires us to make estimates and assumptions that affect the amounts reported in the consolidated financial statements, including the accompanying notes. We base our estimates and assumptions on historical factors, current circumstances, and the experience and judgment of management. We evaluate our estimates and assumptions on an ongoing basis. Actual results could differ from those estimates.
Unrestricted Cash and Cash Equivalents
We consider all unrestricted highly liquid investments with an original maturity of three months or less to be unrestricted cash and cash equivalents.
Investment Securities
Our investment portfolio is primarily comprised of fixed income securities. We classify these securities as available-for-sale and report them at fair value with the related unrealized gains and losses, net of tax, included in accumulated other comprehensive income, a component of stockholders’ equity. We classify investment securities with maturities less than or equal to 365 days as current assets.
62
Note 2—Summary of Significant Accounting Policies (continued)
We regularly evaluate each fixed income security where the value has declined below amortized cost to assess whether the decline in fair value is other-than-temporary. In determining whether an impairment is other-than-temporary, we consider the severity and duration of the decline in fair value, the length of time expected for recovery, the financial condition of the issuer, and other qualitative factors, as well as whether we either plan to sell the security or it is more likely-than-not that we will be required to sell the security before recovery of its amortized cost. If the impairment of the investment security is credit-related, an other-than-temporary impairment is recorded in earnings. We recognize non-credit-related impairment in accumulated other comprehensive income. If we intend to sell an investment security or believe we will more-likely-than-not be required to sell a security, we record the full amount of the impairment as an other-than-temporary impairment.
Interest on fixed income securities, including amortization of premiums and accretion of discounts, is included in interest income.
Obligations to Customers and Settlement Assets and Obligations
At the point of sale, our retail distributors collect customer funds for purchases of new cards and balance reloads and then remit these funds directly to the banks that issue our cards. Our retail distributors’ remittance of these funds takes an average of two business days.
Settlement assets represent the amounts due from our retail distributors and other partners for customer funds collected at the point of sale that have not yet been received by our subsidiary bank. Also included in this balance are payroll amounts funded in advance (up to two days early) to certain cardholders who are eligible to participate in our early direct deposit programs. Obligations to customers represent customer funds collected from (or to be remitted by) our retail distributors for which the underlying products have not been activated. Once the underlying products have been activated, the customer funds are reclassified as deposits in a bank account established for the benefit of the customer. Settlement obligations represent the customer funds received by our subsidiary bank that are due to third-party card issuing banks upon activation.
Accounts Receivable, net
Accounts receivable is comprised principally of receivables due from card issuing banks, overdrawn account balances due from cardholders, trade accounts receivable, fee advances and other receivables. We record accounts receivable net of reserves for estimated uncollectible accounts. Receivables due from card issuing banks primarily represent revenue-related funds held at the third-party card issuing banks related to our network branded programs that have yet to be remitted to us. These receivables are generally collected within a short period of time based on the remittance terms in our agreements with the third-party card issuing banks. Fee advances represent short-term advances to in-person tax return preparation companies made prior to and during tax season. These advances are collateralized by their clients' tax preparation fees and are generally collected within a short period of time as the in-person tax preparation companies begin preparing and processing their clients' tax refunds.
Overdrawn Account Balances Due from Cardholders and Reserve for Uncollectible Overdrawn Accounts
Our cardholder accounts may become overdrawn as a result of maintenance fee assessments or from purchase transactions that we honor, in excess of the funds in a cardholder’s account. We are exposed to losses from any unrecovered overdrawn account balances. We establish a reserve for uncollectible overdrawn accounts. We classify overdrawn accounts into age groups based on the number of days that have elapsed since an account last had activity, such as a purchase, ATM transaction or maintenance fee assessment. We calculate a reserve factor for each age group based on the average recovery rate for the most recent six months . These factors are applied to these age groups to estimate our overall reserve. When more than 90 days have passed without activity in an account, we write off the full amount of the overdrawn account balance. We include our provision for uncollectible overdrawn accounts related to maintenance fees and purchase transactions as an offset to card revenues and other fees and in other general and administrative expenses, respectively, in the accompanying consolidated statements of operations.
Restricted Cash
As of December 31, 2019 and 2018, restricted cash amounted to $2.7 million and $0.5 million, respectively. Restricted cash principally relates to pre-funding obligations for cardholder accounts at third-party issuing banks.
63
Note 2—Summary of Significant Accounting Policies (continued)
Loans to Bank Customers
We report loans measured at historical cost at their outstanding principal balances, net of any charge-offs, and for purchased loans, net of any unaccreted discounts. We recognize interest income as it is earned.
Nonperforming Loans
Nonperforming loans generally include loans that have been placed on nonaccrual status. We generally place loans on nonaccrual status when they are past due 90 days or more. We reverse the related accrued interest receivable and apply interest collections on nonaccrual loans as principal reductions; otherwise, we credit such collections to interest income when received. These loans may be restored to accrual status when all principal and interest is current and full repayment of the remaining contractual principal and interest is expected. For our secured credit card portfolio, when an account is past due 90 days, collateral deposits are applied against outstanding credit card balances. Any balance in excess of the collateral balance is charged off at 180 days.
We consider a loan to be impaired when it is probable that we will be unable to collect all amounts due according to the contractual terms of the loan agreement. Once we determine a loan to be impaired, we measure the impairment based on the present value of the expected future cash flows discounted at the loan's effective interest rate. We may also measure impairment based on observable market prices, or for loans that are solely dependent on the collateral for repayment, the estimated fair value of the collateral less estimated costs to sell. If the recorded investment in impaired loans exceeds this amount, we establish a specific allowance as a component of the allowance for loan losses or by adjusting an existing valuation allowance for the impaired loan.
Allowance for Loan Losses
We establish an allowance for loan losses to account for estimated credit losses inherent in our loan portfolio, including our secured credit cards. For each portfolio of loans, our estimate of inherent losses is separately calculated on an aggregate basis for groups of loans and are considered to have similar credit characteristics and risk of loss. We analyze historical loss rates for these groups to determine a loss rate for each group of loans. We then adjust the rates for qualitative factors which in our judgment affect the expected inherent losses. Qualitative considerations include, but are not limited to, prevailing economic or market conditions, changes in the loan grading and underwriting process, changes in the estimated value of the underlying collateral for collateral dependent loans, delinquency and nonaccrual status, problem loan trends, and geographic concentrations. We separately establish specific allowances for impaired loans based on the present value of changes in cash flows expected to be collected, or for impaired loans that are considered collateral dependent, the estimated fair value of the collateral.
Property and Equipment
We carry our property and equipment at cost less accumulated depreciation and amortization. We generally compute depreciation on property and equipment using the straight-line method over the estimated useful lives of the assets, except for land, which is not depreciated. We generally compute amortization on tenant improvements using the straight-line method over the shorter of the related lease term or estimated useful lives of the improvements. We expense expenditures for maintenance and repairs as incurred.
We capitalize certain internal and external costs incurred to develop internal-use software during the application development stage. We also capitalize the cost of specified upgrades and enhancements to internal-use software that result in additional functionality. Once a development project is substantially complete and the software is ready for its intended use, we begin depreciating these costs on a straight-line basis over the internal-use software’s estimated useful life.
The estimated useful lives of the respective classes of assets are as follows:
Land | N/A |
Building | 30 years |
Computer equipment, furniture and office equipment | 3-10 years |
Computer software purchased | 3 years |
Capitalized internal-use software | 3-7 years |
Tenant improvements | Shorter of the useful life or the lease term |
64
Note 2—Summary of Significant Accounting Policies (continued)
Impairment of Long-Lived Assets
Goodwill and Intangible Assets
Goodwill is the purchase premium after adjusting for the fair value of net assets acquired. Goodwill is not amortized but is reviewed for potential impairment on an annual basis, or when events or circumstances indicate a potential impairment, at the reporting unit level. A reporting unit, as defined under applicable accounting guidance, is an operating segment or one level below an operating segment, referred to as a component. We may in any given period bypass the qualitative assessment and proceed directly to a two-step method to assess and measure impairment of the reporting unit's goodwill. We first assess qualitative factors to determine whether it is more likely-than-not (i.e., a likelihood of more than 50 percent) that the fair value of a reporting unit is less than its carrying value. This step serves as the basis for determining whether it is necessary to perform the two-step quantitative impairment test. The first step of the quantitative impairment test involves a comparison of the estimated fair value of each reporting unit to its carrying amount, including goodwill. If the estimated fair value of the reporting unit exceeds its carrying amount, goodwill of the reporting unit is not impaired; however, if the carrying amount of the reporting unit exceeds its estimated fair value, then the second step of the quantitative impairment test must be performed. The second step compares the implied fair value of the reporting unit’s goodwill with its carrying amount to measure the amount of impairment loss, if any.
The implied fair value of goodwill is determined in the same manner as the amount of goodwill recognized in a business combination. If the carrying amount of the reporting unit’s goodwill exceeds the implied fair value of that goodwill, an impairment loss is recognized in an amount equal to that excess.
For intangible assets subject to amortization, we recognize an impairment loss if the carrying amount of the intangible asset is not recoverable and exceeds its estimated fair value. The carrying amount of the intangible asset is considered not recoverable if it exceeds the sum of the undiscounted cash flows expected to result from the use of the asset.
No impairment charges were recognized related to goodwill or intangible assets for the years ended December 31, 2019, 2018 and 2017.
Intangible assets with finite lives are amortized on a straight-line basis over their estimated useful lives, which is our best estimate of the pattern of economic benefit, based on legal, contractual, and other provisions. The estimated useful lives of the intangible assets, which consist primarily of customer relationships and trade names, range from 3 -15 years.
Amounts Due to Card Issuing Banks for Overdrawn Accounts
65
Note 2—Summary of Significant Accounting Policies (continued)
Fair Value
Under applicable accounting guidance, fair value is defined as the price that would be received to sell an asset or paid to transfer a liability. As such, fair value reflects an exit price in an orderly transaction between market participants on the measurement date.
We determine the fair values of our financial instruments based on the fair value hierarchy established under applicable accounting guidance, which requires an entity to maximize the use of observable inputs and minimize the use of unobservable inputs when measuring fair value. The following describes the three-level hierarchy:
Level 1 – Unadjusted quoted prices in active markets for identical assets or liabilities. Level 1 assets and liabilities include debt and equity securities and derivative contracts that are traded in an active exchange market, as well as certain U.S. Treasury securities that are highly liquid and are actively traded in over-the-counter markets.
Level 2 – Observable inputs other than Level 1 prices, such as quoted prices for similar assets or liabilities, quoted prices in markets that are not active, or other inputs that are observable or can be corroborated by observable market data for substantially the full term of the assets or liabilities. Level 2 assets and liabilities include fixed income securities with quoted prices that are traded less frequently than exchange-traded instruments. This category generally includes U.S. government and agency mortgage-backed fixed income securities and corporate fixed income securities.
Level 3 – Unobservable inputs that are supported by little or no market activity and that are significant to the overall fair value of the assets or liabilities. Level 3 assets and liabilities include financial instruments for which the determination of fair value requires significant management judgment or estimation. The fair value for such assets and liabilities is generally determined using pricing models, market comparables, discounted cash flow methodologies or similar techniques that incorporate the assumptions a market participant would use in pricing the asset or liability. This category generally includes certain private equity investments and certain asset-backed securities.
Revenue Recognition
Our operating revenues consist of card revenues and other fees, processing and settlement service revenues and interchange revenues. The core principle of the recent revenue standard is that these revenues will be recognized when control of the promised goods or services is transferred to our customers, in an amount that reflects the consideration we expect to be entitled to in exchange for those goods or services, as determined under a five-step process.
A description of our principal revenue generating activities is as follows:
Card Revenues and Other Fees
Card revenues and other fees consist of monthly maintenance fees, new card fees, ATM fees, and other card revenues. We earn these fees based upon the underlying terms and conditions with each of our cardholders that obligate us to stand ready to provide account services to each of our cardholders over the contract term. Agreements with our cardholders are considered daily service contracts as they are not fixed in duration. Also included in card revenues and other fees are program management service fees earned from our BaaS partners for cardholder programs we manage on their behalf.
We charge maintenance fees on a monthly basis pursuant to the terms and conditions in the applicable cardholder agreements. We recognize monthly maintenance fees ratably over each day in the monthly bill cycle in which the fee is assessed, which represents the period our cardholders receive the benefits of our services and our performance obligation is satisfied.
We charge new card fees when a consumer purchases a new card in a retail store. The new card fee provides our cardholders a material right and accordingly, we defer and recognize new card fee revenues on a straight-line basis over our average card lifetime, which is currently less than one year for our GPR cards and gift cards. For GPR cards, average card lifetime is determined based on recent historical data using the period from sale (or activation) of the card through the date of last positive balance. We reassess average card lifetime quarterly. We report the unearned portion of new card fees as a component of deferred revenue in our consolidated balance sheets. See Contract Balances discussed in Note 3 — Revenues, for further information.
66
Note 2—Summary of Significant Accounting Policies (continued)
We charge ATM fees to cardholders when they withdraw money at certain ATMs in accordance with the terms and conditions in our cardholder agreements. We recognize ATM fees when the withdrawal is made by the cardholder, which is the point in time our performance obligation is satisfied and service is performed. Since our cardholder agreements are considered daily service contracts, our performance obligations for these types of transactional based fees are satisfied on a daily basis, or as each transaction occurs.
Other revenues consist primarily of revenue associated with our gift card program, transaction-based fees and fees associated with optional products or services, which we offer our cardholders at their election. Since our performance obligations are settled daily, we recognize most of these fees at the point in time the transactions occur which is when the underlying performance obligation is satisfied. In the case of our gift card program, we record the related revenues using the redemption method.
Substantially all our fees are collected from our cardholders at the time the fees are assessed and debited from their account balance.
Program management fees from our BaaS partners are earned on a monthly basis, pursuant to the terms of each program management agreement. Our agreements are generally multi-year arrangements of varying lengths. We recognize these fees as our program management services are rendered each month.
Processing and Settlement Service Revenues
Our processing and settlement services consist of cash transfer revenues, Simply Paid disbursement revenues, and tax refund processing service revenues.
We generate cash transfer revenues when consumers purchase our cash transfer products (reload services) in a retail store. Our reload services are subject to the same terms and conditions in each of the applicable cardholder agreements as discussed above. We recognize these revenues at the point in time the reload services are completed. Similarly, we earn Simply Paid disbursement fees from our business partners as payment disbursements are made.
We earn tax refund processing service revenues when a customer of a third-party tax preparation company chooses to pay their tax preparation fee through the use of our tax refund processing services. Revenues we earn from these services are generated from our contractual relationships with the tax software transmitters. These contracts may be multi-year agreements and vary in length, however, our underlying promise obligates us to process each refund transfer on a transaction by transaction basis as elected by the taxpayer. Accordingly, we recognize tax refund processing service revenues at the point in time we satisfy our performance obligation by remitting each taxpayer’s proceeds from his or her tax return.
Interchange
We earn interchange revenues from fees remitted by the merchant’s bank, which are based on rates established by the payment networks, such as Visa and MasterCard, when account holders make purchase transactions using our card products and services. We recognize interchange revenues at the point in time the transactions occur, as our performance obligation is satisfied.
Principal vs Agent
For all our significant revenue-generating arrangements, we record revenues on a gross basis except for our tax refund processing service revenues which are recorded on a net basis.
Sales and Marketing Expenses
Sales and marketing expenses primarily consist of sales commissions, advertising and marketing expenses, and the costs of manufacturing and distributing card packages, placards, promotional materials to our retail distributors’ locations and personalized GPR cards to consumers who have activated their cards.
We pay our retail distributors, and brokers commissions based on sales of our prepaid debit cards and cash transfer products in their stores. We defer and expense commissions related to new cards sales ratably over the average card lifetime, which is currently less than one year for our GPR and gift cards. Absent a new card fee, we recognize the cost of the related commissions immediately. We recognize the cost of commissions related to cash transfer products when the cash transfer transactions are completed. We recognize costs for the production of advertising as incurred. The cost of media advertising is recorded when the advertising first takes place. We record the costs associated with
67
Note 2—Summary of Significant Accounting Policies (continued)
card packages and placards as prepaid expenses, and we record the costs associated with personalized GPR cards as deferred expenses. We recognize the prepaid cost of card packages and placards over the related sales period, and we amortize the deferred cost of personalized GPR cards, when activated, over the average card lifetime.
Included in sales and marketing expenses are advertising and marketing expenses of $51.1 million, $23.2 million and $25.1 million and shipping and handling costs of $1.5 million, $2.0 million and $3.0 million for the years ended December 31, 2019, 2018 and 2017, respectively. Also included in sales and marketing expenses are use taxes to various states related to purchases of materials since we do not charge sales tax to customers when new cards or cash transfer transactions are purchased.
Employee Stock-Based Compensation
We record employee stock-based compensation expense based on the grant-date fair value of the award. For stock options and stock purchases under our employee stock purchase plan, or ESPP, we base compensation expense on fair values estimated at the grant date using the Black-Scholes option-pricing model. For stock awards, including restricted stock units, we base compensation expense on the fair value of our common stock at the grant date. We recognize compensation expense for awards with only service conditions that have graded vesting schedules on a straight-line basis over the vesting period of the award. Vesting is based upon continued service to our company and we account for any forfeitures as they occur.
We have issued performance based and market based restricted stock units to our executive officers and employees. For performance-based awards, we recognize compensation cost for the restricted stock units if and when we conclude it is probable that the performance metrics will be satisfied, over the requisite service period based on the grant-date fair value of the stock. We reassess the probability of vesting at each reporting period and adjust compensation expense based on the probability assessment. For market based restricted stock units, we base compensation expense on the fair value estimated at the date of grant using a Monte Carlo simulation or similar lattice model. We recognize compensation expense over the requisite service period regardless of the market condition being satisfied, provided that the requisite service has been rendered, since the estimated grant date fair value incorporates the probability of outcomes that the market condition will be achieved.
Under our retirement policy adopted in April 2018, following a qualified retirement, any service-based requirement for unvested stock awards held by the eligible employee is eliminated. Accordingly, the related compensation expense is recognized immediately for qualifying awards granted to eligible employees, or in the case of ineligible employees who later become eligible under the retirement policy, over the period from the grant date to the date a qualifying retirement is achieved, if earlier than the standard vesting dates. Performance-based restricted stock units issued to retirement eligible employees remain subject to the stock awards’ annual performance targets and the expense will be adjusted accordingly based expected achievement.
Income Taxes
Our income tax expense is comprised of current and deferred income tax expense. Current income tax expense approximates taxes to be paid or refunded for the current period. Deferred income tax expense results from the changes in deferred tax assets and liabilities during the periods. These gross deferred tax assets and liabilities represent decreases or increases in taxes expected to be paid in the future because of future reversals of temporary differences between the basis of assets and liabilities as measured by tax laws and their basis as reported in our consolidated financial statements. We also recognize deferred tax assets for tax attributes such as net operating loss carryforwards and tax credit carryforwards. We record valuation allowances to reduce deferred tax assets to the amounts we conclude are more likely-than-not to be realized in the foreseeable future.
We recognize and measure income tax benefits based upon a two-step model: 1) a tax position must be more likely-than-not to be sustained based solely on its technical merits in order to be recognized, and 2) the benefit is measured as the largest dollar amount of that position that is more likely-than-not to be sustained upon settlement. The difference between the benefit recognized for a position and the tax benefit claimed on a tax return is referred to as an unrecognized tax benefit. We accrue income tax related interest and penalties, if applicable, within income tax expense.
68
Note 2—Summary of Significant Accounting Policies (continued)
Earnings Per Common Share
We currently have only one class of common stock outstanding. Basic EPS is calculated by dividing net income by the weighted-average common shares issued and outstanding.
Diluted EPS is calculated dividing net income by the weighted-average number of the common shares issued and outstanding for each period plus amounts representing the dilutive effect of outstanding stock options, restricted stock units (including performance based restricted stock units), and shares to be purchased under our employee stock purchase plan. We calculate dilutive potential common shares using the treasury stock method. We exclude the effects of restricted stock units and stock options from the computation of diluted EPS in periods in which the effect would be anti-dilutive. Additionally, we exclude any performance based restricted stock units for which the performance contingency has not been met as of the end of the period.
Regulatory Matters and Capital Adequacy
As a bank holding company, we are subject to comprehensive supervision and examination by the Federal Reserve Board and must comply with applicable regulations, including minimum capital and leverage requirements. If we fail to comply with any of these requirements, we may become subject to formal or informal enforcement actions, proceedings, or investigations, which could result in regulatory orders, restrictions on our business operations or requirements to take corrective actions, which may, individually or in the aggregate, affect our results of operations and restrict our ability to grow. If we fail to comply with the applicable capital and leverage requirements, or if our subsidiary bank fails to comply with its applicable capital and leverage requirements, the Federal Reserve Board may limit our or Green Dot Bank's ability to pay dividends. In addition, as a bank holding company and a financial holding company, we are generally prohibited from engaging, directly or indirectly, in any activities other than those permissible for bank holding companies and financial holding companies. This restriction might limit our ability to pursue future business opportunities which we might otherwise consider but which might fall outside the scope of permissible activities. We may also be required to serve as a “source of strength” to Green Dot Bank if it becomes less than adequately capitalized.
Recent Accounting Pronouncements
Recently issued accounting pronouncements not yet adopted
In January 2017, the FASB issued ASU No. 2017-04, Intangibles - Goodwill and Other ("ASU 2017-04"): Simplifying the Test for Goodwill Impairment, which simplifies the existing two-step guidance for goodwill impairment testing by eliminating the second step resulting in a write-down to goodwill equal to the initial amount of impairment determined in step one. The ASU is to be applied prospectively for reporting periods beginning after December 15, 2019. We adopted the new accounting pronouncement upon its effective date on January 1, 2020, the effect of which did not have any impact to our financial statements upon initial adoption.
In June 2016, the FASB issued ASU No. 2016-13, Financial Instruments – Credit Losses (Topic 326): Measurement of Credit Losses on Financial Instruments ("ASU 2016-13") that requires financial assets measured at amortized cost be presented at the net amount expected to be collected. Credit losses on available-for-sale debt securities should be recorded through an allowance for credit losses limited by the amount that the fair value is less than amortized cost. The amendments of ASU 2016-13 eliminate the probable incurred loss recognition model under current GAAP and introduces a forward-looking approach, based on expected losses, to estimate credit losses on certain types of financial instruments. The estimate of expected credit losses will require entities to incorporate considerations of historical information, current information, and reasonable and supportable forecasts. The new ASU also expands the disclosure requirements to enable users of financial statements to understand the entity’s assumptions, models, and methods for estimating expected credit losses. ASU 2016-13 is effective for fiscal years beginning after December 15, 2019, including interim periods within those fiscal years. We adopted the new accounting pronouncement upon its effective date on January 1, 2020 on a prospective basis and have substantially completed our assessment of the impact on our consolidated financial statements. While we do not expect a material quantitative effect, if any, to our consolidated financial statements upon adoption, we will provide expanded credit loss disclosures and any final quantitative impact as required beginning in the first quarter of 2020.
69
Note 2—Summary of Significant Accounting Policies (continued)
Recently adopted accounting pronouncements
In February 2016, the FASB issued ASU No. 2016-02, Leases (Topic 842) ("ASU 2016-02") in order to increase transparency and comparability among organizations by recognizing lease assets and lease liabilities on the balance sheet for those leases classified as operating leases under previous GAAP. The guidance has been modified through additional technical corrections since its original issuance, including optional transition relief as provided for under ASU No. 2018-11, Leases (Topic 842): Targeted Improvements. ASU 2016-02 requires that a lessee should recognize a liability to make lease payments and a right-of-use ("ROU") asset representing its right to use the underlying asset for leases with a term greater than 12 months.
We adopted the new lease standard effective January 1, 2019, electing the optional transition method that permits the new standard to be applied prospectively, as of the effective date, without restating comparative periods presented. As a result, prior periods continue to be reported in accordance with our historical lease accounting policies. We elected the package of practical expedients under the new standard, which allows us to not reassess 1) whether any expired or existing contracts as of the adoption date are or contain a lease, 2) lease classification for any expired or existing leases as of the adoption date and 3) initial direct costs for any existing leases as of the adoption date. We did not elect to use the hindsight practical expedient under the new standard when determining the lease term and assessing any impairment of ROU assets.
The adoption of ASU 2016-02 resulted in the recognition of operating ROU assets of approximately $17.9 million on our consolidated balance sheet and a corresponding lease liability of approximately $25.1 million. The difference between the lease assets and liabilities recognized on our consolidated balance sheets primarily relates to accrued rent on existing leases that were offset against the ROU assets upon adoption. The adoption of the standard did not have any impact on our consolidated statements of operations, comprehensive income, changes in stockholders’ equity and cash flows. See Note 19 — Leases, for discussion on updates to our lease accounting policies and additional disclosures.
In August 2018, the FASB issued ASU No. 2018-15, Customer’s Accounting for Implementation Costs Incurred in a Cloud Computing Arrangement That Is a Service Contract ("ASU 2018-15"), which amends ASC 350-40 to address implementation costs incurred in a cloud computing arrangement (CCA) that is a service contract. ASU 2018-15 aligns the accounting for costs incurred to implement a CCA that is a service arrangement with the guidance on capitalizing costs associated with developing or obtaining internal-use software. As a result, certain implementation costs incurred by companies under hosting arrangements will be deferred and amortized. We adopted the standard effective January 1, 2019 on a prospective basis, the effect of which did not have a material impact on our consolidated financial statements.
Note 3—Revenues
Adoption of ASC 606
On January 1, 2018, we adopted ASC 606 using the modified retrospective method applied to contracts which were not completed upon adoption, the impact of which did not result in any cumulative adjustment to our retained earnings. Results for reporting periods beginning after January 1, 2018 are presented under ASC 606, while prior period amounts have not been adjusted and continue to be reported in accordance with our historical accounting policies.
The impact of our adoption of ASC 606 was limited to a change in presentation of certain incentive agreements. Prior to the adoption of ASC 606, incentive payments with our retail distributors and other partners had generally been recorded as a reduction to revenues over the related period of benefit the incentive payment related. Upon the adoption of ASC 606, such payments are classified as sales and marketing expenses since these contractual arrangements have been determined to be outside the scope of contracts with our customers under the new accounting standard.
70
Note 3—Revenues (continued)
The total amount of incentive payments recognized was $6.4 million, $7.1 million and $4.8 million for the years ended December 31, 2019, 2018, and 2017, respectively.
Disaggregation of Revenues
Our products and services are offered only to customers within the United States. We determine our operating segments based on how our chief operating decision maker manages our operations, makes operating decisions and evaluates operating performance. Within our segments, we believe that the nature, amount, timing and uncertainty of our revenue and cash flows and how they are affected by economic factors can be further illustrated based on the timing in which revenue for each of our products and services is recognized.
The following table disaggregates our revenues by the timing in which the revenue is recognized:
Year Ended December 31, 2019 | Year Ended December 31, 2018 | ||||||||||||||
Account Services | Processing and Settlement Services | Account Services | Processing and Settlement Services | ||||||||||||
Timing of revenue recognition | (In thousands) | ||||||||||||||
Transferred at a point in time | $ | $ | $ | $ | |||||||||||
Transferred over time | |||||||||||||||
Operating revenues (1) | $ | $ | $ | $ | |||||||||||
(1) | Excludes net interest income, a component of total operating revenues, as it remains outside the scope of ASC 606, Revenues |
Within our Account Services segment, revenues recognized at a point in time are comprised of ATM fees, interchange, and other similar transaction-based fees. Revenues recognized over time consists of new card fees, monthly maintenance fees, revenue earned from gift cards and substantially all BaaS partner program management fees. Substantially all of our processing and settlement services are recognized at a point in time.
Refer to Note 24 — Segment Information for our revenues disaggregated by our products and services and the components to our total operating revenues on our consolidated statements of operations for additional information.
Significant Judgments and Estimates
Transaction prices related to our account cardholder services are based on stand-alone fees stated within the terms and conditions and may also include certain elements of variable consideration depending upon the product’s features, such as cardholder incentives, cash-back rewards, monthly fee concessions and reserves on accounts that may become overdrawn. We estimate such amounts using historical data and customer behavior patterns to determine these estimates which are recorded as a reduction to the corresponding fee revenue. Additionally, while the number of transactions that a cardholder may perform is unknown, any uncertainty is resolved at the end of each daily service contract.
Contract Balances
As disclosed on our consolidated balance sheets, we record deferred revenue for any upfront payments received in advance of our performance obligations being satisfied. These contract liabilities consist principally of unearned new card fees and monthly maintenance fees. We recognized approximately $31.8 million and $28.7 million for the years ended December 31, 2019 and 2018, or substantially all of the amount of contract liabilities included in deferred revenue at the beginning of the respective periods and did not recognize any revenue during these periods from performance obligations satisfied in previous periods. Changes in the deferred revenue balance are driven primarily by the amount of new card fees recognized during the period, and the degree to which these reductions to the deferred revenue balance are offset by the deferral of new card fees associated with cards sold during the period.
Costs to Obtain or Fulfill a Contract
Our incremental direct costs of obtaining a contract consist primarily of revenue share payments we make to our retail partners associated with new card sales. These commissions are generally capitalized upon payment and expensed over the period the corresponding revenue is recognized. These deferred commissions are not material and are included in deferred expenses on our consolidated balance sheets.
71
Note 3—Revenues (continued)
Practical Expedients and Exemptions
Any unsatisfied performance obligations at the end of the period relate to contracts with customers that either have an original expected length of one year or less or are contracts for which we recognize revenue at the amount to which we have the right to invoice for services performed. Therefore, no additional disclosure is provided for these performance obligations.
Note 4—Investment Securities
Our available-for-sale investment securities were as follows:
Amortized cost | Gross unrealized gains | Gross unrealized losses | Fair value | ||||||||||||
(In thousands) | |||||||||||||||
December 31, 2019 | |||||||||||||||
Corporate bonds | $ | $ | $ | $ | |||||||||||
Agency bond securities | |||||||||||||||
Agency mortgage-backed securities | ( | ) | |||||||||||||
Municipal bonds | ( | ) | |||||||||||||
Asset-backed securities | |||||||||||||||
Total investment securities | $ | $ | $ | ( | ) | $ | |||||||||
December 31, 2018 | |||||||||||||||
Negotiable certificate of deposit | $ | $ | $ | $ | |||||||||||
Agency bond securities | ( | ) | |||||||||||||
Agency mortgage-backed securities | ( | ) | |||||||||||||
Municipal bonds | ( | ) | |||||||||||||
Asset-backed securities | ( | ) | |||||||||||||
Total investment securities | $ | $ | $ | ( | ) | $ | |||||||||
As of December 31, 2019 and 2018, the gross unrealized losses and fair values of available-for-sale investment securities that were in unrealized loss positions were as follows:
Less than 12 months | 12 months or more | Total fair value | Total unrealized loss | ||||||||||||||||||||
Fair value | Unrealized loss | Fair value | Unrealized loss | ||||||||||||||||||||
(In thousands) | |||||||||||||||||||||||
December 31, 2019 | |||||||||||||||||||||||
Agency mortgage-backed securities | $ | $ | ( | ) | $ | $ | ( | ) | $ | $ | ( | ) | |||||||||||
Municipal bonds | ( | ) | ( | ) | |||||||||||||||||||
Total investment securities | $ | $ | ( | ) | $ | $ | ( | ) | $ | $ | ( | ) | |||||||||||
December 31, 2018 | |||||||||||||||||||||||
Agency bond securities | $ | $ | ( | ) | $ | $ | $ | $ | ( | ) | |||||||||||||
Agency mortgage-backed securities | ( | ) | ( | ) | ( | ) | |||||||||||||||||
Municipal bonds | ( | ) | ( | ) | ( | ) | |||||||||||||||||
Asset-backed securities | ( | ) | ( | ) | ( | ) | |||||||||||||||||
Total investment securities | $ | $ | ( | ) | $ | $ | ( | ) | $ | $ | ( | ) | |||||||||||
We did not record any other-than-temporary impairment losses during the years ended December 31, 2019 and 2018 on our available-for-sale investment securities. We do not intend to sell these investments and we have determined that it is more likely than not that we will not be required to sell these investments before recovery of their amortized cost bases, which may be at maturity.
72
Note 4—Investment Securities (continued)
As of December 31, 2019, the contractual maturities of our available-for-sale investment securities were as follows:
Amortized cost | Fair value | ||||||
(In thousands) | |||||||
Due in one year or less | $ | $ | |||||
Due after one year through five years | |||||||
Due after five years through ten years | |||||||
Due after ten years | |||||||
Mortgage and asset-backed securities | |||||||
Total investment securities | $ | $ | |||||
The expected payments on mortgage-backed and asset-backed securities may not coincide with their contractual maturities because the issuers have the right to call or prepay certain obligations.
Note 5—Accounts Receivable
Accounts receivable, net consisted of the following:
December 31, 2019 | December 31, 2018 | ||||||
(In thousands) | |||||||
Overdrawn account balances due from cardholders | $ | $ | |||||
Reserve for uncollectible overdrawn accounts | ( | ) | ( | ) | |||
Net overdrawn account balances due from cardholders | |||||||
Trade receivables | |||||||
Reserve for uncollectible trade receivables | ( | ) | ( | ) | |||
Net trade receivables | |||||||
Receivables due from card issuing banks | |||||||
Fee advances | |||||||
Other receivables | |||||||
Accounts receivable, net | $ | $ | |||||
Activity in the reserve for uncollectible overdrawn accounts consisted of the following:
Year Ended December 31, | |||||||||||
2019 | 2018 | 2017 | |||||||||
(In thousands) | |||||||||||
Balance, beginning of period | $ | $ | $ | ||||||||
Provision for uncollectible overdrawn accounts: | |||||||||||
Fees | |||||||||||
Purchase transactions | |||||||||||
Charge-offs | ( | ) | ( | ) | ( | ) | |||||
Balance, end of period | $ | $ | $ | ||||||||
73
Note 6—Loans to Bank Customers
The following table presents total outstanding loans, gross of the related allowance for loan losses, and a summary of the related payment status:
30-59 Days Past Due | 60-89 Days Past Due | 90 Days or More Past Due | Total Past Due | Total Current or Less Than 30 Days Past Due | Total Outstanding | ||||||||||||||||||
(In thousands) | |||||||||||||||||||||||
December 31, 2019 | |||||||||||||||||||||||
Residential | $ | $ | $ | $ | $ | $ | |||||||||||||||||
Commercial | |||||||||||||||||||||||
Installment | |||||||||||||||||||||||
Secured credit card | |||||||||||||||||||||||
Total loans | $ | $ | $ | $ | $ | $ | |||||||||||||||||
Percentage of outstanding | % | % | % | % | % | % | |||||||||||||||||
December 31, 2018 | |||||||||||||||||||||||
Residential | $ | $ | $ | $ | $ | $ | |||||||||||||||||
Commercial | |||||||||||||||||||||||
Installment | |||||||||||||||||||||||
Secured credit card | |||||||||||||||||||||||
Total loans | $ | $ | $ | $ | $ | $ | |||||||||||||||||
Percentage of outstanding | % | % | % | % | % | % | |||||||||||||||||
Nonperforming Loans
The following table presents the carrying value, gross of the related allowance for loan losses, of our nonperforming loans. See Note 2 — Summary of Significant Accounting Policies for further information on the criteria for classification as nonperforming.
December 31, 2019 | December 31, 2018 | ||||||
(In thousands) | |||||||
Residential | $ | $ | |||||
Installment | |||||||
Secured credit card | |||||||
Total loans | $ | $ | |||||
Credit Quality Indicators
We closely monitor and assess the credit quality and credit risk of our loan portfolio on an ongoing basis. We continuously review and update loan risk classifications. We evaluate our loans using non-classified or classified as the primary credit quality indicator. Classified loans are those loans that have demonstrated credit weakness where we believe there is a heightened risk of principal loss, including all impaired loans. Classified loans are generally internally categorized as substandard, doubtful, or loss, consistent with regulatory guidelines.
The table below presents the carrying value, gross of the related allowance for loan losses, of our loans within the primary credit quality indicators related to our loan portfolio:
December 31, 2019 | December 31, 2018 | ||||||||||||||
Non-Classified | Classified | Non-Classified | Classified | ||||||||||||
(In thousands) | |||||||||||||||
Residential | $ | $ | $ | $ | |||||||||||
Commercial | |||||||||||||||
Installment | |||||||||||||||
Secured credit card | |||||||||||||||
Total loans | $ | $ | $ | $ | |||||||||||
74
Note 6—Loans to Bank Customers (continued)
Impaired Loans and Troubled Debt Restructurings
When, for economic or legal reasons related to a borrower’s financial difficulties, we grant a concession for other than an insignificant period of time to a borrower that we would not otherwise consider, the related loan is classified as a Troubled Debt Restructuring, or TDR. Our TDR modifications related to extensions of the maturity dates at a stated interest rate lower than the current market rate for new debt with similar risk. The following table presents our impaired loans and loans that we modified as TDRs as of December 31, 2019 and 2018:
December 31, 2019 | December 31, 2018 | ||||||||||||||
Unpaid Principal Balance | Carrying Value | Unpaid Principal Balance | Carrying Value | ||||||||||||
(In thousands) | |||||||||||||||
Residential | $ | $ | $ | $ | |||||||||||
Installment | |||||||||||||||
Allowance for Loan Losses
Activity in the allowance for loan losses consisted of the following:
Year Ended December 31, | |||||||||||
2019 | 2018 | 2017 | |||||||||
(In thousands) | |||||||||||
Balance, beginning of period | $ | $ | $ | ||||||||
Provision for loans | |||||||||||
Loans charged off | ( | ) | ( | ) | ( | ) | |||||
Recoveries of loans previously charged off | |||||||||||
Balance, end of period | $ | $ | $ | ||||||||
Note 7—Property and Equipment
Property and equipment consisted of the following:
December 31, | |||||||
2019 | 2018 | ||||||
(In thousands) | |||||||
Land | $ | $ | |||||
Building | |||||||
Computer equipment, furniture, and office equipment | |||||||
Computer software purchased | |||||||
Capitalized internal-use software | |||||||
Tenant improvements | |||||||
Less accumulated depreciation and amortization | ( | ) | ( | ) | |||
Property and equipment, net | $ | $ | |||||
Depreciation and amortization expense was $49.5 million, $38.6 million and $33.5 million for the years ended December 31, 2019, 2018 and 2017, respectively. Included in those amounts are depreciation expense related to internal-use software of $35.1 million, $25.5 million and $20.0 million for the years ended December 31, 2019, 2018 and 2017, respectively.
We recorded impairment charges of $0.6 million, $0.9 million and $1.3 million for the years ended December 31, 2019, 2018 and 2017, respectively, associated with capitalized internal-use software we determined to no longer be utilized and any remaining carrying value was written off. The net carrying value of capitalized internal-use software was $119.9 million and $93.8 million at December 31, 2019 and 2018, respectively.
75
Note 8—Goodwill and Intangible Assets
Goodwill and intangible assets on our consolidated balance sheets consisted of the following:
December 31, | |||||||
2019 | 2018 | ||||||
(In thousands) | |||||||
Goodwill | $ | $ | |||||
Intangible assets, net | |||||||
Goodwill and intangible assets | $ | $ | |||||
Goodwill
Intangible Assets
The gross carrying amounts and accumulated amortization related to intangibles assets were as follows:
December 31, 2019 | December 31, 2018 | ||||||||||||||||||||||||
Gross Carrying Value | Accumulated Amortization | Net Book Value | Gross Carrying Value | Accumulated Amortization | Net Book Value | Weighted Average Useful Lives | |||||||||||||||||||
(In thousands) | (In thousands) | (Years) | |||||||||||||||||||||||
Customer relationships | $ | $ | ( | ) | $ | $ | $ | ( | ) | $ | |||||||||||||||
Trade names | ( | ) | ( | ) | |||||||||||||||||||||
Patents | ( | ) | ( | ) | |||||||||||||||||||||
Software licenses | ( | ) | |||||||||||||||||||||||
Other | ( | ) | ( | ) | |||||||||||||||||||||
Total intangible assets | $ | $ | ( | ) | $ | $ | $ | ( | ) | $ | |||||||||||||||
Amortization expense on finite-lived intangibles, a component of other general and administrative expenses, was $32.6 million, $32.8 million, and $31.1 million for the years ended December 31, 2019, 2018, and 2017, respectively. None of our intangible assets were considered impaired as of December 31, 2019 or 2018.
The following table shows our estimated amortization expense for intangible assets for each of the next five succeeding years and thereafter:
December 31, | |||
(In thousands) | |||
2020 | $ | ||
2021 | |||
2022 | |||
2023 | |||
2024 | |||
Thereafter | |||
Total | $ | ||
76
Note 9—Deposits
Deposits are categorized as non-interest or interest-bearing deposits as follows:
December 31, | |||||||
2019 | 2018 | ||||||
Non-interest bearing deposit accounts | (In thousands) | ||||||
Account programs | $ | $ | |||||
Other demand deposits | |||||||
Total non-interest bearing deposit accounts | |||||||
Interest-bearing deposit accounts | |||||||
Checking accounts | |||||||
Savings | |||||||
Secured card deposits | |||||||
Time deposits, denominations greater than or equal to $100 | |||||||
Time deposits, denominations less than $100 | |||||||
Total interest-bearing deposit accounts | |||||||
Total deposits | $ | $ | |||||
The scheduled contractual maturities for total time deposits are presented in the table below:
December 31, | |||
(In thousands) | |||
Due in 2020 | $ | ||
Due in 2021 | |||
Due in 2022 | |||
Due in 2023 | |||
Due in 2024 | |||
Total time deposits | $ | ||
As of December 31, 2019, we had aggregate time deposits of $2.3 million in denominations that met or exceeded the Federal Deposit Insurance Corporation (FDIC) insurance limit.
Note 10—Debt
As of December 31, 2019 and 2018, our outstanding debt consisted of the following:
December 31, 2019 | December 31, 2018 | ||||||
(In thousands) | |||||||
Term facility | $ | $ | |||||
Revolving facility | |||||||
Total debt outstanding | $ | $ | |||||
2019 Revolving Facility
In October 2019, we entered into a secured credit agreement with Wells Fargo Bank, National Association, and other lenders party thereto. The new credit facility provides for a $100.0 million five-year revolving line of credit (the "2019 Revolving Facility"), maturing in October 2024. We use the proceeds of any borrowings under the revolving facility for working capital and other general corporate purposes, subject to the terms and conditions set forth in the credit agreement. We may make voluntary repayments at any time or from time to time until maturity. Borrowings available under the 2019 Revolving Facility as of December 31, 2019 amounted to $65.0 million.
77
Note 10—Debt (continued)
At our election, loans made under the credit agreement bear interest at 1) a LIBOR rate (the “LIBOR Rate") or 2) a base rate determined by reference to the highest of (a) the United States federal funds rate plus .50 %, (a) the Wells Fargo prime rate and (c) a daily rate equal to one-month LIBOR rate plus 1.0 % (the “Base Rate"), plus in either case an applicable margin. The margin is dependent upon on our total leverage ratio and varies from 1.25 % to 2.00 % for LIBOR Rate loans and .25 % to 1.00 % for Base Rate loans. The interest rate on our outstanding balance as of December 31, 2019 was 3.05 %.
We also pay a commitment fee, which varies from .20 % to .35 % per annum on the actual daily unused portions of the 2019 Revolving Facility. Letter of credit fees are payable in respect of outstanding letters of credit at a rate per annum equal to the applicable margin for LIBOR Rate loans.
The 2019 Revolving Facility contains customary representations and warranties relating to us and our subsidiaries. The facility also contains certain affirmative and negative covenants including negative covenants that limit or restrict, among other things, liens, indebtedness, investments and acquisitions, mergers and fundamental changes, asset sales, restricted payments, changes in the nature of the business, transactions with affiliates and other matters customarily restricted in such agreements. We must also maintain a minimum fixed charge coverage ratio and a maximum consolidated leverage ratio at the end of each fiscal quarter, as set forth in the credit agreement. At December 31, 2019, we were in compliance with all such covenants.
If an event of default shall occur and be continuing under the facility, the commitments may be terminated and the principal amounts outstanding under the 2019 Revolving Facility, together with all accrued unpaid interest and other amounts owing in respect thereof, may be declared immediately due and payable.
Senior Credit Facility
In October 2014, we entered into a $225.0 million credit agreement with Bank of America, N.A., as an administrative agent, Wells Fargo Bank, National Association, and the other lenders party thereto. The credit agreement provided for 1) a $75.0 million five-year revolving facility (the "Revolving Facility") and 2) a five-year $150.0 million term loan facility ("Term Facility" and, together with the Revolving Facility, the "Senior Credit Facility").
Quarterly principal payments of $5.6 million were payable under the Term Facility, with any remaining balance outstanding due upon maturity on October 23, 2019. In March 2019, we elected to make a voluntary prepayment of $60.0 million to retire the Term Facility without penalty or additional premium. The Revolving Facility remained available for use until the Senior Credit Facility matured in October 2019, at which point we entered into the 2019 Revolving Facility discussed above.
Cash interest expense related to our debt was $0.6 million, $3.5 million, and $4.1 million for the years ended December 31, 2019, 2018 and 2017, respectively.
Note 11—Stockholders’ Equity
Common Stock
Our Certificate of Incorporation specifies the following rights, preferences, and privileges for our common stockholders.
Voting
Holders of our Class A common stock are entitled to one vote per share.
We have not provided for cumulative voting for the election of directors in our restated Certificate of Incorporation. In addition, our Certificate of Incorporation provides that a holder, or group of affiliated holders, of more than 24.9 % of our common stock may not vote shares representing more than 14.9 % of the voting power represented by the outstanding shares of our Class A common stock.
Dividends
Subject to preferences that may apply to any shares of preferred stock outstanding at the time, the holders of outstanding shares of our Class A common stock are entitled to receive dividends out of funds legally available at the times and in the amounts that our board of directors may determine. In the event a dividend is paid in the form of shares of common stock or rights to acquire shares of common stock, the holders of Class A common stock will receive Class A common stock, or rights to acquire Class A common stock, as the case may be.
78
Note 11—Stockholders’ Equity (continued)
Liquidation
Upon our liquidation, dissolution or winding-up, the assets legally available for distribution to our stockholders would be distributable ratably among the holders of our Class A common stock and any participating preferred stock outstanding at that time after payment of liquidation preferences, if any, on any outstanding shares of our preferred stock and payment of other claims of creditors.
Preemptive or Similar Rights
Our Class A common stock is not entitled to preemptive rights or subject to redemption.
Comprehensive Income
The tax impact on unrealized losses on investment securities available-for-sale for the years ended December 31, 2019, 2018 and 2017 was approximately $0.8 million, $0.1 million and $0.1 million, respectively.
Stock Repurchase Program
In June 2015, our Board of Directors authorized, subject to regulatory approval, a repurchase of shares of our Class A Common Stock in an amount up to $150 million under a stock repurchase program ("Repurchase Program") with no expiration date. We completed our repurchase of all Class A Common Stock under the initial authorization in 2017. In May 2017, our Board of Directors authorized, subject to regulatory approval, expansion of our stock Repurchase Program by an additional $150 million. We sought and received regulatory approval during the second quarter of 2019, at which point we entered into an accelerated share repurchase agreement, as further discussed below. As of December 31, 2019, we have an authorized $50 million remaining under our current stock repurchase program for any additional repurchases.
Accelerated Share Repurchases
We have entered into accelerated share repurchase arrangements (“ASRs”) with a financial institution from time to time under the Repurchase Program. The following table summarizes our ASR activity for the years presented in these consolidated financial statements:
Purchase Period End Date | Number of Shares (In thousands) | Average repurchase price per share | ASR Amount (In thousands) | |||||||||||
May 2019 ASR | August 2019 | $ | $ | |||||||||||
March 2017 ASR | November 2017 | $ | $ | (1) | ||||||||||
(1) | We elected to cash settle approximately $2.0 million worth of shares owed back to the counterparty under our March 2017 accelerated share repurchase agreement. |
In exchange for an up-front payment, the financial institution delivers shares of our Class A Common Stock during the purchase periods of each ASR. Upon settlement, we either receive additional shares from the financial institution or we may be required to deliver additional shares or cash to the financial institution, at our election. The final number of shares received upon settlement for the ASR is determined based on the volume-weighted average price of our common stock over the term of the agreement less an agreed upon discount and subject to adjustments pursuant to the terms and conditions of the ASR.
79
Note 12—Employee Stock-Based Compensation
In June 2010, our board of directors adopted, and in July 2010 our stockholders approved, the 2010 Equity Incentive Plan, which replaced our 2001 Stock Plan, and the 2010 Employee Stock Purchase Plan. The 2010 Equity Incentive Plan authorizes the award of stock options, restricted stock awards, stock appreciation rights, restricted stock units, performance shares and stock bonuses. Options granted under the 2010 Equity Incentive Plan generally vest over four years and expire five years or ten years from the date of grant. The 2010 Employee Stock Purchase Plan enables eligible employees to purchase shares of our Class A common stock periodically at a discount. Our 2010 Employee Stock Purchase Plan is intended to qualify as an employee stock purchase plan under Section 423 of the Internal Revenue Code. Approximately 2.1 million shares are available for grant under the 2010 Equity Incentive Plan as of December 31, 2019.
Stock-based compensation for the years ended December 31, 2019, 2018, and 2017 includes expense related to awards of stock options, performance and service based restricted stock units and purchases under the 2010 Employee Stock Purchase Plan. Total stock-based compensation expense and the related income tax benefit were as follows:
Year Ended December 31, | |||||||||||
2019 | 2018 | 2017 | |||||||||
(In thousands) | |||||||||||
Total stock-based compensation expense | $ | $ | $ | ||||||||
Related income tax benefit | |||||||||||
Restricted Stock Units
The following table summarizes restricted stock units with only service conditions granted under our 2010 Equity Incentive Plan:
Year Ended December 31, | |||||||||||
2019 | 2018 | 2017 | |||||||||
(In thousands, except per share data) | |||||||||||
Restricted stock units granted | |||||||||||
Weighted-average grant-date fair value | $ | $ | $ | ||||||||
Restricted stock unit activity for the year ended December 31, 2019 was as follows:
Shares | Weighted-Average Grant-Date Fair Value | |||||
(In thousands, except per share data) | ||||||
Outstanding at December 31, 2018 | $ | |||||
Restricted stock units granted | ||||||
Restricted stock units vested | ( | ) | ||||
Restricted stock units canceled | ( | ) | ||||
Outstanding at December 31, 2019 | $ | |||||
The total fair value of restricted stock vested for the years ended December 31, 2019, 2018 and 2017 was $30.9 million, $67.5 million and $41.5 million, respectively, based on the price of our Class A common stock on the vesting date.
Performance Based Restricted Stock Units
We grant performance-based restricted stock units to certain employees which are subject to the attainment of pre-established annual performance targets for, among other things, non-GAAP earnings per share for the grant year. The actual number of shares subject to the award is determined at the end of the annual performance period and may range from zero to 150 % of the target shares granted. These awards contain an additional service component after each annual performance period is concluded and the unvested balance of the shares determined at the end of the annual performance period will vest over the remaining requisite service period. Compensation expense related to these awards is recognized using the accelerated attribution method over the vesting period (generally, a period of four years) based on the fair value of the closing market price of our Class A common stock on the date of the grant
80
Note 12—Employee Stock-Based Compensation (continued)
and the estimated performance that is expected to be achieved. In the case of our former Chief Executive Officer, vesting of his awards was based on our achievement of total shareholder return ("TSR") relative to the S&P 600 index over a three-year performance period, with awards eligible for a maximum payout up to 150 % of the target shares for awards granted prior to 2019 or 200 % of the target shares for awards granted in 2019, respectively. Compensation expense related to these awards is recognized over the performance period based on the grant date fair value through the use of a Monte Carlo simulation and are not subsequently re-measured. Any unvested awards of our former Chief Executive Officer were forfeited as of December 31, 2019 as a result of his retirement.
The following table summarizes the performance-based restricted stock units granted under our 2010 Equity Incentive Plan:
Year Ended December 31, | |||||||||||
2019 | 2018 | 2017 | |||||||||
(In thousands, except per share data) | |||||||||||
Performance based restricted stock units granted | |||||||||||
Weighted-average grant-date fair value | $ | $ | $ | ||||||||
Performance based restricted stock unit activity for the year ended December 31, 2019 was as follows:
Shares | Weighted-Average Grant-Date Fair Value | |||||
(In thousands, except per share data) | ||||||
Outstanding at December 31, 2018 | $ | |||||
Performance restricted stock units granted (at target) | $ | |||||
Performance restricted stock units vested | ( | ) | $ | |||
Performance restricted stock units canceled | ( | ) | $ | |||
Actual adjustment for certified performance periods | $ | |||||
Outstanding at December 31, 2019 | $ | |||||
In June 2019, we modified the performance targets for certain performance-based restricted stock units issued at the beginning of 2019. The modification for these awards was classified as improbable to probable, and resulted in a lower grant date fair value at the time of modification compared to the original grant date and an overall decrease in stock-based compensation expense recognized for the year ended December 31, 2019 compared to the prior year period. Stock-based compensation for these modified awards, as well as other performance-based restricted stock units issued during the year, have further been adjusted to reflect our estimated achievement under the modified targets.
The total fair value of performance based restricted stock vested for the years ended December 31, 2019, 2018 and 2017 was $22.7 million, $45.1 million and $4.4 million, respectively, based on the price of our Class A common stock on the vesting date.
Stock Options
Stock option activity for the year ended December 31, 2019 was as follows:
Options | Weighted-Average Exercise Price | Weighted-Average Remaining Contractual Life (in Years) | Aggregate Intrinsic Value | |||||||||
(In thousands, except per share data and years) | ||||||||||||
Outstanding at December 31, 2018 | $ | |||||||||||
Options exercised | ( | ) | ||||||||||
Outstanding at December 31, 2019 | $ | $ | ||||||||||
Exercisable at December 31, 2019 | $ | |||||||||||
81
Note 12—Employee Stock-Based Compensation (continued)
The total intrinsic value of options exercised was $2.4 million, $36.2 million and $24.1 million for the years ended December 31, 2019, 2018, and 2017, respectively.
We have not issued any new stock option awards from our equity plan for the periods presented in these consolidated financial statements. Accordingly, any additional required disclosures with respect to fair value assumptions of our stock options have been omitted.
Note 13—Income Taxes
The components of income tax expense included in our consolidated statements of operations were as follows:
Year Ended December 31, | |||||||||||
2019 | 2018 | 2017 | |||||||||
(In thousands) | |||||||||||
Current: | |||||||||||
Federal | $ | $ | $ | ||||||||
State | ( | ) | |||||||||
Foreign | |||||||||||
Current income tax expense | |||||||||||
Deferred: | |||||||||||
Federal | |||||||||||
State | ( | ) | ( | ) | ( | ) | |||||
Deferred income tax expense (benefit) | ( | ) | |||||||||
Income tax expense | $ | $ | $ | ||||||||
Income tax expense differs from the amount computed by applying the statutory federal income tax rate to income before income taxes. The sources and tax effects of the differences are as follows:
Year Ended December 31, | ||||||||
2019 | 2018 | 2017 | ||||||
U.S. federal statutory tax rate | % | % | % | |||||
State income taxes, net of federal tax benefit | ( | ) | ( | ) | ||||
General business credits | ( | ) | ( | ) | ( | ) | ||
Employee stock-based compensation | ( | ) | ( | ) | ( | ) | ||
Tax Cuts and Jobs Act remeasurement | ( | ) | ||||||
IRC 162(m) limitation | ||||||||
Other | ||||||||
Effective tax rate | % | % | % | |||||
Due to the passage of the Tax Cuts and Jobs Act in 2017, we are now subject to an additional tax on the 'Global Intangible Low-Taxed Income' (GILTI) earned by our foreign subsidiary. Under FASB Staff Q&A, Topic 740, No. 5, Accounting for Global Intangible Low-Taxed Income, an entity can make an accounting policy election to either recognize deferred taxes for temporary basis differences expected to reverse as GILTI in future years or provide for the tax expense related to GILTI in the year the tax is incurred. We have made a policy election to account for GILTI in the year the tax is incurred. For the year ended December 31, 2019, the provision for GILTI expense was not material to our financial statements.
82
Note 13—Income Taxes (continued)
The increase in the effective tax rate for the year ended December 31, 2019 as compared to the year ended December 31, 2018 is primarily due to the decrease in benefit on the recognition of excess tax benefits from stock-based compensation and additional expenses related to state taxes, net of federal benefits.
The tax effects of temporary difference that give rise to significant portions of our deferred tax assets and liabilities were as follows:
December 31, | |||||||
2019 | 2018 | ||||||
(In thousands) | |||||||
Deferred tax assets: | |||||||
Net operating loss carryforwards | $ | $ | |||||
Stock-based compensation | |||||||
Reserve for overdrawn accounts | |||||||
Accrued liabilities | |||||||
Lease liabilities | — | ||||||
Tax credit carryforwards | |||||||
Capital loss carryforwards | |||||||
Gross deferred tax assets | |||||||
Valuation allowance | ( | ) | |||||
Total deferred tax assets | $ | $ | |||||
Deferred tax liabilities: | |||||||
Internal-use software costs | $ | $ | |||||
Property and equipment, net | |||||||
Deferred expenses | |||||||
Intangible assets | |||||||
Gift card revenue | |||||||
Lease right-of-use assets | — | ||||||
Other | |||||||
Total deferred tax liabilities | |||||||
Net deferred tax liabilities | $ | ( | ) | $ | ( | ) | |
We establish a valuation allowance when we consider it more-likely-than-not that some portion or all of the deferred tax assets will not be realized. As of December 31, 2019, we provided a valuation allowance against our capital loss carryforwards as we believe it is more-likely-than-not that the tax benefits related to the capital loss carryforwards will not be realized.
We are subject to examination by the Internal Revenue Service, or IRS, and various state tax authorities. We remain subject to examination of our federal income tax returns for the years ended December 31, 2016 through 2018. We generally remain subject to examination of our various state income tax returns for a period of four to five years from the respective dates the returns were filed.
As of December 31, 2019, we have federal net operating loss carryforwards of approximately $31.9 million, state net operating loss carryforwards of approximately $57.9 million, and capital loss carryforwards of approximately $1.5 million, which will be available to offset future income. If not used, the federal net operating losses will expire between 2021 and 2035. In regards to the state net operating loss carryforwards, approximately $31.7 million will expire between 2021 and 2039, while the remaining balance of approximately $26.2 million, does not expire and carries forward indefinitely. The capital loss carryforwards will expire between 2020 and 2023. The net operating losses are subject to an annual IRC Section 382 limitation which restricts their utilization against taxable income in future periods. In addition, we have state business tax credits of approximately $14.8 million that can be carried forward indefinitely and other state business tax credits of approximately $1.1 million that will expire between 2023 and 2027.
83
Note 13—Income Taxes (continued)
As of December 31, 2019 and 2018, we had a liability of $8.3 million and $6.9 million, respectively, for unrecognized tax benefits related to various federal and state income tax matters excluding interest, penalties and related tax benefits. The reconciliation of the beginning unrecognized tax benefits balance to the ending balance is as follows:
Year Ended December 31, | |||||||||||
2019 | 2018 | 2017 | |||||||||
(In thousands) | |||||||||||
Beginning balance | $ | $ | $ | ||||||||
Increases related to positions taken during prior years | |||||||||||
Increases related to positions taken during the current year | |||||||||||
Decreases related to positions settled with tax authorities | ( | ) | |||||||||
Decreases due to a lapse of applicable statute of limitations | ( | ) | ( | ) | ( | ) | |||||
Ending balance | $ | $ | $ | ||||||||
The total amount of unrecognized tax benefits that, if recognized, would affect the effective tax rate | $ | $ | $ | ||||||||
We recognized accrued interest and penalties related to unrecognized tax benefits for the years ended December 31, 2019, 2018 and 2017, of approximately $0.5 million, $0.3 million and $0.2 million, respectively.
Note 14—Earnings per Common Share
The calculation of basic and diluted EPS was as follows:
Year Ended December 31, | |||||||||||
2019 | 2018 | 2017 | |||||||||
(In thousands, except per share data) | |||||||||||
Basic earnings per Class A common share | |||||||||||
Numerator: | |||||||||||
Net income | $ | $ | $ | ||||||||
Denominator: | |||||||||||
Weighted-average Class A shares issued and outstanding | |||||||||||
Basic earnings per Class A common share | $ | $ | $ | ||||||||
Diluted earnings per Class A common share | |||||||||||
Numerator: | |||||||||||
Net income | $ | $ | $ | ||||||||
Denominator: | |||||||||||
Weighted-average Class A shares issued and outstanding | |||||||||||
Dilutive potential common shares: | |||||||||||
Stock options | |||||||||||
Service based restricted stock units | |||||||||||
Performance-based restricted stock units | |||||||||||
Employee stock purchase plan | |||||||||||
Diluted weighted-average Class A shares issued and outstanding | |||||||||||
Diluted earnings per Class A common share | $ | $ | $ | ||||||||
For the periods presented, we excluded certain restricted stock units and stock options outstanding, which could potentially dilute basic EPS in the future, from the computation of diluted EPS as their effect was anti-dilutive. Additionally, we have excluded any performance based restricted stock units for which the performance contingency has not been met as of the end of the period, or whereby the result of including such awards was anti-dilutive. The following table shows the weighted-average number of anti-dilutive shares excluded from the diluted EPS calculation:
84
Note 14—Earnings per Common Share (continued)
Year Ended December 31, | ||||||||
2019 | 2018 | 2017 | ||||||
(In thousands) | ||||||||
Class A common stock | ||||||||
Options to purchase Class A common stock | ||||||||
Service based restricted stock units | ||||||||
Performance-based restricted stock units | ||||||||
Total options, restricted and performance-based stock units | ||||||||
Note 15—Fair Value Measurements
We determine the fair values of our financial instruments based on the fair value hierarchy established under applicable accounting guidance which requires an entity to maximize the use of observable inputs and minimize the use of unobservable inputs when measuring fair value. There are three levels of inputs used to measure fair value.
For more information regarding the fair value hierarchy and how we measure fair value, see Note 2 — Summary of Significant Accounting Policies.
As of December 31, 2019 and 2018, our assets and liabilities carried at fair value on a recurring basis were as follows:
Level 1 | Level 2 | Level 3 | Total Fair Value | ||||||||||||
December 31, 2019 | (In thousands) | ||||||||||||||
Assets | |||||||||||||||
Corporate bonds | $ | $ | $ | $ | |||||||||||
Agency bond securities | |||||||||||||||
Agency mortgage-backed securities | |||||||||||||||
Municipal bonds | |||||||||||||||
Asset-backed securities | |||||||||||||||
Total assets | $ | $ | $ | $ | |||||||||||
Liabilities | |||||||||||||||
Contingent consideration | $ | $ | $ | $ | |||||||||||
December 31, 2018 | |||||||||||||||
Assets | |||||||||||||||
Negotiable certificate of deposit | $ | $ | $ | $ | |||||||||||
Agency bond securities | |||||||||||||||
Agency mortgage-backed securities | |||||||||||||||
Municipal bonds | |||||||||||||||
Asset-backed securities | |||||||||||||||
Total assets | $ | $ | $ | $ | |||||||||||
Liabilities | |||||||||||||||
Contingent consideration | $ | $ | $ | $ | |||||||||||
We based the fair value of our fixed income securities held as of December 31, 2019 and 2018 on quoted prices in active markets for similar assets. We had no transfers between Level 1, Level 2 or Level 3 assets or liabilities during the years ended December 31, 2019 and 2018.
85
Note 15—Fair Value Measurements (continued)
The following table presents changes in our contingent consideration payable for the years ended December 31, 2019, 2018 and 2017, which is categorized in Level 3 of the fair value hierarchy:
Year Ended December 31, | |||||||||||
2019 | 2018 | 2017 | |||||||||
(In thousands) | |||||||||||
Balance, beginning of period | $ | $ | $ | ||||||||
Issuance | |||||||||||
Payments of contingent consideration | ( | ) | ( | ) | ( | ) | |||||
Change in fair value of contingent consideration | ( | ) | ( | ) | |||||||
Balance, end of period | $ | $ | $ | ||||||||
Note 16—Fair Value of Financial Instruments
The following describes the valuation technique for determining the fair value of financial instruments, whether or not such instruments are carried at fair value on our consolidated balance sheets.
Short-term Financial Instruments
Our short-term financial instruments consist principally of unrestricted and restricted cash and cash equivalents, settlement assets and obligations, and obligations to customers. These financial instruments are short-term in nature, and, accordingly, we believe their carrying amounts approximate their fair values. Under the fair value hierarchy, these instruments are classified as Level 1.
Investment Securities
The fair values of investment securities have been derived using methodologies referenced in Note 2 — Summary of Significant Accounting Policies. Under the fair value hierarchy, our investment securities are classified as Level 2.
Loans
We determined the fair values of loans by discounting both principal and interest cash flows expected to be collected using a discount rate commensurate with the risk that we believe a market participant would consider in determining fair value. Under the fair value hierarchy, our loans are classified as Level 3.
Deposits
The fair value of demand and interest checking deposits and savings deposits is the amount payable on demand at the reporting date. We determined the fair value of time deposits by discounting expected future cash flows using market-derived rates based on our market yields on certificates of deposit, by maturity, at the measurement date. Under the fair value hierarchy, our deposits are classified as Level 2.
Contingent Consideration
The fair value of contingent consideration obligations are estimated through valuation models designed to estimate the probability of such contingent payments based on various assumptions. Estimated payments are discounted using present value techniques to arrive at an estimated fair value. Our contingent consideration payable is classified as Level 3 because we use unobservable inputs to estimate fair value, including the probability of achieving certain earnings thresholds and appropriate discount rates. Our contingent consideration payable is included as a component of other accrued liabilities on our consolidated balance sheets and changes in fair value are recorded through operating expenses.
Debt
The fair value of our debt is based on borrowing rates currently required of loans with similar terms, maturity and credit risk. The carrying amount of our debt approximates fair value because the base interest rate charged varies with market conditions and the credit spread is commensurate with current market spreads for issuers of similar risk. The fair value of our debt is classified as a Level 2 liability in the fair value hierarchy.
86
Note 16—Fair Value of Financial Instruments (continued)
Fair Value of Financial Instruments
The carrying values and fair values of certain financial instruments that were not carried at fair value, excluding short-term financial instruments for which the carrying value approximates fair value, at December 31, 2019 and 2018 are presented in the table below.
December 31, 2019 | December 31, 2018 | ||||||||||||||
Carrying Value | Fair Value | Carrying Value | Fair Value | ||||||||||||
(In thousands) | |||||||||||||||
Financial Assets | |||||||||||||||
Loans to bank customers, net of allowance | $ | $ | $ | $ | |||||||||||
Financial Liabilities | |||||||||||||||
Deposits | $ | $ | $ | $ | |||||||||||
Debt | $ | $ | $ | $ | |||||||||||
Note 17—Concentrations of Credit Risk
Financial instruments that subject us to concentration of credit risk consist primarily of unrestricted cash and cash equivalents, restricted cash, investment securities, accounts receivable, loans and settlement assets. We deposit our unrestricted cash and cash equivalents and our restricted cash with regional and national banking institutions that we periodically monitor and evaluate for creditworthiness. Credit risk for our investment securities is mitigated by the types of investment securities in our portfolio, which must comply with strict investment guidelines that we believe appropriately ensures the preservation of invested capital. Credit risk for our accounts receivable is concentrated with card issuing banks and our customers, and this risk is mitigated by the relatively short collection period and our large customer base. We do not require or maintain collateral for accounts receivable. We maintain reserves for uncollectible overdrawn accounts and uncollectible trade receivables. With respect to our loan portfolio (excluding secured credit cards), approximately 92.3 % of our borrowers reside in the state of Utah and approximately 42.3 % in the city of Provo. Consequently, this loan portfolio is susceptible to any adverse market or environmental conditions that may impact this specific geographic region. Credit risk associated with our secured credit card portfolio is mitigated by collateral provided by the borrower in the amount of their credit limit. Credit risk for our settlement assets is concentrated with our retail distributors and other business partners, which we frequently monitor.
Note 18—Defined Contribution Plan
Note 19—Leases
We enter into operating lease agreements principally related to our corporate office locations. Currently, we do not enter into any financing lease agreements. Our leases have remaining lease terms of less than 1 year to approximately 6 years, most of which include renewal options of varying terms. We made a policy election to adopt the short term lease exemption for all leases with an initial term of 12 months or less.
Significant Assumptions, Judgments and Policies
Under Topic 842, we determine if an arrangement is or contains a lease at inception. ROU assets and liabilities are recognized at the lease commencement date based on the present value of remaining lease payments over the lease term. For this purpose, we consider only fixed payments stated in the leases at the time of commencement. Variable lease payments that are not based on a specified rate or index are expensed when incurred. Since an implicit interest rate for our leases cannot be determined under our contracts, we use an incremental borrowing rate based on the information available to us at the commencement date in determining the present value of our lease payments.
87
Note 19—Leases (continued)
Our incremental borrowing rate is based on a variety of considerations, including borrowing rates currently available to us for loans with similar terms and market participant information based on credit spreads for issuers of similar risk and credit rating.
The ROU asset also reflects any lease payments made prior to commencement and is recorded net of any lease incentives received. Our ROU asset and liability reflects, as applicable, options to extend or terminate a lease when it is reasonably certain that we will exercise such options. We also made a policy election to combine our lease and non-lease components for each of our existing classes of leased assets. Our lease agreements do not contain any material residual value guarantees or material restrictive covenants. Lease expense is recognized on a straight-line basis over the lease term.
Our total lease expense amounted to approximately $11.3 million, $7.6 million, and $7.2 million for the years ended December 31, 2019, 2018 and 2017, respectively. Our lease expense is generally based on fixed payments stated within the agreements. Any variable payments for non-lease components and other short term lease expenses are not considered material.
Supplemental Information
Supplemental information related to our ROU assets and related lease liabilities is as follows:
December 31, 2019 | |||
Cash paid for operating lease liabilities (in thousands) | $ | ||
Weighted average remaining lease term (years) | |||
Weighted average discount rate | % | ||
Maturities of our operating lease liabilities as of December 31, 2019 is as follows:
Operating Leases | |||
(In thousands) | |||
2020 | $ | ||
2021 | |||
2022 | |||
2023 | |||
2024 | |||
Thereafter | |||
Less: imputed interest | ( | ) | |
Total lease liabilities | $ | ||
Note 20—Commitments and Contingencies
At December 31, 2019, the future minimum annual payments through various agreements with vendors and retail distributors was as follows:
Vendor/Retail Distributor Commitments | |||
Year ending December 31, | (In thousands) | ||
2020 | $ | ||
2021 | |||
2022 | |||
2023 | |||
Total of future commitments | $ | ||
88
Note 20—Commitments and Contingencies (continued)
In the event we terminate our processing services agreement for convenience, we are required to pay a single lump sum equal to any minimum payments remaining on the date of termination. These future minimum obligations are included in our vendor and retail distributor commitments.
In addition to the above contractual obligations, our definitive agreement to acquire all of the equity interests of UniRush provides for a minimum $4 million annual earn-out payment for five years following the closing, ending in February 2022. As of December 31, 2019, the estimated fair value of our remaining earn-out payments amounted to $9.3 million.
Litigation and Claims
In the ordinary course of business, we are a party to various legal proceedings, including, from time to time, actions which are asserted to be maintainable as class action suits. We review these actions on an ongoing basis to determine whether it is probable and estimable that a loss has occurred and use that information when making accrual and disclosure decisions. We have provided reserves where necessary for all claims and, based on current knowledge and in part upon the advice of legal counsel, all matters are believed to be adequately covered by insurance, or, if not covered, we do not expect the outcome in any legal proceedings, individually or collectively, to have a material adverse impact on our financial condition or results of operations.
On December 18, 2019, an alleged class action entitled Koffsmon v. Green Dot Corp., et al., No. 19-cv-10701-DDP-E, was filed in the United States District Court for the Central District of California, against us and two of our officers. The suit asserts purported claims under Sections 10(b) and 20(a) of the Exchange Act for allegedly misleading statements regarding our business strategy. Plaintiff alleges that defendants made statements that were misleading because they allegedly failed to disclose details regarding our customer acquisition strategy and its impact on our financial performance. The suit is purportedly brought on behalf of purchasers of our securities between May 9, 2018 and November 7, 2019, and seeks compensatory damages, fees and costs. On February 18, 2020, a shareholder derivative suit and securities class action entitled Hellman v. Streit, et al, No. 20-cv-01572-SVW-PVC was filed in United States District Court for the Central District of California, against us and certain of our officers and directors. The suit avers purported breach of fiduciary duty and unjust enrichment claims, as well as claims under Sections 10(b), 14(a) and 20(a) of the Exchange Act, on the basis of the same wrongdoing alleged in the first lawsuit described above. The suit does not define the purported class allegedly damaged. These cases have been related. The defendants have not yet responded to the complaints in these matters.
Due to the inherent uncertainties of litigation, we cannot accurately predict the ultimate outcome of this matter. We are unable at this time to determine whether the outcome of the litigation would have a material impact on our results of operations, financial condition or cash flows.
The third and final performance period under an earn-out provision for the acquisition of our tax refund processing business ended on June 30, 2017. We believed that our tax refund processing business did not achieve its earn-out performance target for the fiscal year performance period based on the provisions of the contract and therefore, the total potential payout of $26 million had not been accrued in any period subsequent to June 30, 2017. We were in the process of resolving the final earn-out calculation with the selling shareholders with the assistance of a neutral third party pursuant to the terms of the contract. Prior to the final outcome of that process, we and the sellers mutually agreed to a payment of $13.5 million. This payment was made in October of 2018 and is reflected as a component of other general and administrative expenses on our consolidated income statement for the year ended December 31, 2018.
Other Matters
We monitor the laws of all 50 states to identify state laws or regulations that apply (or may apply) to our products and services. We have obtained money transmitter licenses (or similar such licenses) where applicable, based on advice of counsel or when we have been requested to do so. If we were found to be in violation of any laws and regulations governing banking, money transmitters, electronic fund transfers, or money laundering in the United States or abroad, we could be subject to penalties or could be forced to change our business practices.
From time to time we enter into contracts containing provisions that contingently require us to indemnify various parties against claims from third parties. These contracts primarily relate to: (i) contracts with our card issuing banks, under which we are responsible to them for any unrecovered overdrafts on cardholders’ accounts; (ii) certain real estate leases, under which we may be required to indemnify property owners for environmental and other liabilities, and other claims arising from our use of the premises; (iii) certain agreements with our officers, directors, and employees, under
89
Note 20—Commitments and Contingencies (continued)
which we may be required to indemnify these persons for liabilities arising out of their relationship with us; and (iv) contracts under which we may be required to indemnify our retail distributors, suppliers, vendors and other parties with whom we have contracts against claims arising from certain of our actions, omissions, violations of law and/or infringement of patents, trademarks, copyrights and/or other intellectual property rights.
Generally, a maximum obligation under these contracts is not explicitly stated. Because the obligated amounts associated with these types of agreements are not explicitly stated, the overall maximum amount of the obligation cannot be reasonably estimated. With the exception of overdrafts on cardholders’ accounts, historically, we have not been required to make payments under these and similar contingent obligations, and no liabilities have been recorded for these obligations in our consolidated balance sheets.
For additional information regarding overdrafts on cardholders’ accounts, refer to Note 5 — Accounts Receivable.
Note 21—Significant Retailer Concentration
A credit concentration may exist if customers are involved in similar industries, economic sectors, and geographic regions. Our retail distributors operate in similar economic sectors but diverse domestic geographic regions. The loss of a significant retail distributor could have a material adverse effect upon our card sales, profitability, and revenue growth.
Revenue Concentrations
Revenues derived from our products sold at retail distributors constituting greater than 10% of our total operating revenues were as follows:
Year Ended December 31, | |||||
2019 | 2018 | 2017 | |||
Walmart | |||||
No other retail distributor or partner made up greater than 10% of our total operating revenues for the years ended December 31, 2019, 2018, and 2017.
Settlement Asset Concentrations
Settlement assets derived from our products sold at retail distributors constituting greater than 10% of the settlement assets outstanding on our consolidated balance sheets were as follows:
December 31, 2019 | December 31, 2018 | ||
Walmart | |||
Note 22—Regulatory Requirements
Our subsidiary bank, Green Dot Bank, is a member bank of the Federal Reserve System and our primary regulator is the Federal Reserve Board. We and Green Dot Bank are subject to commitments that we have made to the Federal Reserve Board and the Utah Department of Financial Institutions. These commitments require Green Dot Bank to maintain cash and/or cash equivalents in an amount equal to no less than 100 % of insured deposits generated by Green Dot Bank related to GPR cards, a subset of its total deposits. In addition, we and Green Dot Bank are subject to various regulatory capital requirements administered by the federal banking agencies. Failure to meet minimum capital requirements can initiate certain mandatory actions by regulators that, if undertaken, could have a direct material effect on our financial statements. Under capital adequacy guidelines, we and Green Dot Bank must meet specific capital guidelines that involve quantitative measures of the assets, liabilities and certain off-balance sheet items as calculated under regulatory accounting practices. The capital amounts and classification are also subject to qualitative judgments by the regulators about components, risk weightings and other factors.
90
Note 22—Regulatory Requirements (continued)
As of December 31, 2019 and 2018, we and Green Dot Bank were categorized as "well capitalized" under applicable regulatory standards. There were no conditions or events since December 31, 2019 which management believes would have caused us or Green Dot Bank not to be considered "well capitalized." Our capital ratios and related regulatory requirements were as follows:
December 31, 2019 | ||||||||||||
Amount | Ratio | Regulatory Minimum | "Well-capitalized" Minimum | |||||||||
(In thousands, except ratios) | ||||||||||||
Green Dot Corporation: | ||||||||||||
Tier 1 leverage | $ | % | % | n/a | ||||||||
Common equity Tier 1 capital | $ | % | % | n/a | ||||||||
Tier 1 capital | $ | % | % | % | ||||||||
Total risk-based capital | $ | % | % | % | ||||||||
Green Dot Bank: | ||||||||||||
Tier 1 leverage | $ | % | % | % | ||||||||
Common equity Tier 1 capital | $ | % | % | % | ||||||||
Tier 1 capital | $ | % | % | % | ||||||||
Total risk-based capital | $ | % | % | % | ||||||||
December 31, 2018 | ||||||||||||
Amount | Ratio | Regulatory Minimum | "Well-capitalized" Minimum | |||||||||
(In thousands, except ratios) | ||||||||||||
Green Dot Corporation: | ||||||||||||
Tier 1 leverage | $ | % | % | n/a | ||||||||
Common equity Tier 1 capital | $ | % | % | n/a | ||||||||
Tier 1 capital | $ | % | % | % | ||||||||
Total risk-based capital | $ | % | % | % | ||||||||
Green Dot Bank: | ||||||||||||
Tier 1 leverage | $ | % | % | % | ||||||||
Common equity Tier 1 capital | $ | % | % | % | ||||||||
Tier 1 capital | $ | % | % | % | ||||||||
Total risk-based capital | $ | % | % | % | ||||||||
91
Note 23—Selected Unaudited Quarterly Financial Information
The following tables set forth a summary of our quarterly financial information for each of the four quarters in 2019 and 2018:
2019 | |||||||||||||||
Q4 | Q3 | Q2 | Q1 | ||||||||||||
(In thousands, except per share data) | |||||||||||||||
Total operating revenues | $ | $ | $ | $ | |||||||||||
Total operating expenses | |||||||||||||||
Operating (loss) income | ( | ) | ( | ) | |||||||||||
Interest expense, net | |||||||||||||||
(Loss) income before income taxes | ( | ) | ( | ) | |||||||||||
Income tax (benefit) expense | ( | ) | ( | ) | |||||||||||
Net income (loss) | $ | $ | ( | ) | $ | $ | |||||||||
Earnings (loss) per common share | |||||||||||||||
Basic | |||||||||||||||
Class A common stock | $ | $ | ( | ) | $ | $ | |||||||||
Diluted | |||||||||||||||
Class A common stock | $ | $ | ( | ) | $ | $ | |||||||||
2018 | |||||||||||||||
Q4 | Q3 | Q2 | Q1 | ||||||||||||
(In thousands, except per share data) | |||||||||||||||
Total operating revenues | $ | $ | $ | $ | |||||||||||
Total operating expenses | |||||||||||||||
Operating income | |||||||||||||||
Interest expense, net | |||||||||||||||
Income before income taxes | ( | ) | |||||||||||||
Income tax (benefit) expense | ( | ) | ( | ) | |||||||||||
Net income | $ | $ | $ | $ | |||||||||||
Earnings per common share | |||||||||||||||
Basic | |||||||||||||||
Class A common stock | $ | $ | $ | $ | |||||||||||
Diluted | |||||||||||||||
Class A common stock | $ | $ | $ | $ | |||||||||||
Note 24—Segment Information
Our operations are comprised of two reportable segments: 1) Account Services and 2) Processing and Settlement Services. We identified our reportable segments based on factors such as how we manage our operations and how our chief operating decision maker views results. Our chief operating decision maker organizes and manages our business primarily on the basis of product and service offerings and uses operating income to assess profitability.
The Account Services segment consists of revenues and expenses derived from our deposit account programs, such as prepaid cards, debit cards, consumer and small business checking accounts, secured credit cards, payroll debit cards and gift cards. These deposit account programs are marketed under several of our leading consumer brand names and under the brand names of our Banking as a Service, or "BaaS," partners. The Processing and Settlement Services segment consists of revenues and expenses derived from our products and services that specialize in facilitating the movement of cash on behalf of consumers and businesses, such as consumer cash processing services, wage disbursements and tax refund processing services. The Corporate and Other segment primarily consists of eliminations of intersegment revenues and expenses, unallocated corporate expenses, depreciation and amortization, and other costs that are not considered when management evaluates segment performance. We do not evaluate performance or allocate resources based on segment asset data, and therefore such information is not presented.
92
Note 24—Segment Information (continued)
The following tables present certain financial information for each of our reportable segments for the periods then ended:
Year Ended December 31, 2019 | |||||||||||||||
Account Services | Processing and Settlement Services | Corporate and Other | Total | ||||||||||||
(In thousands) | |||||||||||||||
Operating revenues | $ | $ | $ | ( | ) | $ | |||||||||
Operating expenses | |||||||||||||||
Operating income | $ | $ | $ | ( | ) | $ | |||||||||
Year Ended December 31, 2018 | |||||||||||||||
Account Services | Processing and Settlement Services | Corporate and Other | Total | ||||||||||||
(In thousands) | |||||||||||||||
Operating revenues | $ | $ | $ | ( | ) | $ | |||||||||
Operating expenses | |||||||||||||||
Operating income | $ | $ | $ | ( | ) | $ | |||||||||
Year Ended December 31, 2017 | |||||||||||||||
Account Services | Processing and Settlement Services | Corporate and Other | Total | ||||||||||||
(In thousands) | |||||||||||||||
Operating revenues | $ | $ | $ | ( | ) | $ | |||||||||
Operating expenses | |||||||||||||||
Operating income | $ | $ | $ | ( | ) | $ | |||||||||
Note 25—Subsequent Events
On October 29, 2019, we entered into the 2020 Amended and Restated Walmart MoneyCard Program Agreement (the “Program Agreement”) with Walmart Inc. and certain of Walmart’s subsidiaries, which provides for us to continue to serve as the issuing bank and program manager for the Walmart MoneyCard suite of reloadable debit card products. The term of the Program Agreement began on January 1, 2020 and expires on January 31, 2027, with an automatic renewal clause for an additional period of one year , subject to certain terms as discussed in the Program Agreement.
On January 2, 2020, we effectuated our agreement with Walmart to jointly establish a new fintech accelerator under the name TailFin Labs, LLC (“TailFin Labs”), with a mission to develop innovative products, services and technologies that sit at the intersection of retail shopping and consumer financial services. The entity is majority-owned by Walmart and is expected to focus on developing tech-enabled solutions to integrate omni-channel retail shopping and financial services. We own a 20 % equity interest in the newly formed entity, in exchange for capital contributions of $35.0 million per year over the next 5 years. We will account for our investment in TailFin Labs under the equity method of accounting. Any economic benefits derived from products or services developed by TailFin Labs will be negotiated on a case-by-case basis between the parties.
93
ITEM 9. Changes in and Disagreement With Accountants on Accounting and Financial Disclosure
None.
ITEM 9A. Controls and Procedures
Disclosure controls and procedures — Our management, with the participation of our Interim Chief Executive Officer and Interim Chief Financial Officer, has evaluated the effectiveness of our disclosure controls and procedures (as defined in Exchange Act Rules 13a-15(e) and 13d-15(e)), and internal control over financial reporting (as defined in Exchange Act Rules 13a-15(f) and 15d-15(f)) at the end of the period covered by this report. Based on such evaluation of our disclosure controls and procedures, our Interim Chief Executive Officer and Interim Chief Financial Officer have concluded that, at the end of such period, our disclosure controls and procedures were effective to ensure that information required to be disclosed by us in reports that we file or submit under the Exchange Act is recorded, processed, summarized and reported within the time periods specified in the SEC’s rules and forms and is accumulated and communicated to our management, including our Interim Chief Executive Officer and Interim Chief Financial Officer, as appropriate, to allow timely decisions regarding required disclosure.
Report of management on internal control over financial reporting — Our management is responsible for establishing and maintaining adequate internal control over financial reporting (as defined in Exchange Act Rules 13a-15(f) and 15d-15(f)) for Green Dot Corporation. Our management, with the participation of our Interim Chief Executive Officer and Interim Chief Financial Officer, has conducted an evaluation of the effectiveness of our internal control over financial reporting as of December 31, 2019, based on criteria established in Internal Control - Integrated Framework by the Committee of Sponsoring Organizations of the Treadway Commission (2013 framework).
Our management concluded that, as of December 31, 2019, our internal control over financial reporting was effective based on these criteria.
Ernst & Young LLP, an independent registered public accounting firm, has issued an unqualified opinion on the effectiveness of our internal control over financial reporting as of December 31, 2019, which is included in Part II, Item 8 of this Annual Report on Form 10-K.
Change in internal control over financial reporting — There was no material change in our internal control over financial reporting (as defined in Exchange Act Rules 13a-15(f) and 15d-15(f)) during the three months ended December 31, 2019 that has materially affected, or is reasonably likely to materially affect, our internal control over financial reporting.
Limitations on Effectiveness of Controls — Our management, including our Interim Chief Executive Officer and Interim Chief Financial Officer, does not expect that our disclosure controls and procedures or our internal controls will prevent all errors and all fraud. A control system, no matter how well conceived and operated, can provide only reasonable, not absolute, assurance that the objectives of the control system are met. Further, the design of a control system must reflect the fact that there are resource constraints, and the benefits of controls must be considered relative to their costs. Because of the inherent limitations in all control systems, no evaluation of controls can provide absolute assurance that all control issues and instances of fraud, if any, within our company have been detected.
ITEM 9B. Other Information
None.
94
PART III
ITEM 10. Directors, Executive Officers and Corporate Governance
The information required by this Item is incorporated by reference from our proxy statement for our 2020 Annual Meeting of Stockholders under the captions “Proposal No. 1 Election of Directors,” “Our Executive Officers,” “Corporate Governance and Director Independence -- Code of Business Conduct and Ethics,” “Corporate Governance and Director Independence - Committees of Our Board of Directors - Audit Committee,” “Additional Information -- Delinquent Section 16(a) Reports.”
ITEM 11. Executive Compensation
The information required by this Item is incorporated by reference from our proxy statement for our 2020 Annual Meeting of Stockholders under the caption “Executive Compensation” excluding the sub-caption “Equity Compensation Plan Information.”
ITEM 12. Security Ownership of Certain Beneficial Owners and Management and Related Stockholder Matters
The information required by this Item is incorporated by reference from our proxy statement for our 2020 Annual Meeting of Stockholders under the captions “Security Ownership of Certain Beneficial Owners and Management” and “Executive Compensation - Equity Compensation Plan Information”.
ITEM 13. Certain Relationships and Related Transactions, and Director Independence
The information required by this Item is incorporated by reference from our proxy statement for our 2020 Annual Meeting of Stockholders under the captions “Corporate Governance and Director Independence of Directors” and “Transactions with Related Parties, Founders and Control Persons.”
ITEM 14. Principal Accounting Fees and Services
The information required by this Item is incorporated by reference from our proxy statement for our 2020 Annual Meeting of Stockholders under the caption “Proposal No. 2 Ratification of Appointment of Independent Registered Public Accounting Firm - Principal Accountant Fees and Services.”
95
PART IV
ITEM 15. Exhibits, Financial Statement Schedules
(a) The following documents are filed as exhibits to this report:
1. Financial Statements
The Index to Consolidated Financial Statements in Item 8 of this report is incorporated herein by reference as the list of financial statements required as part of this report.
2. Financial Statement Schedules
All financial statement schedules have been omitted, since the required information is not applicable or is not present in amounts sufficient to require submission of the schedule, or because the information required is included in the consolidated financial statements and notes thereto.
3. Exhibits: The following exhibits are filed as part of or furnished with this annual report on Form 10-K as applicable:
Incorporated by Reference | ||||||||||
Exhibit Number | Exhibit Title | Form | Date | Number | Filed Herewith | |||||
3.1 | S-1(A2) | April 26, 2010 | 3.02 | |||||||
3.2 | 8-K | May 31, 2017 | 3.1 | |||||||
3.3 | 8-K | December 19, 2016 | 3.1 | |||||||
3.4 | 8-K | December 14, 2011 | 3.01 | |||||||
4.1 | X | |||||||||
10.1* | S-1(A4) | June 29, 2010 | 10.01 | |||||||
10.2* | S-1(A3) | June 2, 2010 | 10.02 | |||||||
10.3* | X | |||||||||
10.4 | S-1(A4) | June 29, 2010 | 10.19 | |||||||
10.5 | 10-K | February 29, 2012 | 10.8 | |||||||
10.6+ | X | |||||||||
10.7† | 10-Q/A | June 7, 2017 | 10.1 | |||||||
10.8† | 10-Q | November 9, 2018 | 10.1 | |||||||
10.9* | 8-K | September 22, 2016 | 10.01 | |||||||
96
Incorporated by Reference | ||||||||||
Exhibit Number | Exhibit Title | Form | Date | Number | Filed Herewith | |||||
10.10 | X | |||||||||
10.11* | 8-K | July 16, 2019 | 10.01 | |||||||
10.12* | S-1(A2) | April 26, 2010 | 10.12 | |||||||
10.13* | 8-K | April 9, 2019 | 10.01 | |||||||
21.1 | X | |||||||||
23.1 | X | |||||||||
24.1 | X | |||||||||
31.1 | X | |||||||||
31.2 | X | |||||||||
32.1** | X | |||||||||
32.2** | X | |||||||||
101 | The following financial statements from the Company's Annual Report on Form 10-K for the year ended December 31, 2019, formatted in Inline XBRL: (i) Consolidated Balance Sheets as of December 31, 2019 and 2018, (ii) Consolidated Statements of Operations for the Years Ended December 31, 2019, 2018 and 2017, (iii) Consolidated Statements of Comprehensive Income and Loss for the Years Ended December 31, 2019, 2018 and 2017, (iv) Consolidated Statements of Changes in Stockholders' Equity for the Years Ended December 31, 2019, 2018 and 2017, (v) Consolidated Statements of Cash Flows for the Years Ended December 31, 2019, 2018 and 2017 and (vi) Notes to Consolidated Financial Statements, tagged as blocks of text and including detailed tags. | X | ||||||||
104 | Cover Page Interactive Data File (formatted as Inline XBRL and contained in Exhibit 101) | X | ||||||||
_______________
* | Indicates management contract or compensatory plan or arrangement. |
** | Furnished, not filed. |
+ | Certain portions of this document that constitute confidential information have been redacted in accordance with Regulation S-K, Item 601(b)(10). |
† | Registrant has omitted portions of the referenced exhibit and filed such exhibit separately with the Securities and Exchange Commission pursuant to a grant of confidential treatment under Rule 406 or Rule 24b-2 promulgated under the Securities Act or Rule 24b-2 promulgated under the Exchange Act. |
97
ITEM 16. Form 10-K Summary
None.
98
SIGNATURE
Pursuant to the requirements of the Securities Exchange Act of 1934, the registrant has duly caused this report to be signed on its behalf by the undersigned, thereunto duly authorized.
Green Dot Corporation | ||||
Date: | February 28, 2020 | By: | /s/ William I Jacobs | |
Name: | William I Jacobs | |||
Title: | Chairman and Interim Chief Executive Officer | |||
KNOW ALL PERSONS BY THESE PRESENTS that each individual whose signature appears below constitutes and appoints William I Jacobs, John C. Ricci, and Jess Unruh, and each of them, his or her true and lawful attorneys-in-fact and agents with full power of substitution, for him or her and in his or her name, place and stead, in any and all capacities, to sign any amendments to this Annual Report on Form 10-K and to file the same, with all exhibits thereto and other documents in connection therewith, with the Securities and Exchange Commission, granting unto said attorneys-in-fact and agents, and each of them, full power and authority to do and perform each and every act and thing requisite and necessary to be done in and about the premises, as fully to all intents and purposes as he or she might or could do in person, hereby ratifying and confirming all that said attorneys-in-fact and agents or any of them, or his, her or their substitute or substitutes, may lawfully do or cause to be done or by virtue hereof.
Pursuant to the requirements of the Securities Exchange Act of 1934, this report has been signed below by the following persons on behalf of the registrant in the capacities and on the dates indicated.
Signature | Title | Date | ||||
By: | /s/ William I Jacobs | Chairman and Interim Chief Executive Officer (Principal Executive Officer) | February 28, 2020 | |||
Name: | William I Jacobs | |||||
By: | /s/ J. Chris Brewster | Director and Interim President | February 28, 2020 | |||
Name: | J. Chris Brewster | |||||
By: | /s/ Jess Unruh | Interim Chief Financial Officer and Chief Accounting Officer (Principal Financial Officer and Accounting Officer) | February 28, 2020 | |||
Name: | Jess Unruh | |||||
By: | /s/ Kenneth C. Aldrich | Director | February 28, 2020 | |||
Name: | Kenneth C. Aldrich | |||||
By: | /s/ Glinda Bridgforth Hodges | Director | February 28, 2020 | |||
Name: | Glinda Bridgforth Hodges | |||||
By: | /s/ Rajeev V. Date | Director | February 28, 2020 | |||
Name: | Rajeev V. Date | |||||
By: | /s/ Saturnino Fanlo | Director | February 28, 2020 | |||
Name: | Saturnino Fanlo | |||||
By: | /s/ George T. Shaheen | Director | February 28, 2020 | |||
Name: | George T. Shaheen | |||||
99