UNITED STATES
SECURITIES AND EXCHANGE COMMISSION
Washington, D.C. 20549
FORM 40-F
(Check One)
☐ | Registration statement pursuant to Section 12 of the Securities Exchange Act of 1934 |
or
☒ | Annual report pursuant to section 13(a) or 15(d) of the Securities Exchange Act of 1934 |
For the fiscal year ended December 31, 2017
Commission file number 1-32895
OBSIDIAN ENERGY LTD.
(Exact name of registrant as specified in its charter)
Alberta, Canada | 1311 | Not applicable | ||
(Province or other jurisdiction of incorporation or organization) |
(Primary Standard Industrial Classification Code Number (if applicable)) |
(I.R.S. Employer Identification Number (if Applicable)) |
Suite 200, 207 9th Avenue SW, Calgary, Alberta, Canada T2P 1K3
(403) 777-2500
(Address and Telephone Number of Registrants Principal Executive Offices)
DL Services Inc., Columbia Center, 701 Fifth Avenue, Suite 6100, Seattle, Washington 98104-7043
(206) 903-5448
(Name, Address (Including Zip Code) and Telephone Number (Including Area Code) of Agent For Service in the United States)
Securities registered or to be registered pursuant to Section 12(b) of the Act.
Title of each class |
Name of each exchange on which registered | |
Common Shares | New York Stock Exchange |
Securities registered or to be registered pursuant to Section 12(g) of the Act: None
Securities for which there is a reporting obligation pursuant to Section 15(d) of the Act: None
For annual reports, indicate by check mark the information filed with this Form:
☒ Annual Information Form | ☒ Audited Annual Financial Statements |
Indicate the number of outstanding shares of each of the issuers classes of capital or common stock as of the close of the period covered by the annual report: 504,340,988
Indicate by check mark whether the Registrant by filing the information contained in this Form is also thereby furnishing the information to the Commission pursuant to Rule 12g3-2(b) under the Securities Exchange Act of 1934 (the Exchange Act). If Yes is marked, indicate the file number assigned to the Registrant in connection with such Rule.
Yes ☐ 82- No ☒
Indicate by check mark whether the registrant: (1) has filed all reports required to be filed by Section 13 or 15(d) of the Exchange Act during the preceding 12 months (or for such shorter period that the registrant was required to file such reports); and (2) has been subject to such filing requirements for the past 90 days.
Yes ☒ No ☐
Indicate by check mark whether the registrant is an emerging growth company as defined in Rule 12b-2 of the Exchange Act.
Emerging growth company ☒
If an emerging growth company that prepares its financial statements in accordance with U.S. GAAP, indicate by check mark if the registrant has elected not to use the extended transition period for complying with any new or revised financial accounting standards provided pursuant to Section 13(a) of the Exchange Act. ☐
FORM 40-F
Principal Documents
The following documents, filed as Exhibits 99.1, 99.2, 99.3 and 99.4 to this Annual Report on Form 40-F, are hereby incorporated by reference into this Annual Report on Form 40-F:
(a) | Annual Information Form for the fiscal year ended December 31, 2017; |
(b) | Managements Discussion and Analysis of Financial Condition and Results of Operations for the fiscal year ended December 31, 2017; |
(c) | Audited Consolidated Financial Statements for the fiscal year ended December 31, 2017, prepared under International Financial Reporting Standards as issued by the International Accounting Standards Board; and |
(d) | Supplemental Oil and Gas information. |
US-1
ADDITIONAL DISCLOSURE
Certifications and Disclosure Regarding Controls and Procedures.
(a) | Certifications. See Exhibits 99.5, 99.6, 99.7 and 99.8 to this Annual Report on Form 40-F. |
(b) | Disclosure Controls and Procedures. As of the end of Obsidian Energy Ltd.s (Obsidian Energy) fiscal year ended December 31, 2017, an evaluation of the effectiveness of Obsidian Energys disclosure controls and procedures (as such term is defined in Rules 13a-15(e) and 15d-15(e) under the Exchange Act) was carried out by the management of Obsidian Energy, with the participation of the President and Chief Executive Officer (CEO) and the Chief Financial Officer (CFO) of Obsidian Energy. Based upon that evaluation, the CEO and CFO have concluded that as of the end of that fiscal year, Obsidian Energys disclosure controls and procedures were effective to ensure that information required to be disclosed by Obsidian Energy in reports that it files or submits under the Exchange Act is (i) recorded, processed, summarized and reported within the time periods specified in Securities and Exchange Commission (the Commission) rules and forms and (ii) accumulated and communicated to the management of Obsidian Energy, including the CEO and CFO, to allow timely decisions regarding required disclosure. |
It should be noted that while the CEO and CFO believe that Obsidian Energys disclosure controls and procedures provide a reasonable level of assurance that they are effective, they do not expect that Obsidian Energys disclosure controls and procedures or internal control over financial reporting will prevent all errors and fraud. A control system, no matter how well conceived or operated, can provide only reasonable, not absolute, assurance that the objectives of the control system are met.
(c) | Managements Annual Report on Internal Control Over Financial Reporting. |
Management is responsible for establishing and maintaining adequate internal control over Obsidian Energys financial reporting. Obsidian Energys internal control system was designed to provide reasonable assurance that all transactions are accurately recorded, that transactions are recorded as necessary to permit preparation of financial statements in accordance with generally accepted accounting principles, and that Obsidian Energys assets are safeguarded.
Management has assessed the effectiveness of Obsidian Energys internal control over financial reporting as at December 31, 2017. In making its assessment, management used the Committee of Sponsoring Organizations of the Treadway Commission (COSO) framework in Internal Control Integrated Framework (2013) to evaluate the effectiveness of Obsidian Energys internal control over financial reporting. Based on this assessment, management has concluded that Obsidian Energys internal control over financial reporting was effective as of December 31, 2017.
US-2
The effectiveness of Obsidian Energys internal control over financial reporting as at December 31, 2017 has been audited by Ernst & Young LLP, as stated in their Report of Independent Registered Public Accounting Firm on Obsidian Energys internal control over financial reporting that accompanies Obsidian Energys Audited Consolidated Financial Statements for the fiscal year ended December 31, 2017, filed as Exhibit 99.3 to this Annual Report on Form 40-F.
(d) | Attestation Report of the Registered Public Accounting Firm. The required disclosure is included in the Report of Independent Registered Public Accounting Firm on Obsidian Energys internal control over financial reporting that accompanies Obsidian Energys Audited Consolidated Financial Statements for the fiscal year ended December 31, 2017, filed as Exhibit 99.3 to this Annual Report on Form 40-F. |
(e) | Changes in Internal Control Over Financial Reporting (ICFR). The required disclosure is included under the heading Changes in Internal Control Over Financial Reporting in the Companys Managements Discussion and Analysis of Financial Condition and Results of Operations for the fiscal year ended December 31, 2017, filed as Exhibit 99.2 to this Annual Report on Form 40-F. |
Notices Pursuant to Regulation BTR.
None.
Audit Committee Financial Expert.
Obsidian Energys board of directors has determined that Raymond Crossley, a member of Obsidian Energys audit committee, qualifies as an audit committee financial expert (as such term is defined in Form 40-F). Mr. Crossley is independent as that term is defined in the rules of the New York Stock Exchange.
Code of Business Conduct.
Obsidian Energy has adopted a Code of Business Conduct and Ethics that applies to all employees, officers and directors of Obsidian Energy. This Code constitutes a code of ethics as defined in Form 40-F and is referred to in this Annual Report on Form 40-F as the Code of Ethics.
The Code of Ethics is available for viewing on Obsidian Energys website at www.obsidianenergy.com, is available in print to any shareholder who requests a copy, and was previously filed as an exhibit to Obsidian Energys Annual Report on Form 40-F for the year ended December 31, 2015. Requests for copies of the Code of Ethics should be made by contacting: investor relations by phone at (888) 770-2633 or by e-mail to investor_relations@obsidianenergy.com.
US-3
During the year ended December 31, 2017, there have not been any amendments to, or waivers, including implicit waivers, from, any provision of the Code of Ethics.
If any amendment to the Code of Ethics is made, or if any waiver from the provisions thereof is granted, Obsidian Energy may elect to disclose the information about such amendment or waiver required by Form 40-F to be disclosed, by posting such disclosure on Obsidian Energys website, which may be accessed at www.obsidianenergy.com.
Principal Accountant Fees and Services.
The required disclosure is included under the heading External Auditor Service Fees in Obsidian Energys Annual Information Form for the fiscal year ended December 31, 2017, filed as Exhibit 99.1 hereto.
Pre-Approval Policies and Procedures.
(a) | The terms of the engagement of Obsidian Energys external auditors to provide audit services, including the budgeted fees for such audit services and the representations and disclaimers relating thereto, must be pre-approved by the entire audit committee. |
With respect to any engagements of Obsidian Energys external auditors for non-audit services, Obsidian Energy must obtain the approval of the audit committee or the Chairman of the audit committee prior to retaining the external auditors to complete such engagement. If such pre-approval is provided by the Chairman of the audit committee, the Chairman shall report to the audit committee on any non-audit service engagement pre-approved by him at the audit committees first scheduled meeting following such pre-approval.
If, after using its reasonable best efforts, Obsidian Energy is unable to contact the Chairman of the audit committee on a timely basis to obtain the pre-approval contemplated by the preceding paragraph, Obsidian Energy may obtain the required pre-approval from any other member of the audit committee, provided that any such audit committee member shall report to the audit committee on any non-audit service engagement pre-approved by him at the audit committees first scheduled meeting following such pre-approval.
(b) | Of the fees reported in this Annual Report on Form 40-F under the heading Principal Accountant Fees and Services, none of the fees billed by Ernst & Young LLP were approved by Obsidian Energys audit committee pursuant to the de minimus exception provided by Section (c)(7)(i)(C) of Rule 2-01 of Regulation S-X. |
Off-Balance Sheet Arrangements.
Obsidian Energy has off-balance-sheet financing arrangements consisting of operating leases. The operating lease payments are summarized below in the Tabular Disclosure of Contractual Obligations.
US-4
Tabular Disclosure of Contractual Obligations.
(CDN$ millions) | Payment due by period | |||||||||||||||||||
Contractual Obligations |
Total | Less than 1 Year |
1 to 3 Years |
3 to 5 Years |
More than 5 Years |
|||||||||||||||
Transportation |
57 | 12 | 19 | 12 | 14 | |||||||||||||||
Power infrastructure |
10 | 8 | 2 | | | |||||||||||||||
Office lease (1) |
243 | 34 | 68 | 68 | 73 | |||||||||||||||
Long-term debt (2)(3) |
359 | 31 | 303 | 22 | 3 | |||||||||||||||
Decommissioning liability (4) |
879 | 10 | 20 | 20 | 829 | |||||||||||||||
|
|
|
|
|
|
|
|
|
|
|||||||||||
Total |
1,548 | 95 | 412 | 122 | 919 | |||||||||||||||
|
|
|
|
|
|
|
|
|
|
(1) | Future office lease commitments will be reduced by sublease recoveries of $101 million. |
(2) | Obsidian Energys syndicated credit facility with an initial revolving period ending on May 17, 2018, with an additional one-year term out period. Obsidian Energy and its predecessors have successfully extended its credit facility on each renewal date since 1992. |
(3) | Interest payments have not been included since future debt levels and rates are not known at this time. |
(4) | These amounts represent the undiscounted future reclamation and abandonment costs that are expected to be incurred over the life of the properties. |
Identification of the Audit Committee.
Obsidian Energy has a separately-designated standing audit committee established in accordance with Section 3(a)(58)(A) of the Exchange Act. The members of the audit committee are: Raymond Crossley, John Brydson, Gordon Ritchie and Maureen Cormier Jackson.
Mine Safety Disclosure.
Not applicable.
Disclosure Pursuant to the Requirements of the New York Stock Exchange.
Director Independence
Obsidian Energys board of directors is responsible for determining whether or not each director is independent. In making these determinations, the board of directors considers all relationships of the directors with Obsidian Energy, including business, family and other relationships. Obsidian Energys board of directors also determines whether each member of Obsidian Energys audit committee is independent pursuant to Sections 1.4 and 1.5 of Multilateral Instrument 52-110 Audit Committees and Rule 10A-3 under the Exchange Act.
Obsidian Energys board of directors has determined that George H. Brookman, John Brydson, Raymond Crossley, William A. Friley, Maureen Cormier Jackson, Edward H. Kernaghan, Gordon Ritchie and Jay W. Thornton are each independent as that term is defined in the rules of the New York Stock Exchange, in that they have no material relationship with Obsidian Energy (either directly or as a partner, shareholder or officer
US-5
of an organization that has a relationship with the company). In reaching this determination in respect of George H. Brookman, the board of directors considered that although West Canadian Digital Imaging Inc., of which Mr. Brookman is a shareholder and the Chief Executive Officer, provides printing and related services to Obsidian Energy, Mr. Brookman is not involved with the services provided by West Canadian to Obsidian Energy and the amounts paid by Obsidian Energy to West Canadian are immaterial to both parties. In reaching this determination in respect of Raymond Crossley, the board of directors considered that although Mr. Crossley was, until March 6, 2015, a partner with PricewaterhouseCoopers LLP (PwC), which provided certain non-audit accounting advisory services to Obsidian Energy during 2014 2017 and took on the role of internal auditor position in 2017, Mr. Crossleys appointment to the board of directors only became effective upon his retirement from PwC and he did not personally provide any service or advice to Obsidian Energy. In reaching this determination in respect of William A. Friley, the board of directors considered that although Titan Energy Services Ltd. (Titan), of which Mr. Friley is a board member, provided some work directly in 2016 and some sub-contracting services for Shark Tank Ltd., which was initially awarded work from Obsidian Energy in 2015, the amount of the work was immaterial in both scenarios and the decision to subcontract the work to Titan by Shark Tank Ltd. was completed independent of Obsidian Energy. In reaching this determination in respect of Gordon Ritchie, the board of directors considered that although RBC Capital Markets LLC (RBC), of which Mr. Ritchie was employed at until March 31, 2016, provides some advisory services to Obsidian Energy, Mr. Ritchies appointment to the board of directors was after his retirement from RBC.
Presiding Director at Meetings of Non-Management Directors
Obsidian Energy schedules regular executive sessions in which Obsidian Energys non-management directors (as that term is defined in the rules of the New York Stock Exchange) meet without management participation. Jay Thornton, the Chairman of the board of directors, serves as the presiding director (the Presiding Director) at such sessions.
Communication with Non-Management Directors
Shareholders may send communications to Obsidian Energys non-management directors by writing to George H. Brookman, Chairman of the governance committee of the board of directors, care of Investor Relations, Obsidian Energy Ltd., 200, 207 9th Avenue SW, Calgary, Alberta, T2P 1K3 Canada. Communications will be referred to the Presiding Director for appropriate action. The status of all outstanding concerns addressed to the Presiding Director will be reported to the board of directors as appropriate.
US-6
Corporate Governance Guidelines
In accordance with the rules of the New York Stock Exchange, Obsidian Energy has adopted corporate governance guidelines, entitled Governance Guidelines, which are available for viewing on Obsidian Energys website at www.obsidianenergy.com and are available in print to any shareholder who requests a copy of them. Requests for copies of the Governance Guidelines should be made by contacting: investor relations by phone (888) 770-2633 or by e-mail to investor_relations@obsidianenergy.com.
Board Committee Mandates
The Mandates of Obsidian Energys audit committee, human resources and compensation committee, governance committee, operations and reserves committee are each available for viewing on Obsidian Energys website at www.obsidianenergy.com, and are available in print to any shareholder who requests them. Requests for copies of these documents should be made by contacting: investor relations by phone (888) 770-2633 or by e-mail to investor_relations@obsidianenergy.com.
NYSE Statement of Governance Differences
As a Canadian corporation listed on the NYSE, Obsidian Energy is not required to comply with most of the NYSE corporate governance standards, so long as it complies with Canadian corporate governance practices. In order to claim such an exemption, however, Obsidian Energy must disclose the significant difference between its corporate governance practices and those required to be followed by U.S. domestic companies under the NYSEs corporate governance standards. Obsidian Energy has included a description of such significant differences in corporate governance practices on its website which may be accessed at www.obsidianenergy.com.
US-7
UNDERTAKING AND CONSENT TO SERVICE OF PROCESS
A. Undertaking.
Obsidian Energy undertakes to make available, in person or by telephone, representatives to respond to inquiries made by the Commission staff, and to furnish promptly, when requested to do so by the Commission staff, information relating to: the securities registered pursuant to Form 40-F; the securities in relation to which the obligation to file an annual report on Form 40-F arises; or transactions in said securities.
B. Consent to Service of Process.
Obsidian Energy has previously filed a Form F-X in connection with the class of securities in relation to which the obligation to file this report arises.
Any change to the name or address of the agent for service of process of Obsidian Energy shall be communicated promptly to the Commission by an amendment to the Form F-X referencing the file number of Obsidian Energy.
SIGNATURES
Pursuant to the requirements of the Exchange Act, Obsidian Energy Ltd. certifies that it meets all of the requirements for filing on Form 40-F and has duly caused this annual report to be signed on its behalf by the undersigned, thereunto duly authorized, on March 7, 2018.
Obsidian Energy Ltd. | ||
By: | /s/ David L. French | |
Name: | David L. French | |
Title: | President and Chief Executive Officer |
US-8
EXHIBIT INDEX
Exhibit |
Description | |
99.1 | Annual Information Form for the fiscal year ended December 31, 2017 | |
99.2 | Managements Discussion and Analysis of Financial Condition and Results of Operations for the fiscal year ended December 31, 2017 | |
99.3 | Consolidated Financial Statements for the fiscal year ended December 31, 2017 | |
99.4 | Supplemental Oil and Gas information | |
99.5 | Certification of President & Chief Executive Officer pursuant to Rule 13a-14(a) or 15d-14 of the Securities Exchange Act of 1934 | |
99.6 | Certification of Chief Financial Officer pursuant to Rule 13a-14(a) or 15d-14 of the Securities Exchange Act of 1934 | |
99.7 | Certification of Chief Executive Officer pursuant to 18 U.S.C. Section 1350 | |
99.8 | Certification of Chief Financial Officer pursuant to 18 U.S.C. Section 1350 | |
99.9 | Consent of Ernst & Young LLP | |
99.10 | Consent of Sproule Associates Limited |
Exhibit 99.1
OBSIDIAN ENERGY LTD.
Annual Information Form
for the year ended December 31, 2017
March 6, 2018
TABLE OF CONTENTS
Page | ||||
GLOSSARY OF TERMS |
3 | |||
CONVENTIONS |
4 | |||
ABBREVIATIONS |
5 | |||
OIL AND GAS INFORMATION ADVISORIES |
5 | |||
CONVERSIONS |
6 | |||
EFFECTIVE DATE OF INFORMATION |
6 | |||
SPECIAL NOTE REGARDING FORWARD-LOOKING STATEMENTS |
6 | |||
GENERAL AND ORGANIZATIONAL STRUCTURE |
9 | |||
DESCRIPTION OF OUR BUSINESS |
10 | |||
CAPITALIZATION OF OBSIDIAN ENERGY |
16 | |||
DIRECTORS AND EXECUTIVE OFFICERS OF OBSIDIAN ENERGY |
18 | |||
AUDIT COMMITTEE DISCLOSURES |
23 | |||
DIVIDENDS AND DIVIDEND POLICY |
25 | |||
MARKET FOR SECURITIES |
26 | |||
INDUSTRY CONDITIONS |
27 | |||
RISK FACTORS |
37 | |||
MATERIAL CONTRACTS |
58 | |||
LEGAL PROCEEDINGS AND REGULATORY ACTIONS |
60 | |||
TRANSFER AGENTS AND REGISTRARS |
60 | |||
INTEREST OF MANAGEMENT AND OTHERS IN MATERIAL TRANSACTIONS |
60 | |||
INTERESTS OF EXPERTS |
60 | |||
ADDITIONAL INFORMATION |
61 | |||
APPENDIX A RESERVES DATA AND OTHER OIL AND GAS INFORMATION | ||||
Appendix A-1 Report of Management and Directors on Reserves Data and Other Information |
||||
Appendix A-2 Report on Reserves Data |
||||
Appendix A-3 Statement of Reserves Data and Other Oil and Gas Information |
||||
APPENDIX B MANDATE OF THE AUDIT COMMITTEE |
2
GLOSSARY OF TERMS
The following is a glossary of certain terms used in this Annual Information Form.
ABCA means the Business Corporations Act (Alberta), R.S.A. 2000, C. B-9, as amended, including the regulations promulgated thereunder.
Annual Information Form means this annual information form dated March 7, 2018.
Board or Board of Directors means the board of directors of Obsidian Energy.
Common Shares means common shares in the capital of Obsidian Energy.
Engineering Report means the report prepared by Sproule dated January 29, 2018 where they evaluated one hundred percent of the crude oil, natural gas and natural gas liquids reserves of Obsidian Energy and the net present value of future net revenue attributable to those reserves effective as at December 31, 2017.
Form 40-F means our Annual Report on Form 40-F for the fiscal year ended December 31, 2017 filed with the SEC.
Gross or gross means:
(a) | in relation to our interest in production or reserves, our company gross reserves, which are our working interest (operating or non-operating) share before deduction of royalties and without including any royalty interests of ours; |
(b) | in relation to wells, the total number of wells in which we have an interest; and |
(c) | in relation to properties, the total area of properties in which we have an interest. |
Handbook means the Chartered Professional Accountant Canada Handbook, as amended from time to time.
IFRS means International Financial Reporting Standards, being the standards and interpretations issued by the International Accounting Standards Board, as amended from time to time. The changeover date to IFRS was January 1, 2011 with retrospective adoption from January 1, 2010 onwards. For periods relating to financial years beginning on or after January 1, 2011, Canadian generally accepted accounting principles applicable to publicly accountable enterprises is determined with reference to Part I of the Handbook, which is IFRS.
MD&A means managements discussion and analysis.
Net or net means:
(a) | in relation to our interest in production or reserves, our working interest (operating or non-operating) share after deduction of royalty obligations, plus our royalty interests in production or reserves; |
(b) | in relation to our interest in wells, the number of wells obtained by aggregating our working interest in each of our gross wells; and |
(c) | in relation to our interest in a property, the total area in which we have an interest multiplied by the working interest we own. |
NI 51-101 means National Instrument 51-101 Standards of Disclosure for Oil and Gas Activities.
3
Non-Resident means: (i) a person who is not a resident of Canada for the purposes of the Tax Act; or (ii) a partnership that is not a Canadian partnership for the purposes of the Tax Act.
NYSE means the New York Stock Exchange.
Obsidian Energy, the Company, the Corporation, we, us or our each mean Obsidian Energy Ltd., a corporation existing under the ABCA. Where the context requires, these terms also include all of Obsidian Energys Subsidiaries on a consolidated basis. The Company completed a corporate name change in June 2017 from Penn West Petroleum Ltd. (Penn West) pursuant to obtaining the requisite shareholder approval.
OPEC means the Organization of the Petroleum Exporting Countries.
SEC means the United States Securities and Exchange Commission.
Senior Notes means our guaranteed, secured senior notes consisting of US$84 million principal amount of notes, as described under the heading Capitalization of Obsidian Energy Debt Capital Senior Notes.
Shareholders means holders of our Common Shares.
Sproule means Sproule Associates Limited, independent petroleum consultants of Calgary, Alberta.
Subsidiaries has the meaning ascribed thereto in the Securities Act (Ontario) and, for greater certainty, includes all corporations and partnerships owned, controlled or directed, directly or indirectly, by Obsidian Energy.
Tax Act means the Income Tax Act (Canada), R.S.C. 1985, C. 1 (5th Supp.), as amended, including the regulations promulgated thereunder, as amended from time to time.
TSX means the Toronto Stock Exchange.
undeveloped land and unproved property each mean a property or part of a property to which no reserves have been specifically attributed.
United States or U.S. means the United States of America.
CONVENTIONS
Certain terms used herein are defined in the Glossary of Terms. Certain other terms used herein but not defined herein are defined in NI 51-101 and, unless the context otherwise requires, shall have the same meanings herein as in NI 51-101.
All dollar amounts in this document are expressed in Canadian dollars, except where otherwise indicated. References to $ or Cdn$ are to Canadian dollars, references to US$ are to United States dollars, references to £ are to pounds sterling, and references to are to Euros. On March 6, 2018, the exchange rate based on the noon rate as reported by WM/Reuters, was Cdn$1.00 equals US$0.776.
All financial information herein has been presented in accordance with IFRS.
4
ABBREVIATIONS
Oil and Natural Gas Liquids |
Natural Gas | |||||
bbl | barrel or barrels | GJ | gigajoule | |||
bbl/d | barrels per day | GJ/d | gigajoules per day | |||
Mbbl | thousand barrels | Mcf | thousand cubic feet | |||
MMbbl | million barrels | MMcf | million cubic feet | |||
NGLs | natural gas liquids | Bcf | billion cubic feet | |||
MMboe | million barrels of oil equivalent | Mcf/d | thousand cubic feet per day | |||
Mboe | thousand barrels of oil equivalent | MMcf/d | million cubic feet per day | |||
boe/d | barrels of oil equivalent per day | m3 MMbtu |
cubic metres million British thermal units |
Other |
||
AECO | the Alberta benchmark price for natural gas. | |
BOE or boe | barrel of oil equivalent, using the conversion factor of 6 Mcf of natural gas being equivalent to one barrel of oil. | |
WTI | West Texas Intermediate, the reference price paid in United States dollars at Cushing, Oklahoma for crude oil of standard grade. | |
API | American Petroleum Institute. | |
°API | the measure of the density or gravity of liquid petroleum products derived from a specific gravity. | |
psi | pounds per square inch. | |
MM$ | million dollars. | |
MW | megawatt. | |
MWh | megawatt hour. | |
CO2 | carbon dioxide. |
OIL AND GAS INFORMATION ADVISORIES
Where any disclosure of reserves data is made in this Annual Information Form (including the Appendices hereto) that does not reflect all of the reserves of Obsidian Energy, the reader should note that the estimates of reserves and future net revenue for individual properties may not reflect the same confidence level as estimates of reserves and future net revenue for all properties, due to the effects of aggregation.
All production and reserves quantities included in this Annual Information Form (including the Appendices hereto) have been prepared in accordance with Canadian practices and specifically in accordance with NI 51-101. These practices are different from the practices used to report production and to estimate reserves in reports and other materials filed with the SEC by United States companies. Nevertheless, as part of Obsidian Energys Form 40-F for the year ended December 31, 2017, filed with the SEC, Obsidian Energy has disclosed proved reserves quantities using the standards contained in SEC Regulation S-X, and the standardized measure of discounted future net cash flows relating to proved oil and gas reserves determined in accordance with the U.S. Financial Accounting Standards Board, Disclosures About Oil and Gas Producing Activities, which disclosure complies with the SECs rules for disclosing oil and gas reserves.
References in this Annual Information Form to land and properties held, owned, acquired or disposed by us, or in respect of which we have an interest, refer to land or properties in respect of which we have a lease or other contractual right to explore for, develop, exploit and produce hydrocarbons underlying such land or properties.
5
Boes may be misleading, particularly if used in isolation. A boe conversion ratio of 6 Mcf: 1 bbl is based on an energy equivalency conversion method primarily applicable at the burner tip and does not represent a value equivalency at the wellhead. Given that the value ratio based on the current price of crude oil as compared to natural gas is significantly different from the energy equivalency conversion ratio of 6:1, utilizing a conversion on a 6:1 basis is misleading as an indication of value.
CONVERSIONS
The following table sets forth certain conversions between Standard Imperial Units and the International System of Units (or metric units).
To Convert From |
To |
Multiply By | ||||
Mcf |
cubic metres | 28.174 | ||||
cubic metres |
cubic feet | 35.494 | ||||
bbl |
cubic metres | 0.159 | ||||
cubic metres |
bbl | 6.293 | ||||
feet |
metres | 0.305 | ||||
metres |
feet | 3.281 | ||||
miles |
kilometres | 1.609 | ||||
kilometres |
miles | 0.621 | ||||
acres |
hectares | 0.405 | ||||
hectares |
acres | 2.500 | ||||
gigajoules (at standard) |
MMbtu | 0.948 | ||||
MMbtu (at standard) |
gigajoules | 1.055 | ||||
gigajoules (at standard) |
Mcf | 1.055 |
EFFECTIVE DATE OF INFORMATION
Except where otherwise indicated, the information in this Annual Information Form is presented as at the end of Obsidian Energys most recently completed financial year, being December 31, 2017.
SPECIAL NOTE REGARDING FORWARD-LOOKING STATEMENTS
In the interest of providing our securityholders and potential investors with information regarding Obsidian Energy, including managements assessment of Obsidian Energys future plans and operations, certain statements contained and incorporated by reference in this document constitute forward-looking statements or information (collectively forward-looking statements). Forward-looking statements are typically identified by words such as anticipate, continue, estimate, expect, forecast, budget, may, will, project, could, plan, intend, should, believe, outlook, objective, aim, potential, target and similar words suggesting future events or future performance. In addition, statements relating to reserves or resources are deemed to be forward-looking statements as they involve the implied assessment, based on certain estimates and assumptions, that the reserves and resources described exist in the quantities predicted or estimated and can be profitably produced in the future. In particular, this document and the documents incorporated by reference herein contain, without limitation, forward-looking statements pertaining to the following: the details of our 2018 capital budget and our average production guidance for 2018; the details of our ongoing acquisition, disposition, farm-out and financing strategy; our dividend policy; our expectations regarding the operational and financial impact that climate change regulations in the jurisdictions in which we operate will have on us; that the Corporation is unable to predict what additional legislation or amendment governments may enact in the future and what will need to be reported, remitted and in what time frame; that we are committed to mitigating the environmental impact from our operations, and to involving stakeholders throughout the exploration, development, production and abandonment process; that we will seek to drive improvement and to ensure compliance with our environmental policies; that we seek to communicate our commitment to environmental stewardship to our stakeholders in
6
order to always be held accountable; that we continue to work cooperatively with governments to develop an approach to deal with climate change issues that protects the industrys competitiveness, limits the cost and administrative burden of compliance, and supports continued investment in the oil and gas sector; our belief that the trend towards heightened and additional standards in environmental legislation and regulation will continue and our expectation that we will be making increased expenditures as a result of the expansion of our operations and the adoption of new legislation relating to the protection of the environment; our commitment to mitigating the environmental impact from our operations and involving stakeholders throughout the exploration, development, production and abandonment process; our assessment of the operational and financial impacts that certain risks factors could have on us and the value of our Common Shares should such risk factors materialize; the quantity of our oil, natural gas liquids and natural gas reserves, the recoverability thereof, and the net present values of future net revenue to be derived from our reserves using forecast prices and costs, including the disclosure set forth in Appendix A-3 under Statement of Reserves Data and Other Oil and Gas Information Reserves Data; the amount of royalties, operating costs, development costs, abandonment and reclamation costs and income taxes that we will incur in connection with the production of our reserves; our outlook for oil, natural gas liquids and natural gas prices; our expectations regarding future currency exchange rates and inflation rates; our expectations regarding funding the development of our reserves; our expectation that interest and other funding costs will not make the development of any of our properties uneconomic; our expectations regarding the timing for developing our proved undeveloped reserves and probable undeveloped reserves and the amount of future capital expenditures required to develop such reserves; our expectations regarding the significant economic factors and other significant uncertainties that could affect our reserves data; the number of net well bores, facilities and the length of pipeline in respect of which we expect to incur abandonment and reclamation costs and the total amount of such costs that we expect to incur and the timing thereof; the details of our exploration and development plans in each of our Cardium, Peace River, Viking and Deep Basin resource plays in 2018 and additional optimization activity in 2018; the expected lands that will be surrendered unless we qualify them in some manner; our expectations regarding when we will be required to pay income taxes; our production volume estimates for 2018; our intention to continue to actively identify and evaluate hedging opportunities in order to reduce our exposure to fluctuations in commodity prices and protect our future cash flows and capital programs; and the nature of, effectiveness of, and benefits to be derived from, our future marketing arrangements and risk management strategies.
With respect to forward-looking statements contained or incorporated by reference in this document, we have made assumptions regarding, among other things: 2018 prices of $55.00 per barrel WTI and $2.25 per Mcf AECO and a 2018 US$/Cdn$ foreign exchange rate of $1.28; that the Company does not dispose of additional material producing properties; the terms and timing of any anticipated asset dispositions or acquisitions; our ability to execute our long-term plan as described herein and in our other disclosure documents and the impact that the successful execution of such plan will have on us and our shareholders; the economic returns anticipated from expenditures on our assets; future crude oil, natural gas liquids and natural gas prices and differentials between light, medium and heavy oil prices and Canadian, WTI and world oil and natural gas prices; future capital expenditure levels and capital programs; future crude oil, natural gas liquids and natural gas production levels; the laws and regulations that we will be required to comply with, including laws and regulations relating to taxation, royalty regimes and environmental protection, and the continuance of those laws and regulations; that we will have the financial resources required to fund our capital and operating expenditures and requirements as needed; drilling results and the recoverability of our reserves; the estimates of our reserves volumes and the assumptions related thereto (including commodity prices and development costs) are accurate in all material respects; the amount of royalties, operating costs, development costs, abandonment and reclamation costs and income taxes that we will incur in connection with the production of our reserves; future exchange rates, inflation rates and interest rates; future debt levels; future income tax rates; the amount of tax pools available to us; the cost of expanding our property holdings; our ability to execute our capital programs as planned without significant adverse impacts from various factors beyond our control, including weather, infrastructure access and delays in obtaining regulatory approvals and third party consents; our ability to obtain equipment in a timely manner to carry out development activities and the costs thereof; our ability to market our oil and natural gas successfully to current and new customers; our ability to reduce our exposure to commodity price fluctuations and counterparty risks through our risk management programs; the impact of increasing competition; our ability to obtain financing on acceptable terms, that our conduct and results of operations will be consistent with expectations; our ability to add production and reserves through our development and exploitation activities;, if necessary; and that we will have the ability to develop our oil and gas properties in the manner currently contemplated. In addition, many of the forward-looking statements contained or incorporated by reference in this document are located proximate to assumptions that are specific to those forward-looking statements, and such
7
assumptions should be taken into account when reading such forward-looking statements: see in particular the assumptions identified in Appendix A-3 under Statement of Reserves Data and Other Oil and Gas Information Reserves Data and Statement of Reserves Data and Other Oil and Gas Information Notes to Reserves Data Tables.
Although Obsidian Energy believes that the expectations reflected in the forward-looking statements contained or incorporated by reference in this document, and the assumptions on which such forward-looking statements are made, are reasonable, there can be no assurance that such expectations will prove to be correct. Readers are cautioned not to place undue reliance on forward-looking statements included or incorporated by reference in this document, as there can be no assurance that the plans, intentions or expectations upon which the forward-looking statements are based will occur. By their nature, forward-looking statements involve numerous assumptions, known and unknown risks and uncertainties that contribute to the possibility that the predictions, forecasts, projections and other forward-looking statements contained herein will not be correct, which may cause our actual performance and financial results in future periods to differ materially from any estimates or projections of future performance or results expressed or implied by such forward-looking statements. These risks and uncertainties include, among other things: the possibility that we are unable to execute some or all of our ongoing asset acquisition or disposition programs on favourable terms or at all, whether due to the failure to receive requisite regulatory or other third party approvals or satisfy applicable closing conditions or for other reasons that we cannot anticipate; the possibility that we will not be able to successfully execute our long-term plan in part or in full, and the possibility that some or all of the benefits that we anticipate will accrue to us and our securityholders as a result of the successful execution of such plan do not materialize; the impact of weather conditions on seasonal demand; the impact of weather conditions on our ability to execute capital programs; the risk that we will be unable to execute our capital programs as planned without significant adverse impacts from various factors beyond our control, including weather, infrastructure access and delays in obtaining regulatory approvals and third party consents; risks inherent in oil and natural gas operations; uncertainties associated with estimating reserves and resources; competition for, among other things, capital, acquisitions of reserves, resources, undeveloped lands and skilled personnel; incorrect assessments of the value of acquisitions, including the historical acquisitions discussed herein; geological, technical, drilling and processing problems; general economic and political conditions in Canada, the U.S., Europe and globally, and in particular, the effect that those conditions have on commodity prices and our access to capital; industry conditions, including fluctuations in the price of crude oil, natural gas liquids and natural gas, price differentials for crude oil and natural gas produced in Canada as compared to other markets and transportation restrictions, including pipeline and railway capacity constraints; royalties payable in respect of our oil and natural gas production and changes to government royalty frameworks in jurisdictions in which we operate and the impact that such changes may have on us; changes in government regulation of the oil and natural gas industry, including environmental regulation; fluctuations in foreign exchange or interest rates; unanticipated operating events or environmental events that can reduce production or cause production to be shut-in or delayed, including extreme cold during winter months, wild fires and flooding; failure to obtain regulatory, industry partner and other third-party consents and approvals when required, including for acquisitions, dispositions, joint ventures, partnerships and mergers; failure to realize the anticipated benefits of dispositions, acquisitions, joint ventures and partnerships, including the historical dispositions, acquisitions, joint ventures and partnerships discussed herein; changes in taxation and other laws and regulations that affect us and our securityholders; the potential failure of counterparties to honour their contractual obligations; stock market volatility and market valuations; the ability of OPEC to control production and balance global supply and demand of crude oil at desired price levels; political uncertainty, including the risks of hostilities, in the petroleum producing regions of the world; delays in exploration and development activities if drilling and related equipment is unavailable or if access to drilling locations is restricted; the impact of pipeline interruptions and apportionments and the actions or inactions of third party operators; the possibility that we breach one or more of the financial covenants pursuant to our agreements with the syndicated banks and the holders of our senior, unsecured notes; and the other factors described under Risk Factors in this document and in Obsidian Energys public filings available in Canada at www.sedar.com and in the United States at www.sec.gov. Readers are cautioned that this list of risk factors should not be construed as exhaustive.
The forward-looking statements contained and incorporated by reference in this document speak only as of the date of this document. Except as expressly required by applicable securities laws, Obsidian Energy does not undertake any obligation to publicly update or revise any forward-looking statements, whether as a result of new information, future events or otherwise. The forward-looking statements contained and incorporated by reference in this document are expressly qualified by this cautionary statement.
8
GENERAL AND ORGANIZATIONAL STRUCTURE
General
Obsidian Energy is a corporation amalgamated under the ABCA. Obsidian Energys head and registered office is located at Suite 200, 207 9th Avenue S.W., Calgary, Alberta, T2P 1K3.
Our Organizational Structure
The following diagram sets forth the organizational structure of Obsidian Energy and its material Subsidiaries as at the date hereof.
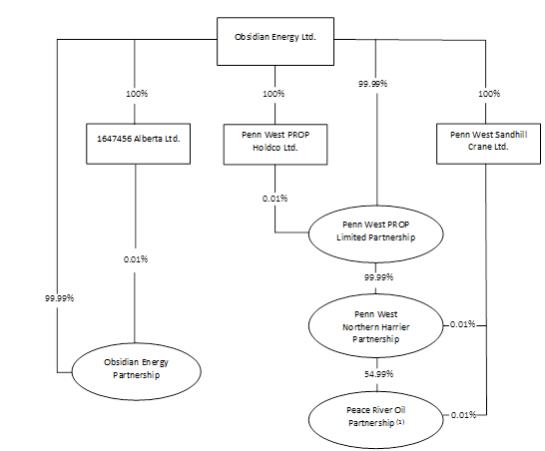
Notes:
(1) | The remaining 45% interest in Peace River Oil Partnership is owned by Winter Spark Resources, Inc., an affiliate of China Investment Corporation. |
(2) | Each of the entities identified in the diagram was incorporated, continued, formed or organized, as the case may be, under the laws of the Province of Alberta. |
9
DESCRIPTION OF OUR BUSINESS
Overview
Obsidian Energy is an intermediate-sized oil and gas producer with a well-balanced portfolio of high-quality assets based in Western Canada. Obsidian Energy is a company based on discipline, relentless passion for the work we do, and resolute accountability to our shareholders, our partners and the communities in which we operate. As at December 31, 2017, Obsidian Energy had 281 employees.
Reserves Data
See Appendices A-1, A-2 and A-3 for complete NI 51-101 oil and gas reserves disclosure for Obsidian Energy as at December 31, 2017.
General Development of the Business
The following is a description of the general development of Obsidian Energys business over the last three completed financial years.
Year Ended December 31, 2015
Board and Management Changes
Messrs. Raymond Crossley and William Friley joined the Board on March 6, 2015 and March 12, 2015, respectively. Effective March 12, 2015, Mr. Crossley was appointed as Chair of the Audit Committee and Mr. Friley was been appointed Chair of the Operations and Reserves Committee. In 2015, James Allard and James Smith retired from the Board.
In June 2015, Keith Luft (General Counsel and Senior Vice President, Corporate Services) retired from his position.
In 2015, as part of our ongoing effort to operate in a more efficient manner, the Company reduced its staffing levels by over 35 percent.
Amendments to Bank Facility and Senior Notes
In May 2015, the Company finalized amending agreements with the lenders under its syndicated bank facility and with the holders of its senior notes to, among other things, amend its financial covenants as follows:
| the maximum Senior Debt to EBITDA and Total Debt to EBITDA ratio will be less than or equal to 5:1 for the period January 1, 2015 through and including June 30, 2016, decreasing to less than or equal to 4.5:1 for the quarter ending September 30, 2016 and decreasing to less than or equal to 4:1 for the quarter ending December 31, 2016; |
| the Senior Debt to EBITDA ratio will decrease to less than or equal to 3:1 for the period from and after January 1, 2017; and |
| the Total Debt to EBITDA ratio will remain at less than or equal to 4:1 for all periods after September 30, 2016. |
The Company also agreed to the following:
| to temporarily grant floating charge security over all of its property in favor of the lenders and the noteholders on a pari passu basis, which security will be fully released upon the Company achieving both (i) a Senior Debt to EBITDA ratio of 3:1 or less for four consecutive quarters, and (ii) an investment grade rating on its senior secured debt; |
10
| to cancel the $500 million tranche of the Companys existing $1.7 billion syndicated bank facility that was set to expire on June 30, 2016, the remaining $1.2 billion tranche of the syndicated bank facility remains available to the Company in accordance with the terms of the agreements governing such facility; |
| to temporarily reduce its quarterly dividend commencing in the first quarter of 2015 to $0.01 per share or less until the earlier of (i) the Senior Debt to EBITDA being less than 3:1 for two consecutive quarters ending on or after September 30, 2015, and (ii) March 30, 2017; and |
| until March 30, 2017, to use net proceeds from any asset dispositions to repay at par $650 million of the outstanding principal amounts owing to noteholders, with corresponding pro rata amounts from such asset dispositions to be used to repay any outstanding amounts drawn under its syndicated bank facility. As at December 31, 2015, Obsidian Energy has accumulated $800 million in net proceeds from asset dispositions that it has put towards its debt prepayments and syndicated bank facility. |
2015 Capital Expenditure Budget and Production and Funds Flow Guidance
In July 2015, the Company reduced its Canadian crude oil pricing assumption for the full year 2015 to $60.00 per barrel. Consequently, the Company updated its funds flow from operations guidance range from $500 - $550 million to $350 - $400 million and the capital budget reduced from $625 million to $575 million.
In September 2015, the Company announced that in response to continued and further significant changes in the commodity price environment, and in order to maintain financial flexibility, the Companys capital budget had been reduced by approximately $75 million to $500 million, representing capital expenditures of approximately $245 million in the second half of 2015 with the revised 2015 production guideline range to be between 86,000 to 90,000 boe per day.
In November 2015, the Company refined the range of the annual production guidance to 85,000 to 87,000 boe per day. The capital budget for the year remained unchanged at $500 million.
Responding to the Commodity Price Environment
In September 2015, the Company provided an update in response to the commodity price environment which focused on limiting capital expenditures to funds flow from operation by year-end 2015, suspending the dividend, reducing board compensation and significantly reducing the cost structure though a 35 percent workforce reduction. For further details, see the Companys news release dated September 1, 2015.
Change to Quarterly Dividend Payment and NYSE Continued Listing Standard Notification
In September 2015, the Company announced a change to its quarterly dividend payment from $0.01 per Common Share to no dividend until further notice, effective after the 2015 third quarter dividend payable on October 15, 2015.
The Company also received notification from the NYSE in September 2015 that it had fallen below the NYSEs continued listing standard, which requires a minimum average closing price of US$1.00 over a consecutive 30 trading day period. The Company regained compliance at the close of trading on November 30, 2015 since the average closing price of its common stock for the consecutive 30 trading days ended November 30, 2015 and the closing price of its common stock on November 30, 2015 both exceeded US$1.00. For further details, see the Companys news release dated December 2, 2015.
Aggregate Acquisition and Disposition Activity
The Company completed non-core property dispositions of $800 million in 2015. Total production associated with the combined divestments was approximately 11,500 boe per day with production weighted approximately 20% toward natural gas. Divested assets were located in Alberta, Saskatchewan and Manitoba and represented non-core, base assets in the Companys asset portfolio which had minimal capital allocated to them in the long-term plan. The net proceeds of the dispositions were used to repay a portion of the indebtedness outstanding under our bank facility and senior notes, as agreed to in the amending agreements.
11
Year Ended December 31, 2016
2016 Capital Expenditure Budget and Production
In January 2016, the Company announced its 2016 capital budget of $50 million. This capital budget was consistent with the strategy announced on September 1, 2015, which limited the total expenditures to funds flow from operations, in response to the weak commodity price environment. The Companys average production guidance for 2016 was also set at 60,000 to 64,000 boe per day. In August 2016, the Company announced that due to the additional financial flexibility afforded the Company through the debt reduction efforts to date, that it would be resuming development in the Cardium and Alberta Viking in the second half of 2016 and therefore increasing the full year capital budget by approximately $40 million to $90 million, plus $15 million allocated to decommissioning expenditures. The Companys average production guidance for 2016 was adjusted in November 2016, due to all the disposition activities, to 52,000 to 55,000 boe per day.
NYSE Continued Listing Standard Notification
In January 2016, the Company received notification from the NYSE that it was no longer in compliance with one of the NYSEs continued listing standards applicable to us because the average closing price of our Common Shares was less than US$1.00 per share over a consecutive 30-day trading period. Under the NYSEs rules, the Company had a period of six months from the date of the NYSE notification to regain compliance with the NYSEs price listing standard and avoid delisting. The Company regained compliance at the close of trading on June 30, 2016 since the average closing price of its common stock for the consecutive 30 trading days ended June 30, 2016 and the closing price of its common stock on June 30, 2016 both exceeded US$1.00. For further details, see the Companys news release dated July 4, 2016.
Settlement of Class Action Lawsuit
In February 2016, the Company announced that it entered into agreements to settle all class action proceedings in Canada and United States against the Company related to damages alleged to have been incurred due to a decline in share price related to the restatement of certain of the Companys historical financial statements and related MD&A in 2014. The settlement agreements provide for a payment of $53 million split evenly between Canadian and US investors that will be fully funded by insurance coverage maintained by the Company. As a result, the payment would not impact the Companys cash or financial position. The settlements received the required court approval in each of Alberta, Ontario and Quebec and in New York, and all conditions to settlement have been satisfied. As a result of the approval of these settlements, there is no further exposure to the Company.
Board of Directors and Management Changes
Ms. Maureen Cormier Jackson joined the Board of Directors on March 8, 2016.
In October 2016, the Company announced that David Roberts (President and Chief Executive Officer) would be retiring from his position effective October 24, 2016 and that David French would succeed him.
In 2016, as part of our ongoing effort to operate in a more efficient manner, the Company reduced its staffing levels by over 40% percent.
12
Long Term Retention and Incentive Plan becomes Restricted Share Unit Plan
In March 2016, the Company announced that the Board had approved amendments to the Restricted Share Unit Plan (formerly the Long Term Retention and Incentive Plan) to allow for the administrators the discretion to make payments on future grants of restricted share units (formerly incentive awards) in either cash or Common Shares.
Termination of DRIP
In March 2016, the Company announced that the Board had decided to terminate the Obsidian Energys Dividend Reinvestment and Optional Common Share Purchase Plan, which had been suspended since December 2014, pursuant to the terms and conditions set forth in the plan.
Prepayment of Outstanding Debt
In September 2016, the Company offered $448 million of net proceeds received from dispositions during the year for prepayment of outstanding senior notes. The note holders accepted $437 million which was subsequently prepaid in October 2016. The remaining $11 million was used to repay indebtedness on our syndicated bank facility. This prepayment reduced the outstanding principal on our senior notes to approximately $139 million at that date, lowered the average interest rate on our debt, and reduced the number of noteholders from 36 down to two.
Aggregate Disposition Activity
The Company completed property dispositions of $1.4 billion in 2016 (including the sale of all its Saskatchewan assets for cash consideration of approximately $975 million see the Companys news release dated June 24, 2016 for further details). Total production associated with the combined divestments was approximately 30,000 boe per day with production weighted approximately 25% toward natural gas. These divested assets were located in Alberta, Saskatchewan and British Columbia and represented both non-core and core base assets in the Companys asset portfolio. The net proceeds of the dispositions were used to repay a portion of the indebtedness outstanding under our bank facility and senior notes, as agreed to in the amending agreements.
Year Ended December 31, 2017
2017 Capital Expenditure Budget and Production
In January 2017, the Company announced its 2017 capital budget of $180 million (which includes $160 million in exploration and development capital and $20 million in decommissioning expenditures) and that it anticipated 2017 average production to be between 27,000 to 29,000 boe per day. In March 2017, Obsidian Energy announced it was increasing full year 2017 production guidance to 30,500 to 31,500 boe per day as a result of retaining certain assets in the outer Cardium and central Alberta that it potentially planned to sell. In August 2017, the Company reduced it full-year capital guidance to $160 million (which includes $145 million in exploration and development capital and $15 million in decommissioning expenditures) in response to sustained weak commodity prices. The Company kept its full-year production guidance unchanged at 30,500 to 31,500 boe per day.
Reduction to Senior Secured Debt
In January 2017, the Company announced that it had reduced the capacity available under its revolving syndicated bank facility to $600 million, from $1.2 billion. The reduced facility size was more appropriate for the Company after a meaningful debt reduction program throughout 2016 and a plan to fund future capital and other expenditures through funds flow from operations. This move was expected to save the Company approximately $2.5 million annually in reduced standby fees.
13
Board of Directors and Management Changes
In January 2017, David Dyck (Senior Vice President, Chief Financial Officer) and Gregg Gegunde (Senior Vice President, Exploration, Production & Delivery) retired from their positions and David Hendry was appointed Chief Financial Officer.
In August 2017, the Companys Chair of the Board of Directors, Mr. Rick George, passed away. Mr. Gordon Ritchie joined the Board of Directors on December 1, 2017.
Aggregate Acquisition and Disposition Activity
In 2017, Obsidian Energy closed property dispositions for total proceeds of $110 million on properties located within British Columbia and the Swan Hills area of Alberta as well as certain royalty interests. Total production associated with the combined divestments was approximately 10,600 boe per day. The net proceeds of the dispositions were used to repay a portion of the indebtedness outstanding under our bank facility.
New Reserve-Based Credit Facility
In May 2017, the Company transitioned to a reserve-based syndicated revolving credit facility with a group of lenders. The credit facility had a borrowing base of $550 million, less the amount of outstanding pari passu senior notes outstanding. The initial revolving period of the credit facility ends on May 17, 2018, with an additional one year term out period, and is subject to a semi-annual borrowing base redetermination in May and November of each year.
Changes approved at the Annual General Meeting
In June 2017, in connection with the shareholder approval obtained at the annual general meeting of the Company, the Company: (i) changed its name to Obsidian Energy Ltd. and replaced its stock symbol with OBE on both the Toronto Stock Exchange and New York Stock Exchange; (ii) reduced the Companys share capital for accounting purposes; and (iii) amended the restricted share unit plan to become the Restricted and Performance Share Unit Plan which allows for, among other things, the option for the Company to make payment on certain awards through the issuance of shares through treasury, purchase of shares on the open market or through payment with cash. The Company also changed the name of the partnership from Penn West Petroleum to Obsidian Energy Partnership at the same time.
SEC Law Suit
In June 2017, the Company announced that the U.S. Securities and Exchange Commission named the Company and three of its former employees in a law suit filed in the U.S. District Court for the Southern District of New York. The SECs complaint, based on those historic practices, alleges that Penn West (now Obsidian Energy) violated statutes which include Section 10(b), 13(b), 13(b)(2)(A) and 13(b)(2)(B) of the Securities Exchange Act of 1934 and certain related rules. The complaint requests the entry of injunctive relief preventing a reoccurrence of the practices and certain financial relief. In November 2017, the Company announced it had reached a settlement with the SEC regarding the law suit. Under the terms of the settlement, the Company, without admitting or denying any of the factual allegations in the SECs Complaint, agreed to pay a penalty of US$8.5 million. In addition, the Company was enjoined from future violations of certain provisions of U.S. securities legislation. Further details of the settlement and its consequences can be found in the Companys press release dated November 15, 2017. The law suit would continue against the former Company employees named in the SEC Complaint.
NYSE Continued Listing Standard Notification
In September 2017, the Company received notification from the NYSE that it was no longer in compliance with one of the NYSEs continued listing standards applicable to us because the average closing price of our Common Shares was less than US$1.00 per share over a consecutive 30 day trading period. Under the NYSEs rules, the Company had a period of six months from the date of the NYSE notification to regain compliance with the NYSEs price listing standard and avoid delisting. The Company regained compliance at the close of trading on October 31, 2017 since the average closing price of its common stock for the consecutive 30 trading days ended October 31, 2017 and the closing price of its common stock on October 31, 2017 both exceeded US$1.00. For further details, see the Companys news release dated November 1, 2017.
14
2018 Capital Expenditure Budget and Production
In November 2017, the Company announced its 2018 capital budget of $135 million which includes $86 million associated with development and existing wellbore optimization, $25 million of infrastructure and corporate capital, $10 million of decommissioning expenditures, and $14 million of capital associated with meeting the AER Directive 84 requirements for Hydrocarbon Emission Controls and Gas Conservation in the Peace River area. The capital budget would focus on the Companys core areas of Cardium, PROP, Viking and Deep Basin. The Companys average production guidance for 2018 was also set at 31,000 to 32,000 boe per day. The Company also announced its increased hedging levels for 2018. For further details, see the Companys news release dated November 10, 2017.
2018 Developments
Board of Directors Changes
Mr. Edward H. Kernaghan joined the Board on January 3, 2018.
Mr. Jay W. Thornton was appointed as the Chair of the Board of Directors on February 22, 2018, replacing Mr. George Brookman who had been Acting Chair of the Board of Directors.
2018 Production Guidance and Disposition Activity
In January 2018, the Company closed an agreement to dispose of a significant portion of its non-core legacy assets located in central Alberta, in exchange for the assumption of abandonment and reclamation liabilities. Total production associated with the disposition is 2,200 boe per day. Additionally, the Company revised its average production guidance for 2018 to 29,000 to 30,000 boe per day.
Ongoing Acquisition, Disposition, Farm-Out and Financing Activities
Potential Acquisitions
Obsidian Energy continues to evaluate potential acquisitions of all types of petroleum and natural gas and other energy-related assets as part of its ongoing asset portfolio management program. At times, Obsidian Energy could be in the process of evaluating several potential acquisitions which individually or in the aggregate could be material. As of the date hereof, Obsidian Energy has not reached agreement on the price or terms of any potential material acquisitions. Obsidian Energy cannot predict whether any current or future opportunities will result in one or more acquisitions for Obsidian Energy.
Potential Dispositions and Farm-Outs
Obsidian Energy continues to evaluate potential dispositions of its petroleum and natural gas assets as part of its ongoing portfolio asset management program.
In addition, Obsidian Energy continues to consider potential farm-out opportunities with other industry participants in respect of its petroleum and natural gas assets in circumstances where Obsidian Energy believes it is prudent to do so based on, among other things, its capital program, development plan timelines and the risk profile of such assets. Obsidian Energy is normally in the process of evaluating several potential dispositions of its assets and farm-out opportunities at any one time, which individually or in the aggregate could be material. As of the date hereof, Obsidian Energy has not reached agreement on the price or terms of any potential material dispositions or farm-outs. Obsidian Energy cannot predict whether any current or future opportunities will result in one or more dispositions or farm-outs for Obsidian Energy.
15
Potential Financings
Obsidian Energy continuously evaluates its capital structure, liquidity and capital resources, and financing opportunities that arise from time to time. Obsidian Energy may in the future complete financings of Common Shares or debt (including debt which may be convertible into Common Shares) for purposes that may include the financing of acquisitions, the financing of Obsidian Energys operations and capital expenditures, and the repayment of indebtedness. As of the date hereof, Obsidian Energy has not reached agreement on the pricing or terms of any potential material financing. Obsidian Energy cannot predict whether any current or future financing opportunity will result in one or more material financings being completed.
Significant Acquisitions
Obsidian Energy did not complete an acquisition during its most recently completed financial year that was a significant acquisition for the purposes of Part 8 of National Instrument 51-102.
CAPITALIZATION OF OBSIDIAN ENERGY
Share Capital
The authorized capital of Obsidian Energy consists of an unlimited number of Common Shares without nominal or par value and 90,000,000 preferred shares without nominal or par value. A description of the share capital of Obsidian Energy is set forth below. This description is a summary only. Shareholders are encouraged to read the full text of such share provisions, which are available on SEDAR at www.sedar.com.
Common Shares
Shareholders are entitled to notice of, to attend and to one vote per Common Share held at any meeting of the shareholders of Obsidian Energy (other than meetings of a class or series of shares of Obsidian Energy other than the Common Shares).
Shareholders are entitled to receive dividends as and when declared by the Board of Directors on the Common Shares as a class, subject to prior satisfaction of all preferential rights to dividends attached to shares of other classes of shares of Obsidian Energy ranking in priority to the Common Shares in respect of dividends.
The holders of Common Shares are entitled in the event of any liquidation, dissolution or winding-up of Obsidian Energy, whether voluntary or involuntary, or any other distribution of the assets of Obsidian Energy among its Shareholders for the purpose of winding-up its affairs, and subject to prior satisfaction of all preferential rights to return of capital on dissolution attached to all shares of other classes of shares of Obsidian Energy ranking in priority to the Common Shares in respect of return of capital on dissolution, to share rateably, together with the holders of shares of any other class of shares of Obsidian Energy ranking equally with the Common Shares in respect of return of capital on dissolution, in such assets of Obsidian Energy as are available for distribution.
As at March 6, 2018, 504,340,988 Common Shares were issued and outstanding.
Preferred Shares
Preferred shares of Obsidian Energy may at any time or from time to time be issued in one or more series. Before any shares of a particular series are issued, the Board shall, by resolution, fix the number of shares that will form such series and shall, subject to the limitations set out in Obsidian Energys articles, by resolution fix the designation, rights, privileges, restrictions and conditions to be attached to the preferred shares of such series, including, but without in any way limiting or restricting the generality of the foregoing, the rate, amount or method of calculation of dividends thereon, the time and place of payment of dividends, the consideration for and the terms and conditions of any purchase for cancellation, retraction or redemption thereof, conversion or exchange rights (if any), and whether into or for securities of Obsidian Energy or otherwise, voting rights
16
attached thereto (if any), the terms and conditions of any share purchase or retirement plan or sinking fund, and restrictions on the payment of dividends on any shares other than preferred shares or payment in respect of capital on any shares in the capital of Obsidian Energy or creation or issue of debt or equity securities; the whole subject to filing of Articles of Amendment setting forth a description of such series, including the designation, rights, privileges, restrictions and conditions attached to the shares of such series. Notwithstanding the foregoing, other than in the case of a failure to declare or pay dividends specified in any series of preferred shares, the voting rights attached to the preferred shares shall be limited to one vote per preferred share at any meeting where the preferred shares and Common Shares vote together as a single class.
As at the date hereof, no preferred shares are issued and outstanding.
Debt Capital
Obsidian Energy has issued the Senior Notes and has a syndicated credit facility. A description of the debt capital of Obsidian Energy is set forth below. This description is a summary only. Shareholders are encouraged to read the full text of the agreements governing Obsidian Energys Senior Notes and credit facility, which are available on SEDAR at www.sedar.com.
Senior Notes
Obsidian Energy has issued the Senior Notes, which consist of US$84 million principal amount of notes. The Senior Notes are guaranteed by Obsidian Energys material subsidiaries, are secured and rank equally with our bank credit facilities. The following is a brief summary of certain of the material terms of each series of our Senior Notes.
Series |
Currency / Principal Amount |
Interest Rate | Issue Date | Maturity Date | ||||||
Series C |
US$5 million | 5.90 | % | May 31, 2007 | May 31, 2019 | |||||
Series F |
US$24 million | 6.30 | % | May 29, 2008 | May 29, 2018 | |||||
Series G |
US$4 million | 6.40 | % | May 29, 2008 | May 29, 2020 | |||||
Series L |
US$8 million | 9.32 | % | May 5, 2009 | May 5, 2019 | |||||
Series S |
US$10 million | 5.85 | % | March 16, 2010 | March 16, 2020 | |||||
Series X |
US$13 million | 4.88 | % | December 2, 2010 and January 4, 2011 |
December 2, 2020 | |||||
Series Y |
US$6 million | 4.98 | % | December 2, 2010 | December 2, 2022 | |||||
Series Z |
US$2 million | 5.23 | % | December 2, 2010 and January 4, 2011 |
December 2, 2025 | |||||
Series DD |
US$0.2 million | 4.23 | % | November 30, 2011 | November 30, 2018 | |||||
Series EE |
US$12 million | 4.79 | % | November 30, 2011 | November 30, 2021 |
17
Credit Facility
In May 2017, the Company transitioned to a reserve-based syndicated revolving credit facility with a group of lenders. The credit facility has a borrowing base of $550 million, less the amount of outstanding pari passu senior notes and outstanding pound sterling cross currency swap. The initial revolving period of the credit facility ends on May 17, 2018, with an additional one year term out period, and is subject to a semi-annual borrowing base redetermination in May and November of each year.
Additional Information
For additional information regarding our Senior Notes and our credit facility, see Description of Our Business General Development of the Business Year Ended December 31, 2015, Year Ended December 31, 2016, Year Ended December 31, 2017 Developments and 2018 Development in this Annual Information Form, Note 8 to our audited consolidated financial statements for the year ended December 31, 2017 (collectively, the Financial Statement Disclosure), and Financing and Liquidity and Capital Resources in our related MD&A (collectively, the MD&A Disclosure), both of which are available on SEDAR at www.sedar.com. The Financial Statement Disclosure and the MD&A Disclosure are both incorporated by reference into this Annual Information Form.
DIRECTORS AND EXECUTIVE OFFICERS OF OBSIDIAN ENERGY
The following table sets forth, as at March 6, 2018, the name, province and country of residence and positions and offices held for each of the directors and executive officers of Obsidian Energy, together with their principal occupations during the last five years. The directors of Obsidian Energy will hold office until the next annual meeting of Shareholders or until their respective successors have been duly elected or appointed.
18
Name, Province and Country of Residence |
Positions and Offices Held with Obsidian Energy |
Principal Occupations during the Five Preceding Years | ||
George H. Brookman(2)(4) Alberta, Canada |
Director since August 3, 2005 | Chief Executive Officer of West Canadian Industries Group Inc. (a digital printing and document management company). | ||
John Brydson(1)(3) Connecticut, United States |
Director since June 4, 2014 | Private investor since 2012. From 2010 until the end of 2012, Chairman of Hestan Consulting Group, a full-service management consulting firm that he founded. Prior thereto, a Managing Director with Credit Suisse First Boston (now Credit Suisse). | ||
Raymond Crossley(1)(4) Alberta, Canada |
Director since March 6, 2015 | Partner with PricewaterhouseCoopers LLP from 1996 until his retirement in March 2015, serving as the Managing Partner, Western Canada, from 2011 to 2013. Currently a director of Pure Technologies Ltd. and the Canada West Foundation. | ||
David L. French Alberta, Canada |
Director, President and Chief Executive Officer since October 24, 2016 | President and Chief Executive Officer of Obsidian Energy since October 2016. Prior thereto, President and Chief Executive Officer of Bankers Petroleum Ltd. from April 2013 to October 2016. Vice-President, Business Development of Apache Corporation, January 2010 to April 2013. | ||
William A. Friley(2)(3) Alberta, Canada |
Director since March 12, 2015 | President and CEO of Telluride Oil and Gas Ltd. and Skyeland Oils Ltd. On the board of directors of: OSUM Oil Sands Corp. (as the Chairman), Titan Energy Services, and Advanced Flow Technologies. He is also now the Chairman Emeritus to the Alberta Region board of the Nature Conservancy of Canada. | ||
Maureen Cormier Jackson(1)(2) Alberta, Canada |
Director since March 8, 2016 | Independent businesswoman with over 35 years of executive, financial and operational expertise in the oil and gas industry. From 2012 and until her retirement in 2014, was Senior Vice President, Chief Process and Information Officer at Suncor Energy Inc. (Suncor). Her career spanned numerous roles at Suncor which provided experience in the areas of accounting and financial controls, environment, health and safety, and project management. Is also a director of Enerflex Ltd., the Founding Chair of the Wood Buffalo Community Foundation and serves on the Deans Advisory Board of Dean of Medicine at the University of Calgary. She was previously a director of a privately-owned family business for more than 15 years and has been involved in several non-profit organizations in various capacities during her career. Is a Chartered Professional Accountant and holds a Bachelor of Commerce from Memorial University. She also holds an ICD.D designation from the Institute of Corporate Directors. |
19
Name, Province and Country of Residence |
Positions and Offices Held with Obsidian Energy |
Principal Occupations during the Five Preceding Years | ||
Edward H. Kernaghan(3)(4) Ontario, Canada |
Director since January 3, 2018 | Mr. Kernaghan holds a Master of Science Degree from the University of Toronto. He is Senior Investment Advisor of Kernaghan & Partners Ltd., a brokerage firm. Mr. Kernaghan is also President of Principia Research Inc., a research and investment company, and of Kernwood Ltd., an investment holding company. | ||
Gordon Ritchie(1)(2) Alberta, Canada |
Director since December 1, 2017 | Retired as Vice Chairman of RBC Capital Markets April 1, 2016 after 37 years with RBC. Previously, Mr. Ritchie served as Managing Director and Head of RBCs Global E&P Energy Group, from 2000 to 2005; spent six years in New York where he served as President and Chief Executive Officer of RBCs U.S. Broker/Dealer, RBC Dominion Securities Corporation, from 1993 to 1999; served as Managing Director of RBCs International Corporate Finance Group based in London, England, from 1989 to 1993; and worked as Investment Banker and Energy Research Analyst in Calgary, from 1979 through 1988. | ||
Jay W. Thornton(3)(4) Alberta, Canada |
Chairman of the Board and Director since June 26, 2013 | Mr. Thornton has over 27 years of oil and gas experience. Mr. Thornton held various operating and corporate executive positions with Shell Canada and Suncor Energy Inc. He is currently a director of North American Energy Partners Inc. and Tervita corporation, and previously a director with the Canadian Association of Petroleum Producers (CAPP). He is a graduate of McMaster university with an Honours degree in Economics. He is also completed the Institute of Corporate Directors (ICD) Education Program. | ||
David Hendry Alberta, Canada |
Chief Financial Officer | Chief Financial Officer of Obsidian Energy since January 2017. Prior thereto, Vice President Finance at Obsidian Energy from May 2015 until December 2016. Prior thereto, Vice President Finance at Talisman Energy Inc. from May 2006 to April 2015. |
Notes:
(1) | Member of the Audit Committee. |
(2) | Member of the Human Resources and Compensation Committee. |
(3) | Member of the Operations and Reserves Committee. |
(4) | Member of the Governance Committee. |
20
As at the date hereof, the directors and executive officers of Obsidian Energy, as a group, beneficially owned, or controlled or directed, directly or indirectly, approximately 3.7 million Common Shares, or less than one percent of the issued and outstanding Common Shares.
Cease Trade Orders, Bankruptcies, Penalties or Sanctions
To the knowledge of Obsidian Energy, except as otherwise set forth herein, no director or executive officer of Obsidian Energy (nor any personal holding company of any of such persons) is, as of the date of this Annual Information Form, or was within ten years before the date of this Annual Information Form, a director, Chief Executive Officer or Chief Financial Officer of any company (including Obsidian Energy), that:
(a) | was subject to a cease trade order (including a management cease trade order), an order similar to a cease trade order or an order that denied the relevant company access to any exemption under securities legislation, in each case that was in effect for a period of more than 30 consecutive days (collectively, an Order) that was issued while the director or executive officer was acting in the capacity as director, Chief Executive Officer or Chief Financial Officer; or |
(b) | was subject to an Order that was issued after the director or executive officer ceased to be a director, Chief Executive Officer or Chief Financial Officer and which resulted from an event that occurred while that person was acting in the capacity as director, Chief Executive Officer or Chief Financial Officer. |
On July 29, 2014, Penn West announced that the Audit Committee of the Board was conducting a voluntary, internal review of certain of the Companys accounting practices and that certain of the Companys historical financial statements and related MD&A must be restated, which might result in the release of its second quarter 2014 financial results being delayed (which ultimately proved to be the case). Furthermore, the Company advised that its historical financial statements and related audit reports and MD&A should not be relied on. As a result, the Alberta Securities Commission issued a Management Cease Trade Order on August 5, 2014 (the ASC MCTO) against Messrs. Brookman, Brydson, and Thornton. On September 18, 2014, Penn West filed restated audited annual financial statements for the years ended December 31, 2013 and 2012, restated unaudited interim financial statements for the three months ended March 31, 2014 and 2013, restated MD&A for the year ended December 31, 2013 and the quarter ended March 31, 2014, and related amended documents. Penn West also filed its unaudited interim financial statements for the three and six month periods ended June 30, 2014 and 2013 and the related MD&A and management certifications. The ASC MCTO was revoked on September 23, 2014.
To the knowledge of Obsidian Energy, no director or executive officer of Obsidian Energy or shareholder holding a sufficient number of securities of Obsidian Energy to affect materially the control of Obsidian Energy (nor any personal holding company of any of such persons):
(a) | is, as of the date of this Annual Information Form, or has been within the ten years before the date of this Annual Information Form, a director or executive officer of any company (including Obsidian Energy) that, while that person was acting in that capacity, or within a year of that person ceasing to act in that capacity, became bankrupt, made a proposal under any legislation relating to bankruptcy or insolvency or was subject to or instituted any proceedings, arrangement or compromise with creditors or had a receiver, receiver manager or trustee appointed to hold its assets; or |
(b) | has, within the ten years before the date of this Annual Information Form, become bankrupt, made a proposal under any legislation relating to bankruptcy or insolvency, or become subject to or instituted any proceedings, arrangement or compromise with creditors, or had a receiver, receiver manager or trustee appointed to hold the assets of the director, executive officer or shareholder. |
To the knowledge of Obsidian Energy, no director or executive officer of Obsidian Energy or shareholder holding a sufficient number of securities of Obsidian Energy to affect materially the control of Obsidian Energy (nor any personal holding company of any of such persons), has been subject to:
(a) | any penalties or sanctions imposed by a court relating to securities legislation or by a securities regulatory authority or has entered into a settlement agreement with a securities regulatory authority; or |
21
(b) | any other penalties or sanctions imposed by a court or regulatory body that would likely be considered important to a reasonable investor in making an investment decision; |
provided that for the purposes of the foregoing, a late filing fee, such as a filing fee that applies to the late filing of an insider report, is not considered to be a penalty or sanction.
Conflicts of Interest
The Board of Directors approved an amendment to the Code of Business Conduct and Ethics (the Code) in July of 2015 which made the Code the applicable policy in regard to conflicts of interest (whereas previously there was also the Code of Ethics for Directors, Officers and Senior Financial Management). In general, the private investment activities of employees, directors and officers are not prohibited; however, should an existing investment pose a potential conflict of interest, the potential conflict is required by the Code to be disclosed to an officer or a member of Obsidian Energys legal department or to the Board of Directors. Any other activities posing a potential conflict of interest are also required by the Code to be disclosed to an officer or to a member of Obsidian Energys legal department. Any such potential conflicts of interests will be dealt with openly with full disclosure of the nature and extent of the potential conflicts of interests with Obsidian Energy. It is acknowledged in the Code that the directors may be directors or officers of other entities engaged in the oil and gas business, and that such entities may compete directly or indirectly with Obsidian Energy. Passive investments in public or private entities of less than one per cent of the outstanding shares will not be viewed as competing with Obsidian Energy. No executive officer or employee of Obsidian Energy should be a director, employee, contractor, consultant or officer of any entity that is or may be in competition with Obsidian Energy unless expressly authorized by an executive officer or the Board of Directors. Any director of Obsidian Energy who is a director or officer of, or who is otherwise actively engaged in the management of, or who owns an investment of one per cent or more of the outstanding shares, in public or private entities shall disclose such holding to the Board of Directors. In the event that any circumstance should arise as a result of such positions or investments being held or otherwise which in the opinion of the Board of Directors constitutes a conflict of interest which reasonably affects such persons ability to act with a view to the best interests of Obsidian Energy, the Board of Directors will take such actions as are reasonably required to resolve such matters with a view to the best interests of Obsidian Energy. Such actions, without limitation, may include excluding such directors, officers or employees from certain information or activities of Obsidian Energy.
The ABCA provides that in the event that an officer or director is a party to, or is a director or an officer of, or has a material interest in any person who is a party to, a material contract or material transaction or proposed material contract or proposed material transaction, such officer or director shall disclose the nature and extent of his or her interest and shall refrain from voting to approve such contract or transaction.
As of the date hereof, Obsidian Energy is not aware of any existing or potential material conflicts of interest between Obsidian Energy or a Subsidiary of Obsidian Energy and any director or officer of Obsidian Energy or of any Subsidiary of Obsidian Energy.
Promoters
No person or company has been, within the two most recently completed financial years or during the current financial year, a promoter (as defined in the Securities Act (Ontario)) of Obsidian Energy or of a Subsidiary of Obsidian Energy.
22
AUDIT COMMITTEE DISCLOSURES
National Instrument 52-110 Audit Committees (NI 52-110) relating to audit committees has mandated certain disclosures for inclusion in this Annual Information Form. The text of the Audit Committees mandate is attached as Appendix B to this Annual Information Form.
Composition of the Audit Committee and Relevant Education and Experience
As of the date hereof, the members of the Audit Committee are Raymond Crossley (Chairman), John Brydson, Maureen Cormier Jackson and Gordon Ritchie, each of whom is independent and financially literate within the meaning of NI 52-110. The following comprises a brief summary of each members education and experience that is relevant to the performance of his or her responsibilities as an Audit Committee member.
John Brydson
Mr. Brydson has over 30 years of experience in the financial sector and has occupied senior roles in both major investment and commercial banks. Since 2012, Mr. Brydson has been a private investor. From 2010 until the end of 2012, he was Chairman of a small full-service management consulting firm, Hestan Consulting Group (HCG), which he founded. Prior to HCG, Mr. Brydson was a Managing Director with Credit Suisse First Boston, now Credit Suisse (CS), from 1995 until 2009, where he was in charge of the Multi-Product Event Trading group. He was also a Managing Director with Lehman Brothers in a similar function from 1983 until he joined CS. The early years of his career were spent as an equity analyst before joining Chase Manhattan Bank (Chase) in London in 1977. He transferred to the head office in New York in 1980 where he became a Vice President in the Project Finance Group, specializing in international projects in the energy, mining and metals sectors. He left Chase to join Lehman Brothers in 1983. Mr. Brydson holds an Honors Degree in Economics from Heriot-Watt University in Edinburgh, Scotland. Mr. Brydson served over 10 years as the President and a Board Member of The American Friends of Heriot-Watt University, a charitable organization, and remains on its Board.
Maureen Cormier Jackson
Ms. Cormier Jackson is an independent businesswoman with over 35 years of executive, financial and operational expertise in the oil and gas industry. From 2012 and until her retirement in 2014, Ms. Cormier Jackson was Senior Vice President, Chief Process and Information Officer at Suncor Energy Inc. (Suncor). Her career spanned numerous roles at Suncor which provided experience in the areas of accounting and financial controls, environment, health and safety, and project management. Ms. Cormier Jackson is also a director of Enerflex Ltd., the Founding Chair of the Wood Buffalo Community Foundation and serves on the Deans Advisory Board of Dean of Medicine at the University of Calgary. She was previously a director of a privately-owned family business for more than 15 years and has been involved in several non-profit organizations in various capacities during her career. Ms. Cormier Jackson is a Chartered Professional Accountant and holds a Bachelor of Commerce from Memorial University. She also holds an ICD.D designation from the Institute of Corporate Directors.
Raymond Crossley (Chairman)
Mr. Crossley is a corporate director. He serves as chair of the audit committee of Pure Technologies Ltd. Mr. Crossley has served as a member of the Financial Review Committee of the Alberta Securities Commission (ASC) and has been a member of the Financial Advisory Committee of the ASC. Mr. Crossley retired in 2015 from the accounting firm of PricewaterhouseCoopers (PwC) after serving for more than 33 years. He joined the firm in 1981 and had been a partner since 1996, working with a number of large publicly traded corporations operating in the natural resource and utilities sectors. Mr. Crossley served as an elected member of the Partnership Board (PwCs governing body), from 2001-2005. From 2005-2011, Mr. Crossley was the Managing Partner of PwCs Calgary office. From 2011-2013 Mr. Crossley acted as Managing Partner, Western Canada. Mr. Crossley is a member of the Chartered Professional Accountants of Alberta. He graduated from the University of Western Ontario with a degree in Economics and Political Science.
23
Gordon Ritchie
Mr. Ritchie retired in 2016, following a career spanning over 37 years with RBC Capital Markets LLC. From 2005 through 2016, Mr. Ritchie served as Vice Chairman, with primary responsibility for many of RBCs top energy clients. During this period, Mr. Ritchie led teams completing many of the largest energy M&A and financing transactions in Canada, aggregating in excess of $200 billion. From 2000 through 2005, served as Managing Director and Head of the Global E&P Energy Group. Before that, Mr. Ritchie spent six years in New York where he served as President and Chief Executive Officer of RBCs U.S. Broker/Dealer Operations (1993 to 1999); was Managing Director of RBCs International Corporate Finance Group based in London, England (1989 to 1993); was Vice President, Corporate Finance in Calgary (1984 to 1988); and Energy Research Analyst (1979 to 1983). Throughout his career, Mr. Ritchie gained extensive experience in research and investment banking in Europe, the United States and Canada. Mr. Ritchie holds an MBA from the University of Western Ontario and a Bachelor of Arts (Economics) from the University of Alberta.
Pre-Approval Policies and Procedures for Audit and Non-Audit Services
The terms of the engagement of Obsidian Energys external auditors to provide audit services, including the budgeted fees for such audit services and the representations and disclaimer relating thereto, must be pre-approved by the entire Audit Committee.
With respect to any engagements of Obsidian Energys external auditors for non-audit services, Obsidian Energy must obtain the approval of the Audit Committee or the Chairman of the Audit Committee prior to retaining the external auditors to complete such engagement. If such pre-approval is provided by the Chairman of the Audit Committee, the Chairman must report to the Audit Committee on any non-audit service engagement pre-approved by him at the Audit Committees first scheduled meeting following such pre-approval. The fees for such non-audit services shall not exceed $50,000, either individually or in the aggregate, for a particular financial year without the approval of the Audit Committee.
If, after using its reasonable best efforts, Obsidian Energy is unable to contact the Chairman of the Audit Committee on a timely basis to obtain the pre-approval contemplated by the preceding paragraph, Obsidian Energy may obtain the required pre-approval from any other member of the Audit Committee, provided that any such Audit Committee member shall report to the Audit Committee on any non-audit service engagement pre-approved by him or her at the Audit Committees first scheduled meeting following such pre-approval and the fees for such services do not exceed $50,000 as noted above.
External Auditor Service Fees
The following table summarizes the fees billed to Obsidian Energy and Ernst & Young for external audit and other services during the periods indicated.
Year |
Audit Fees(1) ($) |
Audit-Related Fees(2) ($) |
Tax Fees(3) ($) |
|||||||||
2017 |
811,000 | 39,000 | 16,000 | |||||||||
2016 |
992,000 | 75,750 | 5,800 |
Notes:
(1) | The aggregate fees billed by our external auditor in each of the last two fiscal years for audit services, including fees for the integrated audit of Obsidian Energys annual financial statements or services that are normally provided in connection with statutory and regulatory filings or engagements, reviews in connection with acquisitions and Sarbanes-Oxley Act related services, and review procedures on the unaudited interim consolidated financial statements. |
(2) | The aggregate fees billed in each of the last two fiscal years by our external auditor for assurance and related services that are reasonably related to the performance of the audit or review of our financial statements (and not included in audit services fees in note (1)). The services comprising the fees disclosed under this category principally consisted of Obsidian Energys portion of fees for the Peace River Oil Partnership audit. |
(3) | The aggregate fees billed in the applicable fiscal year by our external auditor for professional services for tax compliance, tax advice and tax planning. |
24
Reliance on Exemptions
At no time since the commencement of Obsidian Energys most recently completed financial year has Obsidian Energy relied on any of the exemptions contained in Sections 2.4, 3.2, 3.4 or 3.5 of NI 52-110, or an exemption from NI 52-110, in whole or in part, granted under Part 8 thereof. In addition, at no time since the commencement of Obsidian Energys most recently completed financial year has Obsidian Energy relied upon the exemptions in Subsection 3.3(2) or Section 3.6 of NI 52-110. Furthermore, at no time since the commencement of Obsidian Energys most recently completed financial year has Obsidian Energy relied upon Section 3.8 of NI 52-110.
Audit Committee Oversight
At no time since the commencement of Obsidian Energys most recently completed financial year has a recommendation of the Audit Committee to nominate or compensate an external auditor not been adopted by the Board of Directors.
DIVIDENDS AND DIVIDEND POLICY
Dividend Policy
In September 2015, the Board of Directors adopted a no dividend policy (effective after the 2015 third quarter payment of $0.01 per Common Share on October 15, 2015) until further notice.
Depending on the foregoing factors and any other factors that the Board deems relevant from time to time, many of which are beyond the control of our Board and management team, the Board may change our dividend policy following any such quarterly review or at any other time that the Board deems appropriate. See Risk Factors.
The credit agreement governing our syndicated credit facility and each of the note purchase agreements governing our Senior Notes also contain provisions which restrict our ability to pay dividends to Shareholders in the event of the occurrence of certain events of default. The full text of the agreements governing our credit facility and our Senior Notes is available on SEDAR at www.sedar.com. For additional information regarding our credit facility and our Senior Notes, see Capitalization of Obsidian Energy Debt Capital.
Dividends Declared Payable to Shareholders of Obsidian Energy
During the financial years ended December 31, 2015, 2016 and 2017, Obsidian Energy declared payable the following amount of cash dividends per Common Share:
Quarter |
2017 Dividends Declared Payable ($) |
2016 Dividends Declared Payable ($) |
2015 Dividends Declared Payable ($) |
|||||||||
First Quarter |
| | 0.01 | |||||||||
Second Quarter |
| | 0.01 | |||||||||
Third Quarter |
| | 0.01 | |||||||||
Fourth Quarter |
| | | |||||||||
|
|
|
|
|
|
|||||||
Total |
| | 0.03 |
In September 2015, Obsidian Energy announced a change to its quarterly dividend payment from $0.01 per Common Share to no dividend per Common Share (effective after the 2015 third quarter payment of $0.01 per Common Share on October 15, 2015) until further notice.
25
MARKET FOR SECURITIES
Trading Price and Volume
The following tables set forth certain trading information for the Common Shares in 2017 as reported by the TSX and the NYSE.
TSX | ||||||||||||
Period |
Common Share price ($) High |
Common Share price ($) Low |
Volume | |||||||||
January |
2.72 | 2.20 | 57,818,880 | |||||||||
February |
2.35 | 2.06 | 32,768,733 | |||||||||
March |
2.32 | 1.92 | 46,626,667 | |||||||||
April |
2.36 | 1.95 | 35,962,901 | |||||||||
May |
2.24 | 1.81 | 54,112,820 | |||||||||
June |
1.96 | 1.56 | 59,005,656 | |||||||||
July |
1.69 | 1.35 | 28,321,704 | |||||||||
August |
1.49 | 1.03 | 25,362,009 | |||||||||
September |
1.40 | 1.17 | 18,315,838 | |||||||||
October |
1.42 | 1.23 | 28,879,396 | |||||||||
November |
1.85 | 1.41 | 57,563,150 | |||||||||
December |
1.72 | 1.47 | 28,256,891 | |||||||||
NYSE | ||||||||||||
Period |
Common Share price ($US) High |
Common Share price ($US) Low |
Volume | |||||||||
January |
2.05 | 1.68 | 43,161,229 | |||||||||
February |
1.80 | 1.57 | 29,410,963 | |||||||||
March |
1.74 | 1.42 | 37,638,509 | |||||||||
April |
1.76 | 1.43 | 25,719,086 | |||||||||
May |
1.64 | 1.34 | 27,767,480 | |||||||||
June |
1.46 | 1.17 | 37,041,648 | |||||||||
July |
1.29 | 1.06 | 28,029,295 | |||||||||
August |
1.20 | 0.82 | 40,321,047 | |||||||||
September |
1.12 | 0.97 | 19,034,426 | |||||||||
October |
1.11 | 0.95 | 29,103,019 | |||||||||
November |
1.44 | 1.08 | 52,196,064 | |||||||||
December |
1.35 | 1.15 | 31,645,648 |
Prior Sales
Other than incentive securities issued pursuant to Obsidian Energys director and employee compensation plans and the Senior Notes, Obsidian Energy does not have any classes of securities that are outstanding but that are not listed or quoted on a market place.
26
Escrowed Securities and Securities Subject to Contractual Restriction on Transfer
To Obsidian Energys knowledge, no securities of Obsidian Energy are held in escrow, are subject to a pooling agreement, or are subject to a contractual restriction on transfer (except in respect of pledges made to lenders and except in respect of incentive securities issued pursuant to Obsidian Energys director and employee compensation plans).
INDUSTRY CONDITIONS
Companies carrying on business in the crude oil and natural gas sector in Canada are subject to extensive controls and regulations imposed through legislation of the federal government and the provincial governments where the companies have assets or operations. While these regulations do not affect the Corporations operations in any manner that is materially different than they affect other similarly-sized industry participants with similar assets and operations, investors should consider such regulations carefully. Although governmental legislation is a matter of public record, the Corporation is unable to predict what additional legislation or amendments governments may enact in the future.
The Corporation holds interests in crude oil and natural gas properties, along with related assets, primarily in the Canadian province of Alberta. The Corporations assets and operations are regulated by administrative agencies deriving authority from underlying legislation. Regulated aspects of the Corporations upstream crude oil and natural gas business include all manner of activities associated with the exploration for and production of crude oil and natural gas, including, among other matters: (i) permits for the drilling of wells; (ii) technical drilling and well requirements; (iii) permitted locations and access of operation sites; (iv) operating standards regarding conservation of produced substances and avoidance of waste, such as restricting flaring and venting; (v) minimizing environmental impacts; (vi) storage, injection and disposal of substances associated with production operations; and (vii) the abandonment and reclamation of impacted sites. In order to conduct crude oil and natural gas operations and remain in good standing with the applicable provincial regulatory scheme, producers must comply with applicable legislation, regulations, orders, directives and other directions (all of which are subject to governmental oversight, review and revision, from time to time). Compliance in this regard can be costly and a breach of the same may result in fines or other sanctions.
The discussion below outlines certain pertinent conditions and regulations that impact the crude oil and natural gas industry in Western Canada, particularly in the province of Alberta where substantially all of the Corporations reserves and resources were located at December 31, 2017.
Pricing and Marketing in Canada
Crude Oil
Producers of crude oil are entitled to negotiate sales contracts directly with crude oil purchasers, which results in the market determining the price of crude oil. Worldwide supply and demand factors primarily determine crude oil prices; however, regional market and transportation issues also influence prices. The specific price depends, in part, on crude oil quality, prices of competing fuels, distance to market, availability of transportation, value of refined products, supply/demand balance and contractual terms of sale.
Natural Gas
The price of natural gas sold in intra-provincial, interprovincial and international trade is determined by negotiation between buyers and sellers. The price received by a natural gas producer depends, in part, on the price of competing natural gas supplies and other fuels, natural gas quality, distance to market, availability of transportation, length of contract term, weather conditions, supply/demand balance and other contractual terms. Spot and future prices can also be influenced by supply and demand fundamentals on various trading platforms.
27
Natural Gas Liquids (NGLs)
The price of condensate and other natural gas liquids such as ethane, butane and propane sold in intra-provincial, interprovincial and international trade is determined by negotiation between buyers and sellers. Such price depends, in part, on the quality of the NGLs, price of competing chemical stock, distance to market, access to downstream transportation, length of contract term, supply/demand balance and other contractual terms.
Exports from Canada
Crude oil, natural gas and NGLs exports from Canada are subject to the National Energy Board Act (Canada) (the NEB Act) and the National Energy Board Act Part VI (Oil and Gas) Regulation (the Part VI Regulation). The NEB Act and the Part VI Regulation authorize crude oil, natural gas and NGLs exports under either short-term orders or long-term licences. To obtain a crude oil export licence, a mandatory public hearing with the National Energy Board (the NEB) is required, which is no longer the case for natural gas and NGLs. For natural gas and NGLs, the NEB uses a written process that includes a public comment period for impacted persons. Following the comment period, the NEB completes its assessment of the application and either approves or denies the application. For natural gas, the maximum duration of an export licence is 40 years and, for crude oil and other gas substances (e.g. NGLs), the maximum term is 25 years. All crude oil, natural gas and NGLs licences require the approval of the cabinet of the Canadian federal government.
Orders from the NEB provide a short-term alternative to export licences and may be issued more expediently, since they do not require a public hearing or approval from the cabinet of the Canadian federal government. Orders are issued pursuant to the Part VI Regulation for up to one or two years depending on the substance, with the exception of natural gas (other than NGLs) for which an order may be issued for up to twenty years for quantities not exceeding 30,000 m3 per day.
As to price, exporters are free to negotiate prices and other terms with purchasers, provided that the export contracts continue to meet certain other criteria prescribed by the NEB and the federal government. The Corporation does not directly enter into contracts to export its production outside of Canada.
As discussed in more detail below, one major constraint to the export of crude oil, natural gas and NGLs outside of Canada is the deficit of overall pipeline and other transportation capacity to transport production from Western Canada to the United States and other international markets. Although certain pipeline or other transportation projects are underway, many contemplated projects have been cancelled or are delayed due to regulatory hurdles, court challenges and economic and political factors. The transportation capacity deficit is not likely to be resolved quickly given the significant length of time required to complete major pipeline or other transportation projects once all regulatory and other hurdles have been cleared. In addition, production of crude oil, natural gas and NGLs in Canada is expected to continue to increase, which may further exacerbate the transportation capacity deficit.
Transportation Constraints and Market Access
Producers negotiate with pipeline operators (or other transport providers) to transport their products, which may be done on a firm or interruptible basis. Due to growing production and a lack of new and expanded pipeline and rail infrastructure capacity, producers in Western Canada have experienced low pricing relative to other markets in the last several years. Transportation availability is highly variable across different areas and regions, which can determine the nature of transportation commitments available, the numbers of potential customers that can be reached in a cost-effective manner and the price received.
Developing a strong network of transportation infrastructure for crude oil, natural gas and NGLs, including by means of pipelines, rail, marine and trucks, in order to obtain better access to domestic and international markets has been a significant challenge to the Canadian crude oil and natural gas industry. Improved means of access to global markets, especially the Midwest United States and export shipping terminals on the west coast of Canada, would help to alleviate the pressures of pricing discussed. Several proposals have been announced to increase pipeline capacity out of Western Canada, to reach Eastern Canada, the United States and international markets via export shipping terminals on the west coast of Canada. While certain projects are proceeding, the regulatory approval process as well as economic and political factors for transportation and other export infrastructure has led to the delay of many pipeline projects or their cancellation altogether.
28
Under the Canadian constitution, interprovincial and international pipelines fall within the federal governments jurisdiction and require approval by both the NEB and the cabinet of the federal government. However, recent years have seen a perceived lack of policy and regulatory certainty at a federal level. Although the current federal government recently introduced draft legislation to amend the current federal approval processes, it is uncertain when the new legislation will be brought into force and whether any changes to the draft legislation will be made before the legislation is brought into force. It is also uncertain whether any new approval process adopted by the federal government will result in a more efficient approval process. The lack of regulatory certainty is likely to have an influence on investment decisions for major projects. Even when projects are approved on a federal level, such projects often face further delays due to interference by provincial and municipal governments as well as court challenges on various issues such as indigenous title, the governments duty to consult and accommodate indigenous peoples and the sufficiency of environmental review processes, which creates further uncertainty. Export pipelines from Canada to the United States face additional uncertainty as such pipelines require approvals of several levels of government in the United States.
Natural gas prices in Alberta and British Columbia have also been constrained in recent years due to increasing North American supply, limited access to markets and limited storage capacity. While companies that secure firm access to transport their natural gas production out of Western Canada may be able to access more markets and obtain better pricing, other companies may be forced to accept spot pricing in Western Canada for their natural gas, which in the last several years has generally been depressed (at times producers have received negative pricing for their natural gas production). Required repairs or upgrades to existing pipeline systems have also led to further reduced capacity and apportionment of firm access, which in Western Canada may be further exacerbated by natural gas storage limitations. Additionally, while a number of liquefied natural gas export plants have been proposed for the west coast of Canada, government decision-making, regulatory uncertainty, opposition from environmental and indigenous groups, and changing market conditions, have resulted in the cancellation or delay of many of these projects.
The North American Free Trade Agreement and Other Trade Agreements
The North American Free Trade Agreement (NAFTA) among the governments of Canada, the United States and Mexico came into force on January 1, 1994. Under the terms of NAFTA, Canada remains free to determine whether exports of energy resources to the United States or Mexico will be allowed, provided that any export restrictions do not: (i) reduce the proportion of energy resources exported relative to the total supply of goods of Canada as compared to the proportion prevailing in the most recent 36 month period; (ii) impose an export price higher than the domestic price (subject to an exception with respect to certain measures which only restrict the volume of exports); and (iii) disrupt normal channels of supply. Further, all three signatory counties are prohibited from imposing a minimum or maximum price requirement on exports (where any other form of quantitative restriction is prohibited) and imports (except as permitted in the enforcement of countervailing and anti-dumping orders and undertakings). NAFTA also requires energy regulators to ensure the orderly and equitable implementation of any regulatory changes and to ensure that the application of such changes will cause minimal disruption to contractual arrangements and avoid undue interference with pricing, marketing and distribution arrangements.
In 2017, the United States government announced its intention to renegotiate NAFTA. As a result, Canada, the United States and Mexico began renegotiating the terms of NAFTA in mid-2017. The United States has also suggested that it might give notice of the termination of NAFTA if it is not satisfied with the outcome of the renegotiations. If the United States does give notice of its intent to terminate or withdraw from NAFTA, the earliest such termination or withdrawal could occur would be six months after such notice is given. The renegotiations are still underway and the outcome of such negotiations remain unclear, but as the United States remains by far Canadas largest trade partner and the largest international market for the export of crude oil, natural gas and NGLs from Canada, any changes to, or termination of, NAFTA could have an impact on Western Canadas crude oil and natural gas industry at large, including the Corporations business.
Canada has also pursued a number of other international free trade agreements with other countries around the world. As a result, a number of free trade or similar agreements are in force between Canada and certain other countries while in other
29
circumstances Canada has been unsuccessful in its efforts. Canada and the European Union recently agreed to the Comprehensive Economic and Trade Agreement (CETA), which provides for duty-free, quota-free market access for Canadian oil and gas products to the European Union. Although CETA remains subject to ratification by certain national legislatures in the European Union, provisional application of CETA commenced on September 21, 2017. In addition, Canada and ten other countries recently concluded discussions and agreed on the draft text of the Comprehensive and Progressive Agreement for Trans-Pacific Partnership (CPTPP), which is intended to allow for preferential market access among the countries that are parties to the CPTPP. The text of CPTPP has not been finalized or published and the agreement remains subject to ratification by the governments of each of the countries involved. While it is uncertain what effect CETA, CPTPP or any other trade agreements will have on the oil and gas industry in Canada, the lack of available infrastructure for the offshore export of oil and gas may limit the ability of Canadian oil and gas producers to benefit from such trade agreements.
Land Tenure
The respective provincial governments (i.e. the Crown) predominantly own the mineral rights to crude oil and natural gas located in Western Canada, with the exception of Manitoba (which only owns 20% of the mineral rights). Provincial governments grant rights to explore for and produce crude oil and natural gas pursuant to leases, licences and permits for varying terms, and on conditions set forth in provincial legislation, including requirements to perform specific work or make payments. The provincial governments in Western Canadas provinces conduct regular land sales where crude oil and natural gas companies bid for leases to explore for and produce crude oil and natural gas pursuant to mineral rights owned by the respective provincial governments. The leases generally have a fixed term; however, a lease may generally be continued after the initial term where certain minimum thresholds of production have been reached, all lease rental payments have been paid on time and other conditions are satisfied.
To develop crude oil and natural gas resources, it is necessary for the mineral estate owner to have access to the surface lands as well. Each province has developed its own process for obtaining surface access to conduct operations that operators must follow throughout the lifespan of a well, including notification requirements and providing compensation for affected persons for lost land use and surface damage.
Each of the provinces in Western Canada have implemented legislation providing for the reversion to the Crown of mineral rights to deep, non-productive geological formations at the conclusion of the primary term of a lease or licence. Additionally, the provinces of Alberta and British Columbia have shallow rights reversion for shallow, non-productive geological formations for new leases and licences.
In addition to Crown ownership of the rights to crude oil and natural gas, private ownership of crude oil and natural gas (i.e. freehold mineral lands) also exists in each of the provinces in Western Canada. In the provinces of Alberta, British Columbia, Saskatchewan and Manitoba, approximately 19%, 6%, 30% and 80%, respectively, of the mineral rights are owned by private freehold owners. Rights to explore for and produce such crude oil and natural gas are granted by a lease or other contract on such terms and conditions as may be negotiated between the owner of such mineral rights and crude oil and natural gas explorers and producers.
An additional category of mineral rights ownership includes ownership by the Canadian federal government of some legacy mineral lands and within indigenous reservations designated under the Indian Act (Canada). Indian Oil and Gas Canada (IOGC), which is a federal government agency, manages subsurface and surface leases, in consultation with the applicable indigenous peoples, for exploration and production of crude oil and natural gas on indigenous reservations.
Royalties and Incentives
General
Each province has legislation and regulations that govern royalties, production rates and other matters. The royalty regime in a given province is a significant factor in the profitability of oil sands projects and crude oil, natural gas and NGLs production. Royalties payable on production from lands where the Crown does not hold the mineral rights are determined by negotiation
30
between the mineral freehold owner and the lessee, although production from such lands is subject to certain provincial taxes and royalties. Royalties from production on Crown lands are determined by governmental legislation and are generally calculated as a percentage of the value of gross production. The rate of royalties payable generally depends in part on prescribed reference prices, well productivity, geographical location, field discovery date, method of recovery and the type or quality of the petroleum substance produced.
Occasionally, the governments of Western Canadas provinces create incentive programs for exploration and development. Such programs often provide for royalty rate reductions, royalty holidays or royalty tax credits and are often introduced when commodity prices are low to encourage exploration and development activity. In addition, such programs may be introduced to encourage producers to undertake initiatives using new technologies that may enhance or improve recovery of crude oil, natural gas and NGLs.
Producers and working interest owners of crude oil and natural gas rights may also carve out additional royalties or royalty-like interests through non-public transactions, which include the creation of instruments such as overriding royalties, net profits interests and net carried interests.
Alberta
In Alberta, the provincial government royalty rates apply to Crown-owned mineral rights. In 2016, Alberta adopted a modernized Alberta royalty framework (the Modernized Framework) that applies to all wells drilled after January 1, 2017. The previous royalty framework (the Old Framework) will continue to apply to wells drilled prior to January 1, 2017 for a period of ten years ending on December 31, 2026. After the expiry of this ten-year period, these older wells will become subject to the Modernized Framework.
The Modernized Framework applies to all hydrocarbons other than oil sands which will remain subject to their existing royalty regime. Royalties on production from non-oil sands wells under the Modernized Framework are determined on a revenue-minus-costs basis with the cost component based on a Drilling and Completion Cost Allowance formula for each well, depending on its vertical depth and/or horizontal length. The formula is based on the industrys average drilling and completion costs as determined by the Alberta Energy Regulator (the AER) on an annual basis.
Producers pay a flat royalty rate of 5% of gross revenue from each well that is subject to the Modernized Framework until the well reaches payout. Payout for a well is the point at which cumulative gross revenues from the well equals the Drilling and Completion Cost Allowance for the well set by the AER. After payout, producers pay an increased post-payout royalty on revenues of between 5% and 40% determined by reference to the then current commodity prices of the various hydrocarbons. Similar to the Old Framework, the post-payout royalty rate under the Modernized Framework varies with commodity prices. Once production in a mature well drops below a threshold level where the rate of production is too low to sustain the full royalty burden, its royalty rate is adjusted downward towards a minimum of 5% as the mature wells production declines. As the Modernized Framework uses deemed drilling and completion costs in calculating the royalty and not the actual drilling and completion costs incurred by a producer, low cost producers benefit if their well costs are lower than the Drilling and Completion Cost Allowance and, accordingly, they continue to pay the lower 5% royalty rate for a period of time after their wells achieve actual payout.
The Old Framework is applicable to all conventional crude oil and natural gas wells drilled prior to January 1, 2017 and bitumen production. Subject to certain available incentives, effective from the January 2011 production month, royalty rates for conventional crude oil production under the Old Framework range from a base rate of 0% to a cap of 40%. Subject to certain available incentives, effective from the January 2011 production month, royalty rates for natural gas production under the Old Framework range from a base rate of 5% to a cap of 36%. The Old Framework also includes a natural gas royalty formula which provides for a reduction based on the measured depth of the well below 2,000 metres deep, as well as the acid gas content of the produced gas. Under the Old Framework, the royalty rate applicable to NGLs is a flat rate of 40% for pentanes and 30% for butanes and propane. Currently, producers of crude oil and natural gas from Crown lands in Alberta are also required to pay annual rental payments, at a rate of $3.50 per hectare, and make monthly royalty payments in respect of crude oil and natural gas produced.
31
The Government of Alberta has from time to time implemented drilling credits, incentives or transitional royalty programs to encourage crude oil and natural gas development and new drilling. In addition, the Government of Alberta has implemented certain initiatives intended to accelerate technological development and facilitate the development of unconventional resources, including as applied to coalbed methane wells, shale gas wells and horizontal crude oil and natural gas wells.
Freehold mineral taxes are levied for production from freehold mineral lands on an annual basis on calendar year production. Freehold mineral taxes are calculated using a tax formula that takes into consideration, among other things, the amount of production, the hours of production, the value of each unit of production, the tax rate and the percentages that the owners hold in the title. On average, in Alberta the tax levied is 4% of revenues reported from freehold mineral title properties. The freehold mineral taxes would be in addition to any royalty or other payment paid to the owner of such freehold mineral rights, which are established through private negotiation.
Freehold and Other Types of Non-Crown Royalties
Royalties on production from privately-owned freehold lands are negotiated between the mineral freehold owner and the lessee under a negotiated lease or other contract.
In addition to the royalties payable to the mineral owners, producers of crude oil and natural gas from freehold lands in each of the Western Canadian provinces are required to pay freehold mineral taxes or production taxes. Freehold mineral taxes or production taxes are taxes levied by a provincial government on crude oil and natural gas production from lands where the Crown does not hold the mineral rights.
IOGC is a special agency responsible for managing and regulating the crude oil and natural gas resources located on indigenous reservations across Canada. IOGCs responsibilities include negotiating and issuing the crude oil and natural gas agreements between indigenous groups and crude oil and natural gas companies, as well as collecting royalty revenues on behalf of indigenous groups and depositing the revenues in their trust accounts. While certain standards exist, the exact terms and conditions of each crude oil and natural gas lease dictate the calculation of royalties owed, which may vary depending on the involvement of the specific indigenous group. Ultimately, the relevant indigenous group must approve the terms.
Regulatory Authorities and Environmental Regulation
General
The crude oil and natural gas industry is currently subject to environmental regulation under a variety of Canadian federal, provincial, territorial and municipal laws and regulations, all of which are subject to governmental review and revision from time to time. Such regulations provide for, among other things, restrictions and prohibitions on the spill, release or emission of various substances produced in association with certain crude oil and natural gas industry operations, such as sulphur dioxide and nitrous oxide. The regulatory regimes set out the requirements with respect to oilfield waste handling and storage, habitat protection and the satisfactory operation, maintenance, abandonment and reclamation of well and facility sites. Compliance with such regulations can require significant expenditures and a breach of such requirements may result in suspension or revocation of necessary licences and authorizations, civil liability and the imposition of material fines and penalties. In addition to these specific, known requirements, future changes to environmental legislation, including anticipated legislation for air pollution and greenhouse gas (GHG) emissions, may impose further requirements on operators and other companies in the crude oil and natural gas industry.
Federal
Canadian environmental regulation is the responsibility of both the federal and provincial governments. Where there is a direct conflict between federal and provincial environmental legislation in relation to the same matter, the federal law will prevail. However, such conflicts are uncommon. The federal government has primary jurisdiction over federal works, undertakings and federally regulated industries such as railways, aviation and interprovincial transport including interprovincial pipelines.
32
On June 20, 2016, the federal government launched a review of current environmental and regulatory processes. On February 8, 2018, the Government of Canada introduced draft legislation to overhaul the existing environmental assessment process and replace the NEB with the Canadian Energy Regulator (CER). Pursuant to the draft legislation, the Impact Assessment Agency of Canada (the Agency) would replace the Canadian Environmental Assessment Agency. It appears that additional categories of projects may be included within the new impact assessment process, such as large-scale wind power facilities and in-situ oilsands facilities. The revamped approval process for applicable major developments will have specific legislated timelines at each stage of the formal impact assessment process. The Agencys process would focus on: (i) early engagement by proponents to engage the Agency and all stakeholders such as the public and indigenous groups prior to the formal impact assessment process; (ii) potentially increased public participation where the project undergoes a panel review; (iii) providing analysis of the potential impacts and effects of a project without making recommendations, to support a public-interest approach to decision-making, with cost-benefit determinations and approvals made by the Minister of Environment and Climate Change or the cabinet of the federal government; (iv) analyzing further specified factors for projects such as alternatives to the project and social and indigenous issues in addition to health, environmental and economic impacts; and (v) overseeing an expanded follow-up, monitoring and enforcement process with increased involvement of indigenous peoples and communities. As to the proposed CER, many of its activities would be similar to the NEB, albeit with a different structure and the notable exception that the CER would no longer have primary responsibility in the consideration of the new major projects, instead focusing on the lifecycle regulation (e.g. overseeing construction, tolls and tariffs, operations and eventual winding down) of approved projects, while providing for expanded participation by communities and indigenous peoples. It is unclear when the new regulatory scheme will come into force or whether any amendments will be made prior to coming into force. Until then, the federal governments interim principles released on January 27, 2016 will continue to guide decision-making authorities for projects currently undergoing environmental assessment. The eventual effects of the proposed regulatory scheme on proponents of major projects remains unclear.
On May 12, 2017, the federal government introduced the Oil Tanker Moratorium Act in Parliament. This legislation is aimed at providing coastal protection in northern British Columbia by prohibiting crude oil tankers carrying more than 12,500 metric tonnes of crude oil or persistent crude oil products from stopping, loading, or unloading crude oil in that area. Parliament is still considering the bill, which passed second reading on October 4, 2017. If implemented, the legislation may prevent the building of pipelines to, and export terminals located on, the portion of the British Columbia coast subject to the moratorium and, as a result, negatively affect the ability of producers to access global markets.
Alberta
The AER is the single regulator responsible for all resource development in Alberta. The AER is responsible for ensuring the safe, efficient, orderly and environmentally responsible development of hydrocarbon resources including allocating and conserving water resources, managing public lands, and protecting the environment. The AERs responsibilities exclude the functions of the Alberta Utilities Commission and the Surface Rights Board, as well as Alberta Energys responsibility for mineral tenure. The objective behind a single regulator is an enhanced regulatory regime that is intended to be efficient, attractive to business and investors and effective in supporting public safety, environmental management and resource conservation while respecting the rights of landowners.
The Government of Alberta relies on regional planning to accomplish its responsible resource development goals. Its approach to natural resource management provides for engagement and consultation with stakeholders and the public and examines the cumulative impacts of development on the environment and communities by incorporating the management of all resources, including energy, minerals, land, air, water and biodiversity. While the AER is the primary regulator for energy development, several other governmental departments and agencies may be involved in land use issues, including Alberta Environment and Parks, Alberta Energy, the Policy Management Office, the Aboriginal Consultation Office and the Land Use Secretariat.
The Government of Albertas land-use policy for surface land in Alberta sets out an approach to manage public and private land use and natural resource development in a manner that is consistent with the long-term economic, environmental and social goals of the province. It calls for the development of seven region-specific land-use plans in order to manage the combined impacts of existing and future land use within a specific region and the incorporation of a cumulative effects management approach into such plans. As a result, several regional plans have been implemented and others are in the process of being implemented. These regional plans may affect further development and operations in such regions.
33
Liability Management Rating Program - Alberta
The AER administers the Licensee Liability Rating Program (the AB LLR Program). The AB LLR Program is a liability management program governing most conventional upstream crude oil and natural gas wells, facilities and pipelines. Albertas Oil and Gas Conservation Act (the OGCA) establishes an orphan fund (the Orphan Fund) to pay the costs to suspend, abandon, remediate and reclaim a well, facility or pipeline included in the AB LLR Program if a licensee or working interest participant (WIP) becomes insolvent or is unable to meet its obligations. The Orphan Fund is funded by licensees in the AB LLR Program through a levy administered by the AER. The AB LLR Program is designed to minimize the risk to the Orphan Fund posed by unfunded liability of licensees and to prevent the taxpayers of Alberta from incurring costs to suspend, abandon, remediate and reclaim wells, facilities or pipelines. The AB LLR Program requires a licensee whose deemed liabilities exceed its deemed assets to provide the AER with a security deposit. The ratio of deemed assets to deemed liabilities is assessed once each month and where a security deposit is deemed to be required, the failure to post any required amounts may result in the initiation of enforcement action by the AER. The AER publishes the liability management rating for each licensee on a monthly basis on its public website.
In Redwater Energy Corporation (Re) (Redwater), the Court of Queens Bench of Alberta found that there was an operational conflict between the abandonment and reclamation provisions of the OGCA, including the AB LLR Program, and the Bankruptcy and Insolvency Act (the BIA). This ruling meant that receivers and trustees have the right to renounce assets within insolvency proceedings, which was affirmed by a majority of the Alberta Court of Appeal. Such a conflict renders the AERs legislated authority unenforceable to impose abandonment orders against licensees or to require a licensee to pay a security deposit before approving a transfer when such a licensee is insolvent. Effectively, this means that abandonment costs will be borne by the industry-funded Orphan Well Fund or the province in these instances because any financial resources of the insolvent licensee will first be used to satisfy secured creditors under the BIA. This decision is currently under appeal to the Supreme Court of Canada, with final resolution expected in 2018.
In response to Redwater, the AER issued several bulletins and interim rule changes to govern while the case is appealed and to allow the Government of Alberta to develop appropriate regulatory measures to adequately address environmental liabilities. The AERs Directive 067: Eligibility Requirements for Acquiring and Holding Energy Licences and Approvals, which deals with licence eligibility to operate wells and facilities, was amended and now requires extensive corporate governance and shareholder information, with a particular focus on any previous companies of directors and officers that have been subject to insolvency proceedings in the last five years. All transfers of well, facility and pipeline licences in the province are subject to AER approval. As a condition of transferring existing AER licences, approvals and permits, all are assessed on a non-routine basis and the AER now requires all transferees to demonstrate that they have a liability management rating (LMR), being the ratio of a licensees assets to liabilities, of 2.0 or higher immediately following the transfer, or to otherwise prove that it can satisfy its abandonment and reclamation obligations. The AER may make further rule changes in response to Redwater at any time, especially as the case heads towards a final determination, which means that additional obligations and/or different requirements may be forthcoming.
The AER has also implemented the Inactive Well Compliance Program (the IWCP) to address the growing inventory of inactive wells in Alberta and to increase the AERs surveillance and compliance efforts under Directive 013: Suspension Requirements for Wells (Directive 013). The IWCP applies to all inactive wells that are noncompliant with Directive 013 as of April 1, 2015. The objective is to bring all inactive noncompliant wells under the IWCP into compliance with the requirements of Directive 013 within five years. As of April 1, 2015, each licensee is required to bring 20% of its inactive wells into compliance every year, either by reactivating or by suspending the wells in accordance with Directive 013 or by abandoning them in accordance with Directive 020: Well Abandonment. The list of current wells subject to the IWCP is available on the AERs Digital Data Submission system. The AER has announced that from April 1, 2015 to April 1, 2016, the number of noncompliant wells subject to the IWCP fell from 25,792 to 17,470, with 76% of licensees operating in the province having met their annual quota. The IWCP completed its second year on March 31, 2017. Overall, the AER has announced that licensees brought 19% of non-compliant wells in the IWCP into compliance with AER requirements in the second year of the IWCP.
34
Climate Change Regulation
Climate change regulation at both the federal and provincial level has the potential to significantly affect the regulatory environment of the crude oil and natural gas industry in Canada.
In general, there is some uncertainty with regard to the impacts of federal or provincial climate change and environmental laws and regulations, as it is currently not possible to predict the extent of future requirements. Any new laws and regulations, or additional requirements to existing laws and regulations, could have a material impact on the Corporations operations and cash flow.
Federal
Canada has been a signatory to the United Nations Framework Convention on Climate Change (the UNFCCC) since 1992. Since its inception, the UNFCCC has instigated numerous policy experiments with respect to climate governance. On April 22, 2016, 197 countries signed the Paris Agreement, committing to prevent global temperatures from rising more than 2° Celsius above pre-industrial levels and to pursue efforts to limit this rise to no more than 1.5° Celsius. As of February 1, 2018, 174 of the 197 parties to the convention have ratified the Paris Agreement.
Following the Paris Agreement and its ratification in Canada, the Government of Canada pledged to cut its emissions by 30% from 2005 levels by 2030. Further, on December 9, 2016, the Government of Canada released the Pan-Canadian Framework on Clean Growth and Climate Change (the Framework). The Framework provided for a carbon-pricing strategy, with a carbon tax starting at $10/tonne, increasing annually until it reaches $50/tonne in 2022. A draft legislative proposal for the federal carbon pricing system was released on January 15, 2018. This system would apply in provinces and territories that request it and in those that do not have a carbon pricing system in place that meets the federal standards in 2018. Four provinces currently have carbon pricing systems in place that would meet federal requirements (Alberta, British Columbia, Ontario and Quebec). The federal government will accept comments on the draft legislative proposals to implement the federal carbon pricing system until February 12, 2018.
On May 27, 2017, the federal government published draft regulations to reduce emissions of methane from the crude oil and natural gas sector. The proposed regulations aim to reduce unintentional leaks and intentional venting of methane, as well as ensuring that crude oil and natural gas operations use low-emission equipment and processes, by introducing new control measures. Among other things, the proposed regulations limit how much methane upstream oil and gas facilities are permitted to vent. These facilities would need to capture the gas and either re-use it, re-inject it, send it to a sales pipeline, or route it to a flare. In addition, in provinces other than Alberta and British Columbia (which already regulate such activities), well completions by hydraulic fracturing would be required to conserve or destroy gas instead of venting. The federal government anticipates that these actions will reduce annual GHG emissions by about 20 megatonnes by 2030.
Alberta
On November 22, 2015, the Government of Alberta introduced its Climate Leadership Plan (the CLP). The CLP has four areas of focus: implementing a carbon price on GHG emissions, phasing out coal-generated electricity and developing renewable energy, legislating an oil sands emission limit, and introducing a new methane emissions reduction plan. The Government of Alberta has since introduced new legislation to give effect to these initiatives. The Climate Leadership Act came into force on January 1, 2017 and enabled a carbon levy that increased from $20 to $30 per tonne on January 1, 2018. The levy is anticipated to increase again in 2021 in line with the federal legislation. On December 14, 2016, the Oil Sands Emissions Limit Act came into force, establishing an annual 100 megatonne limit for GHG emissions from all oil sands sites, excluding some attributable to upgraders, the electric energy portion of cogeneration and other prescribed emissions.
35
The Carbon Competitiveness Incentives Regulation (the CCIR), which replaces the Specified Gas Emitters Regulation, came into effect on January 1, 2018. Unlike the previous regulation, which set emission reduction requirements, the CCIR imposes an output-based benchmark on competitors in the same emitting industry. The aim is to reduce annual GHG emissions by 20 megatonnes by 2020 and 50 megatonnes by 2030, and targets facilities that emit more than 100,000 tonnes of GHGs per year and mandates quarterly and final reporting requirements. The CCIR compliance obligations will be reduced by 50% and 25% for 2018 and 2019, respectively, with no reduction for 2020 onward. In addition to the industry-specific benchmarks, each benchmark will decrease annually at a rate of 1%, beginning in 2020. The Government of Alberta intends for this strategy to align with the federal Framework.
The Government of Alberta also signaled its intention through its CLP to implement regulations that would lower annual methane emissions by 45% by 2025. Regulations are planned to take effect in 2020 to ensure the 2025 target is met.
Alberta was also the first jurisdiction in North America to direct dedicated funding to implement carbon capture and storage technology across industrial sectors. Alberta has committed $1.24 billion over 15 years to fund two large-scale carbon capture and storage projects that will begin commercializing the technology on the scale needed to be successful. On December 2, 2010, the Government of Alberta passed the Carbon Capture and Storage Statutes Amendment Act, 2010. It deemed the pore space underlying all land in Alberta to be, and to have always been the property of the Crown and provided for the assumption of long-term liability for carbon sequestration projects by the Crown, subject to the satisfaction of certain conditions.
Accountability and Transparency
In 2015, the federal governments Extractive Sector Transparency Measures Act (the ESTMA) came into effect, which imposed mandatory reporting requirements on certain entities engaged in the commercial development of oil, gas or minerals, including exploration, extraction and holding permits. All companies subject to ESTMA must report payments over CAD$100,000 made to any level of a Canadian or foreign government (including indigenous groups), including royalty payments, taxes (other than consumption taxes and personal income taxes), fees, production entitlements, bonuses, dividends (other than ordinary dividends paid to shareholders), infrastructure improvement payments and other prescribed categories of payments.
Obsidian Energy and the Environment
Obsidian Energy understands its responsibilities for reducing the environmental impacts from its operations and recognizes the interests of other land users in resource development areas and conducts its operations accordingly. Obsidian Energy is committed to mitigating the environmental impact from its operations, and to involving stakeholders throughout the exploration, development, production and abandonment process. Obsidian Energys environmental programs encompass resource conservation, stakeholder communication and site abandonment/reclamation. Our environmental programs are monitored to ensure they comply with all government environmental regulations and with Obsidian Energys own environmental policies. The results of these programs are reviewed with Obsidian Energys management and operations personnel, which seeks to drive improvement and to ensure compliance with these policies. Obsidian Energy seeks to communicate its commitment to environmental stewardship to our stakeholders, including employees, investors, contractors, landowners and local communities, in order to always be held accountable.
Obsidian Energy maintains a program of detailed inspections, audits and field assessments to determine and quantify the environmental liabilities that will be incurred during the eventual decommissioning and reclamation of its field facilities. Obsidian Energy pursues a program of environmental impact reduction aimed at minimizing these future corporate liabilities without hampering field productivity. This program, launched in 1994, is ongoing, and includes measures to remediate potential contaminant sources, reclaim spill sites and abandon unproductive wells and shut-in facilities. For information regarding our estimated future abandonment and reclamation costs as of December 31, 2017, see Appendix A-3 Statement of Reserves Data and Other Oil and Gas Information Disclosure of Reserves Data Total Future Net Revenue (Undiscounted) as of December 31, 2017 Forecast Prices and Costs.
36
Obsidian Energy does not operate any facilities in Alberta that are regulated to reduce GHG emissions and has no facilities that are required to report their emissions and remit the carbon levy until 2023. Obsidian Energy has minor working interests in several non-operated facilities that are required to meet the requirements of the Alberta GHG regulations. Obsidian Energys financial obligations related to compliance with existing federal and provincial legislation regarding GHG emissions is not material at this time.
Because the federal and provincial programs relating to the regulation of the emission of GHGs and other air pollutants continue to be developed, Obsidian Energy is currently unable to predict the total impact of the potential regulations upon its business. Therefore, it is possible that Obsidian Energy could face increases in costs in order to comply with emissions legislation. However, in cooperation with various industry groups, Obsidian Energy continues to work cooperatively with governments to develop an approach to deal with climate change issues that protects the industrys competitiveness, limits the cost and administrative burden of compliance, and supports continued investment in the oil and gas sector.
Obsidian Energy is committed to meeting its responsibilities to protect the environment wherever it operates. Obsidian Energy anticipates that its expenditures, both capital and expense in nature, will continue to increase as a result of operational growth and increasing legislation relating to the protection of the environment. Obsidian Energy will be taking such steps as required to ensure continued compliance with applicable environmental legislation in each jurisdiction in which it operates. Obsidian Energy believes that it is currently in compliance with applicable environmental laws and regulations in all material respects. Obsidian Energy also believes that it is reasonably likely that the trend towards heightened and additional standards in environmental legislation and regulation will continue.
RISK FACTORS
The following is a summary of certain risk factors relating to Obsidian Energy and its business. The following information is a summary only of certain risk factors and is qualified in its entirety by reference to, and must be read in conjunction with, the detailed information appearing elsewhere in this Annual Information Form. Securityholders and potential securityholders should consider carefully the information contained herein and, in particular, the following risk factors. If any of these risks occur, our financial condition and results of operations could be materially adversely affected, which could result in a decline in the trading price of our Common Shares. The risks described below are not an exhaustive list of the risks that may affect Obsidian Energy and its business, nor should they be taken as a complete summary or description of all the risks associated with Obsidian Energy and its business and the oil and natural gas business generally.
Volatility in oil and natural gas prices could have a material adverse effect on our results of operations and financial condition, which in turn could negatively affect the market price of our Common Shares.
Our results of operations and financial condition are dependent upon the prices that we receive for the oil and natural gas that we sell. Historically, the oil and natural gas markets have been volatile and are likely to continue to be volatile in the future. Oil and natural gas prices have fluctuated widely during recent years and are subject to fluctuations in response to changes in supply, demand, market uncertainty and other factors that are beyond our control. These factors include, but are not limited to:
| the limitations on the ability of Western Canadian energy producers to export oil, natural gas and natural gas liquids to U.S. markets and world markets and the resulting discount that Western Canadian energy producers may receive for their products as compared to U.S. and international benchmark commodity prices; |
| the availability of transportation infrastructure, and in particular: |
| our ability to acquire space on pipelines that deliver crude oil and natural gas to commercial markets or alternatively contract for the delivery of our products by rail; |
| deliverability uncertainties related to the distance of our production from existing pipeline, railway line, processing and storage facility infrastructure; and |
| operational problems affecting the pipelines, railway lines and facilities on which we rely; |
| global energy policy, including the ability of OPEC (and in particular the Kingdom of Saudi Arabia) and other oil and gas exporting nations to set and maintain production levels and influence prices for oil; |
37
| increased growth of shale oil production in the U.S.; |
| existing and threatened political instability and hostilities; |
| foreign supply of oil and natural gas, including liquefied natural gas; |
| weather conditions; |
| the overall level of energy demand; |
| production and storage levels of oil and natural gas; |
| government regulations and taxes; |
| currency exchange rates; |
| the effect of worldwide environmental and/or energy conservation measures; |
| the price and availability of alternative energy supplies; |
| the overall economic and political environment in Canada, the U.S., China, emerging markets and globally; and |
| the advent of new technologies. |
The economics of producing from some wells may change because of lower prices, which could result in reduced production of oil or natural gas and a reduction in the volumes and the value of the Corporations reserves. The Corporation might also elect not to produce from certain wells at lower prices. Volatile oil and natural gas prices make it difficult to estimate the value of producing properties for acquisitions and often cause disruption in the market for oil and natural gas producing properties, as buyers and sellers have difficulty agreeing on such value. Price volatility also makes it difficult to budget for and project the return on acquisitions and development and exploitation projects.
All these factors could result in a material decrease in the Corporations expected net production revenue and a reduction in its oil and natural gas production, acquisition, development and exploration activities. Any substantial and extended decline in the price of oil and natural gas would have an adverse effect on the Corporations carrying value of its reserves, borrowing capacity, revenues, profitability and cash flows from operations and may have a material adverse effect on the Corporations business, financial condition, results of operations and prospects.
Weakness and volatility in the market conditions for the oil and gas industry may affect the value of the Corporations reserves and restrict its cash flow and its ability to access capital to fund the development of its oil and gas assets.
Recent market events and conditions, including global excess oil and natural gas supply, recent actions taken by OPEC, slowing growth in emerging economies, market volatility and disruptions in Asia, sovereign debt levels and political upheavals in various countries, have caused significant weakness and volatility in commodity prices. These events and conditions have caused a significant decrease in the valuation of oil and gas companies and a decrease in confidence in the oil and gas industry. These difficulties have been exacerbated in Canada by political and other actions resulting in uncertainty surrounding potential changes to the tax, royalty, environmental and other regulatory regimes. In addition, the inability to get the necessary approvals to build pipelines, liquefied natural gas plants and other facilities to provide better access to markets for the oil and gas industry in western Canada has led to additional downward price pressure on oil and gas produced in western Canada and uncertainty and reduced confidence in the oil and gas industry in western Canada. Lower commodity prices may also affect the volume and value of the Corporations reserves by rendering certain reserves uneconomic. In addition, lower commodity prices restrict the Corporations cash flow resulting in less funds from operations being available to fund the Corporations capital expenditure budget. As a result, the Corporation may not be able to replace its production with additional reserves and both the Corporations production and reserves could be reduced on a year over year basis. Any decrease in value of the Corporations reserves may reduce the borrowing base under our credit facilities which, depending on the level of the Corporations indebtedness, could result in the Corporation having to repay a portion of its indebtedness. In addition to possibly resulting in a decrease in the value of the Corporations economically recoverable reserves, lower commodity prices may also result in a decrease in the value of the Corporations infrastructure and facilities, all of which could also have the effect of requiring a write down of the carrying value of the Corporations oil and gas assets on its balance sheet and the recognition of an impairment charge in its income statement. Given the current market conditions and the lack of confidence in the Canadian oil and gas industry, the Corporation may have difficulty raising additional funds or if it is able to do so, it may be on unfavourable and highly dilutive terms.
38
Changing investor sentiment towards the oil and gas industry may impact the Corporations access to, and cost of, capital.
A number of factors, including the concerns of the effects of the use of fossil fuels on climate change, concerns of the impact of oil and gas operations on the environment, concerns of environmental damage relating to spills of petroleum products during transportation, and concerns of indigenous rights, have affected certain investors sentiments towards investing in the oil and gas industry. As a result of these concerns, some institutional, retail and public investors have announced that they no longer are willing to fund or invest in oil and gas properties or companies or are reducing the amount thereof over time. In addition, certain institutional investors are requesting that issuers develop and implement more robust social, environmental and governance policies and practices. Developing and implementing such policies and practices can involve significant costs and require a significant time commitment from the Board, management and employees of the Corporation. Failing to implement the policies and practices as requested by institutional investors may result in such investors reducing their investment in the Corporation or not investing in the Corporation at all. Any reduction in the investor base interested or willing to invest in the oil and gas industry and more specifically, the Corporation, may result in limiting the Corporations access to capital, increasing the cost of capital, and decreasing the price and liquidity of the Common shares.
The price of oil and natural gas is affected by political events throughout the world. Any such event could result in a material decline in commodity prices and in turn result in a reduction in the market price of our Common Shares.
Political events throughout the world that cause disruptions in the supply of oil continue to affect the marketability and price of oil and natural gas acquired, produced or discovered by us. Conflicts, or conversely peaceful developments, arising outside of Canada, including changes in political regimes or the parties in power, have a significant impact on the price of oil and natural gas. Any particular event could result in a material decline in prices and therefore result in a reduction of our revenue and consequently the market price of our Common Shares.
We cannot predict the impact of ongoing political uncertainty on our business.
In the last several years, the United States and certain European countries have experienced significant political events that have cast uncertainty on global financial and economic markets. During the 2016 presidential campaign a number of election promises were made and the new American administration has begun taking steps to implement certain of these promises. The administration has announced withdrawal of the United States from the Trans-Pacific Partnership and Congress has passed sweeping tax reform, which, among other things, significantly reduces U.S. corporate tax rates. This may affect competitiveness of other jurisdictions, including Canada. The North American Free Trade Agreement is currently under renegotiation and the result is uncertain at this time. The administration has also taken action with respect to reduction of regulation which may also affect relative competitiveness of other jurisdictions. It is unclear exactly what other actions the administration in the United States will implement, and if implemented, how these actions may impact Canada and in particular the oil and gas industry. Any actions taken by the new United States administration may have a negative impact on the Canadian economy and on the businesses, financial conditions, results of operations and the valuation of Canadian oil and gas companies, including the Corporation. See Industry Conditions.
In addition to the political disruption in the United States, in 2017 the citizens of the United Kingdom have voted to withdraw from the European Union. The Government of the United Kingdom has begun taking steps to implement such withdrawal. Some European countries have also experienced the rise of anti-establishment political parties and public protests held against open-door immigration policies, trade and globalization. To the extent that certain political actions taken in North America, Europe and elsewhere in the world result in a marked decrease in free trade, access to personnel and freedom of movement, it could have an adverse effect on the Corporations ability to market its products internationally, increase costs for goods and services required for the Corporations operations, reduce access to skilled labour and negatively impact the Corporations business, operations, financial conditions and the market value of our securities.
A change in federal, provincial or municipal governments in Canada may have an impact on the directions taken by such governments on matters that may impact the oil and gas industry, including the balance between economic development and environmental policy such as the potential impact of the recent change of government in British Columbia and announcements and actions by the government of British Columbia that may impact the completion of the Trans-Mountain Pipeline project and other infrastructure projects.
39
Changes to the demand for oil and natural gas products and the rise of petroleum alternatives may negatively affect the Corporations financial condition, results of operations and cash flow.
Fuel conservation measures, alternative fuel requirements, increasing consumer demand for alternatives to oil and natural gas and technological advances in fuel economy and renewable energy generation devices could reduce the demand for oil, natural gas and liquid hydrocarbons. Recently, certain jurisdictions have implemented policies or incentives to decrease the use of fossil fuels and encourage the use of renewable fuel alternatives, which may lessen the demand for petroleum products and put downward pressure on commodity prices. In addition, advancements in energy efficient products have a similar effect on the demand for oil and gas products. The Corporation cannot predict the impact of changing demand for oil and natural gas products, and any major changes may have a material adverse effect on the Corporations business, financial condition, results of operations and cash flows by decreasing the Corporations profitability, increasing its costs, limiting its access to capital and decreasing the value of its assets.
Changes in the regulation of the oil and gas industry may adversely affect our business.
Various levels of governments impose extensive controls and regulations on oil and natural gas operations (including exploration, development, production, pricing, marketing and transportation). Governments may regulate or intervene with respect to exploration and production activities, prices, taxes, royalties and the exportation of oil and natural gas. Amendments to these controls and regulations may occur from time to time in response to economic or political conditions. The implementation of new regulations or the modification of existing regulations affecting the oil and natural gas industry could reduce demand for crude oil and natural gas and increase our costs, either of which may have a material adverse effect on our business, financial condition, results of operations and prospects. Recently, the federal government and certain provincial governments have taken steps to initiate protocols and regulations to limit the release of methane from oil and gas operations. Such draft regulations and protocols may require additional expenditures or otherwise negatively impact the Corporations operations, which may affect the Corporations profitability. See Industry Conditions.
In order to conduct oil and natural gas operations, we will require regulatory permits, licenses, registrations, approvals and authorizations from various governmental authorities at the municipal, provincial and federal level. There can be no assurance that we will be able to obtain all of the permits, licenses, registrations, approvals and authorizations that may be required to conduct operations that we may wish to undertake. In addition, certain federal legislation such as the Competition Act and the Investment Canada Act could negatively affect our business, financial condition and the market value of our securities or our assets, particularly when undertaking, or attempting to undertake, acquisition or disposition activity.
In 2017, the Alberta Energy Regulator (AER) released requirements for hydrocarbon emission controls and gas conservation within the Peace River area of Alberta (Directive 84). The directive outlines requirements to address emissions generated by heavy oil and bitumen operations in the area. By September 1, 2018, the Company is required to ensure emission controls are in place to prevent off lease odours. The Company is in progress on meeting the requirements by the effective date.
We use conventional recovery methods, such as horizontal multi-stage fracturing technology, and non-conventional recovery methods, such as enhanced oil recovery technologies, both of which are subject to significant risk factors which could lead to the delay or cancellation of some or all of our projects, which could adversely affect the market price of our Common Shares.
Obsidian Energy utilizes new drilling and completion technologies, including horizontal multi-stage fracture completions, intended to increase the resource recovery from known oil and natural gas fields. However, Obsidian Energy may not realize the anticipated increase in resource recovery from the employment of such techniques due to particular reservoir characteristics or other adverse factors.
40
Hydraulic fracturing typically involves the injection of water, sand and small amounts of additives under pressure into rock formations to stimulate hydrocarbon (natural gas and oil) production. Hydraulic fracturing is being used to produce commercial quantities of natural gas and oil from reservoirs that were previously unproductive. Any new laws, regulations or permitting requirements regarding hydraulic fracturing could lead to operational delay or increased operating costs or third party or governmental claims, and could increase our cost of compliance and doing business as well as delay the development of oil and natural gas resources from shale formations which are not commercial without the use of hydraulic fracturing. Restrictions on hydraulic fracturing could also reduce the amount of oil and natural gas that we are ultimately able to produce from our reserves.
Due to seismic activity reported in the Fox Creek area of Alberta, the AER announced in February 2015, seismic monitoring and reporting requirements for hydraulic fracturing operators in the Duvernay zone in the Fox Creek area. These requirements include, among others, an assessment of the potential for seismicity prior to operations, the implementation of a response plan to address potential events, and the suspension of operations if a seismic event above a particular threshold occurs. Although we do not currently own oil and gas assets in the Fox Creek area, the AER continues to monitor seismic activity around the province and may extend these requirements to other areas of the province where we do own oil and gas assets if necessary.
The potential or planned use of enhanced oil recovery (EOR) methods such as steam injection (steam assisted gravity drainage, cyclical steam stimulation and steam flooding), water injection, solvent injection and firefloods to increase the ultimate recovery of oil resources in place are subject to significant risk factors. These factors include but are not limited to the following:
| changing economic conditions (including commodity pricing and operating and capital expenditure fluctuations); |
| changing engineering and technical conditions (including the ability to apply EOR methods to the reservoir and the production response thereto); |
| large development programs may need to be spread over a longer time period than initially planned due to the requirement to allocate capital expenditures to different periods; |
| surface access and deliverability issues (including landowner and stakeholder relations, weather, pipeline, road and processing matters); |
| environmental regulations relating to such items as GHG emissions and access to water, which could impact capital and operating costs; and |
| the availability of sufficient financing on acceptable terms. |
The Corporation undertakes or intends to undertake certain waterflooding programs which involve the injection of water or other liquids into an oil reservoir to increase production from the reservoir and to decrease production declines. To undertake such waterflooding activities, the Corporation needs to have access to sufficient volumes of water, or other liquids, to pump into the reservoir to increase the pressure in the reservoir. There is no certainty that the Corporation will have access to the required volumes of water. In addition, in certain areas there may be restrictions on water use for activities such as waterflooding. If the Corporation is unable to access such water it may not be able to undertake waterflooding activities, which may reduce the amount of oil and natural gas that the Corporation is ultimately able to produce from its reservoirs. In addition, the Corporation may undertake certain waterflood programs that ultimately prove unsuccessful in increasing production from the reservoir and as a result have a negative impact on the Corporations results of operations.
Acquiring, exploring for, developing, and producing from oil and natural gas assets involves many risks. Losses resulting from the occurrence of one or more of these risks may adversely affect our business and thus the value of our Common Shares.
Oil and natural gas operations involve many risks that even a combination of experience, knowledge and careful evaluation may not be able to overcome. The long-term commercial success of Obsidian Energy depends on our ability to find, acquire, develop and commercially produce oil and natural gas reserves. Without the continual addition of new reserves, our existing reserves, and the production from them, will decline over time as we produce from such reserves. A future increase in our reserves will depend on both our ability to explore and develop our existing properties and on our ability to select and acquire
41
suitable producing properties or prospects. There is no assurance that we will be able to continue to find satisfactory properties to acquire or participate in. Moreover, management of Obsidian Energy may determine that current markets, terms of acquisition, participation or pricing conditions make potential acquisitions or participations uneconomic. There is also no assurance that we will discover or acquire further commercial quantities of oil and natural gas.
Future oil and natural gas exploration may involve unprofitable efforts from dry wells as well as from wells that are productive but do not produce sufficient petroleum substances to return a profit after drilling, completing (including hydraulic fracturing), operating and other costs. Completion of a well does not assure a profit on the investment or recovery of drilling, completion and operating costs.
Drilling hazards, environmental damage and various field operating conditions could greatly increase the cost of operations and adversely affect the production from successful wells. Field operating conditions include, but are not limited to, delays in obtaining governmental approvals or consents, shut-ins of wells resulting from extreme weather conditions, insufficient storage or transportation capacity or geological and mechanical conditions. While diligent well supervision and effective maintenance operations can contribute to maximizing production rates over time, it is not possible to eliminate production delays and declines from normal field operating conditions, which can negatively affect revenue and cash flow levels to varying degrees.
Acquiring, exploring for, developing, and producing from oil and natural gas assets involves many risks. These risks include, but are not limited to:
| encountering unexpected formations or pressures; |
| premature declines of reservoirs; |
| the invasion of water into producing formations; |
| blowouts, explosions, equipment failures and other accidents; |
| sour gas releases; |
| uncontrollable flows of oil, natural gas or well fluids; |
| personal injury to staff and others; |
| adverse weather conditions, such as wild fires and flooding; and |
| pollution and other environmental risks, such as fires and spills. |
These typical risks and hazards could result in substantial damage to oil and natural gas wells, production facilities, other property, the environment and personal injury. Particularly, we may explore for and produce sour natural gas in certain areas. An unintentional leak of sour natural gas could result in personal injury, loss of life or damage to property and may necessitate an evacuation of populated areas, all of which could result in liability to us. Losses resulting from the occurrence of any of these risks may have a material adverse effect on our business, financial condition, results of operations and prospects.
Although we maintain insurance in accordance with customary industry practice based on our projected cost benefit analysis of maintaining such insurance, we are not fully insured against all of these risks, not all risks are insurable, and liabilities associated with certain risks could exceed policy limits or not be covered. Like other oil and natural gas companies, we attempt to conduct our business and financial affairs so as to protect against political and economic risks applicable to operations in the jurisdictions where we operate, but there can be no assurance that we will be successful in so protecting our assets.
Our hedging program subjects us to certain risks, including financial loss and counterparty risk.
From time to time, the Corporation may enter into agreements to receive fixed prices on its oil and natural gas production to offset the risk of revenue losses if commodity prices decline. However, to the extent that the Corporation engages in price risk management activities to protect itself from commodity price declines, it may also be prevented from realizing the full benefits of price increases above the levels of the derivative instruments used to manage price risk. In addition, the Corporations hedging arrangements may expose it to the risk of financial loss in certain circumstances, including instances in which:
| production falls short of the hedged volumes or prices fall significantly lower than projected; |
42
| there is a widening of price-basis differentials between delivery points for production and the delivery point assumed in the hedge arrangement; |
| the counterparties to the hedging arrangements or other price risk management contracts fail to perform under those arrangements; or |
| a sudden unexpected event materially impacts oil and natural gas prices. |
Similarly, from time to time the Corporation may enter into agreements to fix the exchange rate of Canadian to United States dollars or other currencies in order to offset the risk of revenue losses if the Canadian dollar increases in value compared to other currencies. However, if the Canadian dollar declines in value compared to such fixed currencies, the Corporation will not benefit from the fluctuating exchange rate.
Liability management programs enacted by regulators in the western provinces may prevent or interfere with the Corporations ability to acquire or dispose of properties or require the Corporation to make a substantial cash deposit with a regulator.
Alberta has developed a liability management program designed to prevent taxpayers from incurring costs associated with suspension, abandonment, remediation and reclamation of wells, facilities and pipelines in the event that a licensee or permit holder is unable to satisfy its regulatory obligations. This program involves an assessment of the ratio of a licensees deemed assets to deemed liabilities. If a licensees deemed liabilities exceed its deemed assets, a security deposit is generally required. Changes to the required ratio of our deemed assets to deemed liabilities or other changes to the requirements of liability management programs may result in significant increases to the Corporations compliance obligations. In addition, the liability management regime may prevent or interfere with the Corporations ability to acquire or dispose of assets as both the vendor and the purchaser of oil and gas assets must be in compliance with the liability management programs (both before and after the transfer of the assets) for the applicable regulatory agency to allow for the transfer of such assets. This is of particular concern to junior oil and gas companies that may be disproportionately affected by price instability. The recent Alberta Court of Queens Bench decision, Redwater Energy Corporation (Re), found an operational conflict between the Bankruptcy and Insolvency Act and the AERs abandonment and reclamation powers when the licensee is insolvent, which was affirmed by a majority of the Alberta Court of Appeal, and has been appealed by the AER to the Supreme Court of Canada for final determination. In response to the decision, the AER issued interim rules to administer the liability management program and until the Government of Alberta can develop new regulatory measures to adequately address environmental liabilities. There remains a great deal of uncertainty as to what new regulatory measures will be developed by the provinces or in concert with the federal government, as the final ruling will become binding in all Canadian jurisdictions. See Industry Conditions.
If we are unable to acquire or develop additional reserves, the value of our Common Shares will decline.
Absent equity capital injections, increased debt levels or the efficient deployment of capital investments by us, our production levels and reserves will decline over time.
Our future oil and natural gas reserves and production, and therefore our cash flow, will be highly dependent on our success in exploring and exploiting our reserves and land base and acquiring additional reserves. Without reserve additions through acquisition, exploration or development activities, our reserves and production will decline over time as our existing reserves are depleted.
To the extent that external sources of capital, including the issuance of additional Common Shares, become limited or unavailable, our ability to make the necessary capital investments to maintain or expand our oil and natural gas reserves may be impaired.
43
Fluctuations in foreign currency exchange rates and interest rates could adversely affect our business, and adversely affect the market price of our Common Shares.
World oil and natural gas prices are denominated in United States dollars and the Canadian dollar price received by Canadian producers is therefore affected by the Canadian/U.S. dollar exchange rate, which fluctuates over time. Material increases in the value of the Canadian dollar relative to the United States dollar will negatively affect, among other things, our oil production revenues in Canadian dollars. We generally fund our cash costs, in Canadian dollars. Strengthening of the Canadian dollar (excluding risk management activities) against the United States dollar negatively affects the amount of Canadian dollar funds available to us for reinvestment, and negatively affects the future value of our reserves as calculated by independent evaluators. Although a low value of the Canadian dollar relative to the United States dollar may positively affect the price we receive for our oil and natural gas production, it could also result in an increase in the price for certain goods used for our operations, which may have a negative impact on our financial results.
To the extent that the Corporation engages in risk management activities related to foreign exchange rates, there is a credit risk associated with counterparties with which the Corporation may contract.
An increase in interest rates could result in a significant increase in the amount we pay to service debt, resulting in a reduced amount available to fund our exploration and development activities which could negatively impact the market price of the Common Shares.
There can be no assurance that we will be successful in developing or acquiring additional reserves on terms that meet our investment objectives.
We may not be able to repay all or part of our indebtedness, or alternatively, refinance all or part of our indebtedness on commercially reasonable terms. We may not be able to comply with the covenants (and in particular the financial covenants) contained in our debt instruments. The occurrence of any one of these events could have a material adverse effect on our results of operations and financial condition, which in turn could negatively affect the market price of our Common Shares.
We currently have a reserve-based syndicated revolving credit facility in place that has an aggregate borrowing limit of $550 million, less the amount of our pari passu Senior Notes outstanding. The initial revolving period of the credit facility ends on May 17, 2018, with an additional one year term out period, and is subject to a semi-annual borrowing base redetermination in May and November of each year. As of December 31, 2017, there was $157 million of unused capacity under our credit facility. In the event that our credit facility is not extended before the maturity date, all outstanding indebtedness under such tranche will be repayable at that date. There is also a risk that our credit facility will not be renewed for the same principal amount or on the same terms. Any of these events could adversely affect our ability to fund our ongoing operations.
In addition, the Corporations credit facility may impose operating and financial restrictions on the Corporation that could include restrictions on the payment of dividends, the repurchase or making of other distributions with respect to the Corporations securities, the incurring of additional indebtedness, the provision of guarantees, the assumption of loans, the making of capital expenditures, the entering into of amalgamations, mergers, take-over bids or disposition of assets, among others.
The amount authorized under the Corporations credit facility is dependent on the borrowing base determined by its lenders. The Corporations lenders use the Corporations reserves, commodity prices, applicable discount rate and other factors to periodically determine the Corporations borrowing base. Commodity prices continue to be depressed and have fallen dramatically since 2014, and while prices have recently increased they remain volatile as a result of various factors including actions taken to limit OPEC and non-OPEC production and increasing production by U.S. shale producers. Depressed commodity prices could reduce the Corporations borrowing base, reducing the funds available to the Corporation under the credit facility. This could result in the requirement to repay a portion, or all, of the Corporations indebtedness.
We also currently have US$85 million principal amount of Senior Notes outstanding, which have maturity dates ranging between 2018 and 2025. In the event we are unable to repay or refinance these debt obligations (or if we must refinance these debt obligations on less favourable terms) it may adversely affect our ability to fund our ongoing operations.
44
We are required to comply with covenants under our credit facilities and Senior Notes which may, in certain cases, include certain financial ratio tests. In the event that we do not comply with covenants under one or more of these debt instruments, our access to capital could be restricted or repayment could be required, which could adversely affect our ability to fund our ongoing operations. Events beyond the Corporations control may contribute to the failure of the Corporation to comply with such covenants. A failure to comply with covenants could result in default under the Corporations credit facility, which could result in the Corporation being required to repay amounts owing thereunder.
In May 2015, the Company reached agreements with the lenders under its syndicated bank facility and with the holders of its Senior Notes to, among other things, amend the financial covenants in the bank facility and Senior Notes and temporarily grant floating charge security over all of its property in favour of the lenders and the noteholders on a pari passu basis. As a result, if the Company is unable to repay amounts owing under our credit facilities and Senior Notes, the lenders under the credit facilities and/or the holders of the Senior Notes could proceed to foreclose or otherwise realize upon the collateral granted to them to secure the indebtedness. The acceleration of our indebtedness under one agreement may permit acceleration of indebtedness under other agreements that contain cross default or cross-acceleration provisions. The security will be fully released on such date when both (a) no default or event of default is continuing under the Companys syndicated bank facility or senior notes and (b) the Company has achieved both (i) a Senior Debt to EBITDA ratio of 3:1 or less for four consecutive quarters, and (ii) an investment grade rating on its senior secured debt
If the Corporations lenders require repayment of all or a portion of the amounts outstanding under our credit facilities for any reason, including for a default of a covenant or the reduction of a borrowing base, there is no certainty that the Corporation would be in a position to make such repayment. Even if the Corporation is able to obtain new financing in order to make any required repayment under its credit facilities, it may not be on commercially reasonable terms or terms that are acceptable to the Corporation. If the Corporation is unable to repay amounts owing under credit facilities, the lenders under the credit facilities could proceed to foreclose or otherwise realize upon the collateral granted to them to secure the indebtedness.
We may experience challenges adopting new technologies and our costs may increase as a result of such adoption.
The oil and gas industry is characterized by rapid and significant technological advancements and introductions of new products and services utilizing new technologies. Other oil and gas companies may have greater financial, technical and personnel resources that allow them to enjoy technological advantages and may in the future allow them to implement new technologies before we do. There can be no assurance that we will be able to respond to such competitive pressures and implement such technologies on a timely basis or at an acceptable cost. If the Corporation does implement such technologies, there is no assurance that the Corporation will do so successfully. One or more of the technologies currently utilized by us or implemented in the future may become obsolete. In such case, our business, financial condition and results of operations could be materially adversely affected. If we are unable to utilize the most advanced commercially available technology, or we are unsuccessful in implementing certain technologies, our business, financial condition and results of operations could be materially adversely affected.
We may from time to time participate in one or more large projects and have more concentrated risks in these areas of our operations.
We manage a variety of small and large projects in the conduct of our business. Project delays may delay expected revenues from operations. Significant project cost over-runs could make a project uneconomic. Our ability to execute projects and market oil and natural gas depends upon numerous factors beyond our control, including:
| the availability of processing capacity; |
| the availability and proximity of transportation infrastructure; |
| the availability of storage capacity; |
| the availability of, and the ability to acquire, water supplies needed for drilling, hydraulic fracturing and waterfloods, or our ability to dispose of water used or removed from strata at a reasonable cost and in accordance with applicable environmental regulations; |
45
| the supply of and demand for oil and natural gas; |
| the availability of alternative fuel sources; |
| the effects of inclement weather; |
| the availability of drilling and related equipment; |
| unexpected cost increases; |
| accidental events; |
| currency fluctuations; |
| changes in regulations; |
| the availability and productivity of skilled labour; and |
| the regulation of the oil and natural gas industry by various levels of government and governmental agencies. |
Because of these factors, we could be unable to execute projects on time, on budget, or at all, and may not be able to effectively market the oil and natural gas that we produce.
The incorrect assessment of value at the time of acquisitions could adversely affect the value of our Common Shares.
Acquisitions of oil and gas properties or companies will be based in large part on engineering and economic assessments made by independent engineers. These assessments include a series of assumptions regarding such factors as recoverability and marketability of oil and gas, future prices of oil and gas and operating costs, future capital expenditures and royalties and other government levies which will be imposed over the producing life of the reserves. Many of these factors are subject to change and are beyond our control. All such assessments involve a measure of geological and engineering uncertainty that could result in lower production and reserves than anticipated. If actual reserves or production are less than we expect, our revenues and consequently the value of our Common Shares could be negatively affected.
Actual reserves will vary from reserves estimates and those variations could be material and negatively affect the market price of our Common Shares.
There are numerous uncertainties inherent in estimating quantities of oil, natural gas and natural gas liquid reserves and resources and future cash flows to be derived therefrom, including many factors beyond our control. The reserve and associated revenue information set forth herein represents estimates only. In general, estimates of economically recoverable oil and natural gas reserves and resources and the future net revenue therefrom are based upon a number of variable factors and assumptions, such as:
| historical production from the properties; |
| estimated production decline rates; |
| estimated ultimate recovery of reserves; |
| changes in technology; |
| timing and amount and effectiveness of future capital expenditures; |
| marketability and price of oil and natural gas; |
| royalty rates; |
| the assumed effects of regulation by governmental agencies; and |
| future operating costs; |
all of which may vary materially from actual results. As a result, estimates of the economically recoverable oil and natural gas reserves or estimates of resources attributable to any particular group of properties, classification of such reserves based on risk of recovery and estimates of future net revenues expected therefrom prepared by different engineers, or by the same engineers at different times, may vary. Our actual production, revenues and development and operating expenditures will vary from reserve and resource estimates thereof and such variations could be material.
46
Estimates of proved reserves that may be developed and produced in the future are sometimes based upon volumetric calculations and upon analogy to similar types of reserves rather than actual production history. Recovery factors and drainage areas are often estimated by experience and analogy to similar producing pools. Estimates based on these methods are generally less reliable than those based on actual production history. Subsequent evaluation of the same reserves based upon production history and production practices will result in variations in the estimated reserves and such variations could be material.
In accordance with applicable securities laws, Sproule has used forecast price and cost estimates in calculating the reserve quantities and future net revenue disclosed herein. Actual future net revenue will be affected by other factors including but not limited to actual production levels, supply and demand for oil and natural gas, curtailments or increases in consumption by oil and natural gas purchasers, changes in governmental regulation or taxation and the impact of inflation on costs.
Actual production and revenue derived from the Corporations reserves will vary from the reserve estimates contained in the Engineering Report summarized herein, and such variations could be material. The Engineering Report summarized herein is based in part on the assumption that certain activities will be undertaken by us in future years and the further assumption that such activities will be successful. The reserves and estimated revenue to be derived therefrom contained in the Engineering Report summarized herein will be reduced in future years to the extent that such activities are not undertaken or, if undertaken, do not achieve the level of success assumed in the Engineering Report summarized herein. The reserves evaluation described herein is effective as of a specific date and, except as otherwise noted, has not been updated and thus does not reflect changes in our reserves since that date.
We may be unable to successfully compete with other companies in our industry, which could negatively affect the market price of our Common Shares.
There is strong competition relating to all aspects of the oil and gas industry. We compete with numerous other exploration and production companies (some of whom have substantially greater financial resources, staff and facilities than those of the Corporation) for, among other things:
| resources, including capital and skilled personnel; |
| the acquisition of properties with longer life reserves and exploitation and development opportunities; and |
| access to equipment, markets, transportation capacity, drilling and service rigs and processing facilities. |
Some of these companies with whom we compete not only explore for, develop and produce oil and natural gas, but also carry on refining operations and market oil and natural gas on an international basis. As a result of these complementary activities, some of these competitors may have greater and more diverse competitive resources to draw on than the Corporation.
Seasonal factors and extreme weather conditions (including wild fires and flooding) may lead to declines in our activities and thereby adversely affect our business, and the market price of our Common Shares.
The level of activity in the Canadian oil and gas industry is influenced by seasonal weather patterns. Wet weather and spring thaw may make the ground unstable. Consequently, municipalities and provincial transportation departments enforce road bans that restrict the movement of rigs and other heavy equipment, thereby reducing activity levels. Roads bans and other restrictions generally result in a reduction of drilling and exploratory activities and may also result in the shut-in of some of the Corporations production if not otherwise tied-in. Also, certain oil and gas producing areas are located in areas that are inaccessible other than during the winter months because the ground surrounding the sites in these areas consists of swampy terrain. In addition, extreme cold weather, heavy snowfall and heavy rainfall may restrict the Corporations ability to access its properties and cause operational difficulties, including damage to machinery, or contribute to personnel injury because of dangerous working conditions.
Our operations are susceptible to the impacts of wild fires and flooding. In recent years, our production levels (and as a result our revenues) have at times been materially and adversely affected by wild fires and flooding. In addition to the loss of revenue
47
that results from the loss of production when our operations are affected by wild fires and/or flooding, we incur expenses responding to such events, repairing damaged equipment, and resuming operations. Although our insurance policies may compensate us for part of our losses, they will not compensate us for all of our losses. In addition, wild fires and/or flooding consume both financial resources and management and employee time that would otherwise be directed towards the development of our business and the pursuit of our business strategy. We can offer no assurance that the severe wild fires and flooding that have at times plagued our operations in recent years will not occur again in the future with equal or greater severity.
Seasonal factors and unexpected weather patterns, including wild fires and flooding, may lead to material declines in our exploration, development and production activities and may consume material amounts of our financial and human resources, and thereby materially and adversely affect our results of operations and financial condition.
Our operation of oil and natural gas wells, and our participation in oil and natural gas wells operated by others, could subject us to environmental claims and liability and/or increased compliance costs, all of which could affect the market price of our Common Shares.
All phases of the oil and natural gas business present environmental risks and hazards and are subject to environmental regulation pursuant to a variety of federal, provincial and local laws and regulations. Environmental legislation provides for, among other things, restrictions and prohibitions on spills, releases or emissions of various substances produced in association with oil and natural gas operations. In addition, such legislation sets out requirements with respect to oilfield waste handling and storage, habitat protection and the satisfactory operation, maintenance, abandonment and reclamation of well and facility sites. Compliance with environmental legislation can require significant expenditures and a breach of such requirements may result in suspension or revocation of necessary licenses and authorizations, civil liability for pollution damage and the imposition of fines and penalties, some of which may be material. Environmental legislation is evolving in a manner expected to result in stricter standards and enforcement, larger fines and legal liability, and potentially increased capital expenditures and operating costs. The discharge of oil, natural gas or other pollutants into the air, soil or water may give rise to liabilities to governments and third parties and may require us to incur costs to remedy such discharge. Although we believe that we will be in material compliance with current applicable environmental legislation, no assurance can be given that environmental compliance requirements will not result in a curtailment of production or a material increase in the costs of production, development or exploration activities or otherwise have a material adverse effect on our business, financial condition, results of operations and prospects. See Industry Conditions.
Regulations regarding the disposal of fluids used in the Corporations operations may increase its costs of compliance or subject it to regulatory penalties or litigation.
The safe disposal of the hydraulic fracturing fluids (including the additives) and water recovered from oil and natural gas wells is subject to ongoing regulatory review by the federal and provincial governments, including its effect on fresh water supplies and the ability of such water to be recycled, amongst other things. While it is difficult to predict the impact of any regulations that may be enacted in response to such review, the implementation of stricter regulations may increase the Corporations costs of compliance.
Changes to royalty regimes may have a material and adverse impact on our financial condition.
There can be no assurance that the federal government and the provincial governments of the western provinces will not adopt a new, or modify the existing, royalty regime, which in each case may have an impact on the economics of our projects. An increase in royalties would reduce our earnings and could make future capital investments, or our operations, less economic. On January 29, 2016, the Government of Alberta adopted a new royalty regime which took effect on January 1, 2017. See Industry Conditions.
48
We may not be able to achieve the anticipated benefits of acquisitions or dispositions and the integration of acquisitions may result in the loss of key employees and the disruption of on-going business relationships.
We make acquisitions and dispositions of businesses and assets in the ordinary course of business. Achieving the benefits of acquisitions depends in part on successfully consolidating functions and integrating operations and procedures in a timely and efficient manner, as well as our ability to realize the anticipated growth opportunities and synergies from combining the acquired businesses and operations with ours. The integration of acquired businesses may require substantial management effort, time and resources and may divert managements focus from other strategic opportunities and operational matters, and may also result in the loss of key employees, the disruption of on-going business, supplier, customer and employee relationships and deficiencies in internal controls or information technology controls. We continually assess the value and mix of our assets in light of our business plans and strategic objectives. In this regard, non-core assets are periodically disposed of so that we can focus our efforts and resources more efficiently. Depending on the state of the market for such non-core assets, certain of our non-core assets may realize less on disposition than their carrying value in our financial statements.
Increased debt levels may impair the Corporations ability to borrow additional capital on a timely basis to fund opportunities as they arise.
From time to time, we may enter into transactions to acquire assets or shares of other organizations. These transactions may be financed in whole or in part with debt, which may increase our debt levels above industry standards for oil and natural gas companies of similar size. Depending on future exploration and development plans, we may require additional debt financing that may not be available or, if available, may not be available on favourable terms. Neither our articles nor our by-laws limit the amount of indebtedness that we may incur. The level of our indebtedness from time to time could impair our ability to obtain additional financing on a timely basis to take advantage of business opportunities that may arise, and may adversely affect the market price of our Common Shares if investors consider our debt levels to be higher than that of our peers.
Our oil and gas assets may be subject to terrorist attack.
The Corporations oil and natural gas properties, wells and facilities could be subject to a terrorist attack. If any of our properties, wells or facilities are the subject of a terrorist attack it could have a material adverse effect on us. We do not currently have insurance to protect against the risk of terrorism.
Canadian and United States practices differ in reporting reserves and production and our estimates may not be comparable to those of companies in the United States.
In this Annual Information Form, we report our production and reserve quantities in accordance with Canadian practices and specifically in accordance with NI 51-101. These practices are different from the practices used to report production and to estimate reserves in reports and other materials filed with the SEC by United States companies. Nevertheless, as part of Obsidian Energys Form 40-F for the year ended December 31, 2017 filed with the SEC, Obsidian Energy has disclosed proved reserves quantities using the standards contained in SEC Regulation S-X, and the standardized measure of discounted future net cash flows relating to proved oil and gas reserves determined in accordance with the U.S. Financial Accounting Standards Board, Disclosures About Oil and Gas Producing Activities, which disclosure complies with the SECs rules for disclosing oil and gas reserves.
Our ability to make future capital expenditures may depend on our ability to access third party financing.
The Corporation anticipates making substantial capital expenditures for the acquisition, exploration, development and production of oil and natural gas reserves in the future. As future capital expenditures will be financed out of cash generated from operations, borrowings and possible future equity sales, the Corporations ability to do so is dependent on, among other factors:
| the overall state of the capital markets; |
| the Corporations credit rating (if applicable); |
49
| commodity prices; |
| interest rates; |
| royalty rates; |
| tax burden due to current and future tax laws; and |
| investor appetite for investments in the energy industry and the Corporations securities in particular. |
Further, if the Corporations revenues or reserves decline, it may not have access to the capital necessary to undertake or complete future drilling programs. The current conditions in the oil and gas industry have at times negatively impacted the ability of some oil and gas companies to access additional financing. There can be no assurance that debt or equity financing, or cash generated by operations, will be available or sufficient to meet these requirements or for other corporate purposes or, if debt or equity financing is available, that it will be on terms acceptable to the Corporation. The Corporation may be required to seek additional equity financing on terms that are highly dilutive to existing shareholders. The inability of the Corporation to access sufficient capital for its operations could have a material adverse effect on the Corporations business financial condition, results of operations and prospects.
A lack of access to capital could harm our financial condition and results of operations.
The Corporations cash flow from its reserves may not be sufficient to fund its ongoing activities at all times and from time to time, the Corporation may require additional financing in order to carry out its oil and natural gas acquisition, exploration and development activities. Failure to obtain financing on a timely basis could cause the Corporation to forfeit its interest in certain properties, miss certain acquisition opportunities, and/or reduce or terminate its operations. Due to the conditions in the oil and gas industry and/or global economic and political volatility, the Corporation may from time to time have restricted access to capital and increased borrowing costs. The current conditions in the oil and gas industry have at times negatively impacted the ability of some oil and gas companies to access additional financing.
As a result of global economic and political volatility, the Corporation may from time to time have restricted access to capital and increased borrowing costs. Failure to obtain such financing on a timely basis could cause the Corporation to forfeit its interest in certain properties, miss certain acquisition opportunities and reduce or terminate its operations. If the Corporations revenues from its reserves decrease as a result of lower oil and natural gas prices or otherwise, it will affect the Corporations ability to expend the necessary capital to replace its reserves or to maintain its production. To the extent that external sources of capital become limited, unavailable or available on onerous terms, the Corporations ability to make capital investments and maintain existing assets may be impaired, and its assets, liabilities, business, financial condition and results of operations may be affected materially and adversely as a result. In addition, the future development of the Corporations petroleum properties may require additional financing and there are no assurances that such financing will be available or, if available, will be available upon acceptable terms. Alternatively, any available financing may be highly dilutive to existing shareholders. Failure to obtain any financing necessary for the Corporations capital expenditure plans may result in a delay in development or production on the Corporations properties, or may force the Corporation to divest of certain assets that it would otherwise not sell.
The failure of third parties to meet their contractual obligations to us may have a material adverse effect on our financial condition.
We may be exposed to third party credit risk through our contractual arrangements with our current or future joint venture partners, marketers of our petroleum and natural gas production and other parties. In addition, we may be exposed to third party credit risk from operators of properties in which we have a working or royalty interest. In the event such entities fail to meet their contractual obligations to us, such failures may have a material adverse effect on our business, financial condition, results of operations and prospects. In addition, poor credit conditions in the industry and of joint venture partners may affect a joint venture partners willingness to participate in our ongoing capital program, potentially delaying the program and the results of such program until we find a suitable alternative partner. To the extent that any of such third parties go bankrupt, become insolvent or make a proposal or institute any proceedings relating to bankruptcy or insolvency, it could result in the Corporation being unable to collect all or a portion of any money owing from such parties. Any of these factors could materially adversely affect our financial and operational results.
50
In the normal course of our operations, we are exposed to litigation, which if determined adversely, could have a material and adverse impact on us.
In the normal course of our operations, we may become involved in, named as a party to, or be the subject of, various legal proceedings, including regulatory proceedings, tax proceedings and legal actions, relating to personal injuries (including resulting from exposure to hazardous substances), property damage, property taxes, land and access rights, environmental issues (including claims relating to contamination or natural resource damages), securities law matters (such as our public disclosures), and contract disputes. The outcome of outstanding, pending or future proceedings cannot be predicted with certainty and may be determined adversely to us and as a result, could have a material adverse effect on our assets, liabilities, business, financial condition and results of operations. Even if we prevail in any such legal proceedings, the proceedings could be costly and time-consuming and may divert the attention of management and key personnel from business operations, which could have an adverse affect on our financial condition.
The impact on us of claims of aboriginal title is unknown.
Aboriginal peoples have claimed aboriginal title and rights to portions of Western Canada. We are not aware that any material claims have been made in respect of our properties and assets; however, if a material claim arose and was successful this could have an adverse effect on our results of operations and business. In addition, the process of addressing such claims, regardless of the outcome, is expensive and time consuming and could result in delays which could have a material adverse effect on our business and financial results.
Our exploration and development activities may be delayed if drilling and related equipment is unavailable or if access to drilling locations is restricted. These events could have an adverse impact on our business.
Oil and natural gas exploration and development activities depend on the availability of drilling and related equipment (typically leased from third parties) as well as skilled personnel trained to use such equipment in the areas where such activities will be conducted. Demand for such limited equipment and skilled personnel, or access restrictions, may affect the availability of such equipment and skilled personnel to us and may delay exploration and development activities.
We rely on third parties to operate some of our assets.
Other companies operate some of the assets in which the Corporation has an interest. The Corporation has limited ability to exercise influence over the operation of those assets or their associated costs, which could adversely affect the Corporations financial performance. The Corporations return on assets operated by others depends upon a number of factors that may be outside of the Corporations control, including, but not limited to, the timing and amount of capital expenditures, the operators expertise and financial resources, the approval of other participants, the selection of technology, and risk management practices.
In addition, due to the current low and volatile commodity price environment, many companies, including companies that may operate some of the assets in which the Corporation has an interest, may be in financial difficulty, which could impact their ability to fund and pursue capital expenditures, carry out their operations in a safe and effective manner, and satisfy regulatory requirements with respect to abandonment and reclamation obligations. If companies that operate some of the assets in which the Corporation has an interest fail to satisfy regulatory requirements with respect to abandonment and reclamation obligations, the Corporation may be required to satisfy such obligations and to seek reimbursement from such companies. To the extent that any of such companies go bankrupt, become insolvent or make a proposal or institute any proceedings relating to bankruptcy or insolvency, it could result in such assets being shut-in, the Corporation potentially becoming subject to additional liabilities relating to such assets, and the Corporation having difficulty collecting revenue due from such operators or recovering amounts owing to the Corporation from such operators for their share of abandonment and reclamation obligations. Any of these factors could have a material adverse affect on the Corporations financial and operational results.
51
A portion of the Corporations revenues from royalty payers and certain of its operations are dependent on the financial and operational capacity of third party working interest owners to develop and produce from the Corporations properties, over which it has limited influence.
The Corporation relies on other companies drilling and producing from lands in which the Corporation has a royalty interest. The Corporation has limited ability to exercise influence over the decision of other companies to drill and produce from such lands. The Corporations return on lands in which it has a royalty interest depends upon a number of factors that may be outside of the Corporations control, including, but not limited to, the capital expenditure budgets and financial resources of the companies who have a working interest in such lands, the operators ability to efficiently produce the resources from such lands, and commodity prices.
In addition, due to the current low and volatile commodity price environment, many companies, including companies that may have a working interest in the lands in which the Corporation has a royalty interest, may be in financial difficulty, which could affect their ability to fund and pursue capital expenditures on such lands. In addition, weak commodity prices might result in companies choosing to defer capital spending or shutting-in existing production. Any reduction in drilling and production from lands in which the Corporation has a royalty interest will negatively affect the Corporations cash flows and financial results.
The financial difficulty of any companies who have assets in which the Corporation has a royalty interest may affect the Corporations ability to collect royalty payments, particularly if such companies go bankrupt, become insolvent or make a proposal or institute any proceedings relating to bankruptcy or insolvency.
Changes in Canadian income tax legislation and other laws may adversely affect us and our Shareholders.
Income tax laws, or other laws or government incentive programs relating to the oil and gas industry, such as the treatment of resource taxation or dividends or capital gains, may in the future be changed or interpreted in a manner that adversely affects us and our Shareholders. Furthermore, tax authorities having jurisdiction over us or our Shareholders may disagree with how we calculate our income for tax purposes or could change administrative practises to our detriment or the detriment of our Shareholders.
We file all required income tax returns and believe that we are in compliance with the provisions of the Tax Act and all other applicable provincial tax legislation. However, such returns are subject to reassessment by the applicable taxation authority. In the event of a successful reassessment of Obsidian Energy, whether by re-characterization of exploration and development expenditures or otherwise, such reassessment may have an impact on current and future taxes payable.
We may incur material expenses complying with new or amended laws and regulations governing climate change.
Our exploration and production facilities and other operations and activities emit greenhouse gases which may require us to comply with GHG emissions legislation at the provincial or federal level. Climate change policy is evolving at regional, national and international levels, and political and economic events may significantly affect the scope and timing of climate change measures that are ultimately put in place. As a signatory to the United Nations Framework Convention on Climate Change and a signatory to the Paris Agreement, which was ratified in Canada on October 3, 2016, the Government of Canada pledged to cut its GHG emissions by 30 per cent from 2005 levels by 2030. One of the pertinent policies announced to date by the Government of Canada to reduce GHG emission is the planned implementation of a nation-wide price on carbon emissions. Provincially, the Government of Alberta has already implemented a carbon levy on almost all sources of GHG emissions, now at a rate of $30 per tonne. The direct or indirect costs of compliance with GHG-related regulations may have a material adverse effect on the Corporations business, financial condition, results of operations and prospects. Some of the Corporations significant facilities may ultimately be subject to future regional, provincial and/or federal climate change regulations to manage GHG emissions. In addition, concerns about climate change have resulted in a number of environmental activists and members of the public opposing the continued exploitation and development of fossil fuels. Given the evolving nature of the debate related to climate change and the control of GHG and resulting requirements, it is expected that current and future climate change regulations will have the effect of increasing the Corporations operating expenses and in the long-term reducing the demand for oil and gas production resulting in a decrease in the Corporations profitability and a reduction in the value of its assets or asset write-offs. See Industry Conditions.
52
Taxes on carbon emissions affect the demand for oil and natural gas, the Corporations operating expenses and may impair the Corporations ability to compete.
The majority of countries across the globe have agreed to reduce their carbon emissions in accordance with the Paris Agreement. See Industry Conditions. In Canada, the federal and certain provincial governments have implemented legislation aimed at incentivizing the use of alternatives fuels and in turn reducing carbon emissions. The taxes placed on carbon emissions may have the effect of decreasing the demand for oil and natural gas products and at the same time, increasing the Corporations operating expenses, each of which may have a material adverse effect on the Corporations profitability and financial condition. Further, the imposition of carbon taxes puts the Corporation at a disadvantage with its competitors who operate in jurisdictions where there are less costly carbon regulations.
We are exposed to potential liabilities that may not be covered, in part or in whole, by insurance.
Our involvement in the exploration and development of oil and natural gas properties could subject us to liability for pollution, blowouts, leaks of sour natural gas, property damage, personal injury or other hazards. Prior to commencing operations, we obtain insurance in accordance with industry standards to address certain of these risks. Such insurance has limitations on liability that may not be sufficient to cover the full extent of such liabilities. In addition, such risks may not, in all circumstances, be insurable or, in certain circumstances, we may elect not to obtain insurance to deal with specific risks due to the high premiums associated with such insurance or other reasons. The payment of such uninsured liabilities would reduce the funds available to us. The occurrence of a significant event that we are not fully insured against, or the insolvency of the insurer of such event, could have a material adverse effect on our financial position, results of operations or prospects.
We depend upon our management and other key personnel and the loss of one or more of such individuals could negatively affect our business.
The Corporations success depends in large measure on certain key personnel. The loss of the services of such key personnel may have a material adverse effect on the Corporations business, financial condition, results of operations and prospects. The Corporation does not have any key personnel insurance in effect for the Corporation. The contributions of the existing management team to the immediate and near term operations of the Corporation are likely to be of central importance. In addition, the competition for qualified personnel in the oil and natural gas industry is intense and there can be no assurance that the Corporation will be able to continue to attract and retain all personnel necessary for the development and operation of its business. Investors must rely upon the ability, expertise, judgment, discretion, integrity and good faith of the management of the Corporation.
Future acquisitions, financings or other transactions and the issuance of securities pursuant to our equity incentive plans may result in Shareholder dilution.
We may make future acquisitions or enter into financings or other transactions involving the issuance of our securities, which may be dilutive to Shareholders. Shareholder dilution may also result from the issuance of Common Shares pursuant to our stock option plan and our restricted and performance share unit plan. For more information regarding these compensation plans, see our most recent Information Circular and Proxy Statement, financial statements and related MD&A filed on SEDAR at www.sedar.com.
We do not operate all of our properties and facilities. Therefore, our results of operations may be adversely affected by pipeline interruptions and apportionments, railway interruptions and/or the actions or inactions of third party operators, any of which could cause delays in receiving our revenues and cause us to incur additional expenses, which could in turn adversely affect the market price of our Common Shares.
We deliver our products through gathering and processing facilities, pipeline systems and, in certain circumstances, by railway systems. The amount of oil and natural gas that we can produce and sell is subject to the accessibility, availability, proximity and capacity of these gathering and processing facilities, pipeline systems and railway lines. The lack of availability of capacity in any of the gathering and processing facilities, pipeline systems or railway lines, could result in our inability to realize the full
53
economic potential of our production or in a reduction of the price offered for our production. The lack of firm pipeline capacity continues to affect the oil and natural gas industry and limit the ability to transport produced oil and natural gas to market. In addition, the pro-rationing of capacity on inter-provincial pipeline systems also continues to affect the ability to export oil and natural gas. Unexpected shut downs or curtailment of capacity of pipelines for maintenance or integrity work or because of actions taken by regulators could also affect the Corporations production, operations and financial results. As a result, producers are increasingly turning to rail as an alternative means of transportation and competition for contracting rail capacity is increasing. In recent years, the volume of crude oil shipped by rail in North America has increased dramatically. Any significant change in market factors or other conditions affecting these infrastructure systems and facilities, as well as any delays in constructing new infrastructure systems and facilities (or uncertainty regarding whether such construction will proceed), could harm our business and, in turn, our financial condition, results of operations and cash flows. Announcements and actions taken by the governments of British Columbia and Alberta relating to approval of infrastructure projects may continue to intensify, leading to increased challenges to interprovincial and international infrastructure projects moving forward. In addition, while the federal government has recently introduced draft legislation to overhaul the existing environmental assessment process and replace the NEB with a new regulatory agency, the impact of the new proposed regulatory scheme on proponents and the timing of receipt of approvals of major projects remains unclear.
Following major accidents in Lac-Megantic, Quebec and North Dakota, the Transportation Safety Board of Canada and the U.S. National Transportation Board have recommended additional regulations for railway tank cars carrying crude oil. In June 2015, as a result of these recommendations, the Government of Canada passed the Safe and Accountable Rail Act, which increased insurance obligations on the shipment of crude oil by rail and imposed a per tonne levy of $1.65 on crude oil shipped by rail to compensate victims and for environmental cleanup in the event of a railway accident. In addition to this legislation, new regulations have implemented the TC-117 standard for all rail tank cars carrying flammable liquids which formalized the commitment to retrofit, and eventually phase out, DOT-111 tank cars carrying crude oil. The increased regulation of rail transportation may reduce the ability of railway lines to alleviate pipeline capacity issues and add additional costs to the transportation of crude oil by rail. On July 13, 2016, the Minister of Transport (Canada) issued Protective Direction No. 38, which directed that the shipping of crude oil on DOT-111 tank cars end by November 1, 2016. Tank cars entering Canada from the United States will be monitored to ensure they are compliant with Protective Direction No. 38.
A portion of our production may, from time to time, be processed through facilities owned by third parties that we do not control. From time to time these facilities may discontinue or decrease operations either as a result of normal servicing requirements or as a result of unexpected events. A discontinuation or decrease of operations could materially adversely affect our ability to process our production and to deliver the same for sale. Midstream and pipeline companies may take actions to maximize their return on investment which may in turn adversely affect producers and shippers, especially when combined with a regulatory framework that may not always align with the interests of particular shippers.
Lower oil and gas prices and higher costs increase the risk of write-downs of our oil and gas property assets and goodwill (if any).
Under IFRS, when indicators of impairment exist, the carrying value of our Property, Plant and Equipment (PP&E) and Goodwill (if any) is compared to its recoverable amount. The recoverable amount is defined as the higher of the fair value less cost to sell or value in use. A decline in oil and gas prices may be an indicator of impairment and may result in a write-down of the value of our assets. While these write-downs would not affect cash flow from operations, the charge to earnings may be viewed unfavourably by investors and could adversely impact the market price of our Common Shares and the calculation of our compliance with the financial covenants contained in our debt instruments. PP&E asset write-downs may also be reversed to earnings in future periods should the conditions that caused impairment reverse.
We may not be able to maintain the confidentiality of sensitive information in business dealings with third parties, and our remedies for breaches of confidentiality may not fully compensate us for our losses.
While discussing potential business relationships or other transactions with third parties, we may disclose confidential information relating to our business, operations or affairs. Although confidentiality agreements are generally signed by third
54
parties prior to the disclosure of any confidential information, a breach could put us at competitive risk and may cause significant damage to our business. The harm to our business from a breach of confidentiality cannot presently be quantified, but may be material and may not be compensable in damages. There is no assurance that, in the event of a breach of confidentiality, we will be able to obtain equitable remedies, such as injunctive relief, from a court of competent jurisdiction in a timely manner, if at all, in order to prevent or mitigate any damage to our business that such a breach of confidentiality may cause.
Our inability to manage growth could adversely affect our business and our Shareholders.
We may be subject to growth related risks, including capacity constraints and pressures on our internal systems and controls. These constraints and pressures could result from, among other things, the completion of large acquisitions. Our ability to manage growth effectively will require us to continue to implement and improve our operational and financial systems and to expand, train and manage our employee base. Our inability to deal with this growth could have a material adverse impact on our business, operations and prospects.
The market price of our Common Shares has been and will likely continue to be volatile and may at times be less than our net asset value per Common Share.
The trading price of securities of oil and natural gas issuers is subject to substantial volatility and is often based on factors both related and unrelated to the financial performance or prospects of the issuers involved. Factors unrelated to our performance could include macroeconomic developments nationally, within North America or globally, domestic and global commodity prices or current perceptions of the oil and gas market. In certain jurisdictions, institutions, including government sponsored entities, have determined to decrease their ownership in oil and gas entities which may impact the liquidity of certain securities and may put downward pressure on the trading price of those securities. Similarly, the market price of our Common Shares could be subject to significant fluctuations in response to variations in our operating results, financial condition, liquidity, debt levels and other internal factors.
Our net asset value from time to time will vary depending upon a number of factors beyond our control, including oil and gas prices. The trading price of the Common Shares from time to time is determined by a number of factors, some of which are beyond our control and such trading price may be greater or less than our net asset value. Accordingly, the price at which our Common Shares will trade cannot be accurately predicted.
An unforeseen defect in the chain of title to our oil and natural gas producing properties may arise to defeat our claim, which could have an adverse effect on the market price of our Common Shares.
Although title reviews may be conducted prior to the purchase of oil and natural gas producing properties or the commencement of drilling wells, such reviews do not guarantee or certify that an unforeseen defect in the chain of title will not arise. The actual interest of the Corporation in properties may accordingly vary from the Corporations records. If a title defect does exist, it is possible that the Corporation may lose all or a portion of the properties to which the title defect relates, which may have a material adverse effect on the Corporations business, financial condition, results of operations and prospects. There may be valid challenges to title or legislative changes, which affect the Corporations title to the oil and natural gas properties the Corporation controls that could impair the Corporations activities on them and result in a reduction of the revenue received by the Corporation.
The ability of residents of the United States to enforce civil remedies against us and our directors, officers and experts may be limited.
Obsidian Energy is organized under the laws of Alberta, Canada and our principal places of business are in Canada. Most of our directors and officers and the experts named herein are residents of Canada, and a substantial portion of our assets and all or a substantial portion of the assets of most of such persons are located outside the United States. As a result, it may be difficult for investors in the United States to effect service of process within the United States upon those directors, officers and experts
55
who are not residents of the United States or to enforce against them judgments of United States courts based upon civil liability under the United States federal securities laws or the securities laws of any state within the United States. There is doubt as to the enforceability in Canada against us or against any of our directors, officers or experts who are not residents of the United States, in original actions or in actions for enforcement of judgments of United States courts of liabilities based solely upon the United States federal securities laws or the securities laws of any state within the United States.
The termination or expiration of licenses and leases through which we or our industry partners hold our interests in petroleum and natural gas substances could adversely affect the market price of our Common Shares.
Our properties are held in the form of licenses and leases and working interests in licenses and leases. If we or the holder of the license or lease fail to meet the specific requirement of a license or lease, the license or lease may terminate or expire. There can be no assurance that all of the obligations required to maintain each license or lease will be met. The termination or expiration of a license or lease or the working interest relating to a license or lease may have a material adverse effect on our results of operations and business.
We suspended our quarterly dividend in 2015 and there can be no assurance that we will resume making dividend payments in the future.
The Board suspended our quarterly dividend until further notice following the dividend payment made on October 15, 2015. The payment of dividends in the future will be dependent on, among other things, the cash flow, results of operations and financial condition of the Corporation, the need for funds to finance ongoing operations, and other considerations as the Board considers relevant. There can be no assurance that we will resume making dividend payments in the future or, if we do, the amount of dividend payments that we will make.
Our directors and management may have conflicts of interest that may create incentives for them to act contrary to or in competition with the interests of our Shareholders.
Certain directors and officers of Obsidian Energy are engaged in, and will continue to engage in, other activities in the oil and natural gas industry and, as a result of these and other activities, the directors and officers of Obsidian Energy may become subject to conflicts of interest. The ABCA provides that in the event that a director has an interest in a contract or proposed contract or agreement, the director must disclose his interest in such contract or agreement and must refrain from voting on any matter in respect of such contract or agreement unless otherwise provided under the ABCA. To the extent that conflicts of interest arise, such conflicts will be resolved in accordance with the provisions of the ABCA and our Code of Business Conduct and Ethics. See Directors and Executive Officers of Obsidian Energy Conflicts of Interest.
A decrease in the fair market value of our hedging instruments could result in a non-cash charge against our income under applicable accounting standards.
Under IFRS, accounting for financial instruments may result in non-cash charges against income as a result of reductions in the fair market value of hedging instruments. A decrease in the fair market value of the hedging instruments as a result of fluctuations in commodity prices and/or foreign exchange rates may result in a non-cash charge against income, which may be viewed unfavourably in the market.
We may in the future expand our operations into new geographical regions where our existing management does not have experience. In addition, we may in the future acquire new types of energy related assets in respect of which our existing management does not have experience. Any such expansion or acquisition could result in our exposure to new risks that if not properly managed could ultimately have an adverse effect on our business and the market price of our Common Shares.
The operations and expertise of our management are currently focused primarily on oil and gas production, exploration and development in the Western Canada Sedimentary Basin. In the future, we may acquire or develop oil and gas properties outside of this geographic area. In addition, we could acquire other energy related assets, such as upgraders or pipelines. Expansion of our activities into new areas may present new risks or alternatively, significantly increase our exposure to one or more existing risk factors, which may in turn result in our future operational and financial conditions being adversely affected.
56
The Corporation relies on its reputation to continue its operations and to attract and retain investors and employees.
Any environmental damage, loss of life, injury or damage to property caused by the Corporations operations could damage the Corporations reputation in the areas in which the Corporation operates. Negative sentiment towards the Corporation could result in a lack of willingness of municipal authorities being willing to grant the necessary licenses or permits for the Corporation to operate its business and in residents in the areas where the Corporation is doing business opposing further operations in the area by the Corporation. If the Corporation develops a reputation of having an unsafe work site it may impact the ability of the Corporation to attract and retain the necessary skilled employees and consultants to operate its business. Further, the Corporations reputation could be affected by actions and activities of other corporations operating in the oil and gas industry, over which the Corporation has no control. In addition, environmental damage, loss of life, injury or damage to property caused by the Corporations operations could result in negative investor sentiment towards the Corporation, which may result in limiting the Corporations access to capital, increasing the cost of capital, and decreasing the price and liquidity of the Common Shares.
Our information assets and critical infrastructure may be subject to destruction, theft, cyber-attacks or misuse by unauthorized parties.
We have become increasingly dependent upon the availability, capacity, reliability and security of our information technology infrastructure and our ability to expand and continually update this infrastructure to conduct daily operations. We depend on various information technology systems to estimate reserve quantities, process and record financial data, manage our land base, analyze seismic information, administer our contracts with our operators and lessees and communicate with employees and third-party partners.
As a result, we are subject to a variety of information technology and/or system risks as a part of our normal course operations, including potential breakdown, invasion, virus, cyber-attack, cyber-fraud, security breach, and destruction or interruption of our information technology systems by third parties or insiders. Unauthorized access to these systems by employees or third parties could lead to corruption or exposure of confidential, fiduciary or proprietary information, interruption to communications or operations, or disruption to our business activities or our competitive position. In addition, cyber phishing attempts, in which a malicious party attempts to obtain sensitive information such as usernames, passwords, and credit card details (and money) by disguising as a trustworthy entity in an electronic communication, have become more widespread and sophisticated in recent years. If the Corporation becomes a victim to a cyber phishing attack it could result in a loss or theft of the Corporations financial resources or critical data and information or could result in a loss of control of the Corporations technological infrastructure or financial resources. The Corporation applies technical and process controls in line with industry-accepted standards to protect our information assets and systems; however, these controls may not adequately prevent cyber-security breaches. Disruption of critical information technology services, or breaches of information security, could have a negative effect on our performance and earnings, as well as on our reputation. The significance of any such event is difficult to quantify, but may in certain circumstances be material and could have a material adverse effect on the Corporations business, financial condition and results of operations.
There might not always be an active trading market in the United States and/or Canada for the Common Shares.
While there is currently an active trading market for the Common Shares in both the United States and Canada, we cannot guarantee that an active trading market will be sustained in either country. If an active trading market in the Common Shares is not sustained, the trading liquidity of the Common Shares will be limited and the market value of the Common Shares may be reduced.
57
Forward-Looking Information May Prove Inaccurate.
Shareholders and prospective investors are cautioned not to place undue reliance on the Corporations forward-looking information. By its nature, forward-looking information involves numerous assumptions, known and unknown risks and uncertainties, of both a general and specific nature, that could cause actual results to differ materially from those suggested by the forward-looking information or contribute to the possibility that predictions, forecasts or projections will prove to be materially inaccurate.
Additional information on the risks, assumption and uncertainties are found under the heading Special Note Regarding Forward-Looking Statements in this Annual Information Form.
MATERIAL CONTRACTS
Except for contracts entered into in the ordinary course of business, the only contracts that are material to us and that were entered into by us or one of our Subsidiaries within the most recently completed financial year or before the most recently completed financial year but which are still material and are still in effect, are the following:
(a) | the amended and restated credit agreement dated May 18, 2017 among Obsidian Energy and certain lenders and other parties in respect of Obsidian Energys $550 reserve-based loan syndicated credit facility, which agreement is described under Capitalization of Obsidian Energy Debt Capital Credit Facility; |
(b) | the note purchase agreement dated May 31, 2007 (as amended on December 2, 2010, August 15, 2014, May 22, 2015, and August 23, 2017) among Obsidian Energy and the holders of our Series B, Series C and Series D Senior Notes, which agreement is described under Capitalization of Obsidian Energy Debt Capital Senior Notes; |
(c) | the note purchase agreement dated May 29, 2008 (as amended on December 2, 2010, August 15, 2014, May 22, 2015, and August 23, 2017) among Obsidian Energy and the holders of our Series E, Series F, Series G and Series H Senior Notes, which agreement is described under Capitalization of Obsidian Energy Debt Capital Senior Notes; |
(d) | the note purchase agreement dated July 31, 2008 (as amended on December 2, 2010, August 15, 2014, May 22, 2015, and August 23, 2017) among Obsidian Energy and the holders of our Series I Senior Notes, which agreement is described under Capitalization of Obsidian Energy Debt Capital Senior Notes; |
(e) | the note purchase agreement dated May 5, 2009 (as amended on December 2, 2010, August 15, 2014, May 22, 2015, and August 23, 2017) among Obsidian Energy and the holders of our Series K, Series L, Series M, Series N and Series O Senior Notes, which agreement is described under Capitalization of Obsidian Energy Debt Capital Senior Notes; |
(f) | the note purchase agreement dated March 16, 2010 (as amended on December 2, 2010, August 15, 2014, May 22, 2015, and August 23, 2017) among Obsidian Energy and the holders of our Series R, Series S, Series T and Series U Senior Notes, which agreement is described under Capitalization of Obsidian Energy Debt Capital Senior Notes; |
(g) | the note purchase agreement dated December 2, 2010 (as amended on December 2, 2010 , August 15, 2014, May 22, 2015, and August 23, 2017) among Obsidian Energy and the holders of our Series W, Series X, Series Y, Series Z and Series BB Senior Notes, which agreement is described under Capitalization of Obsidian Energy Debt Capital Senior Notes; and |
58
(h) | the note purchase agreement dated November 30, 2011 (as amended on August 15, 2014, May 22, 2015, and August 23, 2017) among Obsidian Energy and the holders of our Series CC, Series DD, Series EE and Series FF Senior Notes, which agreement is described under Capitalization of Obsidian Energy Debt Capital Senior Notes. |
Copies of each of these agreements have been filed on SEDAR at www.sedar.com.
59
Economic Dependence
We are not currently a party to any contract on which our business is substantially dependent, including any contract to sell the major part of our products or to purchase the major part of our requirements for goods, services or raw materials, or any franchise or license or other agreement to use a patent, formula, trade secret, process or trade name on which our business depends.
LEGAL PROCEEDINGS AND REGULATORY ACTIONS
Legal Proceedings
Other than disclosed, there are no legal proceedings that Obsidian Energy is or was a party to, or that any of Obsidian Energys property is or was the subject of, during the most recently completed financial year, that were or are material to Obsidian Energy, and there are no such material legal proceedings that Obsidian Energy knows to be contemplated. For the purposes of the foregoing, a legal proceeding is not considered to be material by us if it involves a claim for damages and the amount involved, exclusive of interest and costs, does not exceed 10 percent of our current assets, provided that if any proceeding presents in large degree the same legal and factual issues as other proceedings pending or known to be contemplated, we have included the amount involved in the other proceedings in computing the percentage.
Regulatory Actions
Other than disclosed, there were no: (i) penalties or sanctions imposed against Obsidian Energy by a court relating to securities legislation or by a security regulatory authority during our most recently completed financial year; (ii) any other penalties or sanctions imposed by a court or regulatory body against Obsidian Energy that would likely be considered important to a reasonable investor in making an investment decision; or (iii) settlement agreements Obsidian Energy entered into before a court relating to securities legislation or with a securities regulatory authority during Obsidian Energys most recently completed financial year.
TRANSFER AGENTS AND REGISTRARS
The transfer agent and registrar for the Common Shares in Canada is AST Trust Company (Canada) at its principal offices in Calgary, Alberta and Toronto, Ontario. The co-transfer agent and registrar for the Common Shares in the United States is Computershare Shareowner Services at its principal offices in Jersey City, New Jersey.
INTEREST OF MANAGEMENT AND OTHERS IN MATERIAL TRANSACTIONS
There were no material interests, direct or indirect, of any director or executive officer of Obsidian Energy, any person or company that beneficially owns, or controls or directs, directly or indirectly, more than 10 percent of the outstanding Common Shares, or any known associate or affiliate of any such person, in any transaction within Obsidian Energys three most recently completed financial years or during our current financial year that has materially affected or is reasonably expected to materially affect Obsidian Energy.
INTERESTS OF EXPERTS
There is no person or company whose profession or business gives authority to a report, valuation, statement or opinion made by such person or company and who is named as having prepared or certified a report, valuation, statement or opinion described or included in a filing, or referred to in a filing, made under National Instrument 51-102 Continuous Disclosure Obligations by us during, or related to, our most recently completed financial year, other than Sproule, the independent engineering evaluator retained by us in 2017 (the Expert), and Ernst & Young LLP (EY), our auditors.
60
There were no registered or beneficial interests, direct or indirect, in any securities or other property of Obsidian Energy or of one of our associates or affiliates: (i) held by the Expert or by the designated professionals (as defined in Form 51-102F2 Annual Information Form) of the Expert, when the Expert prepared the relevant report, valuation, statement or opinion; (ii) received by the Expert or by the designated professionals of the Expert, after the preparation of the relevant report, valuation, statement or opinion; or (iii) to be received by the Expert or by the designated professionals of the Expert; except with respect to the ownership of our Common Shares, in which case the persons or companys interest in our Common Shares represents less than one percent of our outstanding Common Shares. The foregoing does not include registered or beneficial interests, direct or indirect, held through mutual funds.
EY are the auditors of Obsidian Energy and have confirmed that they are independent with respect to Obsidian Energy within the meaning of the relevant rules and related interpretations prescribed by the relevant professional bodies in Canada and any applicable legislation or regulations, and also that they are independent accountants with respect to Obsidian Energy under all relevant US professional and regulatory standards.
No director, officer or employee of the Expert or EY is or is expected to be elected, appointed or employed as a director, officer or employee of Obsidian Energy or of any associate or affiliate of Obsidian Energy.
ADDITIONAL INFORMATION
Additional information relating to Obsidian Energy may be found on SEDAR at www.sedar.com and on EDGAR at www.sec.gov. Additional information, including directors and officers remuneration and indebtedness, principal holders of Obsidian Energys securities and securities authorized for issuance under equity compensation plans, is contained in Obsidian Energys Information Circular for its most recent annual meeting of securityholders that involved the election of directors. Additional financial information is provided in Obsidian Energys financial statements and MD&A for its most recently completed financial year.
Any document referred to in this Annual Information Form and described as being filed on SEDAR at www.sedar.com and on EDGAR at www.sec.gov (including those documents referred to as being incorporated by reference in this Annual Information Form) may be obtained free of charge from us by contacting our Investor Relations Department by telephone (toll free: 1-888-770-2633) or by email (investor_relations@obsidianenergy.com).
61
APPENDIX A-1
REPORT OF MANAGEMENT AND DIRECTORS ON RESERVES DATA AND OTHER INFORMATION
(Form 51-101F3)
Management of Obsidian Energy Ltd. (Obsidian Energy) is responsible for the preparation and disclosure of information with respect to Obsidian Energys oil and gas activities in accordance with securities regulatory requirements. This information includes reserves data, which are estimates of proved reserves and probable reserves and related future net revenue as at December 31, 2017, estimated using forecast prices and costs.
An independent qualified reserves evaluator has evaluated Obsidian Energys reserves data. The report of the independent qualified reserves evaluator is presented below.
The Reserves Committee of the Board of Directors of Obsidian Energy has:
(a) | reviewed Obsidian Energys procedures for providing information to the independent qualified reserves evaluator; |
(b) | met with the independent qualified reserves evaluator to determine whether any restrictions affected the ability of the independent qualified reserves evaluator to report without reservation; and |
(c) | reviewed the reserves data with management and the independent qualified reserves evaluator. |
The Reserves Committee of the Board of Directors has reviewed Obsidian Energys procedures for assembling and reporting other information associated with oil and gas activities and has reviewed that information with management. The Board of Directors has, on the recommendation of the Reserves Committee, approved:
(a) | the content and filing with securities regulatory authorities of Form 51-101F1 containing reserves data and other oil and gas information; |
(b) | the filing of Form 51-101F2 which is the report of the independent qualified reserves evaluator on the reserves data; and |
(c) | the content and filing of this report. |
Because the reserves data are based on judgments regarding future events, actual results will vary and the variations may be material.
(signed) David L. French | (signed) David Hendry | |
President and Chief Executive Officer | Chief Financial Officer | |
(signed) William Friley | (signed) Jay Thornton | |
Director and Chair of the Operations and Reserves Committee | Chairman and Member of the Operations and Reserves Committee | |
March 6, 2018 |
APPENDIX A-2
REPORT ON RESERVES DATA
(Form 51-101F2)
To the Board of Directors of Obsidian Energy Ltd. (Obsidian Energy):
1. | We have evaluated Obsidian Energys reserves data as at December 31, 2017. The reserves data are estimates of proved reserves and probable reserves and related future net revenue as at December 31, 2017, estimated using forecast prices and costs. |
2. | The reserves data are the responsibility of Obsidian Energys management. Our responsibility is to express an opinion on the reserves data based on our evaluation. |
3. | We carried out our evaluation in accordance with standards set out in the Canadian Oil and Gas Evaluation Handbook as amended from time to time (the COGE Handbook), maintained by the Society of Petroleum Evaluation Engineers (Calgary Chapter). |
4. | Those standards require that we plan and perform an evaluation to obtain reasonable assurance as to whether the reserves data are free of material misstatement. An evaluation also includes assessing whether the reserves data are in accordance with principles and definitions presented in the COGE Handbook. |
5. | The following table sets forth the estimated future net revenue (before deduction of income taxes) attributed to proved plus probable reserves, estimated using forecast prices and costs and calculated using a discount rate of 10 percent, included in the reserves data of Obsidian Energy evaluated by us for the year ended December 31, 2017, and identifies the respective portions thereof that we have audited, evaluated and reviewed and reported on to Obsidian Energys management and Board of Directors: |
Independent Qualified Reserves Evaluator or Auditor |
Description and Preparation Date of Evaluation Report |
Location of Reserves (Country) |
Net Present Value of Future Net Revenue (millions before income taxes, 10% discount rate) |
|||||||||||||||||||
Audited | Evaluated | Reviewed | Total | |||||||||||||||||||
Sproule Associates Limited |
Evaluation of the P&NG Reserves of Obsidian Energy Ltd. (As of December 31, 2017) | Canada | nil | $ | 1,707 | nil | $ | 1,707 | ||||||||||||||
January 29, 2018 |
6. | In our opinion, the reserves data respectively evaluated by us have, in all material respects, been determined and are in accordance with the COGE Handbook, consistently applied. We express no opinion on the reserves data that we reviewed but did not audit or evaluate. |
7. | We have no responsibility to update our reports referred to in paragraph 5 for events and circumstances occurring after their respective preparation dates. |
8. | Because the reserves data are based on judgements regarding future events, actual results will vary and the variations may be material. |
Executed as to our report referred to above:
(signed) Sproule Associates Limited Sproule Associates Limited Calgary, Alberta, Canada January 29, 2018 |
APPENDIX A-3
STATEMENT OF RESERVES DATA AND OTHER OIL AND GAS INFORMATION
Our statement of reserves data and other oil and gas information dated March 6, 2018 is set forth below (the Statement). The effective date of the Statement is December 31, 2017 and the preparation date of the Statement is March 6, 2018. The Report of Management and Directors on Reserves Data and Other Information on Form 51-101F3 and the Report on Reserves Data by Sproule on Form 51-101F2 are attached as Appendices A-1 and A-2, respectively, to this Annual Information Form.
Disclosure of Reserves Data
The reserves data set forth below is based upon an evaluation prepared by Sproule with an effective date of December 31, 2017 contained in the Engineering Report. The reserves data summarizes our oil, natural gas liquids and natural gas reserves and the net present values of future net revenue from these reserves using forecast prices and costs, not including the impact of any hedging activities. The reserves data conforms to the requirements of NI 51-101. We engaged Sproule to evaluate all of our proved and proved plus probable reserves. See also Notes to Reserves Data Tables below.
As at December 31, 2017, the vast majority of our proved plus probable reserves are located in Alberta, Canada.
It should not be assumed that the estimates of future net revenues presented in the tables below represent the fair market value of the reserves. There is no assurance that the forecast price and cost assumptions will be attained and variances could be material. The recovery and reserves estimates of crude oil, natural gas liquids and natural gas reserves provided herein are estimates only and there is no guarantee that the estimated reserves will be recovered. Actual crude oil, natural gas and natural gas liquid reserves may be greater than or less than the estimates provided herein.
BOEs may be misleading, particularly if used in isolation. A boe conversion ratio of 6 Mcf: 1 bbl is based on an energy equivalency conversion method primarily applicable at the burner tip and does not represent a value equivalency at the wellhead. Given that the value ratio based on the current price of crude oil as compared to natural gas is significantly different from the energy equivalency conversion ratio of 6:1, utilizing a conversion on a 6:1 basis is misleading as an indication of value.
For more information as to the risks involved, see Risk Factors.
A3-2
SUMMARY OF OIL AND GAS RESERVES
AS OF DECEMBER 31, 2017
FORECAST PRICES AND COSTS
RESERVES | ||||||||||||||||
LIGHT AND MEDIUM CRUDE OIL |
HEAVY CRUDE OIL AND BITUMEN |
|||||||||||||||
RESERVES CATEGORY |
Gross (MMbbl) |
Net (MMbbl) |
Gross (MMbbl) |
Net (MMbbl) |
||||||||||||
PROVED |
||||||||||||||||
Developed Producing |
35 | 33 | 6 | 6 | ||||||||||||
Developed Non-Producing |
0 | 0 | 0 | 0 | ||||||||||||
Undeveloped |
12 | 11 | 2 | 2 | ||||||||||||
|
|
|
|
|
|
|
|
|||||||||
TOTAL PROVED |
47 | 44 | 8 | 8 | ||||||||||||
PROBABLE |
19 | 16 | 3 | 3 | ||||||||||||
|
|
|
|
|
|
|
|
|||||||||
TOTAL PROVED PLUS PROBABLE |
66 | 60 | 12 | 10 | ||||||||||||
|
|
|
|
|
|
|
|
RESERVES | ||||||||||||||||
CONVENTIONAL NATURAL GAS |
NATURAL GAS LIQUIDS | |||||||||||||||
RESERVES CATEGORY |
Gross (Bcf) |
Net (Bcf) |
Gross (MMbbl) |
Net (MMbbl) |
||||||||||||
PROVED |
||||||||||||||||
Developed Producing |
162 | 154 | 6 | 5 | ||||||||||||
Developed Non-Producing |
2 | 2 | 0 | 0 | ||||||||||||
Undeveloped |
30 | 28 | 1 | 1 | ||||||||||||
|
|
|
|
|
|
|
|
|||||||||
TOTAL PROVED |
194 | 183 | 8 | 6 | ||||||||||||
PROBABLE |
64 | 60 | 3 | 2 | ||||||||||||
|
|
|
|
|
|
|
|
|||||||||
TOTAL PROVED PLUS PROBABLE |
258 | 243 | 10 | 8 | ||||||||||||
|
|
|
|
|
|
|
|
RESERVES | ||||||||
TOTAL OIL EQUIVALENT | ||||||||
RESERVES CATEGORY |
Gross (MMboe) |
Net (MMboe) |
||||||
PROVED |
||||||||
Developed Producing |
75 | 69 | ||||||
Developed Non-Producing |
1 | 1 | ||||||
Undeveloped |
20 | 19 | ||||||
|
|
|
|
|||||
TOTAL PROVED |
96 | 88 | ||||||
PROBABLE |
35 | 31 | ||||||
|
|
|
|
|||||
TOTAL PROVED PLUS PROBABLE |
131 | 119 | ||||||
|
|
|
|
A3-3
SUMMARY OF NET PRESENT VALUES OF FUTURE NET REVENUE AS OF DECEMBER 31, 2017
BEFORE INCOME TAXES DISCOUNTED AT (%/year)
FORECAST PRICES AND COSTS
Unit Value Before Income Tax Discounted at 10%/year(1) |
||||||||||||||||||||||||||||
RESERVES CATEGORY |
0% (MM$) |
5% (MM$) |
10% (MM$) |
15% (MM$) |
20% (MM$) |
($/boe) | ($/Mcfe) | |||||||||||||||||||||
PROVED |
||||||||||||||||||||||||||||
Developed Producing |
2,203 | 1,534 | 1,178 | 962 | 818 | 17.07 | 2.85 | |||||||||||||||||||||
Developed Non-Producing |
12 | 10 | 9 | 7 | 6 | 12.81 | 2.14 | |||||||||||||||||||||
Undeveloped |
473 | 216 | 99 | 39 | 4 | 5.34 | 0.89 | |||||||||||||||||||||
|
|
|
|
|
|
|
|
|
|
|
|
|
|
|||||||||||||||
TOTAL PROVED |
2,689 | 1,761 | 1,286 | 1,008 | 828 | 14.57 | 2.43 | |||||||||||||||||||||
PROBABLE |
1,488 | 701 | 421 | 291 | 217 | 13.81 | 2.30 | |||||||||||||||||||||
|
|
|
|
|
|
|
|
|
|
|
|
|
|
|||||||||||||||
TOTAL PROVED PLUS PROBABLE |
4,176 | 2,461 | 1,707 | 1,299 | 1,046 | 14.37 | 2.40 | |||||||||||||||||||||
|
|
|
|
|
|
|
|
|
|
|
|
|
|
Note:
(1) | The unit values are based on net reserve volumes. |
SUMMARY OF NET PRESENT VALUES OF FUTURE NET REVENUE AS OF DECEMBER 31, 2017
AFTER INCOME TAXES DISCOUNTED AT (%/year)
FORECAST PRICES AND COSTS
RESERVES CATEGORY |
0% (MM$) |
5% (MM$) |
10% (MM$) |
15% (MM$) |
20% (MM$) |
|||||||||||||||
PROVED |
||||||||||||||||||||
Developed Producing |
2,203 | 1,534 | 1,178 | 962 | 818 | |||||||||||||||
Developed Non-Producing |
12 | 10 | 9 | 7 | 6 | |||||||||||||||
Undeveloped |
423 | 206 | 97 | 38 | 4 | |||||||||||||||
|
|
|
|
|
|
|
|
|
|
|||||||||||
TOTAL PROVED |
2,638 | 1,750 | 1,283 | 1,008 | 828 | |||||||||||||||
PROBABLE |
1,093 | 571 | 370 | 268 | 207 | |||||||||||||||
TOTAL PROVED PLUS PROBABLE |
3,731 | 2,321 | 1,654 | 1,276 | 1,035 | |||||||||||||||
|
|
|
|
|
|
|
|
|
|
A3-4
TOTAL FUTURE NET REVENUE
(UNDISCOUNTED)
AS OF DECEMBER 31, 2017
FORECAST PRICES AND COSTS
RESERVES CATEGORY |
REVENUE (MM$) |
ROYALTIES (MM$) |
OPERATING COSTS (MM$) |
DEVELOPMENT COSTS (MM$) |
ABANDONMENT AND RECLAMATION COSTS (MM$) |
FUTURE NET REVENUE BEFORE FUTURE INCOME TAXES (MM$) |
FUTURE INCOME TAXES (MM$) |
FUTURE NET REVENUE AFTER FUTURE INCOME TAXES (MM$) |
||||||||||||||||||||||||
Proved Reserves |
6,049 | 522 | 2,106 | 457 | 275 | 2,689 | 51 | 2,638 | ||||||||||||||||||||||||
Proved Plus Probable Reserves |
8,811 | 944 | 2,820 | 560 | 310 | 4,176 | 445 | 3,731 |
FUTURE NET REVENUE
BY PRODUCTION TYPE
AS OF DECEMBER 31, 2017
FORECAST PRICES AND COSTS
FUTURE NET REVENUE BEFORE INCOME TAXES (discounted at 10%/year) |
UNIT VALUE(3) | |||||||||||||
RESERVES CATEGORY |
PRODUCTION TYPE |
(MM$) | ($/bbl) | ($/Mcf) | ||||||||||
Proved Reserves |
Light and Medium Crude Oil(1) | 1,030 | 17.04 | 2.84 | ||||||||||
Heavy Crude Oil and Bitumen(1) | 113 | 14.67 | 2.45 | |||||||||||
Conventional Natural Gas(2) | 140 | 7.37 | 1.23 | |||||||||||
Non-Conventional Oil and Gas Activities(3) | 2 | 2.18 | 0.36 | |||||||||||
|
|
|
|
|
|
|||||||||
TOTAL | 1,286 | 14.57 | 2.43 | |||||||||||
|
|
|
|
|
|
|||||||||
Proved Plus Probable |
Light and Medium Crude Oil(1) | 1,380 | 16.74 | 2.79 | ||||||||||
Reserves |
Heavy Crude Oil and Bitumen(1) | 152 | 14.45 | 2.41 | ||||||||||
Conventional Natural Gas(2) | 171 | 7.03 | 1.17 | |||||||||||
Non-Conventional Oil and Gas Activities(3) | 3 | 2.33 | 0.39 | |||||||||||
|
|
|
|
|
|
|||||||||
TOTAL | 1,707 | 14.37 | 2.40 | |||||||||||
|
|
|
|
|
|
Notes:
(1) | Including solution gas and other by-products. |
(2) | Including by-products but excluding solution gas and by-products from oil wells. |
(3) | The unit values are based on net reserve volumes. |
A3-5
Notes to Reserves Data Tables
1. | Columns may not add due to rounding. |
2. | The crude oil, natural gas liquids and natural gas reserves estimates presented in the Engineering Report are based on the definitions and guidelines contained in the Canadian Oil and Gas Evaluation Handbook (the COGE Handbook). A summary of those definitions are set forth below: |
Reserves Categories
Reserves are estimated remaining quantities of oil and natural gas and related substances anticipated to be recoverable from known accumulations, as of a given date, based on:
(a) | analysis of drilling, geological, geophysical and engineering data; |
(b) | the use of established technology; and |
(c) | specified economic conditions, which are generally accepted as being reasonable, and shall be disclosed. |
Reserves are classified according to the degree of certainty associated with the estimates.
(d) | Proved reserves are those reserves that can be estimated with a high degree of certainty to be recoverable. It is likely that the actual remaining quantities recovered will exceed the estimated proved reserves. |
(e) | Probable reserves are those additional reserves that are less certain to be recovered than proved reserves. It is equally likely that the actual remaining quantities recovered will be greater or less than the sum of the estimated proved plus probable reserves. |
Other criteria that must also be met for the classification of reserves are provided in the COGE Handbook.
Development and Production Status
Each of the reserves categories (proved and probable) may be divided into developed and undeveloped categories.
(a) | Developed reserves are those reserves that are expected to be recovered from existing wells and installed facilities or, if facilities have not been installed, that would involve a low expenditure (for example, when compared to the cost of drilling a well) to put the reserves on production. The developed category may be subdivided into producing and non-producing. |
(i) | Developed producing reserves are those reserves that are expected to be recovered from completion intervals open at the time of the estimate. These reserves may be currently producing or, if shut-in, they must have previously been on production, and the date of resumption of production must be known with reasonable certainty. |
(ii) | Developed non-producing reserves are those reserves that either have not been on production, or have previously been on production, but are shut-in, and the date of resumption of production is unknown. |
(b) | Undeveloped reserves are those reserves expected to be recovered from known accumulations where a significant expenditure (for example, when compared to the cost of drilling a well) is required to render them capable of production. They must fully meet the requirements of the reserves category (proved, probable) to which they are assigned. |
In multi-well pools, it may be appropriate to allocate total pool reserves between the developed and undeveloped categories or to subdivide the developed reserves for the pool between developed producing and developed non-producing. This allocation should be based on the estimators assessment as to the reserves that will be recovered from specific wells, facilities and completion intervals in the pool and their respective development and production status.
A3-6
Levels of Certainty for Reported Reserves
The qualitative certainty levels referred to in the definitions above are applicable to individual reserves entities, which refers to the lowest level at which reserves calculations are performed, and to reported reserves, which refers to the highest level sum of individual entity estimates for which reserves estimates are presented. Reported reserves should target the following levels of certainty under a specific set of economic conditions:
(a) | at least a 90 percent probability that the quantities actually recovered will equal or exceed the estimated proved reserves; and |
(b) | at least a 50 percent probability that the quantities actually recovered will equal or exceed the sum of the estimated proved plus probable reserves. |
A quantitative measure of the certainty levels pertaining to estimates prepared for the various reserves categories is desirable to provide a clearer understanding of the associated risks and uncertainties. However, the majority of reserves estimates are prepared using deterministic methods that do not provide a mathematically derived quantitative measure of probability. In principle, there should be no difference between estimates prepared using probabilistic or deterministic methods.
Additional clarification of certainty levels associated with reserves estimates and the effect of aggregation is provided in the COGE Handbook.
3. | Forecast prices and costs |
NI 51-101 defines forecast prices and costs as future prices and costs that are: (i) generally acceptable as being a reasonable outlook of the future; and (ii) if, and only to the extent that, there are fixed or presently determinable future prices or costs to which we are legally bound by a contractual or other obligation to supply a physical product, including those for an extension period of a contract that is likely to be extended, those prices or costs rather than the prices and costs referred to in subparagraph (i).
The forecast cost and price assumptions include increases in wellhead selling prices and take into account inflation with respect to future operating and capital costs. The crude oil, natural gas and natural gas liquids benchmark reference pricing, inflation rates and exchange rates utilized in the Engineering Report are set forth below. The price assumptions set forth below were provided by Sproule.
A3-7
SUMMARY OF PRICING AND INFLATION RATE ASSUMPTIONS
AS OF DECEMBER 31, 2017
FORECAST PRICES AND COSTS
Oil | Gas | Edmonton Liquids Prices | ||||||||||||||||||||||||||||||||||||||
Year |
WTI Cushing, Oklahoma ($US/bbl) |
Canadian Light Sweet Crude 40° API ($Cdn/bbl) |
Western Canada Select 20.5 API ($Cdn/bbl) |
Cromer LSB 35° API ($Cdn/bbl) |
Natural Gas AECO-C Spot ($Cdn/MMbtu) |
Edmonton Propane ($Cdn/bbl) |
Edmonton Butane ($Cdn/bbl) |
Edmonton Pentanes Plus ($Cdn/bbl) |
Inflation Rate (1) (%/Yr) |
Exchange Rate (2) ($US/$Cdn) |
||||||||||||||||||||||||||||||
Forecast |
||||||||||||||||||||||||||||||||||||||||
2018 |
55.00 | 65.44 | 51.05 | 64.44 | 2.85 | 26.06 | 48.73 | 67.72 | 0.00 | 0.79 | ||||||||||||||||||||||||||||||
2019 |
65.00 | 74.51 | 59.61 | 73.51 | 3.11 | 32.84 | 55.49 | 75.61 | 2.00 | 0.82 | ||||||||||||||||||||||||||||||
2020 |
70.00 | 78.24 | 64.94 | 77.24 | 3.65 | 35.41 | 57.65 | 78.82 | 2.00 | 0.85 | ||||||||||||||||||||||||||||||
2021 |
73.00 | 82.45 | 68.43 | 81.45 | 3.80 | 37.85 | 60.12 | 82.35 | 2.00 | 0.85 | ||||||||||||||||||||||||||||||
2022 |
74.46 | 84.10 | 69.80 | 83.10 | 3.95 | 39.29 | 61.32 | 84.07 | 2.00 | 0.85 | ||||||||||||||||||||||||||||||
2023 |
75.95 | 85.78 | 71.20 | 84.78 | 4.05 | 40.25 | 62.55 | 85.82 | 2.00 | 0.85 | ||||||||||||||||||||||||||||||
2024 |
77.47 | 87.49 | 72.62 | 86.49 | 4.15 | 41.23 | 63.80 | 87.61 | 2.00 | 0.85 | ||||||||||||||||||||||||||||||
2025 |
79.02 | 89.24 | 74.07 | 88.24 | 4.25 | 42.23 | 65.07 | 89.43 | 2.00 | 0.85 | ||||||||||||||||||||||||||||||
2026 |
80.60 | 91.03 | 75.55 | 90.03 | 4.36 | 43.26 | 66.37 | 91.29 | 2.00 | 0.85 | ||||||||||||||||||||||||||||||
2027 |
82.21 | 92.85 | 77.06 | 91.85 | 4.46 | 44.30 | 67.70 | 93.19 | 2.00 | 0.85 | ||||||||||||||||||||||||||||||
2028 |
83.85 | 94.71 | 78.61 | 93.71 | 4.57 | 45.36 | 69.06 | 95.12 | 2.00 | 0.85 |
(1) | Inflation rates are used for forecasting prices and costs |
(2) | Exchange rates used to generate the benchmark reference prices in this table. |
Weighted average actual prices realized, including hedging activities, for the year ended December 31, 2017 were $2.96/Mcf for natural gas, $66.63/bbl for light and medium crude oil, $33.27/bbl for heavy crude oil and $31.16/bbl for natural gas liquids.
A3-8
4. | Future Development Costs |
The following table sets forth development costs deducted in the estimation of our future net revenue attributable to the reserve categories noted below.
Forecast Prices and Costs | ||||||||
Year |
Proved Reserves (MM$) |
Proved Plus Probable Reserves (MM$) |
||||||
2018 |
74 | 91 | ||||||
2019 |
114 | 138 | ||||||
2020 |
79 | 98 | ||||||
2021 |
102 | 121 | ||||||
2022 |
87 | 112 | ||||||
2023 and subsequent |
0 | 0 | ||||||
Total: Undiscounted for all years |
457 | 560 |
We currently expect to fund the development costs of our reserves primarily through internally-generated funds flow from operations. There can be no guarantee that funds will be available to develop all of our reserves or that we will allocate funding to develop all of the reserves attributed in the Engineering Report. Failure to develop those reserves would have a negative impact on future production and cash flow and could result in negative revisions to our reserves. The interest and other costs of any external funding are not included in our reserves and future net revenue estimates and would reduce reserves and future net revenue to some degree depending upon the funding sources utilized. We do not currently expect that interest or other funding costs could make development of any of our properties uneconomic.
5. | Estimated future well abandonment and reclamation costs related to reserve wells have been taken into account by Sproule in determining the aggregate future net revenue therefrom. |
6. | The forecast price and cost assumptions assume the continuance of current laws and regulations. |
7. | All factual data supplied to Sproule was accepted as represented. No field inspection was conducted. |
8. | The estimates of future net revenue presented in the tables above do not represent fair market value. |
A3-9
Reconciliations of Changes in Reserves
The following table sets forth the reconciliation of our gross reserves as at December 31, 2017, using forecast price and cost estimates derived from the Engineering Report.
RECONCILIATION OF
COMPANY GROSS RESERVES
BY PRODUCT TYPE
FORECAST PRICES AND COSTS
LIGHT AND MEDIUM CRUDE OIL(1) |
HEAVY CRUDE OIL AND BITUMEN(1) |
CONVENTIONAL NATURAL GAS(1) |
||||||||||||||||||||||||||||||||||
FACTORS |
Gross Proved (MMbbl) |
Gross Probable (MMbbl) |
Gross Proved Plus Probable (MMbbl) |
Gross Proved (MMbbl) |
Gross Probable (MMbbl) |
Gross Proved Plus Probable (MMbbl) |
Gross Proved (Bcf) |
Gross Probable (Bcf) |
Gross Proved Plus Probable (Bcf) |
|||||||||||||||||||||||||||
December 31, 2016 |
54 | 21 | 75 | 10 | 5 | 14 | 278 | 97 | 374 | |||||||||||||||||||||||||||
Extensions |
3 | 1 | 4 | 0 | 0 | 1 | 18 | 5 | 23 | |||||||||||||||||||||||||||
Infill drilling |
2 | 1 | 3 | 1 | 0 | 2 | 2 | 1 | 3 | |||||||||||||||||||||||||||
Improved Recovery |
0 | 5 | 5 | 0 | 0 | 0 | 0 | 7 | 7 | |||||||||||||||||||||||||||
Technical Revisions |
2 | (6 | ) | (4 | ) | (1 | ) | (2 | ) | (3 | ) | 15 | (17 | ) | (2 | ) | ||||||||||||||||||||
Discoveries |
0 | 0 | 0 | 0 | 0 | 0 | 0 | 0 | 0 | |||||||||||||||||||||||||||
Acquisitions |
0 | 0 | 0 | 0 | 0 | 0 | 0 | 0 | 0 | |||||||||||||||||||||||||||
Dispositions |
(8 | ) | (3 | ) | (11 | ) | 0 | 0 | 0 | (89 | ) | (29 | ) | (119 | ) | |||||||||||||||||||||
Economic Factors |
0 | 0 | 0 | 0 | 0 | 0 | (2 | ) | (0 | ) | (2 | ) | ||||||||||||||||||||||||
Production |
(4 | ) | 0 | (4 | ) | (2 | ) | 0 | (2 | ) | (26 | ) | 0 | (26 | ) | |||||||||||||||||||||
December 31, 2017 |
47 | 19 | 66 | 8 | 3 | 12 | 194 | 64 | 258 |
NATURAL GAS LIQUIDS(1) | TOTAL OIL EQUIVALENT(1) | |||||||||||||||||||||||
FACTORS |
Gross Proved (MMbbl) |
Gross Probable (MMbbl) |
Gross Proved Plus Probable (MMbbl) |
Gross Proved (MMboe) |
Gross Probable (MMboe) |
Gross Proved Plus Probable (MMboe) |
||||||||||||||||||
December 31, 2016 |
7 | 3 | 10 | 117 | 44 | 161 | ||||||||||||||||||
Extensions |
1 | 0 | 1 | 7 | 2 | 9 | ||||||||||||||||||
Infill drilling |
0 | 0 | 0 | 3 | 2 | 5 | ||||||||||||||||||
Improved Recovery |
0 | 0 | 0 | 0 | 6 | 6 | ||||||||||||||||||
Technical Revisions |
2 | 0 | 2 | 5 | (11 | ) | (6 | ) | ||||||||||||||||
Discoveries |
0 | 0 | 0 | 0 | 0 | 0 | ||||||||||||||||||
Acquisitions |
0 | 0 | 0 | 0 | 0 | 0 | ||||||||||||||||||
Dispositions |
(2 | ) | (1 | ) | (2 | ) | (25 | ) | (8 | ) | (33 | ) | ||||||||||||
Economic Factors |
0 | 0 | 0 | 0 | 0 | 0 | ||||||||||||||||||
Production |
(1 | ) | 0 | (1 | ) | (12 | ) | 0 | (12 | ) | ||||||||||||||
December 31, 2017 |
8 | 3 | 10 | 96 | 35 | 131 |
Note:
(1) | Columns may not add due to rounding. |
A3-10
Additional Information Relating to Reserves Data
Undeveloped Reserves
Undeveloped reserves are attributed by Sproule in accordance with standards and procedures contained in the COGE Handbook. Undeveloped reserves are those reserves expected to be recovered from known accumulations where a significant expenditure (for example, when compared to the cost of drilling a well) is required to render them capable of production. Undeveloped reserves must fully meet the requirements of the reserves category (proved or probable) to which they are assigned.
In some cases, it will take longer than two years to develop Obsidian Energys undeveloped reserves. Obsidian Energy plans to develop approximately two-fifths of the proved undeveloped reserves in the Engineering Report over the next two years and the significant majority of the proved undeveloped reserves over the next five years. Obsidian Energy plans to develop approximately two-fifths of the probable undeveloped reserves in the Engineering Report over the next two years and the significant majority of the probable undeveloped reserves over the next five years. There are a number of factors that could result in delayed or cancelled development, including the following: (i) changing economic conditions (due to pricing and/or operating and capital expenditure fluctuations); (ii) changing technical conditions (including production anomalies, such as water breakthrough or accelerated depletion); (iii) multi-zone developments (for instance, a prospective formation completion may be delayed until the initial completion is no longer economic); (iv) a larger development program may need to be spread out over several years to optimize capital allocation and facility utilization; and (v) surface access issues (including those relating to land owners, weather conditions and regulatory approvals).
Proved Undeveloped Reserves
The following table discloses, for each product type, the gross volumes of proved undeveloped reserves that were first attributed in each of the most recent three financial years.
Year |
Light and Medium Crude Oil (MMbbl) |
Heavy Crude Oil and Bitumen (MMbbl) |
Conventional Natural Gas (Bcf) |
NGLs (MMbbl) |
||||||||||||||||||||||||||||
First Attributed |
Cumulative at Year End |
First Attributed |
Cumulative at Year End |
First Attributed |
Cumulative at Year End |
First Attributed |
Cumulative at Year End |
|||||||||||||||||||||||||
2015 |
| 16 | 2 | 2 | | 32 | | 1 | ||||||||||||||||||||||||
2016 |
| 10 | 2 | 2 | | 23 | | 1 | ||||||||||||||||||||||||
2017 |
3 | 12 | 1 | 2 | 11 | 30 | 1 | 1 |
Sproule has assigned 20 MMboe of proved undeveloped reserves in the Engineering Report under forecast prices and costs, together with $456 million of associated undiscounted future capital expenditures. Proved undeveloped capital spending in the first two forecast years of the Engineering Report accounts for $187 million, or 41 percent, of the total forecast undiscounted capital expenditures for proved undeveloped reserves. These figures increase to $456 million, or nearly 100 percent, during the first five years of the Engineering Report. The majority of our proved undeveloped reserves evaluated in the Engineering Report are attributable to future oil development from known pools and enhanced oil recovery projects.
A3-11
Probable Undeveloped Reserves
The following table discloses, for each product type, the gross volumes of probable undeveloped reserves that were first attributed in each of the most recent three financial years.
Year |
Light and Medium Crude Oil (MMbbl) |
Heavy Crude Oil and Bitumen (MMbbl) |
Conventional Natural Gas (Bcf) |
NGLs (MMbbl) |
||||||||||||||||||||||||||||
First Attributed |
Cumulative at Year End |
First Attributed |
Cumulative at Year End |
First Attributed |
Cumulative at Year End |
First Attributed |
Cumulative at Year End |
|||||||||||||||||||||||||
2015 |
| 15 | 1 | 29 | | 30 | | 1 | ||||||||||||||||||||||||
2016 |
2 | 10 | 2 | 2 | 3 | 23 | | 1 | ||||||||||||||||||||||||
2017 |
6 | 10 | 1 | 1 | 5 | 19 | 1 | 1 |
Sproule has assigned 15 MMboe of probable undeveloped reserves in the Engineering Report under forecast prices and costs, together with $101 million of associated undiscounted future capital expenditures. Probable undeveloped capital spending in the first two forecast years of the Engineering Report accounts for $39 million, or 38 percent, of the total forecast undiscounted future capital expenditures for probable undeveloped reserves. These figures increase to $101 million, or 100 percent, during the first five years of the Engineering Report. The probable undeveloped reserves evaluated in the Engineering Report are primarily associated with proved undeveloped reserve assignments but have a less likely probability of being recovered than such associated proved undeveloped reserve assignments.
Significant Factors or Uncertainties Affecting Reserves Data
The development schedule for our undeveloped reserves is based on forecast price assumptions for the determination of economic projects. The actual market prices for oil and natural gas may be significantly lower or higher resulting in some projects being delayed or accelerated, as the case may be. See Risk Factors.
We do not anticipate that any significant economic factors or other significant uncertainties will affect any particular components of our reserves data. However, our reserves can be affected significantly by fluctuations in product pricing, capital expenditures, operating costs, royalty regimes and well performance that are beyond our control.
Additional Information Concerning Abandonment and Reclamation Costs
Abandonment and reclamation costs in respect of surface leases, wells, facilities and pipelines (collectively, A&R Costs) are primarily comprised of abandonment, decommissioning, remediation and reclamation costs. A&R Costs are estimated using our experience conducting annual abandonment and reclamation programs over the past several years, the use of external consultants, and the use of comparisons to A&R Cost estimates obtained from the Alberta regulatory authorities.
Obsidian Energy reviews its suspended or standing well bores for reactivation, recompletion or sale opportunities. Wellbores that do not meet this criterion become part of our overall wellbore abandonment program. A portion of our A&R Costs are retired every year and facilities are generally decommissioned subsequent to the time when all the wells producing to them have been abandoned. All of our liability reduction programs take into account seasonal access, high priority and stakeholder issues, and where possible, opportunities for multi-location programs and continuous operations to reduce costs.
A3-12
As of December 31, 2017, we expect to incur future A&R Costs in respect of approximately 5,016 net well bores, 772 facilities and 8,540 kilometres of pipelines. On an undiscounted, inflated basis, approximately 57% percent of A&R Costs relate to well bores, 34% percent to facilities and 9% percent to pipelines. The total amount of A&R Costs, net of estimated salvage values, we expect to incur, including wells that extend beyond the 50-year limit in the Engineering Report, are summarized in the following table:
Period |
Abandonment and Reclamation Costs Escalated at 2% Undiscounted (MM$) |
Abandonment and Reclamation Costs Escalated at 2% Discounted at 10% (MM$) |
||||||
Total liability as at December 31, 2017 |
1,673 | 38 | ||||||
Anticipated to be paid in 2018 |
10 | 10 | ||||||
Anticipated to be paid in 2019 |
10 | 9 | ||||||
Anticipated to be paid in 2020 |
10 | 9 | ||||||
Total anticipated to be paid in 2018, 2019 and 2020 |
30 | 28 |
The above table includes certain A&R Costs, net of estimated salvage values, not included in the Engineering Report and not deducted in estimating future net revenue as disclosed above. Escalated at two percent and undiscounted, the A&R Costs deducted were $310 million, and escalated at two percent and discounted at 10 percent, these A&R Costs were $6 million.
OTHER OIL AND GAS INFORMATION
Description of Our Properties, Operations and Activities in Our Major Operating Regions
Introduction
Obsidian Energy participates in the exploration for, and the development and production of, oil and natural gas principally in western Canada. Our portfolio of properties as at December 31, 2017 includes both unitized and non-unitized oil and natural gas production. In general, the properties contain long-life, low-decline-rate reserves and include interests in several major oil and gas fields. As at December 31, 2017, the majority of our proved plus probable reserves are located in Alberta, Canada.
Major Operating Regions
Our production and reserves are attributed to approximately 46 producing properties. No single property accounts for more than 30 percent of our proved plus probable reserves. Obsidian Energys operations are currently focused on light-oil development.
A3-13
The following map illustrates Obsidian Energys major operating regions as at December 31, 2017.
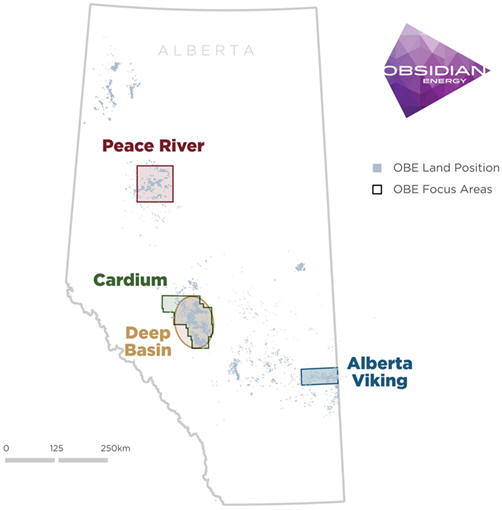
The following is a description of our principal oil and natural gas properties and related operations and activities as at December 31, 2017. Information in respect of gross and net acres and well counts are as of December 31, 2017 and information in respect of production is for the year ended December 31, 2017, except where indicated otherwise. For information on the Companys disposition activity in 2018 see Description of Our Business General Development of the Business 2018 Developments. The estimates of reserves and future net revenue for individual properties may not reflect the same confidence level as estimates of reserves and future net revenue for all properties, due to the effects of aggregation.
Cardium Development Area
The Cardium development play is located in West Central Alberta and extends over 300 kilometers from Calgary to Grande Prairie, Alberta. At December 31, 2017, Obsidian Energy is the largest land owner in the play, holding approximately 450 net sections of developed and undeveloped land. The Companys holdings in the area include significant interests within the core of the play, particularly in the Willesden Green and Pembina areas. In 2017, development was focused in both these areas with an emphasis on integrated waterflood activity as the Company builds on its long-term, low-decline production base and increases ultimate recoveries in the area. Total development spending was approximately $71 million resulting in 10 (9.5 net) operated wells drilled and 24 (23.2 net) injectors. In 2018, Cardium development will continue to focus on waterflood activities while the Company strategically focuses on utilizing existing injectors in the Pembina area for a lower cost integrated waterflood approach. Total development capital budget for 2018 is approximately $50 million which includes 11 horizontal producers (gross operated wells) amongst our Pembina and Willesden Green assets.
A3-14
Within the budget, the Company has allocated $3 million to integrated waterflood and optimization opportunities, approximately $12 million to Non-Operated primary drilling by our working interest partners in the area, and $4 million to land consolidation opportunities and seismic data.
Peace River Development Area
The Peace River development area is a heavy oil play located in Northwestern Alberta. In 2010, Obsidian Energy entered the Peace River Oil Partnership (PROP) where it holds a 55 percent working interest and operatorship. Under PROP, the Company was initially funded on 90 percent of its capital and operating commitments by its joint venture partner. This funding was completed at the end of December 2017. At December 31, 2017, Obsidian Energy had approximately 235 net sections of developed and undeveloped land in the area. In 2017, with the support of its joint venture partner, Obsidian Energy continued to focus on primary, cold flow, development within PROP and drilled a total of 28 wells (15.4 net wells) with $4 million of capital, net of the JV partner carry. In 2018, PROPs drilling program is anticipated to consist of approximately $8 million to drill four (2.2 net) primary cold flow wells. Due to the attractive economics and de-risked acreage in the area, the Company plans future development in the area despite the funding commitment is now fully utilized.
Viking Development Area
The Viking development area is located in Eastern Alberta along the Alberta/Saskatchewan border. At December 31, 2017, Obsidian Energy had approximately 170 net sections of developed and undeveloped land in the play. In 2017 Obsidian Energy invested approximately $20 million of development capital in the area resulting in 10 (10 net) operated wells drilled in the Esther area and additional related facilities. Results from the 2017 program exceeded expectations and the Company continues to evolve its strategy to maximize both capital efficiencies and economics. In 2018, the Company is planning to spend $6 million resulting in four wells in the area.
Deep Basin Development area
The Deep Basin development area underlies the Companys Cardium acreage spanning an area from Drayton Valley to Rocky Mountain House in Alberta. At December 31, 2017, Obsidian Energy holds a dominant position in the area with approximately 700 net sections of developed and undeveloped land. In 2017, the Company drilled three wells (2.4 net wells) in the area with strong results for total capital of $11 million. In 2018, Obsidian Energy plans to build on its 2017 activity with anticipated spending of approximately $8 million resulting in two additional wells. Using the learnings from the Companys 2017 development program, and given the negative outlook for natural gas pricing in Alberta, the Company has high-graded its 2018 inventory to target liquids rich gas and oil locations that generate robust rates of return.
Optimization activity
In 2018, Obsidian Energy plans to leverage its existing infrastructure and land base and focus on optimization of existing well bores and facilities within the Companys portfolio. Allocated capital to these activities totals $14 million and consists of over 50 individual projects to either increase production by reactivating and/or recompleting existing well bores, or reduce operating costs through facilities optimization projects.
Additional Information
None of our important properties, plants, facilities or installations are subject to any material statutory or other mandatory relinquishments, surrenders, back-ins or changes in ownership.
We do not have any important properties to which reserves have been attributed and which are capable of producing but which are not producing.
2018 Capital Budget
In November 2017, the Company announced its 2018 capital budget of $135 million which includes $86 million associated with development and existing wellbore optimization, $25 million of infrastructure and corporate capital, $10 million of decommissioning expenditures, and $14 million of capital associated with meeting the AER Directive 84 requirements for
A3-15
Hydrocarbon Emission Controls and Gas Conservation in the Peace River area. The capital budget will focus on the Companys core areas of Cardium, PROP, Viking and Deep Basin. The Companys average production guidance for 2018 was also set at 31,000 to 32,000 boe per day, and was further updated in January to 29,000 to 30,00 boe per day to reflect disposition activity.
The primary components of our programs are described above under the heading Major Operating Regions. See also Description of our Business General Development of the Business Year Ended December 31, 2017 2017 Capital Expenditure Budget and Production and 2018 Developments - 2018 Production Guidance and Disposition Activity.
Oil and Gas Wells
The following table sets forth the number and status of wells in which we had a working interest as at December 31, 2017.
Producing | Non-Producing | Total | ||||||||||||||||||||||||||||||
Oil | Gas | |||||||||||||||||||||||||||||||
Gross | Net | Gross | Net | Gross | Net | Gross | Net | |||||||||||||||||||||||||
Alberta |
2,288 | 1,707 | 1,276 | 778 | 3,203 | 2,502 | 6,767 | 4,987 | ||||||||||||||||||||||||
British Columbia |
| | 3 | 1 | 6 | 3 | 9 | 4 | ||||||||||||||||||||||||
Saskatchewan |
51 | 3 | 1 | 1 | 9 | 6 | 61 | 10 | ||||||||||||||||||||||||
Northwest Territories |
10 | 1 | | | 32 | 6 | 42 | 7 | ||||||||||||||||||||||||
Wyoming |
| | | | 25 | 8 | 25 | 8 | ||||||||||||||||||||||||
|
|
|
|
|
|
|
|
|
|
|
|
|
|
|
|
|||||||||||||||||
Total |
2,349 | 1,711 | 1,280 | 780 | 3,275 | 2,525 | 6,904 | 5,016 | ||||||||||||||||||||||||
|
|
|
|
|
|
|
|
|
|
|
|
|
|
|
|
Properties with no Attributed Reserves
The following table sets out the unproved properties in which we had an interest as at December 31, 2017.
Unproved Properties (thousands of acres) |
||||||||
Gross | Net | |||||||
Alberta |
752 | 528 | ||||||
British Columbia |
1 | 1 | ||||||
Saskatchewan |
2 | 2 | ||||||
Northwest Territories |
85 | 18 | ||||||
Wyoming |
2 | 0 | ||||||
|
|
|
|
|||||
Total |
842 | 549 |
We currently have no material work commitments on these lands. The primary lease or extension term on approximately 9,210 net acres of unproved property is scheduled to expire by December 31, 2018. The right to explore, develop and exploit these leases will be surrendered unless we qualify them for continuation based on production, drilling or technical mapping.
Significant Factors or Uncertainties Relevant to Properties with No Attributed Reserves
The development of properties with no attributed reserves can be affected by a number of factors including, but not limited to, project economics, forecasted price assumptions, cost estimates, well type expectations and access to infrastructure. These and other factors could lead to the delay or the acceleration of projects related to these properties.
Tax Horizon
The most important variables that will determine the level of cash taxes incurred by us in a given year will be the price of crude oil and natural gas, our capital spending levels, the nature and extent of acquisition and disposition activities and the amount of tax pools available to us. We currently estimate that we will not be required to pay income taxes for the foreseeable future.
A3-16
However, if crude oil and natural gas prices were to strengthen beyond the levels anticipated by the current forward market, our tax pools would be utilized more quickly and we may experience higher than expected cash taxes or payment of such taxes in an earlier time period. However, we emphasize that it is difficult to give guidance on future taxability as we operate within an industry where various factors constantly change our outlook, including factors such as acquisitions, divestments, capital spending levels, operating cost levels and commodity price changes.
Capital Expenditures
The following table summarizes capital expenditures related to our activities for the year ended December 31, 2017, irrespective of whether such costs were capitalized or charged to expense when incurred.
2017 MM$ |
||||
Property Acquisition Costs(1) |
||||
Proved Properties |
(110 | ) | ||
Unproved Properties |
3 | |||
Exploration Costs(1) |
2 | |||
Development Costs(1) |
184 | |||
Corporate Costs |
2 | |||
Joint venture, carried capital |
(50 | ) | ||
|
|
|||
Total Capital Expenditures |
31 | |||
Corporate Acquisitions |
| |||
|
|
|||
Total Expenditures |
31 | |||
|
|
Note:
(1) | Property Acquisition Costs, Proved Properties, Unproved Properties, Exploration Costs and Development Costs have the meanings ascribed thereto in the COGE Handbook. |
Exploration and Development Activities
The following table sets forth the gross and net exploratory and development wells that we participated in during the year ended December 31, 2017.
Exploratory Wells | Development Wells | |||||||||||||||
Gross | Net | Gross | Net | |||||||||||||
Oil |
42 | 31.6 | ||||||||||||||
Gas |
| | 3 | 2.4 | ||||||||||||
Injectors/Stratigraphic test |
| | 30 | 26.5 | ||||||||||||
|
|
|
|
|
|
|
|
|||||||||
Total |
| | 75 | 60.5 | ||||||||||||
|
|
|
|
|
|
|
|
A3-17
Production Estimates
The following table sets out the volume of our production estimated for the year ended December 31, 2018 which is reflected in the estimates of gross proved reserves and gross probable reserves disclosed in the tables contained under Disclosure of Reserves Data above.
Light and Medium Crude Oil (bbl/d) |
Heavy Crude Oil and Bitumen (bbl/d) |
Conventional Natural Gas (Mcf/d) |
Natural Gas Liquids (bbl/d) |
Total Oil Equivalent (boe/d) |
||||||||||||||||||||||||||||||||||||
Gross | Net | Gross | Net | Gross | Net | Gross | Net | Gross | Net | |||||||||||||||||||||||||||||||
Proved Developed Producing |
9,816 | 9,242 | 4,289 | 4,171 | 53,721 | 51,027 | 2,034 | 1,490 | 25,093 | 23,407 | ||||||||||||||||||||||||||||||
Proved Developed Non-Producing |
84 | 79 | 1 | 1 | 416 | 403 | 22 | 15 | 176 | 162 | ||||||||||||||||||||||||||||||
Proved Undeveloped |
703 | 667 | 375 | 364 | 3,564 | 3,386 | 148 | 140 | 1,820 | 1,736 | ||||||||||||||||||||||||||||||
|
|
|
|
|
|
|
|
|
|
|
|
|
|
|
|
|
|
|
|
|||||||||||||||||||||
Total Proved |
10,603 | 9,987 | 4,665 | 4,537 | 57,701 | 54,816 | 2,203 | 1,645 | 27,088 | 25,304 | ||||||||||||||||||||||||||||||
Total Probable |
1,339 | 1,130 | 269 | 261 | 5,729 | 5,427 | 305 | 232 | 2,867 | 2,528 | ||||||||||||||||||||||||||||||
|
|
|
|
|
|
|
|
|
|
|
|
|
|
|
|
|
|
|
|
|||||||||||||||||||||
Total Proved Plus Probable |
11,941 | 11,118 | 4,934 | 4,798 | 63,430 | 60,241 | 2,508 | 1,877 | 29,956 | 27,833 | ||||||||||||||||||||||||||||||
|
|
|
|
|
|
|
|
|
|
|
|
|
|
|
|
|
|
|
|
The Company noted that its Willesden Green property (located in the Cardium development area) accounted for approximately 29% of the estimated production on a proved plus probable basis in 2018. No other field (being a defined geographical area consisting of one or more pools) accounts for more than 20 percent of the estimated production on a proved plus probable basis disclosed above. For more information, see Other Oil and Gas Information Description of Our Properties, Operations and Activities in Our Major Operating Regions.
A3-18
Production History
The following table summarizes certain information in respect of our share of average gross daily production volumes, average net product prices received, royalties paid, production costs, transportation costs, risk management contracts loss (gain), and resulting netbacks for the periods indicated below:
Quarter Ended 2017 | Year Ended | |||||||||||||||||||
March 31 | June 30 | September 30 | December 31 | December 31, 2017 |
||||||||||||||||
Share of Average Gross Daily Production |
||||||||||||||||||||
Light and Medium Crude Oil (bbl/d) |
13,167 | 11,185 | 10,975 | 11,907 | 11,803 | |||||||||||||||
Heavy Crude Oil (bbl/d) |
5,206 | 5,636 | 5,456 | 5,247 | 5,387 | |||||||||||||||
Conventional Natural Gas (MMcf/d) |
82 | 68 | 68 | 71 | 73 | |||||||||||||||
NGLs (bbl/d) |
2,795 | 2,211 | 2,349 | 2,381 | 2,433 | |||||||||||||||
Combined (boe/d) |
34,900 | 30,436 | 30,166 | 31,447 | 31,723 | |||||||||||||||
Average Net Production Prices Received |
||||||||||||||||||||
Light and Medium Crude Oil ($/bbl) |
63.21 | 61.46 | 55.94 | 67.29 | 62.13 | |||||||||||||||
Heavy Crude Oil ($/bbl) |
33.21 | 31.61 | 30.36 | 38.12 | 33.27 | |||||||||||||||
Conventional Natural Gas ($/Mcf) |
3.22 | 3.10 | 2.35 | 2.51 | 2.81 | |||||||||||||||
NGLs ($/bbl) |
27.79 | 29.14 | 28.29 | 39.74 | 31.16 | |||||||||||||||
Combined ($/boe) |
38.63 | 37.51 | 33.37 | 40.55 | 37.58 | |||||||||||||||
Royalties Paid |
||||||||||||||||||||
Light and Medium Crude Oil ($/bbl) |
5.98 | 5.19 | 4.28 | 4.65 | 5.05 | |||||||||||||||
Heavy Crude Oil ($/bbl) |
0.92 | 0.49 | 0.80 | 1.06 | 0.81 | |||||||||||||||
Conventional Gas ($/Mcf) |
0.03 | 0.34 | 0.11 | 0.15 | 0.15 | |||||||||||||||
NGLs ($/bbl) |
2.82 | (1.21 | ) | 3.90 | 4.84 | 2.67 | ||||||||||||||
Combined ($/boe) |
2.68 | 2.67 | 2.27 | 2.64 | 2.57 | |||||||||||||||
Production Costs(1)(2)(3) |
||||||||||||||||||||
Light and Medium Crude Oil ($/bbl) |
21.56 | 26.39 | 22.76 | 20.41 | 22.69 | |||||||||||||||
Heavy Crude Oil ($/bbl) |
4.23 | 4.60 | 5.25 | 6.09 | 5.04 | |||||||||||||||
Conventional Natural Gas ($/Mcf) |
2.42 | 1.66 | 1.34 | 1.54 | 1.77 | |||||||||||||||
NGLs ($/bbl) |
| | | | | |||||||||||||||
Combined ($/boe) |
14.48 | 14.27 | 12.26 | 12.50 | 13.40 | |||||||||||||||
Transportation |
||||||||||||||||||||
Light and Medium Crude Oil ($/bbl) |
2.20 | 3.52 | 3.16 | 3.13 | 2.97 | |||||||||||||||
Heavy Crude Oil ($/bbl) |
3.37 | 4.44 | 3.97 | 4.20 | 4.01 | |||||||||||||||
Conventional Natural Gas ($/Mcf) |
0.42 | 0.31 | 0.23 | 0.23 | 0.30 | |||||||||||||||
NGLs ($/bbl) |
| | | | | |||||||||||||||
Combined ($/boe) |
2.31 | 2.82 | 2.38 | 2.41 | 2.48 | |||||||||||||||
Risk Management Contracts Loss (Gain) |
||||||||||||||||||||
Light and Medium Crude Oil ($/bbl) |
8.88 | 5.95 | 4.78 | (1.82 | ) | 4.50 | ||||||||||||||
Heavy Crude Oil ($/bbl) |
| | | | | |||||||||||||||
Conventional Gas ($/Mcf) |
0.07 | 0.01 | 0.22 | 0.30 | 0.15 | |||||||||||||||
NGLs ($/bbl) |
| | | | | |||||||||||||||
Combined ($/boe) |
3.52 | 2.21 | 2.24 | | 2.02 | |||||||||||||||
Netback Received(4) |
||||||||||||||||||||
Light and Medium Crude Oil ($/bbl) |
42.35 | 32.32 | 30.51 | 37.29 | 35.92 | |||||||||||||||
Heavy Crude Oil ($/bbl) |
24.70 | 22.08 | 20.33 | 26.77 | 23.41 | |||||||||||||||
Conventional Natural Gas ($/Mcf) |
0.42 | 0.80 | 0.89 | 0.90 | 0.74 | |||||||||||||||
NGLs ($/bbl) |
24.97 | 30.35 | 24.40 | 34.90 | 28.50 | |||||||||||||||
Combined ($/boe) |
22.68 | 19.96 | 18.70 | 23.00 | 21.16 |
Notes:
(1) | Operating expenses are comprised of direct costs incurred to operate both oil and gas wells. A number of assumptions are required to allocate these costs between crude oil, conventional natural gas and natural gas liquids production. |
A3-19
(2) | Operating overhead recoveries associated with operated properties are charged to operating costs and accounted for as a reduction to general and administrative costs. |
(3) | Production costs include the effect of carried operating expenses from the Companys partner under the Peace River Oil Partnership. The Company fully utilized the deferred funding asset in December 2017. |
(4) | Netbacks are calculated by subtracting royalties, operating costs, transportation costs and losses/gains on commodity and foreign exchange contracts from revenues. |
During the year ended December 31, 2017, Obsidian Energy produced 12 MMboe, comprised of 4 MMbbl of light and medium crude oil, 2 MMbbl of heavy crude oil, 27 Bcf of conventional natural gas and 1 MMbbl of natural gas liquids.
Marketing Arrangements
Our marketing approach incorporates the following primary objectives:
| Ensure security of market and avoid production shut-ins due to marketing constraints by dealing with end-users or regionally strategic counterparties wherever possible. |
| Ensure competitive pricing by managing pricing exposures through a portfolio of various terms and geographic basis. |
| Ensure optimization of netbacks through careful management of transportation obligations, facility utilization levels, blending opportunities and emulsion handling. |
| Ensure protection of our receivables by, whenever possible, dealing only with credit worthy counterparties who have been subjected to regular credit reviews. |
Oil and Liquids Marketing
Of our liquids production in 2017, approximately 60% percent was light and medium crude oil, 28% percent was conventional heavy crude oil and 12% percent was NGLs. In regard specifically to crude oil, our average quality was 30 degrees API, which was comprised of an average quality for our light and medium crude oil of 38 degrees API and an average quality for our conventional heavy crude oil of 11 degrees API.
To reduce risk, we market the majority of our production to large credit-worthy counterparties or end-users on varying term contracts. Where possible we aggregate our oil on pipelines and sell on a stream basis to maximize flexibility and reduce incremental costs. We actively manage our heavy oil sales by finding opportunities to optimize netbacks through ongoing evaluation of both pipeline and rail sales opportunities based on market conditions.
The following table summarizes the net product price received for our production of conventional light and medium crude oil (including NGLs) and our conventional heavy crude oil, before adjustments for hedging activities, for the periods indicated:
2017 | 2016 | 2015 | ||||||||||||||||||||||
Light and Medium Crude Oil and NGLs |
Heavy Crude Oil |
Light and Medium Crude Oil and NGLs |
Heavy Crude Oil |
Light and Medium Crude Oil and NGLs |
Heavy Crude Oil |
|||||||||||||||||||
Quarter Ended |
($/bbl) | ($/bbl) | ($/bbl) | ($/bbl) | ($/bbl) | ($/bbl) | ||||||||||||||||||
March 31 |
57.00 | 33.21 | 34.49 | 14.76 | 46.11 | 14.76 | ||||||||||||||||||
June 30 |
56.12 | 31.61 | 49.66 | 25.18 | 58.05 | 46.44 | ||||||||||||||||||
September 30 |
51.06 | 30.36 | 47.01 | 21.67 | 48.28 | 31.20 | ||||||||||||||||||
December 31 |
62.70 | 38.12 | 52.34 | 27.09 | 47.00 | 25.40 |
A3-20
Natural Gas Marketing
In 2017, we received an average price from the sale of conventional natural gas, before adjustments for hedging activities, of $2.81 per mcf compared to $2.14 per mcf realized in 2016. Approximately 98 percent of our conventional natural gas sales are marketed directly, with the balance of natural gas sales sold at the plantgate. We continue to maintain a significant weighting to the Alberta market which is one of the largest and most liquid market hubs in North America, but have also diversified with approximately 25% of our gas portfolio sold into the US Midwest market.
We continue to conservatively manage our transportation costs. Transportation on all pipelines is closely balanced to supply, and market commitments.
Forward Contracts
We are exposed to market risks resulting from fluctuations in commodity prices, foreign exchange rates and interest rates in the normal course of operations. In accordance with policies approved by our Board of Directors, we may, from time to time, manage these risks through the use of swaps, collars or other financial instruments. Commodity price risk may be hedged up to a maximum of 50 percent of forecast sales volumes, net of royalties, for the balance of any current year and one year following and up to 25 percent of forecast sales volumes, net of royalties, for one additional year thereafter. Subject to the Boards approval, our hedging limits may be increased above the maximum limits. This policy is reviewed by management and our Board of Directors from time to time and amended as necessary. In November 2017, the Board approved the Company to hedge up to a maximum of 75 percent of forecast sales volumes on natural gas and up to a maximum of 67 percent of forecast sales volumes on crude, both net of royalties for the 2018 calendar year.
We are also exposed to losses in the event of default by the counterparties to these derivative instruments. We manage this risk by diversifying our hedging portfolio among a number of counterparties, primarily parties within our banking syndicate, whom we consider to be financially sound.
As at December 31, 2017, we were not bound by any agreement (including a transportation agreement), directly or through an aggregator, under which we may be precluded from fully realizing, or may be protected from the full effect of, future market prices for oil or natural gas, except for agreements disclosed by us in Note 10 to our audited consolidated financial statements as at and for the year ended December 31, 2017 which have been filed on SEDAR at www.sedar.com.
Our transportation obligations and commitments for future physical deliveries of crude oil and conventional natural gas do not exceed our expected related future production from our proved reserves, estimated using forecast prices and costs, as disclosed herein.
A3-21
APPENDIX B
MANDATE OF THE AUDIT COMMITTEE
1. PURPOSE
The purpose of the Audit Committee (the Committee) of the board of directors (the Board) of Obsidian Energy Ltd. (Obsidian Energy or the Company) is to assist the Board in fulfilling its responsibility for oversight of the integrity of Obsidian Energys consolidated financial statements, Obsidian Energys compliance with legal and regulatory requirements, the qualifications and independence of Obsidian Energys independent auditors, and the performance of Obsidian Energys internal audit function, if any.
The objectives of the Committee are as follows:
(a) | To assist the Board in meeting its responsibilities (especially for accountability) in respect of the preparation and disclosure of the consolidated financial statements of Obsidian Energy and related matters; |
(b) | To provide an open avenue of communication between directors, management and independent auditors; |
(c) | To assist the Board in meeting its responsibilities regarding the oversight of the independent auditors qualifications and independence; |
(d) | To assist the Board in meeting its responsibilities regarding the oversight of the credibility, integrity and objectivity of financial reports; |
(e) | To strengthen the role of the non-management directors by facilitating discussions between directors on the Committee, management and independent auditors; |
(f) | To assist the Board in meeting its responsibilities regarding the oversight of the performance of Obsidian Energys independent auditors and internal audit function (if any); |
(g) | To assist the Board in meeting its responsibilities regarding the oversight of Obsidian Energys compliance with legal and regulatory requirements; and |
(h) | To assist the Board by monitoring the effectiveness and integrity of the Corporations financial reporting systems, management information systems and internal control systems. |
2. SPECIFIC DUTIES AND RESPONSIBILITIES
Subject to the powers and duties of the Board, the Committee will perform the following duties:
(a) | Satisfy itself on behalf of the Board that the Companys internal control systems are sufficient to reasonably ensure that: |
(i) | controllable, material business risks are identified, monitored and mitigated where it is determined cost effective to do so; |
(ii) | internal controls over financial reporting are sufficient to meet the requirements under National Instrument 52-109 Certification of Disclosure in Issuers Annual and Interim Filings and the United States Securities Exchange Act of 1934, as amended, and |
(iii) | there is compliance with legal, ethical and regulatory requirements. |
(b) | Review the annual and interim financial statements of the Company prior to their submission to the Board for approval. The process should include, but not be limited to: |
(i) | review of changes in accounting principles, or in their application, which may have a material impact on the current or future years financial statements; |
(ii) | review of significant accruals, reserves or other estimates such as the ceiling test calculation; |
(iii) | review of accounting treatment of unusual or non-recurring transactions; |
(iv) | review of compliance with covenants under loan agreements; |
(v) | review of asset retirement obligations recommended by the Health, Safety, Environment and Regulatory Committee; |
(vi) | review of disclosure requirements for commitments and contingencies; |
(vii) | review of adjustments raised by the independent auditors, whether or not included in the financial statements; |
(viii) | review of unresolved differences between management and the independent auditors, if any; |
(ix) | review of reasonable explanations of significant variances with comparative reporting periods; and |
(x) | determination through inquiry if there are any related party transactions and ensure the nature and extent of such transactions are properly disclosed. |
(c) | Review, discuss and recommend for approval by the Board the annual and interim financial statements and related information included in prospectuses, management discussion and analysis, information circular-proxy statements and annual information forms, prior to recommending Board approval. |
(d) | Discuss Obsidian Energys interim results press releases, as well as financial information and earnings guidance provided to analysts and rating agencies (provided that the Committee is not required to review and discuss investor presentations that do not contain financial information or earnings guidance that has not previously been generally disclosed to the public). |
(e) | With respect to the appointment of independent auditors by the Board, the Committee shall: |
(i) | on an annual basis, review and discuss with the auditors all relationships the auditors have with Obsidian Energy to determine the auditors independence, ensure the rotation of partners on the audit engagement team in accordance with applicable law and, in order to ensure continuing auditor independence, consider the rotation of the audit firm itself; |
(ii) | be directly responsible for overseeing the work of the independent auditors engaged for the purpose of issuing an auditors report or performing other audit, review or attest services for Obsidian Energy, including the resolution of disagreements between management and the independent auditor regarding financial reporting, and the independent auditors shall report directly to the Committee; |
(iii) | review and evaluate the performance of the lead partner of the independent auditors; |
(iv) | review the basis of managements recommendation for the appointment of independent auditors and recommend to the Board appointment of independent auditors and their compensation; |
(v) | review the terms of engagement and the overall audit plan (including the materiality levels to be applied) of the independent auditors, including the appropriateness and reasonableness of the auditors fees; |
(vi) | when there is to be a change in auditors, review the issues related to the change and the information to be included in the required notice to securities regulators of such change; and |
(vii) | review and pre-approve any audit and permitted non-audit services to be provided by the independent auditors firm and consider the impact on the independence of the auditors. |
(f) | The Committee may delegate to one or more Committee members (the Delegate) authority to pre-approve non-audit services in satisfaction of 2(e)(vii) above, subject to the fee restriction below. If such delegation occurs, the pre-approval of non-audit services by the Delegate must be presented to the Committee at its first scheduled meeting following such pre-approval and the member(s) comply with such other procedures as may be established by the Committee from time to time. The fee for such non-audit services shall not exceed $50,000 either individually or in the aggregate, for a particular financial year without the approval of the Committee of the Company. |
(g) | At least annually, obtain and review the report by the independent auditors describing the independent auditors internal quality control procedures, any material issues raised by the most recent interim quality-control review, or peer review, of the independent auditors, or by any inquiry or investigation by governmental or professional authorities, within the preceding five years, respecting one or more independent audits carried out by the independent auditors, and any steps taken to deal with any such issues. |
(h) | Review with the independent auditors (and internal auditors, if any) their assessment of the internal controls of the Company, their written reports containing recommendations for improvement, and managements response and follow-up to any identified weaknesses. The Committee shall also review annually with the independent auditors their plan for their audit and, upon completion of the audit, their reports upon the financial statements of Obsidian Energy and its subsidiaries. |
(i) | At least annually, obtain and review a report by the independent auditors describing (i) all critical accounting policies and practices used by Obsidian Energy, (ii) all alternative accounting treatments of financial information within generally accepted accounting principles related to material items that have been discussed with management, including the ramifications of the use of such alternative treatments and disclosures and the treatment preferred by the accounting firm, and (iii) other material written communications between the accounting firm and management of Obsidian Energy. |
(j) | Obtain assurance from the independent auditors that disclosure to the Committee is not required pursuant to the provisions of the United States Securities Exchange Act of 1934, as amended, regarding the discovery by the independent auditors of illegal acts. |
(k) | Review, set and approve hiring policies relating to current and former staff of current and former independent auditors. |
(l) | Review all public disclosure containing financial information before release (provided that the Committee is not required to review investor presentations that do not contain financial information or earnings guidance that has not previously been generally disclosed to the public). |
(m) | Review all pending significant litigation to ensure disclosures are sufficient and appropriate. |
(n) | Satisfy itself that adequate procedures are in place for the review of Obsidian Energys public disclosure of financial information from Obsidian Energys financial statements and periodically assess the adequacy of those procedures. |
(o) | Review and discuss major financial risk exposures and the steps management has taken to monitor and control such exposures. |
(p) | Establish procedures independent of management for: |
(i) | the receipt, retention and treatment of complaints received by Obsidian Energy regarding accounting, internal accounting controls, or auditing matters; and |
(ii) | the confidential, anonymous submission by employees of Obsidian Energy of concerns regarding questionable accounting or auditing matters. |
(q) | Review any other matters required by law, regulation or stock exchange requirement, or that the Committee feels are important to its mandate or that the Board chooses to delegate to it. |
(r) | Establish, review and update periodically a Code of Business and ensure that management has established systems to enforce these codes. |
(s) | Review managements monitoring of Obsidian Energys compliance with the organizations Code of Business Conduct. |
(t) | Review and discuss with the Chief Executive Officer, the Chief Financial Officer and the independent auditors, the matters required to be reviewed with those persons in connection with any certificates required by applicable laws, regulations or stock exchange requirements to be provided by the Chief Executive Officer and the Chief Financial Officer. |
(u) | Review and discuss major issues regarding accounting principles and financial statement presentations, including any significant changes in Obsidian Energys selection or application of accounting principles. |
(v) | Review and discuss major issues as to the adequacy of Obsidian Energys internal controls and any special audit steps adopted in light of material control deficiencies. |
(w) | Review and discuss analyses prepared by management and/or the independent auditors setting forth significant financial reporting issues and judgments made in connection with the preparation of the financial statements, including analyses of the effects of alternative generally accepted accounting principles methods on the financial statements. |
(x) | Review and discuss the effect of regulatory and accounting initiatives, as well as off-balance sheet structures, on Obsidian Energys financial statements. |
(y) | Review and discuss the type and presentation of information to be included in earnings press releases, paying particular attention to any use of pro forma or adjusted non-GAAP information. |
(z) | Annually review the Committees Mandate and the Committee Chairs Terms of Reference and recommend any proposed changes to the Board for consideration. |
(aa) | Review and/or approve any other matters specifically delegated to the Committee by the Board. |
3. KNOWLEDGE & EDUCATION
Committee members shall be financially literate within the meaning of National Instrument 52-110 Audit Committees (NI 52-110), and should have or obtain sufficient knowledge of Obsidian Energys financial and audit policies and procedures to assist in providing advice and counsel on related matters. Members shall be encouraged as appropriate to attend relevant educational opportunities at the expense of Obsidian Energy.
4. COMPOSITION
(a) | Committee members shall be appointed and removed by the Board and the Committee shall be composed of three directors of Obsidian Energy or such greater number as the Board may from time to time determine. |
(b) | Provided the Board Chair is an independent director as contemplated in subparagraph 4(c) below and financially literate as contemplated in subparagraph (d) below, the Board Chair shall be a non-voting ex officio member of the Committee, subject to subparagraph 5(e) below. |
(c) | Each member of the Committee shall be an independent director in accordance with the definition of independent in (a) NI 52-110 and (b) Section 303A.02 and 303A.07 of the New York Stock Exchange Listed Company Manual, and in accordance with all other applicable securities laws or rules of any stock exchange on which Obsidian Energys securities are listed for trading. |
(d) | All of the members must be financially literate within the meaning of NI 52-110 and Section 303A.07 (a) of the New York Stock Exchange Listed Company Manual unless the Board has determined to rely on an exemption in NI 52-110. Being financially literate means members have the ability to read and understand a set of financial statements that present a breadth and level of complexity of accounting issues that are generally comparable to the breadth and complexity of issues that can reasonably be expected to be raised by Obsidian Energys financial statements. In addition, at least one member of the Committee must have accounting or related financial management expertise, as the Board interprets such qualification in its business judgment. |
(e) | In connection with the appointment of the members of the Committee, the Board will determine whether any proposed nominee for the Committee serves on the audit committees of more than three public companies. To the extent that any proposed nominee for membership on the Committee serves on the audit committees of more than three public companies, the Board will make a |
determination as to whether such simultaneous services would impair the ability of such member to effectively serve on the Companys Audit Committee and will disclose such determination in Obsidian Energys annual management proxy circular and annual report on Form 40-F filed with the United States Securities and Exchange Commission. |
(f) | The Board shall appoint the Chair of the Committee from among the Committee members. |
5. MEETINGS
(a) | The Committee shall meet at least four times per year at the call of the Committee Chair. The Committee Chair may call additional meetings as required. In addition, a meeting may be called by the Board Chair, the Chief Executive Officer, the Chief Financial Officer or any member of the Committee. |
(b) | As part of its job to foster open communication, the Committee shall meet at least annually with management, internal auditors (if any) and the independent auditors in separate executive sessions to discuss any matters that the Committee or each of these groups believe should be discussed privately. In addition, the Committee shall meet with the independent auditors and management quarterly to review Obsidian Energys interim financials. The Committee shall also meet with management and independent auditors on an annual basis to review and discuss Obsidian Energys annual financial statements and the managements discussion and analysis of financial conditions and results of operations. |
(c) | Notice of the time and place of every meeting may be given orally, in writing, by facsimile or by other electronic means of communication to each member of the Committee at least 48 hours prior to the time fixed for such meeting. A member may, in any manner, waive notice of the meeting. Attendance of a member at a meeting shall constitute waiver of notice. |
(d) | Agendas, with input from management and the Committee Chair, shall be circulated by the Committee Secretary to Committee members and relevant members of management along with appropriate meeting materials and background reading on a timely basis prior to Committee meetings. |
(e) | A quorum shall be a majority of the members of the Committee present in person or by telephone or video conference or by other electronic or communication medium or by a combination thereof. If an independent ex officio non-voting members presence is required to attain a quorum, then such member shall be a voting member of the Committee for such meeting. |
(f) | The Committee Chair shall be a full voting member of the Committee. If the Committee Chair is unavailable or unable to attend a meeting of the Committee, the Committee Chair shall ask another member to chair the meeting, failing which a member of the Committee present at the meeting shall be chosen to preside over the meeting by a majority of the members of the Committee present at such meeting. The Chair of any Committee meeting shall have a casting vote in the event of a tie on any matter upon which the Committee votes during such meeting. |
(g) | Members of the Companys management and such other Company staff as are appropriate to provide information to the Committee shall be available to attend meetings upon invitation by the Committee. The Committee shall have the right to determine who shall and who shall not be present at any time during a meeting of the Committee; however, independent directors, including the Board Chair, shall always have the right to be present. As part of each Committee meeting the Committee members will also meet in-camera without any members of management present, and in the Committees discretion, without any other members of the Board who are not Committee members present. |
(h) | The secretary to the Committee (the Committee Secretary) will be either the Corporate Secretary of Obsidian Energy or his/her designate. The Committee Secretary shall record minutes of the meetings of the Committee, which shall be reviewed and approved by the Committee and maintained with Obsidian Energys records by the Committee Secretary. The Committee shall report its activities and proceedings to the Board by oral or written report at the next Board meeting and by distributing the minutes of its meetings. Supporting schedules and information reviewed by the Committee shall be available for examination by any Director. |
6. RESOURCES
(a) | The Committee may retain special legal, accounting, financial or other consultants or advisors to advise the Committee at the Companys expense and shall have sole authority to retain and terminate any such consultants or advisors and to approve any such consultants or advisors fees and retention terms, subject to review by the Board, and at the expense of the Company. |
(b) | The Committee shall have access to Obsidian Energys senior management and documents as required to fulfill its responsibilities and shall be provided with the resources necessary to carry out its responsibilities. |
(c) | The Committee shall have the authority to investigate any financial activity of Obsidian Energy and to communicate directly with the internal auditors (if any) and independent auditors. All employees are to cooperate as requested by the Committee. |
7. DELEGATION
The Committee may delegate from to time to any person or committee of persons any of the Audit Committees responsibilities that are permitted to be delegated to such person or committee in accordance with applicable laws, regulations and stock exchange requirements.
8. STANDARDS OF LIABILITY
(a) | Nothing contained in this Mandate is intended to expand applicable standards of liability under statutory, regulatory or other legal requirements for the Board or members of the Committee. The purposes and responsibilities outlined in this Mandate are meant to serve as guidelines rather than inflexible rules and the Committee may adopt such additional procedures and standards as it deems necessary from time to time to fulfill its responsibilities, subject to applicable statutory, regulatory and other legal requirements. |
(b) | The duties and responsibilities of a member of the Committee are in addition to those duties set out for a member of the Board. |
Exhibit 99.2
MANAGEMENTS DISCUSSION AND ANALYSIS
For the year ended December 31, 2017
This managements discussion and analysis of financial condition and results of operations (MD&A) of Obsidian Energy Ltd. (Obsidian Energy, the Company, we, us, our) should be read in conjunction with the Companys audited consolidated financial statements for the years ended December 31, 2017 and 2016 (the Consolidated Financial Statements). The date of this MD&A is March 6, 2018. All dollar amounts contained in this MD&A are expressed in millions of Canadian dollars unless noted otherwise.
Effective June 26, 2017, the Company changed its name from Penn West Petroleum Ltd. to Obsidian Energy Ltd.
For additional information, including Obsidian Energys Consolidated Financial Statements and Annual Information Form, please go to the Companys website at www.obsidianenergy.com, in Canada to the SEDAR website at www.sedar.com or in the United States to the EDGAR website at www.sec.gov.
Certain financial measures such as funds flow from operations, funds flow from operations per share-basic, funds flow from operations per share-diluted, netback, gross revenues, earnings before interest, taxes, depreciation and amortization (EBITDA) and net debt included in this MD&A do not have a standardized meaning prescribed by International Financial Reporting Standards (IFRS) and therefore are considered non-GAAP measures; accordingly, they may not be comparable to similar measures provided by other issuers. This MD&A also contains oil and gas information and forward-looking statements. Please see the Companys disclosure under the headings Non-GAAP Measures, Oil and Gas Information, and Forward-Looking Statements included at the end of this MD&A.
Annual Financial Summary
Year ended December 31 | ||||||||||||
(millions, except per share amounts) |
2017 | 2016 | 2015 | |||||||||
Gross revenues (1) |
$ | 460 | $ | 709 | $ | 1,268 | ||||||
Funds flow from operations |
192 | 182 | 249 | |||||||||
Basic per share |
0.38 | 0.36 | 0.50 | |||||||||
Diluted per share |
0.38 | 0.36 | 0.50 | |||||||||
Net loss |
(84 | ) | (696 | ) | (2,646 | ) | ||||||
Basic per share |
(0.17 | ) | (1.39 | ) | (5.27 | ) | ||||||
Diluted per share |
(0.17 | ) | (1.39 | ) | (5.27 | ) | ||||||
Development capital expenditures (2) |
141 | 82 | 470 | |||||||||
Property acquisitions (dispositions), net |
(110 | ) | (1,415 | ) | (800 | ) | ||||||
Long-term debt |
359 | 469 | 1,940 | |||||||||
Dividends declared |
| | 15 | |||||||||
Dividends declared per share |
| | 0.03 | |||||||||
Total assets |
$ | 3,008 | $ | 3,339 | $ | 5,924 |
(1) | Includes realized gains and losses on commodity contracts and excludes gains and losses on foreign exchange hedges. |
(2) | Includes the effect of capital carried by partners. |
In 2016 and into early 2017, the Company completed several asset dispositions continuing its focus on balance sheet strength and creating efficiencies within its asset base. As a result of disposition activities, production volumes declined which led to lower gross revenues and total assets from comparative periods.
In 2017, the net loss was attributed to higher depletion costs on a per boe basis and a low commodity price environment specifically in the first half of 2017.
In 2016, the net loss was due to non-cash property, plant and equipment (PP&E) impairment charges as a result of classifying certain assets as held for sale and impairments on exploration & evaluation (E&E) assets as the Company re-focused its development plans to the Cardium, Peace River, Viking and Deep Basin areas in Alberta.
OBSIDIAN ENERGY 2017 | MANAGEMENTS DISCUSSION AND ANALYSIS 1 |
In 2017, due to significant improvements in Obsidian Energys financial position, the Company increased its capital program and focused on its key development areas, specifically, the Cardium, Viking, Peace River and Deep Basin. In 2016, capital expenditures were lower compared to 2015 as the Company reduced its first half capital program in response to declining commodity prices.
Long-term debt declined significantly since 2015 as proceeds from asset dispositions were used to reduce the Companys outstanding debt balance both under its credit facility and senior notes.
On September 1, 2015, the Company announced that its Board of Directors approved the suspension of the dividend until further notice. The last dividend payment of $0.01 per share was on October 15, 2015.
Quarterly Financial Summary
(millions, except per share and production amounts) (unaudited)
Dec. 31 | Sep. 30 | June 30 | Mar. 31 | Dec. 31 | Sep. 30 | June 30 | Mar. 31 | |||||||||||||||||||||||||
Three months ended |
2017 | 2017 | 2017 | 2017 | 2016 | 2016 | 2016 | 2016 | ||||||||||||||||||||||||
Gross revenues (1) |
$ | 119 | $ | 98 | $ | 111 | $ | 132 | $ | 133 | $ | 136 | $ | 209 | $ | 231 | ||||||||||||||||
Funds flow from operations |
52 | 40 | 43 | 57 | 48 | 32 | 55 | 47 | ||||||||||||||||||||||||
Basic per share |
0.10 | 0.08 | 0.09 | 0.11 | 0.10 | 0.06 | 0.11 | 0.09 | ||||||||||||||||||||||||
Diluted per share |
0.10 | 0.08 | 0.09 | 0.11 | 0.10 | 0.06 | 0.11 | 0.09 | ||||||||||||||||||||||||
Net income (loss) |
(58 | ) | (44 | ) | (9 | ) | 27 | (232 | ) | (232 | ) | (132 | ) | (100 | ) | |||||||||||||||||
Basic per share |
(0.12 | ) | (0.09 | ) | (0.02 | ) | 0.05 | (0.46 | ) | (0.46 | ) | (0.26 | ) | (0.20 | ) | |||||||||||||||||
Diluted per share |
$ | (0.12 | ) | $ | (0.09 | ) | $ | (0.02 | ) | $ | 0.05 | $ | (0.46 | ) | $ | (0.46 | ) | $ | (0.26 | ) | $ | (0.20 | ) | |||||||||
Production |
||||||||||||||||||||||||||||||||
Liquids (bbls/d) (2) |
19,535 | 18,779 | 19,033 | 21,169 | 21,295 | 23,355 | 41,848 | 53,012 | ||||||||||||||||||||||||
Natural gas (mmcf/d) |
71 | 68 | 68 | 82 | 103 | 107 | 130 | 144 | ||||||||||||||||||||||||
|
|
|
|
|
|
|
|
|
|
|
|
|
|
|
|
|||||||||||||||||
Total (boe/d) |
31,447 | 30,166 | 30,436 | 34,900 | 38,481 | 41,233 | 63,568 | 77,010 | ||||||||||||||||||||||||
|
|
|
|
|
|
|
|
|
|
|
|
|
|
|
|
(1) | Includes realized gains and losses on commodity contracts and excludes gains/losses on foreign exchange hedges. |
(2) | Includes crude oil and natural gas liquids. |
Calculation of Funds Flow from Operations
Year ended December 31 | ||||||||
(millions, except per share amounts) |
2017 | 2016 | ||||||
Cash flow from operating activities |
$ | 125 | $ | (137 | ) | |||
Change in non-cash working capital |
(5 | ) | 97 | |||||
Decommissioning expenditures |
16 | 11 | ||||||
Office lease settlements |
16 | 4 | ||||||
Monetization of foreign exchange contracts |
| (32 | ) | |||||
Settlements of normal course foreign exchange contracts |
(8 | ) | (3 | ) | ||||
Monetization of transportation commitment |
| (20 | ) | |||||
Realized foreign exchange loss debt prepayments |
| 191 | ||||||
Realized foreign exchange loss debt maturities |
6 | 37 | ||||||
Carried operating expenses (1) |
21 | 15 | ||||||
Restructuring charges |
10 | 19 | ||||||
Other expenses (2) |
11 | | ||||||
|
|
|
|
|||||
Funds flow from operations |
$ | 192 | $ | 182 | ||||
|
|
|
|
|||||
Per share funds flow from operations |
||||||||
Basic per share |
$ | 0.38 | $ | 0.36 | ||||
Diluted per share |
$ | 0.38 | $ | 0.36 |
(1) | The effect of carried operating expenses from the Companys partner under the Peace River Oil Partnership which came to an end in December 2017. |
(2) | The Company settled the outstanding lawsuit it had with the United States Securities and Exchange Commission (SEC) for US$8.5 million (CAD$11 million) during the fourth quarter of 2017. |
OBSIDIAN ENERGY 2017 | MANAGEMENTS DISCUSSION AND ANALYSIS 2 |
In 2017, funds flow from operations increased from 2016 mainly due to higher realized commodity prices and improvements in the Companys cost structure as it focused its operations on key development areas within Alberta. This was partially offset by lower production volumes as the Company completed several dispositions, particularly in 2016.
Additionally, in 2017, Obsidian Energy repaid senior notes in an aggregate amount of $26 million (2016 $185 million) as part of normal maturities. In 2016, $1,075 million of senior notes were prepaid as a result of the offers made at par to the Companys noteholders using asset disposition proceeds.
Lastly, in 2016, the Company monetized a total of US$115 million of foreign exchange forward contracts on senior notes and permanently disposed of a pipeline commitment and received $20 million of proceeds from the sale.
Business Strategy
In 2017, the Company took a balanced and disciplined approach to developing its asset portfolio with a focus on organic production growth and living within funds flow from operations. Obsidian Energy plans to continue this approach in 2018 with further development on its predictable, low decline asset base across its key areas being the Cardium, Peace River, Viking and Deep Basin.
The Companys key focuses in 2018 include:
| Cardium - planned spending of approximately $50 million to further develop the Companys high netback, low decline asset, drilling 11 horizontal producers (gross operated wells) amongst its Pembina and Willesden Green assets. Additional spending of $12 million on non-operated primary drilling, $5 million integrated waterflood and optimization opportunities and $4 million on land and seismic data. |
| Peace River planned development of approximately $8 million to drill four (2.2 net) primary, cold flow wells in 2018. |
| Alberta Viking planned investment of approximately $6 million to drill four wells in the area as the Company focuses its program in similar areas to its 2017 program and leverages off existing infrastructure. |
| Deep Basin - planned spending of approximately $8 million resulting in two wells drilled with a focus on continued development of the Companys position, targeting high pressure areas and strategic positions close to the Companys operated processing facilities. |
| Optimization planned spending of approximately $14 million to optimize existing well bores, involving multiple projects across the Companys portfolio with the most capital efficient spend within the Companys 2018 capital budget. |
As Obsidian Energy moves forward, the Company believes its plans offer a predictable growth profile focused on creating liquids weighted, sustainable value for all stakeholders.
OBSIDIAN ENERGY 2017 | MANAGEMENTS DISCUSSION AND ANALYSIS 3 |
Business Environment
The following table outlines quarterly averages for benchmark prices and Obsidian Energys realized prices for the previous five quarters.
Q4 2017 | Q3 2017 | Q2 2017 | Q1 2017 | Q4 2016 | ||||||||||||||||
Benchmark prices |
||||||||||||||||||||
WTI crude oil ($US/bbl) |
$ | 55.40 | $ | 48.21 | $ | 48.29 | $ | 51.91 | $ | 49.29 | ||||||||||
Edm mixed sweet par price (CAD$/bbl) |
68.94 | 56.63 | 61.83 | 63.87 | 61.58 | |||||||||||||||
Western Canada Select (CAD$/bbl) |
54.87 | 47.91 | 49.98 | 49.38 | 46.63 | |||||||||||||||
NYMEX Henry Hub ($US/mcf) |
2.93 | 3.00 | 3.18 | 3.32 | 2.98 | |||||||||||||||
AECO Index (CAD$/mcf) |
1.82 | 1.75 | 2.78 | 2.82 | 2.95 | |||||||||||||||
Foreign exchange rate (CAD$/$US) |
1.2717 | 1.2528 | 1.3449 | 1.3238 | 1.3344 | |||||||||||||||
Average sales price (1) |
||||||||||||||||||||
Light oil (CAD$/bbl) |
67.29 | 55.94 | 61.46 | 63.21 | 58.76 | |||||||||||||||
Heavy oil (CAD$/bbl) |
38.12 | 30.36 | 31.61 | 33.21 | 27.09 | |||||||||||||||
NGL (CAD$/bbl) |
39.74 | 28.29 | 29.14 | 27.79 | 25.09 | |||||||||||||||
Total liquids (CAD$/bbl) |
56.10 | 45.05 | 48.86 | 51.15 | 45.82 | |||||||||||||||
Natural gas (CAD$/mcf) |
2.51 | 2.35 | 3.10 | 3.22 | 2.98 | |||||||||||||||
Benchmark differentials |
||||||||||||||||||||
WTI - Edm Light Sweet ($US/bbl) |
(1.14 | ) | (2.89 | ) | (2.26 | ) | (3.54 | ) | (3.11 | ) | ||||||||||
WTI - WCS Heavy ($US/bbl) |
$ | (12.27 | ) | $ | (9.94 | ) | $ | (11.13 | ) | $ | (14.58 | ) | $ | (14.32 | ) |
(1) | Excludes the impact of realized hedging gains or losses. |
Crude Oil
Crude oil prices continued to be volatile in 2017 as the market responded to ongoing discussions regarding OPEC and Non-OPEC production agreements and the response of US shale supply to increasing oil prices. WTI traded between US$45 per barrel and US$55 per barrel through most of the year before increasing to US$60 per barrel in late 2017 as oil inventories began to approach more reasonable levels and OPEC and non-OPEC producers agreed to a production ceiling through 2018. For 2017, WTI averaged US$50.95 per barrel. In the fourth quarter of 2017, WTI declined to approximately US$50 per barrel early in the quarter before improving to approximately US$60 per barrel near the end of the year as a result of the aforementioned production ceiling extension.
Canadian light and heavy oil differentials strengthened through most of 2017 as unexpected downtime and maintenance affected oil sands and synthetic oil production through the second and third quarters of the year. Canadian heavy oil differentials widened during the fourth quarter in anticipation of incremental heavy oil coming onstream from oil sands projects. Light oil differentials tightened compared to the third quarter of 2017 as strong demand and pricing for synthetic crude positively impacted light sweet crude pricing. For the year, light oil differentials averaged US$2.87 per barrel below WTI and heavy oil averaged US$11.98 per barrel below WTI
Currently, the Company has the following crude oil hedges in place:
Q1 2018 | Q2 2018 | Q3 2018 | Q4 2018 | Q1 2019 |
Q2 2019 |
Q3 2019 |
||||||||||||||||||||||
WTI $USD |
$ | 50.82 | $ | 50.00 | $ | 50.05 | $ | 49.78 | $ | 50.02 | $ | 56.53 | $ | 57.00 | ||||||||||||||
bbl/day |
7,000 | 7,000 | 8,000 | 8,000 | 3,000 | 2,000 | 1,000 | |||||||||||||||||||||
WTI $CAD |
$ | 71.03 | $ | 71.03 | $ | 71.04 | $ | 71.04 | $ | 67.88 | $ | 68.58 | | |||||||||||||||
bbl/day |
5,000 | 5,000 | 4,000 | 4,000 | 6,000 | 4,000 | | |||||||||||||||||||||
|
|
|
|
|
|
|
|
|
|
|
|
|
|
|||||||||||||||
Total bbl/day |
12,000 | 12,000 | 12,000 | 12,000 | 9,000 | 6,000 | 1,000 | |||||||||||||||||||||
|
|
|
|
|
|
|
|
|
|
|
|
|
|
OBSIDIAN ENERGY 2017 | MANAGEMENTS DISCUSSION AND ANALYSIS 4 |
Natural Gas
NYMEX Henry Hub gas prices began 2017 trading at approximately US$3.50 per mcf due to winter weather demand. However, throughout 2017 prices weakened as moderate weather and a strong supply outlook from the Marcellus and other basins resulted in prices closing the year at approximately US$3.00 per mcf. AECO pricing within Alberta declined in 2017 as strong supply growth in both Northwest Alberta and British Columbia put pressure on existing intra-Alberta demand and export capacity.
During the fourth quarter, AECO prices in Alberta continued to trade at a discount to NYMEX with daily prices trading below $1.00 per mcf due to ongoing TransCanada Pipeline restrictions in October. Prices improved later in the fourth quarter to over $2.00 per mcf as restrictions were lifted and cold weather-related demand resulted in storage withdrawals.
In the fourth quarter of 2017, extremely cold weather moved into the US Midwest resulting in strong natural gas prices in the Ventura market. As Obsidian Energy participates within the Ventura market, this contributed to strong realized pricing for the Company versus AECO pricing.
Currently, the Company has the following natural gas hedges in place:
Q1 2018 | Q2 2018 | Q3 2018 | Q4 2018 | |||||||||||||
AECO $CAD |
$ | 2.83 | $ | 2.72 | $ | 2.67 | $ | 2.67 | ||||||||
mcf/day |
28,400 | 22,700 | 17,100 | 15,200 | ||||||||||||
Ventura $USD (1) |
$ | 2.79 | $ | 2.79 | $ | 2.79 | $ | 2.79 | ||||||||
mcf/day |
7,500 | 7,500 | 7,500 | 7,500 | ||||||||||||
|
|
|
|
|
|
|
|
|||||||||
Total mcf/day |
35,900 | 30,200 | 24,600 | 22,700 | ||||||||||||
|
|
|
|
|
|
|
|
(1) | Until the third quarter of 2020, the Company has an agreement in place to sell 15 mmcf per day of natural gas at the Ventura index price less the cost of transportation from AECO. Recent transportation deductions for the Company to bring product to the Ventura market have been approximately $0.55 per mcf. |
Average Sales Prices
Year ended December 31 | ||||||||||||
2017 | 2016 | % change | ||||||||||
Light oil (per bbl) |
$ | 62.13 | $ | 47.96 | 30 | |||||||
Risk management gain (per bbl) (1) |
4.50 | 11.37 | (60 | ) | ||||||||
|
|
|
|
|
|
|||||||
Light oil net (per bbl) |
66.63 | 59.33 | 12 | |||||||||
|
|
|
|
|
|
|||||||
Heavy oil (per bbl) |
33.27 | 21.22 | 57 | |||||||||
|
|
|
|
|
|
|||||||
NGLs (per bbl) |
31.16 | 17.73 | 76 | |||||||||
|
|
|
|
|
|
|||||||
Natural gas (per mcf) |
2.81 | 2.14 | 31 | |||||||||
Risk management gain (per mcf) (1) |
0.15 | 0.18 | (17 | ) | ||||||||
|
|
|
|
|
|
|||||||
Natural gas net (per mcf) |
2.96 | 2.32 | 28 | |||||||||
|
|
|
|
|
|
|||||||
Weighted average (per boe) |
37.58 | 28.83 | 30 | |||||||||
Risk management gain (per boe) (1) |
2.02 | 5.03 | (60 | ) | ||||||||
|
|
|
|
|
|
|||||||
Weighted average net (per boe) |
$ | 39.60 | $ | 33.86 | 17 | |||||||
|
|
|
|
|
|
(1) | Realized risk management gains and losses on commodity contracts are included in gross revenues. |
OBSIDIAN ENERGY 2017 | MANAGEMENTS DISCUSSION AND ANALYSIS 5 |
Performance Indicators
Obsidian Energys management and Board of Directors monitors its performance based on the following three key focus areas using a number of qualitative and quantitative factors:
| Values Includes Obsidian Energys execution of its field, health, safety, environmental and regulatory programs and its focus on operational excellence; |
| Delivery Includes Obsidian Energy key performance metrics including a leading cost structure within the industry and a focus on free cash flow generation; and |
| Growth Includes the management of the Companys asset portfolio, financial stewardship and the goal of creating production growth and long-term competitive return on investment for its shareholders. |
Values
At Obsidian Energy, the health, safety and wellness of its employees, contractors and stakeholders living within its areas of operation is paramount. Safety policies, procedures and programs developed by Obsidian Energy shall meet or exceed legislative requirements and all injuries and serious incidents are reported and investigated accordingly. Additionally, the Company is committed to minimizing the environmental impacts of its operations with its programs focusing on stakeholder communication, impact minimization, resource conservation and site abandonment and reclamation. Throughout its operations, Obsidian Energy requires a high standard of professional conduct and supports a culture that ensures all individuals act with integrity and respect. These principles form the operational standard for the Company as it focuses on activities across its leading positions within Alberta.
Delivery
The Company met all key targets in 2017 as it continued to emphasize execution and focus on cost reduction initiatives.
| The Companys average annual production was 31,723 boe per day, above production guidance of 30,500 to 31,500 boe per day; |
| Development capital expenditures were $157 million compared to capital guidance of $160 million; |
| Operating costs per boe were $13.40 per boe, within the Companys operating cost guidance of $13.00 - $13.50 per boe; |
In 2018, the Company will continue to target capital expenditures within funds flow from operations. For 2018 targets, please refer to the Outlook section below.
Growth
In 2017, Obsidian Energy expanded its capital program as it focused on activities within its key development areas. Development plans for 2018 will be within the same key development areas with the Company continuing to progress on integrated waterflood development in the Cardium and build off its initial well results in the Deep Basin. For 2018, Obsidian Energy has an exploration and development capital budget of $125 million, planned decommissioning expenditures of $10 million and is targeting five percent production growth relative to 2017, adjusted for disposition activity. The Companys reserves replacement will continue to be a focus as noted in 2017 where it replaced 126 percent of production declines through its development program.
The Company believes that it has the operational flexibility and ready to drill inventory as commodity prices allow. Additionally, the Company has protection from commodity price declines through its hedging program to support its development budget.
OBSIDIAN ENERGY 2017 | MANAGEMENTS DISCUSSION AND ANALYSIS 6 |
RESULTS OF OPERATIONS
Production
Year ended December 31 | ||||||||||||
Daily production |
2017 | 2016 | % change | |||||||||
Light oil (bbls/d) |
11,803 | 22,423 | (47 | ) | ||||||||
Heavy oil (bbls/d) |
5,387 | 8,750 | (38 | ) | ||||||||
NGL (bbls/d) |
2,433 | 3,636 | (33 | ) | ||||||||
Natural gas (mmcf/d) |
73 | 121 | (40 | ) | ||||||||
|
|
|
|
|
|
|||||||
Total production (boe/d) |
31,723 | 54,990 | (42 | ) | ||||||||
|
|
|
|
|
|
Obsidian Energy experienced production results in 2017, ahead of guidance, due to its successful development program and improvements in the Companys base production declines from integrated waterflood performance in the Cardium. Additionally, this led to 10 percent production growth, from the fourth quarter of 2016 to the fourth quarter of 2017, adjusted for disposition activity.
In 2017, the Company closed several dispositions which included properties in British Columbia and in the Swan Hills area of Alberta. Associated average production from these dispositions was 10,600 boe per day.
In 2016, Obsidian Energy closed several asset dispositions with associated average production of approximately 30,000 boe per day as it focused on reducing its debt levels. This resulted in a decline in 2017 production from the comparative period in 2016. Significant dispositions included:
| the Saskatchewan Viking disposition in June 2016 which had associated average production of approximately 13,700 boe per day; |
| the Slave Point disposition in April 2016 which had associated average production of approximately 3,900 boe per day; and |
| several non-core asset dispositions during the third quarter of 2016 with associated average production of approximately 6,000 boe per day. |
Netbacks
Year ended December 31 | ||||||||||||||||
2017 | 2016 | |||||||||||||||
Liquids | Natural Gas | Combined | Combined | |||||||||||||
(bbl) | (mcf) | (boe) | (boe) | |||||||||||||
Operating netback: |
||||||||||||||||
Sales price (1) |
$ | 50.37 | $ | 2.81 | $ | 37.58 | $ | 28.83 | ||||||||
Commodity gain (2) |
2.71 | 0.15 | 2.02 | 5.03 | ||||||||||||
Royalties |
(3.59 | ) | (0.15 | ) | (2.57 | ) | (1.08 | ) | ||||||||
Transportation |
(2.89 | ) | (0.30 | ) | (2.48 | ) | (1.72 | ) | ||||||||
Operating costs |
(15.03 | ) | (1.77 | ) | (13.40 | ) | (13.18 | ) | ||||||||
|
|
|
|
|
|
|
|
|||||||||
Netback |
$ | 31.57 | $ | 0.74 | $ | 21.15 | $ | 17.88 | ||||||||
|
|
|
|
|
|
|
|
|||||||||
(bbls/d) | (mmcf/d) | (boe/d) | (boe/d) | |||||||||||||
Production |
19,622 | 73 | 31,723 | 54,990 | ||||||||||||
|
|
|
|
|
|
|
|
(1) | Excluded from the netback calculation in the comparable period of 2016 was $28 million, mainly related to the proceeds received by the Company from permanently disposing of a pipeline commitment during the first quarter. |
(2) | Realized risk management gains and losses on commodity contracts. |
OBSIDIAN ENERGY 2017 | MANAGEMENTS DISCUSSION AND ANALYSIS 7 |
In 2017, the Companys netbacks increased from 2016 primarily due to improvements in commodity prices which was partially offset by lower commodity gains and higher royalties. The Companys hedging program continues to help reduce the volatility of its funds flow from operations, and thereby improve the Companys ability to align capital programs going forward. Operating Costs includes the effect of carried operating expenses from the Companys partner under the Peace River Oil Partnership of $21 million or $1.78 per boe on a combined basis (2016 - $15 million or $0.75 per boe).
Production Revenues
Revenues from the sale of oil, NGL and natural gas consisted of the following:
Year ended December 31 | ||||||||
(millions) |
2017 | 2016 | ||||||
Liquids |
$ | 381 | $ | 606 | ||||
Natural gas |
79 | 103 | ||||||
|
|
|
|
|||||
Gross revenues (1) |
$ | 460 | $ | 709 | ||||
|
|
|
|
(1) | Includes realized risk management gains on commodity contracts which totaled $23 million (2016 - $101 million). |
Gross revenues reduced from the prior year as a result of disposition activity, mainly in 2016, which led to a decrease in production volumes and revenues. This was partially offset by increases in the commodity price environment, specifically crude oil prices.
Reconciliation of Change in Production Revenues
(millions) |
||||
Gross revenues January 1 December 31, 2016 |
$ | 709 | ||
Decrease in liquids production |
(244 | ) | ||
Increase in liquids prices (1) |
47 | |||
Decrease in natural gas production |
(41 | ) | ||
Increase in natural gas prices (1) |
17 | |||
Decrease in other income (2) |
(28 | ) | ||
|
|
|||
Gross revenues January 1 December 31, 2017 |
$ | 460 | ||
|
|
(1) | Includes realized risk management gains and losses on commodity contracts. |
(2) | Decrease in other income mainly relates to proceeds received from disposing of a pipeline commitment in 2016. |
Royalties
Year ended December 31 | ||||||||
(millions) |
2017 | 2016 | ||||||
Royalties (millions) |
$ | 30 | $ | 22 | ||||
Average royalty rate (1) |
7 | % | 4 | % | ||||
$/boe |
$ | 2.57 | $ | 1.08 |
(1) | Excludes effects of risk management activities. |
Royalties increased in 2017, primarily as a result of improved crude oil prices. Additionally, in 2017, the Company received its annual gas cost allowance invoice and recorded a $2 million provision (2016 - $8 million credit).
OBSIDIAN ENERGY 2017 | MANAGEMENTS DISCUSSION AND ANALYSIS 8 |
Expenses
Year ended December 31 | ||||||||
(millions) |
2017 | 2016 | ||||||
Operating |
$ | 176 | $ | 281 | ||||
Transportation |
29 | 35 | ||||||
Financing |
23 | 114 | ||||||
Share-based compensation |
$ | 8 | $ | 12 | ||||
Year ended December 31 | ||||||||
(per boe) |
2017 | 2016 | ||||||
Operating (1) |
$ | 13.40 | $ | 13.18 | ||||
Transportation |
2.48 | 1.72 | ||||||
Financing |
1.96 | 5.65 | ||||||
Share-based compensation |
$ | 0.69 | $ | 0.60 |
(1) | Includes the effect of carried operating expenses from its partner under the Peace River Oil Partnership of $21 million or $1.78 per boe (2016 - $15 million or $0.75 per boe). |
Operating
In 2017, operating costs were within guidance of $13.00 - $13.50 per boe. During the first half of 2017, the Company increased its maintenance activity compared to 2016 when all discretionary spending was reduced as it focused on debt reduction. Additionally, in early 2017, the timing of certain asset disposition activity and costs associated with assets sold or held for sale resulted in higher costs.
On an absolute basis, operating costs decreased from the comparative period as the Company completed several asset dispositions as it focused on debt reduction and concentrating its asset base.
In late 2017, the Company fully utilized the deferred funding asset under the Peace River Oil Partnership resulting in no further carried operating expenses in 2018 and beyond. For 2018, the Company is targeting annual operating costs of $13.00 - $13.50 per boe.
Transportation
In 2017, transportation costs on a per boe basis increased from the comparable period as the Companys Peace River asset, which has higher average trucking costs due to its proximity to market, is now a larger percentage of the Companys portfolio as a result of disposition activity closed over the past year.
Financing
In 2017, the Company transitioned to a reserve-based syndicated credit facility. The underlying borrowing base of the syndicated credit facility is $550 million, less the amount of outstanding pari passu senior notes and outstanding GBP cross currency swap, resulting in $410 million currently available under the credit facility. The initial revolving period of the syndicated credit facility ends on May 17, 2018, with an additional one-year term out period, and is subject to a semi-annual borrowing base redetermination in May and November of each year. At December 31, 2017, the Company had $157 million of unused credit capacity available under the syndicated credit facility.
OBSIDIAN ENERGY 2017 | MANAGEMENTS DISCUSSION AND ANALYSIS 9 |
At December 31, 2017, the value of the Companys senior notes was $106 million (2016 $140 million). Summary information on the Companys senior notes outstanding as at December 31, 2017 is as follows:
Issue date |
Amount (millions) |
Initial Term |
Average interest rate |
Weighted average remaining term |
||||||||||
2007 Notes |
May 31, 2007 | US$5 | 12 years | 5.90 | % | 1.4 | ||||||||
2008 Notes |
May 29, 2008 | US$28 | 8 12 years | 6.31 | % | 0.7 | ||||||||
2009 Notes |
May 5, 2009 | US$8 | 5 10 years | 9.32 | % | 1.3 | ||||||||
2010 Q1 Notes |
March 16, 2010 | US$10 | 5 15 years | 5.85 | % | 2.2 | ||||||||
2010 Q4 Notes |
December 2, 2010, January 4, 2011 | US$21 | 5 15 years | 4.94 | % | 4.0 | ||||||||
2011 Notes |
November 30, 2011 | US$12 | 5 10 years | 4.79 | % | 3.9 |
Obsidian Energys debt structure includes short-term financings under its syndicated credit facility and long-term financing through its senior notes. Financing charges in 2017 decreased from 2016 as the Company applied asset disposition proceeds to re-pay outstanding indebtedness on its syndicated credit facility and to pre-pay outstanding senior notes.
In 2015, as part of entering into amending agreements with its lenders and noteholders, the Company agreed to grant floating charge security over all of its property in favour of the lenders and the noteholders on a pari passu basis, which security will be fully released on such date when both (a) no default or event of default is continuing under the Companys syndicated credit facility or senior notes and (b) the Company has achieved both (i) a Senior Debt to EBITDA ratio of 3:1 or less for four consecutive quarters, and (ii) an investment grade rating on its senior secured debt.
The interest rates on any non-hedged portion of the Companys syndicated credit facility are subject to fluctuations in short-term money market rates as advances on the syndicated credit facility are generally made under short-term instruments. As at December 31, 2017, 70 percent (December 31, 2016 70 percent) of the Companys outstanding debt instruments were exposed to changes in short-term interest rates.
Share-Based Compensation
Share-based compensation expense relates to the Companys Stock Option Plan (the Option Plan), Restricted and Performance Share Unit Plan (RPSU), Deferred Share Unit Plan (DSU) and Performance Share Unit Plan (PSU).
Share-based compensation consisted of the following:
Year ended December 31 | ||||||||
(millions) |
2017 | 2016 | ||||||
Options |
$ | 1 | $ | 1 | ||||
PSU plan |
1 | 1 | ||||||
DSU plan |
| 1 | ||||||
RPSU equity method |
7 | 6 | ||||||
RPSU liability method |
(1 | ) | 3 | |||||
|
|
|
|
|||||
Share-based compensation |
$ | 8 | $ | 12 | ||||
|
|
|
|
The share price used in the fair value calculation of the RPSU plan (liability method), PSU and DSU obligations at December 31, 2017 was $1.56 (2016 $2.37).
OBSIDIAN ENERGY 2017 | MANAGEMENTS DISCUSSION AND ANALYSIS 10 |
General and Administrative Expenses (G&A)
Year ended December 31 | ||||||||
(millions, except per boe amounts) |
2017 | 2016 | ||||||
Gross |
$ | 51 | $ | 87 | ||||
Per boe |
4.41 | 4.32 | ||||||
Net |
31 | 56 | ||||||
Per boe |
$ | 2.68 | $ | 2.81 |
Obsidian Energy closed a number of asset dispositions in 2016 and early 2017 which resulted in reductions in staff and declines in both the absolute dollars and per boe figures. The Company will continue to seek improvements in its cost structure in 2018, with a target range of $2.00 - $2.50 net per boe.
Restructuring Expense
Year ended December 31 | ||||||||
(millions, except per boe amounts) |
2017 | 2016 | ||||||
Restructuring |
$ | 10 | $ | 135 | ||||
Per boe |
$ | 0.86 | $ | 6.70 |
In 2017, as a result of disposition activity, the Company further aligned its organizational structure to its operations which led to lower staff levels and associated restructuring costs.
In 2016, the Company recorded a charge totaling $108 million on certain office lease commitments as they were considered onerous contracts. The charge was the result of completing several asset dispositions that led to staff reductions and the need for less office space.
Other Expense
Year ended December 31 | ||||||||
(millions, except per boe amounts) |
2017 | 2016 | ||||||
Other |
$ | 15 | $ | | ||||
Per boe |
$ | 1.33 | $ | |
In the fourth quarter of 2017, the Company settled the outstanding lawsuit it had with the United States Securities and Exchange Commission (SEC) for US$8.5 million (CAD$11 million). The settlement is in relation to the Companys 2014 restatement of certain financial results while it was known as Penn West Petroleum Ltd.
OBSIDIAN ENERGY 2017 | MANAGEMENTS DISCUSSION AND ANALYSIS 11 |
Depletion, Depreciation, Impairment and Accretion
Year ended December 31 | ||||||||
(millions, except per boe amounts) |
2017 | 2016 | ||||||
Depletion and depreciation (D&D) |
$ | 289 | $ | 368 | ||||
D&D expense per boe |
24.97 | 18.33 | ||||||
PP&E Impairment |
15 | 288 | ||||||
PP&E Impairment per boe |
1.30 | 14.35 | ||||||
E&E Impairment |
| 235 | ||||||
E&E Impairment per boe |
| 11.66 | ||||||
Accretion of decommissioning liability |
11 | 24 | ||||||
Accretion expense per boe |
$ | 0.95 | $ | 1.19 |
For 2017, the Companys total D&D expense decreased from the comparative period mainly due to asset disposition activity and impairment charges recorded in 2016.
In 2017, Obsidian Energy announced it had entered into a definitive sale agreement to sell certain assets. As the sales were not closed by the balance sheet dates, the assets were classified as held for sale and impairment tests were required. As the book value of these assets exceeded the fair value received, non-cash impairment charges of $15 million (2016 $288 million) were recorded.
In 2016, the Company recorded a $235 million impairment charge relating to certain E&E assets in Alberta and natural gas properties in British Columbia as the Company has no future plans for development in these areas as it focuses activities within its key development plays.
Taxes
Year ended December 31 | ||||||||
(millions) |
2017 | 2016 | ||||||
Deferred tax recovery |
$ | 13 | $ | 252 |
The decrease in the deferred tax recovery from 2016 was primarily due to impairment and restructuring charges recognized in 2016.
Tax Pools
As at December 31 | ||||||||
(millions) |
2017 | 2016 | ||||||
Undepreciated capital cost (UCC) |
$ | 372 | $ | 365 | ||||
Canadian development expense (CDE) |
24 | | ||||||
Canadian exploration expense (CEE) |
2 | | ||||||
Non-capital losses |
1,973 | 2,000 | ||||||
Other |
11 | 67 | ||||||
|
|
|
|
|||||
Total |
$ | 2,382 | $ | 2,432 | ||||
|
|
|
|
In 2017 and 2016, the Companys tax pool balance declined as a result of asset dispositions that were closed during the year.
OBSIDIAN ENERGY 2017 | MANAGEMENTS DISCUSSION AND ANALYSIS 12 |
Foreign Exchange
Obsidian Energy records unrealized foreign exchange gains or losses to translate U.S. denominated senior, secured notes and the related accrued interest to Canadian dollars using the exchange rates in effect on the balance sheet date. Realized foreign exchange gains or losses are recorded upon repayment of the senior notes.
The split between realized and unrealized foreign exchange is as follows:
Year ended December 31 | ||||||||
2017 | 2016 | |||||||
Realized foreign exchange loss on debt maturities |
$ | (6 | ) | $ | (37 | ) | ||
Realized foreign exchange loss on debt pre-payments |
| (191 | ) | |||||
Unrealized foreign exchange gain |
11 | 312 | ||||||
|
|
|
|
|||||
Foreign exchange gain |
$ | 5 | $ | 84 | ||||
|
|
|
|
In 2017, the Company repaid senior notes in the amount of $26 million as part of normal course maturities (2016 $185 million normal course maturities and $1,075 million in prepayments).
Net Loss
Years ended December 31 | ||||||||
(millions, except per share amounts) |
2017 | 2016 | ||||||
Net loss |
$ | (84 | ) | $ | (696 | ) | ||
Basic per share |
(0.17 | ) | (1.39 | ) | ||||
Diluted per share |
$ | (0.17 | ) | $ | (1.39 | ) |
In 2017, the net loss was attributed to higher depletion costs on a per boe basis and a low commodity price environment specifically in the first half of 2017.
In 2016, the net loss was due to non-cash PP&E impairment charges as a result of classifying certain assets as held for sale in addition to impairments on E&E assets as the Company re-focused its development plans to the Cardium, Peace River and Alberta Viking areas.
Capital Expenditures
Year ended December 31 | ||||||||
(millions) |
2017 | 2016 | ||||||
Land acquisition and retention |
$ | 3 | $ | 2 | ||||
Drilling and completions |
101 | 71 | ||||||
Well equipping and facilities |
83 | 43 | ||||||
Geological and geophysical |
2 | 4 | ||||||
Corporate |
2 | 2 | ||||||
Capital carried by partners |
(50 | ) | (40 | ) | ||||
Development capital expenditures (1) |
141 | 82 | ||||||
SR&ED tax credits |
(1 | ) | | |||||
Property dispositions, net |
(110 | ) | (1,415 | ) | ||||
|
|
|
|
|||||
Total expenditures |
$ | 30 | $ | (1,333 | ) | |||
|
|
|
|
(1) | Exploration and development capital includes costs related to Property, Plant and Equipment and Exploration and Evaluation activities. |
OBSIDIAN ENERGY 2017 | MANAGEMENTS DISCUSSION AND ANALYSIS 13 |
In 2017, the Company focused its development activities across its key areas being the Cardium, Peace River, Viking and Deep Basin. Key highlights include:
| Cardium Continued focus on integrated waterflood development with 10 (9.5 net) operated wells drilled and 24 (23.2 net) injectors. |
| Peace River Primary, cold flow, development within PROP specifically within Harmon Valley, resulting in 22 wells drilled (12.1 net). |
| Viking Development in the Esther area with 10 (10 net) operated wells drilled with results ahead of expectations. |
| Deep Basin Drilled the Companys first three wells (2.4 net) within the Mannville formation. |
In the fourth quarter of 2017, as a result of entering into a definitive sale agreement, the Company classified certain non-core legacy assets located in Central Alberta as assets held for sale at December 31, 2017. In January 2018, the transaction closed, with associated average production of approximately 2,200 boe per day sold, in exchange for the assumption of abandonment and reclamation liabilities.
Drilling
Year ended December 31 | ||||||||||||||||
2017 | 2016 | |||||||||||||||
Gross | Net | Gross | Net | |||||||||||||
Oil | 42 | 31.6 | 60 | 35 | ||||||||||||
Gas |
3 | 2.4 | | | ||||||||||||
Injectors, stratigraphic and service |
30 | 26.5 | 3 | 3 | ||||||||||||
|
|
|
|
|
|
|
|
|||||||||
Total |
75 | 60.5 | 63 | 38 | ||||||||||||
|
|
|
|
|
|
|
|
|||||||||
Success rate (1) |
100 | % | 100 | % |
(1) | Success rate is calculated excluding stratigraphic and service wells. |
Gain on asset dispositions
Year ended December 31 | ||||||||
(millions) |
2017 | 2016 | ||||||
Gain on asset dispositions |
$ | 74 | $ | 33 | ||||
|
|
|
|
The Company completed its formal disposition program during the first quarter of 2017, by disposing of assets within British Columbia and in the Swan Hills area of Alberta. Additionally, during 2017, the Company closed minor asset dispositions to further focus its asset base within its key development areas in Alberta.
Environmental and Climate Change
The oil and gas industry has a number of environmental risks and hazards and is subject to regulation by all levels of government. Environmental legislation includes, but is not limited to, operational controls, site restoration requirements and restrictions on emissions of various substances produced in association with oil and natural gas operations. Compliance with such legislation could require additional expenditures and a failure to comply may result in fines and penalties which could, in the aggregate and under certain assumptions, become material.
Obsidian Energy is dedicated to managing the environmental impact from its operations through its environmental programs which include resource conservation, water management and site abandonment/reclamation/remediation. Operations are continuously monitored to minimize environmental impact and allocate sufficient capital to reclamation and other activities to mitigate the impact on the areas in which the Company operates.
OBSIDIAN ENERGY 2017 | MANAGEMENTS DISCUSSION AND ANALYSIS 14 |
Liquidity and Capital Resources
Capitalization
Year ended December 31 | ||||||||
(millions) |
2017 | 2016 | ||||||
Common shares issued, at market (1) |
$ | 787 | $ | 1,192 | ||||
Bank loans and long-term notes |
359 | 469 | ||||||
Cash |
(2 | ) | (11 | ) | ||||
|
|
|
|
|||||
Total enterprise value |
$ | 1,144 | $ | 1,650 | ||||
|
|
|
|
(1) | Based on share price at December 31, 2017 of $1.56 (December 31, 2016 - $2.37). |
Net Debt
Year ended December 31 | ||||||||
(millions) |
2017 | 2016 | ||||||
Bank loans and long-term notes |
$ | 359 | $ | 469 | ||||
Working capital deficiency (1) |
24 | 33 | ||||||
|
|
|
|
|||||
Net debt |
$ | 383 | $ | 502 | ||||
|
|
|
|
(1) | The Companys working capital deficiency excludes the current portion of deferred funding asset, risk management, long-term debt, provisions and assets held for sale. |
Liquidity
In the second quarter of 2017, the Company transitioned to a reserve-based syndicated credit facility. For further details on the Companys debt instruments, please refer to the Financing section of this MD&A.
The Company actively manages its debt portfolio and considers opportunities to reduce or diversify its debt capital structure. Management contemplates both operating and financial risks and takes action as appropriate to limit the Companys exposure to certain risks. Management maintains close relationships with the Companys lenders and agents to monitor credit market developments. These actions and plans aim to increase the likelihood of maintaining the Companys financial flexibility and capital program, supporting the Companys ability to capture opportunities in the market and execute longer-term business strategies.
The Company has a number of covenants related to its syndicated credit facility and senior notes. On December 31, 2017, the Company was in compliance with all of these financial covenants which consisted of the following:
Limit | December 31, 2017 |
|||||||
Senior debt to EBITDA (1) |
Less than 3:1 | 1.9 | ||||||
Total debt to EBITDA (1) |
Less than 4:1 | 1.9 | ||||||
Senior debt to capitalization |
Less than 50% | 15% | ||||||
Total debt to capitalization |
Less than 55% | 15% |
(1) | EBITDA is calculated in accordance with Obsidian Energys lending agreements wherein unrealized risk management gains and losses and impairment provisions are excluded. Additionally, under the syndicated credit facility, realized foreign exchange gains or losses related to debt maturities are excluded from the calculation. |
OBSIDIAN ENERGY 2017 | MANAGEMENTS DISCUSSION AND ANALYSIS 15 |
Financial Instruments
The Company had the following financial instruments outstanding as at December 31, 2017. Fair values are determined using external counterparty information, which is compared to observable market data. Obsidian Energy limits its credit risk by executing counterparty risk procedures which include transacting only with institutions within its syndicated credit facility or companies with high credit ratings and by obtaining financial security in certain circumstances.
Notional volume |
Remaining term |
Pricing | Fair value (millions) |
|||||||||||
Natural gas |
||||||||||||||
AECO Swaps |
1,900 mcf/d | Jan/18 Mar/18 | $3.19/mcf | $ | ||||||||||
AECO Swaps |
1,900 mcf/d | Jan/18 Jun/18 | $2.91/mcf | | ||||||||||
AECO Swaps |
1,900 mcf/d | Jan/18 Sep/18 | $2.69/mcf | 1 | ||||||||||
AECO Swaps |
3,800 mcf/d | Jan/18 Mar/18 | $3.33/mcf | | ||||||||||
AECO Swaps |
3,800 mcf/d | Jan/18 Jun/18 | $2.84/mcf | 1 | ||||||||||
AECO Swaps |
15,200 mcf/d | Jan/18 Dec/18 | $2.67/mcf | 6 | ||||||||||
Ventura |
7,500 mcf/d | Jan/18 Dec/18 | US$2.79/mcf | | ||||||||||
Crude Oil |
||||||||||||||
WTI Swaps |
1,000 bbl/d | Jan/18 Jun/18 | $71.00/bbl | (1 | ) | |||||||||
WTI Swaps |
2,000 bbl/d | Jul/18 Dec/18 | US$50.09/bbl | (4 | ) | |||||||||
WTI Swaps |
6,000 bbl/d | Jan/18 Mar/18 | US$51.07/bbl | (6 | ) | |||||||||
WTI Swaps |
4,000 bbl/d | Apr/18 Jun/18 | US$50.95/bbl | (4 | ) | |||||||||
WTI Swaps |
2,000 bbl/d | Jul/18 Sep/18 | US$51.90/bbl | (2 | ) | |||||||||
WTI Swaps |
2,000 bbl/d | Oct/18 Dec/18 | US$50.81/bbl | (2 | ) | |||||||||
WTI Swaps |
4,000 bbl/d | Jan/18 Dec/18 | $71.04/bbl | (5 | ) | |||||||||
WTI Swaps |
1,000 bbl/d | Jan/18 Dec/18 | US$49.35/bbl | (4 | ) | |||||||||
WTI Swaps |
2,000 bbl/d | Apr/18 Dec/18 | US$48.43/bbl | (7 | ) | |||||||||
WTI Swaps |
1,000 bbl/d | Jul/18 Mar/19 | US$50.20/bbl | (3 | ) | |||||||||
WTI Swaps |
2,000 bbl/d | Jan/19 Mar/19 | $66.50/bbl | (1 | ) | |||||||||
WTI Swaps |
2,000 bbl/d | Jan/19 Mar/19 | US$49.93/bbl | (1 | ) | |||||||||
WTI Swaps |
4,000 bbl/d | Jan/19 Jun/19 | $68.58/bbl | (2 | ) | |||||||||
WTI Swaps |
1,000 bbl/d | Apr/19 Jun/19 | US$55.35/bbl | | ||||||||||
Foreign exchange forward contracts on revenue |
||||||||||||||
FX Collar |
US$24 | 2018 | 1.210 to 1.272 USD/CAD | | ||||||||||
FX Swap |
US$24 | 2018 | 1.2768 | 1 | ||||||||||
FX Swap |
US$24 | 2018 | 1.2500 | | ||||||||||
FX Swap |
US$24 | 2018 | 1.2568 | | ||||||||||
FX Swap |
US$24 | 2018 | 1.2803 | 1 | ||||||||||
FX Swap |
US$12 | 2018 | 1.2840 | | ||||||||||
Cross currency swaps |
|
|||||||||||||
10-year initial term |
£57 | 2018 | 2.0075 CAD/GBP, 6.95 | % | (18 | ) | ||||||||
18-month offset |
(£43 | ) | 2018 | 1.7049 CAD/GBP, 6.95 | % | | ||||||||
10-year initial term |
£5 | 2019 | 1.8051 CAD/GBP, 9.15 | % | | |||||||||
10-year initial term |
10 | 2019 | 1.5870 CAD/EUR, 9.22 | % | | |||||||||
|
|
|||||||||||||
Total |
$ | (50) | ||||||||||||
|
|
Please refer to Obsidian Energys website at www.obsidianenergy.com for details on all financial instruments currently outstanding.
OBSIDIAN ENERGY 2017 | MANAGEMENTS DISCUSSION AND ANALYSIS 16 |
Subsequent to December 31, 2017, the Company entered into the following crude oil swaps and foreign exchange contracts on long-term debt:
Reference Price |
Term |
Price | Notional | |||
WTI |
Apr/19 Jun/19 | US$57.70/bbl | 1,000 bbl/d | |||
WTI |
Jul/19 Sep/19 | US$57.00/bbl | 1,000 bbl/d | |||
USD |
Jan/19 May/19 | 1.2259 | US$5 | |||
USD |
Jan/19 May/19 | 1.2319 | US$5 | |||
USD |
Jan/19 May/19 | 1.2400 | US$5 |
Additionally, subsequent to December 31, 2017, the Company unwound its outstanding £5 million and 10 million cross currency swaps for nil proceeds.
The components of risk management on the Statement of Income (Loss) are as follows:
Year ended December 31 | ||||||||
2017 | 2016 | |||||||
Realized |
||||||||
Settlement of commodity contracts/assignment |
$ | 23 | $ | 99 | ||||
Monetization of commodity contracts |
| 2 | ||||||
Settlement of foreign exchange contracts |
8 | 3 | ||||||
Monetization of foreign exchange contracts |
| 32 | ||||||
|
|
|
|
|||||
Total realized risk management gain |
31 | 136 | ||||||
Unrealized |
||||||||
Commodity contracts |
(7 | ) | (72 | ) | ||||
Electricity swaps |
| 4 | ||||||
Crude oil assignment |
| (2 | ) | |||||
Foreign exchange contracts |
(6 | ) | (43 | ) | ||||
Cross-currency swaps |
6 | (34 | ) | |||||
|
|
|
|
|||||
Total unrealized risk management (loss) |
(7 | ) | (147 | ) | ||||
|
|
|
|
|||||
Risk management gain (loss) |
$ | 24 | $ | (11 | ) | |||
|
|
|
|
In 2017, the Company monetized a total of $nil (2016 - US$115 million) of foreign exchange forward contracts on senior notes and unwound AECO swap contracts totaling $nil (2016 - 14,100) mcf per day.
OBSIDIAN ENERGY 2017 | MANAGEMENTS DISCUSSION AND ANALYSIS 17 |
Outlook
For 2018, Obsidian Energys capital program is expected to provide five percent production growth from 2017, adjusted for acquisition and disposition activity. The Company expects to fund its capital program using funds flow from operations. There have been no changes to the Companys 2018 guidance as previously disclosed on January 31, 2018 within the Companys press release Obsidian Energy announces Legacy asset disposition.
Metric |
2018 Guidance Range | |||||||
Average Production |
boe per day | 29,000 30,000 | ||||||
Production Growth rate (1) |
5 | % | ||||||
E&D Capital Expenditures |
$ | millions | $125 | |||||
Decommissioning Expenditures |
$ | millions | $10 | |||||
Operating costs |
$ | /boe | $ | 13.00 - $13.50 per boe | ||||
G&A |
$ | /boe | $ | 2.00 - $2.50 per boe |
(1) | Relative to full year 2017 production, adjusted for 2017 and 2018 acquisition and disposition activity, of 28,000 boe per day. |
This outlook section is included to provide shareholders with information about Obsidian Energys expectations as at March 6, 2018 for production, production growth, exploration and development capital expenditures, decommissioning expenditures, operating costs and G&A for 2018 and readers are cautioned that the information may not be appropriate for any other purpose. This information constitutes forward-looking information. Readers should note the assumptions, risks and discussion under Forward-Looking Statements and are cautioned that numerous factors could potentially impact Obsidian Energys capital expenditure levels, operating costs and production, including fluctuations in commodity prices.
All press releases are available on Obsidian Energys website at www.obsidianenergy.com, on SEDAR at www.sedar.com, and on EDGAR at www.sec.gov.
Sensitivity Analysis
Estimated sensitivities to selected key assumptions on funds flow for the 12 months subsequent to the date of this MD&A, including risk management contracts entered to date, are based on forecasted results as discussed in the Outlook above.
Impact on funds flow | ||||||||||
Change of: |
Change |
$ millions |
$/share |
|||||||
Price per barrel of liquids |
$1.00 | 2 | 0.01 | |||||||
Liquids production |
1,000 bbls/day | 15 | 0.03 | |||||||
Price per mcf of natural gas |
$0.10 | 1 | 0.01 | |||||||
Natural gas production |
10 mmcf/day | | | |||||||
Effective interest rate |
1% | 3 | 0.01 | |||||||
Exchange rate ($US per $CAD) |
$0.01 | 1 | 0.01 |
OBSIDIAN ENERGY 2017 | MANAGEMENTS DISCUSSION AND ANALYSIS 18 |
Contractual Obligations and Commitments
Obsidian Energy is committed to certain payments over the next five calendar years and thereafter as follows:
2018 | 2019 | 2020 | 2021 | 2022 | Thereafter | Total | ||||||||||||||||||||||
Long-term debt (1) |
$ | 31 | $ | 269 | $ | 34 | $ | 15 | $ | 7 | $ | 3 | $ | 359 | ||||||||||||||
Transportation |
12 | 10 | 9 | 7 | 5 | 14 | 57 | |||||||||||||||||||||
Power infrastructure |
8 | 2 | | | | | 10 | |||||||||||||||||||||
Interest obligations |
12 | 6 | 2 | 1 | 1 | | 22 | |||||||||||||||||||||
Office lease (2) |
34 | 34 | 34 | 34 | 34 | 73 | 243 | |||||||||||||||||||||
Decommissioning liability (3) |
10 | 10 | 10 | 10 | 10 | 97 | 147 | |||||||||||||||||||||
|
|
|
|
|
|
|
|
|
|
|
|
|
|
|||||||||||||||
Total |
$ | 107 | $ | 331 | $ | 89 | $ | 67 | $ | 57 | $ | 187 | $ | 838 | ||||||||||||||
|
|
|
|
|
|
|
|
|
|
|
|
|
|
(1) | The 2019 figure includes $253 million related to the syndicated credit facility that is due for renewal in 2019. Historically, the Company has successfully renewed its syndicated credit facility. |
(2) | The future office lease commitments above are to be reduced by contracted sublease recoveries totaling $101 million. |
(3) | These amounts represent the inflated, discounted future reclamation and abandonment costs that are expected to be incurred over the life of the Companys properties. |
The initial revolving period of the syndicated credit facility ends on May 17, 2018, with an additional one-year term out period. In addition, the Company has an aggregate of US$84 million in senior notes maturing between 2018 and 2025. If the Company is unsuccessful in renewing or replacing the syndicated credit facility or obtaining alternate funding for some or all of the maturing amounts of the senior notes, it is possible that it could be required to obtain other facilities, including term bank loans.
The Company is involved in various litigation and claims in the normal course of business and records provisions for claims as required.
Equity Instruments
Common shares issued: |
||||
As at December 31, 2017 |
504,340,988 | |||
Stock option plan |
| |||
As at March 6, 2018 |
504,340,988 | |||
Options outstanding: |
||||
As at December 31, 2017 |
3,662,575 | |||
Forfeited |
(669,525 | ) | ||
As at March 6, 2018 |
2,993,050 |
OBSIDIAN ENERGY 2017 | MANAGEMENTS DISCUSSION AND ANALYSIS 19 |
Fourth Quarter Highlights
Key financial and operational results for the fourth quarter were as follows:
Three months ended December 31 | ||||||||||||
2017 | 2016 | % change | ||||||||||
Financial (millions, except per share amounts) |
||||||||||||
Gross revenues (1) |
$ | 119 | $ | 133 | (11 | ) | ||||||
Funds flow from operations |
52 | 48 | 8 | |||||||||
Basic per share |
0.10 | 0.10 | | |||||||||
Diluted per share |
0.10 | 0.10 | | |||||||||
Net loss |
(58 | ) | (232 | ) | (75 | ) | ||||||
Basic per share |
(0.12 | ) | (0.46 | ) | (74 | ) | ||||||
Diluted per share |
(0.12 | ) | (0.46 | ) | (74 | ) | ||||||
Development capital expenditures (2) |
37 | 50 | (26 | ) | ||||||||
Property acquisition (disposition), net |
$ | (39 | ) | $ | (14 | ) | >100 | |||||
Operations |
||||||||||||
Daily production |
||||||||||||
Light oil and NGL (bbls/d) |
14,288 | 15,803 | (10 | ) | ||||||||
Heavy oil (bbls/d) |
5,247 | 5,493 | (4 | ) | ||||||||
Natural gas (mmcf/d) |
71 | 103 | (31 | ) | ||||||||
|
|
|
|
|
|
|||||||
Total production (boe/d) |
31,447 | 38,481 | (18 | ) | ||||||||
|
|
|
|
|
|
|||||||
Corporate netback per boe (2) |
||||||||||||
Sales price |
$ | 40.55 | $ | 33.33 | 22 | |||||||
Risk management gain |
| 4.27 | (100 | ) | ||||||||
|
|
|
|
|
|
|||||||
Net sales price |
40.55 | 37.60 | 8 | |||||||||
Royalties |
(2.64 | ) | (1.26 | ) | >100 | |||||||
Operating expenses |
(12.50 | ) | (14.05 | ) | (11 | ) | ||||||
Transportation |
(2.41 | ) | (1.62 | ) | 49 | |||||||
|
|
|
|
|
|
|||||||
Netback |
$ | 23.00 | $ | 20.67 | 11 | |||||||
|
|
|
|
|
|
|||||||
Liquids netback |
||||||||||||
Sales price |
$ | 56.10 | $ | 45.82 | 22 | |||||||
Risk management gain (loss) |
(1.11 | ) | 7.76 | >(100) | ||||||||
|
|
|
|
|
|
|||||||
Net sales price |
54.99 | 53.58 | 3 | |||||||||
Royalties |
(3.71 | ) | (3.11 | ) | 19 | |||||||
Operating expenses |
(14.07 | ) | (17.32 | ) | (19 | ) | ||||||
Transportation |
(3.04 | ) | (1.25 | ) | >100 | |||||||
|
|
|
|
|
|
|||||||
Netback |
$ | 34.17 | $ | 31.90 | 7 | |||||||
|
|
|
|
|
|
|||||||
Natural gas netback |
||||||||||||
Sales price |
$ | 2.51 | $ | 2.98 | (16 | ) | ||||||
Risk management gain (loss) |
0.30 | (0.01 | ) | >100 | ||||||||
|
|
|
|
|
|
|||||||
Net sales price |
2.81 | 2.97 | (5 | ) | ||||||||
Royalties |
(0.15 | ) | 0.17 | >(100) | ||||||||
Operating expenses |
(1.54 | ) | (1.67 | ) | (8 | ) | ||||||
Transportation |
(0.23 | ) | (0.35 | ) | (34 | ) | ||||||
|
|
|
|
|
|
|||||||
Netback |
$ | 0.89 | $ | 1.12 | (21 | ) | ||||||
|
|
|
|
|
|
(1) | Includes realized gains and losses on commodity contracts and excludes gains and losses on foreign exchange hedges. |
(2) | Includes the effect of capital and operating costs carried by partners. |
OBSIDIAN ENERGY 2017 | MANAGEMENTS DISCUSSION AND ANALYSIS 20 |
Financial
Funds flow from operations increased in the fourth quarter of 2017 from the comparative quarter as increases in commodity prices and lower operating costs, more than offset declines in production from asset disposition activity.
Gross revenues decreased in the fourth quarter of 2017 compared to 2016 due to lower production volumes as the Company completed its formal asset disposition program in early 2017.
The net loss in the fourth quarter of 2017 was primarily the result of unrealized risk management losses related to outstanding crude oil contracts. The net loss was lower than the comparative period as the Company recorded impairment charges in 2016, specifically on E&E assets, as the Company focused on its key development areas.
Operations
Netbacks increased from the comparative quarter mainly due to higher realized prices and lower operating costs as the Company continued to focus on cost reduction strategies.
Development activities during the quarter were focused in the Cardium, Deep Basin and Peace River areas with nine net operated wells drilled. Additionally, during the fourth quarter, the Company brought on production its first three Mannville wells all with results at or above expectations.
Production declined from the comparable period in 2016, due to asset dispositions that closed during 2017. During the fourth quarter of 2017, average production within the Companys key development areas were as follows:
| Cardium 18,190 boe per day |
| Deep Basin (Cardium) 1,356 boe per day |
| Peace River 4,963 boe per day |
| Alberta Viking 2,508 boe per day |
| Legacy 4,430 boe per day |
In the fourth quarter of 2017, WTI crude oil prices averaged US$55.40 per barrel compared to US$48.21 per barrel in the third quarter of 2017 and US$49.29 per barrel in the fourth quarter of 2016. The increase is mainly due to OPEC and non-OPEC producers commitment to extending a production ceiling to the end of 2018. The AECO Monthly Index averaged $1.82 per mcf in the fourth quarter of 2017 compared to $1.75 per mcf in the third quarter of 2017 and $2.95 per mcf for the fourth quarter of 2016. Natural gas prices decreased in 2017 mainly due to weak demand resulting in high storage levels.
Evaluation of Disclosure Controls and Procedures
The Companys disclosure controls and procedures are designed to provide reasonable assurance that information required to be disclosed by the Company in its annual filings, interim filings or other reports filed or submitted by it under securities legislation is recorded, processed, summarized and reported within the time periods specified in such securities legislation. They include controls and procedures designed to ensure that information required to be disclosed by the Company in its annual filings, interim filings or other reports that it files or submits under applicable securities legislation is accumulated and communicated to the Companys management, including its Chief Executive Officer and Chief Financial Officer, as appropriate, to allow timely decisions regarding required disclosure.
An internal evaluation was carried out by management under the supervision and with the participation of the Companys Chief Executive Officer and Chief Financial Officer of the effectiveness of Obsidian Energys disclosure controls and procedures as defined in Rule 13a-15 under the US Securities Exchange Act of 1934 (the Exchange Act) and as defined in Canada by National Instrument 52-109 Certification of Disclosure in Issuers Annual and Interim Filings (NI 52-109) as at December 31, 2017. Based on that evaluation, the Chief Executive Officer and the Chief Financial Officer concluded that as at December 31, 2017 the disclosure controls and procedures were effective.
OBSIDIAN ENERGY 2017 | MANAGEMENTS DISCUSSION AND ANALYSIS 21 |
Managements Report on Internal Control over Financial Reporting
Internal control over financial reporting (ICFR) is a process designed to provide reasonable assurance regarding the reliability of financial reporting and the preparation of financial statements for external purposes in accordance with IFRS. Obsidian Energys management, including its Chief Executive Officer and Chief Financial Officer, is responsible for establishing and maintaining adequate ICFR, as such term is defined in Rule 13a-15 under the Exchange Act and as defined in Canada by NI 52-109. A material weakness in the Companys ICFR exists if a deficiency, or a combination of deficiencies, in its ICFR is such that there is a reasonable possibility that a material misstatement of its annual financial statements or interim financial reports will not be prevented or detected on a timely basis.
An internal evaluation was carried out by management under the supervision and with the participation of the Companys Chief Executive Officer and Chief Financial Officer of the effectiveness of the Companys ICFR as at December 31, 2017. The assessment was based on the framework in Internal Control Integrated Framework (2013) issued by the Committee of Sponsoring Organizations of the Treadway Commission (COSO). Based on that evaluation, the Chief Executive Officer and the Chief Financial Officer concluded that as at December 31, 2017 the Companys ICFR was effective.
Changes in Internal Control Over Financial Reporting
Obsidian Energys senior management has evaluated whether there were any changes in the Companys ICFR that occurred during the period beginning on October 1, 2017 and ending on December 31, 2017 that have materially affected, or are reasonably likely to materially affect, the Companys ICFR. No changes to Obsidian Energys ICFR were made during the quarter.
Future Accounting Pronouncements
The IASB issued IFRS 15 Revenue from Contracts with Customers which replaces IAS 18 Revenue. IFRS 15 specifies revenue recognition criteria and expanded disclosures for revenue. The new standard is effective for annual periods beginning on or after January 1, 2018. The Company has completed its assessment of the standard and adopted the standard retrospectively on January 1, 2018. The Company has also concluded that the adoption of IFRS 15 will not have a material impact on its financial statements. Obsidian Energy will expand its disclosures in the notes to the financial statements as outlined in IFRS 15.
The IASB completed the final sections of IFRS 9 Financial Instruments which replaces IAS 39 Financial Statement: Recognition and Measurement. IFRS 9 provides guidance on the recognition and measurement, impairment and derecognition on financial instruments. The new standard is effective for annual periods beginning on or after January 1, 2018. The Company has concluded that the adoption of IFRS 9 will not result in any material changes in the measurement and carrying value of the Companys financial instruments.
The IASB issued IFRS 16 Leases in January 2016 which replaces IAS 17 Leases. IFRS 16 outlines several new requirements in regards to the recognition, measurement and disclosure of leases. A key principle within the standard includes a single lessee accounting model which requires lessees to recognise assets and liabilities for all leases which have a term more than 12 months. The accounting for lessors, which classify leases as either operating or finance, remains substantially unchanged from the previous standard. The new standard is effective for annual reporting periods beginning on or after January 1, 2019. Obsidian Energy is currently assessing the impact of the standard.
Off-Balance-Sheet Financing
Obsidian Energy has off-balance-sheet financing arrangements consisting of operating leases. The operating lease payments are summarized in the Contractual Obligations and Commitments section.
OBSIDIAN ENERGY 2017 | MANAGEMENTS DISCUSSION AND ANALYSIS 22 |
Critical Accounting Estimates
Obsidian Energys significant accounting policies are detailed in Note 3 to its audited consolidated financial statements. In the determination of financial results, Obsidian Energy must make certain critical accounting estimates as follows:
Depletion and Impairments
Costs of developing oil and natural gas reserves are capitalized and depleted against associated oil and natural gas production using the unit-of-production method based on the estimated proved plus probable reserves with forecast commodity pricing.
All of the Companys reserves were evaluated by Sproule Associates Limited (SAL), an independent, qualified reserve evaluation engineering firm. Obsidian Energys reserves are determined in compliance with National Instrument 51-101. The evaluation of oil and natural gas reserves is, by its nature, based on complex extrapolations and models as well as other significant engineering, reservoir, capital, pricing and cost assumptions. Reserve estimates are a key component in the calculation of depletion and are an important component in determining the recoverable amount in impairment tests. The determination of the recoverable amount involves estimating the higher of an assets fair value less costs to sell or its value-in-use, the latter of which is based on its discounted future cash flows using an applicable discount rate. To the extent that the recoverable amount, which could be based in part on its reserves, is less than the carrying amount of property, plant and equipment, a write-down against income is recorded.
Decommissioning Liability
The decommissioning liability is the present value of the Companys future statutory, contractual, legal or constructive obligations to retire long-lived assets including wells, facilities and pipelines. The liability is recorded on the balance sheet with a corresponding increase to the carrying amount of the related asset. The recorded liability increases over time to its future liability amount through accretion charges to income. Revisions to the estimated amount or timing of the obligations are reflected as increases or decreases to the recorded decommissioning liability. Actual decommissioning expenditures are charged to the liability to the extent of the then-recorded liability. Amounts capitalized to the related assets are amortized to income consistent with the depletion or depreciation of the underlying asset. Note 9 to Obsidian Energys audited consolidated financial statements details the impact of these accounting standards.
Office Lease Provision
The office lease liability is the net present value of future lease payments Obsidian Energy is obligated to make under non-cancellable lease contracts less recoveries under current sub-lease agreements. The liability is recognized on the balance sheet with the corresponding change charged to income. The recorded liability increases over time to its future amount through accretion charges to income. Revisions to the estimated amount or timing of the obligations are reflected prospectively as increases or decreases to the recorded liability. Actual lease payments less sub-lease recoveries are charged to the liability as the costs are incurred. Note 9 to Obsidian Energys audited consolidated financial statements details the impact of these accounting standards.
Financial Instruments
Financial instruments included in the balance sheets consist of accounts receivable, fair values of derivative financial instruments, current liabilities and long-term debt. Except for the senior notes, the fair values of these financial instruments approximate their carrying amounts due to the short-term maturity of the instruments, the mark-to-market values recorded for the financial instruments and the market rate of interest applicable to the bank debt. The estimated fair value of the senior notes is disclosed in Note 8 to the Companys audited consolidated financial statements.
Obsidian Energys revenues from the sale of crude oil, natural gas liquids and natural gas are directly impacted by changes to the underlying commodity prices. To ensure that funds flows from operations are sufficient to fund planned capital programs, financial instruments including swaps and collars may be utilized from time to time.
OBSIDIAN ENERGY 2017 | MANAGEMENTS DISCUSSION AND ANALYSIS 23 |
Substantially all of the Companys accounts receivable are with customers in the oil and natural gas industry and are subject to normal industry credit risk. Obsidian Energy may, from time to time, use various types of financial instruments to reduce its exposure to fluctuating oil and natural gas prices, electricity costs, exchange rates and interest rates. The use of these financial instruments exposes it to credit risks associated with the possible non-performance of counterparties to the derivative contracts. The Company limits this risk by executing counterparty risk procedures which include transacting only with financial institutions who are members of its credit facility or those with high credit ratings as well as obtaining security in certain circumstances.
Deferred Tax
Deferred taxes are recorded based on the liability method of accounting whereby temporary differences are calculated assuming financial assets and liabilities will be settled at their carrying amount. Deferred taxes are computed on temporary differences using substantively enacted income tax rates expected to apply when future income tax assets and liabilities are realized or settled.
Non-GAAP Measures
Certain financial measures including funds flow from operations, funds flow from operations per share-basic, funds flow from operations per share-diluted, netback, EBITDA, gross revenues and net debt included in this MD&A do not have a standardized meaning prescribed by IFRS and therefore are considered non-GAAP measures; accordingly, they may not be comparable to similar measures provided by other issuers. Funds flow from operations is cash flow from operating activities before changes in non-cash working capital, decommissioning expenditures and office lease settlements which also excludes the effects of financing related transactions from foreign exchange contracts and debt repayments/ pre-payments and is representative of cash related to continuing operations. Funds flow from operations is used to assess the Companys ability to fund its planned capital programs. See Calculation of Funds Flow from Operations above for a reconciliation of funds flow from operations to its nearest measure prescribed by IFRS. Netback is the per unit of production amount of revenue less royalties, operating expenses, transportation and realized risk management gains and losses, and is used in capital allocation decisions and to economically rank projects. See Results of Operations Netbacks above for a calculation of the Companys netbacks. EBITDA is cash flow from operations excluding the impact of changes in non-cash working capital, decommissioning expenditures, financing expenses, realized gains and losses on foreign exchange hedges on prepayments, realized foreign exchange gains and losses on debt prepayments and restructuring expenses. In addition, under the syndicated credit facility, realized foreign exchange gains or losses related to debt maturities are excluded from the calculation. EBITDA as defined by Obsidian Energys debt agreements excludes the EBITDA contribution from assets sold in the prior 12 months and is used within Obsidian Energys covenant calculations related to its syndicated bank facility and senior notes. Gross revenue is total revenues including realized risk management gains and losses on commodity contracts and is used to assess the cash realizations on commodity sales. Net debt includes long-term debt and includes the effects of working capital and all cash held on hand.
Oil and Gas Information
Barrels of oil equivalent (boe) may be misleading, particularly if used in isolation. A boe conversion ratio of six thousand cubic feet of natural gas to one barrel of crude oil is based on an energy equivalency conversion method primarily applicable at the burner tip and does not represent a value equivalency at the wellhead. Given that the value ratio based on the current price of crude oil as compared to natural gas is significantly different from the energy equivalency conversion ratio of 6:1, utilizing a conversion on a 6:1 basis is misleading as an indication of value.
Forward-Looking Statements
Certain statements contained in this document constitute forward-looking statements or information (collectively forward-looking statements). In particular, this document contains forward-looking statements pertaining to, without limitation, the following: that Obsidian Energy plans to continue to focus in 2018 on organic production growth and living within funds flow from operations with further development on its predictable, low decline asset base across its key areas including the Cardium, Peace River, Viking and
Deep Basin; the planned spending (including decommissioning), drilling, optimization of the Company; the belief that the Companys plans offer a predictable growth profile focused on creating liquids weighted,
OBSIDIAN ENERGY 2017 | MANAGEMENTS DISCUSSION AND ANALYSIS 24 |
sustainable value for all stakeholders; that the Company has an agreement in place to sell certain volumes at Ventura index pricing less the cost of transportation from AECO; that safety policies, procedures and programs developed by Obsidian Energy shall meet or exceed legislative requirements and all injuries and serious incidents are reported and investigated accordingly; that the Company is committed to minimizing the environmental impacts of its operations with its programs focusing on stakeholder communication, impact minimization, resource conservation and site abandonment and reclamation; that the Company will continue to target capital expenditures within funds flow from operations; that the Company has the operational flexibility and ready to drill inventory to deliver above five percent production growth by adjusting its second half program as commodity prices allow and the Company has protection from commodity price declines through its hedging program to support its development; that the Companys hedging program continues to help reduce the volatility of its funds flow from operations and thereby improve the Companys ability to align capital programs going forward; that the Company will continue to seek improvements in its G&A cost structure in 2018; our belief that compliance with environmental legislation could require additional expenditures and a failure to comply with such legislation may result in fines and penalties which could, in the aggregate and under certain assumptions, become material, our intent to reduce the environmental impact from our operations through environmental programs; that management contemplates both operating and financial risks and takes action as appropriate to limit the Companys exposure to certain risks and that management maintains close relationships with the Companys lenders and agents to monitor credit market developments, and these actions and plans aim to increase the likelihood of maintaining the Companys financial flexibility and capital program, supporting the Companys ability to capture opportunities in the market and execute longer-term business strategies. In addition, statements relating to reserves or resources are deemed to be forward-looking statements as they involve the implied assessment, based on certain estimates and assumptions, that the reserves and resources described exist in the quantities predicted or estimated and can be profitably produced in the future.
With respect to forward-looking statements contained in this document, the Company has made assumptions regarding, among other things: that the Company does not dispose of additional material producing properties or royalties or other interests therein; that the current commodity price and foreign exchange environment will continue or improve; future capital expenditure levels; future crude oil, natural gas liquids and natural gas prices and differentials between light, medium and heavy oil prices and Canadian, WTI and world oil and natural gas prices; future crude oil, natural gas liquids and natural gas production levels; future exchange rates and interest rates; future debt levels; and the continued suspension of our dividend.
Although the Company believes that the expectations reflected in the forward-looking statements contained in this document, and the assumptions on which such forward-looking statements are made, are reasonable, there can be no assurance that such expectations will prove to be correct. Readers are cautioned not to place undue reliance on forward-looking statements included in this document, as there can be no assurance that the plans, intentions or expectations upon which the forward-looking statements are based will occur. By their nature, forward-looking statements involve numerous assumptions, known and unknown risks and uncertainties that contribute to the possibility that the forward-looking statements contained herein will not be correct, which may cause our actual performance and financial results in future periods to differ materially from any estimates or projections of future performance or results expressed or implied by such forward-looking statements. These risks and uncertainties include, among other things: the possibility that the Company will not be able to continue to successfully execute our long-term plan in part or in full, and the possibility that some or all of the benefits that the Company anticipates will accrue to our Company and our security holders as a result of the successful execution of such plan do not materialize; the possibility that the Company is unable to execute some or all of our ongoing asset disposition program on favorable terms or at all; the possibility that we breach one or more of the financial covenants pursuant to our agreements with the syndicated banks and the holders of our senior notes; general economic and political conditions in Canada, the U.S. and globally, and in particular, the effect that those conditions have on commodity prices and our access to capital; industry conditions, including fluctuations in the price of crude oil, natural gas liquids and natural gas, price differentials for crude oil and natural gas produced in Canada as compared to other markets, and transportation restrictions, including pipeline and railway capacity constraints; fluctuations in foreign exchange or interest rates; unanticipated operating events or environmental events that can reduce production or cause production to be shut-in or delayed (including extreme cold during winter months, wild fires and flooding); and the other factors described under Risk Factors in our Annual Information Form and described in our public filings, available in Canada at www.sedar.com and in the United States at www.sec.gov. Readers are cautioned that this list of risk factors should not be construed as exhaustive.
OBSIDIAN ENERGY 2017 | MANAGEMENTS DISCUSSION AND ANALYSIS 25 |
The forward-looking statements contained in this document speak only as of the date of this document. Except as expressly required by applicable securities laws, the Company does not undertake any obligation to publicly update any forward-looking statements. The forward-looking statements contained in this document are expressly qualified by this cautionary statement.
Additional Information
Additional information relating to Obsidian Energy, including Obsidian Energys Annual Information Form, is available on the Companys website at www.obsidianenergy.com, on SEDAR at www.sedar.com and on EDGAR at www.sec.gov.
OBSIDIAN ENERGY 2017 | MANAGEMENTS DISCUSSION AND ANALYSIS 26 |
REPORT OF INDEPENDENT REGISTERED PUBLIC ACCOUNTING FIRM
To the Shareholders of Obsidian Energy Ltd.
Opinion on the Consolidated Financial Statements
We have audited the accompanying consolidated financial statements of Obsidian Energy Ltd. (the Company), which comprise the consolidated balance sheets as at December 31, 2017 and December 31, 2016, the consolidated statements of loss, changes in shareholders equity and cash flows for the years then ended, and the related notes, comprising a summary of significant accounting policies and other explanatory information (collectively referred to as the consolidated financial statements).
In our opinion, the consolidated financial statements present fairly, in all material respects, the consolidated financial position of the Company as at December 31, 2017 and December 31, 2016, and its consolidated financial performance and its consolidated cash flows for the years then ended in accordance with International Financial Reporting Standards (IFRSs) as issued by the International Accounting Standards Board.
Report on internal control over financial reporting
We also have audited, in accordance with the standards of the Public Company Accounting Oversight Board (United States) (PCAOB), the Companys internal control over financial reporting as of December 31, 2017, based on the criteria established in Internal Control Integrated Framework (2013) issued by the Committee of Sponsoring Organizations of the Treadway Commission (COSO), and our report dated March 6, 2018 expressed an unqualified opinion on the effectiveness of the Companys internal control over financial reporting.
Basis for Opinion
Managements Responsibility for the Consolidated Financial Statements
Management is responsible for the preparation and fair presentation of these consolidated financial statements in accordance with International Financial Reporting Standards (IFRSs) as issued by the International Accounting Standards Board, and for such internal control as management determines is necessary to enable the preparation of consolidated financial statements that are free from material misstatement, whether due to fraud or error.
Auditors Responsibility
Our responsibility is to express an opinion on these consolidated financial statements based on our audits. We conducted our audits in accordance with Canadian generally accepted auditing standards and the standards of the PCAOB. Those standards require that we plan and perform the audit to obtain reasonable assurance about whether the consolidated financial statements are free from material misstatement, whether due to error or fraud. Those standards also require that we comply with ethical requirements, including independence. We are required to be independent with respect to the Company in accordance with the ethical requirements that are relevant to our audit of the consolidated financial statements in Canada, the U.S. federal securities laws and the applicable rules and regulations of the Securities and Exchange Commission and the PCAOB. We are a public accounting firm registered with the PCAOB.
OBSIDIAN ENERGY 2017 | NOTES TO CONSOLIDATED FINANCIAL STATEMENTS 1 |
An audit includes performing procedures to assess the risks of material misstatements of the consolidated financial statements, whether due to error or fraud, and performing procedures to respond to those risks. Such procedures included obtaining and examining, on a test basis, audit evidence regarding the amounts and disclosures in the consolidated financial statements. The procedures selected depend on our judgment, including the assessment of the risks of material misstatement of the consolidated financial statements, whether due to fraud or error. In making those risk assessments, we consider internal control relevant to the Companys preparation and fair presentation of the consolidated financial statements in order to design audit procedures that are appropriate in the circumstances.
An audit also includes evaluating the appropriateness of accounting policies and principles used and the reasonableness of accounting estimates made by management, as well as evaluating the overall presentation of the consolidated financial statements.
We believe that the audit evidence we have obtained in our audits is sufficient and appropriate to provide a reasonable basis for our audit opinion.
We have served as the Companys auditor since 2015.
signed Ernst & Young LLP
Chartered Professional Accountants
Calgary, Canada
March 6, 2018
OBSIDIAN ENERGY 2017 | NOTES TO CONSOLIDATED FINANCIAL STATEMENTS 2 |
REPORT OF INDEPENDENT REGISTERED PUBLIC ACCOUNTING FIRM
To the Shareholders of Obsidian Energy Ltd.
Opinion on Internal Control over Financial Reporting
We have audited Obsidian Energy Ltd.s internal control over financial reporting as of December 31, 2017, based on criteria established in Internal ControlIntegrated Framework (2013) issued by the Committee of Sponsoring Organizations of the Treadway Commission (the COSO criteria). In our opinion, Obsidian Energy Ltd.s (the Company) maintained, in all material respects, effective internal control over financial reporting as of December 31, 2017, based on the COSO criteria.
We also have audited, in accordance with Canadian generally accepted auditing standards and the standards of the Public Company Accounting Oversight Board (United States) (PCAOB), the consolidated balance sheets as at December 31, 2017 and 2016, the consolidated statements of loss, changes in shareholders equity and cash flows for the years then ended, and the related notes, comprising a summary of significant accounting policies and other explanatory information and our report dated March 6, 2018 expressed an unqualified opinion thereon.
Basis of Opinion
The Companys management is responsible for maintaining effective internal control over financial reporting and for its assessment of the effectiveness of internal control over financial reporting included in the accompanying Managements Report on Internal Controls over Financial Reporting. Our responsibility is to express an opinion on the Companys internal control over financial reporting based on our audit. We are a public accounting firm registered with the PCAOB and are required to be independent with respect to the Company in accordance with the ethical requirements that are relevant to our audit of the consolidated financial statements in Canada, the U.S. federal securities laws and the applicable rules and regulations of the Securities and Exchange Commission and the PCAOB.
We conducted our audit in accordance with the standards of the PCAOB. Those standards require that we plan and perform the audit to obtain reasonable assurance about whether effective internal control over financial reporting was maintained in all material respects. Our audit included obtaining an understanding of internal control over financial reporting, assessing the risk that a material weakness exists, testing and evaluating the design and operating effectiveness of internal control based on the assessed risk, and performing such other procedures as we considered necessary in the circumstances. We believe that our audit provides a reasonable basis for our opinion.
Definition and Limitations of Internal Control Over Financial Reporting
A companys internal control over financial reporting is a process designed to provide reasonable assurance regarding the reliability of financial reporting and the preparation of financial statements for external purposes in accordance with International Financial Reporting Standards as issued by the International Accounting Standards Board. A companys internal control over financial reporting includes those policies and procedures that (1) pertain to the maintenance of records that, in reasonable detail, accurately and fairly reflect the transactions and dispositions of the assets of the company; (2) provide reasonable assurance that transactions are recorded as necessary to permit preparation of financial statements in accordance with International Financial Reporting Standards as issued by the International Accounting Standards Board, and that receipts and expenditures of the company are being made only in accordance with authorizations of management and directors of the company; and (3) provide reasonable assurance regarding prevention or timely detection of unauthorized acquisition, use, or disposition of the companys assets that could have a material effect on the financial statements.
Because of its inherent limitations, internal control over financial reporting may not prevent or detect misstatements. Also, projections of any evaluation of effectiveness to future periods are subject to the risk that controls may become inadequate because of changes in conditions, or that the degree of compliance with the policies or procedures may deteriorate.
OBSIDIAN ENERGY 2017 | NOTES TO CONSOLIDATED FINANCIAL STATEMENTS 3 |
signed Ernst & Young LLP
Chartered Professional Accountants
Calgary, Canada
March 6, 2018
OBSIDIAN ENERGY 2017 | NOTES TO CONSOLIDATED FINANCIAL STATEMENTS 4 |
Obsidian Energy Ltd.
Consolidated Balance Sheets
As at December 31 | ||||||||||||
(CAD millions) |
Note | 2017 | 2016 | |||||||||
Assets |
||||||||||||
Current |
||||||||||||
Cash |
$ | 2 | $ | 11 | ||||||||
Accounts receivable |
4 | 105 | 113 | |||||||||
Other |
18 | 18 | ||||||||||
Deferred funding asset |
5 | 18 | 77 | |||||||||
Risk management |
10 | 11 | 8 | |||||||||
Assets held for sale |
6 | 35 | 114 | |||||||||
|
|
|
|
|||||||||
189 | 341 | |||||||||||
|
|
|
|
|||||||||
Non-current |
||||||||||||
Deferred funding asset |
5 | | 16 | |||||||||
Property, plant and equipment |
7 | 2,819 | 2,982 | |||||||||
|
|
|
|
|||||||||
2,819 | 2,998 | |||||||||||
|
|
|
|
|||||||||
Total assets |
$ | 3,008 | $ | 3,339 | ||||||||
|
|
|
|
|||||||||
Liabilities and Shareholders Equity |
||||||||||||
Current |
||||||||||||
Accounts payable and accrued liabilities |
$ | 149 | $ | 175 | ||||||||
Current portion of long-term debt |
8 | 31 | 27 | |||||||||
Current portion of provisions |
9 | 27 | 35 | |||||||||
Risk management |
10 | 55 | 26 | |||||||||
Liabilities related to assets held for sale |
6 | 24 | 81 | |||||||||
|
|
|
|
|||||||||
286 | 344 | |||||||||||
|
|
|
|
|||||||||
Non-current |
||||||||||||
Long-term debt |
8 | 328 | 442 | |||||||||
Provisions |
9 | 221 | 264 | |||||||||
Risk management |
10 | 6 | 25 | |||||||||
Deferred tax liability |
11 | | 14 | |||||||||
Other non-current liabilities |
13 | 1 | 3 | |||||||||
|
|
|
|
|||||||||
842 | 1,092 | |||||||||||
|
|
|
|
|||||||||
Shareholders equity |
||||||||||||
Shareholders capital |
12 | 2,181 | 8,997 | |||||||||
Other reserves |
12 | 96 | 97 | |||||||||
Deficit |
(111 | ) | (6,847 | ) | ||||||||
|
|
|
|
|||||||||
2,166 | 2,247 | |||||||||||
|
|
|
|
|||||||||
Total liabilities and shareholders equity |
$ | 3,008 | $ | 3,339 | ||||||||
|
|
|
|
Subsequent events (Note 6 and 10)
Commitments and contingencies (Note 17)
See accompanying notes to the consolidated financial statements.
Approved on behalf of the Board of Directors of Obsidian Energy Ltd.:
signed | signed | |
Jay W. Thornton | Raymond D. Crossley | |
Chairman | Director |
OBSIDIAN ENERGY 2017 | ANNUAL CONSOLIDATED FINANCIAL STATEMENTS 5 |
Obsidian Energy Ltd.
Consolidated Statements of Loss
Year ended December 31 | ||||||||||||
(CAD millions, except per share amounts) |
Note | 2017 | 2016 | |||||||||
Oil and natural gas sales and other income |
$ | 437 | $ | 608 | ||||||||
Royalties |
(30 | ) | (22 | ) | ||||||||
|
|
|
|
|||||||||
407 | 586 | |||||||||||
Risk management gain (loss) |
10 | 24 | (11 | ) | ||||||||
|
|
|
|
|||||||||
431 | 575 | |||||||||||
|
|
|
|
|||||||||
Expenses |
||||||||||||
Operating |
19 | 176 | 281 | |||||||||
Transportation |
29 | 35 | ||||||||||
General and administrative |
19 | 31 | 56 | |||||||||
Restructuring |
10 | 135 | ||||||||||
Share-based compensation |
13 | 8 | 12 | |||||||||
Depletion, depreciation, impairment and accretion |
7,9 | 323 | 680 | |||||||||
Gain on dispositions |
7 | (74 | ) | (33 | ) | |||||||
Provisions |
9 | (8 | ) | 3 | ||||||||
Foreign exchange gain |
8 | (5 | ) | (84 | ) | |||||||
Financing |
8 | 23 | 114 | |||||||||
Other |
17 | 15 | | |||||||||
Exploration and evaluation |
| 242 | ||||||||||
Deferred funding asset |
5 | | 82 | |||||||||
|
|
|
|
|||||||||
528 | 1,523 | |||||||||||
|
|
|
|
|||||||||
Loss before taxes |
(97 | ) | (948 | ) | ||||||||
|
|
|
|
|||||||||
Deferred tax recovery |
11 | 13 | 252 | |||||||||
|
|
|
|
|||||||||
Net and comprehensive loss |
$ | (84 | ) | $ | (696 | ) | ||||||
|
|
|
|
|||||||||
Net loss per share |
||||||||||||
Basic |
14 | $ | (0.17 | ) | $ | (1.39 | ) | |||||
Diluted |
14 | $ | (0.17 | ) | $ | (1.39 | ) | |||||
Weighted average shares outstanding (millions) |
|
|||||||||||
Basic |
14 | 503.9 | 502.3 | |||||||||
Diluted |
14 | 503.9 | 502.3 |
See accompanying notes to the consolidated financial statements.
OBSIDIAN ENERGY 2017 | ANNUAL CONSOLIDATED FINANCIAL STATEMENTS 6 |
Obsidian Energy Ltd.
Consolidated Statements of Cash Flows
Year ended December 31 | ||||||||||||
(CAD millions) |
Note | 2017 | 2016 | |||||||||
Operating activities |
||||||||||||
Net loss |
$ | (84 | ) | $ | (696 | ) | ||||||
Depletion, depreciation, impairment and accretion |
7,9 | 323 | 680 | |||||||||
Gain on dispositions |
7 | (74 | ) | (42 | ) | |||||||
Provisions |
9 | (8 | ) | 3 | ||||||||
Deferred tax recovery |
11 | (13 | ) | (252 | ) | |||||||
Share-based compensation |
13 | 8 | 7 | |||||||||
Restructuring |
| 116 | ||||||||||
Other |
4 | | ||||||||||
Unrealized risk management loss |
10 | 7 | 147 | |||||||||
Unrealized foreign exchange gain |
8 | (11 | ) | (312 | ) | |||||||
Exploration and evaluation |
| 242 | ||||||||||
Deferred funding asset |
5 | | 82 | |||||||||
Decommissioning expenditures |
9 | (16 | ) | (11 | ) | |||||||
Office lease settlements |
9 | (16 | ) | (4 | ) | |||||||
Change in non-cash working capital |
15 | 5 | (97 | ) | ||||||||
|
|
|
|
|||||||||
125 | (137 | ) | ||||||||||
|
|
|
|
|||||||||
Investing activities |
||||||||||||
Capital expenditures |
(141 | ) | (82 | ) | ||||||||
Property dispositions (acquisitions), net |
110 | 1,415 | ||||||||||
Change in non-cash working capital |
15 | (3 | ) | (23 | ) | |||||||
|
|
|
|
|||||||||
(34 | ) | 1,310 | ||||||||||
|
|
|
|
|||||||||
Financing activities |
||||||||||||
Decrease in long-term debt |
8 | (76 | ) | (133 | ) | |||||||
Repayments of senior notes |
8 | (26 | ) | (1,260 | ) | |||||||
Issue of equity compensation plans |
12 | (4 | ) | 1 | ||||||||
Realized foreign exchange loss on repayments |
8 | 6 | 228 | |||||||||
|
|
|
|
|||||||||
(100 | ) | (1,164 | ) | |||||||||
|
|
|
|
|||||||||
Change in cash |
(9 | ) | 9 | |||||||||
Cash, beginning of year |
11 | 2 | ||||||||||
|
|
|
|
|||||||||
Cash, end of year |
$ | 2 | $ | 11 | ||||||||
|
|
|
|
See accompanying notes to the consolidated financial statements.
OBSIDIAN ENERGY 2017 | ANNUAL CONSOLIDATED FINANCIAL STATEMENTS 7 |
Obsidian Energy Ltd.
Statements of Changes in Shareholders Equity
Note | Shareholders Capital |
Other Reserves |
Deficit | Total | ||||||||||||||||
Balance at January 1, 2017 |
$ | 8,997 | $ | 97 | $ | (6,847 | ) | $ | 2,247 | |||||||||||
Net and comprehensive loss |
| | (84 | ) | (84 | ) | ||||||||||||||
Share-based compensation |
13 | | 8 | | 8 | |||||||||||||||
Issued on exercise of options |
12 | 4 | (9 | ) | | (5 | ) | |||||||||||||
Elimination of deficit |
12 | (6,820 | ) | | 6,820 | | ||||||||||||||
|
|
|
|
|
|
|
|
|||||||||||||
Balance at December 31, 2017 |
$ | 2,181 | $ | 96 | $ | (111 | ) | $ | 2,166 | |||||||||||
|
|
|
|
|
|
|
|
Note | Shareholders Capital |
Other Reserves |
Deficit | Total | ||||||||||||||||
Balance at January 1, 2016 |
$ | 8,994 | $ | 92 | $ | (6,151 | ) | $ | 2,935 | |||||||||||
Net and comprehensive loss |
| | (696 | ) | (696 | ) | ||||||||||||||
Share-based compensation |
13 | | 7 | | 7 | |||||||||||||||
Issued on exercise of options |
12 | 3 | (2 | ) | | 1 | ||||||||||||||
|
|
|
|
|
|
|
|
|||||||||||||
Balance at December 31, 2016 |
$ | 8,997 | $ | 97 | $ | (6,847 | ) | $ | 2,247 | |||||||||||
|
|
|
|
|
|
|
|
See accompanying notes to the consolidated financial statements.
OBSIDIAN ENERGY 2017 | ANNUAL CONSOLIDATED FINANCIAL STATEMENTS 8 |
Notes to the Consolidated Financial Statements
(All tabular amounts are in CAD millions except numbers of common shares, per share amounts, percentages and various figures in Note 10)
1. Structure of Obsidian Energy
Obsidian Energy Ltd. (Obsidian Energy or the Company) is an exploration and production company and is governed by the laws of the Province of Alberta, Canada. The Company operates in one segment, to explore for, develop and hold interests in oil and natural gas properties and related production infrastructure in the Western Canada Sedimentary Basin directly and through investments in securities of subsidiaries holding such interests. Obsidian Energys portfolio of assets is managed at an enterprise level, rather than by separate operating segments or business units. The Company assesses its financial performance at the enterprise level and resource allocation decisions are made on a project basis across its portfolio of assets, without regard to the geographic location of projects. Obsidian Energy owns the petroleum and natural gas assets or 100 percent of the equity, directly or indirectly, of the entities that carry on the remainder of the oil and natural gas business of Obsidian Energy, except for an unincorporated joint arrangement (the Peace River Oil Partnership) in which Obsidian Energys wholly owned subsidiaries hold a 55 percent interest.
Name change
Effective June 26, 2017, the Company obtained shareholder approval to change its name from Penn West Petroleum Ltd. to Obsidian Energy Ltd.
2. Basis of presentation and statement of compliance
a) Statement of Compliance
These annual consolidated financial statements are prepared in compliance with International Financial Reporting Standards (IFRS) as issued by the International Accounting Standards Board.
The annual consolidated financial statements have been prepared on a historical cost basis, except risk management assets and liabilities which are recorded at fair value as discussed in Note 10.
The annual consolidated financial statements of the Company for the year ended December 31, 2017 were approved for issuance by the Board of Directors on March 6, 2018.
b) Basis of Presentation
The annual consolidated financial statements include the accounts of Obsidian Energy, its wholly owned subsidiaries and its proportionate interest in partnerships. Results from acquired properties are included in Obsidian Energys reported results subsequent to the closing date and results from properties sold are included until the closing date.
All intercompany balances, transactions, income and expenses are eliminated on consolidation.
Certain comparative figures have been reclassified to correspond with current period presentation.
OBSIDIAN ENERGY 2017 | NOTES TO CONSOLIDATED FINANCIAL STATEMENTS 9 |
3. Significant accounting policies
a) Critical accounting judgments and key estimates
The preparation of the consolidated financial statements in conformity with IFRS requires management to make estimates and assumptions that affect the recorded amounts of assets and liabilities, disclosure of any contingent assets and liabilities at the date of the financial statements and the reported amounts of revenues and expenses for the period. These and other estimates are subject to measurement uncertainty and the effect on the consolidated financial statements of changes in these estimates could be material.
Management also makes judgments while applying accounting policies that could affect amounts recorded in its consolidated financial statements. Significant judgments include the identification of cash generating units (CGUs) for impairment testing purposes and determining whether a CGU has an impairment indicator.
The following are the estimates that management has made in applying the Companys accounting policies that have the most significant effect on the amounts recognized in the consolidated financial statements.
i) Reserve estimates
Commercial petroleum reserves are determined based on estimates of petroleum-in-place, recovery factors and future oil and natural gas prices and costs. Obsidian Energy engages an independent qualified reserve evaluator to evaluate all of the Companys oil and natural gas reserves at each year-end.
Reserve adjustments are made annually based on actual oil and natural gas volumes produced, the results from capital programs, revisions to previous estimates, new discoveries and acquisitions and dispositions made during the year and the effect of changes in forecast future crude oil and natural gas prices. There are a number of estimates and assumptions that affect the process of evaluating reserves.
Proved reserves are the estimated quantities of crude oil, natural gas and natural gas liquids determined to be economically recoverable under existing economic and operating conditions with a high degree of certainty (at least 90 percent) those quantities will be exceeded. Proved plus probable reserves are the estimated quantities of crude oil, natural gas and natural gas liquids determined to be economically recoverable under existing economic and operating conditions with a 50 percent certainty those quantities will or will not be exceeded. Obsidian Energy reports production and reserve quantities in accordance with Canadian practices and specifically in accordance with Standards of Disclosure for Oil and Gas Activities (NI 51-101).
The estimate of proved plus probable reserves is an essential part of the depletion calculation, the impairment test and hence the recorded amount of oil and gas assets.
Contingent Resources are defined in the COGE Handbook as those quantities of petroleum estimated to be potentially recoverable from known accumulations using established technology or technology under development, but which do not currently qualify as Reserves or commercially recoverable due to one or more contingencies. Contingencies may include factors such as economic, legal, environmental, operational, political and regulatory matters or a lack of markets. The estimate of contingent resources may be included as part of the recoverable amount in the impairment test.
Obsidian Energy cautions users of this information that the process of estimating crude oil and natural gas reserves is subject to a level of uncertainty. The reserves are based on current and forecast economic and operating conditions; therefore, changes can be made to future assessments as a result of a number of factors, which can include commodity prices, new technology, changing economic conditions, future reservoir performance and forecast development activity.
OBSIDIAN ENERGY 2017 | NOTES TO CONSOLIDATED FINANCIAL STATEMENTS 10 |
ii) Recoverability of asset carrying values
Obsidian Energy assesses its property, plant and equipment (PP&E) for impairment by comparing the carrying amount to the recoverable amount of the underlying assets. The determination of the recoverable amount involves estimating the higher of an assets fair value less costs to sell or its value-in-use, the latter of which is based on its discounted future cash flows using an applicable discount rate. Future cash flows are calculated based on estimates of future commodity prices and inflation and are discounted based on managements current assessment of market conditions.
iii) Decommissioning liability
Obsidian Energy recognizes a provision for future abandonment activities in the consolidated financial statements at the net present value of the estimated future expenditures required to settle the estimated obligation at the balance sheet date. The measurement of the decommissioning liability involves the use of estimates and assumptions including the discount rate, the amount and expected timing of future abandonment costs and the inflation rate related thereto. The estimates were made by management and external consultants considering current costs, technology and enacted legislation.
iv) Office lease liability
Obsidian Energy recognizes a provision for certain onerous office lease commitments in the consolidated financial statements at the net present value of future lease payments the Company is obligated to make under non-cancellable lease contracts less recoveries under current sub-lease agreements. The measurement of the office lease liability involves the use assumptions including the discount rate, actual settlement amounts and estimates of future recoveries. Actual costs and cash outflows may differ from the estimates as a result of the changes in the noted assumptions.
v) Fair value calculation on share-based payments
The fair value of share-based payments is calculated using a Black-Scholes model. There are a number of estimates used in the calculation such as the expected future forfeiture rate, the expected period the share-based compensation is outstanding and the future price volatility of the underlying security all of which can vary from expectations. The factors applied in the calculation are managements estimates based on historical information and future forecasts.
vi) Fair value of risk management contracts
Obsidian Energy records risk management contracts at fair value with changes in fair value recognized in income. The fair values are determined using external counterparty information which is compared to observable market data.
vii) Taxation
The calculation of deferred income taxes is based on a number of assumptions including estimating the future periods in which temporary differences and other tax credits will reverse and the general assumption that substantively enacted future tax rates at the balance sheet date will be in effect when differences reverse.
OBSIDIAN ENERGY 2017 | NOTES TO CONSOLIDATED FINANCIAL STATEMENTS 11 |
viii) Litigation
Obsidian Energy records provisions related to legal matters if it is probable that the Company will not be successful in defending the claim and if an amount can be reasonably estimated. Determining the probability of a claim being defended is subject to considerable judgment. Additionally, the potential claim is generally a wide range of figures and a single estimate must be made when recording a provision. Contingencies will only be resolved or unfounded when one or more future events occur. The assessment of contingencies involves significant judgment and estimates of the potential outcome of future events.
b) Business combinations
Obsidian Energy uses the acquisition method to account for business combinations. The net identifiable assets and liabilities acquired in transactions are generally measured at their fair value on the acquisition date. The acquisition date is the closing date of the business combination. Acquisition costs incurred by Obsidian Energy to complete a business combination are expensed in the period incurred except for costs related to the issue of any debt or equity securities, which are recognized based on the nature of the related financing instrument.
Revisions may be made to the initial recognized amounts determined during the measurement period, which shall not exceed one year after the close date of the acquisition.
c) Revenue
Obsidian Energy generally recognizes oil and natural gas revenue when title passes from Obsidian Energy to the purchaser or, in the case of services, as contracted services are performed.
Revenue is measured at the fair value of the consideration received or receivable. Revenue from the sale of crude oil, natural gas and natural gas liquids (prior to deduction of transportation costs) is recognized when all the following conditions have been satisfied:
| The significant risks and rewards of ownership of the goods have been transferred to the buyer; |
| There is no continuing managerial involvement to the degree usually associated with ownership or effective control over the goods sold; |
| The amount of revenue can be reliably measured; |
| It is probable that the economic benefits associated with the transaction will flow to Obsidian Energy; and |
| The costs incurred or to be incurred in respect of the transaction can be reliably measured. |
d) Joint arrangements
The consolidated financial statements include Obsidian Energys proportionate interest of jointly controlled assets and liabilities and its proportionate interest of the revenue, royalties and operating expenses. A significant portion of Obsidian Energys exploration and development activities are conducted jointly with others and involve joint operations. Under such arrangements, Obsidian Energy has the exclusive rights to its proportionate interest in the assets and the economic benefits generated from its share of the assets. Income from the sale or use of Obsidian Energys interest in joint operations and its share of expenses is recognized when it is probable that the economic benefits associated with the transactions will flow to/from Obsidian Energy and the amounts can be reliably measured.
The Peace River Oil Partnership is a joint operation and Obsidian Energy records its 55 percent interest of revenues, expenses, assets and liabilities.
OBSIDIAN ENERGY 2017 | NOTES TO CONSOLIDATED FINANCIAL STATEMENTS 12 |
e) Transportation expense
Transportation costs are paid by Obsidian Energy for the shipping of natural gas, crude oil and natural gas liquids from the wellhead to the point of title transfer to buyers. These costs are recognized as services are received.
f) Foreign currency translation
Obsidian Energy and each of its subsidiaries use the Canadian dollar as their functional currency. Monetary items, such as accounts receivable and long-term debt, are translated to Canadian dollars at the rate of exchange in effect at the balance sheet date. Non-monetary items, such as PP&E, are translated to Canadian dollars at the rate of exchange in effect when the associated transactions occurred. Revenues and expenses denominated in foreign currencies are translated at the exchange rate on the date of the transaction. Foreign exchange gains or losses on translation are included in income.
g) PP&E
i) Measurement and recognition
Oil & Gas properties are included in PP&E at cost, less accumulated depletion and depreciation and any impairment losses. The cost of PP&E includes costs incurred initially to acquire or construct the item and betterment costs.
Capital expenditures are recognized as PP&E when it is probable that future economic benefits associated with the investment will flow to Obsidian Energy and the cost can be reliably measured. PP&E includes capital expenditures incurred in the development phases, acquisition and disposition of PP&E and additions to the decommissioning liability.
ii) Depletion and Depreciation
Except for components with a useful life shorter than the reserve life of the associated property, resource properties are depleted using the unit-of-production method based on production volumes before royalties in relation to total proved plus probable reserves. Natural gas volumes are converted to equivalent oil volumes based upon the relative energy content of six thousand cubic feet of natural gas to one barrel of oil. In determining its depletion base, Obsidian Energy includes estimated future costs to develop proved plus probable reserves and excludes estimated equipment salvage values. Changes to reserve estimates are included in the depletion calculation prospectively.
Components of PP&E that are not depleted using the unit-of-production method are depreciated on a straight-line basis over their useful life. The turnaround component has an estimated useful life of three to five years and the corporate asset component has an estimated useful life of 10 years.
iii) Derecognition
The carrying amount of an item of PP&E is derecognized when no future economic benefits are expected from its use or upon sale to a third party. The gain or loss arising from derecognition is included in income and is measured as the difference between the net proceeds, if any, and the carrying amount of the asset.
OBSIDIAN ENERGY 2017 | NOTES TO CONSOLIDATED FINANCIAL STATEMENTS 13 |
iv) Major maintenance and repairs
Ongoing costs to maintain properties are generally expensed as incurred. These costs include the cost of labour, consumables and small parts. The costs of material replacement parts, turnarounds and major inspections are capitalized provided it is probable that future economic benefits in excess of cost will be realized and such benefits are expected to extend beyond the current operating period. The carrying amount of a replaced part is derecognized in accordance with Obsidian Energys derecognition policies.
v) Impairment of oil and natural gas properties
Obsidian Energy reviews oil and gas properties for circumstances that indicate its assets may be impaired at the end of each reporting period. These indicators can be internal (i.e. reserve changes) or external (i.e. market conditions) in nature. If an indication of impairment exists, Obsidian Energy completes an impairment test, which compares the estimated recoverable amount to the carrying value. The estimated recoverable amount is defined under IAS 36 (Impairment of Assets) as the higher of an assets or CGUs fair value less costs to sell and its value-in-use.
Where the recoverable amount is less than the carrying amount, the CGU is considered to be impaired. Impairment losses identified for a CGU are allocated on a pro rata basis to the asset categories within the CGU. The impairment loss is recognized as an expense in income.
Value-in-use is computed as the present value of future cash flows expected to be derived from production. Present values are calculated using a pre-tax discount rate that reflects current market assessments of the time value of money and the risks specific to the asset. Under the fair value less cost to sell method the recoverable amount is determined using various factors, which can include external factors such as observable market conditions and comparable transactions and internal factors such as discounted cash flows related to reserve and resource studies and future development plans.
Impairment losses related to PP&E can be reversed in future periods if the estimated recoverable amount of the asset exceeds the carrying value. The impairment recovery is limited to a maximum of the estimated depleted historical cost if the impairment had not been recognized. The reversal of the impairment loss is recognized in depletion, depreciation and impairment.
vi) Other Property, Plant and Equipment
Obsidian Energys corporate assets include computer hardware and software, office furniture, buildings and leasehold improvements and are depreciated on a straight-line basis over their useful lives. Corporate assets are tested for impairment separately from oil and gas assets.
h) Share-based payments
The fair value of units granted under the Restricted and Performance Share Unit Plan (RPSU) following the equity method are recognized as compensation expense with a corresponding increase to other reserves in shareholders equity over the term of the units based on a graded vesting schedule. Obsidian Energy measures the fair value of units granted under this plan at the grant date using the share price from the Toronto Stock Exchange (TSX). The fair value is based on market prices and considers the terms and conditions of the units granted.
The fair value of options granted under the Stock Option Plan (the Option Plan) are recognized as compensation expense with a corresponding increase to other reserves in shareholders equity over the term of the options based on a graded vesting schedule. Obsidian Energy measures the fair value of options granted under these plans at the grant date using the Black-Scholes option-pricing model. The fair value is based on market prices and considers the terms and conditions of the share options granted.
OBSIDIAN ENERGY 2017 | NOTES TO CONSOLIDATED FINANCIAL STATEMENTS 14 |
The fair value of awards granted under the Deferred Share Unit Plan (DSU), Performance Share Unit Plan (PSU) and the RPSU Plan following the liability method are based on a fair value calculation on each reporting date using the awards outstanding and Obsidian Energys share price from the TSX on each balance sheet date. The fair value of the awards is expensed over the vesting period based on a graded vesting schedule. Subsequent increases and decreases in the underlying share price result in increases and decreases, respectively, to the accrued obligation until the related instruments are settled.
i) Provisions
i) General
Provisions are recognized based on an estimate of expenditures required to settle present obligations at the end of the reporting period. The provision is risk adjusted to take into account any uncertainties. When the effect of the time value of money is material, the amount of a provision is calculated as the present value of the future expenditures required to settle the obligations. The discount rate reflects the current assessment of the time value of money and risks specific to the liability when those risks have not already been reflected as an adjustment to future cash flows.
ii) Decommissioning liability
The decommissioning liability is the present value of Obsidian Energys future costs of obligations for property, facility and pipeline abandonment and site restoration. The liability is recognized on the balance sheet with a corresponding increase to the carrying amount of the related asset. The recorded liability increases over time to its future amount through accretion charges to income. Revisions to the estimated amount or timing of the obligations are reflected prospectively as increases or decreases to the recorded liability and the related asset. Actual decommissioning expenditures, up to the recorded liability at the time, are charged to the liability as the costs are incurred. Amounts capitalized to the related assets are amortized to income consistent with the depletion or depreciation of the underlying asset.
iii) Office lease liability
The office lease liability is the net present value of future lease payments Obsidian Energy is obligated to make under non-cancellable lease contracts less recoveries under current sub-lease agreements. The liability is recognized on the balance sheet with the corresponding change charged to income. The recorded liability increases over time to its future amount through accretion charges to income. Revisions to the estimated amount or timing of the obligations are reflected prospectively as increases or decreases to the recorded liability. Actual lease payments less sub-lease recoveries are charged to the liability as the costs are incurred.
j) Leases
A lease is classified as an operating lease if it does not transfer substantially all of the risks and rewards incidental to ownership of the related asset to the lessee. Operating lease payments are expensed on a straight-line basis over the life of the lease.
k) Share capital
Common shares are classified as equity. Share issue costs are recorded in shareholders equity, net of applicable taxes. Dividends are paid at the discretion of the Board of Directors and are deducted from retained earnings.
If issued, preferred shares would be classified as equity and could be issued in one or more series.
OBSIDIAN ENERGY 2017 | NOTES TO CONSOLIDATED FINANCIAL STATEMENTS 15 |
l) Earnings per share
Earnings per share is calculated by dividing net income or loss attributable to the shareholders by the weighted average number of common shares outstanding during the period. Obsidian Energy computes the dilutive impact of equity instruments other than common shares assuming the proceeds received from the exercise of in-the-money share options are used to purchase common shares at average market prices.
m) Taxation
Income taxes are based on taxable income in a taxation year. Taxable income normally differs from income reported in the consolidated statement of income as it excludes items of income or expense that are taxable or deductible in other years or are not taxable or deductible for income tax purposes.
Obsidian Energy uses the liability method of accounting for deferred income taxes. Temporary differences are calculated assuming that the financial assets and liabilities will be settled at their carrying amount. Deferred income taxes are computed on temporary differences using substantively enacted income tax rates expected to apply when deferred income tax assets and liabilities are realized or settled.
A deferred income tax asset is recognized to the extent that it is probable that future taxable income will be available against which the deductible temporary differences can be utilized. Deferred income tax assets are reviewed at each reporting date and are not recognized until such time that it is more likely than not that the related tax benefit will be realized.
n) Financial instruments
Financial instruments are measured at fair value and recorded on the balance sheet upon initial recognition of an instrument. Subsequent measurement and changes in fair value will depend on initial classification, as follows:
| Fair value through profit or loss financial assets and liabilities and derivative instruments classified as held for trading or designated as fair value through profit or loss are measured at fair value and subsequent changes in fair value are recognized in income; |
| Loans and receivables are non-derivative financial assets with fixed or determinable payments that are not quoted in an active market are initially measured at fair value with subsequent changes at amortized cost; |
| Available-for-sale financial instruments are measured at fair value with changes in fair value recorded in equity until the instrument or a portion thereof is derecognized or impaired at which time the amounts would be recognized in income; |
| Held to maturity financial assets and loans and receivables are initially measured at fair value with subsequent measurement at amortized cost using the effective interest method. The effective interest method calculates the amortized cost of a financial asset and allocates interest income or expense over the applicable period. The rate used discounts the estimated future cash flows over either the expected life of the financial asset or liability or a shorter time-frame if it is deemed appropriate; and |
| Other financial liabilities are initially measured at fair value with subsequent changes to fair value measured at amortized cost. |
OBSIDIAN ENERGY 2017 | NOTES TO CONSOLIDATED FINANCIAL STATEMENTS 16 |
Obsidian Energys current classifications are as follows:
| Cash and cash equivalents and accounts receivable are designated as loans and receivables; |
| Accounts payable and accrued liabilities and long-term debt are designated as other financial liabilities; and |
| Risk management contracts are derivative financial instruments measured at fair value through profit or loss. |
Obsidian Energy assesses each financial instrument, except those valued at fair value through profit or loss, for impairment at the reporting date and records the gain or loss in income during the period.
o) Embedded derivatives
An embedded derivative is a component of a contract that affects the terms of another factor, for example, rent costs that fluctuate with oil prices. These hybrid contracts are considered to consist of a host contract plus an embedded derivative. The embedded derivative is separated from the host contract and accounted for as a derivative if the following conditions are met:
| The economic characteristics and risks of the embedded derivative are not closely related to the economic characteristics and risks of the host contract; |
| The embedded item, itself, meets the definition of a derivative; and |
| The hybrid contract is not measured at fair value or designated as held for trading. |
p) Classification of debt or equity
Obsidian Energy classifies financial liabilities and equity instruments in accordance with the substance of the contractual arrangement and the definitions of a financial liability or an equity instrument.
Obsidian Energys debt instruments currently have requirements to deliver cash at the end of the term thus are classified as liabilities.
q) Future accounting pronouncements
The IASB issued IFRS 15 Revenue from Contracts with Customers which replaces IAS 18 Revenue. IFRS 15 specifies revenue recognition criteria and expanded disclosures for revenue. The new standard is effective for annual periods beginning on or after January 1, 2018. The Company has completed its assessment of the standard and adopted the standard retrospectively on January 1, 2018. The Company has also concluded that the adoption of IFRS 15 will not have a material impact on its financial statements. Obsidian Energy will expand its disclosures in the notes to the financial statements as outlined in IFRS 15.
The IASB completed the final sections of IFRS 9 Financial Instruments which replaces IAS 39 Financial Statement: Recognition and Measurement. IFRS 9 provides guidance on the recognition and measurement, impairment and derecognition on financial instruments. The new standard is effective for annual periods beginning on or after January 1, 2018. The Company has concluded that the adoption of IFRS 9 will not result in any material changes in the measurement and carrying value of the Companys financial instruments.
The IASB issued IFRS 16 Leases in January 2016 which replaces IAS 17 Leases. IFRS 16 outlines several new requirements in regards to the recognition, measurement and disclosure of leases. A key principle within the standard includes a single lessee accounting model which requires lessees to recognise assets and liabilities for all leases which have a term more than 12 months. The accounting for lessors, which classify leases as either operating or finance, remains substantially unchanged from the previous standard. The new standard is effective for annual reporting periods beginning on or after January 1, 2019. Obsidian Energy is currently assessing the impact of the standard.
OBSIDIAN ENERGY 2017 | NOTES TO CONSOLIDATED FINANCIAL STATEMENTS 17 |
4. Working capital
Accounts receivable
Obsidian Energy continuously monitors credit risk and maintains credit policies to ensure collection risk is limited. Receivables are primarily with customers in the oil and gas industry and are subject to normal industry credit risk. Receivables over 90 days are classified as past due and are assessed for collectability. If an amount is deemed to be uncollectible, it is expensed through income.
As at December 31, based on Obsidian Energys credit assessments, provisions have been made for amounts deemed uncollectible. As at December 31, the following accounts receivable amounts were outstanding.
Current | 30-90 days | 90+ days | Total (1) | |||||||||||||
2017 |
$ | 94 | $ | 3 | $ | 9 | $ | 106 | ||||||||
2016 |
$ | 90 | $ | 23 | $ | 9 | $ | 122 |
(1) | In 2017, $1 million of accounts receivable is related to assets classified as held for sale (2016 - $9 million). |
5. Deferred funding asset
Deferred funding amounts relate to Obsidian Energys share of capital and operating expenses to be funded by the Companys partner in the Peace River Oil Partnership. Amounts expected to be settled within the next 12 months are classified as current. The Company fully utilized the deferred funding asset in the fourth quarter of 2017 and expects payment from its partner during the first quarter of 2018.
As at December 31 | ||||||||
2017 | 2016 | |||||||
Current portion |
$ | 18 | $ | 77 | ||||
Long-term portion |
| 16 | ||||||
|
|
|
|
|||||
Total |
$ | 18 | $ | 93 | ||||
|
|
|
|
6. Assets and liabilities held for sale
Assets and liabilities classified as held for sale consisted of the following:
As at December 31 | ||||||||
2017 | 2016 | |||||||
Assets held for sale Working capital |
$ | 1 | $ | 10 | ||||
Property, plant and equipment |
34 | 104 | ||||||
|
|
|
|
|||||
$ | 35 | $ | 114 | |||||
|
|
|
|
|||||
Liabilities related to assets held for sale |
||||||||
Working capital |
$ | 1 | $ | 6 | ||||
Decommissioning liability |
23 | 75 | ||||||
|
|
|
|
|||||
$ | 24 | $ | 81 | |||||
|
|
|
|
During the fourth quarter of 2017, as a result of entering into a definitive sale agreement, the Company classified certain non-core legacy assets located in Central Alberta as assets held for sale at December 31, 2017. The transaction closed in January 2018.
At December 31, 2017, these assets were recorded at the lower of fair value less costs to sell and their carrying amount, resulting in a PP&E impairment loss of $12 million (2016 - $65 million). The impairment expense has been recorded as additional depletion, depreciation, impairment and accretion on the Consolidated Statements of Loss.
OBSIDIAN ENERGY 2017 | NOTES TO CONSOLIDATED FINANCIAL STATEMENTS 18 |
In 2016, the Company entered into definitive sales agreements during the fourth quarter and classified all of its assets located in British Columbia and certain assets located in the Swan Hills area of Alberta as assets held for sale at December 31, 2016. In January 2017, two of these transactions closed for total proceeds of $22 million, subject to closing adjustments.
7. Property, plant and equipment
Cost
Oil and gas assets |
Facilities | Corporate assets |
Total | |||||||||||||||||
Balance at January 1, 2016 |
$ | 10,731 | $ | 5,310 | $ | 169 | $ | 16,210 | ||||||||||||
Capital expenditures |
37 | 43 | 2 | 82 | ||||||||||||||||
Joint venture, carried capital |
40 | | | 40 | ||||||||||||||||
Acquisitions |
2 | 1 | | 3 | ||||||||||||||||
Dispositions |
(3,996 | ) | (999 | ) | | (4,995 | ) | |||||||||||||
Transfers from E&E |
1 | | | 1 | ||||||||||||||||
Transfers to asset held for sale |
(430 | ) | (107 | ) | | (537 | ) | |||||||||||||
Net decommissioning dispositions (1) |
(156 | ) | | | (156 | ) | ||||||||||||||
|
|
|
|
|
|
|
|
|||||||||||||
Balance at December 31, 2016 |
$ | 6,229 | $ | 4,248 | $ | 171 | $ | 10,648 | ||||||||||||
Capital expenditures |
56 | 83 | 2 | 141 | ||||||||||||||||
Joint venture, carried capital |
50 | | | 50 | ||||||||||||||||
Acquisitions |
5 | 1 | | 6 | ||||||||||||||||
Dispositions |
(61 | ) | (15 | ) | | (76 | ) | |||||||||||||
Transfers to asset held for sale |
(100 | ) | (25 | ) | | (125 | ) | |||||||||||||
Net decommissioning dispositions (1) |
(7 | ) | | | (7 | ) | ||||||||||||||
SR&ED credits (note 11) |
(1 | ) | | | (1 | ) | ||||||||||||||
|
|
|
|
|
|
|
|
|||||||||||||
Balance at December 31, 2017 |
$ | 6,171 | $ | 4,292 | $ | 173 | $ | 10,636 | ||||||||||||
|
|
|
|
|
|
|
|
(1) | Includes additions from drilling activity, facility capital spending and disposals from net property dispositions. |
Accumulated depletion, depreciation and impairment
Oil and gas Assets |
Facilities | Corporate assets |
Total | |||||||||||||
Balance at January 1, 2016 |
$ | 8,545 | $ | 2,426 | $ | 94 | $ | 11,065 | ||||||||
Depletion and depreciation |
263 | 91 | 14 | 368 | ||||||||||||
Impairments |
230 | 58 | | 288 | ||||||||||||
Transfers to asset held for sale |
(346 | ) | (87 | ) | | (433 | ) | |||||||||
Dispositions |
(2,898 | ) | (724 | ) | | (3,622 | ) | |||||||||
|
|
|
|
|
|
|
|
|||||||||
Balance at December 31, 2016 |
$ | 5,794 | $ | 1,764 | $ | 108 | $ | 7,666 | ||||||||
Depletion and depreciation |
201 | 74 | 14 | 289 | ||||||||||||
Impairments |
12 | 3 | | 15 | ||||||||||||
Transfers to asset held for sale |
(73 | ) | (18 | ) | | (91 | ) | |||||||||
Dispositions |
(50 | ) | (12 | ) | | (62 | ) | |||||||||
|
|
|
|
|
|
|
|
|||||||||
Balance at December 31, 2017 |
$ | 5,884 | $ | 1,811 | $ | 122 | $ | 7,817 | ||||||||
|
|
|
|
|
|
|
|
Net book value
As at December 31 | ||||||||
2017 | 2016 | |||||||
Total |
$ | 2,819 | $ | 2,982 |
OBSIDIAN ENERGY 2017 | NOTES TO CONSOLIDATED FINANCIAL STATEMENTS 19 |
In 2017, the Company continued to focus its asset base and completed a number of dispositions which led to gains on dispositions of $74 million (2016 - $33 million), which included an insignificant amount of transaction costs (2016 - $9 million).
At December 31, 2017, due to commodity price volatility, specifically heavy oil differentials, and recent disposition activity within the Companys non-core properties, Obsidian Energy determined there were indicators of impairment within its Peace River and Legacy CGUs and accordingly completed an impairment tests on those respective CGUs. No impairment was noted as a result of completing the test. There were no indicators of impairment or impairment reversal in the Companys remaining CGUs.
The recoverable amount used in the Peace River impairment test was based on a value in use method while the Legacy impairment test was based on fair value less cost to sell method. Both recoverable amounts were calculated using proved plus probable reserves and incremental development drilling locations, if applicable. The incremental development drilling location value was based on managements internal estimates considering well performance and recent well and type curve assumptions.
The following table outlines benchmark prices and assumptions the Company used in the impairment test as at December 31, 2017:
WTI ($US/bbl) |
AECO ($CAD/MMbtu) |
Exchange rate ($US equals $1 CAD) |
||||||||||
2018 |
$ | 55.00 | $ | 2.85 | $ | 0.79 | ||||||
2019 |
65.00 | 3.11 | 0.82 | |||||||||
2020 |
70.00 | 3.65 | 0.85 | |||||||||
2021 |
73.00 | 3.80 | 0.85 | |||||||||
2022 |
74.46 | 3.95 | 0.85 | |||||||||
2023 2028 |
$ | 79.85 | $ | 4.31 | $ | 0.85 | ||||||
Thereafter (inflation percentage) |
2.0 | % | 2.0 | % | |
Impairments have been recorded as Depletion, depreciation, impairment and accretion on the Consolidated Statements of Loss.
OBSIDIAN ENERGY 2017 | NOTES TO CONSOLIDATED FINANCIAL STATEMENTS 20 |
8. Long-term debt
As at December 31 | ||||||||
2017 | 2016 | |||||||
Bankers acceptances and prime rate loans |
$ | 253 | $ | 329 | ||||
U.S. Senior secured notes 2007 Notes |
||||||||
5.80%, US$5 million, matured May 31, 2017 |
| 6 | ||||||
5.90%, US$5 million, maturing May 31, 2019 |
5 | 6 | ||||||
Senior secured notes 2008 Notes |
||||||||
6.30%, US$24 million, maturing May 29, 2018 |
31 | 33 | ||||||
6.40%, US$4 million, maturing May 29, 2020 |
5 | 5 | ||||||
Senior secured notes 2009 Notes |
||||||||
9.32%, US$8 million, maturing May 5, 2019 |
10 | 11 | ||||||
Senior secured notes 2010 Q1 Notes |
||||||||
5.29%, US$10 million, matured March 16, 2017 |
| 13 | ||||||
5.85%, US$10 million, maturing March 16, 2020 |
12 | 13 | ||||||
Senior secured notes 2010 Q4 Notes |
||||||||
4.17%, US$6 million, matured December 2, 2017 |
| 8 | ||||||
4.88%, US$13 million, maturing December 2, 2020 |
17 | 17 | ||||||
4.98%, US$6 million, maturing December 2, 2022 |
7 | 8 | ||||||
5.23%, US$2 million, maturing December 2, 2025 |
3 | 3 | ||||||
Senior secured notes 2011 Q4 Notes |
||||||||
4.79%, US$12 million, maturing November 30, 2021 |
16 | 17 | ||||||
|
|
|
|
|||||
Total long-term debt |
$ | 359 | $ | 469 | ||||
|
|
|
|
|||||
Current portion |
$ | 31 | $ | 27 | ||||
Long-term portion |
$ | 328 | $ | 442 |
In 2017, the Company repaid senior notes in the amount of US$26 million as part of normal course maturities (2016 $185 million normal course maturities and $1,075 million in prepayments).
There were no senior note issuances in either 2017 or 2016.
Additional information on Obsidian Energys senior secured notes was as follows:
As at December 31 | ||||||||
2017 | 2016 | |||||||
Weighted average remaining life (years) |
2.3 | 2.7 | ||||||
Weighted average interest rate |
6.0 | % | 6.3 | % |
OBSIDIAN ENERGY 2017 | NOTES TO CONSOLIDATED FINANCIAL STATEMENTS 21 |
The estimated fair values of the principal and interest obligations of the outstanding senior secured notes were as follows:
As at December 31 | ||||||||
2017 | 2016 | |||||||
2007 Notes |
$ | 6 | $ | 12 | ||||
2008 Notes |
36 | 38 | ||||||
2009 Notes |
10 | 11 | ||||||
2010 Q1 Notes |
12 | 25 | ||||||
2010 Q4 Notes |
25 | 33 | ||||||
2011 Notes |
14 | 15 | ||||||
|
|
|
|
|||||
Total |
$ | 103 | $ | 134 | ||||
|
|
|
|
During 2017, the Company transitioned to a reserve-based syndicated credit facility. The underlying borrowing base of the syndicated credit facility is $550 million, less the amount of outstanding pari passu senior notes and outstanding GBP cross currency swap, resulting in $410 million currently available under the syndicated credit facility. The initial revolving period of the syndicated credit facility ends on May 17, 2018, with an additional one-year term out period, and is subject to a semi-annual borrowing base redetermination in May and November of each year. At December 31, 2017, the Company had $157 million of unused credit capacity available under the syndicated credit facility.
Drawings on the Companys bank facility are subject to fluctuations in short-term money market rates as they are generally held as short-term borrowings. As at December 31, 2017, 70 percent (2016 70 percent) of Obsidian Energys long-term debt instruments were exposed to changes in short-term interest rates.
At December 31, 2017, letters of credit totalling $14 million were outstanding (2016 $16 million) that reduce the amount otherwise available to be drawn on the syndicated credit facility.
Obsidian Energy records unrealized foreign exchange gains or losses on its senior notes as amounts are translated into Canadian dollars at the rate of exchange in effect at the balance sheet date. The split between realized and unrealized foreign exchange is as follows:
Year ended December 31 | ||||||||
2017 | 2016 | |||||||
Realized foreign exchange loss on debt maturities |
$ | (6 | ) | $ | (37 | ) | ||
Realized foreign exchange loss on debt pre-payments |
| (191 | ) | |||||
Unrealized foreign exchange gain |
11 | 312 | ||||||
|
|
|
|
|||||
Foreign exchange gain |
$ | 5 | $ | 84 | ||||
|
|
|
|
OBSIDIAN ENERGY 2017 | NOTES TO CONSOLIDATED FINANCIAL STATEMENTS 22 |
The Company is subject to certain financial covenants under its senior notes and syndicated credit facility. These types of financial covenants are typical for senior lending arrangements and include senior debt and total debt to EBITDA and senior debt and total debt to capitalization, as more specifically defined in the applicable lending agreements. At December 31, 2017, the Company was in compliance with all of its financial covenants under such lending agreements.
In 2015, as part of entering into amending agreements with its lenders and noteholders, the Company agreed to grant floating charge security over all of its property in favour of the lenders and the noteholders on a pari passu basis, which security will be fully released on such date when both (a) no default or event of default is continuing under the Companys syndicated bank facility or senior notes and (b) the Company has achieved both (i) a Senior Debt to EBITDA ratio of 3:1 or less for four consecutive quarters, and (ii) an investment grade rating on its senior secured debt.
9. Provisions
Year ended December 31 | ||||||||
2017 | 2016 | |||||||
Decommissioning liability |
$ | 147 | $ | 182 | ||||
Office lease provision |
101 | 117 | ||||||
|
|
|
|
|||||
Total |
$ | 248 | $ | 299 | ||||
Current portion |
$ | 27 | $ | 35 | ||||
Long-term portion |
221 | 264 | ||||||
|
|
|
|
|||||
Total |
$ | 248 | $ | 299 | ||||
|
|
|
|
Decommissioning liability
The decommissioning liability is based upon the present value of Obsidian Energys net share of estimated future costs of obligations to abandon and reclaim all wells, facilities and pipelines. These estimates were made by management using information from internal analysis and external consultants assuming current costs, technology and enacted legislation.
The decommissioning liability was determined by applying an inflation factor of 2.0 percent (2016 - 2.0 percent) and the inflated amount was discounted using a credit-adjusted rate of 6.5 percent (2016 6.5 percent) over the expected useful life of the underlying assets, currently extending over 50 years into the future. The total decommissioning liability on an undiscounted, uninflated basis was $0.9 billion (2016 - $1.1 billion).
OBSIDIAN ENERGY 2017 | NOTES TO CONSOLIDATED FINANCIAL STATEMENTS 23 |
Changes to the decommissioning liability were as follows:
Year ended December 31 | ||||||||
2017 | 2016 | |||||||
Balance, beginning of year |
$ | 182 | $ | 397 | ||||
Net liabilities disposed (1) |
(4 | ) | (193 | ) | ||||
Acquisitions |
| 5 | ||||||
Increase (decrease) due to changes in estimates (2) |
(3 | ) | 37 | |||||
Liabilities settled |
(16 | ) | (11 | ) | ||||
Transfers to liabilities for assets held for sale |
(23 | ) | (75 | ) | ||||
Accretion charges |
11 | 22 | ||||||
|
|
|
|
|||||
Balance, end of year |
$ | 147 | $ | 182 | ||||
|
|
|
|
|||||
|
|
|
|
|||||
Current portion |
$ | 10 | $ | 20 | ||||
Long-term portion |
$ | 137 | $ | 162 |
(1) | Includes additions from drilling activity, facility capital spending and disposals from net property dispositions. |
(2) | In 2017, there were no changes in the discount rate (2016 $75 million increase). |
Office lease provision
The office lease provision represents the net present value of the future lease payments that the Company is obligated to make under non-cancellable lease contracts less recoveries under current sub-lease agreements. The office lease provision was determined by applying a credit-adjusted discount rate of 6.5 percent (2016 6.5%) over the remaining life of the lease contracts, extending into 2025.
Changes to the office lease provision were as follows:
Year ended December 31 | ||||||||
2017 | 2016 | |||||||
Balance, beginning of year |
$ | 117 | $ | | ||||
Net additions |
(7 | ) | 107 | |||||
Increase due to changes in estimates |
(1 | ) | 12 | |||||
Cash settlements |
(16 | ) | (4 | ) | ||||
Accretion charges |
8 | 2 | ||||||
|
|
|
|
|||||
Balance, end of year |
$ | 101 | $ | 117 | ||||
|
|
|
|
|||||
Current portion |
$ | 17 | $ | 15 | ||||
Long-term portion |
$ | 84 | $ | 102 |
During 2016, the Company closed several significant asset dispositions which reduced the size of its operations and recognized a provision related to certain office lease commitments that are considered onerous contracts.
OBSIDIAN ENERGY 2017 | NOTES TO CONSOLIDATED FINANCIAL STATEMENTS 24 |
10. Risk management
Financial instruments consist of accounts receivable, fair values of derivative financial instruments, accounts payable and accrued liabilities and long-term debt. At December 31, 2017, except for the senior notes described in Note 8 with a carrying value of $106 million (2016 $140 million) and a fair value of $103 million (2016$134 million), the fair values of these financial instruments approximate their carrying amounts due to the short-term maturity of the instruments, the mark to market values recorded for the financial instruments and the market rate of interest applicable to the syndicated credit facility.
The fair values of all outstanding financial, commodity, interest rate and foreign exchange contracts are reflected on the balance sheet with the changes during the period recorded in income as unrealized gains or losses.
At December 31, 2017 and 2016, the only asset or liability measured at fair value on a recurring basis was the risk management asset and liability, which was valued based on Level 2 inputs being quoted prices in markets that are not active or based on prices that are observable for the asset or liability.
The following table reconciles the changes in the fair value of financial instruments outstanding:
Year ended December 31 | ||||||||
Risk management asset (liability) |
2017 | 2016 | ||||||
Balance, beginning of year |
$ | (43 | ) | $ | 104 | |||
Unrealized gain (loss) on financial instruments: |
||||||||
Commodity collars, swaps and assignments |
(7 | ) | (74 | ) | ||||
Electricity swaps |
| 4 | ||||||
Foreign exchange forwards |
(6 | ) | (43 | ) | ||||
Cross currency swaps |
6 | (34 | ) | |||||
|
|
|
|
|||||
Total fair value, end of year |
$ | (50 | ) | $ | (43 | ) | ||
|
|
|
|
|||||
As at December 31 | ||||||||
Total fair value consists of the following: |
2017 | 2016 | ||||||
Current asset portion |
$ | 11 | $ | 8 | ||||
Current liability portion |
(55 | ) | (26 | ) | ||||
Non-current asset portion |
| | ||||||
Non-current liability portion |
(6 | ) | (25 | ) | ||||
|
|
|
|
|||||
Total fair value |
$ | (50 | ) | $ | (43 | ) | ||
|
|
|
|
OBSIDIAN ENERGY 2017 | NOTES TO CONSOLIDATED FINANCIAL STATEMENTS 25 |
Obsidian Energy had the following financial instruments outstanding as at December 31, 2017. Fair values are determined using external counterparty information, which is compared to observable market data. The Company limits its credit risk by executing counterparty risk procedures which include transacting only with institutions within its syndicated credit facility or companies with high credit ratings and by obtaining financial security in certain circumstances.
Notional |
Remaining term |
Pricing |
Fair value (millions) | |||||||
Natural gas |
||||||||||
AECO Swaps |
1,900 mcf/d | Jan/18 Mar/18 | $3.19/mcf | $ | | |||||
AECO Swaps |
1,900 mcf/d | Jan/18 Jun/18 | $2.91/mcf | | ||||||
AECO Swaps |
1,900 mcf/d | Jan/18 Sep/18 | $2.69/mcf | 1 | ||||||
AECO Swaps |
3,800 mcf/d | Jan/18 Mar/18 | $3.33/mcf | | ||||||
AECO Swaps |
3,800 mcf/d | Jan/18 Jun/18 | $2.84/mcf | 1 | ||||||
AECO Swaps |
15,200 mcf/d | Jan/18 Dec/18 | $2.67/mcf | 6 | ||||||
Ventura |
7,500 mcf/d | Jan/18 Dec/18 | US$2.79/mcf | | ||||||
Crude Oil |
||||||||||
WTI Swaps |
1,000 bbl/d | Jan/18 Jun/18 | $71.00/bbl | (1) | ||||||
WTI Swaps |
2,000 bbl/d | Jul/18 Dec/18 | US$50.09/bbl | (4) | ||||||
WTI Swaps |
6,000 bbl/d | Jan/18 Mar/18 | US$51.07/bbl | (6) | ||||||
WTI Swaps |
4,000 bbl/d | Apr/18 Jun/18 | US$50.95/bbl | (4) | ||||||
WTI Swaps |
2,000 bbl/d | Jul/18 Sep/18 | US$51.90/bbl | (2) | ||||||
WTI Swaps |
2,000 bbl/d | Oct/18 Dec/18 | US$50.81/bbl | (2) | ||||||
WTI Swaps |
4,000 bbl/d | Jan/18 Dec/18 | $71.04/bbl | (5) | ||||||
WTI Swaps |
1,000 bbl/d | Jan/18 Dec/18 | US$49.35/bbl | (4) | ||||||
WTI Swaps |
2,000 bbl/d | Apr/18 Dec/18 | US$48.43/bbl | (7) | ||||||
WTI Swaps |
1,000 bbl/d | Jul/18 Mar/19 | US$50.20/bbl | (3) | ||||||
WTI Swaps |
2,000 bbl/d | Jan/19 Mar/19 | $66.50/bbl | (1) | ||||||
WTI Swaps |
2,000 bbl/d | Jan/19 Mar/19 | US$49.93/bbl | (1) | ||||||
WTI Swaps |
4,000 bbl/d | Jan/19 Jun/19 | $68.58/bbl | (2) | ||||||
WTI Swaps |
1,000 bbl/d | Apr/19 Jun/19 | US$55.35/bbl | | ||||||
Foreign exchange forward contracts on revenue |
||||||||||
FX Collar |
US$24 | 2018 | 1.210 to 1.272 USD/CAD | | ||||||
FX Swap |
US$24 | 2018 | 1.2768 | 1 | ||||||
FX Swap |
US$24 | 2018 | 1.2500 | | ||||||
FX Swap |
US$24 | 2018 | 1.2568 | | ||||||
FX Swap |
US$24 | 2018 | 1.2803 | 1 | ||||||
FX Swap |
US$12 | 2018 | 1.2840 | | ||||||
Cross currency swaps |
||||||||||
10-year initial term |
£57 | 2018 | 2.0075 CAD/GBP, 6.95% | (18) | ||||||
18-month offset |
(£43) | 2018 | 1.7049 CAD/GBP, 6.95% | | ||||||
10-year initial term |
£5 | 2019 | 1.8051 CAD/GBP, 9.15% | | ||||||
10-year initial term |
10 | 2019 | 1.5870 CAD/EUR, 9.22% | | ||||||
|
|
|||||||||
Total |
$ | (50) | ||||||||
|
|
Based on December 31, 2017 pricing, a $1.00 change in the price per barrel of liquids of WTI would have changed pre-tax unrealized risk management by $7 million and a $0.10 change in the price per mcf of natural gas would change pre-tax unrealized risk management by $1 million.
OBSIDIAN ENERGY 2017 | NOTES TO CONSOLIDATED FINANCIAL STATEMENTS 26 |
Subsequent to December 31, 2017, the Company entered into the following crude oil swaps and foreign exchange contracts on long-term debt:
Reference Price |
Term | Price | Notional | |||
WTI |
Apr/19 Jun/19 | US$57.70/bbl | 1,000 bbl/d | |||
WTI |
Jul/19 Sep/19 | US$57.00/bbl | 1,000 bbl/d | |||
USD/CAD |
Jan/19 May/19 | 1.2259 | US$5 | |||
USD/CAD |
Jan/19 May/19 | 1.2319 | US$5 | |||
USD/CAD |
Jan/19 May/19 | 1.2400 | US$5 |
Additionally, subsequent to December 31, 2017, the Company unwound its outstanding £5 million and 10 million cross currency swaps for nil proceeds.
The components of risk management on the Consolidated Statements of Loss are as follows:
Year ended December 31 | ||||||||
2017 | 2016 | |||||||
Realized |
||||||||
Settlement of commodity contracts/assignment |
$ | 23 | $ | 99 | ||||
Monetization of commodity contracts |
| 2 | ||||||
Settlement of foreign exchange contracts |
8 | 3 | ||||||
Monetization of foreign exchange contracts |
| 32 | ||||||
|
|
|
|
|||||
Total realized risk management gain |
31 | 136 | ||||||
Unrealized |
||||||||
Commodity contracts |
(7 | ) | (72 | ) | ||||
Electricity swaps |
| 4 | ||||||
Crude oil assignment |
| (2 | ) | |||||
Foreign exchange contracts |
(6 | ) | (43 | ) | ||||
Cross-currency swaps |
6 | (34 | ) | |||||
|
|
|
|
|||||
Total unrealized risk management loss |
(7 | ) | (147 | ) | ||||
|
|
|
|
|||||
Risk management gain (loss) |
$ | 24 | $ | (11 | ) | |||
|
|
|
|
In 2017, the Company had no outstanding electricity contracts (2016 - $7 million loss).
Market Risks
Obsidian Energy is exposed to normal market risks inherent in the oil and natural gas business, including, but not limited to, commodity price risk, foreign currency rate risk, credit risk, interest rate risk and liquidity risk. The Company seeks to mitigate these risks through various business processes and management controls and from time to time by using financial instruments.
OBSIDIAN ENERGY 2017 | NOTES TO CONSOLIDATED FINANCIAL STATEMENTS 27 |
Commodity Price Risk
Commodity price fluctuations are among the Companys most significant exposures. Crude oil prices are influenced by worldwide factors, including, but not limited to, OPEC actions, world supply and demand fundamentals and geopolitical events. Natural gas prices are influenced by, including, but not limited to, the price of alternative fuel sources such as oil or coal and by North American natural gas supply and demand fundamentals including the levels of industrial activity, weather, storage levels and liquefied natural gas activity. In accordance with policies approved by Obsidian Energys Board of Directors, the Company may, from time to time, manage these risks through the use of swaps or other financial instruments up to a maximum of 50 percent of forecast sales volumes, net of royalties, for the balance of any current year plus one additional year forward and up to a maximum of 25 percent, net of royalties, for one additional year thereafter. Risk management limits included in Obsidian Energys policies may be exceeded with specific approval from the Board of Directors. In November 2017, the Board approved the Company to hedge up to a maximum of 75 percent of forecast sales volumes on natural gas and up to a maximum of 67 percent of forecast sales volumes on crude, both net of royalties, for the 2018 calendar year.
Foreign Currency Rate Risk
Prices received for crude oil are referenced to US dollars, thus Obsidian Energys realized oil prices are impacted by Canadian dollar to US dollar exchange rates. A portion of the Companys debt capital is denominated in US dollars, thus the principal and interest payments in Canadian dollars are also impacted by exchange rates. When considered appropriate, the Company may use financial instruments to fix or collar future exchange rates to fix the Canadian dollar equivalent of crude oil revenues or to fix US denominated long-term debt principal repayments.
In 2017, US$25 million of foreign exchange forward contracts on senior notes matured. Additionally, in 2016 the Company monetized a total of US$115 million of foreign exchange forward contracts on senior notes.
Credit Risk
Credit risk is the risk of loss if purchasers or counterparties do not fulfill their contractual obligations. The Companys accounts receivable are principally with customers in the oil and natural gas industry and are generally subject to normal industry credit risk, which includes the ability to recover unpaid receivables by retaining the partners share of production when Obsidian Energy is the operator. For oil and natural gas sales and financial derivatives, a counterparty risk procedure is followed whereby each counterparty is reviewed on a regular basis for the purpose of assigning a credit limit and may be requested to provide security if determined to be prudent. For financial derivatives, the Company normally transacts with counterparties who are members of its banking syndicate or other counterparties that have investment grade bond ratings. Credit events related to all counterparties are monitored and credit exposures are reassessed on a regular basis. As necessary, provisions for potential credit related losses are recognized.
As at December 31, 2017, the maximum exposure to credit risk was $117 million (2016 $130 million) which was comprised of $106 million (2016 - $122 million) being the carrying value of the accounts receivable and $11 million (2016 $8 million) related to the fair value of the derivative financial assets.
Interest Rate Risk
A portion of the Companys debt capital can be held in floating-rate bank facilities, which results in exposure to fluctuations in short-term interest rates, which remain at lower levels than longer-term rates. From time to time, Obsidian Energy may increase the certainty of its future interest rates by entering fixed interest rate debt instruments or by using financial instruments to swap floating interest rates for fixed rates or to collar interest rates. As at December 31, 2017, 70 percent of the Companys long-term debt instruments were exposed to changes in short-term interest rates (2016 70 percent).
OBSIDIAN ENERGY 2017 | NOTES TO CONSOLIDATED FINANCIAL STATEMENTS 28 |
As at December 31, 2017, a total of $106 million (2016 $140 million) of fixed interest rate debt instruments was outstanding with an average remaining term of 2.3 years (2016 2.7 years) and an average interest rate of 6.0 percent (2016 6.3 percent).
Liquidity Risk
Liquidity risk is the risk that the Company will be unable to meet its financial liabilities as they come due. Management utilizes short and long-term financial and capital forecasting programs to ensure credit facilities are sufficient relative to forecast debt levels and capital program levels are appropriate, and that financial covenants will be met. Management also regularly reviews capital markets to identify opportunities to optimize the debt capital structure on a cost-effective basis. In the short term, liquidity is managed through daily cash management activities, short-term financing strategies and the use of swaps and other financial instruments to increase the predictability of cash flow from operating activities.
The following table outlines estimated future obligations for non-derivative financial liabilities as at December 31, 2017:
Senior secured notes |
Accounts payable & accrued liabilities (1) |
Share-based compensation accrual |
Total | |||||||||||||
2018 |
$ | 31 | $ | 148 | $ | 2 | $ | 181 | ||||||||
2019 |
16 | | 1 | 17 | ||||||||||||
2020 |
34 | | | 34 | ||||||||||||
2021 |
15 | | | 15 | ||||||||||||
2022 |
7 | | | 7 | ||||||||||||
Thereafter |
$ | 3 | $ | | $ | | $ | 3 |
(1) | Includes $1 million of accounts payable and accrued liabilities related to assets classified as held for sale. |
11. Income taxes
The provision for income taxes is as follows:
Year ended December 31 | ||||||||
2017 | 2016 | |||||||
Deferred tax recovery |
$ | (13 | ) | $ | (252 | ) |
The provision for income taxes reflects an effective tax rate that differs from the combined federal and provincial statutory tax rate as follows:
Year ended December 31 | ||||||||
2017 | 2016 | |||||||
Loss before taxes |
$ | (97 | ) | $ | (948 | ) | ||
Combined statutory tax rate (1) |
27.0 | % | 27.0 | % | ||||
Computed income tax recovery |
$ | (26 | ) | $ | (256 | ) | ||
Increase (decrease) resulting from: |
||||||||
Share-based compensation |
2 | 1 | ||||||
Non-taxable foreign exchange (gain) loss |
(2 | ) | (11 | ) | ||||
Unrecognized deferred tax asset |
5 | | ||||||
Adjustments related to prior years |
5 | 14 | ||||||
Other |
3 | | ||||||
|
|
|
|
|||||
Deferred tax recovery |
$ | (13 | ) | $ | (252 | ) | ||
|
|
|
|
(1) | The tax rate represents the combined federal and provincial statutory tax rates for the Company and its subsidiaries for the years ended December 31, 2017 and December 31, 2016. |
OBSIDIAN ENERGY 2017 | NOTES TO CONSOLIDATED FINANCIAL STATEMENTS 29 |
The net deferred income tax liability is comprised of the following:
Balance January 1, 2017 |
Provision (Recovery) in Income |
Recognized in Property, Plant and Equipment |
Balance December 31, 2017 |
|||||||||||||
Deferred tax liabilities (assets) |
||||||||||||||||
PP&E |
$ | 668 | $ | (53 | ) | $ | (1 | ) | $ | 614 | ||||||
Risk management |
(40 | ) | 5 | | (35 | ) | ||||||||||
Decommissioning liability |
(69 | ) | 23 | | (46 | ) | ||||||||||
Share-based compensation |
(4 | ) | 3 | | (1 | ) | ||||||||||
Non-capital losses |
(541 | ) | 9 | | (532 | ) | ||||||||||
|
|
|
|
|
|
|
|
|||||||||
Net deferred tax liability |
$ | 14 | $ | (13 | ) | $ | (1 | ) | $ | | ||||||
|
|
|
|
|
|
|
|
Balance January 1, 2016 |
Provision (Recovery) in Income |
Recognized in Property, Plant and Equipment |
Balance December 31, 2016 |
|||||||||||||
Deferred tax liabilities (assets) |
||||||||||||||||
PP&E |
$ | 1,129 | $ | (461 | ) | $ | | $ | 668 | |||||||
Risk management |
12 | (52 | ) | | (40 | ) | ||||||||||
Decommissioning liability |
(107 | ) | 38 | | (69 | ) | ||||||||||
Share-based compensation |
(2 | ) | (2 | ) | | (4 | ) | |||||||||
Non-capital losses |
(766 | ) | 225 | | (541 | ) | ||||||||||
|
|
|
|
|
|
|
|
|||||||||
Net deferred tax liability |
$ | 266 | $ | (252 | ) | $ | | $ | 14 | |||||||
|
|
|
|
|
|
|
|
As at December 31, 2017, Obsidian Energy had approximately $2.4 billion (2016 $2.4 billion) in total tax pools, including non-capital losses of $2.0 billion (2016 - $2.0 billion). The non-capital losses are available for immediate deduction against future taxable income and expire in the years 2026 through 2038. A deferred tax asset has not been recognized in respect of non-capital losses of $17 million (December 31, 2016 nil) as there is not sufficient certainty regarding future utilization.
At December 31, 2017, Obsidian Energy had realized and unrealized net capital losses of $586 million (2016 - $591 million). A deferred tax asset has not been recognized in respect of these losses as they may only be applied against future capital gains.
The Company has income tax filings that are subject to audit by taxation authorities, which may impact its deferred income tax position or amount. The Company does not anticipate adjustments arising from these audits and believes it has adequately provided for income taxes based on available information, however, adjustments that arise could be material.
12. Shareholders equity
a) Authorized
i) An unlimited number of Common Shares.
ii) 90,000,000 preferred shares issuable in one or more series.
If issued, preferred shares of each series would rank on parity with the preferred shares of other series with respect to accumulated dividends and return on capital. Preferred shares would have priority over the Common shares with respect to the payment of dividends or the distribution of assets.
OBSIDIAN ENERGY 2017 | NOTES TO CONSOLIDATED FINANCIAL STATEMENTS 30 |
b) Issued
Shareholders capital |
Common Shares |
Amount | ||||||
Balance, January 1, 2016 |
502,163,163 | $ | 8,994 | |||||
Issued on exercise of equity compensation plans (1) |
600,775 | 3 | ||||||
Cancellation of dividend reinvestment plan (2) |
(175 | ) | | |||||
|
|
|
|
|||||
Balance, December 31, 2016 |
502,763,763 | $ | 8,997 | |||||
Issued on exercise of equity compensation plans (1) |
1,577,225 | 4 | ||||||
Elimination of deficit |
| (6,820 | ) | |||||
|
|
|
|
|||||
Balance, December 31, 2017 |
504,340,988 | $ | 2,181 | |||||
|
|
|
|
(1) | Upon exercise of options, the net benefit is recorded as a reduction of other reserves and an increase to shareholders capital. |
(2) | In March 2016, the Company cancelled its dividend reinvestment plan. |
In June 2017, the Companys shareholders approved the reduction of the Companys share capital and the elimination of its deficit as stated at March 31, 2017.
Year ended December 31 | ||||||||
Other Reserves |
2017 | 2016 | ||||||
Balance, beginning of year |
$ | 97 | $ | 92 | ||||
Share-based compensation expense |
8 | 7 | ||||||
Net benefit on options exercised (1) |
(9 | ) | (2 | ) | ||||
|
|
|
|
|||||
Balance, end of year |
$ | 96 | $ | 97 | ||||
|
|
|
|
(1) | Upon exercise of options, the net benefit is recorded as a reduction of other reserves and an increase to shareholders capital. |
Preferred Shares
No Preferred Shares were issued or outstanding.
OBSIDIAN ENERGY 2017 | NOTES TO CONSOLIDATED FINANCIAL STATEMENTS 31 |
13. Share-based compensation
Restricted and Performance Share Unit plan (RPSU plan)
Obsidian Energy has an RPSU plan whereby employees receive consideration that fluctuates based on the Companys share price on the TSX. Since March 2016, consideration can be in the form of cash or shares purchased on the open market therefore all grants subsequent to March 2016 are accounted for based on the equity method. In June 2017, the shareholders approved amendments to the RPSU plan such that shares provided under the plan can either be purchased on the open market or issued from treasury.
RPSU plan (number of shares equivalent) |
Year ended December 31 | |||||||
2017 | 2016 | |||||||
Outstanding, beginning of year |
10,199,595 | 6,325,954 | ||||||
Granted |
4,472,510 | 11,745,330 | ||||||
Vested |
(3,935,186 | ) | (2,353,989 | ) | ||||
Forfeited |
(2,339,541 | ) | (5,517,700 | ) | ||||
|
|
|
|
|||||
Outstanding, end of year |
8,397,378 | 10,199,595 | ||||||
|
|
|
|
|||||
Outstanding units liability method |
730,297 | 2,314,805 | ||||||
Outstanding units equity method |
7,667,081 | 7,884,790 | ||||||
As at December 31 | ||||||||
RPSU obligation: |
2017 | 2016 | ||||||
Current liability (1) |
$ | 1 | $ | 3 | ||||
Non-current liability |
$ | | $ | 1 |
(1) | Included within Accounts payable and accrued liabilities. |
The fair value of the RPSU plan units under the equity method used the following weighted average assumptions:
Year ended December 31 | ||||||||
2017 | 2016 | |||||||
Average fair value of units granted (per unit) |
$ | 2.11 | $ | 1.20 | ||||
Expected life of units (years) |
3.0 | 3.0 | ||||||
Expected forfeiture rate |
7.8 | % | 18.4 | % |
Stock Option Plan
Obsidian Energy has an Option Plan that allows the Company to issue options to acquire common shares to officers, employees and other service providers. In March 2017, the Board of Directors resolved to suspend all future grants of options under the Option Plan.
OBSIDIAN ENERGY 2017 | NOTES TO CONSOLIDATED FINANCIAL STATEMENTS 32 |
Year ended December 31 | ||||||||||||||||
2017 | 2016 | |||||||||||||||
Options |
Number of Options |
Weighted Average Exercise Price |
Number of Options |
Weighted Average Exercise Price |
||||||||||||
Outstanding, beginning of year |
7,612,625 | $ | 6.01 | 10,595,728 | $ | 10.21 | ||||||||||
Granted |
| | 3,557,250 | 1.20 | ||||||||||||
Exercised |
(1,577,225 | ) | 1.44 | (600,775 | ) | 1.53 | ||||||||||
Forfeited |
(2,372,825 | ) | 11.22 | (5,939,578 | ) | 11.08 | ||||||||||
|
|
|
|
|
|
|
|
|||||||||
Outstanding, end of year |
3,662,575 | $ | 4.60 | 7,612,625 | $ | 6.01 | ||||||||||
|
|
|
|
|
|
|
|
|||||||||
Exercisable, end of year |
1,980,876 | $ | 6.50 | 2,804,426 | $ | 11.10 | ||||||||||
|
|
|
|
|
|
|
|
Options Outstanding | Options Exercisable | |||||||||||||||||||
Range of Grant Prices |
Number Outstanding |
Weighted Average Exercise Price |
Weighted Remaining Contractual Life (years) |
Number Exercisable |
Weighted Average Exercise Price |
|||||||||||||||
$1.00 - $1.99 |
2,005,425 | $ | 1.42 | 2.8 | 631,238 | $ | 1.53 | |||||||||||||
$2.00 - $9.99 |
1,058,950 | 7.44 | 1.4 | 751,438 | 7.66 | |||||||||||||||
$10.00 - $21.99 |
598,200 | 10.30 | 0.3 | 598,200 | 10.30 | |||||||||||||||
|
|
|
|
|
|
|
|
|
|
|||||||||||
3,662,575 | $ | 4.60 | 1.2 | 1,980,876 | $ | 6.50 | ||||||||||||||
|
|
|
|
|
|
|
|
|
|
Deferred Share Unit (DSU) plan
The DSU plan allows the Company to grant DSUs in lieu of cash fees to non-employee directors providing a right to receive, upon retirement, a cash payment based on the volume-weighted-average trading price of the common shares on the TSX. At December 31, 2017, 640,705 DSUs (2016 745,851) were outstanding and $1 million was recorded as a current liability (2016 $2 million).
Performance Share Unit (PSU) plan
The PSU plan allows Obsidian Energy to grant PSUs to employees of the Company. Members of the Board of Directors are not eligible for the PSU Plan. The PSU obligation is classified as a liability due to the cash settlement feature. Since June 2017, issuances of performance share units are made under the RPSU plan and therefore could be paid in shares.
Year ended December 31 | ||||||||
PSU awards (number of shares equivalent) |
2017 | 2016 | ||||||
Outstanding, beginning of period |
1,855,500 | 1,622,881 | ||||||
Granted |
569,000 | 2,516,000 | ||||||
Vested |
(638,750 | ) | (199,843 | ) | ||||
Forfeited |
(246,750 | ) | (2,083,538 | ) | ||||
|
|
|
|
|||||
Outstanding, end of period |
1,539,000 | 1,855,500 | ||||||
|
|
|
|
|||||
As at December 31 | ||||||||
PSU obligation: |
2017 | 2016 | ||||||
Non-current liability |
$ | 1 | $ | 2 |
OBSIDIAN ENERGY 2017 | NOTES TO CONSOLIDATED FINANCIAL STATEMENTS 33 |
Share-based compensation
Share-based compensation is based on the fair value of the options and units at the time of grant under the Option Plan and RPSU plan (equity method), which is amortized over the remaining vesting period on a graded vesting schedule. Share-based compensation under the RPSU plan (liability method), DSU and PSU is based on the fair value of the awards outstanding at the reporting date and is amortized based on a graded vesting schedule. Share-based compensation consisted of the following:
Year ended December 31 | ||||||||
2017 | 2016 | |||||||
Options |
$ | 1 | $ | 1 | ||||
PSU plan |
1 | 1 | ||||||
DSU plan |
| 1 | ||||||
RPSU plan equity method |
7 | 6 | ||||||
RPSU plan liability method |
(1 | ) | 3 | |||||
|
|
|
|
|||||
Share-based compensation |
$ | 8 | $ | 12 | ||||
|
|
|
|
The share price used in the fair value calculation of the RPSU plan (liability method), PSU and DSU obligations at December 31, 2017 was $1.56 (2016 $2.37).
Employee retirement savings plan
Obsidian Energy has an employee retirement savings plan (the savings plan) for the benefit of all employees. Under the savings plan, employees may elect to contribute up to 10 percent of their salary and Obsidian Energy matches these contributions at a rate of $1.50 for each $1.00 of employee contribution up to and including December 31, 2017, $1.25 for each $1.00 of employee contribution for 2018 and $1.00 for each $1.00 of employee contribution thereafter. Both the employees and Obsidian Energys contributions are used to acquire Obsidian Energy common shares or are placed in low-risk investments. Shares are purchased in the open market at prevailing market prices.
14. Per share amounts
The number of incremental shares included in diluted earnings per share is computed using the average volume-weighted market price of shares for the period. In addition, contracts that could be settled in cash or shares are assumed to be settled in shares if share settlement is more dilutive.
Year ended December 31 | ||||||||
2017 | 2016 | |||||||
Net loss basic and diluted |
$ | (84 | ) | $ | (696 | ) |
The weighted average number of shares used to calculate per share amounts is as follows:
Year ended December 31 | ||||||||
2017 | 2016 | |||||||
Basic and Diluted |
503,933,024 | 502,316,003 |
For 2017, 3.7 million shares (2016 7.6 million) that would be issued under the Option Plan were excluded in calculating the weighted average number of diluted shares outstanding as they were considered anti-dilutive.
OBSIDIAN ENERGY 2017 | NOTES TO CONSOLIDATED FINANCIAL STATEMENTS 34 |
15. Changes in non-cash working capital (increase) decrease
Year ended December 31 | ||||||||
2017 | 2016 | |||||||
Accounts receivable (1) |
$ | 12 | $ | 32 | ||||
Other current assets (2) |
| 23 | ||||||
Deferred funding obligation |
25 | 16 | ||||||
Accounts payable and accrued liabilities (3) (4) |
(35 | ) | (191 | ) | ||||
|
|
|
|
|||||
2 | (120 | ) | ||||||
|
|
|
|
|||||
Operating activities |
5 | (97 | ) | |||||
Investing activities |
(3 | ) | (23 | ) | ||||
|
|
|
|
|||||
$ | 2 | $ | (120 | ) | ||||
|
|
|
|
|||||
Interest paid |
$ | 23 | $ | 124 | ||||
Income taxes recovered |
$ | | $ | |
(1) | $1 million of accounts receivable is related to assets classified as held for sale in 2017 (2016 - $9 million). |
(2) | No other current assets were classified as held for sale in 2017 (2016 - $1 million). |
(3) | $1 million of accounts payable and accrued liabilities is related to assets classified as held for sale in 2017 (2016 - $6 million). |
(4) | Includes share-based compensation plans. |
16. Capital management
Obsidian Energy manages its capital to provide a flexible structure to support capital programs, production maintenance and other operational strategies. Attaining a strong financial position enables the capture of business opportunities and supports Obsidian Energys business strategy of providing strong shareholder returns.
Obsidian Energy defines capital as the sum of shareholders equity and long-term debt. Shareholders equity includes shareholders capital, other reserves and retained earnings (deficit). Long-term debt includes bank loans and senior notes.
Management continuously reviews Obsidian Energys capital structure to ensure the objectives and strategies of Obsidian Energy are being met. The capital structure is reviewed based on a number of key factors including, but not limited to, current market conditions, hedging positions, trailing and forecast debt to capitalization ratios, debt to EBITDA and other economic risk factors.
The Company is subject to certain quarterly financial covenants under its secured, syndicated credit facility and the senior secured notes. These financial covenants are typical for senior secured lending arrangements and include senior debt and total debt to EBITDA and senior debt and total debt to capitalization as defined in Obsidian Energys lending agreements. As at December 31, 2017, the Company was in compliance with all of its financial covenants under such lending agreements.
OBSIDIAN ENERGY 2017 | NOTES TO CONSOLIDATED FINANCIAL STATEMENTS 35 |
Year ended December 31 | ||||||||
(millions, except ratio amounts) |
2017 | 2016 | ||||||
Components of capital |
||||||||
Shareholders equity |
$ | 2,166 | $ | 2,247 | ||||
Long-term debt |
$ | 359 | $ | 469 | ||||
|
|
|
|
|||||
Ratios |
||||||||
Senior debt to EBITDA (1) |
1.9 | 2.0 | ||||||
Total debt to EBITDA (2) |
1.9 | 2.0 | ||||||
Senior debt to capitalization (3) |
15 | % | 17 | % | ||||
Total debt to capitalization (4) |
15 | % | 17 | % | ||||
Priority debt to consolidated tangible assets (5) |
| | ||||||
|
|
|
|
|||||
EBITDA (6) |
$ | 194 | $ | 235 | ||||
Credit facility debt and senior notes |
$ | 359 | $ | 469 | ||||
Letters of credit (7) |
10 | 6 | ||||||
|
|
|
|
|||||
Senior debt and total debt |
369 | 475 | ||||||
Total shareholders equity |
2,166 | 2,247 | ||||||
|
|
|
|
|||||
Total capitalization |
$ | 2,535 | $ | 2,722 | ||||
|
|
|
|
(1) | As at December 31, 2017, less than 3:1 |
(2) | As at December 31, 2017, less than 4:1 |
(3) | Not to exceed 50 percent |
(4) | Not to exceed 55 percent |
(5) | Priority debt not to exceed 15% of consolidated tangible assets. |
(6) | EBITDA is calculated in accordance with Obsidian Energys lending agreements wherein unrealized risk management and impairment provisions are excluded. Additionally, under the syndicated credit facility, realized foreign exchange gains or losses related to debt maturities are excluded from the calculation. |
(7) | Letters of credit defined as financial under the lending agreements are included in the calculation. |
The Company intends to continue to actively identify and evaluate hedging opportunities in order to reduce its exposure to fluctuations in commodity prices and protect its future cash flows and capital programs.
17. Commitments and contingencies
Obsidian Energy is committed to certain payments over the next five calendar years and thereafter as follows:
2018 | 2019 | 2020 | 2021 | 2022 | Thereafter | Total | ||||||||||||||||||||||
Long-term debt (1) |
$ | 31 | $ | 269 | $ | 34 | $ | 15 | $ | 7 | $ | 3 | $ | 359 | ||||||||||||||
Transportation |
12 | 10 | 9 | 7 | 5 | 14 | 57 | |||||||||||||||||||||
Power infrastructure |
8 | 2 | | | | | 10 | |||||||||||||||||||||
Interest obligations |
12 | 6 | 2 | 1 | 1 | | 22 | |||||||||||||||||||||
Office lease |
34 | 34 | 34 | 34 | 34 | 73 | 243 | |||||||||||||||||||||
Decommissioning liability |
10 | 10 | 10 | 10 | 10 | 97 | 147 | |||||||||||||||||||||
|
|
|
|
|
|
|
|
|
|
|
|
|
|
|||||||||||||||
Total |
$ | 107 | $ | 331 | $ | 89 | $ | 67 | $ | 57 | $ | 187 | $ | 838 | ||||||||||||||
|
|
|
|
|
|
|
|
|
|
|
|
|
|
(1) | The 2019 figure includes $253 million related to the syndicated credit facility that is due for renewal in 2019. Historically, the Company has successfully renewed its syndicated credit facility. |
Obsidian Energy has an aggregate of $106 million in senior notes maturing between 2018 and 2025.
OBSIDIAN ENERGY 2017 | NOTES TO CONSOLIDATED FINANCIAL STATEMENTS 36 |
Obsidian Energys commitments relate to the following:
| Transportation commitments relate to costs for future pipeline access. |
| Power infrastructure commitments pertain to electricity contracts. |
| Interest obligations are the estimated future interest payments related to Obsidian Energys debt instruments. |
| Office leases pertain to total leased office space. A portion of this office space has been sub-leased to other parties to minimize Obsidian Energys net exposure under the leases. The future office lease commitments above will be reduced by sublease recoveries totaling $101 million. For 2017, lease costs, net of recoveries totaled $19 million. |
| The decommissioning liability represents the inflated, discounted future reclamation and abandonment costs that are expected to be incurred over the life of the properties. |
During the fourth quarter of 2017, the Company settled the outstanding lawsuit it had with the United States Securities and Exchange Commission (SEC) for US$8.5 million, which is included in other expenses in the Consolidated Statement of Loss. The settlement is in relation to the Companys 2014 restatement of certain financial results while it was known as Penn West Petroleum Ltd. (Penn West). Under the terms of the settlement, the Company, without admitting or denying any of the factual allegations in the SECs Complaint, agreed to pay a penalty of US$8.5 million. In addition, the Company will be enjoined from future violations of certain provisions of U.S. securities legislation. Further details of the settlement and its consequences can be found in the settlement documents, and in U.S. securities laws. The lawsuit continued against the former Penn West employees named in the SEC Complaint.
The Company is involved in various litigation and claims in the normal course of business and records provisions for claims as required.
18. Related-party transactions
Operating entities
The consolidated financial statements include the results of Obsidian Energy Ltd. and its wholly-owned subsidiaries, notably the Obsidian Energy Partnership. Transactions and balances between Obsidian Energy Ltd. and all of its subsidiaries are eliminated upon consolidation.
Compensation of key management personnel
In 2017, key management personnel include the President and Chief Executive Officer, Vice-Presidents and the Board of Directors. The Human Resources & Compensation Committee makes recommendations to the Board of Directors who approves the appropriate remuneration levels for management based on performance and current market trends. Compensation levels of the Board of Directors are recommended by the Corporate Governance committee of the Board. The remuneration of the directors and key management personnel of Obsidian Energy during the year is below.
Year ended December 31 | ||||||||
2017 | 2016 | |||||||
Salary and employee benefits |
$ | 3 | $ | 2 | ||||
Termination benefits |
2 | 2 | ||||||
Share-based payments (1) |
3 | 2 | ||||||
|
|
|
|
|||||
$ | 8 | $ | 6 | |||||
|
|
|
|
(1) | Includes changes in the fair value of PSUs, DSUs and non-cash charges related to the Option Plan and RPSU plan (equity method) for key management personnel. |
OBSIDIAN ENERGY 2017 | NOTES TO CONSOLIDATED FINANCIAL STATEMENTS 37 |
19. Supplemental Items
In the consolidated financial statements, compensation costs are included in both operating and general and administrative expenses. For 2017, employee compensation costs of $14 million (2016 - $36 million) were included in operating expenses and $30 million (2016 - $44 million) were included in general and administrative expenses on a gross basis.
OBSIDIAN ENERGY 2017 | NOTES TO CONSOLIDATED FINANCIAL STATEMENTS 38 |
SUPPLEMENTARY OIL AND GAS INFORMATION - (UNAUDITED)
The disclosures contained in this section provide oil and gas information in accordance with the U.S. standard, Extractive Activities Oil and Gas. Obsidian Energys financial reporting is prepared in accordance with International Financial Reporting Standards (IFRS) as issued by the International Accounting Standards Board.
For the years ended December 31, 2017 and 2016, Obsidian Energy has filed its reserves information under National Instrument 51-101 Standards of Disclosure of Oil and Gas Activities (NI 51-101), which prescribes the standards for the preparation and disclosure of reserves and related information for companies listed in Canada.
There are significant differences to the type of volumes disclosed and the basis from which the volumes are economically determined under the United States Securities and Exchange Commission (SEC) requirements and NI 51-101. The SEC requires disclosure of net reserves, after royalties, using 12-month average prices and current costs; whereas NI 51-101 requires gross reserves, before royalties, using forecast pricing and costs. Therefore, the difference between the reported numbers under the two disclosure standards can be material.
For the purposes of determining proved crude oil and natural gas reserves for SEC requirements as at December 31, 2017 and 2016 Obsidian Energy used the 12-month average price, defined by the SEC as the unweighted arithmetic average of the first-day-of-the-month price for each month within the 12-month period prior to the end of the reporting period.
NET PROVED OIL AND NATURAL GAS RESERVES
Obsidian Energy engaged independent qualified reserve evaluator, Sproule Associates Limited (Sproule), to evaluate Obsidian Energys proved developed and proved undeveloped oil and natural gas reserves. As at December 31, 2017, substantially all of Obsidian Energys oil and natural gas reserves are located in Canada. The changes in the Companys net proved reserve quantities are outlined below.
Net reserves include Obsidian Energys remaining working interest and royalty reserves, less all Crown, freehold, and overriding royalties and other interests that are not owned by Obsidian Energy.
Proved reserves are those estimated quantities of crude oil, natural gas and natural gas liquids that can be estimated with a high degree of certainty to be economically recoverable under existing economic and operating conditions.
Proved developed reserves are those proved reserves that are expected to be recovered from existing wells and installed facilities or, if facilities have not been installed, that would involve a low expenditure to put the reserves on production. Proved developed reserves may be subdivided into producing and non-producing.
Proved undeveloped reserves are those reserves that are expected to be recovered from known accumulations where a significant expenditure is required to render them capable of production.
Obsidian Energy cautions users of this information as the process of estimating crude oil and natural gas reserves is subject to a level of uncertainty. The reserves are based on economic and operating conditions; therefore, changes can be made to future assessments as a result of a number of factors, which can include new technology, changing economic conditions and development activity.
YEAR ENDED DECEMBER 31, 2017
CONSTANT PRICES AND COSTS
Net Proved Developed and Proved Undeveloped Reserves (1) |
Light and Medium Crude Oil (mmbbl) |
Heavy Crude Oil and Bitumen (mmbbl) |
Natural Gas (bcf) |
Natural Gas Liquids (mmbbl) |
Barrels of Oil Equivalent (mmboe) |
|||||||||||||||
December 31, 2016 |
43 | 7 | 164 | 4 | 81 | |||||||||||||||
Extensions & Discoveries |
2 | | 14 | 1 | 5 | |||||||||||||||
Improved Recovery & Infill Drilling |
1 | 1 | 2 | | 3 | |||||||||||||||
Technical Revisions |
5 | 1 | 60 | 3 | 19 | |||||||||||||||
Acquisitions |
| | | | | |||||||||||||||
Dispositions |
(7 | ) | | (76 | ) | (1 | ) | (21 | ) | |||||||||||
Production |
(4 | ) | (2 | ) | (26 | ) | (1 | ) | (12 | ) | ||||||||||
|
|
|
|
|
|
|
|
|
|
|||||||||||
Change for the year |
(3 | ) | | (26 | ) | 2 | (6 | ) | ||||||||||||
|
|
|
|
|
|
|
|
|
|
|||||||||||
December 31, 2017 |
41 | 7 | 138 | 5 | 76 | |||||||||||||||
|
|
|
|
|
|
|
|
|
|
|||||||||||
Developed |
32 | 5 | 119 | 4 | 62 | |||||||||||||||
Undeveloped |
9 | 1 | 20 | 1 | 14 | |||||||||||||||
|
|
|
|
|
|
|
|
|
|
|||||||||||
Total (2) |
41 | 7 | 138 | 5 | 76 | |||||||||||||||
|
|
|
|
|
|
|
|
|
|
(1) | Columns may not add due to rounding. |
(2) | Obsidian Energy does not file any estimates of total net proved crude oil or natural gas reserves with any U.S. federal authority or agency other than the SEC. |
YEAR ENDED DECEMBER 31, 2016
CONSTANT PRICES AND COSTS
Net Proved Developed and Proved Undeveloped Reserves (1) |
Light and Medium Crude Oil (mmbbl) |
Heavy Crude Oil and Bitumen (mmbbl) |
Natural Gas (bcf) |
Natural Gas Liquids (mmbbl) |
Barrels of Oil Equivalent (mmboe) |
|||||||||||||||
December 31, 2015 |
83 | 24 | 230 | 7 | 153 | |||||||||||||||
Extensions & Discoveries |
| | | | | |||||||||||||||
Improved Recovery & Infill Drilling |
| 1 | | | 2 | |||||||||||||||
Technical Revisions |
(1 | ) | 1 | 13 | | 3 | ||||||||||||||
Acquisitions |
| | 14 | | 2 | |||||||||||||||
Dispositions |
(32 | ) | (16 | ) | (49 | ) | (2 | ) | (58 | ) | ||||||||||
Production |
(8 | ) | (3 | ) | (44 | ) | (1 | ) | (20 | ) | ||||||||||
|
|
|
|
|
|
|
|
|
|
|||||||||||
Change for the year |
(41 | ) | (17 | ) | (66 | ) | (3 | ) | (71 | ) | ||||||||||
|
|
|
|
|
|
|
|
|
|
|||||||||||
December 31, 2016 |
43 | 7 | 164 | 4 | 81 | |||||||||||||||
|
|
|
|
|
|
|
|
|
|
|||||||||||
Developed |
37 | 6 | 152 | 4 | 72 | |||||||||||||||
Undeveloped |
6 | 1 | 12 | | 9 | |||||||||||||||
|
|
|
|
|
|
|
|
|
|
|||||||||||
Total (2) |
43 | 7 | 164 | 4 | 81 | |||||||||||||||
|
|
|
|
|
|
|
|
|
|
(1) | Columns may not add due to rounding. |
(2) | Obsidian Energy does not file any estimates of total net proved crude oil or natural gas reserves with any U.S. federal authority or agency other than the SEC. |
In both 2017 and 2016 Obsidian Energy closed a number of asset dispositions as it consolidated its asset portfolio and strengthened its balance sheet.
CAPITALIZED COSTS
As at December 31, ($CAD millions) |
2017 | 2016 | ||||||
Proved oil and gas properties |
$ | 10,636 | $ | 10,648 | ||||
Unproved oil and gas properties |
| | ||||||
|
|
|
|
|||||
Total capitalized costs |
10,636 | 10,648 | ||||||
Accumulated depletion and depreciation |
(7,817 | ) | (7,666 | ) | ||||
|
|
|
|
|||||
Net capitalized costs |
$ | 2,819 | $ | 2,982 | ||||
|
|
|
|
COSTS INCURRED
For the years ended December 31, ($CAD millions) | 2017 | 2016 | ||||||
Property acquisition (disposition) costs (1) |
||||||||
Proved oil and gas properties - acquisitions |
$ | 6 | $ | | ||||
Proved oil and gas properties - dispositions |
(116 | ) | (1,418 | ) | ||||
Unproved oil and gas properties |
3 | 2 | ||||||
Exploration costs (2) |
2 | 4 | ||||||
Development costs (3) |
184 | 114 | ||||||
Joint venture, carried capital |
(50 | ) | (40 | ) | ||||
|
|
|
|
|||||
Capital expenditures |
29 | (1,338 | ) | |||||
Corporate acquisitions |
| 3 | ||||||
|
|
|
|
|||||
Total expenditures |
$ | 29 | $ | (1,335 | ) | |||
|
|
|
|
(1) | Acquisitions are net of disposition of properties. |
(2) | Cost of geological and geophysical capital expenditures and costs on exploratory plays. |
(3) | Includes equipping and facilities capital expenditures. |
STANDARDIZED MEASURE OF DISCOUNTED FUTURE NET CASH FLOWS AND CHANGES THEREIN
The standardized measure of discounted future net cash flows is based on estimates made by Sproule of net proved reserves. Future cash inflows are computed based on constant prices and cost assumptions from annual future production of proved crude oil and natural gas reserves. Future development and production costs are based on constant price assumptions and assume the continuation of existing economic conditions. Constant prices are calculated as the average of the first day prices of each month for the prior 12-month calendar period. Deferred income taxes are calculated by applying statutory income tax rates in effect at the end of the fiscal period. Obsidian Energy is currently not cash taxable. The standardized measure of discounted future net cash flows is computed using a 10 percent discount factor.
Obsidian Energy cautions users of this information that the discounted future net cash flows relating to proved crude oil and natural gas reserves are neither an indication of the fair market value of our oil and gas properties, nor of the future net cash flows expected to be generated from such properties. The discounted future cash flows do not include the fair market value of exploratory properties and probable or possible oil and gas reserves, nor is consideration given to the effect of anticipated future changes in crude oil and natural gas prices, development, asset retirement and production costs and possible changes to tax and royalty regulations. The prescribed discount rate of 10 percent is arbitrary and may not reflect applicable future interest rates.
STANDARD MEASURE OF DISCOUNTED FUTURE NET CASH FLOWS
For the years ended December 31, ($CAD millions) |
2017 | 2016 | ||||||
Future cash inflows |
$ | 3,384 | $ | 2,885 | ||||
Future production costs |
(1,625 | ) | (1,545 | ) | ||||
Future development costs |
(302 | ) | (223 | ) | ||||
|
|
|
|
|||||
Undiscounted pre-tax cash flows |
1,457 | 1,117 | ||||||
Deferred income taxes (1) |
| | ||||||
|
|
|
|
|||||
Future net cash flows |
1,457 | 1,117 | ||||||
Less 10% annual discount factor |
(661 | ) | (486 | ) | ||||
|
|
|
|
|||||
Standardized measure of discounted future net cash flows |
$ | 796 | $ | 631 | ||||
|
|
|
|
(1) | Obsidian Energy is currently not cash taxable. |
STANDARD MEASURE OF DISCOUNTED FUTURE NET CASH FLOW CHANGES
For the years ended December 31, ($CAD millions) |
2017 | 2016 | ||||||
Standardized measure of discounted future net cash flows at beginning of year |
$ | 631 | $ | 1,307 | ||||
Oil and gas sales during period net of production costs and royalties (1) |
(213 | ) | (336 | ) | ||||
Changes due to prices (2) |
481 | (449 | ) | |||||
Development costs during the period (3) |
141 | 83 | ||||||
Changes in forecast development costs (4) |
(202 | ) | 5 | |||||
Changes resulting from extensions, infills and improved recovery (5) |
73 | 27 | ||||||
Changes resulting from discoveries (2) |
1 | | ||||||
Changes resulting from acquisitions of reserves (5) |
| 8 | ||||||
Changes resulting from dispositions of reserves (5) |
(71 | ) | (578 | ) | ||||
Accretion of discount (6) |
63 | 131 | ||||||
Net change in income tax (7) |
| | ||||||
Changes resulting from other changes and technical reserves revisions plus effects on timing (8) |
(109 | ) | 433 | |||||
|
|
|
|
|||||
Standardized measure of discounted future net cash flows at end of year |
$ | 796 | $ | 631 | ||||
|
|
|
|
(1) | Company actual before income taxes, excluding general and administrative expenses. |
(2) | The impact of changes in prices and other economic factors on future net revenue. |
(3) | Actual capital expenditures relating to the exploration, development and production of oil and gas reserves. |
(4) | The change in forecast development costs. |
(5) | End of period net present value of the related reserves. |
(6) | Estimated as 10 percent of the beginning of period net present value. |
(7) | The difference between forecast income taxes at beginning of period and the actual taxes for the period plus forecast income taxes at the end of period. |
(8) | Includes changes due to revised production profiles, development timing, operating costs, royalty rates and actual prices received versus forecast, etc. |
Exhibit 99.5
CERTIFICATION PURSUANT TO RULE 13a-14 OR 15d-14 OF THE
SECURITIES EXCHANGE ACT OF 1934
I, David L. French, certify that:
1. | I have reviewed this annual report on Form 40-F of Obsidian Energy Ltd.; |
2. | Based on my knowledge, this report does not contain any untrue statement of a material fact or omit to state a material fact necessary to make the statements made, in light of the circumstances under which such statements were made, not misleading with respect to the period covered by this report; |
3. | Based on my knowledge, the financial statements, and other financial information included in this report, fairly present in all material respects the financial condition, results of operations and cash flows of the issuer as of, and for, the periods presented in this report; |
4. | The issuers other certifying officer and I are responsible for establishing and maintaining disclosure controls and procedures (as defined in Exchange Act Rules 13a-15(e) and 15d-15(e)) and internal control over financial reporting (as defined in Exchange Act Rules 13a-15(f) and 15d-15(f)) for the issuer and have: |
(a) | Designed such disclosure controls and procedures, or caused such disclosure controls and procedures to be designed under our supervision, to ensure that material information relating to the issuer, including its consolidated subsidiaries, is made known to us by others within those entities, particularly during the period in which this report is being prepared; |
(b) | Designed such internal control over financial reporting, or caused such internal control over financial reporting to be designed under our supervision, to provide reasonable assurance regarding the reliability of financial reporting and the preparation of financial statements for external purposes in accordance with generally accepted accounting principles; |
(c) | Evaluated the effectiveness of the issuers disclosure controls and procedures and presented in this report our conclusions about the effectiveness of the disclosure controls and procedures, as of the end of the period covered by this report based on such evaluation; and |
(d) | Disclosed in this report any change in the issuers internal control over financial reporting that occurred during the period covered by the annual report that has materially affected, or is reasonably likely to materially affect, the issuers internal control over financial reporting; and |
5. | The issuers other certifying officer and I have disclosed, based on our most recent evaluation of internal control over financial reporting, to the issuers auditors and the audit committee of the issuers board of directors (or persons performing the equivalent function): |
(a) | All significant deficiencies and material weaknesses in the design or operation of internal control over financial reporting which are reasonably likely to adversely affect the issuers ability to record, process, summarize and report financial information; and |
(b) | Any fraud, whether or not material, that involves management or other employees who have a significant role in the issuers internal control over financial reporting. |
Dated: March 7, 2018
/s/ David L. French |
David L. French |
President and Chief Executive Officer |
Exhibit 99.6
CERTIFICATION PURSUANT TO RULE 13a-14 OR 15d-14 OF THE SECURITIES
EXCHANGE ACT OF 1934
I, David Hendry, certify that:
1. | I have reviewed this annual report on Form 40-F of Obsidian Energy Ltd.; |
2. | Based on my knowledge, this report does not contain any untrue statement of a material fact or omit to state a material fact necessary to make the statements made, in light of the circumstances under which such statements were made, not misleading with respect to the period covered by this report; |
3. | Based on my knowledge, the financial statements, and other financial information included in this report, fairly present in all material respects the financial condition, results of operations and cash flows of the issuer as of, and for, the periods presented in this report; |
4. | The issuers other certifying officer and I are responsible for establishing and maintaining disclosure controls and procedures (as defined in Exchange Act Rules 13a-15(e) and 15d-15(e)) and internal control over financial reporting (as defined in Exchange Act Rules 13a-15(f) and 15d-15(f)) for the issuer and have: |
(a) | Designed such disclosure controls and procedures, or caused such disclosure controls and procedures to be designed under our supervision, to ensure that material information relating to the issuer, including its consolidated subsidiaries, is made known to us by others within those entities, particularly during the period in which this report is being prepared; |
(b) | Designed such internal control over financial reporting, or caused such internal control over financial reporting to be designed under our supervision, to provide reasonable assurance regarding the reliability of financial reporting and the preparation of financial statements for external purposes in accordance with generally accepted accounting principles; |
(c) | Evaluated the effectiveness of the issuers disclosure controls and procedures and presented in this report our conclusions about the effectiveness of the disclosure controls and procedures, as of the end of the period covered by this report based on such evaluation; and |
(d) | Disclosed in this report any change in the issuers internal control over financial reporting that occurred during the period covered by the annual report that has materially affected, or is reasonably likely to materially affect, the issuers internal control over financial reporting; and |
5. | The issuers other certifying officer and I have disclosed, based on our most recent evaluation of internal control over financial reporting, to the issuers auditors and the audit committee of the issuers board of directors (or persons performing the equivalent function): |
(a) | All significant deficiencies and material weaknesses in the design or operation of internal control over financial reporting which are reasonably likely to adversely affect the issuers ability to record, process, summarize and report financial information; and |
(b) | Any fraud, whether or not material, that involves management or other employees who have a significant role in the issuers internal control over financial reporting. |
Dated: March 7, 2018
/s/ David Hendry |
David Hendry |
Chief Financial Officer |
Exhibit 99.7
CERTIFICATION PURSUANT TO
18 U.S.C. SECTION 1350,
AS ADOPTED PURSUANT TO
SECTION 906 OF THE SARBANES-OXLEY ACT OF 2002
In connection with the Annual Report of Obsidian Energy Ltd. (the Company) on Form 40-F for the year ended December 31, 2017, as filed with the Securities and Exchange Commission on the date hereof (the Report), I, David L. French, President and Chief Executive Officer of the Company, certify, pursuant to 18 U.S.C. section 1350, as adopted pursuant to Section 906 of the Sarbanes-Oxley Act of 2002, that to the best of my knowledge:
1. | The Report fully complies with the requirements of section 13(a) or 15(d) of the Securities Exchange Act of 1934; and |
2. | The information contained in the Report fairly presents, in all material respects, the financial condition and results of operations of the Company. |
By: | /s/ David L. French | |
David L. French | ||
President and Chief Executive Officer |
March 7, 2018
Exhibit 99.8
CERTIFICATION PURSUANT TO
18 U.S.C. SECTION 1350,
AS ADOPTED PURSUANT TO
SECTION 906 OF THE SARBANES-OXLEY ACT OF 2002
In connection with the Annual Report of Obsidian Energy Ltd. (the Company) on Form 40-F for the year ended December 31, 2017, as filed with the Securities and Exchange Commission on the date hereof (the Report), I, David Hendry, Chief Financial Officer of the Company, certify, pursuant to 18 U.S.C. section 1350, as adopted pursuant to Section 906 of the Sarbanes-Oxley Act of 2002, that to the best of my knowledge:
1. | The Report fully complies with the requirements of section 13(a) or 15(d) of the Securities Exchange Act of 1934; and |
2. | The information contained in the Report fairly presents, in all material respects, the financial condition and results of operations of the Company. |
By: | /s/ David Hendry | |
David Hendry | ||
Chief Financial Officer |
March 7, 2018
Exhibit 99.9
CONSENT OF INDEPENDENT REGISTERED PUBLIC ACCOUNTING FIRM
To the Directors and Shareholders of Obsidian Energy Ltd.
We consent to the use of our reports dated March 6, 2018 with respect to the consolidated financial statements of Obsidian Energy Ltd., which comprise the consolidated balance sheets as at December 31, 2017 and 2016, and the consolidated statements of income (loss), changes in shareholders equity and cash flows for each of the years in the two year period ended December 31, 2017, and a summary of significant accounting policies and other explanatory information, and the effectiveness of internal control over financial reporting of Obsidian Energy Ltd. as at December 31, 2017, included in an exhibit to the Annual Report (Form 40-F) for the year ended December 31, 2017.
Calgary, Canada
March 7, 2018
Exhibit 99.10
March 07, 2018
Securities and Exchange Commission (SEC)
Re: | Evaluation of the P&NG Reserves of Obsidian Energy Ltd. |
(As of December 31, 2017) |
We refer to our report dated January 29, 2018 entitled Evaluation of the P&NG Reserves of Obsidian Energy Ltd. (Obsidian Energy) (As of December 31, 2017) (the Sproule Report).
We hereby consent to the inclusion of, or incorporation by, reference of and reference to, the Sproule Report in Obsidian Energys:
(i) | Annual Report on Form 40-F for the year ended December 31, 2017 |
(ii) | press release regarding 2017 year-end results; |
(collectively, the Disclosure Documents).
We have read the Disclosure Documents and have no reason to believe that there are any misrepresentations in the information contained therein that is derived from the Report, or that is within our knowledge as a result of the services performed by us in connection with the Report.
Sincerely, |
Sproule Associates Limited |
Original Signed by Gary R. Finnis, P.Eng. |
Gary R. Finnis, P.Eng. |
Senior Manager, Engineering |
140 Fourth Avenue SW, Suite 900 Calgary, AB, Canada T2P 3N3 Sproule.com T +1 403 294 5500 F +1 403 294 5590 TF +1 877 777 6135 |
M244 9ZZ)H\(M]NEV,8M
MFS!BW0>43_=X^4_2IH-,T^U:5K>QMHFE<22&.%5+L/XC@ D!
M\@'Z @,"# (4 AT")@(O C@"00)+ E0"70)G G$">@*$ HX"F *B JP"M@+!
M LL"U0+@ NL"]0, PL#%@,A RT#. -# T\#6@-F W(#?@.* Y8#H@.N [H#
MQP/3 ^ #[ /Y! 8$$P0@!"T$.P1(!%4$8P1Q!'X$C 2:!*@$M@3$!-,$X03P
M!/X%#044%]@8&!A8&)P8W!D@&
M609J!GL&C :=!J\&P ;1!N,&]0<'!QD'*P<]!T\'80=T!X8'F0>L![\'T@?E
M!_@("P@?"#((1@A:"&X(@@B6"*H(O@C2".<(^PD0"24).@E/"60)>0F/":0)
MN@G/">4)^PH1"B<*/0I4"FH*@0J8"JX*Q0K<"O,+"PLB"SD+40MI"X +F NP
M"\@+X0OY#!(,*@Q##%P,=0R.#*<,P S9#/,-#0TF#4 -6@UT#8X-J0W##=X-
M^ X3#BX.20YD#G\.FPZV#M(.[@\)#R4/00]>#WH/E@^S#\\/[! )$"800Q!A
M$'X0FQ"Y$-<0]1$3$3$13Q%M$8P1JA')$>@2!Q(F$D429!*$$J,2PQ+C$P,3
M(Q-#$V,3@Q.D$\43Y10&%"<4211J%(L4K13.%/ 5$A4T%585>!6;%;T5X!8#
M%B86219L%H\6LA;6%OH7'1=!%V47B1>N%](7]Q@;&$ 891B*&*\8U1CZ&2 9
M11EK&9$9MQG=&@0:*AI1&G<:GAK%&NP;%!L[&V,;BANR&]H< APJ'%(<>QRC
M',P<]1T>'4<=:AZ4'KX>Z1\3'SX?:1^4'[\?ZB 5($$@
M;""8(,0@\"$<(4@A=2&A( &YXS'DJ>8EYYWI&
M>J5[!'MC>\)\(7R!?.%]07VA?@%^8G["?R-_A'_E@$> J($*@6N!S8(P@I*"
M](-7@[J$'82 A..%1X6KA@Z&
1. Structure of Obsidian Energy
Obsidian Energy Ltd. (“Obsidian Energy” or the
“Company”) is an exploration and production company and
is governed by the laws of the Province of Alberta, Canada. The
Company operates in one segment, to explore for, develop and hold
interests in oil and natural gas properties and related production
infrastructure in the Western Canada Sedimentary Basin directly and
through investments in securities of subsidiaries holding such
interests. Obsidian Energy’s portfolio of assets is managed
at an enterprise level, rather than by separate operating segments
or business units. The Company assesses its financial performance
at the enterprise level and resource allocation decisions are made
on a project basis across its portfolio of assets, without regard
to the geographic location of projects. Obsidian Energy owns
the petroleum and natural gas assets or 100 percent of the
equity, directly or indirectly, of the entities that carry on the
remainder of the oil and natural gas business of Obsidian Energy,
except for an unincorporated joint arrangement (the “Peace
River Oil Partnership”) in which Obsidian Energy’s
wholly owned subsidiaries hold a 55 percent interest.
Name change
Effective June 26, 2017, the Company obtained shareholder
approval to change its name from Penn West Petroleum Ltd. to
Obsidian Energy Ltd.
2. Basis of presentation and statement of compliance
a) Statement of Compliance
These annual consolidated financial statements are prepared in
compliance with International Financial Reporting Standards
(“IFRS”) as issued by the International Accounting
Standards Board.
The annual consolidated financial statements have been prepared on
a historical cost basis, except risk management assets and
liabilities which are recorded at fair value as discussed in Note
10.
The annual consolidated financial statements of the Company for the
year ended December 31, 2017 were approved for issuance by the
Board of Directors on March 6, 2018.
b) Basis of Presentation
The annual consolidated financial statements include the accounts
of Obsidian Energy, its wholly owned subsidiaries and its
proportionate interest in partnerships. Results from acquired
properties are included in Obsidian Energy’s reported results
subsequent to the closing date and results from properties sold are
included until the closing date.
All intercompany balances, transactions, income and expenses are
eliminated on consolidation.
Certain comparative figures have been reclassified to correspond
with current period presentation.
3. Significant accounting policies
a) Critical accounting judgments and key estimates
The preparation of the consolidated financial statements in
conformity with IFRS requires management to make estimates and
assumptions that affect the recorded amounts of assets and
liabilities, disclosure of any contingent assets and liabilities at
the date of the financial statements and the reported amounts of
revenues and expenses for the period. These and other estimates are
subject to measurement uncertainty and the effect on the
consolidated financial statements of changes in these estimates
could be material.
Management also makes judgments while applying accounting policies
that could affect amounts recorded in its consolidated financial
statements. Significant judgments include the identification of
cash generating units (“CGUs”) for impairment testing
purposes and determining whether a CGU has an impairment
indicator.
The following are the estimates that management has made in
applying the Company’s accounting policies that have the most
significant effect on the amounts recognized in the consolidated
financial statements.
i) Reserve estimates
Commercial petroleum reserves are determined based on estimates of
petroleum-in-place, recovery
factors and future oil and natural gas prices and costs. Obsidian
Energy engages an independent qualified reserve evaluator to
evaluate all of the Company’s oil and natural gas reserves at
each year-end.
Reserve adjustments are made annually based on actual oil and
natural gas volumes produced, the results from capital programs,
revisions to previous estimates, new discoveries and acquisitions
and dispositions made during the year and the effect of changes in
forecast future crude oil and natural gas prices. There are a
number of estimates and assumptions that affect the process of
evaluating reserves.
Proved reserves are the estimated quantities of crude oil, natural
gas and natural gas liquids determined to be economically
recoverable under existing economic and operating conditions with a
high degree of certainty (at least 90 percent) those quantities
will be exceeded. Proved plus probable reserves are the estimated
quantities of crude oil, natural gas and natural gas liquids
determined to be economically recoverable under existing economic
and operating conditions with a 50 percent certainty those
quantities will or will not be exceeded. Obsidian Energy reports
production and reserve quantities in accordance with Canadian
practices and specifically in accordance with “Standards of
Disclosure for Oil and Gas Activities” (“NI
51-101”).
The estimate of proved plus probable reserves is an essential part
of the depletion calculation, the impairment test and hence the
recorded amount of oil and gas assets.
Contingent Resources are defined in the COGE Handbook as those
quantities of petroleum estimated to be potentially recoverable
from known accumulations using established technology or technology
under development, but which do not currently qualify as Reserves
or commercially recoverable due to one or more contingencies.
Contingencies may include factors such as economic, legal,
environmental, operational, political and regulatory matters or a
lack of markets. The estimate of contingent resources may be
included as part of the recoverable amount in the impairment
test.
Obsidian Energy cautions users of this information that the process
of estimating crude oil and natural gas reserves is subject to a
level of uncertainty. The reserves are based on current and
forecast economic and operating conditions; therefore, changes can
be made to future assessments as a result of a number of factors,
which can include commodity prices, new technology, changing
economic conditions, future reservoir performance and forecast
development activity.
ii) Recoverability of asset carrying values
Obsidian Energy assesses its property, plant and equipment
(“PP&E”) for impairment by comparing the carrying
amount to the recoverable amount of the underlying assets. The
determination of the recoverable amount involves estimating the
higher of an asset’s fair value less costs to sell or its
value-in-use, the latter of
which is based on its discounted future cash flows using an
applicable discount rate. Future cash flows are calculated based on
estimates of future commodity prices and inflation and are
discounted based on management’s current assessment of market
conditions.
iii) Decommissioning liability
Obsidian Energy recognizes a provision for future abandonment
activities in the consolidated financial statements at the net
present value of the estimated future expenditures required to
settle the estimated obligation at the balance sheet date. The
measurement of the decommissioning liability involves the use of
estimates and assumptions including the discount rate, the amount
and expected timing of future abandonment costs and the inflation
rate related thereto. The estimates were made by management and
external consultants considering current costs, technology and
enacted legislation.
iv) Office lease liability
Obsidian Energy recognizes a provision for certain onerous office
lease commitments in the consolidated financial statements at the
net present value of future lease payments the Company is obligated
to make under non-cancellable lease contracts less
recoveries under current sub-lease agreements. The measurement
of the office lease liability involves the use assumptions
including the discount rate, actual settlement amounts and
estimates of future recoveries. Actual costs and cash outflows may
differ from the estimates as a result of the changes in the noted
assumptions.
v) Fair value calculation on share-based payments
The fair value of share-based payments is calculated using a
Black-Scholes model. There are a number of estimates used in the
calculation such as the expected future forfeiture rate, the
expected period the share-based compensation is outstanding and the
future price volatility of the underlying security all of which can
vary from expectations. The factors applied in the calculation are
management’s estimates based on historical information and
future forecasts.
vi) Fair value of risk management contracts
Obsidian Energy records risk management contracts at fair value
with changes in fair value recognized in income. The fair values
are determined using external counterparty information which is
compared to observable market data.
vii) Taxation
The calculation of deferred income taxes is based on a number of
assumptions including estimating the future periods in which
temporary differences and other tax credits will reverse and the
general assumption that substantively enacted future tax rates at
the balance sheet date will be in effect when differences
reverse.
viii) Litigation
Obsidian Energy records provisions related to legal matters if it
is probable that the Company will not be successful in defending
the claim and if an amount can be reasonably estimated. Determining
the probability of a claim being defended is subject to
considerable judgment. Additionally, the potential claim is
generally a wide range of figures and a single estimate must be
made when recording a provision. Contingencies will only be
resolved or unfounded when one or more future events occur. The
assessment of contingencies involves significant judgment and
estimates of the potential outcome of future events.
b) Business combinations
Obsidian Energy uses the acquisition method to account for business
combinations. The net identifiable assets and liabilities acquired
in transactions are generally measured at their fair value on the
acquisition date. The acquisition date is the closing date of the
business combination. Acquisition costs incurred by Obsidian Energy
to complete a business combination are expensed in the period
incurred except for costs related to the issue of any debt or
equity securities, which are recognized based on the nature of the
related financing instrument.
Revisions may be made to the initial recognized amounts determined
during the measurement period, which shall not exceed one year
after the close date of the acquisition.
c) Revenue
Obsidian Energy generally recognizes oil and natural gas revenue
when title passes from Obsidian Energy to the purchaser or, in the
case of services, as contracted services are performed.
Revenue is measured at the fair value of the consideration received
or receivable. Revenue from the sale of crude oil, natural gas and
natural gas liquids (prior to deduction of transportation costs) is
recognized when all the following conditions have been
satisfied:
d) Joint arrangements
The consolidated financial statements include Obsidian
Energy’s proportionate interest of jointly controlled assets
and liabilities and its proportionate interest of the revenue,
royalties and operating expenses. A significant portion of Obsidian
Energy’s exploration and development activities are conducted
jointly with others and involve joint operations. Under such
arrangements, Obsidian Energy has the exclusive rights to its
proportionate interest in the assets and the economic benefits
generated from its share of the assets. Income from the sale or use
of Obsidian Energy’s interest in joint operations and its
share of expenses is recognized when it is probable that the
economic benefits associated with the transactions will flow
to/from Obsidian Energy and the amounts can be reliably
measured.
The Peace River Oil Partnership is a joint operation and Obsidian
Energy records its 55 percent interest of revenues, expenses,
assets and liabilities.
e) Transportation expense
Transportation costs are paid by Obsidian Energy for the shipping
of natural gas, crude oil and natural gas liquids from the wellhead
to the point of title transfer to buyers. These costs are
recognized as services are received.
f) Foreign currency translation
Obsidian Energy and each of its subsidiaries use the Canadian
dollar as their functional currency. Monetary items, such as
accounts receivable and long-term debt, are translated to Canadian
dollars at the rate of exchange in effect at the balance sheet
date. Non-monetary items,
such as PP&E, are translated to Canadian dollars at the rate of
exchange in effect when the associated transactions occurred.
Revenues and expenses denominated in foreign currencies are
translated at the exchange rate on the date of the transaction.
Foreign exchange gains or losses on translation are included in
income.
g) PP&E
i) Measurement and recognition
Oil & Gas properties are included in PP&E at cost,
less accumulated depletion and depreciation and any impairment
losses. The cost of PP&E includes costs incurred initially to
acquire or construct the item and betterment costs.
Capital expenditures are recognized as PP&E when it is probable
that future economic benefits associated with the investment will
flow to Obsidian Energy and the cost can be reliably measured.
PP&E includes capital expenditures incurred in the development
phases, acquisition and disposition of PP&E and additions to
the decommissioning liability.
ii) Depletion and Depreciation
Except for components with a useful life shorter than the reserve
life of the associated property, resource properties are depleted
using the unit-of-production method based
on production volumes before royalties in relation to total proved
plus probable reserves. Natural gas volumes are converted to
equivalent oil volumes based upon the relative energy content of
six thousand cubic feet of natural gas to one barrel of oil. In
determining its depletion base, Obsidian Energy includes estimated
future costs to develop proved plus probable reserves and excludes
estimated equipment salvage values. Changes to reserve estimates
are included in the depletion calculation prospectively.
Components of PP&E that are not depleted using the unit-of-production method are
depreciated on a straight-line basis over their useful life. The
turnaround component has an estimated useful life of three to five
years and the corporate asset component has an estimated useful
life of 10 years.
iii) Derecognition
The carrying amount of an item of PP&E is derecognized when no
future economic benefits are expected from its use or upon sale to
a third party. The gain or loss arising from derecognition is
included in income and is measured as the difference between the
net proceeds, if any, and the carrying amount of the asset.
iv) Major maintenance and repairs
Ongoing costs to maintain properties are generally expensed as
incurred. These costs include the cost of labour, consumables and
small parts. The costs of material replacement parts, turnarounds
and major inspections are capitalized provided it is probable that
future economic benefits in excess of cost will be realized and
such benefits are expected to extend beyond the current operating
period. The carrying amount of a replaced part is derecognized in
accordance with Obsidian Energy’s derecognition policies.
v) Impairment of oil and natural gas properties
Obsidian Energy reviews oil and gas properties for circumstances
that indicate its assets may be impaired at the end of each
reporting period. These indicators can be internal (i.e. reserve
changes) or external (i.e. market conditions) in nature. If an
indication of impairment exists, Obsidian Energy completes an
impairment test, which compares the estimated recoverable amount to
the carrying value. The estimated recoverable amount is defined
under IAS 36 (“Impairment of Assets”) as the higher of
an asset’s or CGU’s fair value less costs to sell and
its value-in-use.
Where the recoverable amount is less than the carrying amount, the
CGU is considered to be impaired. Impairment losses identified for
a CGU are allocated on a pro rata basis to the asset categories
within the CGU. The impairment loss is recognized as an expense in
income.
Value-in-use is computed as the
present value of future cash flows expected to be derived from
production. Present values are calculated using a pre-tax discount rate that reflects
current market assessments of the time value of money and the risks
specific to the asset. Under the fair value less cost to sell
method the recoverable amount is determined using various factors,
which can include external factors such as observable market
conditions and comparable transactions and internal factors such as
discounted cash flows related to reserve and resource studies and
future development plans.
Impairment losses related to PP&E can be reversed in future
periods if the estimated recoverable amount of the asset exceeds
the carrying value. The impairment recovery is limited to a maximum
of the estimated depleted historical cost if the impairment had not
been recognized. The reversal of the impairment loss is recognized
in depletion, depreciation and impairment.
vi) Other Property, Plant and Equipment
Obsidian Energy’s corporate assets include computer hardware
and software, office furniture, buildings and leasehold
improvements and are depreciated on a straight-line basis over
their useful lives. Corporate assets are tested for impairment
separately from oil and gas assets.
h) Share-based payments
The fair value of units granted under the Restricted and
Performance Share Unit Plan (“RPSU”) following the
equity method are recognized as compensation expense with a
corresponding increase to other reserves in shareholders’
equity over the term of the units based on a graded vesting
schedule. Obsidian Energy measures the fair value of units granted
under this plan at the grant date using the share price from the
Toronto Stock Exchange (“TSX”). The fair value is based
on market prices and considers the terms and conditions of the
units granted.
The fair value of options granted under the Stock Option Plan (the
“Option Plan”) are recognized as compensation expense
with a corresponding increase to other reserves in
shareholders’ equity over the term of the options based on a
graded vesting schedule. Obsidian Energy measures the fair value of
options granted under these plans at the grant date using the
Black-Scholes option-pricing model. The fair value is based on
market prices and considers the terms and conditions of the share
options granted.
The fair value of awards granted under the Deferred Share Unit Plan
(“DSU”), Performance Share Unit Plan
(“PSU”) and the RPSU Plan following the liability
method are based on a fair value calculation on each reporting date
using the awards outstanding and Obsidian Energy’s share
price from the TSX on each balance sheet date. The fair value of
the awards is expensed over the vesting period based on a graded
vesting schedule. Subsequent increases and decreases in the
underlying share price result in increases and decreases,
respectively, to the accrued obligation until the related
instruments are settled.
i) Provisions
i) General
Provisions are recognized based on an estimate of expenditures
required to settle present obligations at the end of the reporting
period. The provision is risk adjusted to take into account any
uncertainties. When the effect of the time value of money is
material, the amount of a provision is calculated as the present
value of the future expenditures required to settle the
obligations. The discount rate reflects the current assessment of
the time value of money and risks specific to the liability when
those risks have not already been reflected as an adjustment to
future cash flows.
ii) Decommissioning liability
The decommissioning liability is the present value of Obsidian
Energy’s future costs of obligations for property, facility
and pipeline abandonment and site restoration. The liability is
recognized on the balance sheet with a corresponding increase to
the carrying amount of the related asset. The recorded liability
increases over time to its future amount through accretion charges
to income. Revisions to the estimated amount or timing of the
obligations are reflected prospectively as increases or decreases
to the recorded liability and the related asset. Actual
decommissioning expenditures, up to the recorded liability at the
time, are charged to the liability as the costs are incurred.
Amounts capitalized to the related assets are amortized to income
consistent with the depletion or depreciation of the underlying
asset.
iii) Office lease liability
The office lease liability is the net present value of future lease
payments Obsidian Energy is obligated to make under non-cancellable lease contracts less
recoveries under current sub-lease agreements. The liability is
recognized on the balance sheet with the corresponding change
charged to income. The recorded liability increases over time to
its future amount through accretion charges to income. Revisions to
the estimated amount or timing of the obligations are reflected
prospectively as increases or decreases to the recorded liability.
Actual lease payments less sub-lease recoveries are charged to
the liability as the costs are incurred.
j) Leases
A lease is classified as an operating lease if it does not transfer
substantially all of the risks and rewards incidental to ownership
of the related asset to the lessee. Operating lease payments are
expensed on a straight-line basis over the life of the lease.
k) Share capital
Common shares are classified as equity. Share issue costs are
recorded in shareholder’s equity, net of applicable taxes.
Dividends are paid at the discretion of the Board of Directors and
are deducted from retained earnings.
If issued, preferred shares would be classified as equity and could
be issued in one or more series.
l) Earnings per share
Earnings per share is calculated by dividing net income or loss
attributable to the shareholders by the weighted average number of
common shares outstanding during the period. Obsidian Energy
computes the dilutive impact of equity instruments other than
common shares assuming the proceeds received from the exercise of
in-the-money share options are
used to purchase common shares at average market prices.
m) Taxation
Income taxes are based on taxable income in a taxation year.
Taxable income normally differs from income reported in the
consolidated statement of income as it excludes items of income or
expense that are taxable or deductible in other years or are not
taxable or deductible for income tax purposes.
Obsidian Energy uses the liability method of accounting for
deferred income taxes. Temporary differences are calculated
assuming that the financial assets and liabilities will be settled
at their carrying amount. Deferred income taxes are computed on
temporary differences using substantively enacted income tax rates
expected to apply when deferred income tax assets and liabilities
are realized or settled.
A deferred income tax asset is recognized to the extent that it is
probable that future taxable income will be available against which
the deductible temporary differences can be utilized. Deferred
income tax assets are reviewed at each reporting date and are not
recognized until such time that it is more likely than not that the
related tax benefit will be realized.
n) Financial instruments
Financial instruments are measured at fair value and recorded on
the balance sheet upon initial recognition of an instrument.
Subsequent measurement and changes in fair value will depend on
initial classification, as follows:
Obsidian Energy’s current classifications are as follows:
Obsidian Energy assesses each financial instrument, except those
valued at fair value through profit or loss, for impairment at the
reporting date and records the gain or loss in income during the
period.
o) Embedded derivatives
An embedded derivative is a component of a contract that affects
the terms of another factor, for example, rent costs that fluctuate
with oil prices. These “hybrid” contracts are
considered to consist of a “host” contract plus an
embedded derivative. The embedded derivative is separated from the
host contract and accounted for as a derivative if the following
conditions are met:
p) Classification of debt or equity
Obsidian Energy classifies financial liabilities and equity
instruments in accordance with the substance of the contractual
arrangement and the definitions of a financial liability or an
equity instrument.
Obsidian Energy’s debt instruments currently have
requirements to deliver cash at the end of the term thus are
classified as liabilities.
q) Future accounting pronouncements
The IASB issued IFRS 15 “Revenue from Contracts with
Customers” which replaces IAS 18 “Revenue”. IFRS
15 specifies revenue recognition criteria and expanded disclosures
for revenue. The new standard is effective for annual periods
beginning on or after January 1, 2018. The Company has
completed its assessment of the standard and adopted the standard
retrospectively on January 1, 2018. The Company has also
concluded that the adoption of IFRS 15 will not have a material
impact on its financial statements. Obsidian Energy will expand its
disclosures in the notes to the financial statements as outlined in
IFRS 15.
The IASB completed the final sections of IFRS 9 “Financial
Instruments” which replaces IAS 39 “Financial
Statement: Recognition and Measurement”. IFRS 9 provides
guidance on the recognition and measurement, impairment and
derecognition on financial instruments. The new standard is
effective for annual periods beginning on or after January 1,
2018. The Company has concluded that the adoption of IFRS 9 will
not result in any material changes in the measurement and carrying
value of the Company’s financial instruments.
The IASB issued IFRS 16 “Leases” in January 2016 which
replaces IAS 17 “Leases”. IFRS 16 outlines several new
requirements in regards to the recognition, measurement and
disclosure of leases. A key principle within the standard includes
a single lessee accounting model which requires lessees to
recognise assets and liabilities for all leases which have a term
more than 12 months. The accounting for lessors, which classify
leases as either operating or finance, remains substantially
unchanged from the previous standard. The new standard is effective
for annual reporting periods beginning on or after January 1,
2019. Obsidian Energy is currently assessing the impact of the
standard.
4. Working capital
Accounts receivable
Obsidian Energy continuously monitors credit risk and maintains
credit policies to ensure collection risk is limited. Receivables
are primarily with customers in the oil and gas industry and are
subject to normal industry credit risk. Receivables over 90 days
are classified as past due and are assessed for collectability. If
an amount is deemed to be uncollectible, it is expensed through
income.
As at December 31, based on Obsidian Energy’s credit
assessments, provisions have been made for amounts deemed
uncollectible. As at December 31, the following accounts
receivable amounts were outstanding.
2017
2016
5. Deferred funding asset
Deferred funding amounts relate to Obsidian Energy’s share of
capital and operating expenses to be funded by the Company’s
partner in the Peace River Oil Partnership. Amounts expected to be
settled within the next 12 months are classified as current. The
Company fully utilized the deferred funding asset in the fourth
quarter of 2017 and expects payment from its partner during the
first quarter of 2018.
Current portion
Long-term portion
Total
6. Assets and liabilities held for sale
Assets and liabilities classified as held for sale consisted of the
following:
Assets held for sale
Working capital
Property, plant and equipment
Liabilities related to assets held for sale
Working capital
Decommissioning liability
During the fourth quarter of 2017, as a result of entering into a
definitive sale agreement, the Company classified certain
non-core legacy assets
located in Central Alberta as assets held for sale at
December 31, 2017. The transaction closed in January 2018.
At December 31, 2017, these assets were recorded at the lower
of fair value less costs to sell and their carrying amount,
resulting in a PP&E impairment loss of $12 million (2016 -
$65 million). The impairment expense has been recorded as
additional depletion, depreciation, impairment and accretion on the
Consolidated Statements of Loss.
In 2016, the Company entered into definitive sales agreements
during the fourth quarter and classified all of its assets located
in British Columbia and certain assets located in the Swan Hills
area of Alberta as assets held for sale at December 31, 2016.
In January 2017, two of these transactions closed for total
proceeds of $22 million, subject to closing adjustments.
7. Property, plant and equipment
Cost
Balance at January 1, 2016
Capital expenditures
Joint venture, carried capital
Acquisitions
Dispositions
Transfers from E&E
Transfers to asset held for sale
Net decommissioning dispositions (1)
Balance at December 31, 2016
Capital expenditures
Joint venture, carried capital
Acquisitions
Dispositions
Transfers to asset held for sale
Net decommissioning dispositions (1)
SR&ED credits (note 11)
Balance at December 31, 2017
Accumulated depletion, depreciation and impairment
Balance at January 1, 2016
Depletion and depreciation
Impairments
Transfers to asset held for sale
Dispositions
Balance at December 31, 2016
Depletion and depreciation
Impairments
Transfers to asset held for sale
Dispositions
Balance at December 31, 2017
Net book value
Total
In 2017, the Company continued to focus its asset base and
completed a number of dispositions which led to gains on
dispositions of $74 million (2016 - $33 million), which
included an insignificant amount of transaction costs (2016 - $9
million).
At December 31, 2017, due to commodity price volatility,
specifically heavy oil differentials, and recent disposition
activity within the Company’s non-core properties, Obsidian Energy
determined there were indicators of impairment within its Peace
River and Legacy CGU’s and accordingly completed an
impairment tests on those respective CGU’s. No impairment was
noted as a result of completing the test. There were no indicators
of impairment or impairment reversal in the Company’s
remaining CGU’s.
The recoverable amount used in the Peace River impairment test was
based on a value in use method while the Legacy impairment test was
based on fair value less cost to sell method. Both recoverable
amounts were calculated using proved plus probable reserves and
incremental development drilling locations, if applicable. The
incremental development drilling location value was based on
management’s internal estimates considering well performance
and recent well and type curve assumptions.
The following table outlines benchmark prices and assumptions the
Company used in the impairment test as at December 31,
2017:
2018
2019
2020
2021
2022
2023 – 2028
Thereafter (inflation percentage)
Impairments have been recorded as Depletion, depreciation,
impairment and accretion on the Consolidated Statements of
Loss.
8. Long-term debt
Bankers’ acceptances and prime rate loans
U.S. Senior secured notes – 2007 Notes
5.80%, US$5 million, matured May 31, 2017
5.90%, US$5 million, maturing May 31, 2019
Senior secured notes – 2008 Notes
6.30%, US$24 million, maturing May 29, 2018
6.40%, US$4 million, maturing May 29, 2020
Senior secured notes – 2009 Notes
9.32%, US$8 million, maturing May 5, 2019
Senior secured notes – 2010 Q1 Notes
5.29%, US$10 million, matured March 16, 2017
5.85%, US$10 million, maturing March 16, 2020
Senior secured notes – 2010 Q4 Notes
4.17%, US$6 million, matured December 2, 2017
4.88%, US$13 million, maturing December 2, 2020
4.98%, US$6 million, maturing December 2, 2022
5.23%, US$2 million, maturing December 2, 2025
Senior secured notes – 2011 Q4 Notes
4.79%, US$12 million, maturing November 30, 2021
Total long-term debt
Current portion
Long-term portion
In 2017, the Company repaid senior notes in the amount of
US$26 million as part of normal course maturities (2016
– $185 million normal course maturities and
$1,075 million in prepayments).
There were no senior note issuances in either 2017 or 2016.
Additional information on Obsidian Energy’s senior secured
notes was as follows:
Weighted average remaining life (years)
Weighted average interest rate
The estimated fair values of the principal and interest obligations
of the outstanding senior secured notes were as follows:
2007 Notes
2008 Notes
2009 Notes
2010 Q1 Notes
2010 Q4 Notes
2011 Notes
Total
During 2017, the Company transitioned to a reserve-based syndicated
credit facility. The underlying borrowing base of the syndicated
credit facility is $550 million, less the amount of
outstanding pari passu senior notes and outstanding GBP cross
currency swap, resulting in $410 million currently available
under the syndicated credit facility. The initial revolving period
of the syndicated credit facility ends on May 17, 2018, with
an additional one-year
term out period, and is subject to a semi-annual borrowing base
redetermination in May and November of each year. At
December 31, 2017, the Company had $157 million of unused
credit capacity available under the syndicated credit facility.
Drawings on the Company’s bank facility are subject to
fluctuations in short-term money market rates as they are generally
held as short-term borrowings. As at December 31, 2017,
70 percent (2016 – 70 percent) of Obsidian
Energy’s long-term debt instruments were exposed to changes
in short-term interest rates.
At December 31, 2017, letters of credit totalling
$14 million were outstanding (2016 – $16 million) that
reduce the amount otherwise available to be drawn on the syndicated
credit facility.
Obsidian Energy records unrealized foreign exchange gains or losses
on its senior notes as amounts are translated into Canadian dollars
at the rate of exchange in effect at the balance sheet date. The
split between realized and unrealized foreign exchange is as
follows:
Realized foreign exchange loss on debt maturities
Realized foreign exchange loss on debt pre-payments
Unrealized foreign exchange gain
Foreign exchange gain
The Company is subject to certain financial covenants under its
senior notes and syndicated credit facility. These types of
financial covenants are typical for senior lending arrangements and
include senior debt and total debt to EBITDA and senior debt and
total debt to capitalization, as more specifically defined in the
applicable lending agreements. At December 31, 2017, the
Company was in compliance with all of its financial covenants under
such lending agreements.
In 2015, as part of entering into amending agreements with its
lenders and noteholders, the Company agreed to grant floating
charge security over all of its property in favour of the lenders
and the noteholders on a pari passu basis, which security will be
fully released on such date when both (a) no default or event
of default is continuing under the Company’s syndicated bank
facility or senior notes and (b) the Company has achieved both
(i) a Senior Debt to EBITDA ratio of 3:1 or less for four
consecutive quarters, and (ii) an investment grade rating on
its senior secured debt.
9. Provisions
Decommissioning liability
Office lease provision
Total
Current portion
Long-term portion
Total
Decommissioning liability
The decommissioning liability is based upon the present value of
Obsidian Energy’s net share of estimated future costs of
obligations to abandon and reclaim all wells, facilities and
pipelines. These estimates were made by management using
information from internal analysis and external consultants
assuming current costs, technology and enacted legislation.
The decommissioning liability was determined by applying an
inflation factor of 2.0 percent (2016 - 2.0 percent) and the
inflated amount was discounted using a credit-adjusted rate of
6.5 percent (2016 – 6.5 percent) over the expected
useful life of the underlying assets, currently extending over 50
years into the future. The total decommissioning liability on an
undiscounted, uninflated basis was $0.9 billion (2016 - $1.1
billion).
Changes to the decommissioning liability were as follows:
Balance, beginning of year
Net liabilities disposed (1)
Acquisitions
Increase (decrease) due to changes in estimates (2)
Liabilities settled
Transfers to liabilities for assets held for sale
Accretion charges
Balance, end of year
Current portion
Long-term portion
Office lease provision
The office lease provision represents the net present value of the
future lease payments that the Company is obligated to make under
non-cancellable lease
contracts less recoveries under current sub-lease agreements. The office lease
provision was determined by applying a credit-adjusted discount
rate of 6.5 percent (2016 – 6.5%) over the remaining
life of the lease contracts, extending into 2025.
Changes to the office lease provision were as follows:
Balance, beginning of year
Net additions
Increase due to changes in estimates
Cash settlements
Accretion charges
Balance, end of year
Current portion
Long-term portion
During 2016, the Company closed several significant asset
dispositions which reduced the size of its operations and
recognized a provision related to certain office lease commitments
that are considered onerous contracts.
10. Risk management
Financial instruments consist of accounts receivable, fair values
of derivative financial instruments, accounts payable and accrued
liabilities and long-term debt. At December 31, 2017, except
for the senior notes described in Note 8 with a carrying value of
$106 million (2016 – $140 million) and a fair value of
$103 million (2016—$134 million), the fair values of
these financial instruments approximate their carrying amounts due
to the short-term maturity of the instruments, the mark to market
values recorded for the financial instruments and the market rate
of interest applicable to the syndicated credit facility.
The fair values of all outstanding financial, commodity, interest
rate and foreign exchange contracts are reflected on the balance
sheet with the changes during the period recorded in income as
unrealized gains or losses.
At December 31, 2017 and 2016, the only asset or liability
measured at fair value on a recurring basis was the risk management
asset and liability, which was valued based on “Level 2
inputs” being quoted prices in markets that are not active or
based on prices that are observable for the asset or liability.
The following table reconciles the changes in the fair value of
financial instruments outstanding:
Risk management asset (liability)
Balance, beginning of year
Unrealized gain (loss) on financial instruments:
Commodity collars, swaps and assignments
Electricity swaps
Foreign exchange forwards
Cross currency swaps
Total fair value, end of year
Total fair value consists of the following:
Current asset portion
Current liability portion
Non-current asset
portion
Non-current liability
portion
Total fair value
Obsidian Energy had the following financial instruments outstanding
as at December 31, 2017. Fair values are determined using
external counterparty information, which is compared to observable
market data. The Company limits its credit risk by executing
counterparty risk procedures which include transacting only with
institutions within its syndicated credit facility or companies
with high credit ratings and by obtaining financial security in
certain circumstances.
Notional Remaining term Pricing
Natural gas
AECO Swaps
AECO Swaps
AECO Swaps
AECO Swaps
AECO Swaps
AECO Swaps
Ventura
Crude Oil
WTI Swaps
WTI Swaps
WTI Swaps
WTI Swaps
WTI Swaps
WTI Swaps
WTI Swaps
WTI Swaps
WTI Swaps
WTI Swaps
WTI Swaps
WTI Swaps
WTI Swaps
WTI Swaps
Foreign exchange forward contracts on revenue
FX Collar
FX Swap
FX Swap
FX Swap
FX Swap
FX Swap
Cross currency swaps
10-year initial term
18-month offset
10-year initial term
Total
Based on December 31, 2017 pricing, a $1.00 change in the
price per barrel of liquids of WTI would have changed pre-tax unrealized risk management by
$7 million and a $0.10 change in the price per mcf of natural
gas would change pre-tax
unrealized risk management by $1 million.
Subsequent to December 31, 2017, the Company entered into the
following crude oil swaps and foreign exchange contracts on
long-term debt:
Reference Price WTI WTI USD/CAD USD/CAD USD/CAD
Additionally, subsequent to December 31, 2017, the Company
unwound its outstanding £5 million and
€10 million cross currency swaps for nil proceeds.
The components of risk management on the Consolidated Statements of
Loss are as follows:
Realized
Settlement of commodity contracts/assignment
Monetization of commodity contracts
Settlement of foreign exchange contracts
Monetization of foreign exchange contracts
Total realized risk management gain
Unrealized
Commodity contracts
Electricity swaps
Crude oil assignment
Foreign exchange contracts
Cross-currency swaps
Total unrealized risk management loss
Risk management gain (loss)
In 2017, the Company had no outstanding electricity contracts (2016
- $7 million loss).
Market Risks
Obsidian Energy is exposed to normal market risks inherent in the
oil and natural gas business, including, but not limited to,
commodity price risk, foreign currency rate risk, credit risk,
interest rate risk and liquidity risk. The Company seeks to
mitigate these risks through various business processes and
management controls and from time to time by using financial
instruments.
Commodity Price Risk
Commodity price fluctuations are among the Company’s most
significant exposures. Crude oil prices are influenced by worldwide
factors, including, but not limited to, OPEC actions, world supply
and demand fundamentals and geopolitical events. Natural gas prices
are influenced by, including, but not limited to, the price of
alternative fuel sources such as oil or coal and by North American
natural gas supply and demand fundamentals including the levels of
industrial activity, weather, storage levels and liquefied natural
gas activity. In accordance with policies approved by Obsidian
Energy’s Board of Directors, the Company may, from time to
time, manage these risks through the use of swaps or other
financial instruments up to a maximum of 50 percent of
forecast sales volumes, net of royalties, for the balance of any
current year plus one additional year forward and up to a maximum
of 25 percent, net of royalties, for one additional year
thereafter. Risk management limits included in Obsidian
Energy’s policies may be exceeded with specific approval from
the Board of Directors. In November 2017, the Board approved the
Company to hedge up to a maximum of 75 percent of forecast
sales volumes on natural gas and up to a maximum of 67 percent
of forecast sales volumes on crude, both net of royalties, for the
2018 calendar year.
Foreign Currency Rate Risk
Prices received for crude oil are referenced to US dollars, thus
Obsidian Energy’s realized oil prices are impacted by
Canadian dollar to US dollar exchange rates. A portion of the
Company’s debt capital is denominated in US dollars, thus the
principal and interest payments in Canadian dollars are also
impacted by exchange rates. When considered appropriate, the
Company may use financial instruments to fix or collar future
exchange rates to fix the Canadian dollar equivalent of crude oil
revenues or to fix US denominated long-term debt principal
repayments.
In 2017, US$25 million of foreign exchange forward contracts
on senior notes matured. Additionally, in 2016 the Company
monetized a total of US$115 million of foreign exchange
forward contracts on senior notes.
Credit Risk
Credit risk is the risk of loss if purchasers or counterparties do
not fulfill their contractual obligations. The Company’s
accounts receivable are principally with customers in the oil and
natural gas industry and are generally subject to normal industry
credit risk, which includes the ability to recover unpaid
receivables by retaining the partner’s share of production
when Obsidian Energy is the operator. For oil and natural gas sales
and financial derivatives, a counterparty risk procedure is
followed whereby each counterparty is reviewed on a regular basis
for the purpose of assigning a credit limit and may be requested to
provide security if determined to be prudent. For financial
derivatives, the Company normally transacts with counterparties who
are members of its banking syndicate or other counterparties that
have investment grade bond ratings. Credit events related to all
counterparties are monitored and credit exposures are reassessed on
a regular basis. As necessary, provisions for potential credit
related losses are recognized.
As at December 31, 2017, the maximum exposure to credit risk
was $117 million (2016 – $130 million) which was
comprised of $106 million (2016 - $122 million) being the
carrying value of the accounts receivable and $11 million
(2016 – $8 million) related to the fair value of the
derivative financial assets.
Interest Rate Risk
A portion of the Company’s debt capital can be held in
floating-rate bank facilities, which results in exposure to
fluctuations in short-term interest rates, which remain at lower
levels than longer-term rates. From time to time, Obsidian Energy
may increase the certainty of its future interest rates by entering
fixed interest rate debt instruments or by using financial
instruments to swap floating interest rates for fixed rates or to
collar interest rates. As at December 31, 2017,
70 percent of the Company’s long-term debt instruments
were exposed to changes in short-term interest rates (2016 –
70 percent).
As at December 31, 2017, a total of $106 million (2016
– $140 million) of fixed interest rate debt instruments was
outstanding with an average remaining term of 2.3 years (2016
– 2.7 years) and an average interest rate of 6.0 percent
(2016 – 6.3 percent).
Liquidity Risk
Liquidity risk is the risk that the Company will be unable to meet
its financial liabilities as they come due. Management utilizes
short and long-term financial and capital forecasting programs to
ensure credit facilities are sufficient relative to forecast debt
levels and capital program levels are appropriate, and that
financial covenants will be met. Management also regularly reviews
capital markets to identify opportunities to optimize the debt
capital structure on a cost-effective basis. In the short term,
liquidity is managed through daily cash management activities,
short-term financing strategies and the use of swaps and other
financial instruments to increase the predictability of cash flow
from operating activities.
The following table outlines estimated future obligations for
non-derivative financial
liabilities as at December 31, 2017:
2018
2019
2020
2021
2022
Thereafter
11. Income taxes
The provision for income taxes is as follows:
Deferred tax recovery
The provision for income taxes reflects an effective tax rate that
differs from the combined federal and provincial statutory tax rate
as follows:
Loss before taxes
Combined statutory tax rate (1)
Computed income tax recovery
Increase (decrease) resulting from:
Share-based compensation
Non-taxable foreign
exchange (gain) loss
Unrecognized deferred tax asset
Adjustments related to prior years
Other
Deferred tax recovery
The net deferred income tax liability is comprised of the
following:
Deferred tax liabilities (assets)
PP&E
Risk management
Decommissioning liability
Share-based compensation
Non-capital losses
Net deferred tax liability
Deferred tax liabilities (assets)
PP&E
Risk management
Decommissioning liability
Share-based compensation
Non-capital losses
Net deferred tax liability
As at December 31, 2017, Obsidian Energy had approximately
$2.4 billion (2016 – $2.4 billion) in total tax pools,
including non-capital
losses of $2.0 billion (2016 - $2.0 billion). The non-capital losses are available for
immediate deduction against future taxable income and expire in the
years 2026 through 2038. A deferred tax asset has not been
recognized in respect of non-capital losses of $17 million
(December 31, 2016 – nil) as there is not sufficient
certainty regarding future utilization.
At December 31, 2017, Obsidian Energy had realized and
unrealized net capital losses of $586 million (2016 - $591
million). A deferred tax asset has not been recognized in respect
of these losses as they may only be applied against future capital
gains.
The Company has income tax filings that are subject to audit by
taxation authorities, which may impact its deferred income tax
position or amount. The Company does not anticipate adjustments
arising from these audits and believes it has adequately provided
for income taxes based on available information, however,
adjustments that arise could be material.
12. Shareholders’ equity
a) Authorized
i) An unlimited number of Common Shares.
ii) 90,000,000 preferred shares issuable in one or more series.
If issued, preferred shares of each series would rank on parity
with the preferred shares of other series with respect to
accumulated dividends and return on capital. Preferred shares would
have priority over the Common shares with respect to the payment of
dividends or the distribution of assets.
b) Issued
Shareholders’ capital
Balance, January 1, 2016
Issued on exercise of equity compensation plans (1)
Cancellation of dividend reinvestment plan (2)
Balance, December 31, 2016
Issued on exercise of equity compensation plans (1)
Elimination of deficit
Balance, December 31, 2017
In June 2017, the Company’s shareholders approved the
reduction of the Company’s share capital and the elimination
of its deficit as stated at March 31, 2017.
Other Reserves
Balance, beginning of year
Share-based compensation expense
Net benefit on options exercised(1)
Balance, end of year
Preferred Shares
No Preferred Shares were issued or outstanding.
13. Share-based compensation
Restricted and Performance Share Unit plan (“RPSU
plan”)
Obsidian Energy has an RPSU plan whereby employees receive
consideration that fluctuates based on the Company’s share
price on the TSX. Since March 2016, consideration can be in the
form of cash or shares purchased on the open market therefore all
grants subsequent to March 2016 are accounted for based on the
equity method. In June 2017, the shareholders approved amendments
to the RPSU plan such that shares provided under the plan can
either be purchased on the open market or issued from treasury.
RPSU plan
(number of shares equivalent)
Outstanding, beginning of year
Granted
Vested
Forfeited
Outstanding, end of year
Outstanding units – liability method
Outstanding units – equity method
RPSU obligation:
Current liability (1)
Non-current liability
The fair value of the RPSU plan units under the equity method used
the following weighted average assumptions:
Average fair value of units granted (per unit)
Expected life of units (years)
Expected forfeiture rate
Stock Option Plan
Obsidian Energy has an Option Plan that allows the Company to issue
options to acquire common shares to officers, employees and other
service providers. In March 2017, the Board of Directors resolved
to suspend all future grants of options under the Option Plan.
Options
Outstanding, beginning of year
Granted
Exercised
Forfeited
Outstanding, end of year
Exercisable, end of year
Range of Grant Prices
$1.00 - $1.99
$2.00 - $9.99
$10.00 - $21.99
Deferred Share Unit (“DSU”) plan
The DSU plan allows the Company to grant DSUs in lieu of cash fees
to non-employee directors
providing a right to receive, upon retirement, a cash payment based
on the volume-weighted-average trading price of the common shares
on the TSX. At December 31, 2017, 640,705 DSUs (2016 –
745,851) were outstanding and $1 million was recorded as a
current liability (2016 – $2 million).
Performance Share Unit (“PSU”) plan
The PSU plan allows Obsidian Energy to grant PSUs to employees of
the Company. Members of the Board of Directors are not eligible for
the PSU Plan. The PSU obligation is classified as a liability due
to the cash settlement feature. Since June 2017, issuances of
performance share units are made under the RPSU plan and therefore
could be paid in shares.
PSU awards (number of shares equivalent)
Outstanding, beginning of period
Granted
Vested
Forfeited
Outstanding, end of period
PSU obligation:
Non-current liability
Share-based compensation
Share-based compensation is based on the fair value of the options
and units at the time of grant under the Option Plan and RPSU plan
(equity method), which is amortized over the remaining vesting
period on a graded vesting schedule. Share-based compensation under
the RPSU plan (liability method), DSU and PSU is based on the fair
value of the awards outstanding at the reporting date and is
amortized based on a graded vesting schedule. Share-based
compensation consisted of the following:
Options
PSU plan
DSU plan
RPSU plan – equity method
RPSU plan – liability method
Share-based compensation
The share price used in the fair value calculation of the RPSU plan
(liability method), PSU and DSU obligations at December 31,
2017 was $1.56 (2016 – $2.37).
Employee retirement savings plan
Obsidian Energy has an employee retirement savings plan (the
“savings plan”) for the benefit of all employees. Under
the savings plan, employees may elect to contribute up to
10 percent of their salary and Obsidian Energy matches these
contributions at a rate of $1.50 for each $1.00 of employee
contribution up to and including December 31, 2017, $1.25 for
each $1.00 of employee contribution for 2018 and $1.00 for each
$1.00 of employee contribution thereafter. Both the
employee’s and Obsidian Energy’s contributions are used
to acquire Obsidian Energy common shares or are placed in
low-risk investments.
Shares are purchased in the open market at prevailing market
prices.
14. Per share amounts
The number of incremental shares included in diluted earnings per
share is computed using the average volume-weighted market price of
shares for the period. In addition, contracts that could be settled
in cash or shares are assumed to be settled in shares if share
settlement is more dilutive.
Net loss – basic and diluted
The weighted average number of shares used to calculate per share
amounts is as follows:
Basic and Diluted
For 2017, 3.7 million shares (2016 – 7.6 million) that
would be issued under the Option Plan were excluded in calculating
the weighted average number of diluted shares outstanding as they
were considered anti-dilutive.
15. Changes in non-cash
working capital (increase) decrease
Accounts receivable (1)
Other current assets (2)
Deferred funding obligation
Accounts payable and accrued liabilities (3) (4)
Operating activities
Investing activities
Interest paid
Income taxes recovered
16. Capital management
Obsidian Energy manages its capital to provide a flexible structure
to support capital programs, production maintenance and other
operational strategies. Attaining a strong financial position
enables the capture of business opportunities and supports Obsidian
Energy’s business strategy of providing strong shareholder
returns.
Obsidian Energy defines capital as the sum of shareholders’
equity and long-term debt. Shareholders’ equity includes
shareholders’ capital, other reserves and retained earnings
(deficit). Long-term debt includes bank loans and senior notes.
Management continuously reviews Obsidian Energy’s capital
structure to ensure the objectives and strategies of Obsidian
Energy are being met. The capital structure is reviewed based on a
number of key factors including, but not limited to, current market
conditions, hedging positions, trailing and forecast debt to
capitalization ratios, debt to EBITDA and other economic risk
factors.
The Company is subject to certain quarterly financial covenants
under its secured, syndicated credit facility and the senior
secured notes. These financial covenants are typical for senior
secured lending arrangements and include senior debt and total debt
to EBITDA and senior debt and total debt to capitalization as
defined in Obsidian Energy’s lending agreements. As at
December 31, 2017, the Company was in compliance with all of
its financial covenants under such lending agreements.
(millions, except ratio amounts)
Components of capital
Shareholders’ equity
Long-term debt
Ratios
Senior debt to EBITDA (1)
Total debt to EBITDA (2)
Senior debt to capitalization (3)
Total debt to capitalization (4)
Priority debt to consolidated tangible assets (5)
EBITDA (6)
Credit facility debt and senior notes
Letters of credit (7)
Senior debt and total debt
Total shareholders’ equity
Total capitalization
The Company intends to continue to actively identify and evaluate
hedging opportunities in order to reduce its exposure to
fluctuations in commodity prices and protect its future cash flows
and capital programs.
17. Commitments and contingencies
Obsidian Energy is committed to certain payments over the next five
calendar years and thereafter as follows:
Long-term debt (1)
Transportation
Power infrastructure
Interest obligations
Office lease
Decommissioning liability
Total
Obsidian Energy has an aggregate of $106 million in senior
notes maturing between 2018 and 2025.
Obsidian Energy’s commitments relate to the following:
During the fourth quarter of 2017, the Company settled the
outstanding lawsuit it had with the United States Securities and
Exchange Commission (“SEC”) for US$8.5 million,
which is included in other expenses in the Consolidated Statement
of Loss. The settlement is in relation to the Company’s 2014
restatement of certain financial results while it was known as Penn
West Petroleum Ltd. (“Penn West”). Under the terms of
the settlement, the Company, without admitting or denying any of
the factual allegations in the SEC’s Complaint, agreed to pay
a penalty of US$8.5 million. In addition, the Company will be
enjoined from future violations of certain provisions of U.S.
securities legislation. Further details of the settlement and its
consequences can be found in the settlement documents, and in U.S.
securities laws. The lawsuit continued against the former Penn West
employees named in the SEC Complaint.
The Company is involved in various litigation and claims in the
normal course of business and records provisions for claims as
required.
18. Related-party transactions
Operating entities
The consolidated financial statements include the results of
Obsidian Energy Ltd. and its wholly-owned subsidiaries, notably the
Obsidian Energy Partnership. Transactions and balances between
Obsidian Energy Ltd. and all of its subsidiaries are eliminated
upon consolidation.
Compensation of key management personnel
In 2017, key management personnel include the President and Chief
Executive Officer, Vice-Presidents and the Board of Directors. The
Human Resources & Compensation Committee makes
recommendations to the Board of Directors who approves the
appropriate remuneration levels for management based on performance
and current market trends. Compensation levels of the Board of
Directors are recommended by the Corporate Governance committee of
the Board. The remuneration of the directors and key management
personnel of Obsidian Energy during the year is below.
Salary and employee benefits
Termination benefits
Share-based payments (1)
19. Supplemental Items
In the consolidated financial statements, compensation costs are
included in both operating and general and administrative expenses.
For 2017, employee compensation costs of $14 million (2016 -
$36 million) were included in operating expenses and
$30 million (2016 - $44 million) were included in general and
administrative expenses on a gross basis.
SUPPLEMENTARY OIL AND GAS INFORMATION - (UNAUDITED)
The disclosures contained in this section provide oil and gas
information in accordance with the U.S. standard, “Extractive
Activities – Oil and Gas”. Obsidian Energy’s
financial reporting is prepared in accordance with International
Financial Reporting Standards (“IFRS”) as issued by the
International Accounting Standards Board.
For the years ended December 31, 2017 and 2016, Obsidian
Energy has filed its reserves information under National Instrument
51-101 –
“Standards of Disclosure of Oil and Gas
Activities” (“NI 51-101”), which prescribes the
standards for the preparation and disclosure of reserves and
related information for companies listed in Canada.
There are significant differences to the type of volumes disclosed
and the basis from which the volumes are economically determined
under the United States Securities and Exchange Commission
(“SEC”) requirements and NI 51-101. The SEC requires disclosure of
net reserves, after royalties, using 12-month average prices and current
costs; whereas NI 51-101
requires gross reserves, before royalties, using forecast pricing
and costs. Therefore, the difference between the reported numbers
under the two disclosure standards can be material.
For the purposes of determining proved crude oil and natural gas
reserves for SEC requirements as at December 31, 2017 and 2016
Obsidian Energy used the 12-month average price, defined by the
SEC as the unweighted arithmetic average of the
first-day-of-the-month price for each
month within the 12-month
period prior to the end of the reporting period.
NET PROVED OIL AND NATURAL GAS RESERVES
Obsidian Energy engaged independent qualified reserve evaluator,
Sproule Associates Limited (“Sproule”), to evaluate
Obsidian Energy’s proved developed and proved undeveloped oil
and natural gas reserves. As at December 31, 2017,
substantially all of Obsidian Energy’s oil and natural gas
reserves are located in Canada. The changes in the Company’s
net proved reserve quantities are outlined below.
Net reserves include Obsidian Energy’s remaining working
interest and royalty reserves, less all Crown, freehold, and
overriding royalties and other interests that are not owned by
Obsidian Energy.
Proved reserves are those estimated quantities of crude oil,
natural gas and natural gas liquids that can be estimated with a
high degree of certainty to be economically recoverable under
existing economic and operating conditions.
Proved developed reserves are those proved reserves that are
expected to be recovered from existing wells and installed
facilities or, if facilities have not been installed, that would
involve a low expenditure to put the reserves on production. Proved
developed reserves may be subdivided into producing and
non-producing.
Proved undeveloped reserves are those reserves that are expected to
be recovered from known accumulations where a significant
expenditure is required to render them capable of production.
Obsidian Energy cautions users of this information as the process
of estimating crude oil and natural gas reserves is subject to a
level of uncertainty. The reserves are based on economic and
operating conditions; therefore, changes can be made to future
assessments as a result of a number of factors, which can include
new technology, changing economic conditions and development
activity.
YEAR ENDED DECEMBER 31, 2017
CONSTANT PRICES AND COSTS
Net Proved Developed and
Proved Undeveloped Reserves (1)
December 31, 2016
Extensions & Discoveries
Improved Recovery & Infill Drilling
Technical Revisions
Acquisitions
Dispositions
Production
Change for the year
December 31, 2017
Developed
Undeveloped
Total (2)
YEAR ENDED DECEMBER 31, 2016
CONSTANT PRICES AND COSTS
Net Proved Developed and
Proved Undeveloped Reserves (1)
December 31, 2015
Extensions & Discoveries
Improved Recovery & Infill Drilling
Technical Revisions
Acquisitions
Dispositions
Production
Change for the year
December 31, 2016
Developed
Undeveloped
Total (2)
In both 2017 and 2016 Obsidian Energy closed a number of asset
dispositions as it consolidated its asset portfolio and
strengthened its balance sheet.
CAPITALIZED COSTS
As at December 31, ($CAD millions)
Proved oil and gas properties
Unproved oil and gas properties
Total capitalized costs
Accumulated depletion and depreciation
Net capitalized costs
COSTS INCURRED
Property acquisition (disposition) costs (1)
Proved oil and gas properties - acquisitions
Proved oil and gas properties - dispositions
Unproved oil and gas properties
Exploration costs (2)
Development costs (3)
Joint venture, carried capital
Capital expenditures
Corporate acquisitions
Total expenditures
STANDARDIZED MEASURE OF DISCOUNTED FUTURE NET CASH FLOWS AND
CHANGES THEREIN
The standardized measure of discounted future net cash flows is
based on estimates made by Sproule of net proved reserves. Future
cash inflows are computed based on constant prices and cost
assumptions from annual future production of proved crude oil and
natural gas reserves. Future development and production costs are
based on constant price assumptions and assume the continuation of
existing economic conditions. Constant prices are calculated as the
average of the first day prices of each month for the prior
12-month calendar period.
Deferred income taxes are calculated by applying statutory income
tax rates in effect at the end of the fiscal period. Obsidian
Energy is currently not cash taxable. The standardized measure of
discounted future net cash flows is computed using a
10 percent discount factor.
Obsidian Energy cautions users of this information that the
discounted future net cash flows relating to proved crude oil and
natural gas reserves are neither an indication of the fair market
value of our oil and gas properties, nor of the future net cash
flows expected to be generated from such properties. The discounted
future cash flows do not include the fair market value of
exploratory properties and probable or possible oil and gas
reserves, nor is consideration given to the effect of anticipated
future changes in crude oil and natural gas prices, development,
asset retirement and production costs and possible changes to tax
and royalty regulations. The prescribed discount rate of
10 percent is arbitrary and may not reflect applicable future
interest rates.
STANDARD MEASURE OF DISCOUNTED FUTURE NET CASH
FLOWS
For the years ended December 31, ($CAD millions)
Future cash inflows
Future production costs
Future development costs
Undiscounted pre-tax cash
flows
Deferred income taxes (1)
Future net cash flows
Less 10% annual discount factor
Standardized measure of discounted future net cash flows
STANDARD MEASURE OF DISCOUNTED FUTURE NET CASH FLOW
CHANGES
For the years ended December 31, ($CAD millions)
Standardized measure of discounted future net cash flows at
beginning of year
Oil and gas sales during period net of production costs and
royalties (1)
Changes due to prices (2)
Development costs during the period (3)
Changes in forecast development costs (4)
Changes resulting from extensions, infills and improved recovery
(5)
Changes resulting from discoveries (2)
Changes resulting from acquisitions of reserves (5)
Changes resulting from dispositions of reserves (5)
Accretion of discount (6)
Net change in income tax (7)
Changes resulting from other changes and technical reserves
revisions plus effects on timing (8)
Standardized measure of discounted future net cash flows at end of
year
a) Critical accounting judgments and key estimates
The preparation of the consolidated financial statements in
conformity with IFRS requires management to make estimates and
assumptions that affect the recorded amounts of assets and
liabilities, disclosure of any contingent assets and liabilities at
the date of the financial statements and the reported amounts of
revenues and expenses for the period. These and other estimates are
subject to measurement uncertainty and the effect on the
consolidated financial statements of changes in these estimates
could be material.
Management also makes judgments while applying accounting policies
that could affect amounts recorded in its consolidated financial
statements. Significant judgments include the identification of
cash generating units (“CGUs”) for impairment testing
purposes and determining whether a CGU has an impairment
indicator.
The following are the estimates that management has made in
applying the Company’s accounting policies that have the most
significant effect on the amounts recognized in the consolidated
financial statements.
i) Reserve estimates
Commercial petroleum reserves are determined based on estimates of
petroleum-in-place, recovery
factors and future oil and natural gas prices and costs. Obsidian
Energy engages an independent qualified reserve evaluator to
evaluate all of the Company’s oil and natural gas reserves at
each year-end.
Reserve adjustments are made annually based on actual oil and
natural gas volumes produced, the results from capital programs,
revisions to previous estimates, new discoveries and acquisitions
and dispositions made during the year and the effect of changes in
forecast future crude oil and natural gas prices. There are a
number of estimates and assumptions that affect the process of
evaluating reserves.
Proved reserves are the estimated quantities of crude oil, natural
gas and natural gas liquids determined to be economically
recoverable under existing economic and operating conditions with a
high degree of certainty (at least 90 percent) those quantities
will be exceeded. Proved plus probable reserves are the estimated
quantities of crude oil, natural gas and natural gas liquids
determined to be economically recoverable under existing economic
and operating conditions with a 50 percent certainty those
quantities will or will not be exceeded. Obsidian Energy reports
production and reserve quantities in accordance with Canadian
practices and specifically in accordance with “Standards of
Disclosure for Oil and Gas Activities” (“NI
51-101”).
The estimate of proved plus probable reserves is an essential part
of the depletion calculation, the impairment test and hence the
recorded amount of oil and gas assets.
Contingent Resources are defined in the COGE Handbook as those
quantities of petroleum estimated to be potentially recoverable
from known accumulations using established technology or technology
under development, but which do not currently qualify as Reserves
or commercially recoverable due to one or more contingencies.
Contingencies may include factors such as economic, legal,
environmental, operational, political and regulatory matters or a
lack of markets. The estimate of contingent resources may be
included as part of the recoverable amount in the impairment
test.
Obsidian Energy cautions users of this information that the process
of estimating crude oil and natural gas reserves is subject to a
level of uncertainty. The reserves are based on current and
forecast economic and operating conditions; therefore, changes can
be made to future assessments as a result of a number of factors,
which can include commodity prices, new technology, changing
economic conditions, future reservoir performance and forecast
development activity.
ii) Recoverability of asset carrying values
Obsidian Energy assesses its property, plant and equipment
(“PP&E”) for impairment by comparing the carrying
amount to the recoverable amount of the underlying assets. The
determination of the recoverable amount involves estimating the
higher of an asset’s fair value less costs to sell or its
value-in-use, the latter of
which is based on its discounted future cash flows using an
applicable discount rate. Future cash flows are calculated based on
estimates of future commodity prices and inflation and are
discounted based on management’s current assessment of market
conditions.
iii) Decommissioning liability
Obsidian Energy recognizes a provision for future abandonment
activities in the consolidated financial statements at the net
present value of the estimated future expenditures required to
settle the estimated obligation at the balance sheet date. The
measurement of the decommissioning liability involves the use of
estimates and assumptions including the discount rate, the amount
and expected timing of future abandonment costs and the inflation
rate related thereto. The estimates were made by management and
external consultants considering current costs, technology and
enacted legislation.
iv) Office lease liability
Obsidian Energy recognizes a provision for certain onerous office
lease commitments in the consolidated financial statements at the
net present value of future lease payments the Company is obligated
to make under non-cancellable lease contracts less
recoveries under current sub-lease agreements. The measurement
of the office lease liability involves the use assumptions
including the discount rate, actual settlement amounts and
estimates of future recoveries. Actual costs and cash outflows may
differ from the estimates as a result of the changes in the noted
assumptions.
v) Fair value calculation on share-based payments
The fair value of share-based payments is calculated using a
Black-Scholes model. There are a number of estimates used in the
calculation such as the expected future forfeiture rate, the
expected period the share-based compensation is outstanding and the
future price volatility of the underlying security all of which can
vary from expectations. The factors applied in the calculation are
management’s estimates based on historical information and
future forecasts.
vi) Fair value of risk management contracts
Obsidian Energy records risk management contracts at fair value
with changes in fair value recognized in income. The fair values
are determined using external counterparty information which is
compared to observable market data.
vii) Taxation
The calculation of deferred income taxes is based on a number of
assumptions including estimating the future periods in which
temporary differences and other tax credits will reverse and the
general assumption that substantively enacted future tax rates at
the balance sheet date will be in effect when differences
reverse.
viii) Litigation
Obsidian Energy records provisions related to legal matters if it
is probable that the Company will not be successful in defending
the claim and if an amount can be reasonably estimated. Determining
the probability of a claim being defended is subject to
considerable judgment. Additionally, the potential claim is
generally a wide range of figures and a single estimate must be
made when recording a provision. Contingencies will only be
resolved or unfounded when one or more future events occur. The
assessment of contingencies involves significant judgment and
estimates of the potential outcome of future events.
b) Business combinations
Obsidian Energy uses the acquisition method to account for business
combinations. The net identifiable assets and liabilities acquired
in transactions are generally measured at their fair value on the
acquisition date. The acquisition date is the closing date of the
business combination. Acquisition costs incurred by Obsidian Energy
to complete a business combination are expensed in the period
incurred except for costs related to the issue of any debt or
equity securities, which are recognized based on the nature of the
related financing instrument.
Revisions may be made to the initial recognized amounts determined
during the measurement period, which shall not exceed one year
after the close date of the acquisition.
c) Revenue
Obsidian Energy generally recognizes oil and natural gas revenue
when title passes from Obsidian Energy to the purchaser or, in the
case of services, as contracted services are performed.
Revenue is measured at the fair value of the consideration received
or receivable. Revenue from the sale of crude oil, natural gas and
natural gas liquids (prior to deduction of transportation costs) is
recognized when all the following conditions have been
satisfied:
d) Joint arrangements
The consolidated financial statements include Obsidian
Energy’s proportionate interest of jointly controlled assets
and liabilities and its proportionate interest of the revenue,
royalties and operating expenses. A significant portion of Obsidian
Energy’s exploration and development activities are conducted
jointly with others and involve joint operations. Under such
arrangements, Obsidian Energy has the exclusive rights to its
proportionate interest in the assets and the economic benefits
generated from its share of the assets. Income from the sale or use
of Obsidian Energy’s interest in joint operations and its
share of expenses is recognized when it is probable that the
economic benefits associated with the transactions will flow
to/from Obsidian Energy and the amounts can be reliably
measured.
The Peace River Oil Partnership is a joint operation and Obsidian
Energy records its 55 percent interest of revenues, expenses,
assets and liabilities.
e) Transportation expense
Transportation costs are paid by Obsidian Energy for the shipping
of natural gas, crude oil and natural gas liquids from the wellhead
to the point of title transfer to buyers. These costs are
recognized as services are received.
f) Foreign currency translation
Obsidian Energy and each of its subsidiaries use the Canadian
dollar as their functional currency. Monetary items, such as
accounts receivable and long-term debt, are translated to Canadian
dollars at the rate of exchange in effect at the balance sheet
date. Non-monetary items,
such as PP&E, are translated to Canadian dollars at the rate of
exchange in effect when the associated transactions occurred.
Revenues and expenses denominated in foreign currencies are
translated at the exchange rate on the date of the transaction.
Foreign exchange gains or losses on translation are included in
income.
g) PP&E
i) Measurement and recognition
Oil & Gas properties are included in PP&E at cost,
less accumulated depletion and depreciation and any impairment
losses. The cost of PP&E includes costs incurred initially to
acquire or construct the item and betterment costs.
Capital expenditures are recognized as PP&E when it is probable
that future economic benefits associated with the investment will
flow to Obsidian Energy and the cost can be reliably measured.
PP&E includes capital expenditures incurred in the development
phases, acquisition and disposition of PP&E and additions to
the decommissioning liability.
ii) Depletion and Depreciation
Except for components with a useful life shorter than the reserve
life of the associated property, resource properties are depleted
using the unit-of-production method based
on production volumes before royalties in relation to total proved
plus probable reserves. Natural gas volumes are converted to
equivalent oil volumes based upon the relative energy content of
six thousand cubic feet of natural gas to one barrel of oil. In
determining its depletion base, Obsidian Energy includes estimated
future costs to develop proved plus probable reserves and excludes
estimated equipment salvage values. Changes to reserve estimates
are included in the depletion calculation prospectively.
Components of PP&E that are not depleted using the unit-of-production method are
depreciated on a straight-line basis over their useful life. The
turnaround component has an estimated useful life of three to five
years and the corporate asset component has an estimated useful
life of 10 years.
iii) Derecognition
The carrying amount of an item of PP&E is derecognized when no
future economic benefits are expected from its use or upon sale to
a third party. The gain or loss arising from derecognition is
included in income and is measured as the difference between the
net proceeds, if any, and the carrying amount of the asset.
iv) Major maintenance and repairs
Ongoing costs to maintain properties are generally expensed as
incurred. These costs include the cost of labour, consumables and
small parts. The costs of material replacement parts, turnarounds
and major inspections are capitalized provided it is probable that
future economic benefits in excess of cost will be realized and
such benefits are expected to extend beyond the current operating
period. The carrying amount of a replaced part is derecognized in
accordance with Obsidian Energy’s derecognition policies.
v) Impairment of oil and natural gas properties
Obsidian Energy reviews oil and gas properties for circumstances
that indicate its assets may be impaired at the end of each
reporting period. These indicators can be internal (i.e. reserve
changes) or external (i.e. market conditions) in nature. If an
indication of impairment exists, Obsidian Energy completes an
impairment test, which compares the estimated recoverable amount to
the carrying value. The estimated recoverable amount is defined
under IAS 36 (“Impairment of Assets”) as the higher of
an asset’s or CGU’s fair value less costs to sell and
its value-in-use.
Where the recoverable amount is less than the carrying amount, the
CGU is considered to be impaired. Impairment losses identified for
a CGU are allocated on a pro rata basis to the asset categories
within the CGU. The impairment loss is recognized as an expense in
income.
Value-in-use is computed as the
present value of future cash flows expected to be derived from
production. Present values are calculated using a pre-tax discount rate that reflects
current market assessments of the time value of money and the risks
specific to the asset. Under the fair value less cost to sell
method the recoverable amount is determined using various factors,
which can include external factors such as observable market
conditions and comparable transactions and internal factors such as
discounted cash flows related to reserve and resource studies and
future development plans.
Impairment losses related to PP&E can be reversed in future
periods if the estimated recoverable amount of the asset exceeds
the carrying value. The impairment recovery is limited to a maximum
of the estimated depleted historical cost if the impairment had not
been recognized. The reversal of the impairment loss is recognized
in depletion, depreciation and impairment.
vi) Other Property, Plant and Equipment
Obsidian Energy’s corporate assets include computer hardware
and software, office furniture, buildings and leasehold
improvements and are depreciated on a straight-line basis over
their useful lives. Corporate assets are tested for impairment
separately from oil and gas assets.
h) Share-based payments
The fair value of units granted under the Restricted and
Performance Share Unit Plan (“RPSU”) following the
equity method are recognized as compensation expense with a
corresponding increase to other reserves in shareholders’
equity over the term of the units based on a graded vesting
schedule. Obsidian Energy measures the fair value of units granted
under this plan at the grant date using the share price from the
Toronto Stock Exchange (“TSX”). The fair value is based
on market prices and considers the terms and conditions of the
units granted.
The fair value of options granted under the Stock Option Plan (the
“Option Plan”) are recognized as compensation expense
with a corresponding increase to other reserves in
shareholders’ equity over the term of the options based on a
graded vesting schedule. Obsidian Energy measures the fair value of
options granted under these plans at the grant date using the
Black-Scholes option-pricing model. The fair value is based on
market prices and considers the terms and conditions of the share
options granted.
The fair value of awards granted under the Deferred Share Unit Plan
(“DSU”), Performance Share Unit Plan
(“PSU”) and the RPSU Plan following the liability
method are based on a fair value calculation on each reporting date
using the awards outstanding and Obsidian Energy’s share
price from the TSX on each balance sheet date. The fair value of
the awards is expensed over the vesting period based on a graded
vesting schedule. Subsequent increases and decreases in the
underlying share price result in increases and decreases,
respectively, to the accrued obligation until the related
instruments are settled.
i) Provisions
i) General
Provisions are recognized based on an estimate of expenditures
required to settle present obligations at the end of the reporting
period. The provision is risk adjusted to take into account any
uncertainties. When the effect of the time value of money is
material, the amount of a provision is calculated as the present
value of the future expenditures required to settle the
obligations. The discount rate reflects the current assessment of
the time value of money and risks specific to the liability when
those risks have not already been reflected as an adjustment to
future cash flows.
ii) Decommissioning liability
The decommissioning liability is the present value of Obsidian
Energy’s future costs of obligations for property, facility
and pipeline abandonment and site restoration. The liability is
recognized on the balance sheet with a corresponding increase to
the carrying amount of the related asset. The recorded liability
increases over time to its future amount through accretion charges
to income. Revisions to the estimated amount or timing of the
obligations are reflected prospectively as increases or decreases
to the recorded liability and the related asset. Actual
decommissioning expenditures, up to the recorded liability at the
time, are charged to the liability as the costs are incurred.
Amounts capitalized to the related assets are amortized to income
consistent with the depletion or depreciation of the underlying
asset.
iii) Office lease liability
The office lease liability is the net present value of future lease
payments Obsidian Energy is obligated to make under non-cancellable lease contracts less
recoveries under current sub-lease agreements. The liability is
recognized on the balance sheet with the corresponding change
charged to income. The recorded liability increases over time to
its future amount through accretion charges to income. Revisions to
the estimated amount or timing of the obligations are reflected
prospectively as increases or decreases to the recorded liability.
Actual lease payments less sub-lease recoveries are charged to
the liability as the costs are incurred.
j) Leases
A lease is classified as an operating lease if it does not transfer
substantially all of the risks and rewards incidental to ownership
of the related asset to the lessee. Operating lease payments are
expensed on a straight-line basis over the life of the lease.
k) Share capital
Common shares are classified as equity. Share issue costs are
recorded in shareholder’s equity, net of applicable taxes.
Dividends are paid at the discretion of the Board of Directors and
are deducted from retained earnings.
If issued, preferred shares would be classified as equity and could
be issued in one or more series.
l) Earnings per share
Earnings per share is calculated by dividing net income or loss
attributable to the shareholders by the weighted average number of
common shares outstanding during the period. Obsidian Energy
computes the dilutive impact of equity instruments other than
common shares assuming the proceeds received from the exercise of
in-the-money share options are
used to purchase common shares at average market prices.
m) Taxation
Income taxes are based on taxable income in a taxation year.
Taxable income normally differs from income reported in the
consolidated statement of income as it excludes items of income or
expense that are taxable or deductible in other years or are not
taxable or deductible for income tax purposes.
Obsidian Energy uses the liability method of accounting for
deferred income taxes. Temporary differences are calculated
assuming that the financial assets and liabilities will be settled
at their carrying amount. Deferred income taxes are computed on
temporary differences using substantively enacted income tax rates
expected to apply when deferred income tax assets and liabilities
are realized or settled.
A deferred income tax asset is recognized to the extent that it is
probable that future taxable income will be available against which
the deductible temporary differences can be utilized. Deferred
income tax assets are reviewed at each reporting date and are not
recognized until such time that it is more likely than not that the
related tax benefit will be realized.
n) Financial instruments
Financial instruments are measured at fair value and recorded on
the balance sheet upon initial recognition of an instrument.
Subsequent measurement and changes in fair value will depend on
initial classification, as follows:
Obsidian Energy’s current classifications are as follows:
Obsidian Energy assesses each financial instrument, except those
valued at fair value through profit or loss, for impairment at the
reporting date and records the gain or loss in income during the
period.
o) Embedded derivatives
An embedded derivative is a component of a contract that affects
the terms of another factor, for example, rent costs that fluctuate
with oil prices. These “hybrid” contracts are
considered to consist of a “host” contract plus an
embedded derivative. The embedded derivative is separated from the
host contract and accounted for as a derivative if the following
conditions are met:
p) Classification of debt or equity
Obsidian Energy classifies financial liabilities and equity
instruments in accordance with the substance of the contractual
arrangement and the definitions of a financial liability or an
equity instrument.
Obsidian Energy’s debt instruments currently have
requirements to deliver cash at the end of the term thus are
classified as liabilities.
q) Future accounting pronouncements
The IASB issued IFRS 15 “Revenue from Contracts with
Customers” which replaces IAS 18 “Revenue”. IFRS
15 specifies revenue recognition criteria and expanded disclosures
for revenue. The new standard is effective for annual periods
beginning on or after January 1, 2018. The Company has
completed its assessment of the standard and adopted the standard
retrospectively on January 1, 2018. The Company has also
concluded that the adoption of IFRS 15 will not have a material
impact on its financial statements. Obsidian Energy will expand its
disclosures in the notes to the financial statements as outlined in
IFRS 15.
The IASB completed the final sections of IFRS 9 “Financial
Instruments” which replaces IAS 39 “Financial
Statement: Recognition and Measurement”. IFRS 9 provides
guidance on the recognition and measurement, impairment and
derecognition on financial instruments. The new standard is
effective for annual periods beginning on or after January 1,
2018. The Company has concluded that the adoption of IFRS 9 will
not result in any material changes in the measurement and carrying
value of the Company’s financial instruments.
The IASB issued IFRS 16 “Leases” in January 2016 which
replaces IAS 17 “Leases”. IFRS 16 outlines several new
requirements in regards to the recognition, measurement and
disclosure of leases. A key principle within the standard includes
a single lessee accounting model which requires lessees to
recognise assets and liabilities for all leases which have a term
more than 12 months. The accounting for lessors, which classify
leases as either operating or finance, remains substantially
unchanged from the previous standard. The new standard is effective
for annual reporting periods beginning on or after January 1,
2019. Obsidian Energy is currently assessing the impact of the
standard.
As at December 31, based on Obsidian Energy’s credit
assessments, provisions have been made for amounts deemed
uncollectible. As at December 31, the following accounts
receivable amounts were outstanding.
2017
2016
The Company fully utilized the deferred funding asset in the fourth
quarter of 2017 and expects payment from its partner during the
first quarter of 2018.
Current portion
Long-term portion
Total
Assets and liabilities classified as held for sale consisted of the
following:
Assets held for sale
Working capital
Property, plant and equipment
Liabilities related to assets held for sale
Working capital
Decommissioning liability
Cost
Balance at January 1, 2016
Capital expenditures
Joint venture, carried capital
Acquisitions
Dispositions
Transfers from E&E
Transfers to asset held for sale
Net decommissioning dispositions (1)
Balance at December 31, 2016
Capital expenditures
Joint venture, carried capital
Acquisitions
Dispositions
Transfers to asset held for sale
Net decommissioning dispositions (1)
SR&ED credits (note 11)
Balance at December 31, 2017
Accumulated depletion, depreciation and impairment
Balance at January 1, 2016
Depletion and depreciation
Impairments
Transfers to asset held for sale
Dispositions
Balance at December 31, 2016
Depletion and depreciation
Impairments
Transfers to asset held for sale
Dispositions
Balance at December 31, 2017
Net book value
Total
The following table outlines benchmark prices and assumptions the
Company used in the impairment test as at December 31,
2017:
2018
2019
2020
2021
2022
2023 – 2028
Thereafter (inflation percentage)
Bankers’ acceptances and prime rate loans
U.S. Senior secured notes – 2007 Notes
5.80%, US$5 million, matured May 31, 2017
5.90%, US$5 million, maturing May 31, 2019
Senior secured notes – 2008 Notes
6.30%, US$24 million, maturing May 29, 2018
6.40%, US$4 million, maturing May 29, 2020
Senior secured notes – 2009 Notes
9.32%, US$8 million, maturing May 5, 2019
Senior secured notes – 2010 Q1 Notes
5.29%, US$10 million, matured March 16, 2017
5.85%, US$10 million, maturing March 16, 2020
Senior secured notes – 2010 Q4 Notes
4.17%, US$6 million, matured December 2, 2017
4.88%, US$13 million, maturing December 2, 2020
4.98%, US$6 million, maturing December 2, 2022
5.23%, US$2 million, maturing December 2, 2025
Senior secured notes – 2011 Q4 Notes
4.79%, US$12 million, maturing November 30, 2021
Total long-term debt
Current portion
Long-term portion
In 2017, the Company repaid senior notes in the amount of
US$20 million as part of normal course maturities (2016
– $185 million normal course maturities and
$1,075 million in prepayments).
There were no senior note issuances in either 2017 or 2016.
Additional information on Obsidian Energy’s senior secured
notes was as follows:
Weighted average remaining life (years)
Weighted average interest rate
The estimated fair values of the principal and interest obligations
of the outstanding senior secured notes were as follows:
2007 Notes
2008 Notes
2009 Notes
2010 Q1 Notes
2010 Q4 Notes
2011 Notes
Total
The split between realized and unrealized foreign exchange is as
follows:
Realized foreign exchange loss on debt maturities
Realized foreign exchange loss on debt pre-payments
Unrealized foreign exchange gain
Foreign exchange gain
Decommissioning liability
Office lease provision
Total
Current portion
Long-term portion
Total
Changes to the decommissioning liability were as follows:
Balance, beginning of year
Net liabilities disposed (1)
Acquisitions
Increase (decrease) due to changes in estimates (2)
Liabilities settled
Transfers to liabilities for assets held for sale
Accretion charges
Balance, end of year
Current portion
Long-term portion
Changes to the office lease provision were as follows:
Balance, beginning of year
Net additions
Increase due to changes in estimates
Cash settlements
Accretion charges
Balance, end of year
Current portion
Long-term portion
The following table reconciles the changes in the fair value of
financial instruments outstanding:
Risk management asset (liability)
Balance, beginning of year
Unrealized gain (loss) on financial instruments:
Commodity collars, swaps and assignments
Electricity swaps
Foreign exchange forwards
Cross currency swaps
Total fair value, end of year
Total fair value consists of the following:
Current asset portion
Current liability portion
Non-current asset
portion
Non-current liability
portion
Total fair value
Obsidian Energy had the following financial instruments outstanding
as at December 31, 2017. Fair values are determined using
external counterparty information, which is compared to observable
market data. The Company limits its credit risk by executing
counterparty risk procedures which include transacting only with
institutions within its syndicated credit facility or companies
with high credit ratings and by obtaining financial security in
certain circumstances.
Notional Remaining term Pricing
Natural gas
AECO Swaps
AECO Swaps
AECO Swaps
AECO Swaps
AECO Swaps
AECO Swaps
Ventura
Crude Oil
WTI Swaps
WTI Swaps
WTI Swaps
WTI Swaps
WTI Swaps
WTI Swaps
WTI Swaps
WTI Swaps
WTI Swaps
WTI Swaps
WTI Swaps
WTI Swaps
WTI Swaps
WTI Swaps
Foreign exchange forward contracts on revenue
FX Collar
FX Swap
FX Swap
FX Swap
FX Swap
FX Swap
Cross currency swaps
10-year initial term
18-month offset
10-year initial term
Total
Based on December 31, 2017 pricing, a $1.00 change in the
price per barrel of liquids of WTI would have changed pre-tax unrealized risk management by
$7 million and a $0.10 change in the price per mcf of natural
gas would change pre-tax
unrealized risk management by $1 million.
Subsequent to December 31, 2017, the Company entered into the
following crude oil swaps and foreign exchange contracts on
long-term debt:
Reference Price WTI WTI USD/CAD USD/CAD USD/CAD
The components of risk management on the Consolidated Statements of
Loss are as follows:
Realized
Settlement of commodity contracts/assignment
Monetization of commodity contracts
Settlement of foreign exchange contracts
Monetization of foreign exchange contracts
Total realized risk management gain
Unrealized
Commodity contracts
Electricity swaps
Crude oil assignment
Foreign exchange contracts
Cross-currency swaps
Total unrealized risk management loss
Risk management gain (loss)
The following table outlines estimated future obligations for
non-derivative financial
liabilities as at December 31, 2017:
2018
2019
2020
2021
2022
Thereafter
The provision for income taxes is as follows:
Deferred tax recovery
The provision for income taxes reflects an effective tax rate that
differs from the combined federal and provincial statutory tax rate
as follows:
Loss before taxes
Combined statutory tax rate (1)
Computed income tax recovery
Increase (decrease) resulting from:
Share-based compensation
Non-taxable foreign
exchange (gain) loss
Unrecognized deferred tax asset
Adjustments related to prior years
Other
Deferred tax recovery
The net deferred income tax liability is comprised of the
following:
Deferred tax liabilities (assets)
PP&E
Risk management
Decommissioning liability
Share-based compensation
Non-capital losses
Net deferred tax liability
Deferred tax liabilities (assets)
PP&E
Risk management
Decommissioning liability
Share-based compensation
Non-capital losses
Net deferred tax liability
b) Issued
Shareholders’ capital
Balance, January 1, 2016
Issued on exercise of equity compensation plans (1)
Cancellation of dividend reinvestment plan (2)
Balance, December 31, 2016
Issued on exercise of equity compensation plans (1)
Elimination of deficit
Balance, December 31, 2017
Other Reserves
Balance, beginning of year
Share-based compensation expense
Net benefit on options exercised(1)
Balance, end of year
The fair value of the RPSU plan units under the equity method used
the following weighted average assumptions:
Average fair value of units granted (per unit)
Expected life of units (years)
Expected forfeiture rate
Options
Outstanding, beginning of year
Granted
Exercised
Forfeited
Outstanding, end of year
Exercisable, end of year
Range of Grant Prices
$1.00 - $1.99
$2.00 - $9.99
$10.00 - $21.99
Share-based compensation consisted of the following:
Options
PSU plan
DSU plan
RPSU plan – equity method
RPSU plan – liability method
Share-based compensation
RPSU plan
(number of shares equivalent)
Outstanding, beginning of year
Granted
Vested
Forfeited
Outstanding, end of year
Outstanding units – liability method
Outstanding units – equity method
RPSU obligation:
Current liability (1)
Non-current liability
PSU awards (number of shares equivalent)
Outstanding, beginning of period
Granted
Vested
Forfeited
Outstanding, end of period
PSU obligation:
Non-current liability
The number of incremental shares included in diluted earnings per
share is computed using the average volume-weighted market price of
shares for the period. In addition, contracts that could be settled
in cash or shares are assumed to be settled in shares if share
settlement is more dilutive.
Net loss – basic and diluted
The weighted average number of shares used to calculate per share
amounts is as follows:
Basic and Diluted
Accounts receivable (1)
Other current assets (2)
Deferred funding obligation
Accounts payable and accrued liabilities (3) (4)
Operating activities
Investing activities
Interest paid
Income taxes recovered
As at December 31, 2017, the Company was in compliance with
all of its financial covenants under such lending agreements.
(millions, except ratio amounts)
Components of capital
Shareholders’ equity
Long-term debt
Ratios
Senior debt to EBITDA (1)
Total debt to EBITDA (2)
Senior debt to capitalization (3)
Total debt to capitalization (4)
Priority debt to consolidated tangible assets (5)
EBITDA (6)
Credit facility debt and senior notes
Letters of credit (7)
Senior debt and total debt
Total shareholders’ equity
Total capitalization
Obsidian Energy is committed to certain payments over the next five
calendar years and thereafter as follows:
Long-term debt (1)
Transportation
Power infrastructure
Interest obligations
Office lease
Decommissioning liability
Total
The remuneration of the directors and key management personnel of
Obsidian Energy during the year is below.
Salary and employee benefits
Termination benefits
Share-based payments (1)
YEAR ENDED DECEMBER 31,
2017
CONSTANT PRICES AND COSTS
Net Proved Developed and
Proved Undeveloped Reserves (1)
December 31, 2016
Extensions & Discoveries
Improved Recovery & Infill Drilling
Technical Revisions
Acquisitions
Dispositions
Production
Change for the year
December 31, 2017
Developed
Undeveloped
Total (2)
YEAR ENDED DECEMBER 31, 2016
CONSTANT PRICES AND COSTS
Net Proved Developed and
Proved Undeveloped Reserves (1)
December 31, 2015
Extensions & Discoveries
Improved Recovery & Infill Drilling
Technical Revisions
Acquisitions
Dispositions
Production
Change for the year
December 31, 2016
Developed
Undeveloped
Total (2)
CAPITALIZED COSTS
As at December 31, ($CAD millions)
Proved oil and gas properties
Unproved oil and gas properties
Total capitalized costs
Accumulated depletion and depreciation
Net capitalized costs
COSTS INCURRED
Property acquisition (disposition) costs (1)
Proved oil and gas properties - acquisitions
Proved oil and gas properties - dispositions
Unproved oil and gas properties
Exploration costs (2)
Development costs (3)
Joint venture, carried capital
Capital expenditures
Corporate acquisitions
Total expenditures
STANDARD MEASURE OF DISCOUNTED FUTURE NET CASH
FLOWS
For the years ended December 31, ($CAD millions)
Future cash inflows
Future production costs
Future development costs
Undiscounted pre-tax cash
flows
Deferred income taxes (1)
Future net cash flows
Less 10% annual discount factor
Standardized measure of discounted future net cash flows
STANDARD MEASURE OF DISCOUNTED FUTURE NET CASH FLOW
CHANGES
For the years ended December 31, ($CAD millions)
Standardized measure of discounted future net cash flows at
beginning of year
Oil and gas sales during period net of production costs and
royalties (1)
Changes due to prices (2)
Development costs during the period (3)
Changes in forecast development costs (4)
Changes resulting from extensions, infills and improved recovery
(5)
Changes resulting from discoveries (2)
Changes resulting from acquisitions of reserves (5)
Changes resulting from dispositions of reserves (5)
Accretion of discount (6)
Net change in income tax (7)
Changes resulting from other changes and technical reserves
revisions plus effects on timing (8)
Standardized measure of discounted future net cash flows at end of
year
M'=+MH?*CMV*\0?\ (O:A_P!<&_E5RT_X\H/^N:_R
MH Q]GBK_ )Z:5_X__A1L\5?\]-*_\?\ \*WJ* ,'9XJ_YZ:5_P"/_P"%&SQ5
M_P ]-*_\?_PK>HH P=GBK_GII7_C_P#A5>YTO7]2FLUOI]/6WM[J*X;R0^X[
M&SCD5TU% !1110 54U.V>\TRYMXR \L;*N>F2*MT4 <[:2>([:S@@_LRT;RH
MU3/VCK@8]*F^U^(_^@7:?^!'_P!:MRB@##^U^(_^@7:?^!'_ -:C[7XC_P"@
M7:?^!'_UJW** ,/[7XC_ .@7:?\ @1_]:C[7XC_Z!=I_X$?_ %JW** .8@UO
M7Y]1N[)=)M0]L$+'[1P=PR.U6_M?B/\ Z!=I_P"!'_UJ--_Y&O7/I;_^@&MR
M@##^U^(_^@7:?^!'_P!:C[7XC_Z!=I_X$?\ UJW** ,/[7XC_P"@7:?^!'_U
MJ/M?B/\ Z!=I_P"!'_UJW** .8U./Q%J>GR6;:?:1K*5!?S\X 8'T]JZ6-=L
M:J>P IU% !1110 4444 %8_A?_D P?5OYFMBL?PO_P @ZM_,T ;%%%% !1
M110 4444 8NLZ9?W.I:?J&G2VZS6J2H5G!VL'V^GIL_6H]GBK_GII7_C_P#A
M6]10!@[/%7_/32O_ !__ HV>*O^>FE?^/\ ^%;U% L\5?\]-*_P#'_P#"
MC9XJ_P">FE?^/_X5O44 (KWBYU*VL(R.4LH=\@_P"!OD?^.B@#4O;^TTZ#
MS[RYC@CSC=(V,GT'J?85E_;-1UKY+"*2QLS]ZZG3;(X_V$/(^K?E5BR\/:?9
MS_:?+>XN\8^T7+F63Z MT'L,"M6@"M8V%OIUOY-NF 3N9B U2$7;3S/3?AOX>L=&\*
M65U#:F*]NX%>Y=@0['K@@],9Z5<59'#B:DIS:;T1V-4
)3;.A$,@(3*, O7).3U]Z2C)RNQ*,G*[
M,M?A_P"(#X _L\V\:WT5^;A8O-4[UV <'IFI]G+DL3R/EL:5CX=\67?C.TUK
M5[.W11:M$WE2#"?(R@$9ZY/ZTU&3E=E*,G*[*<7@O78/AE>:1):QK>R7JRJA
MF7!7CG/3M0J2QI;R3" O#.Z!MN/FX/4=*IVE
M&Z)J1T=S/2=YHK:Z^XT\2287MD XKJI6E#4YI73N3O?".*667Y80IYQTXZ5G
M4C&$;LTC)R=BW\.-'AL?#-O?^2J75_&DDI&
G3%
M 02.#B@ (SB@ &>] "T % !0!4U($Z=/SQM- $UN2;>(XXV#G\* ): "@ H
M * "@ H * "@ H * "@ H * "@ H * "@ H * "@ H * "@ H * "@ H * "
M@ H * "@ H S-2'EW=M<-&TD:9!"C.#VH C+:A<7*3QPF+RUX5SPV: ,CQ1>
M&ZT*1'0))'.H.#D=^]U4TN@DWU+JL&4$'(J1D)4M.7CQP,$
M^M '-^+-GVS0MA5@+PC:.H.Q^:VI[,PJ]""0=CD9X(%-"(SY"##2QICH?,%/
M45T5I[NPC1B=0MP?3S5_QII/L+F7<@_M32(T7_B:VJGO^_7^E.TNPN:/JZ
M;#O!V^@IR$C6J2@H * "@ H * "@ H * "@ H * "@ H * "@ H * "@ H *
M "@ H * "@ H * "@ H * "@ H * "@ H * "@ H * "@#-O+)8=]Y;-Y4J
MDX&0WX4 7+25I[6.5L!F&3CI0!-0 4 % !0 4 (!@DY/- "T % !0 4 % !0
M 4 -145=B@ #MZ4 (T:NK*PX88(S0 JJ$0*HPH& * (5,FQ/O,#U(&T_E3$3
M1IY:!02<=R
E($)04 )!X.* )5FQ]X4K!8T=-O!%)L+?NV_0U$E
^NI+FYE,LTARS'O72DHJR.E)15D=%X6
M\7)X;M+B!K)IS+)ORKA<<8]*QJTN=WN95:7.[W,/5KX:GJUU>K&8Q.Y<(3G%
M:PCRQ2-(QY8I'2^'?'$>@Z.EBU@\Q5F;>) .ISTQ6%2CSRO
12 Months Ended
Document Information [Line Items]
Document Type
40-F
Amendment Flag
false
Document Period End Date
Dec. 31, 2017
Document Fiscal Year Focus
2017
Document Fiscal Period Focus
FY
Trading Symbol
OBE
Entity Registrant Name
OBSIDIAN ENERGY LTD.
Entity Central Index Key
0001334388
Current Fiscal Year End Date
--12-31
Entity Current Reporting Status
Yes
Entity Common Stock, Shares Outstanding
0
CAD in Millions
Current
Cash
CAD 2
CAD 11
Accounts receivable
105
113
Other
18
18
Deferred funding asset
18
77
Risk management
11
8
Assets held for sale
35
114
Total current assets
189
341
Non-current
Deferred funding asset
16
Property, plant and equipment
2,819
2,982
Total non-current assets
2,819
2,998
Total assets
3,008
3,339
Current
Accounts payable and accrued liabilities
149
175
Current portion of long-term debt
31
27
Current portion of provisions
27
35
Risk management
55
26
Liabilities related to assets held for sale
24
81
Total current liabilities
286
344
Non-current
Long-term debt
328
442
Provisions
221
264
Risk management
6
25
Deferred tax liability
14
Other non-currentliabilities
1
3
Total liabilities
842
1,092
Shareholders' equity
Shareholders' capital
2,181
8,997
Other reserves
96
97
Deficit
(111)
(6,847)
Total shareholders' equity
2,166
2,247
Total liabilities and shareholders' equity
CAD 3,008
CAD 3,339
shares in Millions, CAD in Millions12 Months Ended
Oil and natural gas sales and other income
CAD 437
CAD 608
Royalties
(30)
(22)
Gross Revenue
407
586
Risk management gain (loss)
24
(11)
Total revenue
431
575
Expenses
Operating
176
281
Transportation
29
35
General and administrative
31
56
Restructuring
10
135
Share-based compensation
8
12
Depletion, depreciation, impairment and accretion
323
680
Gain on dispositions
(74)
(33)
Provisions
(8)
3
Foreign exchange gain
(5)
(84)
Financing
23
114
Other
15
Exploration and evaluation
242
Deferred funding asset
82
Total expenses
528
1,523
Loss before taxes
(97)
(948)
Deferred tax recovery
13
252
Net and comprehensive loss
CAD (84)
CAD (696)
Net loss per share
Basic
CAD (0.17)
CAD (1.39)
Diluted
CAD (0.17)
CAD (1.39)
Weighted average shares outstanding (millions)
Basic
503.9
502.3
Diluted
503.9
502.3
CAD in Millions
Beginning balance at Dec. 31, 2015
CAD 2,935
CAD 8,994
CAD 92
CAD (6,151)
Net and comprehensive loss
(696)
(696)
Share-based compensation
7
7
Issued on exercise of options
1
3
(2)
Ending balance at Dec. 31, 2016
2,247
8,997
97
(6,847)
Net and comprehensive loss
(84)
(84)
Share-based compensation
8
8
Issued on exercise of options
(5)
4
(9)
Elimination of deficit
(6,820)
6,820
Ending balance at Dec. 31, 2017
CAD 2,166
CAD 2,181
CAD 96
CAD (111)
12 Months Ended
Structure of Obsidian Energy
12 Months Ended
Basis of presentation and statement of compliance
12 Months Ended
Significant accounting policies
•
The significant risks and rewards of
ownership of the goods have been transferred to the buyer;
•
There is no continuing managerial
involvement to the degree usually associated with ownership or
effective control over the goods sold;
•
The amount of revenue can be reliably
measured;
•
It is probable that the economic
benefits associated with the transaction will flow to Obsidian
Energy; and
•
The costs incurred or to be incurred
in respect of the transaction can be reliably measured.
•
Fair value through profit or loss
financial assets and liabilities and derivative instruments
classified as held for trading or designated as fair value through
profit or loss are measured at fair value and subsequent changes in
fair value are recognized in income;
•
Loans and receivables are
non-derivative financial
assets with fixed or determinable payments that are not quoted in
an active market are initially measured at fair value with
subsequent changes at amortized cost;
•
Available-for-sale financial
instruments are measured at fair value with changes in fair value
recorded in equity until the instrument or a portion thereof is
derecognized or impaired at which time the amounts would be
recognized in income;
•
Held to maturity financial assets and
loans and receivables are initially measured at fair value with
subsequent measurement at amortized cost using the effective
interest method. The effective interest method calculates the
amortized cost of a financial asset and allocates interest income
or expense over the applicable period. The rate used discounts the
estimated future cash flows over either the expected life of the
financial asset or liability or a shorter time-frame if it is
deemed appropriate; and
•
Other financial liabilities are
initially measured at fair value with subsequent changes to fair
value measured at amortized cost.
•
Cash and cash equivalents and
accounts receivable are designated as loans and receivables;
•
Accounts payable and accrued
liabilities and long-term debt are designated as other financial
liabilities; and
•
Risk management contracts are
derivative financial instruments measured at fair value through
profit or loss.
•
The economic characteristics and
risks of the embedded derivative are not closely related to the
economic characteristics and risks of the host contract;
•
The embedded item, itself, meets the
definition of a derivative; and
•
The hybrid contract is not measured
at fair value or designated as held for trading.
12 Months Ended
Working capital
Current
30-90 days
90+ days
Total (1)
$
94
$
3
$
9
$
106
$
90
$
23
$
9
$
122
(1)
In 2017, $1 million of accounts
receivable is related to assets classified as held for sale (2016 -
$9 million).
12 Months Ended
Deferred funding asset
As at December 31
2017
2016
$
18
$
77
—
16
$
18
$
93
12 Months Ended
Assets and liabilities held for sale
As at December 31
2017
2016
$
1
$
10
34
104
$
35
$
114
$
1
$
6
23
75
$
24
$
81
12 Months Ended
Property, plant and equipment
Oil and gas
assets
Facilities
Corporate
assets
Total
$
10,731
$
5,310
$
169
$
16,210
37
43
2
82
40
—
—
40
2
1
—
3
(3,996
)
(999
)
—
(4,995
)
1
—
—
1
(430
)
(107
)
—
(537
)
(156
)
—
—
(156
)
$
6,229
$
4,248
$
171
$
10,648
56
83
2
141
50
—
—
50
5
1
—
6
(61
)
(15
)
—
(76
)
(100
)
(25
)
—
(125
)
(7
)
—
—
(7
)
(1
)
—
—
(1
)
$
6,171
$
4,292
$
173
$
10,636
(1)
Includes additions from drilling
activity, facility capital spending and disposals from net property
dispositions.
Oil and gas
Assets
Facilities
Corporate
assets
Total
$
8,545
$
2,426
$
94
$
11,065
263
91
14
368
230
58
—
288
(346
)
(87
)
—
(433
)
(2,898
)
(724
)
—
(3,622
)
$
5,794
$
1,764
$
108
$
7,666
201
74
14
289
12
3
—
15
(73
)
(18
)
—
(91
)
(50
)
(12
)
—
(62
)
$
5,884
$
1,811
$
122
$
7,817
As at December 31
2017
2016
$
2,819
$
2,982
WTI
($US/bbl)
AECO
($CAD/MMbtu)
Exchange rate
($US equals $1 CAD)
$
55.00
$
2.85
$
0.79
65.00
3.11
0.82
70.00
3.65
0.85
73.00
3.80
0.85
74.46
3.95
0.85
$
79.85
$
4.31
$
0.85
2.0
%
2.0
%
—
12 Months Ended
Long-term debt
As at December 31
2017
2016
$
253
$
329
—
6
5
6
31
33
5
5
10
11
—
13
12
13
—
8
17
17
7
8
3
3
16
17
$
359
$
469
$
31
$
27
$
328
$
442
As at December 31
2017
2016
2.3
2.7
6.0
%
6.3
%
As at December 31
2017
2016
$
6
$
12
36
38
10
11
12
25
25
33
14
15
$
103
$
134
Year ended December 31
2017
2016
$
(6
)
$
(37
)
—
(191
)
11
312
$
5
$
84
12 Months Ended
Provisions
Year ended December 31
2017
2016
$
147
$
182
101
117
$
248
$
299
$
27
$
35
221
264
$
248
$
299
Year ended December 31
2017
2016
$
182
$
397
(4
)
(193
)
—
5
(3
)
37
(16
)
(11
)
(23
)
(75
)
11
22
$
147
$
182
$
10
$
20
$
137
$
162
(1)
Includes additions from drilling
activity, facility capital spending and disposals from net property
dispositions.
(2)
In 2017, there were no changes in the
discount rate (2016 – $75 million increase).
Year ended December 31
2017
2016
$
117
$
—
(7
)
107
(1
)
12
(16
)
(4
)
8
2
$
101
$
117
$
17
$
15
$
84
$
102
12 Months Ended
Risk management
Year ended December 31
2017
2016
$
(43
)
$
104
(7
)
(74
)
—
4
(6
)
(43
)
6
(34
)
$
(50
)
$
(43
)
As at December 31
2017
2016
$
11
$
8
(55
)
(26
)
—
—
(6
)
(25
)
$
(50
)
$
(43
)
volume
Fair value (millions)
1,900 mcf/d
Jan/18 – Mar/18
$3.19/mcf
$
—
1,900 mcf/d
Jan/18 –
Jun/18
$2.91/mcf
—
1,900 mcf/d
Jan/18 –
Sep/18
$2.69/mcf
1
3,800 mcf/d
Jan/18 –
Mar/18
$3.33/mcf
—
3,800 mcf/d
Jan/18 –
Jun/18
$2.84/mcf
1
15,200 mcf/d
Jan/18 –
Dec/18
$2.67/mcf
6
7,500 mcf/d
Jan/18 –
Dec/18
US$2.79/mcf
—
1,000 bbl/d
Jan/18 –
Jun/18
$71.00/bbl
(1)
2,000 bbl/d
Jul/18 –
Dec/18
US$50.09/bbl
(4)
6,000 bbl/d
Jan/18 –
Mar/18
US$51.07/bbl
(6)
4,000 bbl/d
Apr/18 –
Jun/18
US$50.95/bbl
(4)
2,000 bbl/d
Jul/18 –
Sep/18
US$51.90/bbl
(2)
2,000 bbl/d
Oct/18 –
Dec/18
US$50.81/bbl
(2)
4,000 bbl/d
Jan/18 –
Dec/18
$71.04/bbl
(5)
1,000 bbl/d
Jan/18 –
Dec/18
US$49.35/bbl
(4)
2,000 bbl/d
Apr/18 –
Dec/18
US$48.43/bbl
(7)
1,000 bbl/d
Jul/18 –
Mar/19
US$50.20/bbl
(3)
2,000 bbl/d
Jan/19 –
Mar/19
$66.50/bbl
(1)
2,000 bbl/d
Jan/19 –
Mar/19
US$49.93/bbl
(1)
4,000 bbl/d
Jan/19 –
Jun/19
$68.58/bbl
(2)
1,000 bbl/d
Apr/19 –
Jun/19
US$55.35/bbl
—
US$24
2018
1.210 to 1.272 USD/CAD
—
US$24
2018
1.2768
1
US$24
2018
1.2500
—
US$24
2018
1.2568
—
US$24
2018
1.2803
1
US$12
2018
1.2840
—
£57
2018
2.0075 CAD/GBP, 6.95%
(18)
(£43)
2018
1.7049 CAD/GBP, 6.95%
—
£5
2019
1.8051 CAD/GBP, 9.15%
—
€10
2019
1.5870 CAD/EUR, 9.22%
—
$
(50)
Term
Price
Notional
Apr/19 – Jun/19
US$57.70/bbl
1,000 bbl/d
Jul/19 – Sep/19
US$57.00/bbl
1,000 bbl/d
Jan/19 –
May/19
1.2259
US$5
Jan/19 –
May/19
1.2319
US$5
Jan/19 –
May/19
1.2400
US$5
Year ended December 31
2017
2016
$
23
$
99
—
2
8
3
—
32
31
136
(7
)
(72
)
—
4
—
(2
)
(6
)
(43
)
6
(34
)
(7
)
(147
)
$
24
$
(11
)
Senior secured
notes
Accounts payable &
accrued liabilities (1)
Share-based
compensation
accrual
Total
$
31
$
148
$
2
$
181
16
—
1
17
34
—
—
34
15
—
—
15
7
—
—
7
$
3
$
—
$
—
$
3
(1)
Includes $1 million of accounts
payable and accrued liabilities related to assets classified as
held for sale.
12 Months Ended
Income taxes
Year ended December 31
2017
2016
$
(13
)
$
(252
)
Year ended December 31
2017
2016
$
(97
)
$
(948
)
27.0
%
27.0
%
$
(26
)
$
(256
)
2
1
(2
)
(11
)
5
—
5
14
3
—
$
(13
)
$
(252
)
(1)
The tax rate represents the combined
federal and provincial statutory tax rates for the Company and its
subsidiaries for the years ended December 31, 2017 and
December 31, 2016.
Balance
January 1, 2017
Provision
(Recovery)
in Income
Recognized in
Property, Plant
and Equipment
Balance
December 31,
2017
$
668
$
(53
)
$
(1
)
$
614
(40
)
5
—
(35
)
(69
)
23
—
(46
)
(4
)
3
—
(1
)
(541
)
9
—
(532
)
$
14
$
(13
)
$
(1
)
$
—
Balance
January 1, 2016
Provision
(Recovery)
in Income
Recognized in
Property, Plant
and Equipment
Balance
December 31,
2016
$
1,129
$
(461
)
$
—
$
668
12
(52
)
—
(40
)
(107
)
38
—
(69
)
(2
)
(2
)
—
(4
)
(766
)
225
—
(541
)
$
266
$
(252
)
$
—
$
14
12 Months Ended
Shareholders' equity
Common
Shares
Amount
502,163,163
$
8,994
600,775
3
(175
)
—
502,763,763
$
8,997
1,577,225
4
—
(6,820
)
504,340,988
$
2,181
(1)
Upon exercise of options, the net
benefit is recorded as a reduction of other reserves and an
increase to shareholders’ capital.
(2)
In March 2016, the Company cancelled
its dividend reinvestment plan.
Year ended December 31
2017
2016
$
97
$
92
8
7
(9
)
(2
)
$
96
$
97
(1)
Upon exercise of options, the net
benefit is recorded as a reduction of other reserves and an
increase to shareholders’ capital.
12 Months Ended
Share-based compensation
Year ended December 31
2017
2016
10,199,595
6,325,954
4,472,510
11,745,330
(3,935,186
)
(2,353,989
)
(2,339,541
)
(5,517,700
)
8,397,378
10,199,595
730,297
2,314,805
7,667,081
7,884,790
As at December 31
2017
2016
$
1
$
3
$
—
$
1
(1)
Included within Accounts payable and
accrued liabilities.
Year ended December 31
2017
2016
$
2.11
$
1.20
3.0
3.0
7.8
%
18.4
%
Year ended December 31
2017
2016
Number of
Options
Weighted
Average
Exercise
Price
Number of
Options
Weighted
Average
Exercise
Price
7,612,625
$
6.01
10,595,728
$
10.21
—
—
3,557,250
1.20
(1,577,225
)
1.44
(600,775
)
1.53
(2,372,825
)
11.22
(5,939,578
)
11.08
3,662,575
$
4.60
7,612,625
$
6.01
1,980,876
$
6.50
2,804,426
$
11.10
Options Outstanding
Options Exercisable
Number
Outstanding
Weighted
Average
Exercise
Price
Weighted
Remaining
Contractual
Life
(years)
Number
Exercisable
Weighted
Average
Exercise
Price
2,005,425
$
1.42
2.8
631,238
$
1.53
1,058,950
7.44
1.4
751,438
7.66
598,200
10.30
0.3
598,200
10.30
3,662,575
$
4.60
1.2
1,980,876
$
6.50
Year ended December 31
2017
2016
1,855,500
1,622,881
569,000
2,516,000
(638,750
)
(199,843
)
(246,750
)
(2,083,538
)
1,539,000
1,855,500
As at December 31
2017
2016
$
1
$
2
Year ended December 31
2017
2016
$
1
$
1
1
1
—
1
7
6
(1
)
3
$
8
$
12
12 Months Ended
Per share amounts
Year ended December 31
2017
2016
$
(84
)
$
(696
)
Year ended December 31
2017
2016
503,933,024
502,316,003
12 Months Ended
Changes in non-cashworking capital (increase) decrease
Year ended December 31
2017
2016
$
12
$
32
—
23
25
16
(35
)
(191
)
2
(120
)
5
(97
)
(3
)
(23
)
$
2
$
(120
)
$
23
$
124
$
—
$
—
(1)
$1 million of accounts
receivable is related to assets classified as held for sale in 2017
(2016 - $9 million).
(2)
No other current assets were
classified as held for sale in 2017 (2016 - $1 million).
(3)
$1 million of accounts payable
and accrued liabilities is related to assets classified as held for
sale in 2017 (2016 - $6 million).
(4)
Includes share-based compensation
plans.
12 Months Ended
Capital management
Year ended December 31
2017
2016
$
2,166
$
2,247
$
359
$
469
1.9
2.0
1.9
2.0
15
%
17
%
15
%
17
%
—
—
$
194
$
235
$
359
$
469
10
6
369
475
2,166
2,247
$
2,535
$
2,722
(1)
As at December 31, 2017, less
than 3:1
(2)
As at December 31, 2017, less
than 4:1
(3)
Not to exceed 50 percent
(4)
Not to exceed 55 percent
(5)
Priority debt not to exceed 15% of
consolidated tangible assets.
(6)
EBITDA is calculated in accordance
with Obsidian Energy’s lending agreements wherein unrealized
risk management and impairment provisions are excluded.
Additionally, under the syndicated credit facility, realized
foreign exchange gains or losses related to debt maturities are
excluded from the calculation.
(7)
Letters of credit defined as
financial under the lending agreements are included in the
calculation.
12 Months Ended
Commitments and contingencies
2018
2019
2020
2021
2022
Thereafter
Total
$
31
$
269
$
34
$
15
$
7
$
3
$
359
12
10
9
7
5
14
57
8
2
—
—
—
—
10
12
6
2
1
1
—
22
34
34
34
34
34
73
243
10
10
10
10
10
97
147
$
107
$
331
$
89
$
67
$
57
$
187
$
838
(1)
The 2019 figure includes $253 million
related to the syndicated credit facility that is due for renewal
in 2019. Historically, the Company has successfully renewed its
syndicated credit facility.
•
Transportation commitments relate to
costs for future pipeline access.
•
Power infrastructure commitments
pertain to electricity contracts.
•
Interest obligations are the
estimated future interest payments related to Obsidian
Energy’s debt instruments.
•
Office leases pertain to total leased
office space. A portion of this office space has been sub-leased to other parties to
minimize Obsidian Energy’s net exposure under the leases. The
future office lease commitments above will be reduced by sublease
recoveries totaling $101 million. For 2017, lease costs, net
of recoveries totaled $19 million.
•
The decommissioning liability
represents the inflated, discounted future reclamation and
abandonment costs that are expected to be incurred over the life of
the properties.
12 Months Ended
Related-party transactions
Year ended December 31
2017
2016
$
3
$
2
2
2
3
2
$
8
$
6
(1)
Includes changes in the fair value of
PSUs, DSUs and non-cash
charges related to the Option Plan and RPSU plan (equity method)
for key management personnel.
12 Months Ended
Supplemental Items
12 Months Ended
Supplementary Oil and Gas Information - (Unaudited)
Light and
Medium
Crude Oil
(mmbbl)
Heavy
Crude Oil
and
Bitumen
(mmbbl)
Natural
Gas
(bcf)
Natural Gas
Liquids
(mmbbl)
Barrels of Oil
Equivalent
(mmboe)
43
7
164
4
81
2
—
14
1
5
1
1
2
—
3
5
1
60
3
19
—
—
—
—
—
(7
)
—
(76
)
(1
)
(21
)
(4
)
(2
)
(26
)
(1
)
(12
)
(3
)
—
(26
)
2
(6
)
41
7
138
5
76
32
5
119
4
62
9
1
20
1
14
41
7
138
5
76
(1)
Columns may not add due to
rounding.
(2)
Obsidian Energy does not file any
estimates of total net proved crude oil or natural gas reserves
with any U.S. federal authority or agency other than the SEC.
Light and
Medium
Crude Oil
(mmbbl)
Heavy
Crude Oil
and
Bitumen
(mmbbl)
Natural
Gas
(bcf)
Natural Gas
Liquids
(mmbbl)
Barrels of Oil
Equivalent
(mmboe)
83
24
230
7
153
—
—
—
—
—
—
1
—
—
2
(1
)
1
13
—
3
—
—
14
—
2
(32
)
(16
)
(49
)
(2
)
(58
)
(8
)
(3
)
(44
)
(1
)
(20
)
(41
)
(17
)
(66
)
(3
)
(71
)
43
7
164
4
81
37
6
152
4
72
6
1
12
—
9
43
7
164
4
81
(1)
Columns may not add due to
rounding.
(2)
Obsidian Energy does not file any
estimates of total net proved crude oil or natural gas reserves
with any U.S. federal authority or agency other than the SEC.
2017
2016
$
10,636
$
10,648
—
—
10,636
10,648
(7,817
)
(7,666
)
$
2,819
$
2,982
For the years ended December 31, ($CAD
millions)
2017
2016
$
6
$
—
(116
)
(1,418
)
3
2
2
4
184
114
(50
)
(40
)
29
(1,338
)
—
3
$
29
$
(1,335
)
(1)
Acquisitions are net of disposition
of properties.
(2)
Cost of geological and geophysical
capital expenditures and costs on exploratory plays.
(3)
Includes equipping and facilities
capital expenditures.
2017
2016
$
3,384
$
2,885
(1,625
)
(1,545
)
(302
)
(223
)
1,457
1,117
—
—
1,457
1,117
(661
)
(486
)
$
796
$
631
(1)
Obsidian Energy is currently not cash
taxable.
2017
2016
$
631
$
1,307
(213
)
(336
)
481
(449
)
141
83
(202
)
5
73
27
1
—
—
8
(71
)
(578
)
63
131
—
—
(109
)
433
$
796
$
631
(1)
Company actual before income taxes,
excluding general and administrative expenses.
(2)
The impact of changes in prices and
other economic factors on future net revenue.
(3)
Actual capital expenditures relating
to the exploration, development and production of oil and gas
reserves.
(4)
The change in forecast development
costs.
(5)
End of period net present value of
the related reserves.
(6)
Estimated as 10 percent of the
beginning of period net present value.
(7)
The difference between forecast
income taxes at beginning of period and the actual taxes for the
period plus forecast income taxes at the end of period.
(8)
Includes changes due to revised
production profiles, development timing, operating costs, royalty
rates and actual prices received versus forecast, etc.
12 Months Ended
Critical accounting judgments and key estimates
Business combinations
Revenue
•
The significant risks and rewards of
ownership of the goods have been transferred to the buyer;
•
There is no continuing managerial
involvement to the degree usually associated with ownership or
effective control over the goods sold;
•
The amount of revenue can be reliably
measured;
•
It is probable that the economic
benefits associated with the transaction will flow to Obsidian
Energy; and
•
The costs incurred or to be incurred
in respect of the transaction can be reliably measured.
Joint arrangements
Transportation expense
Foreign currency translation
PP&E
Share-based payments
Provisions
Leases
Share capital
Earnings per share
Taxation
Financial instruments
•
Fair value through profit or loss
financial assets and liabilities and derivative instruments
classified as held for trading or designated as fair value through
profit or loss are measured at fair value and subsequent changes in
fair value are recognized in income;
•
Loans and receivables are
non-derivative financial
assets with fixed or determinable payments that are not quoted in
an active market are initially measured at fair value with
subsequent changes at amortized cost;
•
Available-for-sale financial
instruments are measured at fair value with changes in fair value
recorded in equity until the instrument or a portion thereof is
derecognized or impaired at which time the amounts would be
recognized in income;
•
Held to maturity financial assets and
loans and receivables are initially measured at fair value with
subsequent measurement at amortized cost using the effective
interest method. The effective interest method calculates the
amortized cost of a financial asset and allocates interest income
or expense over the applicable period. The rate used discounts the
estimated future cash flows over either the expected life of the
financial asset or liability or a shorter time-frame if it is
deemed appropriate; and
•
Other financial liabilities are
initially measured at fair value with subsequent changes to fair
value measured at amortized cost.
•
Cash and cash equivalents and
accounts receivable are designated as loans and receivables;
•
Accounts payable and accrued
liabilities and long-term debt are designated as other financial
liabilities; and
•
Risk management contracts are
derivative financial instruments measured at fair value through
profit or loss.
Embedded derivatives
•
The economic characteristics and
risks of the embedded derivative are not closely related to the
economic characteristics and risks of the host contract;
•
The embedded item, itself, meets the
definition of a derivative; and
•
The hybrid contract is not measured
at fair value or designated as held for trading.
Classification of debt or equity
Future accounting pronouncements
12 Months Ended
Disclosure of Detailed Information about Accounts Receivable
Current
30-90 days
90+ days
Total (1)
$
94
$
3
$
9
$
106
$
90
$
23
$
9
$
122
(1)
In 2017, $1 million of accounts
receivable is related to assets classified as held for sale (2016 -
$9 million).
12 Months Ended
Disclosure of Detailed Information About Composition of Deferred Funding Asset
As at December 31
2017
2016
$
18
$
77
—
16
$
18
$
93
12 Months Ended
Disclosure of Detailed Information about Assets and Liabilities Held for Sale
As at December 31
2017
2016
$
1
$
10
34
104
$
35
$
114
$
1
$
6
23
75
$
24
$
81
12 Months Ended
Disclosure of Property Plant and Equipment
Oil and gas
assets
Facilities
Corporate
assets
Total
$
10,731
$
5,310
$
169
$
16,210
37
43
2
82
40
—
—
40
2
1
—
3
(3,996
)
(999
)
—
(4,995
)
1
—
—
1
(430
)
(107
)
—
(537
)
(156
)
—
—
(156
)
$
6,229
$
4,248
$
171
$
10,648
56
83
2
141
50
—
—
50
5
1
—
6
(61
)
(15
)
—
(76
)
(100
)
(25
)
—
(125
)
(7
)
—
—
(7
)
(1
)
—
—
(1
)
$
6,171
$
4,292
$
173
$
10,636
(1)
Includes additions from drilling
activity, facility capital spending and disposals from net property
dispositions.
Oil and gas
Assets
Facilities
Corporate
assets
Total
$
8,545
$
2,426
$
94
$
11,065
263
91
14
368
230
58
—
288
(346
)
(87
)
—
(433
)
(2,898
)
(724
)
—
(3,622
)
$
5,794
$
1,764
$
108
$
7,666
201
74
14
289
12
3
—
15
(73
)
(18
)
—
(91
)
(50
)
(12
)
—
(62
)
$
5,884
$
1,811
$
122
$
7,817
As at December 31
2017
2016
$
2,819
$
2,982
Disclosure of Benchmark Prices Used in Impairment Tests
WTI
($US/bbl)
AECO
($CAD/MMbtu)
Exchange rate
($US equals $1 CAD)
$
55.00
$
2.85
$
0.79
65.00
3.11
0.82
70.00
3.65
0.85
73.00
3.80
0.85
74.46
3.95
0.85
$
79.85
$
4.31
$
0.85
2.0
%
2.0
%
—
12 Months Ended
Schedule of Long-term Debt
As at December 31
2017
2016
$
253
$
329
—
6
5
6
31
33
5
5
10
11
—
13
12
13
—
8
17
17
7
8
3
3
16
17
$
359
$
469
$
31
$
27
$
328
$
442
As at December 31
2017
2016
2.3
2.7
6.0
%
6.3
%
Estimated Fair Values of Principal and Interest Obligations of Outstanding Senior Secured Notes
As at December 31
2017
2016
$
6
$
12
36
38
10
11
12
25
25
33
14
15
$
103
$
134
Realized and Unrealized Gain (Loss) on Foreign Exchange
Year ended December 31
2017
2016
$
(6
)
$
(37
)
—
(191
)
11
312
$
5
$
84
12 Months Ended
Summary of Provisions
Year ended December 31
2017
2016
$
147
$
182
101
117
$
248
$
299
$
27
$
35
221
264
$
248
$
299
Summary of Changes to Decommissioning Liability
Year ended December 31
2017
2016
$
182
$
397
(4
)
(193
)
—
5
(3
)
37
(16
)
(11
)
(23
)
(75
)
11
22
$
147
$
182
$
10
$
20
$
137
$
162
(1)
Includes additions from drilling
activity, facility capital spending and disposals from net property
dispositions.
(2)
In 2017, there were no changes in the
discount rate (2016 – $75 million increase).
Summary of Changes to Office Lease Provision
Year ended December 31
2017
2016
$
117
$
—
(7
)
107
(1
)
12
(16
)
(4
)
8
2
$
101
$
117
$
17
$
15
$
84
$
102
12 Months Ended
Summary of Reconcilation of Change in Fair Value of Financial Instruments Outstanding
Year ended December 31
2017
2016
$
(43
)
$
104
(7
)
(74
)
—
4
(6
)
(43
)
6
(34
)
$
(50
)
$
(43
)
As at December 31
2017
2016
$
11
$
8
(55
)
(26
)
—
—
(6
)
(25
)
$
(50
)
$
(43
)
Schedule of Financial Instruments Outstanding
volume
Fair value (millions)
1,900 mcf/d
Jan/18 – Mar/18
$3.19/mcf
$
—
1,900 mcf/d
Jan/18 –
Jun/18
$2.91/mcf
—
1,900 mcf/d
Jan/18 –
Sep/18
$2.69/mcf
1
3,800 mcf/d
Jan/18 –
Mar/18
$3.33/mcf
—
3,800 mcf/d
Jan/18 –
Jun/18
$2.84/mcf
1
15,200 mcf/d
Jan/18 –
Dec/18
$2.67/mcf
6
7,500 mcf/d
Jan/18 –
Dec/18
US$2.79/mcf
—
1,000 bbl/d
Jan/18 –
Jun/18
$71.00/bbl
(1)
2,000 bbl/d
Jul/18 –
Dec/18
US$50.09/bbl
(4)
6,000 bbl/d
Jan/18 –
Mar/18
US$51.07/bbl
(6)
4,000 bbl/d
Apr/18 –
Jun/18
US$50.95/bbl
(4)
2,000 bbl/d
Jul/18 –
Sep/18
US$51.90/bbl
(2)
2,000 bbl/d
Oct/18 –
Dec/18
US$50.81/bbl
(2)
4,000 bbl/d
Jan/18 –
Dec/18
$71.04/bbl
(5)
1,000 bbl/d
Jan/18 –
Dec/18
US$49.35/bbl
(4)
2,000 bbl/d
Apr/18 –
Dec/18
US$48.43/bbl
(7)
1,000 bbl/d
Jul/18 –
Mar/19
US$50.20/bbl
(3)
2,000 bbl/d
Jan/19 –
Mar/19
$66.50/bbl
(1)
2,000 bbl/d
Jan/19 –
Mar/19
US$49.93/bbl
(1)
4,000 bbl/d
Jan/19 –
Jun/19
$68.58/bbl
(2)
1,000 bbl/d
Apr/19 –
Jun/19
US$55.35/bbl
—
US$24
2018
1.210 to 1.272 USD/CAD
—
US$24
2018
1.2768
1
US$24
2018
1.2500
—
US$24
2018
1.2568
—
US$24
2018
1.2803
1
US$12
2018
1.2840
—
£57
2018
2.0075 CAD/GBP, 6.95%
(18)
(£43)
2018
1.7049 CAD/GBP, 6.95%
—
£5
2019
1.8051 CAD/GBP, 9.15%
—
€10
2019
1.5870 CAD/EUR, 9.22%
—
$
(50)
Term
Price
Notional
Apr/19 – Jun/19
US$57.70/bbl
1,000 bbl/d
Jul/19 – Sep/19
US$57.00/bbl
1,000 bbl/d
Jan/19 –
May/19
1.2259
US$5
Jan/19 –
May/19
1.2319
US$5
Jan/19 –
May/19
1.2400
US$5
Components of Risk Management on Consolidated Statements of Loss
Year ended December 31
2017
2016
$
23
$
99
—
2
8
3
—
32
31
136
(7
)
(72
)
—
4
—
(2
)
(6
)
(43
)
6
(34
)
(7
)
(147
)
$
24
$
(11
)
Summary of Estimated Future Obligations for Non-Derivative Financial Liabilities
Senior secured
notes
Accounts payable &
accrued liabilities (1)
Share-based
compensation
accrual
Total
$
31
$
148
$
2
$
181
16
—
1
17
34
—
—
34
15
—
—
15
7
—
—
7
$
3
$
—
$
—
$
3
(1)
Includes $1 million of accounts
payable and accrued liabilities related to assets classified as
held for sale.
12 Months Ended
Summary of Provision for Income Taxes
Year ended December 31
2017
2016
$
(13
)
$
(252
)
Summary of Provision for Income Taxes Reflects Effective Tax Rate
Year ended December 31
2017
2016
$
(97
)
$
(948
)
27.0
%
27.0
%
$
(26
)
$
(256
)
2
1
(2
)
(11
)
5
—
5
14
3
—
$
(13
)
$
(252
)
(1)
The tax rate represents the combined
federal and provincial statutory tax rates for the Company and its
subsidiaries for the years ended December 31, 2017 and
December 31, 2016.
Summary of Net Deferred Income Tax Liability
Balance
January 1, 2017
Provision
(Recovery)
in Income
Recognized in
Property, Plant
and Equipment
Balance
December 31,
2017
$
668
$
(53
)
$
(1
)
$
614
(40
)
5
—
(35
)
(69
)
23
—
(46
)
(4
)
3
—
(1
)
(541
)
9
—
(532
)
$
14
$
(13
)
$
(1
)
$
—
Balance
January 1, 2016
Provision
(Recovery)
in Income
Recognized in
Property, Plant
and Equipment
Balance
December 31,
2016
$
1,129
$
(461
)
$
—
$
668
12
(52
)
—
(40
)
(107
)
38
—
(69
)
(2
)
(2
)
—
(4
)
(766
)
225
—
(541
)
$
266
$
(252
)
$
—
$
14
12 Months Ended
Summary of Issued Capital
Common
Shares
Amount
502,163,163
$
8,994
600,775
3
(175
)
—
502,763,763
$
8,997
1,577,225
4
—
(6,820
)
504,340,988
$
2,181
(1)
Upon exercise of options, the net
benefit is recorded as a reduction of other reserves and an
increase to shareholders’ capital.
(2)
In March 2016, the Company cancelled
its dividend reinvestment plan.
Summary of Other Reserves
Year ended December 31
2017
2016
$
97
$
92
8
7
(9
)
(2
)
$
96
$
97
(1)
Upon exercise of options, the net
benefit is recorded as a reduction of other reserves and an
increase to shareholders’ capital.
12 Months Ended
Summary of Weighted Average Assumptions of RPSU Plan Units Under Equity Method
Year ended December 31
2017
2016
$
2.11
$
1.20
3.0
3.0
7.8
%
18.4
%
Summary of Stock Option Activity and Related Information
Year ended December 31
2017
2016
Number of
Options
Weighted
Average
Exercise
Price
Number of
Options
Weighted
Average
Exercise
Price
7,612,625
$
6.01
10,595,728
$
10.21
—
—
3,557,250
1.20
(1,577,225
)
1.44
(600,775
)
1.53
(2,372,825
)
11.22
(5,939,578
)
11.08
3,662,575
$
4.60
7,612,625
$
6.01
1,980,876
$
6.50
2,804,426
$
11.10
Summary of Options Outstanding and Exercisable
Options Outstanding
Options Exercisable
Number
Outstanding
Weighted
Average
Exercise
Price
Weighted
Remaining
Contractual
Life
(years)
Number
Exercisable
Weighted
Average
Exercise
Price
2,005,425
$
1.42
2.8
631,238
$
1.53
1,058,950
7.44
1.4
751,438
7.66
598,200
10.30
0.3
598,200
10.30
3,662,575
$
4.60
1.2
1,980,876
$
6.50
Summary of Share-Based Compensation
Year ended December 31
2017
2016
$
1
$
1
1
1
—
1
7
6
(1
)
3
$
8
$
12
Restricted share unit plan [member]
Summary of Performance Share Unit Plan
Year ended December 31
2017
2016
10,199,595
6,325,954
4,472,510
11,745,330
(3,935,186
)
(2,353,989
)
(2,339,541
)
(5,517,700
)
8,397,378
10,199,595
730,297
2,314,805
7,667,081
7,884,790
As at December 31
2017
2016
$
1
$
3
$
—
$
1
(1)
Included within Accounts payable and
accrued liabilities.
PSU Plan [member]
Summary of Performance Share Unit Plan
Year ended December 31
2017
2016
1,855,500
1,622,881
569,000
2,516,000
(638,750
)
(199,843
)
(246,750
)
(2,083,538
)
1,539,000
1,855,500
As at December 31
2017
2016
$
1
$
2
12 Months Ended
Disclosure of Detailed Information about Net Loss Basic and Diluted
Year ended December 31
2017
2016
$
(84
)
$
(696
)
Disclosure of Detailed Information about Weighted Average Number of Shares Per Share
Year ended December 31
2017
2016
503,933,024
502,316,003
12 Months Ended
Summary of Changes in Non-cash Working Capital (Increase) Decrease
Year ended December 31
2017
2016
$
12
$
32
—
23
25
16
(35
)
(191
)
2
(120
)
5
(97
)
(3
)
(23
)
$
2
$
(120
)
$
23
$
124
$
—
$
—
(1)
$1 million of accounts
receivable is related to assets classified as held for sale in 2017
(2016 - $9 million).
(2)
No other current assets were
classified as held for sale in 2017 (2016 - $1 million).
(3)
$1 million of accounts payable
and accrued liabilities is related to assets classified as held for
sale in 2017 (2016 - $6 million).
(4)
Includes share-based compensation
plans.
12 Months Ended
Summary of Financial Covenants Under Lending Agreements
Year ended December 31
2017
2016
$
2,166
$
2,247
$
359
$
469
1.9
2.0
1.9
2.0
15
%
17
%
15
%
17
%
—
—
$
194
$
235
$
359
$
469
10
6
369
475
2,166
2,247
$
2,535
$
2,722
(1)
As at December 31, 2017, less
than 3:1
(2)
As at December 31, 2017, less
than 4:1
(3)
Not to exceed 50 percent
(4)
Not to exceed 55 percent
(5)
Priority debt not to exceed 15% of
consolidated tangible assets.
(6)
EBITDA is calculated in accordance
with Obsidian Energy’s lending agreements wherein unrealized
risk management and impairment provisions are excluded.
Additionally, under the syndicated credit facility, realized
foreign exchange gains or losses related to debt maturities are
excluded from the calculation.
(7)
Letters of credit defined as
financial under the lending agreements are included in the
calculation.
12 Months Ended
Summary of Certain Payments Over the Next Five Years
2018
2019
2020
2021
2022
Thereafter
Total
$
31
$
269
$
34
$
15
$
7
$
3
$
359
12
10
9
7
5
14
57
8
2
—
—
—
—
10
12
6
2
1
1
—
22
34
34
34
34
34
73
243
10
10
10
10
10
97
147
$
107
$
331
$
89
$
67
$
57
$
187
$
838
(1)
The 2019 figure includes $253 million
related to the syndicated credit facility that is due for renewal
in 2019. Historically, the Company has successfully renewed its
syndicated credit facility.
12 Months Ended
Summary of Compensation of key Management Personnel
Year ended December 31
2017
2016
$
3
$
2
2
2
3
2
$
8
$
6
(1)
Includes changes in the fair value of
PSUs, DSUs and non-cash
charges related to the Option Plan and RPSU plan (equity method)
for key management personnel.
12 Months Ended
Net Proved Oil and Natural Gas Reserves
Light and
Medium
Crude Oil
(mmbbl)
Heavy
Crude Oil
and
Bitumen
(mmbbl)
Natural
Gas
(bcf)
Natural Gas
Liquids
(mmbbl)
Barrels of Oil
Equivalent
(mmboe)
43
7
164
4
81
2
—
14
1
5
1
1
2
—
3
5
1
60
3
19
—
—
—
—
—
(7
)
—
(76
)
(1
)
(21
)
(4
)
(2
)
(26
)
(1
)
(12
)
(3
)
—
(26
)
2
(6
)
41
7
138
5
76
32
5
119
4
62
9
1
20
1
14
41
7
138
5
76
(1)
Columns may not add due to
rounding.
(2)
Obsidian Energy does not file any
estimates of total net proved crude oil or natural gas reserves
with any U.S. federal authority or agency other than the SEC.
Light and
Medium
Crude Oil
(mmbbl)
Heavy
Crude Oil
and
Bitumen
(mmbbl)
Natural
Gas
(bcf)
Natural Gas
Liquids
(mmbbl)
Barrels of Oil
Equivalent
(mmboe)
83
24
230
7
153
—
—
—
—
—
—
1
—
—
2
(1
)
1
13
—
3
—
—
14
—
2
(32
)
(16
)
(49
)
(2
)
(58
)
(8
)
(3
)
(44
)
(1
)
(20
)
(41
)
(17
)
(66
)
(3
)
(71
)
43
7
164
4
81
37
6
152
4
72
6
1
12
—
9
43
7
164
4
81
(1)
Columns may not add due to
rounding.
(2)
Obsidian Energy does not file any
estimates of total net proved crude oil or natural gas reserves
with any U.S. federal authority or agency other than the SEC.
Capitalized Costs
2017
2016
$
10,636
$
10,648
—
—
10,636
10,648
(7,817
)
(7,666
)
$
2,819
$
2,982
Costs Incurred
For the years ended December 31, ($CAD
millions)
2017
2016
$
6
$
—
(116
)
(1,418
)
3
2
2
4
184
114
(50
)
(40
)
29
(1,338
)
—
3
$
29
$
(1,335
)
(1)
Acquisitions are net of disposition
of properties.
(2)
Cost of geological and geophysical
capital expenditures and costs on exploratory plays.
(3)
Includes equipping and facilities
capital expenditures.
Standardized Measure of Discounted Future Net Cash Flows
2017
2016
$
3,384
$
2,885
(1,625
)
(1,545
)
(302
)
(223
)
1,457
1,117
—
—
1,457
1,117
(661
)
(486
)
$
796
$
631
(1)
Obsidian Energy is currently not cash
taxable.
Standardized Measure of Discounted Future Net Cash Flow Changes
2017
2016
$
631
$
1,307
(213
)
(336
)
481
(449
)
141
83
(202
)
5
73
27
1
—
—
8
(71
)
(578
)
63
131
—
—
(109
)
433
$
796
$
631
(1)
Company actual before income taxes,
excluding general and administrative expenses.
(2)
The impact of changes in prices and
other economic factors on future net revenue.
(3)
Actual capital expenditures relating
to the exploration, development and production of oil and gas
reserves.
(4)
The change in forecast development
costs.
(5)
End of period net present value of
the related reserves.
(6)
Estimated as 10 percent of the
beginning of period net present value.
(7)
The difference between forecast
income taxes at beginning of period and the actual taxes for the
period plus forecast income taxes at the end of period.
(8)
Includes changes due to revised
production profiles, development timing, operating costs, royalty
rates and actual prices received versus forecast, etc.
12 Months Ended
Disclosure of operating segments [line items]
Number of operating segment
1
Percentage of ownership in petroleum and natural gas assets
100.00%
Peace River Oil Partnership [member]
Disclosure of operating segments [line items]
Proportion of ownership interest in joint arrangement
55.00%
12 Months Ended
Later than three months [member] | Trade receivables [member]
Disclosure of accounts receivables [line items]
Receivables past due period
90 Days
CAD in Millions
Disclosure of accounts receivables [line items]
Accounts receivables
CAD 106
CAD 122
Current [member]
Disclosure of accounts receivables [line items]
Accounts receivables
94
90
Later than one month and not later than three months [member]
Disclosure of accounts receivables [line items]
Accounts receivables
3
23
Later than three months [member]
Disclosure of accounts receivables [line items]
Accounts receivables
CAD 9
CAD 9
CAD in Millions
Disclosure of accounts receivables [line items]
Accounts receivables
CAD 105
CAD 113
Disposal groups classified as held for sale [member]
Disclosure of accounts receivables [line items]
Accounts receivables
CAD 1
CAD 9
CAD in Millions
Disclosure of financial assets [line items]
Current portion
CAD 18
CAD 77
Long-term portion
16
Total
CAD 18
CAD 93
CAD in Millions
Disclosure of assets and liabilities classified as held for sale [Line Items]
Assets held for sale
CAD 35
CAD 114
Liabilities related to assets held for sale
24
81
Working capital [member]
Disclosure of assets and liabilities classified as held for sale [Line Items]
Assets held for sale
1
10
Liabilities related to assets held for sale
1
6
Disposal of property, plant and equipment [member]
Disclosure of assets and liabilities classified as held for sale [Line Items]
Assets held for sale
34
104
Decommissioning liability [member]
Disclosure of assets and liabilities classified as held for sale [Line Items]
Liabilities related to assets held for sale
CAD 23
CAD 75
CAD in Millions
1 Months Ended
Depletion depreciation, impairment and accretion [member]
Disclosure of assets and liabilities classified as held for sale [Line Items]
Impairment loss, net of tax
CAD 12
CAD 65
Impairment loss
CAD 15
CAD 65
Classification of assets as held for sale [member]
Disclosure of assets and liabilities classified as held for sale [Line Items]
Proceeds from sale assets
CAD 22
12 Months Ended
Disclosure of detailed information about property, plant and equipment [line items]
Gains on disposition of assets
CAD 74,000,000
CAD 33,000,000
Transaction costs related to advisory fees
CAD 9,000,000
Impairment reversal
CAD 0
Disclosure of detailed information about property, plant and equipment [line items]
2018 | CAD / shares
CAD 0.79
2019 | CAD / shares
0.82
2020 | CAD / shares
0.85
2021 | CAD / shares
0.85
2022 | CAD / shares
0.85
2023 - 2028 | CAD / shares
CAD 0.85
WTI [member]
Disclosure of detailed information about property, plant and equipment [line items]
2018 | bbl
55.00
2019 | bbl
65.00
2020 | bbl
70.00
2021 | bbl
73.00
2022 | bbl
74.46
2023 - 2028 | bbl
79.85
Thereafter (inflation percentage)
2.00%
AECO [member]
Disclosure of detailed information about property, plant and equipment [line items]
2018 | MMBTU
2.85
2019 | MMBTU
3.11
2020 | MMBTU
3.65
2021 | MMBTU
3.80
2022 | MMBTU
3.95
2023 - 2028 | MMBTU
4.31
Thereafter (inflation percentage)
2.00%
CAD in Millions12 Months Ended
Disclosure of detailed information about borrowings [line items]
Repayment of senior notes
CAD 26
CAD 185
Prepayment of senior notes under asset disposition proceeds
CAD 1,075
Percentage of long-term debt instruments exposed to changes in short-term interest rates
70.00%
70.00%
Letters of credit outstanding
CAD 14
CAD 16
Top of range [member]
Disclosure of detailed information about borrowings [line items]
Senior debt to EBITDA ratio
3
Syndicated credit facility [member]
Disclosure of detailed information about borrowings [line items]
Debt
550
Available borrowing facilities
CAD 410
Debt, maturity date
May 17, 2018
Credit facilities term out period
1 year
Unused borrowings
CAD 157
CAD in Millions
Disclosure of fair value measurement of liabilities [line items]
Senior notes
CAD 103
CAD 134
2007 notes [member]
Disclosure of fair value measurement of liabilities [line items]
Senior notes
6
12
2008 notes [member]
Disclosure of fair value measurement of liabilities [line items]
Senior notes
36
38
2009 notes [member]
Disclosure of fair value measurement of liabilities [line items]
Senior notes
10
11
2010 Q1 notes [member]
Disclosure of fair value measurement of liabilities [line items]
Senior notes
12
25
2010 Q4 notes [member]
Disclosure of fair value measurement of liabilities [line items]
Senior notes
25
33
2011 notes [member]
Disclosure of fair value measurement of liabilities [line items]
Senior notes
CAD 14
CAD 15
CAD in Millions12 Months Ended
Disclosure of foreign exchange rates [Line Items]
Realized foreign exchange loss on debt maturities
CAD (6)
CAD (37)
Realized foreign exchange loss on debt pre-payments
(191)
Unrealized foreign exchange gain
11
312
Foreign exchange gain
CAD 5
CAD 84
CAD in Millions
Disclosure of Provisions [Line Items]
Decommissioning liability
CAD 147
CAD 182
CAD 397
Office lease provision
101
117
Total
248
299
Current portion
27
35
Long-term portion
221
264
Total
CAD 248
CAD 299
CAD in Millions12 Months Ended
Disclosure of provision matrix [line items]
Decommissioning liability, inflation factor rate
2.00%
2.00%
Decommissioning liability, credit-adjusted rate
6.50%
6.50%
Decommissioning liability, expected useful life | Years
50
Decommissioning liability
CAD 147
CAD 182
CAD 397
Office lease provision, credit-adjusted discount rate
6.50%
6.50%
Decommissioning liability on undiscounted uninflated basis [member]
Disclosure of provision matrix [line items]
Decommissioning liability
CAD 900
CAD 1,100
CAD in Millions12 Months Ended
Disclosure of Provisions [Line Items]
Balance, beginning of year
CAD 182
CAD 397
Net liabilities disposed
(4)
(193)
Acquisitions
5
Increase (decrease) due to changes in estimates
(3)
37
Liabilities settled
(16)
(11)
Transfers to liabilities for assets held for sale
(23)
(75)
Accretion charges
11
22
Balance, end of year
147
182
Current portion
10
20
Long-term portion
CAD 137
CAD 162
CAD in Millions12 Months Ended
Disclosure of Provisions [Line Items]
Increase (decrease) in decommissioning liability due to change in discount rate
CAD 0
CAD 75
CAD in Millions12 Months Ended
Disclosure of Provisions [Line Items]
Balance, beginning of year
CAD 117
Net additions
(7)
CAD 107
Increase due to changes in estimates
(1)
12
Cash settlements
(16)
(4)
Accretion charges
8
2
Balance, end of year
101
117
Current portion
17
15
Long-term portion
CAD 84
CAD 102
€ in Millions, £ in Millions, CAD in Millions, $ in Millions12 Months Ended
Disclosure of risk management strategy [Line Items]
Pre-tax unrealized risk management, change in price per unit | Mcf
0.10
0.10
0.10
0.10
Pre-tax unrealized risk management, change in price, amount
CAD 1
Risk management, description
the Company may, from time to time, manage these risks through the use of swaps or other financial instruments up to a maximum of 50 percent of forecast sales volumes, net of royalties, for the balance of any current year plus one additional year forward and up to a maximum of 25 percent, net of royalties, for one additional year thereafter. Risk management limits included in Obsidian Energy’s policies may be exceeded with specific approval from the Board of Directors. In November 2017, the Board approved the Company to hedge up to a maximum of 75 percent of forecast sales volumes on natural gas and up to a maximum of 67 percent of forecast sales volumes on crude, both net of royalties for the 2018 calendar year.
Maximum exposure to credit risk
CAD 130
117
Accounts receivable, carrying value
122
106
Derivative financial assets, fair value
CAD 8
11
Percentage of long term debt instruments exposed to changes in short term interest rates
70.00%
70.00%
70.00%
Fixed interest rate debt instruments outstanding
CAD 140
CAD 106
Fixed interest rate debt instruments average remaining term
2 years 3 months 19 days
2 years 8 months 12 days
Average interest rate
6.30%
6.00%
6.00%
6.00%
6.00%
6.30%
Electricity swaps [member]
Disclosure of risk management strategy [Line Items]
Notional value
CAD 0
Realized loss on electricity contracts included in operating expenses
CAD 7
Cross Currency Swap [member]
Disclosure of risk management strategy [Line Items]
Notional value
£ 5
€ 10
Proceeds from cross currency swaps
£ 0
€ 0
Foreign exchange forwards on senior notes [member] | Matured Foreign Exchange Contracts [member]
Disclosure of risk management strategy [Line Items]
Notional value | $
$ 25
Foreign exchange forwards on senior notes [member] | Monetization of foreign exchange contracts [member]
Disclosure of risk management strategy [Line Items]
Notional value | $
$ 115
Natural gas [member]
Disclosure of risk management strategy [Line Items]
Pre-tax unrealized risk management, change in price per unit | bbl
1.00
1.00
1.00
1.00
Pre-tax unrealized risk management, change in price, amount
CAD 7
Senior notes [member]
Disclosure of risk management strategy [Line Items]
Senior notes
140
106
Senior notes [member] | At fair value [member]
Disclosure of risk management strategy [Line Items]
Senior notes
CAD 134
CAD 103
CAD in Millions12 Months Ended
Total fair value consists of the following:
Current asset portion
CAD 11
CAD 8
Current liability portion
(55)
(26)
Non-current liability portion
(6)
(25)
At fair value [member]
Disclosure of detailed information about financial instruments [line items]
Balance, beginning of year
(43)
104
Unrealized gain (loss) on financial instruments:
Commodity collars, swaps and assignments
(7)
(74)
Electricity swaps
4
Foreign exchange forwards
(6)
(43)
Cross currency swaps
6
(34)
Total fair value, end of year
(50)
(43)
Total fair value consists of the following:
Current asset portion
11
8
Current liability portion
(55)
(26)
Non-current asset portion
0
0
Non-current liability portion
(6)
(25)
Total fair value, end of year
CAD (50)
CAD (43)
12 Months Ended
6.95 % swaps [member]
Disclosure of detailed information about financial instruments [line items]
Financial instruments, pricing
6.95%
6.95 % swaps one [member]
Disclosure of detailed information about financial instruments [line items]
Financial instruments, pricing
6.95%
9.15% swaps [member]
Disclosure of detailed information about financial instruments [line items]
Financial instruments, pricing
9.15%
9.22% swaps [member]
Disclosure of detailed information about financial instruments [line items]
Financial instruments, pricing
9.22%
CAD in Millions
2018 [member]
Disclosure of financial liabilities [line items]
Senior secured notes
CAD 31
Accounts payable & accrued liabilities
148
Share-based compensation accrual
2
Total
181
2019 [member]
Disclosure of financial liabilities [line items]
Senior secured notes
16
Share-based compensation accrual
1
Total
17
2020 [member]
Disclosure of financial liabilities [line items]
Senior secured notes
34
Total
34
2021 [member]
Disclosure of financial liabilities [line items]
Senior secured notes
15
Total
15
2022 [member]
Disclosure of financial liabilities [line items]
Senior secured notes
7
Total
7
Thereafter [member]
Disclosure of financial liabilities [line items]
Senior secured notes
3
Total
CAD 3
$ in Millions
Disclosure of financial liabilities [line items]
Accounts payable and accrued liabilities related to assets classified as held for sale
$ 1
CAD in Millions12 Months Ended
Disclosure representing major components of tax expense income [Line Items]
Deferred tax recovery
CAD (13)
CAD (252)
CAD in Millions12 Months Ended
Disclosure representing major components of tax expense income [Line Items]
Loss before taxes
CAD (97)
CAD (948)
Combined statutory tax rate
27.00%
27.00%
Computed income tax recovery
CAD (26)
CAD (256)
Increase (decrease) resulting from:
Share-based compensation
2
1
Non-taxable foreign exchange (gain) loss
(2)
(11)
Unrecognized deferred tax asset
5
Adjustments related to prior years
5
14
Other
3
Deferred tax recovery
CAD (13)
CAD (252)
CAD in Millions12 Months Ended
Disclosure of temporary difference, unused tax losses and unused tax credits [line items]
Tax pool
CAD 2,400
CAD 2,400
Non-capital losses
2,000
2,000
Non-capital losses for which deferred tax asset has not been recognozed
17
0
Realized and unrealized net capital losses
CAD 586
CAD 591
12 Months Ended
Common shares [member]
Disclosure of classes of share capital [line items]
Number of authorized common shares
An unlimited number of Common Shares.
Number of shares issued
504,340,988
502,763,763
502,163,163
Preferred shares [member]
Disclosure of classes of share capital [line items]
Number of authorized preferred shares
90,000,000
Number of authorized common shares
Shares issuable in one or more series.
Number of shares issued
0
Number of shares outstanding
0
CAD in Millions12 Months Ended
Disclosure of classes of share capital [line items]
Balance, beginning of year
CAD 8,997
Issued on exercise of equity compensation plans
8
CAD 7
Balance, end of year
2,181
8,997
Common shares [member]
Disclosure of classes of share capital [line items]
Balance, beginning of year
8,997
8,994
Issued on exercise of equity compensation plans
4
3
Cancellation of dividend reinvestment plan
0
Elimination of deficit
(6,820)
Balance, end of year
CAD 2,181
CAD 8,997
Balance, beginning of year
502,763,763
502,163,163
Issued on exercise of equity compensation plans
1,577,225
600,775
Cancellation of dividend reinvestment plan
(175)
Balance, end of year
504,340,988
502,763,763
CAD in Millions12 Months Ended
Disclosure of reserves within equity [line items]
Balance, beginning of year
CAD 97
CAD 92
Share-based compensation expense
8
7
Net benefit on options exercised
(9)
(2)
Balance, end of year
CAD 96
CAD 97
CAD in Millions12 Months Ended
Disclosure of terms and conditions of share-based payment arrangement [line items]
Outstanding, beginning of year
10,199,595
6,325,954
Granted
4,472,510
11,745,330
Vested
(3,935,186)
(2,353,989)
Forfeited
(2,339,541)
(5,517,700)
Outstanding, end of year
8,397,378
10,199,595
Outstanding units - liability method
730,297
2,314,805
Outstanding units - equity method
7,667,081
7,884,790
Current liability (1)
CAD 1
CAD 3
Non-current liability
CAD 1
12 Months Ended
Disclosure of terms and conditions of share-based payment arrangement [line items]
Average fair value of units granted (per unit)
CAD 2.11
CAD 1.20
Expected life of units (years)
3 Years
3 Years
Expected forfeiture rate
7.80%
18.40%
12 Months Ended
Disclosure of classes of share capital [line items]
Weighted average share price
CAD 1.56
CAD 2.37
Employer contributions to employee retirement savings plan percentage of employee contribution
150.00%
Percentage of employees contribution
10.00%
2019 [member]
Disclosure of classes of share capital [line items]
Employer contributions to employee retirement savings plan percentage of employee contribution
125.00%
After year two [member]
Disclosure of classes of share capital [line items]
Employer contributions to employee retirement savings plan percentage of employee contribution
100.00%
Deferred share unit [member]
Disclosure of classes of share capital [line items]
Number of options outstanding,
640,705
745,851
Current liability
CAD 1,000,000
CAD 2,000,000
CAD in Millions12 Months Ended
Disclosure of terms and conditions of share-based payment arrangement [line items]
Outstanding, beginning of year
1,855,500
1,622,881
Granted
569,000
2,516,000
Vested
(638,750)
(199,843)
Forfeited
(246,750)
(2,083,538)
Outstanding, end of year
1,539,000
1,855,500
Non-current liability
CAD 1
CAD 2
CAD in Millions12 Months Ended
Disclosure of terms and conditions of share-based payment arrangement [line items]
Share-based compensation
CAD 8
CAD 12
Options [member]
Disclosure of terms and conditions of share-based payment arrangement [line items]
Share-based compensation
1
1
PSU Plan [member]
Disclosure of terms and conditions of share-based payment arrangement [line items]
Share-based compensation
1
1
DSU Plan [member]
Disclosure of terms and conditions of share-based payment arrangement [line items]
Share-based compensation
1
RPSU Plan - equity method [member]
Disclosure of terms and conditions of share-based payment arrangement [line items]
Share-based compensation
7
6
RPSU Plan - liability method [member]
Disclosure of terms and conditions of share-based payment arrangement [line items]
Share-based compensation
CAD (1)
CAD 3
CAD in Millions12 Months Ended
Earnings per share [line items]
Net loss - basic and diluted
CAD (84)
CAD (696)
shares in Millions12 Months Ended
Earnings per share [line items]
Basic and Diluted
503.9
502.3
shares in Millions12 Months Ended
Earnings per share [line items]
Anti-dilutive securities issued under option plan
3.7
7.6
CAD in Millions12 Months Ended
Disclosure of Increase Decrease In Non-cash Working Capital [Line Items]
Accounts receivable
CAD 12
CAD 32
Other current assets
23
Deferred funding obligation
25
16
Accounts payable and accrued liabilities
(35)
(191)
Net changes in non cash working capital
2
(120)
Operating activities
5
(97)
Investing activities
(3)
(23)
Net changes in non cash working capital
2
(120)
Interest paid
23
124
Income taxes recovered
CAD 0
CAD 0
CAD in Millions
Disclosure of Increase Decrease In Non-cash Working Capital [Line Items]
Accounts receivable
CAD 105
CAD 113
Other current assets
18
18
Accounts payable and accrued liabilities
149
175
Current assets held for sale [member]
Disclosure of Increase Decrease In Non-cash Working Capital [Line Items]
Accounts receivable
1
9
Other current assets
0
1
Accounts payable and accrued liabilities
CAD 1
CAD 6
CAD in Millions12 Months Ended
Components of capital
Shareholders' equity
CAD 2,166
CAD 2,247
CAD 2,935
Long-term debt
359
469
Ratios
Long-term debt
CAD 359
CAD 469
Senior debt to EBITDA
1.9
2.0
Total debt to EBITDA
1.9
2.0
Senior debt to capitalization
15.00%
17.00%
Total debt to capitalization
15.00%
17.00%
Priority debt to consolidated tangible assets
0.00%
0.00%
EBITDA
CAD 194
CAD 235
Total shareholders' equity
2,166
2,247
CAD 2,935
Total capitalization
2,535
2,722
Credit facility debt and senior notes [member]
Components of capital
Long-term debt
359
469
Ratios
Long-term debt
359
469
Letters of credit [member]
Components of capital
Long-term debt
10
6
Ratios
Long-term debt
10
6
Senior debt and total debt [member]
Components of capital
Long-term debt
369
475
Ratios
Long-term debt
CAD 369
CAD 475
Disclosure of objectives, policies and processes for managing capital [line items]
Senior debt to EBITDA
1.9
2.0
Total debt to EBITDA
1.9
2.0
Maximum senior debt to capitalization
50.00%
Maximum total debt to capitalization
55.00%
Maximum priority debt to consolidated tangible assets
15.00%
Top of range [member]
Disclosure of objectives, policies and processes for managing capital [line items]
Senior debt to EBITDA
3
Total debt to EBITDA
4
CAD in Millions
Disclosure of commitments and contingencies [Line Items]
Long-term debt
CAD 359
CAD 469
2019 [member]
Disclosure of commitments and contingencies [Line Items]
Long-term debt
269
Bankers acceptances and prime rate loans [member]
Disclosure of commitments and contingencies [Line Items]
Long-term debt
253
CAD 329
Bankers acceptances and prime rate loans [member] | 2019 [member]
Disclosure of commitments and contingencies [Line Items]
Long-term debt
CAD 253
CAD in Millions, $ in Millions12 Months Ended
Disclosure of commitments and contingencies [Line Items]
Amount of outstanding funds
CAD 359
CAD 469
Sublease recoveries
101
Lease costs, net of recoveries
19
Payment in respect of settlement agreements | $
$ 8.5
Senior notes [member]
Disclosure of commitments and contingencies [Line Items]
Amount of outstanding funds
CAD 106
Senior notes, maturity
Maturing between 2018 and 2025
CAD in Millions12 Months Ended
Disclosure of transactions between related parties [line items]
Salary and employee benefits
CAD 3
CAD 2
Termination benefits
2
2
Share-based payments
3
2
Key Management Personnel Compensation
CAD 8
CAD 6
CAD in Millions12 Months Ended
Operating expense [member]
Supplemental Information [Line Items]
Employee compensation costs
CAD 14
CAD 36
General and administrative expense [member]
Supplemental Information [Line Items]
Employee compensation costs
CAD 30
CAD 44
CAD in Millions
Capitalized Costs Relating to Oil and Gas Producing Activities, by Geographic Area [Line Items]
Proved oil and gas properties
CAD 10,636
CAD 10,648
Unproved oil and gas properties
0
0
Total capitalized costs
10,636
10,648
Accumulated depletion and depreciation
(7,817)
(7,666)
Net capitalized costs
CAD 2,819
CAD 2,982
CAD in Millions12 Months Ended
Costs Incurred, Oil and Gas Property Acquisition, Exploration, and Development Activities [Line Items]
Proved oil and gas properties - acquisitions
CAD 6
Proved oil and gas properties - dispositions
(116)
CAD (1,418)
Unproved oil and gas properties
3
2
Exploration costs
2
4
Development costs
184
114
Joint venture, carried capital
(50)
(40)
Capital expenditures
29
(1,338)
Corporate acquisitions
3
Total expenditures
CAD 29
CAD (1,335)
12 Months Ended
Discounted Future Net Cash Flows Relating to Proved Oil and Gas Reserves [Line Items]
Discounted future net cash flows, annual discount factor
10.00%
CAD in Millions
Discounted Future Net Cash Flows Relating to Proved Oil and Gas Reserves [Line Items]
Future cash inflows
CAD 3,384
CAD 2,885
Future production costs
(1,625)
(1,545)
Future development costs
(302)
(223)
Undiscounted pre-tax cash flows
1,457
1,117
Deferred income taxes
0
0
Future net cash flows
1,457
1,117
Less 10% annual discount factor
(661)
(486)
Standardized measure of discounted future net cash flows
CAD 796
CAD 631
CAD 1,307
B[2;]0
MO!LZ93"VZ_P?4$L#!!0 ( %.,9TR>]S -V0, "L3 8 >&PO=V]R
M:W-H965T
73EU2##U;/65"*%B_3*4TZQ^F&[V;:90*?"7PAW*8Z;"J4E'\1092Y
MLR-QT^Q[$7]QMN_:S(1[:OK #QYT\JX@G;>]T?&7-6!%NX&>S#AID&KA0^N;9GK+8@ZD;1B
M?+?[P+20AI9YBIUMF>/@E31PML0-6@O[ZP0*QX+NZ7O@6;:=CP%6YKUHX1OX
M[_W9!H\M66JIP3B)AEAH"GJ_/YZRB$^ 'Q)&M[))[.2"^!J=SW5!=U$0**A\
MS"#"<84'4"HF"C)^SCGI4C(2U_9[]L?4>^CE(AP\H'J1M>\*>D=)#8T8E'_&
M\0GF?@Z4S,U_@2NH (]*0HT*E4M?4@W.HYZS!"E:O$VG-.D
B\42D+2E'\93Z%CN>4;CXDVC8A3X1\(=S%.FPN%)5_Y)Y7A343
ML?/L!QY^\>Z8XVSJ$(RCB'7/@%UG4WV@T!SCPZN?@)*.\M<
M'03*/3KX ""@NK/"U4&@A4<'GP$$%'@>NSH(Y,L#? P04./Y) \0R)<'^"0@
MH,SS21X@D"\/\&% 0*7GDSQ (#&UL;5-M;YPP#/XK47Y US7WDZ U.LTK5(KG3IM
M^YP# U'SPI)PM/]^3J",=7PAMO,\]F/CY*.Q+ZX#\.152>T*VGG?'QAS50>*
MNRO3@\:;QEC%/;JV9:ZWP.M(4I)E27+#%!>:EGF,G6R9F\%+H>%DB1N4XO;M
M"-*,!4WI>^!9M)T/ 5;F/6_A._@?_