Hudbay Minerals Inc. - Exhibit 99.5 - Filed by newsfilecorp.com
NI 43-101 Technical Report
Feasibility Study
Updated Mineral Resource, Mineral Reserve and
Financial Estimates
Rosemont Project
Pima County, Arizona, USA
Issue and Effective Date: March 30,
2017

25 York Street, Suite 800
Toronto, Ontario
Canada M5J 2V5
Prepared by:
Cashel Meagher, P.Geo.
Senior Vice President and Chief Operating Officer, Hudbay
Revision 3
CAUTIONARY NOTE REGARDING FORWARD-LOOKING INFORMATION
This Technical Report contains "forward-looking statements" and
"forward-looking information" (collectively, "forward-looking information")
within the meaning of applicable Canadian and United States securities
legislation. All information contained in this Technical Report, other than
statements of current and historical fact, is forward-looking information.
Often, but not always, forward-looking information can be identified by the use
of words such as “plans”, “expects”, “budget”, “guidance”, “scheduled”,
“estimates”, “forecasts”, “strategy”, “target”, “intends”, “objective”, “goal”,
“understands”, “anticipates” and “believes” (and variations of these or similar
words) and statements that certain actions, events or results “may”, “could”,
“would”, “should”, “might” “occur” or “be achieved” or “will be taken” (and
variations of these or similar expressions). All of the forward-looking
information in this Technical Report is qualified by this cautionary note.
Forward-looking information includes, but is not limited to,
our objectives, strategies, intentions, expectations, production, cost, capital
and exploration expenditure guidance, including the estimated economics of the
Rosemont project, future financial and operating performance and prospects,
anticipated production at our Rosemont project and processing facilities and
events that may affect Hudbay’s operations, anticipated cash flows from
operations and related liquidity requirements, the anticipated effect of
external factors on revenue, such as commodity prices, estimation of mineral
reserves and resources, mine life projections, reclamation costs, economic
outlook, government regulation of mining operations, and expectations regarding
community relations. Forward-looking information is not, and cannot be, a
guarantee of future results or events. Forward-looking information is based on,
among other things, opinions, assumptions, estimates and analyses that, while
considered reasonable by us at the date the forward-looking information is
provided, inherently are subject to significant risks, uncertainties,
contingencies and other factors that may cause actual results and events to be
materially different from those expressed or implied by the forward-looking
information.
The material factors or assumptions that we identified and were
applied by us in drawing conclusions or making forecasts or projections set out
in the forward-looking information include, but are not limited to:
- the success of mining, processing, exploration and development activities;
- the accuracy of geological, mining and metallurgical estimates;
- anticipated metals prices and the costs of production;
- the supply and demand for metals we produce;
- the supply and availability of concentrate for our processing facilities;
- the supply and availability of third party processing facilities for our
concentrate;
-
the supply and availability of all forms of energy and fuels at reasonable prices;
-
the availability of transportation services at reasonable prices;
-
no significant unanticipated operational or technical difficulties;
-
the execution of our business and growth strategies, including the success of our strategic investments and initiatives;
-
the availability of additional financing, if needed;
-
the ability to complete project targets on time and on budget and other events that may affect our ability to develop our projects;
-
the timing and receipt of various regulatory, governmental and joint venture partner approvals;
-
the availability of personnel for our exploration, development and operational projects and ongoing employee and union relations;
-
the ability to secure required land rights to develop the Pampacancha deposit;
-
maintaining good relations with the communities in which we operate, including the communities surrounding our Rosemont project;
-
no significant unanticipated challenges with stakeholders at our various projects;
-
no significant unanticipated events or changes relating to regulatory, environmental, health and safety matters;
-
no contests over title to our properties, including as a result of rights or claimed rights of aboriginal peoples;
-
the timing and possible outcome of pending litigation and no significant unanticipated litigation;
-
certain tax matters, including, but not limited to current tax laws and regulations; and
-
no significant and continuing adverse changes in general economic conditions or conditions in the financial markets (including commodity prices and foreign exchange rates).
The risks, uncertainties, contingencies and other factors that may cause actual results to differ materially from those expressed or implied by the forward-looking information may include, but are not limited to, risks generally associated with the
mining industry, such as economic factors (including future commodity prices, currency fluctuations, energy prices and general cost escalation), uncertainties related to the development and operation of our projects (including risks associated with
the permitting, development and economics of the Rosemont project and related legal challenges), dependence on key personnel and employee and union relations, risks related to political or social unrest or change, risks in respect of aboriginal and
community relations, rights and title claims, operational risks and hazards, including unanticipated environmental, industrial and geological events and developments and the inability to insure against all risks, failure of plant, equipment,
processes, transportation and other infrastructure to operate as anticipated, compliance with government and environmental regulations, including permitting requirements and anti-bribery legislation, depletion of Hudbay’s reserves, volatile
financial markets that may affect our ability to obtain additional financing on acceptable terms, the failure to obtain required approvals or clearances from government authorities on a timely basis, uncertainties related to the geology, continuity,
grade and estimates of mineral reserves and resources, and the potential for variations in
grade and recovery rates, uncertain costs of reclamation activities, Hudbay’s ability to comply with its pension and other post-retirement obligations, our ability to abide by the covenants in our debt instruments and other material contracts,
tax refunds, hedging transactions, as well as the risks discussed under the heading “Risk Factors” in our most recent Annual Information Form and our management’s discussion and analysis of Hudbay for the year ended December 31,
2016.
Should one or more risk, uncertainty, contingency or other factor materialize or should any factor or assumption prove incorrect, actual results could vary materially from those expressed or implied in the forward-looking information. Accordingly,
you should not place undue reliance on forward-looking information. We do not assume any obligation to update or revise any forward-looking information after the date of this Technical Report or to explain any material difference between subsequent
actual events and any forward-looking information, except as required by applicable law.
 |
Rosemont Project |
| Form
43-101F1 Technical Report |
TABLE OF CONTENTS
| SECTION |
|
|
PAGE |
| |
|
|
|
| TABLE OF CONTENTS |
i |
| |
|
|
|
| LIST OF TABLES |
v |
| |
|
|
|
| LIST OF FIGURES |
x |
| |
|
|
|
| LIST OF APPENDICES |
xv |
| |
|
|
|
| 1 |
SUMMARY |
1-1 |
| |
|
|
|
| |
1.1 |
Introduction |
1-1 |
| |
1.2 |
Property Description and Location |
1-2 |
| |
1.3 |
Accessibility,
Climate, Local Resources, Infrastructure and Physiography |
1-3 |
| |
1.4 |
History |
1-4 |
| |
1.5 |
Geological
Setting and Mineralization |
1-5 |
| |
1.6 |
Deposit Types |
1-6 |
| |
1.7 |
Exploration |
1-6 |
| |
1.8 |
Drilling |
1-7 |
| |
1.9 |
Sample
Preparation, Analyses, and Security |
1-7 |
| |
1.10 |
Data Verification |
1-8 |
| |
1.11 |
Mineral
Processing and Metallurgical Testing |
1-9 |
| |
1.12 |
Mineral Resource Estimate |
1-10 |
| |
1.13 |
Mineral Reserves
Estimate |
1-15 |
| |
1.14 |
Mining Methods |
1-19 |
| |
1.15 |
Recovery Methods |
1-25 |
| |
1.16 |
Project Infrastructure |
1-25 |
| |
1.17 |
Market Studies
and Contracts |
1-27 |
| |
1.18 |
Environmental Studies, Permitting
and Social or Community Impact |
1-28 |
| |
1.19 |
Capital and
Operating Cost |
1-29 |
| |
1.20 |
Economic Analysis |
1-29 |
| |
1.21 |
Adjacent
Properties |
1-33 |
| |
1.22 |
Other Relevant Data and
Information |
1-33 |
| |
1.23 |
Conclusions |
1-33 |
| |
1.24 |
Recommendations |
1-35 |
| |
|
|
|
| 2 |
INTRODUCTION AND TERMS OF REFERENCE |
2-1 |
| |
|
|
|
| |
2.1 |
Information Sources |
2-1 |
| |
2.2 |
Unit
Abbreviations |
2-2 |
| |
2.3 |
Name Abbreviations |
2-3 |
| |
|
|
|
| 3 |
RELIANCE ON
OTHER EXPERTS |
3-1 |
| |
|
|
|
| 4 |
PROPERTY
DESCRIPTION AND LOCATION |
4-1 |
| |
|
|
|
| |
4.1 |
Location |
4-1 |
| |
4.2 |
Land Tenure |
4-1 |
| |
|
|
|
| 5 |
ACCESSIBILITY, CLIMATE, LOCAL RESOURCES,
INFRASTRUCTURE AND
PHYSIOGRAPHY |
5-1 |
| |
|
|
|
| |
5.1 |
Accessibility |
5-1 |
| |
5.2 |
Climate |
5-1 |
| |
5.3 |
Local Resources |
5-2 |
Page i
|
|
Rosemont Project |
| Form
43-101F1 Technical Report |
| |
5.4 |
Infrastructure |
5-2 |
| |
5.5 |
Physiography |
5-3 |
| |
|
|
|
| 6 |
HISTORY |
6-1 |
| |
|
|
|
| |
6.1 |
Helvetia-Rosemont Mining District
(1875 – 1973) |
6-1 |
| |
6.2 |
Anamax Mining
Company (1973 - 1985) |
6-1 |
| |
6.3 |
ASARCO, Inc. (1988 – 2004) |
6-2 |
| |
6.4 |
Augusta Resource
Corporation (2005 – 2014) |
6-2 |
| |
6.5 |
Hudbay (2014 – Present) |
6-3 |
| |
|
|
|
| 7 |
GEOLOGICAL
SETTING AND MINERALIZATION |
7-1 |
| |
|
|
|
| |
7.1 |
Tectonic and Metallogenic Setting |
7-1 |
| |
7.2 |
Regional Geology |
7-2 |
| |
7.3 |
District Geology |
7-2 |
| |
7.4 |
Chemostratigraphy |
7-8 |
| |
7.5 |
Structural Domains |
7-8 |
| |
7.6 |
Mineralization |
7-9 |
| |
7.7 |
Mineralization Domains |
7-11 |
| |
7.8 |
Alteration and
Skarn Development |
7-12 |
| |
7.9 |
Clay Proxies |
7-13 |
| |
|
|
|
| 8 |
DEPOSIT
TYPE |
8-1 |
| |
|
|
|
| 9 |
EXPLORATION |
9-1 |
| |
|
|
|
| 10 |
DRILLING |
10-1 |
| |
|
|
|
| |
10.1 |
Banner Mining Company (1961 to
1963) |
10-3 |
| |
10.2 |
The Anaconda
Mining Co., (1963 to 1986) |
10-3 |
| |
10.3 |
ASARCO Mining Co., (1988 to 2004) |
10-3 |
| |
10.4 |
Augusta Resource
(2005 to 2012) |
10-3 |
| |
10.5 |
Hudbay (2014 to 2015) |
10-4 |
| |
|
|
|
| 11 |
SAMPLING
PREPARATION, ANALYSES, AND SECURITY |
11-1 |
| |
|
|
|
| |
11.1 |
Hudbay 2014 |
11-1 |
| |
11.2 |
Hudbay 2015 |
11-13 |
| |
11.3 |
Augusta |
11-22 |
| |
11.4 |
Historic |
11-29 |
| |
|
|
|
| 12 |
DATA VERIFICATION |
12-1 |
| |
|
|
|
| |
12.1 |
Drill Hole
Database |
12-1 |
| |
|
|
|
| 13 |
MINERAL PROCESSING AND METALLURGICAL
TESTING |
13-1 |
| |
|
|
|
| |
13.1 |
Overview |
13-1 |
| |
13.2 |
Historical Metallurgical Testwork
Summary |
13-2 |
| |
13.3 |
Hudbay
Metallurgical Testing Programs |
13-6 |
| |
13.4 |
XPS Phase 1 |
13-6 |
| |
13.5 |
XPS Phase 2 |
13-9 |
| |
13.6 |
XPS Phase 3 |
13-12 |
| |
13.7 |
BML Confirmation
Testing |
13-14 |
| |
13.8 |
BML Production Period Testwork |
13-14 |
| |
13.9 |
Concentrate
Quality |
13-17 |
| |
13.10 |
Tailings Dewatering |
13-18 |
| |
13.11 |
Recovery
Estimates |
13-19 |
| |
13.12 |
Conclusions and Recommendations |
13-21 |
Page ii
|
|
Rosemont Project |
| Form
43-101F1 Technical Report |
| |
13.13 |
Discussion and
Recommendations |
13-22 |
| |
|
|
|
| 14 |
MINERAL RESOURCE ESTIMATE |
14-1 |
| |
|
|
|
| |
14.1 |
Key Assumptions
of Model |
14-1 |
| |
14.2 |
Wireframe Models and
Mineralization |
14-1 |
| |
14.3 |
Exploratory Data
Analysis |
14-7 |
| |
14.4 |
Assays |
14-7 |
| |
14.5 |
Composites |
14-27 |
| |
14.6 |
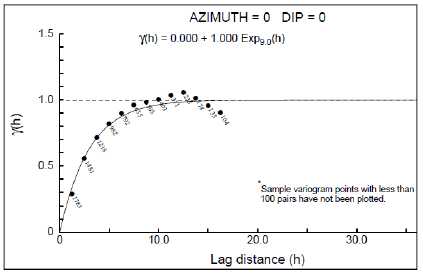
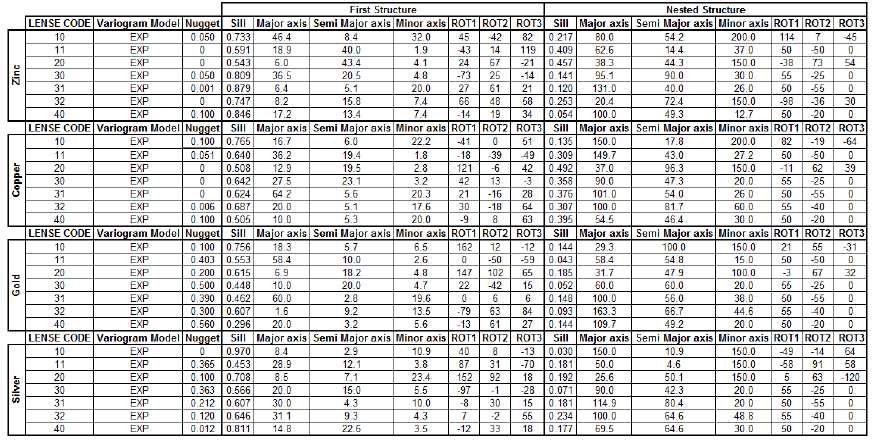
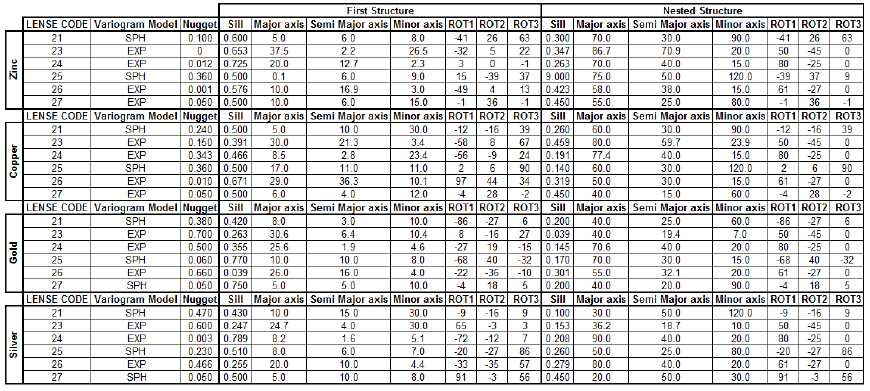
Variography |
14-29 |
| |
14.7 |
Estimation and
Interpolation Methods |
14-33 |
| |
14.8 |
Tonnage Factor Assignment |
14-36 |
| |
14.9 |
Block Model
Validation |
14-40 |
| |
14.10 |
Visual Inspection |
14-40 |
| |
14.11 |
Metal Removed by
Capping |
14-45 |
| |
14.12 |
Global Bias Checks |
14-48 |
| |
14.13 |
Local Bias Checks |
14-51 |
| |
14.14 |
Block Model Quality Control |
14-64 |
| |
14.15 |
Grade-Tonnage
Statistics |
14-64 |
| |
14.16 |
Classification of Mineral
Resource |
14-67 |
| |
14.17 |
Third Party
Review |
14-69 |
| |
14.18 |
Internal Peer Review |
14-69 |
| |
14.19 |
Reasonable
Prospects of Economic Extraction |
14-69 |
| |
14.20 |
Mineral Resource Statement
Inclusive of Mineral Reserve |
14-71 |
| |
14.21 |
Sensitivity of
the Mineral Resource |
14-72 |
| |
14.22 |
Comparison with the 2012 Resource
Estimates |
14-74 |
| |
14.23 |
Factors That May
Affect the Mineral Resource Estimate |
14-75 |
| |
14.24 |
Conclusions |
14-75 |
| |
14.25 |
Recommendations |
14-76 |
| |
|
|
|
| 15 |
MINERAL RESERVES ESTIMATE |
15-1 |
| |
|
|
|
| |
15.1 |
Pit Optimization |
15-1 |
| |
15.2 |
Mineral Reserves |
15-8 |
| |
|
|
|
| 16 |
MINING
METHODS |
16-1 |
| |
|
|
|
| |
16.1 |
Mine Overview |
16-1 |
| |
16.2 |
Mine Phases |
16-2 |
| |
16.3 |
Mine Schedule and Production Plan |
16-12 |
| |
16.4 |
Mine Facilities |
16-27 |
| |
16.5 |
Mine Equipment |
16-30 |
| |
16.6 |
Mine Operations |
16-34 |
| |
16.7 |
Mine Engineering |
16-35 |
| |
16.8 |
Manpower
Requirements |
16-40 |
| |
|
|
|
| 17 |
RECOVERY METHODS |
17-1 |
| |
|
|
|
| |
17.1 |
Introduction |
17-1 |
| |
17.2 |
Buildings |
17-3 |
| |
17.3 |
Processing Plant |
17-3 |
| |
17.4 |
Crushing |
17-6 |
| |
17.5 |
Grinding |
17-8 |
| |
17.6 |
Copper Flotation |
17-10 |
| |
17.7 |
Copper-Molybdenum
Separation |
17-13 |
| |
17.8 |
Molybdenum Concentrate
Thickening, Filtration and Drying |
17-15 |
| |
17.9 |
Copper
Concentrate Dewatering and Storage |
17-15 |
Page iii
|
|
Rosemont Project |
| Form
43-101F1 Technical Report |
| |
17.10 |
Tailings
Thickening |
17-17 |
| |
17.11 |
Tailings Filtration Plant |
17-17 |
| |
17.12 |
Reagents
and Consumables |
17-19 |
| |
17.13 |
Plant Services |
17-21 |
| |
17.14 |
Process
Control Strategy |
17-22 |
| |
|
|
|
| 18 |
PROJECT
INFRASTRUCTURE |
18-1 |
| |
|
|
|
| |
18.1 |
Access
Roads, Plant Roads and Haul Roads |
18-1 |
| |
18.2 |
Power Supply and
Distribution |
18-2 |
| |
18.3 |
Water
Supply and Distribution |
18-3 |
| |
18.4 |
Tailings Management |
18-5 |
| |
18.5 |
Communications |
18-7 |
| |
|
|
|
| 19 |
MARKET STUDIES
AND CONTRACTS |
19-1 |
| |
|
|
|
| 20 |
ENVIRONMENTAL
STUDIES, PERMITTING, AND SOCIAL OR COMMUNITY IMPACT |
20-1 |
| |
|
|
|
| |
20.1 |
Reclamation and Closure Plan |
20-4 |
| |
|
|
|
| 21 |
CAPITAL AND
OPERATING COSTS |
21-1 |
| |
|
|
|
| |
21.1 |
Introduction |
21-1 |
| |
21.2 |
Capital Costs |
21-1 |
| |
21.3 |
Operating
Costs
|
21-4 |
| |
21.4 |
Working Capital Costs |
21-5 |
| |
|
|
|
| 22 |
ECONOMIC ANALYSIS |
22-1 |
| |
|
|
|
| |
22.1 |
Key Model Assumptions |
22-1 |
| |
22.2 |
Annual
Cash Flow Model |
22-5 |
| |
22.3 |
Financial Analysis (100%
Project Basis) |
22-10 |
| |
22.4 |
Sensitivity Analysis (100% Project Basis) |
22-10 |
| |
22.5 |
Project Ownership Impact
on Valuation |
22-11 |
| |
|
|
|
| 23 |
ADJACENT PROPERTIES |
23-1 |
| |
|
|
|
| 24 |
OTHER RELEVANT DATA AND
INFORMATION |
24-1 |
| |
|
|
|
| |
24.1 |
Project Implementation |
24-1 |
| |
24.2 |
Risk
Assessments |
24-4 |
| |
|
|
|
| 25 |
INTERPRETATION
AND CONCLUSIONS |
25-1 |
| |
|
|
|
| 26 |
RECOMMENDATIONS |
26-1 |
| |
|
|
|
| 27 |
REFERENCES |
27-1 |
| |
|
|
|
| 28 |
SIGNATURE
PAGE |
28-1 |
| |
|
|
|
| 29 |
CERTIFICATES
OF QUALIFIED PERSONS |
29-1 |
| |
|
|
|
| |
CASHEL MEAGHER |
29-1 |
Page iv
|
|
Rosemont Project |
| Form
43-101F1 Technical Report |
LIST OF TABLES
| TITLE |
PAGE |
| Table 1-1: Rosemont Deposit Drilling
Summary |
1-7 |
| Table 1-2: Resource by Category, Mineralized Zone and NSR
Cut-Off (1)(2)(3)(4)(5)(6)(7)(8)(9)(10) |
1-13 |
| Table 1-3: Measured and Indicated,
Comparison to 2012 Augusta Estimate |
1-14 |
| Table 1-4: Inferred, Comparison to 2012 Augusta Estimate
|
1-14 |
| Table 1-5: Proven and Probable Mineral
Reserves in Rosemont Final Pit |
1-17 |
| Table 1-6: Rosemont Mineral Exclusive Resource Estimates
(1)(2)(3)(4)(5)(6)(7)(8)(9) |
1-18 |
| Table 1-7: Proven and Probable, Comparison
to 2012 Augusta Reserve Estimate |
1-19 |
| Table 1-8: Rosemont Slope Guidance |
1-20 |
| Table 1-9: Rosemont Mine Phases Mineral
Reserves |
1-22 |
| Table 1-10: Mine Production Schedule Criteria |
1-22 |
| Table 1-11: Waste Rock Facility Design
Criteria |
1-24 |
| Table 1-12: DSTF Buttress Rock Storage Design Criteria |
1-24 |
| Table 1-13: Copper Concentrate |
1-27 |
| Table 1-14: Molybdenum Concentrate |
1-28 |
| Table 1-15: Metal Price Assumptions |
1-29 |
| Table 1-16: Life of Mine Financial Metrics (100% Project
Basis) |
1-31 |
| Table 1-17: After-Tax NPV8%, NPV10%, IRR
and Payback Sensitivity at Various Flat Copper Prices (100% Basis) |
1-32 |
| Table 1-18: Key Financial Metrics Attributable to Hudbay
|
1-33 |
| Table 2-1: Unit Abbreviations |
2-2 |
| Table 2-2: Name Abbreviations |
2-3 |
| Table 6-1: Historical Sulfide Mineral
Resource (Augusta 2012) |
6-3 |
| Table 10-1: Rosemont Deposit Drilling Summary |
10-1 |
| Table 11-1: Bureau Veritas Assay
Specifications |
11-4 |
| Table 11-2: Summary Of QA/QC Samples |
11-5 |
| Table 11-3: Oreas Certified Blanks |
11-5 |
| Table 11-4: Summary of Blank Performance |
11-6 |
| Table 11-5: Oreas Certified Reference
Material |
11-6 |
| Table 11-6: Summary of CRM Performance |
11-7 |
| Table 11-7: Summary of Coarse Duplicate
Analysis |
11-9 |
| Table 11-8: Summary of QA/QC Samples |
11-14 |
| Table 11-9: Summary of Blank Performance
|
11-15 |
| Table 11-10: Oreas Certified Reference Material |
11-15 |
Page v
|
|
Rosemont Project |
| Form
43-101F1 Technical Report |
| Table 11-11: Summary of CRM Performance |
11-17 |
| Table 11-12: Summary of Coarse Duplicate Analysis |
11-18 |
| Table 11-13: Assay Specifications – Skyline
|
11-24 |
| Table 11-14: Summary of Blank Performance at Skyline |
11-25 |
| Table 11-15: Standard Reference Materials –
Augusta |
11-26 |
| Table 11-16: Performance of Standard Reference Materials at
Skyline |
11-27 |
| Table 11-17: Rosemont Deposit Drilling
Summary |
11-29 |
| Table 11-18: Comparison of Historical Assay Results and
Twin Half-Split Core Samples Analyzed by Augusta at Skyline |
11-31 |
| Table 12-1: Downhole Surveys of Historical
Drilling |
12-2 |
| Table 12-2: Hudbay 2014 Downhole Results |
12-2 |
| Table 12-3: Hudbay 2015 Downhole Surveys
|
12-2 |
| Table 12-4: Drill Hole Assay Ranking |
12-4 |
| Table 13-1: Grinding Mill Sizing Parameters
|
13-3 |
| Table 13-2: Molybdenite Flotation |
13-4 |
| Table 13-3: Lithology of Composite Samples
|
13-5 |
| Table 13-4: 2012 Closed Circuit Flotation Results |
13-5 |
| Table 13-5: XPS Phase 1 - Comminution Test
Statistics* |
13-7 |
| Table 13-6: XPS Phase 2 - Qemscan Analysis |
13-10 |
| Table 13-7: XPS Phase 2 - CEC Analysis |
13-10 |
| Table 13-8: XPS Phase 2 - Copper Deportment by Mineral
Species |
13-10 |
| Table 13-9: XPS Phase 2 - Locked Cycle Test
Results |
13-11 |
| Table 13-10: XPS Phase 3 - Molybdenum Separation Test |
13-13 |
| Table 13-11: XPS Phase 3 - Flotation Blends
Test Results |
13-13 |
| Table 13-12: XPS Phase 3 - Flotation Water Test Results |
13-14 |
| Table 13-13: Production Composites |
13-15 |
| Table 13-14: BML Mineral Content |
13-15 |
| Table 13-15: BML CEC Analysis |
13-16 |
| Table 13-16: BML Locked Cycle Test Results |
13-17 |
| Table 13-17: Production Recovery Profile
|
13-20 |
| Table 14-1: Drilling Data By Company |
14-1 |
| Table 14-2: Legend of Interpreted
Wireframes |
14-4 |
| Table 14-3: Samples and Length Analyzed |
14-7 |
| Table 14-4: Capping Thresolds by Lithology
|
14-12 |
| Table 14-5: Assay Statistics for Total Copper by Lithology
in Sulfides |
14-13 |
| Table 14-6: Assay Statistics for Acid
Soluble Copper by Lithology in Sulfides |
14-13
|
Page vi
|
|
Rosemont Project |
| Form
43-101F1 Technical Report |
| Table 14-7: Assay Statistics for Molybdenum
by Lithology in Sulfides |
14-14 |
| Table 14-8: Assay Statistics for silver by Lithology in
Sulfides |
14-14 |
| Table 14-9: Assay RMA Regression
Parameters, Silver Against Copper |
14-16 |
| Table 14-10: Drilling Data by company |
14-17 |
| Table 14-11: Matrix of Boundary Conditions,
Total Copper |
14-23 |
| Table 14-12: Matrix of Boundary Conditions, Acid Soluble
Copper |
14-24 |
| Table 14-13: Matrix of Boundary Conditions,
Molybdenum |
14-25 |
| Table 14-14: Matrix of Boundary Conditions, Silver |
14-26 |
| Table 14-15: Length Weighted Uncapped and
Capped 25-foot Composite Statistics, Copper in Sulfides |
14-27 |
| Table 14-16: Length Weighted Uncapped and Capped 25-foot
Composite Statistics, Acid Soluble Copper in Sulfides |
14-27 |
| Table 14-17: Length Weighted Uncapped and
Capped 25-foot Composite Statistics, Molybdenum in Sulfides |
14-28 |
| Table 14-18: Length Weighted Uncapped and Capped 25-foot
Composite Statistics, Silver in sulfides |
14-28 |
| Table 14-19: Variogram Models and Rotation
Angles |
14-32 |
| Table 14-20: Copper and Acid Soluble Copper Grade Model
Interpolation Plans |
14-34 |
| Table 14-21: Molybdenum and Silver Grade
Model Interpolation Plans |
14-35 |
| Table 14-22: Measured Compared to Calculated Specific
Gravity |
14-36 |
| Table 14-23: Specific Gravity Measurements
per Lithology and Oxidation State |
14-37 |
| Table 14-24: SG Baseline Values per Lithology and Oxidation
Level |
14-38 |
| Table 14-25: Tonnage Factors by Lithology
and Oxidation State |
14-39 |
| Table 14-26: Assay, NN, IDw and OK Model, Copper Removed by
Capping in Blocks Within the Resource Pit and Above $5.7/Ton NSR |
14-46 |
| Table 14-27: Assay, NN, IDW and OK Model,
Acid Soluble Copper Removed by Capping in Blocks Within the Resource Pit
and Above $5.7/Ton NSR |
14-46 |
| Table 14-28: Assay, NN, IDW and OK Model, Molybdenum
Removed by Capping in Blocks Within the Resource Pit and Above $5.7/Ton
NSR |
14-47 |
| Table 14-29: Assay, NN, IDW and OK Model,
Silver Removed by Capping in Blocks Within the Resource Pit and Above
$5.7/Ton NSR |
14-47 |
| Table 14-30: NN, IDW and OK Model Statistics Mean Block
Grade Comparisons for Copper in Blocks Within the Resource Pit and Above
$5.7/Ton NSR |
14-49 |
| Table 14-31: NN, IDW and OK Model
Statistics Mean Block Grade Comparisons for Acid Soluble Copper in Blocks
Within the Resource Pit and Above $5.7/Ton NSR |
14-49 |
| Table 14-32: NN, IDW and OK Model Statistics Mean Block
Grade Comparisons for Molybdenum Silver in Blocks Within the Resource Pit
and Above $5.7/Ton NSR |
14-50 |
| Table 14-33: NN, IDW and OK Model
Statistics Mean Block Grade Comparisons for Silver in Blocks Within the
Resource Pit and Above $5.7/Ton NSR |
14-50 |
Page vii
|
|
Rosemont Project |
| Form
43-101F1 Technical Report |
| Table 14-34: Quality Control Statistics of
the Copper interpolation in Measured and Indicated Blocks Above $5.7/Ton
NSR Within the Resource Pit Shell |
14-64 |
| Table 14-35: Grade-Tonnage Statistics, Copper |
14-65 |
| Table 14-36: Lerchs-Grossman Cone Inputs
|
14-70 |
| Table 14-37: Economic Parameters |
14-71 |
| Table 14-38: Resource by Category,
Mineralized Zone and NSR Cut-Off
(1)(2)(3)(4)(5)(6)(7)(8)(9)(10) |
14-72 |
| Table 14-39: Measured Resource by Mineralized Zone and
Multiple NSR Cut-Offs |
14-73 |
| Table 14-40: Indicated Resource by
Mineralized Zone and Multiple NSR Cut-Offs |
14-73 |
| Table 14-41: Inferred Resource by Mineralized Zone and
Multiple NSR Cut-Offs |
14-74 |
| Table 14-42: Measured and Indicated,
Comparison to 2012 Augusta Estimate |
14-74 |
| Table 14-43: Inferred, Comparison to 2012 Augusta Estimate
|
14-75 |
| Table 15-1: Metallurgical Recoveries Used
In Lerchs-Grossman Evaluations |
15-2 |
| Table 15-2: Base-Case Lerchs-Grossman Economic Parameters
|
15-3 |
| Table 15-3: Overall Slope Angles Used in
Lerchs-Grossman Analysis |
15-5 |
| Table 15-4: Pit Design Parameters |
15-8 |
| Table 15-5: Proven and Probable Mineral
Reserves in Rosemont Final Pit |
15-10 |
| Table 15-6: Proven and Probable Mineral Reserves in
Rosemont Final Pit by Ore Type |
15-10 |
| Table 15-7: Rosemont Mineral Exclusive
Resource Estimates |
15-12 |
| Table 15-8: Proven and Probable, Comparison to 2012 Augusta
Reserve Estimate |
15-13 |
| Table 16-1: Pit Design Parameters |
16-2 |
| Table 16-2: Rosemont Slope Guidance |
16-3 |
| Table 16-3: Rosemont Mine Phases Mineral
Reserves |
16-11 |
| Table 16-4: Rosemont Mine Phases, Mineral Reserves by Ore
Type |
16-11 |
| Table 16-5: Mine Production Schedule
Criteria |
16-12 |
| Table 16-6: Mill Ramp-Up Schedule |
16-12 |
| Table 16-7: Mine Production Schedule – LOM
RP16Aug |
16-25 |
| Table 16-8: WRSA Design Criteria |
16-27 |
| Table 16-9: DSTF Buttress Rock Storage
Design Criteria |
16-28 |
| Table 16-10: LOM Waste Rock Distribution and Landforming
Storage Plan |
16-29 |
| Table 16-11: Material Characteristics |
16-30 |
| Table 16-12: Major Fleet Requirements for LOM |
16-32 |
| Table 16-13: Major Equipment KPI and
Productivity |
16-33 |
| Table 16-14: Labor Estimation for Rosemont Mine Operations
|
16-41 |
| Table 16-15: Labor Estimation for Rosemont
Process Operations |
16-42 |
| Table 16-16: labor Estimation for Rosemont G&A
Operations |
16-43 |
| Table 17-1: Key Facility Design Criteria
|
17-3
|
Page viii
|
|
Rosemont Project |
| Form
43-101F1 Technical Report |
| Table 17-2: Key Design Criteria |
17-5 |
| Table 17-3: Plant Utilization Summary |
17-6 |
| Table 19-1: Copper Concentrate |
19-1 |
| Table 19-2: Molybdenum Concentrate |
19-1 |
| Table 21-1: INITIAL Capital Cost Summary
|
21-1 |
| Table 21-2: Sustaining Capital |
21-3 |
| Table 21-3: Operating Cost Summary |
21-4 |
| Table 21-4: Cash Costs (Net of By-product Credits at Stream
Prices) |
21-4 |
| Table 22-1: Metal Price Assumptions |
22-1 |
| Table 22-2: Mine and Mill Operating Assumptions used in the
Financial Model (100% Project Basis) |
22-2 |
| Table 22-3: Capital and Operating Cost
Assumptions used in the Financial Model (100% Project Basis) |
22-3 |
| Table 22-4: Tax Depreciation for Development Capital |
22-5 |
| Table 22-5: Annual Cash Flow Model |
22-6 |
| Table 22-6: Life Of Mine Financial Metrics (100% Project
Basis) |
22-10 |
| Table 22-7: After-Tax NPV8%, NPV10% and IRR
Sensitivity at Various Flat Copper Prices (100% Basis) |
22-11 |
| Table 22-8: Key Financial Metrics Attributable to Hudbay
|
22-12 |
| Table 24-1: Risk Assessments |
24-4
|
Page ix
|
|
Rosemont Project |
| Form
43-101F1 Technical Report |
LIST OF FIGURES
| TITLE |
PAGE |
| Figure 1-1: Rosemont Copper Project
Property Location |
1-4 |
| Figure 1-2: Plan View Contours of Selected Lerchs-Grossman
Pit Shell (Pit Shell 30) |
1-16 |
| Figure 1-3: AA’ Section View of Selected
Lerchs-Grossman Pit Shell (Pit Shell 30) |
1-16 |
| Figure 1-4: Rosemont Mine Plan Site Layout |
1-20 |
| Figure 1-5: Plan View of Rosemont Mine
Phases |
1-21 |
| Figure 1-6: AA' Section View of Rosemont Mine Phases |
1-21 |
| Figure 1-7: Rosemont Mine Schedule,
Material Movement |
1-23 |
| Figure 1-8: Dry Stack Tailings Facility NS Section View,
LOM Buttress by Year |
1-24 |
| Figure 1-9: Rosemont Annual Copper
Production and C1 Cash Costs |
1-30 |
| Figure 1-10: NPV8% Sensitivity (100% Basis) |
1-32 |
| Figure 4-1: Property Location of Rosemont
Project |
4-1 |
| Figure 4-2: Rosemont Property Ownership |
4-3 |
| Figure 7-1: Laramide Belt and Associated
Porphyry Copper Mineralization (Barra ET AL., 2005) |
7-1 |
| Figure 7-2: Santa Rita Mountain Geology (Adapted From
Drewes ET AL., 2002) |
7-3 |
| Figure 7-3: Rosemont Regional Geology |
7-4 |
| Figure 7-4: Rosemont Stratigraphic Column |
7-5 |
| Figure 7-5: Rosemont Deposit Geologic –
4,000 Foot Level Plan |
7-6 |
| Figure 7-6: Rosemont Deposit Geologic – 11,555,050 Vertical
Section |
7-7 |
| Figure 7-7: Chemostratigraphy Rosemont
Deposit Geology |
7-8 |
| Figure 7-8: Rosemont Deposit Geological Model Structural
Domains 3D View (Looking North) |
7-9 |
| Figure 7-9: Mineralization Domains Section
11,555,500 N |
7-12 |
| Figure 7-10: Ore Types Cart Model |
7-14 |
| Figure 10-1: Rosemont Deposit Drill Hole
Locations By Company |
10-2 |
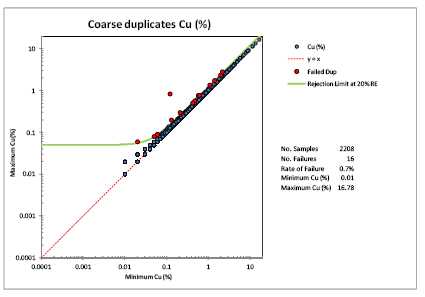
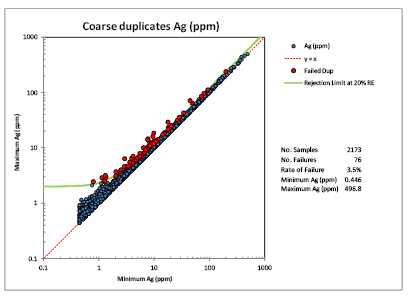
| Figure 11-1: Copper Coarse Duplicate Minimum and Maximum
Plot |
11-10 |
| Figure 11-2: Molybdenum Coarse Duplicate
Minimum and Maximum Plot |
11-10 |
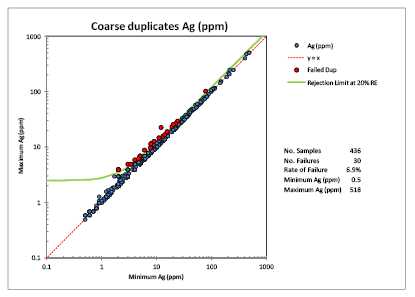
| Figure 11-3: Silver Coarse Duplicate Minimum and Maximum
Plot |
11-11 |
| Figure 11-4: Soluble Copper Coarse
Duplicate Minimum and Maximum Plot |
11-11 |
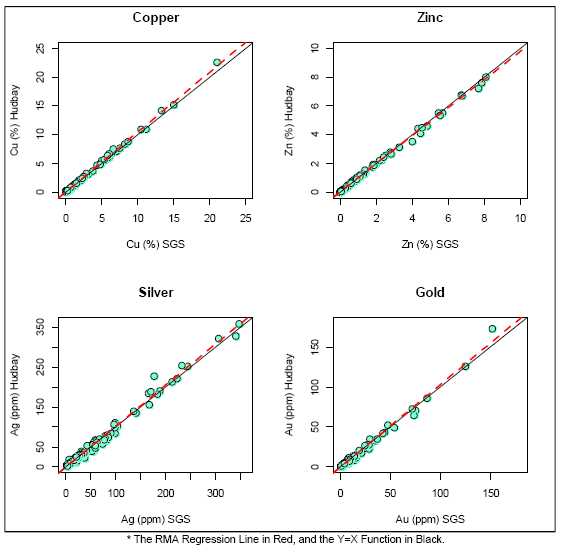
| Figure 11-5: XP Plots of Check Assay Data, Comparing
Primary Laboratory Bureau Veritas to Secondary Laboratory SGS |
11-13 |
| Figure 11-6: Copper Coarse Duplicate
Minimum and Maximum Plot |
11-19 |
| Figure 11-7: Molybdenum Coarse Duplicate Minimum and
Maximum Plot |
11-19 |
| Figure 11-8: Silver Coarse Duplicate
Minimum and Maximum PLot |
11-20 |
| Figure 11-9: Soluble Copper Coarse Duplicate Minimum and
Maximum Plot |
11-20 |
Page x
|
|
Rosemont Project |
| Form
43-101F1 Technical Report |
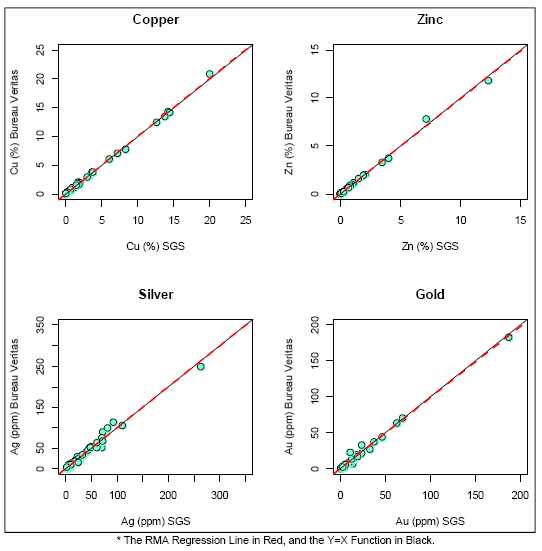
| Figure 11-10: XP Plots of Check Assay Data,
Comparing Primary Laboratory Bureau Vertias To Secondary Laboratory SGS
|
11-21 |
| Figure 11-11: Boxplots of SG Measured By Hudbay and Augusta
at Inspectorate and Skyline Laboratories, Respectively |
11-23 |
| Figure 11-12: Boxplots of Raw Molybdenum
Data and Factored Data Reported by Wet and XRF (A- A = Anaconda-ANamax and
Y-Axis in Logarithmic Scale) |
11-32 |
| Figure 13-1: % COPPER Rougher Flotation Recovery VS % Acid
Soluble / Total Copper |
13-9 |
| Figure 13-2: LCT Final Concentrate Fluorine
Levels |
13-18 |
| Figure 14-1: 3D View of Interpreted Lithology Wireframes,
Looking Northwest |
14-3 |
| Figure 14-2: 3D View of Interpreted
Oxidation Wireframes, Looking Northwest |
14-5 |
| Figure 14-3: EW Cross Section of the Ore Types Wireframes
|
14-6 |
| Figure 14-4: Box Plots of Total Copper
Assays in Sulfides |
14-8 |
| Figure 14-5: Box Plots of Acid Soluble Copper in Sulfides
|
14-9 |
| Figure 14-6: Box Plots of Molybdenum Assays
in Sulfides |
14-10 |
| Figure 14-7: Box Plots of Silver Assays in Sulfides |
14-11 |
| Figure 14-8: Scatter Plot of Capped Silver
and Capped Copper, All Lithology Domains |
14-15 |
| Figure 14-9: Scatter Plot of Capped Molybdenum and Capped
Copper, All Lithology Domains |
14-16 |
| Figure 14-10: QQ Plot of Original
Molybdemum Grade Versus Corrected Molybdenum Grade |
14-17 |
| Figure 14-11: Box Plot of Gold in Oxide |
14-18 |
| Figure 14-12: Box Plot of Gold in Mix |
14-19 |
| Figure 14-13: Box Plot of Gold in Hypogene |
14-20 |
| Figure 14-14: Contact Profile, Upper and
Lower Earp |
14-22 |
| Figure 14-15: Histogram, 25-foot Copper Composites,
Horquilla Lithology |
14-29 |
| Figure 14-16: Downhole Variogram Copper,
Lower Group of Lithologies in Sulfides |
14-30 |
| Figure 14-17: Correlogram of the Main Structure of Copper,
Lower Group of Lithologies in Sulfides |
14-31 |
| Figure 14-18: Correlogram of the Nested
Structure of Copper, Lower Group of Lithologies in Sulfides |
14-31
|
| Figure 14-19: Scatterplot of Total Copper and Specific
Gravity |
14-37 |
| Figure 14-20: OK, IDW and NN Specific
Gravity Distribution |
14-38 |
| Figure 14-21: Vertical E-W Section 11,554,900 Showing OK
Model and Composites - Copper |
14-41 |
| Figure 14-22: Vertical E-W Section
11,554,900 Showing OK Model and Composites – Acid Soluble Copper Grade |
14-42 |
| Figure 14-23: Vertical E-W Section 11,554,900 Showing OK
Model and Composites - Molybdenum Grade |
14-43 |
| Figure 14-24: Vertical E-W Section
11,554,900 Showing OK Model and Composites – Silver Grade |
14-44
|
| Figure 14-25: Measured and Indicated Blocks Above $5.7/Ton
NSR Within the Resource Pit Shell, Copper Swath Plot by Easting |
14-52 |
| Figure 14-26: Measured and Indicated Blocks
Above $5.7/Ton NSR Within the Resource Pit Shell, Copper Swath Plot by
Northing |
14-53
|
Page xi
|
|
Rosemont Project |
| Form
43-101F1 Technical Report |
| Figure 14-27: Measured and Indicated Blocks
Above $5.7/Ton NSR Within the Resource Pit Shell, Copper Swath Plot by
Elevation |
14-54 |
| Figure 14-28: Measured and Indicated Blocks Above $5.7/Ton
NSR Within the Resource Pit Shell, Acid Soluble Copper Swath Plot by
Easting |
14-55 |
| Figure 14-29: Measured and Indicated Blocks
above $5.7/Ton NSR within the resource pit shell, acid soluble Copper
Swath Plot by Northing |
14-56 |
| Figure 14-30: Measured and Indicated Blocks Above $5.7/Ton
NSR Within the Resource Pit Shell, Acid Soluble Copper Swath Plot by
Elevation |
14-57 |
| Figure 14-31: Measured and Indicated Blocks
Above $5.7/Ton NSR Within the Resource Pit Shell, Molybdenum Swath Plot by
Easting |
14-58 |
| Figure 14-32: Measured and Indicated Blocks Above $5.7/Ton
NSR Within the Resource Pit Shell, Molybdenum Swath Plot by Northing |
14-59 |
| Figure 14-33: Measured and Indicated Blocks
Above $5.7/Ton NSR Within the Resource Pit Shell, Molybdenum Swath Plot By
Elevation |
14-60 |
| Figure 14-34: Measured and Indicated Blocks Above $5.7/Ton
NSR Within the Resource Pit Shell, Silver Swath Plot by Easting |
14-61 |
| Figure 14-35: Measured and Indicated Blocks
Above $5.7/Ton NSR Within the Resource Pit Shell, Silver Swath Plot by
Northing |
14-62 |
| Figure 14-36: Measured and Indicated Blocks Above $5.7/Ton
NSR Within the Resource Pit Shell, Silver Swath Plot by Elevation |
14-63 |
| Figure 14-37: NN, IDW and OK Copper
Grade-Tonnage Curves, All Lithologies in Measured and Indicated Blocks
Above $5.7/Ton NSR Within the Resource Pit Shell |
14-66 |
| Figure 14-38: Vertical e-w Section 11,554,600 Showing
Resource Classification and Drill Holes |
14-68 |
| Figure 15-1: Plan View Contours of Selected
Lerchs-Grossman Pit Shell |
15-5 |
| Figure 15-2: Rosemont Whittle Results, Revenue Factor
Sensitivity |
15-6 |
| Figure 15-3: Plan View Contours of Selected
Lerchs-Grossman Pit Shell |
15-7 |
| Figure 15-4: AA’ Section View of Selected Lerchs-Grossman
Pit Shell |
15-7 |
| Figure 15-5: Plan View of Rosemont Final
Pit and Economic Shell 30 |
15-11 |
| Figure 15-6: Section view BB’ of Rosemont Final Pit and
Economic Shell 30 |
15-11 |
| Figure 16-1: Rosemont Mine Plan Site Layout
|
16-2 |
| Figure 16-2: Rosemont Geotechnical Sectors |
16-3 |
| Figure 16-3: Plan View of Mining Pit Phase
1 |
16-4 |
| Figure 16-4: Plan View of Mining Pit Phase 2 |
16-5 |
| Figure 16-5: Plan View of Mining Pit Phase
3 |
16-6 |
| Figure 16-6: Plan View of Mining Pit Phase 4 |
16-7 |
| Figure 16-7: Plan View of Mining Pit Phase
5 |
16-8 |
| Figure 16-8: Plan View of Mining Pit Phase 6 (Ultimate Pit)
|
16-9 |
| Figure 16-9: Plan View of Rosemont Mine
Phases |
16-10 |
| Figure 16-10: AA’ Section View of Rosemont Mine Phases |
16-10 |
Page xii
|
|
Rosemont Project |
| Form
43-101F1 Technical Report |
| Figure 16-11: Mine Plan End of Period
Pre-Production |
16-14 |
| Figure 16-12: Mine Plan End of Period Year 1 |
16-15 |
| Figure 16-13: Mine Plan End of Period Year
2 |
16-15 |
| Figure 16-14: Mine Plan End of Period Year 3 |
16-16 |
| Figure 16-15: Mine Plan End of Period Year
4 |
16-16 |
| Figure 16-16: Mine Plan End of Period Year 5 |
16-17 |
| Figure 16-17: Mine Plan End of Period Year
6 |
16-17 |
| Figure 16-18: Mine Plan End of Period Year 7 |
16-18 |
| Figure 16-19: Mine Plan End of Period Year
8 |
16-18 |
| Figure 16-20: Mine Plan End of Period Year 9 |
16-19 |
| Figure 16-21: Mine Plan End of Period Year
10 |
16-19 |
| Figure 16-22: Mine Plan End of Period Year 11 |
16-20 |
| Figure 16-23: Mine Plan End of Period Year
12 |
16-20 |
| Figure 16-24: Mine Plan End of Period Year 13 |
16-21 |
| Figure 16-25: Mine Plan End of Period Year
14 |
16-21 |
| Figure 16-26: Mine Plan End of Period Year 15 |
16-22 |
| Figure 16-27: Mine Plan End of Period Year
16 |
16-22 |
| Figure 16-28: Mine Plan End of Period Year 17 |
16-23 |
| Figure 16-29: Mine Plan End of Period Year
18 |
16-23 |
| Figure 16-30: Mine Plan End of Period Year 19 |
16-24 |
| Figure 16-31: Mine Plan, Final Topography
|
16-24 |
| Figure 16-32: Rosemont Mine Schedule, Material Movement |
16-26 |
| Figure 16-33: Rosemont Mine Schedule, Mill
Feed Ore by Lithology |
16-26 |
| Figure 16-34: Rosemont Mine Schedule, Mill Feed Ore by Ore
Type |
16-27 |
| Figure 16-35: DSTF NS Section View, LOM
Buttress by Year |
16-29 |
| Figure 16-36: Rosemont Geotechnical Sectors |
16-37 |
| Figure 16-37: Section AA’ Showing RQD
Values in Final Rosemont Pit |
16-37 |
| Figure 16-38: Rosemont Final Pit, Lithology in Final Wall
|
16-38 |
| Figure 16-39: Section BB’ showing Hard
Values in Final Rosemont Pit |
16-38 |
| Figure 16-40: Section AA’ Showing Hard Values in Final
Rosemont Pit |
16-40 |
| Figure 17-1: Overall View of Process Plant
Looking North |
17-2 |
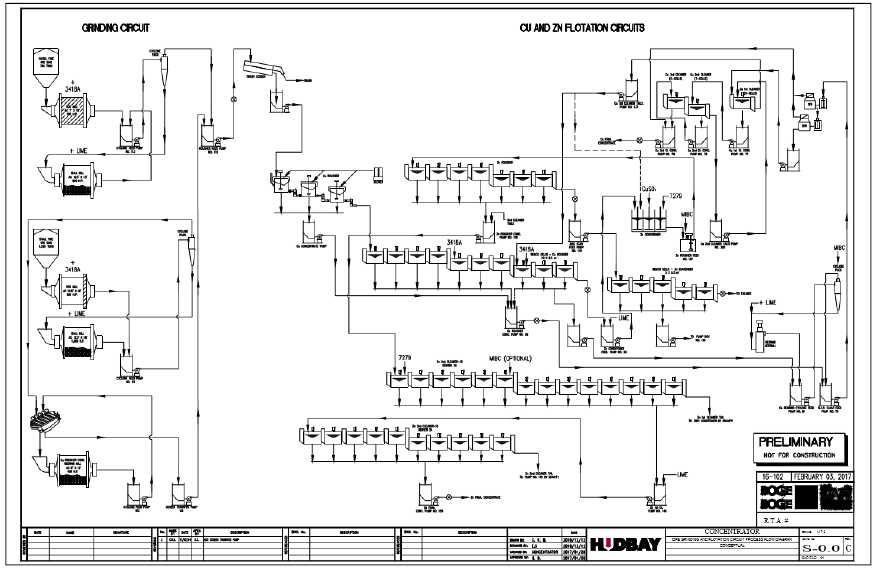
| Figure 17-2: Process Plant Process Flow Diagram |
17-5 |
| Figure 17-3: Primary Crusher |
17-7 |
| Figure 17-4: Stockpile Fabric Cover |
17-8 |
| Figure 17-5: Grinding Building From
Stockpile Looking North (Roof and Walls removed) |
17-9
|
Page xiii
|
|
Rosemont Project |
| Form
43-101F1 Technical Report |
| Figure 17-6: Pebble Crushing Looking South
From the Grinding Area |
17-10 |
| Figure 17-7: Copper Flotation |
17-11 |
| Figure 17-8: Copper Regrind Area Looking
West |
17-12 |
| Figure 17-9: Molybdenum Plant Looking West (Roof and walls
Removed) |
17-14 |
| Figure 17-10: Copper Concentrate
Filtration, Storage and Load out Looking South |
17-16 |
| Figure 17-11: Tailing Thickeners Looking East |
17-17 |
| Figure 17-12: Tailings Filter Plant (roof
and walls removed) |
17-18 |
| Figure 17-13: Tailings Shiftable Conveyor/Mobile Tripper
|
17-19 |
| Figure 17-14: Reagents Area |
17-20 |
| Figure 18-1: Plant and Access Road |
18-1 |
| Figure 18-2: CEC Approved Utility Corridor
for 138Kv Transmission Line |
18-3 |
| Figure 18-3: Utility Corridor for Water Line |
18-4 |
| Figure 22-1: Rosemont Annual Copper
Production and C1 Cash Costs |
22-4 |
| Figure 22-2: NPV8% Sensitivity (100% Basis) |
22-11 |
| Figure 24-1: Overall Construction
Management & HSEC (EPCM) |
24-1
|
Page xiv
|
|
Rosemont Project |
| Form
43-101F1 Technical Report |
LIST OF APPENDICES
| TITLE |
PAGE |
| |
|
| A1-1 Land Tenure |
30-1 |
| |
|
| A1-2 Rosemont Project Patented Claims |
30-2 |
| |
|
| A1-3 Rosemont Project Unpatented Claims |
30-5 |
| |
|
| A1-4 Rosemont Project Fee Owned
(Associated) Lands |
30-27 |
| |
|
| A2-1 Permits and Authorizations |
30-28
|
Page xv
|
|
Rosemont Project |
| Form
43-101F1 Technical Report |
1
SUMMARY
The information that follows provides an executive summary of
important information contained in this Technical Report.
1.1
Introduction
The author has prepared this Technical Report for Hudbay
Minerals Inc. (“Hudbay”) with respect to its Rosemont Project (the “Project”),
located in Arizona (the “Property”), issued and effective as of March 30, 2017.
The purpose of this Report is to present Hudbay’s estimate of the mineral
reserves and mineral resources for the Project based on the current mine plan,
the current state of metallurgical testing, operating cost and capital cost
estimates.
Hudbay is a Canadian integrated mining company with assets in
North and South America principally focused on the discovery, production and
marketing of base and precious metals. Hudbay’s objective is to maximize
shareholder value through efficient operations, organic growth and accretive
acquisitions, while maintaining its financial strength.
Hudbay completed the acquisition of the Project on September
23, 2014 through its acquisition of all issued and outstanding common shares of
Augusta Resource Corporation (“Augusta”) pursuant to the take-over bid, which
expired July 29, 2014.
Hudbay owns a 92.05% interest in the 132 patented claims and
1,064 unpatented claims that comprise the Project, all of which are duly
registered in the name of Hudbay’s wholly-owned subsidiary, Rosemont Copper
Company1; Rosemont Copper Company also has the required surface
rights to develop the Project. This Technical Report represents the first
technical report filed by Hudbay since its acquisition of Augusta and also
updates and supersedes Augusta’s Updated Feasibility Study dated August 28,
2012, prepared by M3 Engineering and Technology Corporation.
This Technical Report provides current estimates of the mineral
reserves and mineral resources at the Project and describes the latest resource
model, mine plan and the current state of the permitting process, metallurgical
testing, operating cost and capital cost estimates. The information presented in
this Technical Report relating to the Rosemont deposit, including the estimates
of mineral reserves and resources therein, is the result of “feasibility study”
level work conducted partly by external contractors and partly internally by
Hudbay’s personnel under the overall supervision of, Cashel Meagher, the
Qualified Person (the “QP”).
____________________________________________________
1
Hudbay’s ownership in the Project is subject to an earn-in agreement and
joint venture agreement dated September 16, 2010 between Rosemont Copper Company
and United Copper & Moly LLC, pursuant to which UCM has earned a 7.95%
interest in the project and may earn up to a 20% joint venture interest.
Page 1-1
|
|
Rosemont Project |
| Form
43-101F1 Technical Report |
This Technical Report conforms with the 2014 CIM Definition
Standards – for Mineral Resources and Mineral Reserves and the requirements in
Form 43-101F1 of National Instrument (NI) 43-101, Standards of Disclosure for
Mineral Projects.
The QP and Principal Author who supervised the preparation of
this Technical Report is Cashel Meagher, P.Geo., Senior Vice President and Chief
Operating Officer for Hudbay. Mr. Meagher last visited the property on April 21,
2016 and numerous times prior to this date. The personal site inspections were
conducted as part of the mineral resource estimation and technical report
process, to become familiar with conditions on the Property and the Project, to
observe the geology and mineralization and verify the work completed on the
Property. Mr. Meagher has reviewed and approved the 3D block model and
determination of mineral resources and mineral reserves of the Project.
As Hudbay is a “producing issuer”, as defined in NI 43-101,
this Technical Report is not required to be prepared by or under the supervision
of an independent QP.
1.2
Property Description and Location
The Project is located within the historic Helvetia-Rosemont
Mining District on the eastern flanks of the Santa Rita Mountain Range,
approximately 30 miles southeast of Tucson in Pima County, Arizona. The property
consists of a comprehensive land package that includes patented and unpatented
mining claims, fee land and grazing leases that cover most of the old mining
district. The lands are under a combination of private ownership by Rosemont
Copper and Federal ownership. The lands occur within Townships 18 and 19 South,
Ranges 15 and 16 East, Gila & Salt River Meridian. The Project’s
geographical coordinates are approximately 31º 50’N and 110º 45’W.
Hudbay’s ownership in the Project is subject to an earn-in
agreement and joint venture agreement dated September 16, 2010 between Rosemont
Copper Company and United Copper & Moly LLC (‘‘UCM’’), pursuant to which UCM
has earned a 7.95% interest in the Project and may earn up to a 20% joint
venture interest.
Hudbay has all of the surface and mineral rights required to
conduct the open pit mining operation, processing and concentrating facilities,
storage of tailings, and disposal of waste rock as documented in this Technical
Report. The core of the Project mineral resource is contained within the 132
patented mining claims that in total encompass an area of approximately 2,000
acres. Surrounding the patented claims is a contiguous package of 1,064
unpatented mining claims with an aggregate area of more than 16,000 acres.
There is a 3% Net Smelter Return (“NSR”) royalty on all 132
patented claims, 603 of the unpatented claims, and one parcel of fee owned
associated land. Pursuant to a precious metals stream agreement with Silver
Wheaton Corp. (“Silver Wheaton”) entered into on February 11, 2010, as amended
and restated on February 15, 2011, Hudbay will receive deposit payments of $230
million against delivery of 100% of the payable gold and silver from the
Project. The deposit will be payable upon the satisfaction of certain conditions precedent,
including the receipt of permits for the Project and the commencement of
construction. In addition to deposit payments, as gold and silver is delivered
to Silver Wheaton, Hudbay will receive cash payments equal to lesser of (i) the
market price and (ii) $450 per ounce (for gold) and $3.90 per ounce (for
silver), subject to one percent annual escalation after three years.
Approximately 50% of the copper concentrate has been contracted under existing
commitments that are on benchmark-based terms.
Page 1-2
|
|
Rosemont Project |
| Form
43-101F1 Technical Report |
1.3
Accessibility, Climate, Local Resources, Infrastructure and
Physiography
Existing graded dirt roads connect the Project site with State
Route 83, which provides easy access to the Project for the communities of
Tucson and Benson to the north, and to Sierra Vista, Sonoita, Patagonia and
Nogales to the south. The city of Tucson, Arizona provides the nearest major
railroad and air transport services to support the Project.
The Project site is located immediately adjacent and west of
Arizona State Route 83, approximately eleven miles south of Interstate 10
(I-10). This system of state and interstate highways allows convenient access to
the site for all major truck deliveries. The majority of the labour and supplies
for construction and operations come from the surrounding areas in Pima,
Maricopa, Cochise, and Santa Cruz counties.
The southern Arizona climate is typical of a semi-arid
continental desert with hot summers and temperate winters. However, higher
elevations in the Project area (4,550 to 5,350 feet AMSL) result in a milder
climate than at lower elevations across the region. Summer daily high
temperatures are above 90°F with significant cooling at night. Winter in the
Project area is typically drier with mild daytime temperatures and overnight
temperatures that are typically above freezing.
The average annual precipitation in the Project area is
estimated between 16 and 18 inches with more than half of the annual
precipitation occurring during the monsoon season from July through September.
Rainfall has minor effects on a mining operation, which is considered to be 365
days per year.
The Project is located within the northern portion of the Santa
Rita Mountains that form the western edge of the Mexican Highland section of the
Basin and Range Physiographic Province characterized by high mountain ranges
adjacent to alluvial filled basins. Vegetation in the Project area reflects the
climate with the lower slopes of the Santa Rita Mountains dominated by mesquite
and grasses while the higher elevations, receiving greater rainfall, support an
open cover of oak, pine, juniper and cypress trees.
Page 1-3
|
|
Rosemont Project |
| Form
43-101F1 Technical Report |
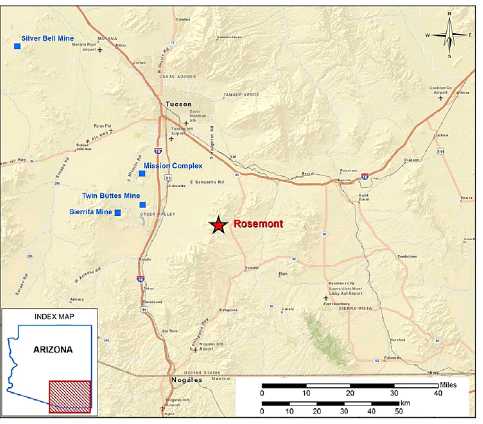
FIGURE 1-1: ROSEMONT COPPER PROJECT PROPERTY LOCATION
1.4
History
The first recorded mining activity in the Helvetia-Rosemont
mining district occurred in 1875 and the mining district was officially
established in 1878. Production from mines on both sides of the Santa Rita
ridgeline supported the construction and operation of two smelters. Copper
production from the district ceased in 1951 after production of about 227,300
tons of ore.
By the late 1950s, the Banner Mining Company (“Banner”) had
acquired most of the claims in the area and had drilled the discovery hole into
the Rosemont deposit. In 1963, Anaconda Mining Co. acquired options to lease the
Banner holdings. Over the next ten years, they carried out an extensive drilling
program on both sides of the ridgeline.
In 1973, the Anaconda Mining Co. and Amax Inc. formed a 50/50
partnership to form the Anamax Mining Co. (“Anamax”) and in 1985, Anamax ceased
operations and liquidated their assets.
ASARCO Inc. (“Asarco”) purchased the patented and unpatented
mining claims from Anamax’s real estate interests in August 1988 and renewed
exploration and engineering studies. Asarco expanded the core of the mineral
deposit in 1995 by patenting 347 acres, the last of the available claims for the
orebody. In 1999, Grupo Mexico acquired the Helvetia-Rosemont property through a
merger with Asarco and in 2004 Grupo Mexico sold the property to a Tucson real
estate developer.
Page 1-4
|
|
Rosemont Project |
| Form
43-101F1 Technical Report |
In April 2005, Augusta purchased the Property from Triangle
Ventures LLC and initiated a series of extensive drill programs on the property.
A Technical Report issued by Augusta in 2012 estimated mineral reserves of 667.2
million tons at an average grade of 0.44% copper, 0.015% molybdenum and 0.12
ounces per ton of silver based on $4.90 per ton net smelter return cut-off using
metal prices of 2.50/lb. copper, $15.00/lb. molybdenum and $20.00/oz.
silver.
Note that Hudbay has treated Augusta’s publicly disclosed
estimated mineral reserves and resources as a historical estimate under NI
43-101 and not as current mineral reserves and resources, as a qualified person
has not performed sufficient work for Hudbay to classify the 2012 estimate for
the Project’s mineral reserves or resources as current mineral reserves or
mineral resources.
Following its acquisition of Augusta, Hudbay acquired all of
the issued and outstanding common shares of Augusta pursuant to a take-over bid,
which expired July 29, 2014, and a subsequent acquisition transaction, which
closed on September 23, 2014. Hudbay’s ownership in the Project is subject to an
earn-in agreement with UCM, pursuant to which UCM has earned a 7.95% interest in
the Project and may earn up to a 20% interest. A joint venture agreement between
Hudbay’s subsidiary, Rosemont Copper Company, and UCM governs the parties’
respective rights and obligations with respect to the Project.
Hudbay completed a 43-hole, 92,909 feet (28,319 m) drill
program from September to December 2014 and a 46-hole, 75,164 feet (22,910 m)
drill program from August to November 2015 in further efforts to better
understand the geological setting and mineralization of the deposit and to
collect additional metallurgical and geotechnical information.
1.5
Geological Setting and Mineralization
The Laramide belt is a major porphyry province that extends for
approximately 621 miles (1,000 km) from Arizona to Sinaloa, Mexico. It hosts a
number of world-class deposits including the Rosemont deposit. The northern
block of the Santa Rita Mountains, where the Rosemont deposit lies, is dominated
by Precambrian granite, with some dismembered slices of Paleozoic and Mesozoic
sediments on the eastern and northern sides.
Paleozoic sedimentary carbonate units are the predominant host
rocks for the copper mineralization. Structurally overlying these predominantly
carbonate units at Rosemont are Mesozoic clastic units, including conglomerates,
sandstones, and siltstones. These clastic upper sequences have andesitic flows
and host mineralization. Quartz monzonite and quartz latite sill-shaped
porphyries intruded both sequences and are associated with the porphyry/skarn
mineralization.
Post-mineral features partially delimit the defined resource,
dividing the deposit into major structural blocks with contrasting intensities
and types of mineralization. The north-trending, steeply-dipping Backbone Fault
juxtaposes marginally mineralized Precambrian granodiorite and Lower
Paleozoic quartzite and limestone to the west against a block of younger,
well-mineralized Paleozoic limestone units to the east.
Page 1-5
|
|
Rosemont Project |
| Form
43-101F1 Technical Report |
The Rosemont deposit consists of copper-molybdenum-silver-gold
mineralization primarily hosted in skarn that formed in the Paleozoic rocks as a
result of the intrusion of quartz latite to quartz monzonite porphyry
intrusions. Bornite-chalcopyrite-molybdenite mineralization occurs as veinlets
and disseminations in the skarn.
Three mineralization domains (oxide, mixed and sulfide) were
defined based on the soluble to total copper ratio (ASCu/TCu) collected in the
Augusta (2005 to 2012) and Hudbay (2014 and 2015) drilling programs. The
oxidation and mixed mineralization occurs mainly above a low angle fault
defining the contact between the Palozoic and Mesozoic rocks as chrysocolla,
copper carbonates and supergene chalcocite.
1.6
Deposit Types
As mentioned above, the Rosemont deposit consists of
copper-molybdenum-silver-gold mineralization primarily hosted in skarn,
genetically, it is a style of porphyry copper deposit, although intrusive rocks
are volumetrically minor within the resource area. The skarns are formed as the
result of thermal and metasomatic alteration of Paleozoic carbonate and to a
lesser extent Mesozoic clastic rocks. Near surface weathering has resulted in
the oxidation of the sulfides in the overlying Mesozoic units however, oxidation
also occurs in the underlying Paleozoic carbonates.
1.7
Exploration
Prospecting began in the Rosemont and Helvetia Mining Districts
in the mid-1800s and by 1875 copper production was first recorded, which
continued sporadically until 1951. By the late 1950s, exploration drilling had
discovered the Rosemont deposit. A succession of major mining companies
subsequently conducted exploratory drilling of the Rosemont deposit and the
nearby Broadtop Butte, Peach Elgin and Copper World mineralized areas.
Augusta acquired the Rosemont property in 2005 and performed
infill drilling of the Rosemont deposit along with exploration geophysical
surveys. A Titan 24 induced polarization/resistivity (DCIP) survey over the
Rosemont deposit, performed in 2011, discovered significant chargeability
anomalies, which were partially tested. These anomalies appear to define
mineralization and certain unmineralized lithologic units. A regional scale
airborne magnetics survey was also completed in 2008.
Two infill drilling campaigns were completed by Hudbay in and
beneath the Rosemont deposit in the fall of both 2014 and 2015. In addition to
chemical assaying, magnetic susceptibility and conductivity measurements were
taken. A single test-line of DCIP data was collected over the Rosemont deposit
using the DIAS Geophysical in April 2015 for comparison to the previously
completed Titan 24 survey.
Page 1-6
|
|
Rosemont Project |
| Form
43-101F1 Technical Report |
Hudbay analyzed all samples of the 2014 and 2015 drilling
programs with ICP multi-element geochemistry. This new geochemical data set was
used to classify rocks according to chemical indexes in a ternary diagram
defined by siliciclatic, limestone and dolomitic vertices. The lithogeochemical
groups honour the deposit stratigraphy and geochemical attributes and proved to
be a useful tool for geological modeling and vectoring.
A mapping and geochemical sampling program was completed in the
latter half of 2015 on the Rosemont property to reassess the interpretation of
the regional geology and deposit setting. This was followed by a structural
interpretation using both surface and drill core measurements to aid in the
geotechnical evaluation of the Project.
1.8
Drilling
Extensive drilling has been conducted at the Rosemont deposit
by several successive property owners. The most recent drilling was done by
Hudbay, with prior drilling campaigns completed by Banner, Anaconda Mining Co.,
Anamax and Asarco and Augusta. Table 1-1 summarizes the drill holes used
to estimate the current mineral resource estimate, with regional exploration
holes excluded. The drillholes are approximately 200 feet apart over the core of
the deposit.
TABLE 1-1: ROSEMONT DEPOSIT DRILLING SUMMARY
|
Company |
Time Period |
Drill Holes |
| Number |
Feet |
|
Banner Mining |
1950s to 1963 |
3 |
4,300 |
|
Anaconda Mining |
1963 to 1973 |
113 |
136,838 |
|
Anamax |
1973 to 1986 |
52 |
54,350 |
|
ASARCO |
1988 to 2004 |
11 |
14,695 |
|
Augusta |
2005 to 2012 |
87 |
132,525 |
|
Hudbay |
2014 to 2015 |
90 |
168,286 |
|
Total |
|
355 |
510,780 |
The recent Hudbay drilling went deeper by approximately 300
feet on average than the Augusta drilling and almost twice as deep as the
Anaconda and Anamax drilling program. This most recent drilling has helped to
confirm the size and quality of the deposit estimated by previous owners and to
also establish its continuation at depth resulting in an improved definition of
the optimum open pit design.
1.9
Sample Preparation, Analyses, and
Security
During the Hudbay 2014 and 2015 drill programs, the samples
were transported to the Inspectorate America Corporation (“Inspectorate”)
preparation facility at Sparks, Nevada, USA. Once the samples were pulverized, a
150 g subsample pulp was collected and air-freighted to Bureau Veritas
Commodities Canada Ltd., in Vancouver, Canada, for analysis. A total of 18,361
drill core samples in 2014 and 14,868 samples in 2015 were analyzed for copper,
molybdenum and silver, through a multi-element (45 elements) determination by Inductively
Coupled Plasma Mass Spectrometry after 4-acid digestion. A total of 1,677
samples in 89 drill holes were collected for specific gravity determinations by
a standard water displacement method at the Inspectorate preparation
facility.
Page 1-7
|
|
Rosemont Project |
| Form
43-101F1 Technical Report |
As part of Hudbay’s quality control and quality assurance
(“QA/QC”) program, QA/QC samples were systematically introduced in the sample
stream to assess adequate sub-sampling procedures, potential
cross-contamination, precision, and accuracy. A total of 1,000 representative
pulp samples (5.4%) from 2014 drilling and 742 representative pulp samples
(5.0%) from 2015 drilling were selected and re-analyzed at the SGS Canada Inc.,
laboratory in Vancouver.
The core samples from the Augusta drilling programs from 2005
to 2012 were transported to Skyline Assayers and Laboratories (Skyline), in
Tucson, Arizona, USA for preparation and analysis. In total, 21,197 samples were
analyzed for total copper and 16,619 samples for molybdenum. Total copper and
molybdenum were dissolved using a hot 3-acid digestion at 482°F and subsequently
analyzed by AAS and ICP-OES, respectively. The lower detection limits for
molybdenum are high relative to the average molybdenum grade of the Rosemont
deposit. Silver was determined in 15,334 samples, which were digested using an
aqua regia leach in 0.25 g subsample pulp and analyzed by AAS. A total of 391
drill core samples across the Rosemont deposit were measured for specific
gravity at Skyline.
Augusta conducted its own internal QA/QC program to
independently evaluate the quality of the assays reported by Skyline. Standards
and blanks were systematically inserted in the sample stream. Duplicates were
not periodically inserted.
Prior to Hudbay and Augusta, significant diamond drilling,
drill core sampling, and assaying programs were executed by several property
owners. Records are not available that detail the sampling and security
protocols used by these property owners. There are no available QA/QC records
for sample preparation and assaying methodologies for Banner, Anaconda, and
Anamax. Copper, molybdenum, silver, and soluble copper were analyzed by Anaconda
and Anamax at their in-house laboratories. Silver was regularly analyzed by
Anamax, but not commonly assayed by Banner and Anaconda. Asarco assayed drill
core samples for total copper, molybdenum, and acid soluble copper (“ASCu”) at
Skyline laboratory.
1.10
Data Verification
Hudbay built an entirely new drill hole database from all
pre-Hudbay drilling and assaying information. Orix Geoscience Inc. was employed
to digitally enter collar, downhole surveys and assay information from scanned
drill logs and assay certificates for all holes drilled prior to ownership of
the property by Augusta.
The infill drilling conducted by Hudbay and Augusta together
with re-assaying of historical holes have closely replicated previous drilling
campaign results confirming that the historical data can be used with a sufficient level of confidence for resource and
reserve estimation. A bias was identified in the historical molybdenum assays
and the data was corrected.
Page 1-8
|
|
Rosemont Project |
| Form
43-101F1 Technical Report |
The author’s opinion is that the data verification is adequate
for the purposes used in the Technical Report.
1.11
Mineral Processing and Metallurgical Testing
The earliest reported testwork on Rosemont ores comprising
preliminary grinding and flotation tests was completed by Anamax in 1974. This
early work was followed by a larger testwork campaign by Augusta in 2006 and
2007 to support the preparation of a feasibility study and technical report.
Further testwork was then completed by Augusta between 2008 and 2012 to support
engineering design and updates to the original technical report.
Historical metallurgical testwork programs were undertaken by
Mountain State R&D International (MSRDI), SGS and G&T Metallurgical
Services, with dewatering and rheology testing undertaken by Pocock, Outotec and
FLSmidth. In 2014, Hudbay engaged XPS Consulting & Testwork Services (XPS)
to undertake mineral characterization and metallurgical testwork. Base Met
Laboratory (“BML”) was engaged in late 2015 to provide confirmation testwork of
the XPS testwork and additional process optimization.
The testwork investigated key geo-metallurgical variables such
as copper oxide content, swelling clays, magnesium clays and ore hardness. The
copper oxide content, as measured by the acid soluble procedure, is a good
indicator of the recoverable copper content of the ore. Clay content varies
considerably in type and quantity throughout the oxide, transition and sulfide
mineralization. Ore hardness varies from soft to very hard; testing results,
together with geomet proxy modelling, were utilized to calculate hardness in the
resource model.
Production period composites, together with the
geo-metallurgical samples, underwent flotation testing for process engineering
design as well as a recovery estimator for mine planning and the financial
model.
Through the course of all the mineral processing and
metallurgical testing, no deleterious elements were found to have a negative
impact on plant performance or on the marketable value of the copper and
molybdenum concentrates to be produced at the Project.
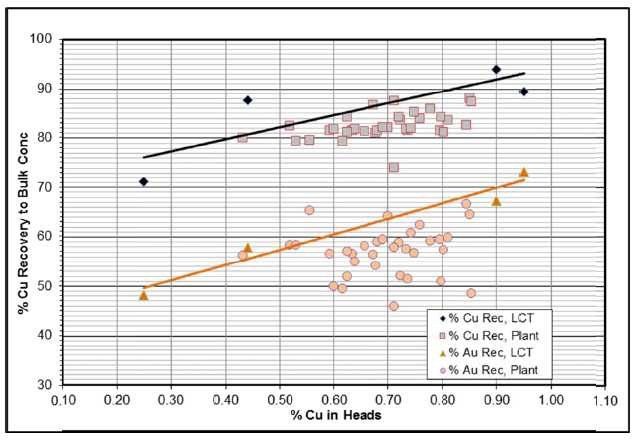
Based on the body of testwork that exists, including both the
historical testwork, and the testing programs completed by Hudbay since the
acquisition of the Project, forecasts of recovery, concentrate grade and
quality, as well as characteristics of the resultant tailing product have been
developed. The following summarizes long range mine plan (“LOM”) average
recoveries expected.
| Concentrate |
Average LOM recoveries
|
| Copper (Cu) |
80.4% |
| Molybdenum (Mo) |
53.4% |
Page 1-9
|
|
Rosemont Project |
| Form
43-101F1 Technical Report |
| Concentrate |
Average LOM recoveries
|
| Silver (Ag) |
74.4% |
| Gold (Au) |
65.1% |
1.12
Mineral Resource Estimate
Hudbay prepared a 3D block model of the Rosemont deposit. The
3D block model and determination of the mineral resources were reviewed and
approved by Cashel Meagher, P.Geo., Senior Vice President and Chief Operating
Officer for Hudbay and QP of this Technical Report.
1.12.1
Wireframe Models and Mineralization
The Rosemont deposit trends approximately along an azimuth of
N020° with a general dip of 50° to the east. The Backbone Fault forms the
footwall contact along the entire length of the deposit. Geologically, Rosemont
is a skarn deposit. The deposit is continuous along a strike length of 4,000
feet in a north-south direction, 3,000 feet in an east-west direction and goes
to a maximum vertical depth of approximately 2,500 feet.
Three sets of structures were recognized, a north-northeast
trending set, an east-west trending set and a gently east dipping set. The
structures locally offset mineralization but some also appear to control
mineralization, especially the oxidation. Wireframes were constructed for each
lithological unit, oxidation level and fault structure.
1.12.2
Exploratory Data Analysis
A statistical analysis (basic statistics, histograms, box
plots, contact plots, regressions) for total copper, acid-soluble copper,
molybdenum, silver and sample length was performed on all the assays and
composites to ensure mineralized domains were understood and that bias was not
introduced during the data preparation stage.
1.12.3
Variography
Experimental variograms were calculated for total copper,
acid-soluble copper, molybdenum and silver from the 25-foot capped composites.
Directional and down-the-hole correlograms were fitted. The down-the-hole models
were used to select the nugget used in subsequent modelling of directional
correlograms. The total copper variograms show very low to moderate nugget
effects with ranges of correlation generally varying between 340 to 2,000 ft,
with the majority of the variability occurring within the first 200 to 300 feet
in all directions.
1.12.4
Estimation and Interpolation Methods
The block model consists of regular blocks (50 feet along
strike x 50 feet across strike x 50 feet vertically). The block size was chosen
such that geological contacts are reasonably well reflected and to support a
large-scale open pit mining scenario.
Page 1-10
|
|
Rosemont Project |
| Form
43-101F1 Technical Report |
The interpolation plan was completed on the uncapped and capped
composites via ordinary kriging (“OK”) interpolation method using three passes
with increasing search distances.
The first interpolation pass was restricted to a minimum of
nine composites, a maximum of 12 composites (with a maximum of three composites
per hole) and quadrant declustering. The second interpolation pass was
restricted to a minimum of six composites, a maximum of 12 composites (with a
maximum of three composites per hole) and quadrant declustering. Finally, the
third interpolation pass was restricted to a minimum of four composites, a
maximum of 12 composites (with a maximum of three composites per hole) without
quadrant declustering.
1.12.5
Block Model Validation
The Rosemont block model was validated to ensure appropriate
honouring of the input data and to verify the absence of bias by the following
methods:
- Visual inspection of the OK block model grades in plan and section views
in comparison to composites grades
- Assessment of the quantity of metal removed via the grade capping
methodology
- Comparison between the different interpolation methods, including nearest
neighbour, inverse distance squared and OK
- Swath plot comparisons of the estimation methods
- Review of block model OK quality control parameters
- Review of grade tonnage curves and statistics for each estimation method
- Third party and internal peer review
1.12.6
Classification of Mineral Resource
The resource category classification relies on the relative
difference between the kriged grade and the composites grades, the number of
composite used, the closest and farthest distance between the composites used
and the centre of the blocks.
A smoothing algorithm was applied to remove isolated blocks of
measured category blocks within areas of mostly indicated category or isolated
indicated blocks within areas of mostly measured category blocks. Proportions of
measured and indicated category blocks were not changed significantly by this
process.
1.12.7
Reasonable Prospects of Economic Extraction
The component of the mineralization within the block model that
meets the requirements for reasonable prospects of economic extraction was based
on the application of a Lerchs-Grossman (“LG”) cone pit algorithm. The mineral
resources are therefore contained within a computer-generated open pit
geometry.
The following assumptions were applied to the determination of
the mineral resources:
Page 1-11
|
|
Rosemont Project |
| Form
43-101F1 Technical Report |
- Economic benefit was applied to measured, indicated and inferred
classified material within the resource cone.
- The LG optimization was conducted on a NSR value that reflects for each
block in the resource model, the copper (“Cu”), molybdenum (“Mo”) and silver
(“Ag”) grades, mill recoveries, contained metal in concentrate, deductions and
payable metal values, metal prices, freight costs, smelting and refining
charges and royalty charges.
- The pit shell selected to report mineral resources was based on a revenue
factor of 1.0 (break-even value) using the following metal prices: $3.15/lb.
copper, $11.00/lb. molybdenum, and $18.00/oz. silver.
- A constant 45-degree pit slope was used for the resource estimate.
- No haulage increment or bench discounting was applied to the resource
estimate.
1.12.8
Mineral Resource Statement inclusive of the Mineral Reserve
Mineral resources for the Rosemont deposit were classified
under the 2014 CIM Definition Standards for Mineral Resources and Mineral
Reserves by application of a NSR calculation that reflects the combined benefit
of producing copper, molybdenum and silver in addition to mine operating,
processing and off-site costs. The cut-off used for resource reporting is based
on a reasonable estimate of the investment required to construct and sustain a
viable operating complex.
The mineral resources, classified as Measured, Indicated and
Inferred and prior to any conversion to mineral reserves, inclusive of the
portion of the mineral resources that was converted to mineral reserves, are
summarized in Table 1-2.
Mineral resources that are not mineral reserves do not have
demonstrated economic viability. Due to the uncertainty that may be associated
with Inferred mineral resources it cannot be assumed that all or any part of
Inferred resources will be upgraded to an Indicated or Measured Resource.
Page 1-12
|
|
Rosemont Project |
| Form
43-101F1 Technical Report |
TABLE 1-2: RESOURCE BY CATEGORY, MINERALIZED ZONE AND NSR
CUT-OFF
(1)(2)(3)(4)(5)(6)(7)(8)(9)(10)
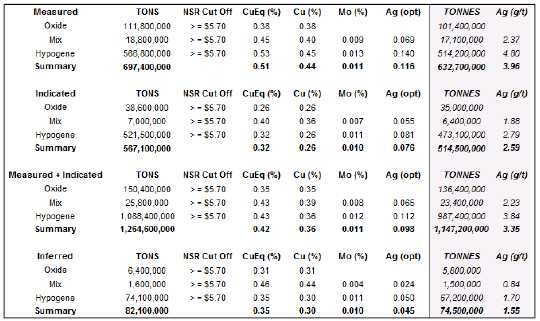
Notes:
| |
1. |
The above mineral resources include mineral
reserves. |
| |
2. |
Domains were modelled in 3D to separate mineralized rock
types from surrounding waste rock. The domains were based on core logging,
structural and geochemical data. |
| |
3. |
Raw drill hole assays were composited to 25-foot lengths
broken at lithology boundaries. |
| |
4. |
Capping of high grades was considered necessary and was
completed for each domain on assays prior to compositing. |
| |
5. |
Block grades for copper, molybdenum and silver were
estimated from the composites using OK interpolation into 50 ft x 50 ft x
50 ft blocks coded by domain. |
| |
6. |
Tonnage factors were interpolated by lithology and
mineralized zone. Tonnage factors are based on 2,066 measurements
collected by Hudbay and previous operators. |
| |
7. |
Blocks were classified as Measured, Indicated or Inferred
in accordance with CIM Definition Standards 2014. |
| |
8. |
Mineral resources are constrained within a computer
generated pit using the LG algorithm. Metal prices of $3.15/lb copper,
$11.00/lb molybdenum and $18.00/troy oz silver. Metallurgical recoveries
of 85% copper, 60% molybdenum and 75% silver were applied to sulfide
material. Metallurgical recoveries of 40% copper, 30% molybdenum and 40%
silver were applied to mixed material. A metallurgical recovery of 65% for
copper was applied to oxide material. NSR was calculated for every model
block and is an estimate of recovered economic value of copper,
molybdenum, and silver combined. Cut-off grades were set in terms of NSR
based on current estimates of process recoveries, total process and
G&A operating costs of $5.70/ton for oxide, mixed and sulfide
material. |
| |
9. |
The oxide resource will be processed in the mill via
flotation |
| |
10. |
Totals may not add up correctly due to
rounding. |
The reporting of the mineral resource by NSR within the LG pit
shell reflects the combined benefit of producing copper, molybdenum and silver
as per the following equations based on mineralized type, in addition to mine
operating and processing costs:
Page 1-13
|
|
Rosemont Project |
| Form
43-101F1 Technical Report |
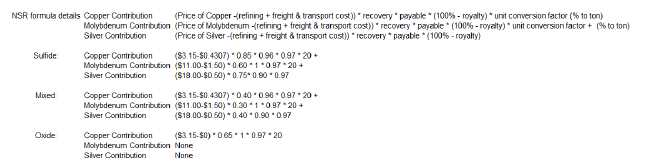
The copper equivalency is calculated, using metal
contributions, for each block using the following formula:
CuEq = Copper + (Contribution of
Molybdenum) + (Contribution of Silver)
Since molybdenum and silver are not considered in oxide
material, the copper equivalency value equals the copper value.
1.12.9
Comparison with the 2012 Resource Estimate
A review and comparison of 2017 Hudbay mineral resource and
2012 Augusta Resource mineral resource was completed. The results of Measured,
Indicated and Inferred are summarized in Table 1-3 and Table 1-4.
TABLE 1-3: MEASURED AND INDICATED, COMPARISON TO 2012 AUGUSTA
ESTIMATE
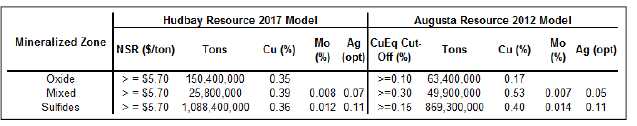
TABLE 1-4: INFERRED, COMPARISON TO 2012 AUGUSTA ESTIMATE
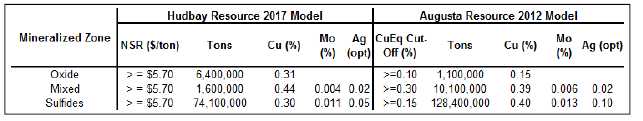
The 2017 measured and indicated resource estimates constitute a
29% increase in tonnage with copper grades 8% lower to those estimated in 2012
by Augusta. Also, the molybdenum grade is 17% lower than reported in 2012 for
the sulfide mineralized material while the 2016 oxide tonnage and grade have
more than doubled. These differences result mainly from the reinterpretation of
the oxide blanket surface. Molybdenum grades are also lower as a result of
factoring historical molybdenum assays. The reduction of tonnage in the Inferred
category is related to the infill drilling completed by Hudbay in 2014 and 2015 which resulted in the
reclassification of the 2012 inferred and indicated resources to indicated and
measured categories in 2017.
Page 1-14
|
|
Rosemont Project |
| Form
43-101F1 Technical Report |
1.13
Mineral Reserves Estimate
The Mineral Reserves estimate for the Project are based in a
LOM which uses the block model compiled under Section 14, Mineral Resource
Estimates, with an economic value calculation per block (NSR in $/ton) and
mining, processing, and engineering detail parameters. The Mineral Reserves
estimate for the Project has been prepared by Hudbay senior mine engineer
experts under the supervision of the QP. The mineral reserve economics are
described in Section 22, Economic Analysis, of this Technical Report.
This Mineral Reserves estimate has been determined and reported
in accordance with NI 43-101 and the classifications adopted by CIM Council in
2014. NI 43-101 defines a Mineral Reserve as “the economically mineable part of
measured and indicated mineral resources”.
Mine design and reserves estimation for the Rosemont pit use
the NSR block model, which consists of an NSR value calculation for each block
in the block model, taking into account grade mill recoveries (Cu, Mo and Ag),
contained metal in concentrate, deductions and payable metal values, metal
prices, freight costs, smelting and refining charges and royalty charges. These
parameters were applied to the block model to form the basis of the reserve
estimate.
The LG analyses were conducted for the purpose of reporting
reserves. The selected pit shell corresponds to a revenue factor of 0.8 (Pit
shell 30), which represents metal prices 20% lower than the base case (revenue
factor of 1.0 - pit 40). It was selected as the basis for the ultimate pit
design, and is approximately 10% smaller than the base economic pit. This pit
has better economic indicators in comparison with other pits in terms of free
discounted cash flow and total revenue, stripping ratio and capital costs. All
LG analyses were restricted to prevent the pit shells from crossing the
topographic ridge immediately west of the deposit. This was done due to a permit
commitment.
The selected LG pit shell 30 is shown in plan view in Figure
1-2 and in cross-section in Figure 1-3.
Page 1-15
|
|
Rosemont Project |
| Form
43-101F1 Technical Report |
FIGURE 1-2: PLAN VIEW CONTOURS OF SELECTED LERCHS-GROSSMAN
PIT SHELL (PIT SHELL 30)
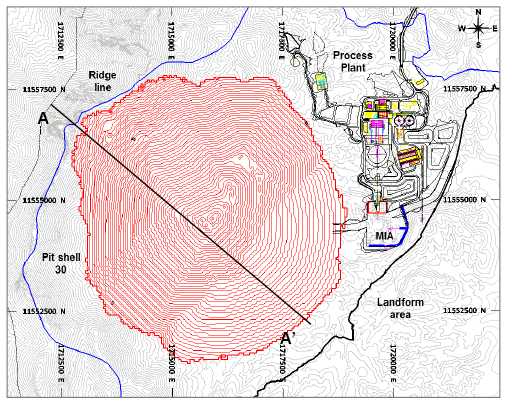
FIGURE 1-3: AA’ SECTION VIEW OF SELECTED LERCHS-GROSSMAN PIT
SHELL (PIT SHELL 30)
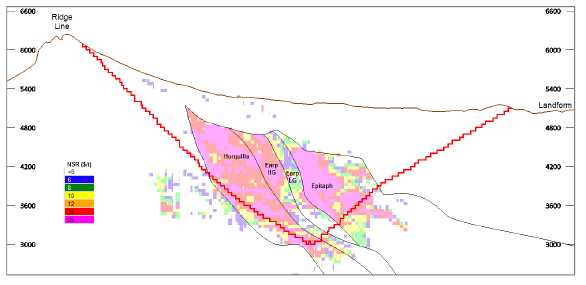
The Rosemont mineral reserve estimate is based on measured and
indicated resources. Therefore, the potential exists for Inferred Mineral
Resources within the ultimate pit to be included and reported as waste, as they
currently do not meet the economic and mining requirements to be categorized as
Page 1-16
|
|
Rosemont Project |
| Form
43-101F1 Technical Report |
Mineral Reserves. It cannot be assumed that all or any part of
Inferred Mineral Resources will ever be upgraded to a higher category.
The selective mining unit (“SMU”) dimension in the resource
block model is 50x50x50 ft. The interpolated metal grade is averaged for the
entire block. When the Project commences operations, ore feed will be delineated
by implementing a detailed blasthole sampling program. Drill blast patterns will
be smaller, 30 ft to 30 ft, than the resource block dimensions, thereby
providing better definition than from the resource model. This new definition
will be provided by a new block model built by assays from blasthole projects,
dynamic or short-range block model, which is a common practice in Hudbay
operations.
1.13.1
Mineral Resources and Mineral Reserves Statement
Proven and probable mineral reserves within the designed final
pit total are 592 million tons grading 0.45% Cu, 0.012% Mo and 0.13 oz Ag/ton.
There are 1.25 billion tons of waste material (including pre-stripping
material), resulting in a stripping ratio of 2.1:1 (tons of waste per ton of
ore). Total material in the pit is 1.84 billion tons. Contained metal in Proven
and Probable mineral reserves is estimated at 5.30 billion pounds of copper, 142
million pounds of molybdenum and 79 million ounces of silver. Proven and
Probable mineral reserves for the Rosemont deposit are summarized in Table 1-5.
TABLE 1-5: PROVEN AND PROBABLE MINERAL RESERVES IN ROSEMONT
FINAL PIT
|
|
Short Tons |
TCu
% |
SCu
% |
ASCu
% |
Mo % |
Ag opt |
NSR
$/ton |
CuEq
% |
Tonnes |
Ag (g/t) |
|
Proven |
469,708,117 |
0.48 |
0.43 |
0.05 |
0.012 |
0.14 |
22.11 |
0.56 |
426,112,017 |
4.96 |
|
Probable |
122,324,813 |
0.31 |
0.28 |
0.03 |
0.010 |
0.09 |
14.66 |
0.38 |
110,971,199 |
3.09 |
|
Total |
592,032,930 |
0.45 |
0.40 |
0.05 |
0.012 |
0.13 |
20.57 |
0.53 |
537,083,216 |
4.58 |
Notes:
| |
1. |
TCu % corresponds to the total copper grade. |
| |
2. |
SCu % grade corresponds to the sulfide copper in the Ore.
As per formula SCU = TCU – ASCu |
| |
3. |
ASCu % grade corresponds to the soluble copper. |
| |
4. |
CuEq% is calculated based on metal prices of $3.15/lb Cu,
$11.00/lb Mo and $18.00/oz Ag. |
Economics of the Mineral Reserves were demonstrated by the mine
plan’s financial analysis, documented in Section 22 of this Technical Report,
which confirmed a 15.6 percent after-tax internal rate of return, based on a
copper price of $3.00/lb, silver price of $18.00/oz and molybdenum price of
$11.00/lb.
Table 1-6 presents the mineral resource estimates exclusive of
the Mineral Reserve estimate, i.e. the mineral resources located inside the
resource pit shell but outside of the reserve pit design. The mineral reserve
estimate represents the portion of the mineral resource estimates with potential
for economic extraction after the current mineral reserves estimate has been
mined and processed.
Page 1-17
|
|
Rosemont Project |
| Form
43-101F1 Technical Report |
TABLE 1-6: ROSEMONT MINERAL EXCLUSIVE RESOURCE ESTIMATES
(1)(2)(3)(4)(5)(6)(7)(8)(9)
|
|
Short Tons |
NSR
Cut-off |
CuEq
% |
TCu
% |
Mo
(%) |
Ag
opt |
Tonnes |
Ag (g/t) |
|
Measured |
|
Oxide |
54,000,000 |
> = $5.70 |
0.41 |
0.41 |
|
|
49,000,000 |
|
|
Mixed |
5,000,000 |
> = $5.70 |
0.45 |
0.41 |
0.01 |
0.047 |
4,500,000 |
1.63 |
|
Hypogene |
118,700,000 |
> = $5.70 |
0.44 |
0.36 |
0.01 |
0.117 |
107,700,000 |
4.01 |
|
Summary |
177,700,000 |
|
0.43 |
0.38 |
0.01 |
0.079 |
161,200,000 |
2.72 |
|
Indicated |
|
Oxide |
18,600,000 |
> = $5.70 |
0.27 |
0.27 |
|
|
16,900,000 |
|
|
Mixed |
2,600,000 |
> = $5.70 |
0.36 |
0.34 |
0.01 |
0.037 |
2,400,000 |
1.27 |
|
Hypogene |
392,000,000 |
> = $5.70 |
0.31 |
0.25 |
0.01 |
0.080 |
355,600,000 |
2.73 |
|
Summary |
413,200,000 |
|
0.31 |
0.25 |
0.01 |
0.076 |
374,900,000 |
2.60 |
|
Measured + Indicated |
|
Oxide |
72,700,000 |
> = $5.70 |
0.38 |
0.38 |
|
|
66,000,000 |
|
|
Mixed |
7,600,000 |
> = $5.70 |
0.42 |
0.38 |
0.01 |
0.044 |
6,900,000 |
1.50 |
|
Hypogene |
510,700,000 |
> = $5.70 |
0.34 |
0.27 |
0.01 |
0.088 |
463,300,000 |
3.03 |
|
Summary |
591,000,000 |
|
0.35 |
0.29 |
0.01 |
0.077 |
536,200,000 |
2.64 |
|
Inferred |
|
Oxide |
3,500,000 |
> = $5.70 |
0.33 |
0.33 |
|
|
3,200,000 |
|
|
Mixed |
1,300,000 |
> = $5.70 |
0.47 |
0.45 |
0.00 |
0.019 |
1,200,000 |
0.66 |
|
Hypogene |
63,900,000 |
> = $5.70 |
0.35 |
0.29 |
0.01 |
0.049 |
58,000,000 |
1.69 |
|
Summary |
68,700,000 |
|
0.35 |
0.30 |
0.01 |
0.046 |
62,400,000 |
1.58 |
Notes:
| |
1. |
Domains were modelled in 3D to separate mineralized rock
types from surrounding waste rock. The domains were based on core logging,
structural and geochemical data. |
| |
2. |
Raw drill hole assays were composited to 25-foot lengths
broken at lithology boundaries. |
| |
3. |
Capping of high grades was considered necessary and was
completed for each domain on assays prior to compositing. |
| |
4. |
Block grades for copper, molybdenum and silver were
estimated from the composites using OK interpolation into 50 ft x 50 ft x
50 ft blocks coded by domain. |
| |
5. |
Tonnage factors were interpolated by lithology and
mineralized zone. Tonnage factors are based on 2,066 measurements
collected by Hudbay and previous operators. |
| |
6. |
Blocks were classified as Measured, Indicated or Inferred
in accordance with CIM Definition Standards 2014. |
| |
7. |
Mineral resources are constrained within a computer
generated pit using the LG algorithm. Metal prices of $3.15/lb copper,
$11.00/lb molybdenum and $18.00/troy oz silver. Metallurgical recoveries
of 85% copper, 60% molybdenum and 75% silver were applied to sulfide
material. Metallurgical recoveries of 40% copper, 30% molybdenum and 40%
silver were applied to mixed material. A metallurgical recovery of 65% for
copper was applied to oxide material. NSR was calculated for every model
block and is an estimate of recovered economic value of copper,
molybdenum, and silver combined. Cut-off grades were set in terms of NSR
based on current estimates of process recoveries, total process and
G&A operating costs of $5.70/ton for oxide, mixed and sulfide
material. |
| |
8. |
The oxide resource will be processed in the mill via
flotation. |
| |
9. |
Totals may not add up correctly due to
rounding. |
1.13.2
Comparison with the 2012 Mineral Reserves
A review and comparison of the 2017 Hudbay mineral resource and
2012 Augusta mineral reserves was completed. The results in Table 1-7 of proven
and probable reserves show that Hudbay reports a tonnage 11% lower; with copper
grades 2% higher, molybdenum grades 17% lower and silver grades 11% higher
compared to those estimated in 2012.
Page 1-18
|
|
Rosemont Project |
| Form
43-101F1 Technical Report |
TABLE 1-7: PROVEN AND PROBABLE, COMPARISON TO 2012 AUGUSTA
RESERVE ESTIMATE
|
Category |
Hudbay Reserves 2017 |
Augusta Reserves 2012
Model |
| Tons |
Cu (%) |
Mo (%) |
Ag
(opt) |
Tons |
TCu
(%) |
Mo (%) |
Ag
(opt) |
|
Proven |
469,708,117 |
0.48 |
0.012 |
0.14 |
308,075,000 |
0.46 |
0.015 |
0.12 |
|
Probable |
122,324,813 |
0.31 |
0.010 |
0.09 |
359,131,000 |
0.42 |
0.014 |
0.12 |
|
TOTAL |
592,032,930 |
0.45 |
0.012 |
0.13 |
667,206,000 |
0.44 |
0.014 |
0.12 |
The changes between the 2012 and 2017 mineral reserve estimates
can be mostly attributed to a revision of the mining, processing and general
& administration cost assumptions resulting in a marginally higher cut-off
in 2017.
1.14
Mining Methods
The Rosemont deposit is a high-tonnage, skarn-hosted,
porphyry-intruded, copper-molybdenum deposit located in close proximity to the
surface. The Project will be a traditional open pit shovel/truck operation. It
consists of open pit mining and flotation of sulfide minerals to produce
commercial grade concentrates of copper and molybdenum. Payable silver and gold
will report to the copper concentrate.
The proposed pit operations will be conducted from 50-foot-high
benches using large-scale mine equipment, including: 10-5/8-inch-diameter rotary
blast hole drills, 60 yd3 class electric mining shovels, 46
yd3 class hydraulic shovels, 25 yd3 front-end loaders, and
260-ton off-highway haul trucks.
The Rosemont final pit will measure approximately 6,000 feet
east to west, 6,000 feet north to south, and will have a total depth of
approximately 2,900 feet down to 3,100 feet (AMSL). There is one primary waste
rock storage area (“WRSA”), which is located 1,200 feet southeast of the
Rosemont final pit. The processing facility is located approximately 1,000 feet
east of the final pit, while the dry stacking tailings facility (“DSTF”) is
located 1,500 feet southeast of the Rosemont pit. The final pit and facilities
can be seen in Figure 1-4.
The mine production plan contains 592 million tons of ore and
approximately 1.25 billion tons of waste, yielding a life of mine waste to ore
stripping ratio of 2.1 to 1 (including pre-stripping material). The mine has a
19-year life, with ore to be delivered to the processing plant at a throughput
ramping up to 90,000 tons per day (tpd).
Page 1-19
|
|
Rosemont Project |
| Form
43-101F1 Technical Report |
FIGURE 1-4: ROSEMONT MINE PLAN SITE LAYOUT

1.14.1
Mine Phases
The mine phases and ultimate pit for the Project are designed
for large-scale mining equipment (specifically, 60 yd3 class electric
shovels and 260-ton haulage trucks) and is derived from the selected LG pit
shells described in the previous section. The design process included smoothing
pit walls, eliminating or rounding significant noses and notches that may affect
slope stability, and providing access to working faces by developing internal
ramps (including a dual ramp for the final pit).
For the pit design, the targeted minimum mining width is 320
ft. and honored the wall slope design provided by Call and Nicholas, Inc.
(“CNI”) and Hudbay. Table 1-8 lists the configuration of the recommended pit
slope configuration for each sector.
TABLE 1-8: ROSEMONT SLOPE GUIDANCE
Geotechnical
Sector |
Bench
Height, ft. |
Bench Face
Angle° |
Inter-Ramp
Slope Angle° |
Catch
BBench, ft. |
Overall Slope
Angle° |
| 1 |
100 |
70 |
50 |
48 |
42 |
| 2 |
100 |
65 |
46 |
50 |
40 |
| 3 |
100 |
65 |
48 |
44 |
45 |
| 4 |
100 |
65 |
48 |
44 |
45 |
| 5 |
50 |
65 |
46 |
25 |
43 |
| 6 |
50 |
65 |
44 |
29 |
41 |
| 7 |
50 |
55 |
33 |
42 |
31 |
| 8 |
50 |
55 |
33 |
42 |
31 |
Page 1-20
|
|
Rosemont Project |
| Form
43-101F1 Technical Report |
Total ore reserves in the final pit are estimated to be 592
million tons. Approximately 55 million tons of medium and low grade oxide, mixed
and sulfide ore will be stockpiled. This material will be reclaimed and
processed during operations.
Final configuration of mine phases in plan view is presented in
Figure 1-5 and in cross section in Figure 1-6. Mineral reserves for the Rosemont
deposit by mine phase are summarized in Table 1-9.
FIGURE 1-5: PLAN VIEW OF ROSEMONT MINE PHASES
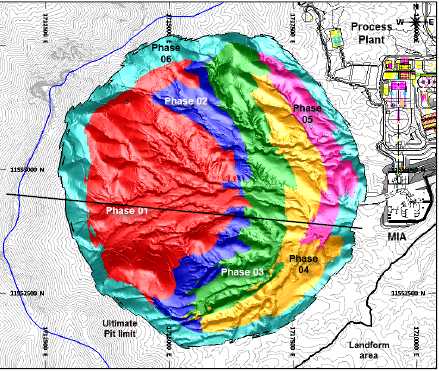
FIGURE 1-6: AA' SECTION VIEW OF ROSEMONT MINE PHASES
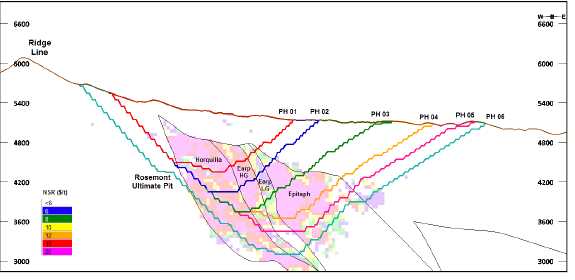
Page 1-21
|
|
Rosemont Project |
| Form
43-101F1 Technical Report |
TABLE 1-9: ROSEMONT MINE PHASES MINERAL RESERVES
|
|
Ore M
Tons |
TCu
% |
SCu
% |
ASCu
% |
Mo
% |
Ag
opt |
NSR
$/ton |
CuEq
% |
Waste
M Tons |
Total
M Tons |
S.R. |
|
PH01 |
84.8 |
0.49 |
0.43 |
0.06 |
0.011 |
0.16 |
21.80 |
0.57 |
190.3 |
275.1 |
2.24 |
|
PH02 |
88.3 |
0.43 |
0.38 |
0.05 |
0.010 |
0.15 |
19.77 |
0.51 |
115.6 |
203.9 |
1.31 |
|
PH03 |
74.8 |
0.50 |
0.45 |
0.04 |
0.012 |
0.15 |
23.18 |
0.58 |
177.9 |
252.7 |
2.38 |
|
PH04 |
63.5 |
0.53 |
0.50 |
0.03 |
0.014 |
0.13 |
25.26 |
0.62 |
182.5 |
246.0 |
2.87 |
|
PH05 |
59.4 |
0.47 |
0.44 |
0.03 |
0.014 |
0.12 |
22.65 |
0.56 |
150.3 |
209.8 |
2.53 |
|
PH06 |
221.2 |
0.39 |
0.34 |
0.05 |
0.012 |
0.12 |
17.64 |
0.46 |
431.9 |
653.1 |
1.95 |
|
Total |
592.0 |
0.45 |
0.40 |
0.05 |
0.012 |
0.13 |
20.57 |
0.53 |
1,248.6 |
1,840.6 |
2.11 |
Notes:
| |
1. |
TCu % corresponds to the total copper grade. |
| |
2. |
SCu % grade corresponds to the sulfide copper in the Ore.
As per formula SCU = TCU – ASCu |
| |
3. |
ASCu % grade corresponds to the soluble copper. |
| |
4. |
CuEq% is calculated based on metal prices of $3.15/lb Cu,
$11.00/lb Mo and $18.00/oz Ag. |
1.14.2
Mine Schedule and Production Plan
The operating and scheduling criteria used to develop the
mining sequence plans are summarized in Table 1-10 below.
TABLE 1-10: MINE PRODUCTION SCHEDULE CRITERIA
|
Parameter |
Value |
|
Annual Ore Production Base Rate |
32,850,000 tons |
|
Daily Ore Production Base Rate |
90,000 tons |
|
Operating Hours per Shift |
12 |
|
Operating Shifts per Day |
2 |
|
Operating Days per Week |
7 |
|
Scheduled Operating Days per Year |
365 |
|
Number of Mine Crews |
4 |
Pit operations and mine maintenance will be scheduled around
the clock. Allowances for down time and weather delays have been included in the
mine equipment and manpower estimations.
A mill ramp up period for concentrator start-up has been
considered. Provisions are included to reach a full and steady production
(throughput) by the end of the sixth month of operation. This assumption is
based on the actual ramp-up achieved by Hudbay in 2016 at the Constancia Project
in Peru.
An elevated cut-off grade strategy has been implemented to
bring forward a slightly higher-grade ore from the pit to the early part of the
ore production schedule. Delivering higher-grade ore to the mill in the early
years will improve the net present value and internal rate of return of the
Project. NSR values were calculated for each block in the resource model to
represent the net Cu, Mo, and Ag metal values. The pit reserves were estimated
at a cut-off with an NSR value of $6.00/ton. This is the minimum value of
mineralized material that will cover the processing and G&A costs and is therefore reserved for mill feed. Priority plant feed will
consist of high grade material (NSR above $12.00/ton) . The medium and low grade
material (NSR between $6.00/ton and $12.00/ton) will be fed as needed to make up
any immediate ore short-fall, but the bulk of this material will be stockpiled.
Page 1-22
|
|
Rosemont Project |
| Form
43-101F1 Technical Report |
The stripping analysis determined a minimum preproduction
stripping requirement of approximately 94 million tons of waste. Approximately
11 million tons of ore will also be mined and stockpiled during this period.
A mine life of approximately 19 years is projected by this
development plan. Peak mining rates of 367,000 tpd of total material will be
realized in year 1 through year 11. Average mining rates during years 12-14 will
be 180,000 tpd of total material, and will then be reduced to an average of
105,000 tpd from years 15 – 17 as the strip ratio drops.
The estimated mine production schedule, in terms of annual
movement of material, is summarized in Figure 1-7.
FIGURE 1-7: ROSEMONT MINE SCHEDULE, MATERIAL MOVEMENT
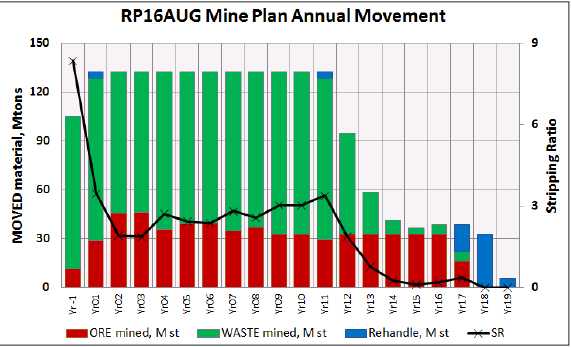
1.14.3
Waste Rock Storage Area (WRSA)
Overburden and other waste rock encountered during the course
of mining will be placed into a WRSA located to the south and southeast of the
planned open pit and within the permitted landform area (i.e., combined WRSA and
DSTF). The design criteria for the WRSA and associated haul roads are summarized
in Table 1-11 below. The general mine site layout is shown in Figure 1-4.
Page 1-23
|
|
Rosemont Project |
| Form
43-101F1 Technical Report |
TABLE 1-11: WASTE ROCK FACILITY DESIGN CRITERIA
|
Description |
Criteria |
|
Angle of Repose |
37° |
|
Average Tonnage Factor (with swell) |
16.02 ft3/ton |
|
Overall Slope Angle |
3.5H:1V |
|
Total Height, ft |
600 |
|
Lift, ft |
100 |
|
Haul Road, ft |
120 |
|
Max Elevation, ft (AMSL) |
5,700 |
1.14.4
Dry StackTailings Facility (DSTF) Buttress
The DSTF is north of the WRSA area and east-northeast of the
pitt. The DSTF is the repository where processed ore tailings will be placed
behind large containmen nt buttresses constructed from mine waste rock. The
design criteria for the DSTF and associated haul roads are summarized in Table
1-12 below. The general mine site layout is shown in Figure 1-4 and a N-S cross
section view of the DSTF buttress by year is shown in Figure 1-8 below.
TABLE 1-12: DSTF BUTTRESS ROCK STORAGE DESIGN CRITERIA
|
Description |
Criteria |
|
Angle of Repose |
37° |
|
Average Tonnage Factor (with swell) |
16.02 ft3/ton |
|
Overall Slope Angle |
3.5H:1V |
|
Total Height, ft |
700 |
|
Haul Road, ft |
120 |
|
Max Elevation, ft (AMSL) |
5,490 |
FIGURE 1-8: DRY STACK TAILINGS FACILITY NS SECTION VIEW, LOM
BUTTRESS BY YEAR
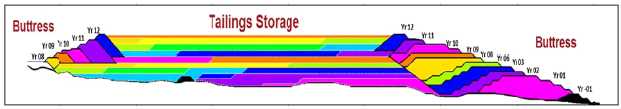
1.14.5
Mine Equipment
The proposed pit operations will be conducted from 50-foot-high
benches using large-scale mine equipment, including: 10-5/8-inch-diameter rotary
blast hole drills, 60 yd3 class electric mining shovels, 46
yd3 class hydraulic shovels, 25 yd3 front-en nd loaders,
and 260 ton off-highway haul trucks.
The mine will operate two shifts per day, 12 hours per shift
for 365 days a year. No significant weather delays are expected and the mine
will not be shut down for holidays. Crew work schedule will consist of a
standard four crew rotation.
Pagee 1-24
|
|
Rosemont Project |
| Form
43-101F1 Technical Report |
A summary of fleet requirements by time period for major mine
equipment is shown in Table 16-12. This represents the equipment necessary to
perform the following mine tasks:
- Mine Site clearing and topsoil salvage and stockpiling.
- Construction of the main haul roads.
- Production drilling.
- Loading and hauling of sulfide ore to the primary crusher (located on the
east side of the pit), and waste rock to the WRSA and DSTF buttresses.
- Maintain mine haulage and access roads.
- Maintain WRSA, DSTF and berms, and allow re-grading of slopes and final
surfaces for concurrent reclamation.
- Control dust.
1.14.6
Mine Manpower Requirements
Mine supervision, technical staff, mine maintenance, workshop
personnel and equipment operator requirements over the life of the mine is based
on the mine plan. During the Pre-Production period, direct (workshop and
operators) and indirect (staff, supervision and technicians) requirements are
337, building up to a peak of 459 in year 7.
Mine staff manpower employees and salaries were developed for
Mine Administration, Mine Geology, Mine Operations, and Mine Maintenance.
Salaries were a composite of information provided by Hudbay which was calibrated
against local mine salaries. Salary information includes wages, burden and bonus
for staff employees.
1.15
Recovery Methods
The Rosemont process plant is a conventional copper-molybdenum
concentrator and its process design is typical of concentrators treating low
sulfur copper porphyry-skarn style ores. The process involves crushing,
grinding, flotation, concentrate dewatering, molybdenum separation and tailings
dewatering.
The process plant design is based on a combination of
metallurgical testwork, Project production plan, and in-house information, and
is modelled after the Constancia Copper Project design with changes made where
necessary to address differences. With minor modifications, the process plant is
designed to treat an average of 90,000 tons/d (32.8 million tons/y).
1.16
Project Infrastructure
The Project Infrastructure consists of access and plant roads,
electric power supply and distribution, water supply and distribution, voice and
data communication, and DSTF, and other ancillary facilities.
Page 1-25
|
|
Rosemont Project |
| Form
43-101F1 Technical Report |
1.16.1
Access and Plant Roads
Access and plant roads consist of an access road into the plant
from State Highway 83, in-plant roads, haul roads and a perimeter road around
the toe of the WRSA and DSTF. The plant and access roads are shown in Figure
18-1.
1.16.2
Power Supply and Distribution
An agreement between Tucson Electric Power (“TEP”), Trico
Electric, and Hudbay will be realize to provide the electrical power supply,
estimated to be approximately 183 MVA, for the Project. A proposed switchyard
(Toro Switchyard) will tap into the existing TEP 138 kV transmission line that
extends from the South Substation to the Green Valley Substation. A 13.2
-mile-long proposed 138 kV transmission line originates at the Toro Switchyard
and terminates on private property to the Rosemont substation as shown in Figure
18-2.
1.16.3
Water Supply and Distribution
The fresh water requirement for the Rosemont facilities is
approximately 6,000 acre-feet per year. The water supply source identified for
the Project is groundwater from the Santa Cruz basin, which lies west of the
Project and the Santa Rita Mountains.
There are 4 pump stations located strategically to pump the
necessary water to the storage tank located at the mine site. Water from the
storage tank will be provided for the following systems:
- potable water system,
- fresh water system,
- process water system, and
- fire water system.
1.16.4
Tailings Management
The Rosemont tailings dry stack is designed as a low hazard
facility with fully drained waste rock placed as buttressing material. The slope
stability analyses performed on the outer slope indicate the dry tailings stack
operations can be constructed with stable 3H:1V inter-bench slopes and an
overall stable slope of approximately 3.5H:1V. The design was developed based on
hydrological and geotechnical studies that included review of regional climate
data, drilling and testing programs, and laboratory characterization of
subsurface and tailings samples.
An initial starter buttress around the tailings facility will
be constructed with waste rock. Concurrent tailings and waste rock placement in
the buttress will occur throughout the life of the tailings facility.
1.16.5
Communication
The proposed approach is to integrate data networking and
telecommunication systems into a common infrastructure to meet the requirements
for accounting, purchasing, maintenance, and general office business as well as
specialized requirements for control systems. Mobile radios will
Page 1-26
|
|
Rosemont Project |
| Form
43-101F1 Technical Report |
also be used by the mine and plant operation personnel for
daily control and communications while outside the offices.
A security system has been incorporated into the plant network.
Using a dedicated video server and monitors, I/P cameras utilizing power over
ethernet connections will be plugged into dedicated switches.
1.17
Market Studies and Contracts
Hudbay has a marketing division that is responsible for
establishing and maintaining all marketing and sales administrations of
concentrates and metals. Rosemont copper concentrates are expected to be a
clean, high grade concentrate containing small gold and silver by-product
credits which will be suitable as a feedstock for smelters globally.
Approximately 50% of the copper concentrate production has been contracted under
long term sales contracts.
Table 1-13 below summarizes the key assumptions for the sale of
Rosemont’s copper concentrate.
TABLE 1-13: COPPER CONCENTRATE
| |
Units |
LOM Total / Average |
| Copper Concentrate Base Treatment Charge |
$ / dry short ton con |
$73 |
| Copper Refining Charge |
$ / lb Cu |
$0.08 |
| Silver Refining Charge |
$ / oz Ag |
$0.50 |
| Copper Concentrate Transport & Freight
|
$ / wet short ton con |
$127 |
| LOM Copper Grade in Copper Concentrate |
% Total Cu |
34.3% |
| Moisture Content of Copper Concentrate |
% H2O |
8.0% |
No deleterious elements are expected to be produced in
quantities which would result in material selling penalties.
Pursuant to a precious metals stream agreement with Silver
Wheaton entered into on February 11, 2010, as amended and restated on February
15, 2011, Hudbay will receive deposit payments of $230 million against delivery
of100% of the payable gold and silver from the Project . The deposit will be
payable upon the satisfaction of certain conditions precedent, including the
receipt of permits for the Project and the commencement of construction. In
addition to deposit payments, as gold and silver is delivered to Silver Wheaton,
Hudbay will receive cash payments equal to lesser of (i) the market price and
(ii) $450 per ounce (for gold) and $3.90 per ounce (for silver), subject to one
percent annual escalation after three years.
Rosemont is expected to produce a marketable 45% molybdenum
concentrate. Table 1-14 below summarizes the key assumptions for the sale of
Rosemont’s molybdenum concentrate.
Page 1-27
|
|
Rosemont Project |
| Form
43-101F1 Technical Report |
TABLE 1-14: MOLYBDENUM CONCENTRATE
|
|
Units |
LOM Total / Average |
|
Molybdenum Concentrate Base Treatment Charge
|
$ / lb Mo |
$1.50 |
|
Molybdenum Concentrate Transport &
Freight |
$ / wet short ton con |
$124 |
|
LOM Molybdenum Grade in Molybdenum
Concentrate |
% Mo |
45.0% |
|
Moisture Content of Molybdenum Concentrate
|
% H2O |
8.0% |
1.18
Environmental Studies, Permitting and Social or Community
Impact
Permitting status for the Project is well advanced and has
continued to progress since July 2007. The final approvals required include the
Final Record of Decision (“ROD”) from the U.S. Forest Service (“USFS”) and the
404 Permit from the U.S. Army Corps of Engineers (“USACE”). These final Federal
permits are currently in the review process.
Since 2013 when the Final Environmental Impact Statement
(“EIS”) and Draft ROD were issued, the USFS has finalized two Supplemental
Information Reports (“SIRs”) and a Supplemental Biological Assessment (“SBA”)and
completed a consultation with the U.S. Fish and Wildlife Services (“USFWS”)
culminating in an Amended Final Biological and Conference Opinion (“BO”) in
April 2016. The SIRs determined that nothing disclosed to date would indicate
that the information in the SIR falls outside the information disclosed in the
EIS. The BO determined that none of the endangered species were jeopardized by
the Project.
The USFS is expected to issue its ROD once the USACE is clear
on the decision it will make for the Project. This will allow the USFS to
include additional analysis into their record and review it against the
disclosed impacts in the EIS if the USACE determines it is necessary to make
adjustments to their portion of the Project, mitigation, or evaluations. Once
the ROD is issued, Hudbay will submit the Mine Plan of Operations (“MPO”) to the
USFS for their approval. This approval is expected to take up to six months, and
once the MPO is approved, site access is granted.
The USACE is evaluating the overall project record and a
mitigation package that provides mitigation for impacts to the ephemeral
channels on the Project site. This mitigation incorporates the restoration of a
floodplain that was impacted by agriculture; mitigation for two sites impacted
by grazing, poor roadway maintenance, and other activities; as well as
preservation of sites near to the Project site. Once the USACE evaluation is
complete, a decision will be made by the USACE on permit issuance, terms and
conditions and appropriate financial assurance will be negotiated.
At this time, the State of Arizona Permits and Approvals
dealing with the environment have been issued for the Project, and all permits
remain in force and are current. The Project continues to comply with permit
terms and conditions. No additional environmental permits are necessary to begin
construction of the facilities, and only minor environmental permits (e.g.,
septic system permits, water system approvals and registration) will be needed
during construction.
Page 1-28
|
|
Rosemont Project |
| Form
43-101F1 Technical Report |
The Project refinements included in this document were
specifically designed and evaluated to fall within the envelope included in the
EIS review and as such are not expected to cause concern by the agency. State of
Arizona permits that were issued based on early designs will be amended to
include designs included in the EIS. Such amendments are customary in the state
of Arizona.
1.19
Capital and Operating Cost
Initial project capital costs are estimated to be $1,921
million including 15% contingency on all items. The LOM sustaining capital costs
are estimated to be $387 million excluding capitalized stripping and $1,168
million including capitalized stripping. The capital cost estimate is considered
to be a Class 3 estimate as defined by AACE Recommended Practice 47R-11 for the
mining and mineral process industry.
The average LOM operating costs (mining, milling and G&A)
are estimated to be $9.24/ton milled (before deducting capitalized stripping)
and $7.92/ton milled (after deducting capitalized stripping). Refer to Section
21 for greater capital and operating cost detail.
Over the first 10 years, C1 cash costs (net of by-product
credits at stream prices) are estimated to average $1.40 per pound of copper
before deducting capitalized stripping and $1.14 per pound of copper after
deducting capitalized stripping. LOM C1 cash costs are estimated to be $1.47 per
pound of copper before deducting capitalized stripping and $1.29 per pound of
copper after deducting capitalized stripping. Including royalties and sustaining
capital, sustaining cash costs are estimated to be $1.59 per pound of copper
over the first 10 years and average $1.65 over the LOM.
1.20
Economic Analysis
The economic viability of the Project has been evaluated using
the metal prices outlined in Table 1-15. The metal prices used in the economic
analysis are based on a blend of consensus metal price forecasts from over 30
well-known financial institutions and Wood Mackenzie.
TABLE 1-15: METAL PRICE ASSUMPTIONS
|
Metal |
Units |
Price |
|
Spot Copper |
$/lb |
$3.00 |
|
Spot Molybdenum |
$/lb |
$11.00 |
|
Spot Silver |
$/oz |
$18.00 |
|
Streamed Silver1 |
$/oz |
$3.90 |
1. Subject to a 1% annual inflation
adjustment
The terms of the existing precious metals streaming agreement
with Silver Wheaton were included in the analysis. Silver Wheaton will make
upfront cash payments totalling $230 million to fund initial development capital
in exchange for 100% of the silver and gold production from Rosemont. Silver
Wheaton will make ongoing payments of $3.90 per ounce of silver and $450 per
ounce of gold subject to a 1% inflation adjustment starting on the third
anniversary of production.
Page 1-29
|
|
Rosemont Project |
| Form
43-101F1 Technical Report |
Although gold is not part of the current reserve estimate,
metallurgical testing has demonstrated economic concentrations of gold in copper
concentrate as outlined in Section 13. Over the LOM, approximately 309 thousand
ounces of gold are expected to be recovered in copper concentrate (although the
financial impact has not been included).
At the effective realized prices including the impact of the
stream, the revenue breakdown at Rosemont is approximately 92% copper, 6%
molybdenum, and 2% silver.
Rosemont’s annual copper production (contained copper in
concentrate) and C1 cash costs (net of by-products at stream prices after
deducting capitalized stripping) are shown below in Figure 1-9. Over the first
10 years, annual production is expected to average 140 thousand tons of copper
at an average C1 cash cost of $1.14/lb. Over the 19-year LOM, annual production
is expected to average 112 thousand tons of copper at an average C1 cash cost of
$1.29/lb.
FIGURE 1-9: ROSEMONT ANNUAL COPPER PRODUCTION AND C1 CASH
COSTS
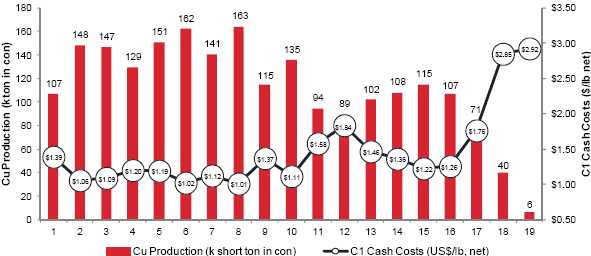
Rosemont (on a 100% basis) has an unlevered after-tax NPV8% of
$769 million and a 15.5% after-tax IRR using a copper price of $3.00/lb as
summarized in Table 1-16. The Project NPV and IRR are calculated using end of
period quarterly discounting in the quarter immediately before development
capital is spent.
Page 1-30
|
|
Rosemont Project |
| Form
43-101F1 Technical Report |
TABLE 1-16: LIFE OF MINE FINANCIAL METRICS (100% PROJECT
BASIS)
|
Metric |
Units |
LOM Total |
|
Gross Revenue (Stream Prices) |
$M |
$13,377 |
|
TCRCs |
$M |
($1,837) |
|
On-Site Operating Costs (After Deducting Capitalized
Stripping) |
$M |
($4,691) |
|
Royalties |
$M |
($368) |
|
Operating Margin |
$M |
$6,480 |
|
Development Capital |
$M |
($1,921) |
|
Stream Upfront Payment |
$M |
$230 |
|
Sustaining Capital (excludes capitalized stripping) |
$M |
($387) |
|
Capitalized Stripping |
$M |
($781) |
|
Pre-Tax Cash Flow |
$M |
$3,622 |
|
Cash Income Taxes |
$M |
($718) |
|
After-Tax Free Cash Flow |
$M |
$2,903 |
|
After-Tax NPV8% |
$M |
$769 |
|
After-Tax NPV10% |
$M |
$496 |
|
After-Tax IRR |
% |
15.5% |
|
After-Tax Payback Period |
Years |
5.2 |
The NPV8% (100% Project basis) was sensitized based on
percentage changes in various input assumptions above or below the base case.
Each input assumption change was assumed to occur independently from changes in
other inputs. The sensitivity analysis is summarized in Figure 1-10. The Project
is most sensitive to the copper price, followed by initial capital costs,
on-site operating costs, and the molybdenum price.
Page 1-31
|
|
Rosemont Project |
| Form
43-101F1 Technical Report |
FIGURE 1-10: NPV8% SENSITIVITY (100% BASIS)
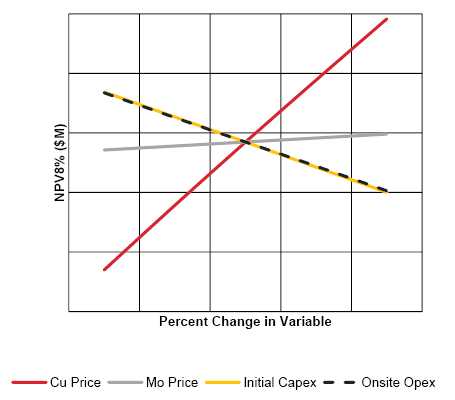
Table 1-17 below reports the after-tax NPV8%, NPV10%, IRR and
Payback of the Project at various flat copper prices assuming all other inputs
remain constant.
TABLE 1-17: AFTER-TAX NPV8%, NPV10%, IRR AND PAYBACK
SENSITIVITY AT VARIOUS FLAT COPPER PRICES (100% BASIS)
|
|
Flat Copper Price ($/lb) |
|
|
$2.50 |
$2.75 |
$3.00 |
$3.25 |
$3.50 |
|
After-Tax NPV8% ($M) |
$45 |
$412 |
$769 |
$1,115 |
$1,448 |
|
After-Tax NPV10% ($M) |
($122) |
$192 |
$496 |
$792 |
$1,076 |
|
After-Tax IRR (%) |
8.5% |
12.2% |
15.5% |
18.5% |
21.2% |
|
After-Tax Payback (years) |
6.9 |
5.9 |
5.2 |
4.4 |
4.3 |
The existing Joint Venture Agreement requires cash payments
from UCM totaling $106 million to the Joint Venture (“JV”) in order for UCM to
complete its earn-in for 20% ownership of the Project. The payments will be made
on an installment basis to fund the initial development capital and payments
will commence once certain milestones are achieved. The NPV attributable to
Hudbay is improved beyond 80% of the standalone project NPV due to the JV
payments, and the IRR attributable to Hudbay is improved beyond the standalone
project IRR as a result of the reduced time period between development capital
spending and positive project cash flow. Table 1-18 shows the adjusted key
financial metrics attributable to Hudbay.
Page 1-32
|
|
Rosemont Project |
| Form
43-101F1 Technical Report |
TABLE 1-18: KEY FINANCIAL METRICS ATTRIBUTABLE TO
HUDBAY
|
Metric |
Units |
LOM Total |
|
Development Capital (100% Basis) |
$M |
$1,921 |
|
Stream Upfront Payment |
$M |
($230) |
|
Joint Venture Earn-in Payment |
$M |
($106) |
|
JV Share of Remaining Capital (20%) |
$M |
($317) |
|
JV Loan Repayment to Hudbay1 |
$M |
($20) |
|
Hudbay's Share of Development Capital
|
$M |
$1,248 |
|
After-Tax NPV8% to Hudbay |
$M |
$719 |
|
After-Tax NPV10% to Hudbay |
$M |
$499 |
|
After-Tax IRR to Hudbay |
% |
17.7% |
|
After-Tax Payback Period to Hudbay |
Years |
4.9 |
1. Hudbay is funding the JV’s share of project expenditures
until receipt of material permits and approximately $20M in principal and
accrued interest is due to Hudbay
1.21
Adjacent Properties
There is no material information concerning mineral properties
immediately adjacent to the Project.
1.22
Other Relevant Data and Information
The author is not aware of any other information that would
impact the reported estimate of mineral resources for the Project.
A draft feasibility study was completed for the Project which
included information on the basis of design, infrastructure, design strategies,
Project Execution Strategy, risks assessments and recommendations. The EPCM team
has also completed a draft construction execution plan.
The Project has undergone various risk assessments and
workshops during the years and continues to hold quarterly risk assessment
workshops.
1.23
Conclusions
The purpose of this Technical Report is to present Hudbay’s
estimate of the mineral reserves and mineral resources for the Project based on
the current mine plan, the current state of metallurgical testing, operating
cost and capital cost estimates. The results of “feasibility study” level work
conducted partly by external contractors and partly internally by Hudbay,
completion of the drill program and bench-marking against other mines including
Hudbay’s Constancia mine has resulted in the following fundamental
conclusions:
- The Rosemont deposit consists of copper-molybdenum-silver-gold
mineralization primarily hosted in skarn formed on a chemical/siliciclastic
sedimentary sequence after the intrusion of Laramide quartz monzonite porphyry
intrusions.
Page 1-33
|
|
Rosemont Project |
| Form
43-101F1 Technical Report |
- A new geological model was built based on chemostratigraphy and
lithogeochemistry from 33,000 samples covering the full footage of the 2014
and 2015 Hudbay drilling programs. Geochemical based geological model reduces
uncertainties in the formational, lithological and alteration logging. The
updated geological model incorporated a revised structural framework based on
a surface mapping and downhole structural review.
- The resource economic parameters utilized are slightly different than
those supporting the mineral reserve statement. The cost and price inputs for
the mineral resource economic parameters are considered an approximation and
were used to test the economic viability of the resource. Although these costs
and prices differ from the ones used for the mineral reserves, it is the
opinion of the QP that changing the resource parameters would not materially
change the output of the reserve.
- A proven and probable reserve of 592 million tons has been identified and
its economic viability demonstrated. An additional 591 million tons of
measured and indicated resources and 69 million tons of inferred resources
have been identified and outlined as having further potential for economic
extraction once the mineral reserves have been extracted.
- Mining equipment performance and maintenance requirements and costs are
benchmarked from Constancia’s actual operating information and are robust.
- Metallurgical testwork has confirmed that the Rosemont ores respond well
to proven and widely used sulfide mineral processing techniques.
- The tailing properties have been sufficiently characterized as well as the
dewatering performance of vendor equipment over the life of the operation to
satisfy the estimated number, type and size of tailing filters for this
Project. To be conservative, expansion space has been allocated for additional
filtering equipment, to the extent that it may be necessary.
- The Rosemont Process Plant design has been modelled after the operating
Constancia processing plant’s flow sheet and is sufficiently robust to
routinely achieve key production targets such as throughput, recovery, and
concentrate grade as stated in the production schedule based on the
metallurgical testing conducted.
- Flexibility exists within the mine plan to optimise plant recovery and
performance through the management of feed types including clays, oxides and
hardness.
- The Project is one of many large projects scheduled to be constructed. The
author believes that schedule slip will be the principal pressure on cost
should the Project experience construction delays. In the opinion of the
author, the contingency allotted to construction capital cost should mitigate
most cost risk. At the time of publication of this Technical Report, committed
and spent dollars would raise this contingency to approximately 15% of the
required project capital as estimated in the draft Detailed Feasibility Study
(dDFS).
Page 1-34
|
|
Rosemont Project |
| Form
43-101F1 Technical Report |
- Related to the capital costs, M3 Engineering and Amec Foster Wheeler
(acting under a joint venture agreement) and Ausenco each completed a value
engineering phase and independently produced capital estimates for the Project
which were within 5% of each other. Since then, Ausenco has also completed a
feasibility quality capital estimate, benchmarked their findings with
Constancia (and other similar projects), and engaged third party construction
contractors and various consulting firms to provide additional input into the
estimate. Hudbay has also completed an independent third party review of the
feasibility study estimate.
- The net present value of the project is most sensitive to the price of
copper. The resulting project NPV8% ($769 million) and IRR (15.5%) utilizing
the current Hudbay long term view on metal prices, TCRC’s and other economic
assumptions, in the opinion of the author, support the declaration of mineral
reserves as outlined in the CIM guidelines.
- The project execution plan is modelled after the Constancia delivery
method. Many key personnel who developed the Constancia mine are members of
the Project who will be involved in the development of the Project and
therefore considered a robust project execution plan.
The Project is uniquely located in a copper mining jurisdiction
that has sustained economic copper production for close to 140 years. Since it
is located approximately 30 miles from Tucson it is expected to have a
significant impact on employment and economic gain for the region. The proposed
mining, processing, and logistics plan provides a step forward in innovation and
sustainability. The dry stack tailings deposition proposed would be among the
largest in size and address industry and stakeholder concerns regarding the use
of water and the stability of tailings impoundment facilities. The proposed
design and operating practice that will be applied in respect of the Project is
expected to set a new standard by which other large mining projects are judged
with respect to their impact on stakeholders, the ecology and the
environment.
In recognition of the scarcity of world economic copper
reserves in an environment of ever increasing consumption of the metal, Hudbay
has carefully considered the ecological, environmental, and ethical extraction
methods to be applied to the Project in an effort to set it apart from others in
the world. The Project is located in a first world leading nation, where
extraction and production is governed by laws with due process and human rights
fundamental to the consumer.
This Technical Report also concludes that the estimated mineral
reserves and mineral resources for the Project conform to the requirements of
2014 CIM Definition Standards – for Mineral Resources and Mineral Reserves and
requirements in Form 43-101F1 of NI 43-101, Standards of Disclosure.
1.24
Recommendations
The Author recommends the following:
- The author recommends that Hudbay further investigate the cause(s) of the
differences in average molybdenum grade of the historical assays. Hudbay
should also evaluate the application of non-linear interpolation or
wireframing methods in the minor geological units.
Page 1-35
|
|
Rosemont Project |
| Form
43-101F1 Technical Report |
- A drill hole twinning program of the pre-Augusta drilling to bolster the
confidence of the re- assaying campaign as conducted by Augusta.
- Further investigate change-of-support correction and alternative
approaches to resource classification taking into account the high production
rate. This should be performed to ensure that the resource classification
properly reflects the reduced risk when a large volume is mined and delivered
to the mill on a quarterly and annual basis.
- It is recommended by the author that 5% of the samples should be sent for
check assay in future drill hole campaigns.
- Future drilling campaigns should consider the by-product credit
contribution of gold noted contained in copper concentrate produced through
testing and increase the confidence in geological continuity such that it can
be included in the reserve statement.
- Metallurgical test-work has confirmed that marketable copper concentrates
can be produced. Mine and mill production sequencing and planning will require
care to manage clay content that can adversely affect flotation and tailings
filtration.
- A geometallurgical program is recommended as a component of the operating
plan to further refine, monitor and optimise the mine to mill performance. It
is concluded that fluorine can be readily rejected from copper concentrate,
and further study is recommended to develop understanding of ore conditions
and indicators that trigger elevated fluorine content in concentrate.
- Ongoing optimization of pit slope designs should be conducted during
operation and should be based on observed conditions accounting for more
detailed mapping of local alteration, jointing and faulting. These
observations and compilation can then provide the basis for revised slope
geometry and pushback (mining phase) configurations that have the potential to
increase mineral reserves and reduce overall stripping requirements.
Page 1-36
|
|
Rosemont Project |
| Form
43-101F1 Technical Report |
2
INTRODUCTION AND TERMS OF REFERENCE
The Principal Author has prepared this Feasibility-Level
Technical Report for Hudbay Minerals Inc. (“Hudbay”) on the Project, located
approximately 30 miles (50 km) southeast of Tucson, in Pima County, Arizona.
This Technical Report conforms with the 2014 CIM Definition Standards for
Mineral Resources and Mineral Reserves and requirements in Form 43-101F1 of NI
43-101, Standards of Disclosure for Mineral Projects.
Hudbay is a Canadian integrated mining company with assets in
North and South America principally focused on the discovery, production and
marketing of base and precious metals. Hudbay’s objective is to maximize
shareholder value through efficient operations, organic growth and accretive
acquisitions, while maintaining its financial strength.
Hudbay acquired all of the issued and outstanding common shares
of Augusta Resource Corporation (“Augusta”) pursuant to take-over bid, which
expired July 29, 2014, and a subsequent acquisition transaction, which closed on
September 23, 2014.
This Technical Report describes the latest resource model and
mine plan and the current state of metallurgical testing, operating cost and
capital cost estimates. The information presented in this Technical Report is
the result of “feasibility study” level work conducted partly by external
contractors and partly by internal Hudbay personnel under the overall
supervision of the Qualified Person (“QP”).
The QP who supervised the preparation of this Technical Report
is Cashel Meagher, P.Geo, Senior Vice President & Chief Operating Officer
for Hudbay. Mr. Meagher last visited the property on April 21, 2016 and numerous
times prior to this date. The personal site inspections were conducted as part
of the 2014-2015 diamond drilling program to become familiar with conditions on
the property, to observe the geology and mineralization and to verify the work
completed on the Property. Mr. Meagher has also reviewed and conducted
sufficient confirmatory work to act as QP for the reporting of the mineral
resource and mineral reserve estimates for the Project.
2.1
Information Sources
Information used to support this Technical Report was based on
current primary-source data when available, previous technical reports on the
property and from the reports and documents listed in Section 27, References.
Notable information reviewed and relied upon by the QP was as follows:
- 3D Block Model – Hudbay prepared a 3D block model of the Rosemont
deposit. The 3D block model and determination of the mineral resources at the
Rosemont deposit were performed by internal Hudbay employees, following Hudbay
procedures and were reviewed and approved by Cashel Meagher, Chief Operating
Officer for Hudbay and Qualified Person of this Technical Report.
Page 2-1
|
|
Rosemont Project |
| Form
43-101F1 Technical Report |
- Lerchs-Grossman Analyses – A Lerchs-Grossman (“LG”) cone algorithm
was applied by Hudbay to the block model to establish the component of the
deposit that has a “reasonable prospect of economic extraction”.
Additional sources of information that the QP relied upon are
described in Section 3 of this Technical Report.
2.2
Unit Abbreviations
The units of measure in this report are a combination of US
standard units and metric units. Unless stated otherwise, all dollar amounts
(“$”) are in United States dollars. Unit abbreviations used in this report are
noted below:
TABLE 2-1: UNIT ABBREVIATIONS
|
Abbreviation
|
Description |
|
$ |
United States dollar |
|
°C |
degree Celsius |
|
°F |
degree Fahrenheit |
|
% |
percent |
|
μm |
microns |
|
cm |
centimetres |
|
ft |
feet |
|
ft2
|
Square feet |
|
g |
gram |
|
g/mt |
grams per (metric) tonne |
|
HP |
horsepower |
|
km |
Kilometre |
|
kV |
Kilovolt |
|
kW |
kilowatt |
|
kWh |
Kilowatt-hour |
|
m2
|
Square meter |
|
m3
|
Cubic meter |
|
mm |
Millimetres |
|
tonne |
metric tonne |
|
Mt |
Million (short) tons |
|
ppb |
parts per billion |
|
ppm |
parts per million |
|
t, ton |
short ton |
|
w/w |
Weight per weight |
Page 2-2
|
|
Rosemont Project |
| Form
43-101F1 Technical Report |
2.3
Name Abbreviations
Abbreviations of company names and terms used in the report are
as shown in Table 2-2.
TABLE 2-2: NAME ABBREVIATIONS
|
Abbreviation |
Description |
|
Abbreviation |
Description |
|
3D |
Three-Dimensional |
|
ID2 |
Inverse Distance Squared |
|
AAS |
Atomic Absorption Spectrometry |
|
Inspectorate |
Inspectorate America Corporation |
|
ADWR |
Arizona Department of Water Resources |
|
LAF |
Low Angle Fault |
|
LG |
Lerchs-Grossman |
|
Ag |
Silver |
|
MPO |
Mine Plan of Operations |
|
AMSL |
Above mean seal level |
|
Mo |
Molybdenum |
|
ASCu |
Acid soluble copper |
|
NaHS |
Sodium Hydrosulfide |
|
Augusta |
Augusta Resource Corporation |
|
NEPA |
National Environmental Policy Act |
|
AV |
Average |
|
NI |
National Instrument |
|
BADCT |
Best Available Demonstrate Control Technology |
|
NN |
Nearest Neighbour |
|
NQ |
HQ drill core size 1.875 inches or 47.6 mm diameter |
|
BQ |
BQ drill core size 1.43 inches or 36.4mm |
|
NSR |
Net Smelter Return |
|
Bureau Veritas |
Bureau Veritas Commodities Canada Ltd. |
|
OK |
Ordinary Kriging |
|
CBV |
Certified best value |
|
OSA |
On-Stream Analyser |
|
CEC |
Cation Exchange Capacity |
|
OREAS |
Ore Research and Exploration |
|
CIM |
Canadian Institute of Mining, Metallurgy and
Petroleum |
|
PQ |
PQ drill core size 3.3 inch or 83 mm diameter |
|
Cu |
Copper |
|
QA/QC |
Quality Assurance and Quality Control |
|
Cu-Mo |
Copper-molybdenum |
|
QUEMSCAN |
Quantitative Evaluation of Minerals by |
|
CRM |
Certified reference materials |
|
|
Scanning electron microscopy |
|
CV |
Coefficient of Variance |
|
R2 |
Coefficient of Determination |
|
DGM |
Discrete Gaussian Model |
|
RE |
Absolute relative error |
|
DSTF |
Dry Stack Tailings Facility or Tailings Management
Facility (TMF) |
|
RMA |
Reduced-to-Major-Axis regression |
|
ROD |
Record of Decision |
|
EDX |
Energy Dispersive X-ray |
|
RQD |
Rock Quality Designation |
|
EGL |
Equivalent Grinding Length |
|
RSE |
Relative standard error of the kriged |
|
EIS |
Environmental Impact Statement |
|
|
estimate |
|
EPMA |
Electron Probe Micro-analysis |
|
RSD |
Relative standard deviations |
|
FEL |
Front End Loader |
|
SAG |
Semi-Autogenous Grinding |
|
FileMaker |
FileMaker Inc. |
|
SABC |
SAG and Ball Mill and Crushing Comminution Circuit |
|
GMD |
Gearless Motor Drive |
|
|
GT |
Grade-tonnage |
|
SBA |
Supplemental Biological Assessment |
|
H2SO4 |
Sulfuric acid |
|
SCu |
Copper in sulfides |
|
HCT |
High Compression Thickeners |
|
SD |
Standard deviation |
|
HQ |
HQ drill core size 2.50 inches or 63.5 |
|
SEM |
Scanning Electron Microscopy |
|
|
mm diameter |
|
SFR |
Staged Flotation Reactor |
|
Hudbay |
Collectively all Hudbay Minerals Inc. subsidiaries
and business groups |
|
SG |
Specific Gravity |
|
SGS |
SGS Canada Inc. |
|
ICP |
Inductively Coupled Plasma |
|
SIR |
Supplemental Information Report |
|
ICP-MS |
Inductively Coupled Plasma Mass Spectrometry |
|
Skyline |
Skyline Assayers & Laboratories |
|
ICP-OES |
Inductively Coupled Plasma Optical Emission
Spectroscopy |
|
SMU |
Selective mining unit |
|
SRM |
Standard reference materials |
Page 2-3
|
|
Rosemont Project |
| Form
43-101F1 Technical Report |
| Abbreviation |
Description |
|
Abbreviation |
Description |
| TCu |
Total copper |
|
USFS |
U.S. Forest Service |
| TEP |
Tucson Electric Power Company |
|
USFWS |
U.S. Fish and Wildlife Service |
| TIA |
Tucson International Airport |
|
USACE |
U.S. Army Corps of Engineers |
| TRICO |
TRICO Electric Cooperative Inc. |
|
XPS |
XPS Consulting & Testwork Services |
| UCM |
United Copper & Moly LLC |
|
XRD |
X-Ray Diffraction |
Page 2-4
|
|
Rosemont Project |
| Form
43-101F1 Technical Report |
3 RELIANCE ON OTHER EXPERTS
Standard professional procedures were followed in preparing the
contents of this Technical Report. Data used in this report has been verified
where possible and the author has no reason to believe that the data was not
collected in a professional manner and no information has been withheld that
would affect the conclusions made herein.
Hudbay has retained a number of contractors/consultants to
prepare technical and cost information to support this Technical Report. All the
information used from this work in the current Technical Report has been duly
verified and validated by the author.
The information, conclusions, opinions, and estimates contained
herein are based on:
- Information available to Hudbay at the time of preparation of this
Technical Report,
- Assumptions, conditions, and qualifications as set forth in this Technical
Report, and
- For purposes of this Technical Report, the author has relied on title and
property ownership information based on select records of the U.S. Bureau of
Land Management and the Assessor’s Office in Pima County, Arizona.
- The author has also relied on tax information provided by Hudbay’s tax
department, Social and Environmental information as provided by appropriate
Arizona based personnel from Hudbay, marketing information from Hudbay’s
marketing group and forward price forecasts from Hudbay’s treasury department.
Page 3-1
|
|
Rosemont Project |
| Form
43-101F1 Technical Report |
4 PROPERTY DESCRIPTION AND LOCATION
4.1
Location
The Project is located within the historic Helvetia-Rosemont
Mining District that dates back to the 1800’s. The deposit lies on the eastern
flanks of the Santa Rita Mountain range approximately 30 miles (50 km) southeast
of Tucson, in Pima County, Arizona off of State Route 83 (see Figure 4-1). The
core land position includes patented and unpatented mining claims, fee land and
grazing leases that cover most of the old Mining District. The lands are under a
combination of private ownership by Rosemont and Federal ownership. The lands
occur within Townships 18 and 19 South, Ranges 15 and 16 East, Gila & Salt
River Meridian. The Project geographical coordinates are approximately 31º 50’N
and 110º 45’W.
FIGURE 4-1: PROPERTY LOCATION OF ROSEMONT PROJECT
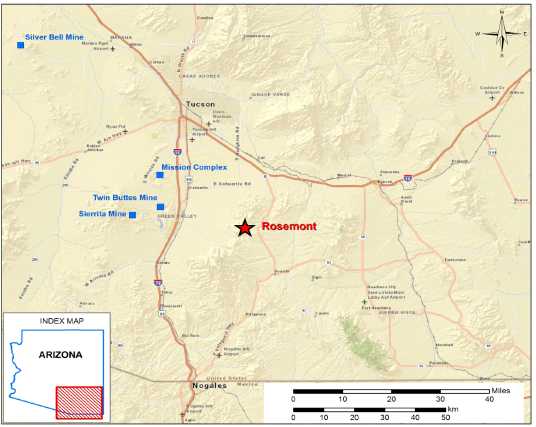
4.2
Land Tenure
Hudbay acquired all of the issued and outstanding common shares
of Augusta Resource Corporation pursuant to take-over bid, which expired July
29, 2014, and a subsequent acquisition transaction, which closed on September
23, 2014. Hudbay’s ownership in the Project is subject to an earn-in agreement
with United Copper & Moly LLC (‘‘UCM’’), pursuant to which UCM has earned
a 7.95% interest in the Project and may earn up to a 20% interest
subject to cash payments from UCM totaling $106 million to the Joint Venture. A
joint venture agreement between Hudbay’s subsidiary, Rosemont Copper Company,
and UCM governs the parties’ respective rights and obligations with respect to
the Project.
Page 4-1
|
|
Rosemont Project |
| Form
43-101F1 Technical Report |
Hudbay continues to maintain the property in good standing
which consists of a combination of fee land, patented and unpatented lode, mill
site mining claims, and rights-of-way from the Arizona State Land Department.
Taken together, the land position is sufficient to allow access to an open pit
mining operation, processing and concentrating facilities, storage of tailings,
disposal of waste rock and a utility corridor to bring water and power to site.
The Federal lands covered by unpatented mining claims are accessible under the
provisions of the Mining Law of 1872, subject to approval from the U.S. Forest
Service (“USFS”) after the completion of an Environmental Impact Statement
(“EIS”) as per the National Environmental Policy Act (“NEPA”) process.
The core of the Project mineral resource is contained within
the 132 patented mining claims that in total encompass an area of approximately
2,000 acres (809 hectares) as shown in Figure 4-2. Surrounding the patented
claims is a contiguous package of 1,064 unpatented mining claims with an
aggregate area of more than 16,000 acres (6,475 hectares). Associated with the
mining claims are 38 parcels of fee (private) land consisting of approximately
2,300 acres (931 hectares) (the Associated Fee Lands). The area covered by the
patented claims, unpatented claims and Associated Fee Lands totals approximately
20,300 acres (8,215 hectares). A listing of the patented claims, unpatented
claims and Associated Fee Lands is provided in Appendix A1-1 & A1- 2.
Rosemont has also acquired 62 parcels of fee (private) land and
one parcel of leased land that are more distal from the Project area that are
planned for: (1) various infrastructure purposes including, well fields, pump
stations, utilities and ranch operation; and (2) for environmental mitigation
and conservation purposes (together, the Distal Fee Lands). The Distal Fee Lands
constitute an additional approximately 3,700 acres (1,497 hectares).
Page 4-2
|
|
Rosemont Project |
| Form
43-101F1 Technical Report |
FIGURE 4-2: ROSEMONT PROPERTY OWNERSHIP
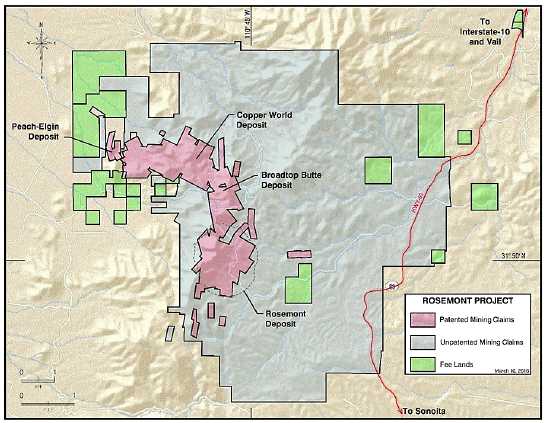
The patented mining claims are considered to be private lands
that provide the owner with both surface and mineral rights. The patented mining
claim block, including the core of the mineral resource, is monumented in the
field by surveyed brass caps on short pipes cemented into the ground. The fee
lands are located by legal description recorded at the Pima County Recorder’s
Office. The patented claims and Associated Fee Lands are subject to annual
property taxes amounting to a total of approximately $8,800.
Mineral Rights on USFS and Bureau of Land Management (“BLM”)
lands have been reserved to Rosemont Copper Company, via the unpatented claims
that surround the patented claims. Wooden posts and stone cairns mark the
unpatented claim corners, end lines and discovery monuments, all of which have
been surveyed. The unpatented claims are maintained through the payment of
annual maintenance fees of $155.00 per claim, for a total of approximately
$165,000 per year, payable to the BLM.
The rights-of-way over State Land are all non-exclusive but
grant Rosemont the rights to construct certain utility infrastructure connecting
the well field and power supply to the site. Two of these rights-of-way have a
term of ten years while the other four have a term of fifty years. These
rights-of-way across State Land are not shown in Figure 4-2, but generally run
northwest from the project site towards the Town of Sahuarita.
Page 4-3
|
|
Rosemont Project |
| Form
43-101F1 Technical Report |
There is a 3% NSR royalty on all 132 patented claims, 603 of
the unpatented claims, and one parcel of the Associated Fee Lands with an area
of approximately 180 acres. In the original royalty deeds, a 1.5% NSR is
reserved to each of (1) Dennis Lauderbach et. ux. and (2) Pioneer Trust Company
of Arizona, as Trustee under Trust No. 11778. These royalties have since been
assigned and Rosemont is in the process of verifying current ownership.
A precious metals stream agreement with Silver Wheaton Corp.
for 100% of payable gold and silver from the Project was entered into on
February 11, 2010. Under the agreement, Hudbay will receive payments equal to
lesser of either the market price or $450 per ounce for gold and $3.90 per ounce
for silver, subject to 1% annual escalation after three years.
Page 4-4
|
|
Rosemont Project |
| Form
43-101F1 Technical Report |
5 ACCESSIBILITY, CLIMATE, LOCAL
RESOURCES,
INFRASTRUCTURE
AND PHYSIOGRAPHY
5.1
Accessibility
The Project is easily accessible to the communities of Tucson
and Benson to the north and Sierra Vista, Sonoita, Patagonia and Nogales to the
south by way of State Route 83.
Existing graded dirt roads connect the property with State
Route 83 which include Forest Service (“FS”) roads 4062 into the Hidden Valley
complex, FS4064 into Rosemont Camp and FS231 transecting the property north to
south. FS4051 and FS4059 provide good access into and around the Project area.
The city of Tucson, Arizona provides the nearest major railroad
and air transport services to the Project and is approximately 30 miles
southeast of Tucson in Pima County.
5.2
Climate
The southern Arizona climate is typical of a semi-arid
continental desert with hot summers and temperate winters. The Project area is
at the north end of the Santa Rita Mountain Range at elevations between 4,550
and 5,350 feet (1,387 and 1,631 meters) above mean sea level (“AMSL”). The
higher elevation in the Project area results in a milder climate than at the
lower elevations across the region.
Summer daily high temperatures are above 90°F (32°C) with
significant cooling at night. Winter in the Project area is typically drier with
mild daytime temperatures and overnight temperatures that are typically above
freezing. Winter can have occasional low intensity rainstorm and light snowfall
patterns that can last for several days.
The average annual precipitation in the Project area is
estimated between 16 and 18 inches (41 and 46 cm) based on historical data from
eight meteorological stations within a 30 mile (50 km) radius of the Project
area. More than half of the annual precipitation occurs during the monsoon
season from July through September. The monsoon season is characterized by
afternoon thunderstorms that are typically of short duration, but with
high-intensity rainfall that has minor effects on a mining operation, which is
considered to be 365 days per year. The lowest precipitation months are April
through June.
A meteorological station was installed at the property in
April, 2006. The station is located near the center of the deposit at an
elevation of 5,350 feet (1,631 m) AMSL. The station monitors site-specific
weather data including temperature, precipitation, wind speed, and wind
direction. Pan evaporation was added to this station in mid-2008. This station
was decommissioned and a new station was located near the core shed on private
property in 2015. Data from the weather station is automatically recorded and
downloaded monthly by site personnel.
Page 5-1
|
|
Rosemont Project |
| Form
43-101F1 Technical Report |
5.3
Local Resources
The largest city near the Project area is Tucson with a
population of over 520,000 based on the 2014 census. Tucson is also the county
seat for Pima County with a population of approximately one million, which
encompasses the Tucson Metropolitan Area.
Arizona produces 65% of the copper in the USA2 and
Tucson is a mining industry hub in the state with nine operating copper mines
within a 125 mile (200 km) radius. The cultural and educational facilities
provided in the Tucson Metropolitan Area attract experienced technical staff
into the area. Tucson is home to a well-established base of contractors and
service providers to the mining industry.
5.4
Infrastructure
The Project site is located immediately adjacent to and west of
Arizona State Route 83 (South Sonoita Highway), approximately 11 miles (18 km)
south of Interstate 10 (“I-10”). This system of state and interstate highways
allows convenient access to the site for all major truck deliveries. The
majority of the labour and supplies for construction and operations can come
from the surrounding areas in Pima, Cochise and Santa Cruz Counties.
The Union Pacific mainline east-west railroad route passes
through Tucson, Arizona and generally follows I-10. The Port of Tucson has rail
access from the Union Pacific mainline consisting of a two mile (3.2 km) siding
complimented by an additional 3,000 foot (914 m) siding.
The Tucson International Airport (“TIA”) is located
approximately 30 miles (50 km) from the Project site and in close proximity to
Interstate highways I-10 and I-19. TIA provides international air passenger and
air freight services to businesses in the area with seven airlines currently
providing nonstop service to 15 destinations with connections worldwide.
The power supply to the Project falls within the Tucson
Electric Power Company (“TEP”) and TRICO Electric Cooperative Inc. (“TRICO”)
service territories. Presently there exists a 13.8 kV TEP distribution line that
routes through the Project site and power from this distribution line was used
to service the related activities for the 2014 and 2015 drill program.
Geographically, the area east of the deposit that includes the
majority of the mineral resource is in the TEP service territory, while the area
west of the deposit falls within the TRICO service territory. Since most of the
estimated electrical load for a mining and process operations would be located
in the TEP service territory, TEP will be the electrical utility service
provider for the entire facility. A joint venture business arrangement is
expected to be established between TEP and TRICO to compensate both service
providers in accordance with the Arizona Corporation Commission review and
approval.
___________________________________________
2
Arizona Mining Association economic impact 2014 (azmining.com)
Page 5-2
|
|
Rosemont Project |
| Form
43-101F1 Technical Report |
The most viable source of water supply for the Project is from
groundwater in the upper Santa Cruz basin aquifer. The Project currently holds a
permit granted by the Arizona Department of Water Resources (“ADWR”) in 2009 to
pump 6,000 acre-feet of water annually for 20 years that meet mining and
processing operations requirements. In addition, there are bedrock and/or
shallow alluvium aquifers on or near the Project area that supplied water for
the 2014 and 2015 drill program; however, they are considered to be insufficient
as a primary source of water supply for a mining operation.
The Project consists of sufficient area of land to the east of
the deposit, which is suitable for mining and processing operations, waste rock
storage area (“WRSA”) and dry stack tailings facility (“DSTF”) for a deposit of
this size.
5.5
Physiography
The Project is located within the northern portion of the Santa
Rita Mountains that form the western edge of the Mexican Highland section of the
Basin and Range Physiographic Province of the southwest United States (Wardrop,
2005). The Basin and Range physiographic province is characterized by high
mountain ranges adjacent to alluvial filled basins. The property occupies flat
to mountainous topography in the northeastern and northwestern flanks of the
Santa Rita Mountains.
Vegetation in the Project area reflects the climate with the
lower slopes of the Santa Rita Mountains dominated by mesquite and grasses. The
higher elevations, receiving greater rainfall, support an open cover of oak,
pine, juniper and cypress trees.
Page 5-3
|
|
Rosemont Project |
| Form
43-101F1 Technical Report |
6
HISTORY
The early history and production from the Property has been
described in Anzalone (1995), M3 (2012) and Briggs (2014) from which the
following summarization is taken. Hudbay considers the mineral reserve and
resource estimates referred to in this chapter (including the estimates prepared
by Augusta) to be historical in nature since no work was done by a qualified
person to verify such estimates and such estimates should not be relied upon.
6.1
Helvetia-Rosemont Mining District (1875 – 1973)
The first recorded mining activity in the Helvetia-Rosemont
mining district occurred in 1875. The Helvetia-Rosemont mining district was
officially established in 1878. Production from mines on both sides of the Santa
Rita ridgeline supported the construction and operation of the Columbia Smelter
in Helvetia and the Rosemont Smelter in Old Rosemont. Copper production from the
district ceased in 1951 after production of about 227,300 tons of ore containing
17,290,000 pounds of copper, 1,097,980 pounds of zinc and 180,760 ounces of
silver.
By the late 1950s, the Banner Mining Company (Banner) had
acquired most of the claims in the area and had drilled the discovery hole into
the Rosemont deposit. In 1963, the Anaconda Mining Co. acquired options to lease
the Banner holdings and over the next ten years they carried out an extensive
drilling program on both sides of the mountain for a total of 136,838 feet
(41,708 m) from 113 drill holes. The exploration program demonstrated that a
large scale porphyry/skarn existed at Rosemont. Regional exploration included
targets at Broadtop Butte and Peach-Elgin prospects. In 1964, Anaconda produced
a historical resource estimate for the Peach-Elgin deposit located in the
Helvetia District. Based on assays from 67 churn and diamond drill holes, the
estimate identified 14 million tons of sulfide material averaging 0.78% copper
and 10 million tons of oxide material averaging 0.72% copper.
6.2
Anamax Mining Company (1973 - 1985)
In 1973, Anaconda Mining Co. and Amax Inc. formed a 50/50
partnership to form the Anamax Mining Co. In 1977, following years of drilling
and evaluation, the Anamax joint venture commissioned the mining consulting firm
of Pincock, Allen & Holt, Inc. to estimate a resource for the Rosemont
deposit. Their historical resource estimate of about 445 million tons of sulfide
mineralization averaged 0.54% copper using a cut-off grade of 0.20% copper. In
addition to the sulfide material, 69 million tons of oxide mineralization
averaging 0.45% copper was estimated. Subsequent engineering designed a pit
based on 40,000 tons/day production rate for a mine life of 20 years.
In 1979, Anamax carried out a resource estimate for the
Broadtop Butte deposit located about a mile north of the Rosemont deposit. Based
on assays from 18 widely spaced diamond drill holes, a historical estimate
identified 9 million tons averaging 0.77% copper and 0.037% molybdenum. In 1985,
Anamax ceased operations and liquidated their assets. Today, most of the
Anaconda/Anamax
Page 6-1
|
|
Rosemont Project |
| Form
43-101F1 Technical Report |
core is currently stored at Hidden Valley core storage facility
at Project site. Hudbay considers the estimate done by Anamax to be
historical in nature since no work has been done by a Hudbay QP to verify the
estimate and the estimate should not be relied upon.
6.3
ASARCO, Inc. (1988 – 2004)
Asarco purchased the patented and unpatented mining claims in
the Helvetia-Rosemont mining district from real estate interests in August 1988
and renewed exploration of the Peach-Elgin and initiated engineering studies on
Rosemont. In 1995, Asarco succeeded in acquiring patents on 21 mining claims in
the Rosemont area just prior to the moratorium placed on patented mining claims
in 1996.
In 1999, Grupo Mexico acquired the Helvetia-Rosemont property
through a merger with Asarco. During the 16 years of ownership by Asarco and
Grupo Mexico, 11 diamond drill holes were completed for a total of 14,695 feet
(4,479 m) at Rosemont. Asarco estimated historical reserves of 294,834,000 tons
at 0.673% copper based on a mine production schedule with a strip ratio of
3.7:1. The Asarco drill core is currently stored at the Hudbay core storage
facility on site. In 2004, Grupo Mexico sold the Rosemont property to a Tucson
developer.
6.4
Augusta Resource Corporation (2005 – 2014)
In April 2005, Augusta purchased the property from Triangle
Ventures LLC. Between mid-2005 and January 2007, Augusta drilled 55 diamond
drill holes for a total of 96,129 feet (29,300 meters) in order to bring the
resource estimate at Rosemont into compliance with NI 43-101 standards. The
program was designed to better define the geology, distribution of copper
mineralization as well as gather geotechnical data required to design a pit. In
June 2006, Washington Group Int. completed a preliminary assessment and economic
evaluation of the Project. Augusta submitted a mine plan of operations (“MPO”)
to the USFS in July 2006. It was deemed incomplete and in 2007, Augusta
resubmitted the MPO. Following a positive feasibility study conducted by M3
Engineering in August 2007 the Forest Service accepted a revised MPO in March
2008 marking the start of the formal EIS process mandated by the National
Environmental Protection Act (“NEPA”) of 1969.
Over the next several years, Augusta continued to evaluate the
mineral potential at Rosemont and refine the economics of developing this
resource. A 20-hole diamond drilling program (17,522 feet or 5,341 meters) was
conducted from December 2007 through July 2008. This was followed by a
twelve-hole diamond drilling program (18,874 feet or 5,753 meters), which was
completed in February 2012. A Technical Report issued by Augusta in 2012
estimated mineral reserves of 667.2 million tons at an average grade of 0.44%
copper, 0.015% molybdenum and 0.12 ounces per ton of silver based on $4.90 per
ton NSR cut-off using metal prices of $2.50/lb copper, $15.00/lb molybdenum and
$20.00/oz silver. Augusta’s mineral resource estimate, shown in Table 6-1, is
inclusive to their mineral reserves, stated above.
Page 6-2
|
|
Rosemont Project |
| Form
43-101F1 Technical Report |
Hudbay is treating Augusta’s publicly disclosed estimated
mineral reserves and resources as a historical estimate under NI 43-101 and not
as current mineral reserves and resources, as a Qualified Person has not done
sufficient work for Hudbay to classify Rosemont’s mineral reserves or resources
as current mineral reserves or mineral resources.
TABLE 6-1: HISTORICAL SULFIDE MINERAL RESOURCE (AUGUSTA 2012)
| Category |
Tons (millions) |
Cu (%) |
Mo (%) |
Ag (oz/ton) |
| Measured |
334.619 |
0.440 |
0.015 |
0.124 |
| Indicated |
534.735 |
0.373 |
0.014 |
0.105 |
| Inferred |
128.488 |
0.397 |
0.013 |
0.104 |
6.5
Hudbay (2014 – Present)
Hudbay completed a 43-hole, 92,909 feet (28,319 meters) drill
program from September to December 2014 and a 46-hole, 75,164 feet (22,910
meters) drill program from August to November 2015. These drilling programs were
completed in further efforts to gain a better understanding of the geological
setting and mineralization of the deposit and to collect additional
metallurgical and geotechnical information.
Page 6-3
|
|
Rosemont Project |
| Form
43-101F1 Technical Report |
7 GEOLOGICAL SETTING AND
MINERALIZATION
7.1
Tectonic and Metallogenic Setting
Mesozoic subduction and associated magmatism and tectonism in
the southwestern United States and northern Mexico, generated extensive and
relevant porphyry copper mineralization (Figure 7-1). Compressional tectonism
during the Mesozoic and early Cenozoic Laramide Orogeny caused folding and
thrusting, accompanied by extensive calc-alkaline magmatism (Barra et al.,
2005). The Laramide belt is a major porphyry province that extends for
approximately 600 miles (1,000 km) from Arizona to Sinaloa, Mexico, and includes
the Rosemont deposit and hosts a number of other world class deposits (e.g.
Morenci, Resolution, and Cananea).
FIGURE 7-1: LARAMIDE BELT AND ASSOCIATED PORPHYRY COPPER
MINERALIZATION (BARRA ET AL., 2005)
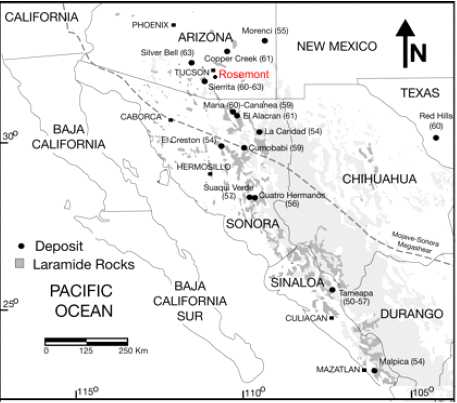
Tertiary extensional tectonism followed the Laramide Orogeny,
accompanied by voluminous felsic volcanism (Barra et al., 2005). Steeply-to
shallowly-dipping normal faults became active during this time, including
rotational listric faulting. At Rosemont, it appears that tertiary faulting has
significantly segmented the original deposit, juxtaposing mineralized and
unmineralized rocks. The extensional tectonics culminated in the large-scale
block faulting that produced the present basin and range geomorphology that is
typical throughout southern Arizona (Maher, 2008).
Page 7-1
|
|
Rosemont Project |
| Form
43-101F1 Technical Report |
7.2
Regional Geology
The geology of the Santa Rita Mountains has recently been
reviewed by Rasmussen et. al. (2012) identifying two main blocks (Figure 7-2).
The northern block, where the Rosemont deposit lies, is dominated by Precambrian
granite (brown on the map), with some slices of Paleozoic and Mesozoic sediments
on the eastern and northern sides (blue and green on the map). This block
includes small stocks and dikes of quartz monzonite or quartz latite porphyry
that are related to porphyry copper and skarn mineralization.
7.3
District Geology
The Precambrian meta-sedimentary and intrusive rocks in the
Rosemont area form the regional basement beneath a Paleozoic carbonate and
siliciclastic sedimentary sequence (Figure 7-3 and Figure 7-4). Paleozoic
sedimentary carbonate units are the predominant host rocks for the copper
mineralization. Structurally overlying these predominantly carbonate units at
Rosemont are Mesozoic clastic units, including conglomerates, sandstones, and
siltstones. These clastic upper sequences have andesitic intercalations and also
host mineralization. Quartz monzonite and quartz latite sill-shaped porphyries
intruded both sequences and are associated with the porphyry/skarn
mineralization. Tertiary conglomerates locally lay over the Mesozoic sedimentary
units in late fault grabens. The Rosemont stratigraphy is summarized in Figure
7-4 and the geological configuration of the deposit is shown on a level
section in Figure 7-5 and in a vertical section in Figure 7-6.
Page 7-2
|
|
Rosemont Project |
| Form
43-101F1 Technical Report |
FIGURE 7-2: SANTA RITA MOUNTAIN GEOLOGY (ADAPTED FROM DREWES
ET AL., 2002)
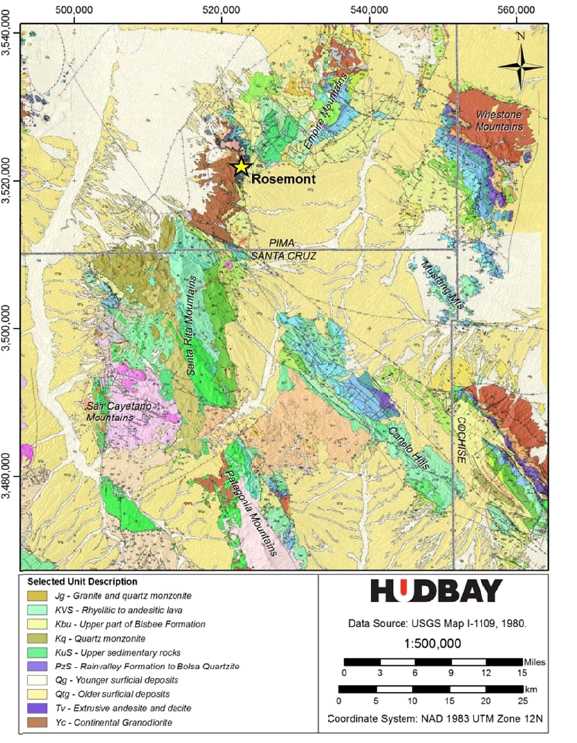
Page 7-3
|
|
Rosemont Project |
| Form
43-101F1 Technical Report |
FIGURE 7-3: ROSEMONT REGIONAL GEOLOGY

Page 7-4
|
|
Rosemont Project |
| Form
43-101F1 Technical Report |
FIGURE 7-4: ROSEMONT STRATIGRAPHIC COLUMN
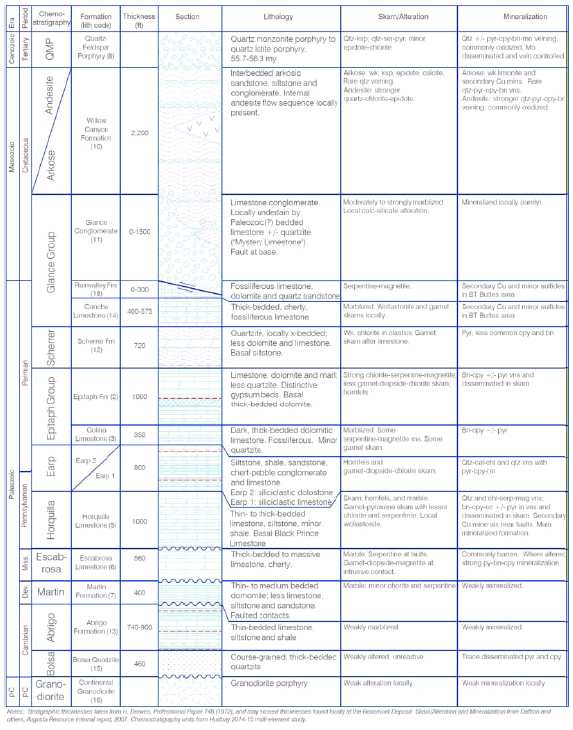
Page 7-5
|
|
Rosemont Project |
| Form
43-101F1 Technical Report |
FIGURE 7-5: ROSEMONT DEPOSIT GEOLOGIC – 4,000 FOOT LEVEL PLAN

Page 7-6
|
|
Rosemont Project |
| Form
43-101F1 Technical Report |
FIGURE 7-6: ROSEMONT
DEPOSIT GEOLOGIC – 11,555,050
VERTICAL SECTION
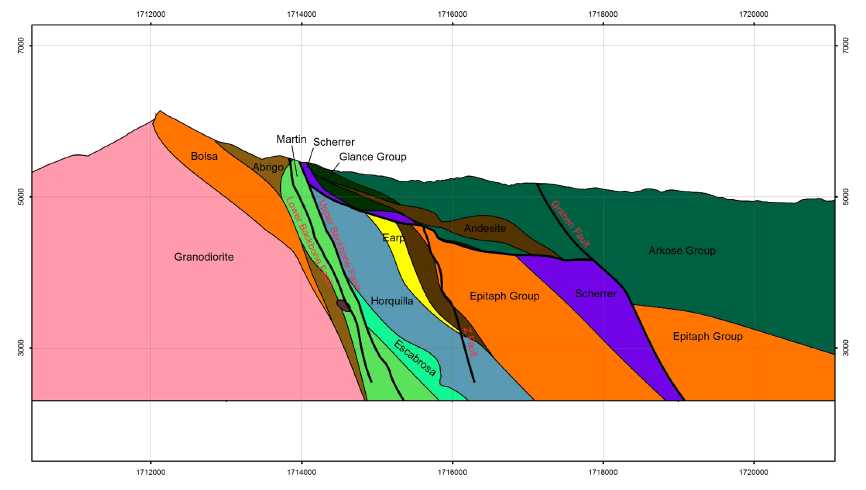
Page 7-7
|
|
Rosemont Project |
| Form
43-101F1 Technical Report |
7.4
Chemostratigraphy
Hudbay 2014 and 2015 drilling programs included complete
inductively coupled plasma multi-element assays (4 acid digestion) for every
sample. The new data set (> 33,000 samples) was used to classify the
different stratigraphic units according to their geochemical affinities. The
original formations were grouped into equivalent chemostratigraphic units that
reflect chemical changes induced by mixing of siliciclastic, dolomitic, and
calcareous sediments as well as a hydrothermal component. The chemostratigraphic
groups honour both the deposit stratigraphy and geochemical attributes and
ultimately reflect the mineralogy (Figure 7-7). The geological model built
implicitly in Leapfrog is based mainly on the downhole chemostratigraphy of the
holes drilled between 2014 and 2015 (90 holes). The density of the
chemostratigraphy data is higher in the pit area, where the new model was
exclusively based on chemostratigraphy. In zones that are distal to the recent
drilling (e.g. Backbone footwall domain), lithology (logged) data was
incorporated into the model.
FIGURE 7-7: CHEMOSTRATIGRAPHY ROSEMONT DEPOSIT
GEOLOGY

7.5
Structural Domains
The updated geological model incorporated a revised structural
framework based on a surface and downhole structural review. The temporal and
special relations between the main fault surfaces define 4 structural domains:
Backbone Footwall, Lower Plate, Upper Plate and Graben Block (Figure 7-8).
The north trending, steeply dipping Backbone Fault juxtaposes
Precambrian granodiorite and Lower Paleozoic quartzite and limestone marginally
mineralized to the west (Backbone Footwall block) against a block of an
homoclinical sequence of younger mineralized metamorphosed sedimentary units to the east (Lower Plate). A series of subparallel,
anastomosing, curviplanar faults that generally strike north and dip steeply
within the Lower Plate define a zone along the Backbone Fault strike.
Page 7-8
|
|
Rosemont Project |
| Form
43-101F1 Technical Report |
The Low Angle Faults are a series of shallowly east-dipping
faults that are comprised of one major fault and a series of steep to shallow
splay structures. The main Low Angle Fault forms the nonconformable contact
between the Upper (siliciclastics and volcanics) and Lower Plate rocks.
The southeast-dipping Graben (60-65°) fault terminates
mineralization continuity to the southeast and east. This fault postdates
mineralization and has been interpreted as an extensional normal fault.
The east-west striking faults, including the Weigle Faults are
a series of steeply-dipping, anastomosing structures that are oriented oblique
to bedding and rock contacts. Locally, the most well-known fault is the Weigle
Fault Zone, which displaces the Precambrian, Paleozoic, and Mesozoic rocks and
generates a deepening of the oxide front.
FIGURE 7-8: ROSEMONT DEPOSIT GEOLOGICAL MODEL STRUCTURAL
DOMAINS 3D VIEW (LOOKING NORTH)
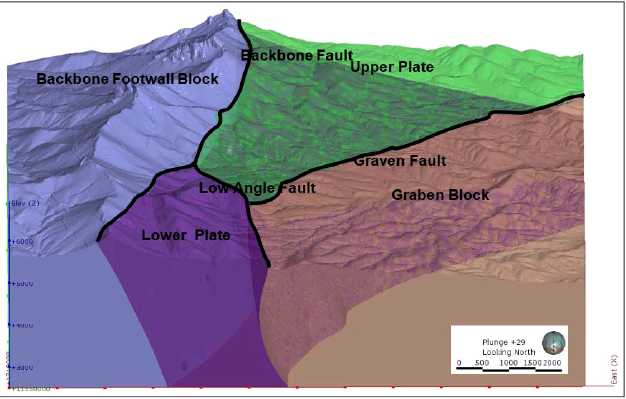
7.6
Mineralization
Drilling to date at Rosemont has defined a mineral resource
approximately 4,000 feet (1,200 meters) in diameter that extends to a depth of
approximately 2,500 feet (750 meters) below the surface. The main fault systems partially delimit the defined resource,
dividing the deposit into major structural blocks with contrasting intensities
and types of mineralization. The north-trending, steeply dipping Backbone Fault
juxtaposes marginally mineralized Precambrian granodiorite and Lower Paleozoic
quartzite and limestone to the west (Back Bone Footwall Block) against a block
of younger, well-mineralized Paleozoic limestone units to the east (Lower
Plate).
Page 7-9
|
|
Rosemont Project |
| Form
43-101F1 Technical Report |
Most of the copper sulfide resource is contained in the eastern
hanging wall of the Backbone Fault. Structurally overlying the sulfide resource
is a block of Mesozoic sedimentary and volcanic rocks (Upper Plate) that
contains lower grade copper mineralization (predominantly as oxides). These two
blocks are separated by the shallowly dipping Low Angle Fault (“LAF”). Other
post-mineral features include a deep, gravel-filled Tertiary paleo valley on the
south side of the deposit and a significant thickness of Cretaceous and Tertiary
volcaniclastic material to the northeast of the deposit.
Sulfide mineralization on the east side of the Backbone Fault
and below the LAF is hosted in an east-dipping package of Paleozoic-age
sedimentary rocks that includes the Escabrosa Limestone, Horquilla Limestone,
Earp Formation, Colina Limestone, and Epitaph Formation.
Relatively minor mineralization occurs in the other Paleozoic
units. To the south, the mineralization in this block appears to weaken and
eventually die out. To the north, mineralization appears to narrow but continues
under cover amid complex faulting (Weigles Fault system). To the east,
mineralization is covered by an increasingly thick block of Mesozoic sediments
due to normal faulting (east block down) along the graben fault.
The Mesozoic rocks of the structural block above the LAF
consist predominantly of arkosic siltstones, sandstones, and conglomerate.
Subordinate andesite flows or sills within the Arkose range from a few tens of
feet to several hundred feet thick. Also, structurally wedged into the Upper
Plate block at the base of the Arkose is the Glance Conglomerate, a
limestone-cobble conglomerate, and some occurrences of relatively fresh
Paleozoic formations.
New QUEMSCAN® data from 107 composite samples (averaging 30
feet (9.1 meters) of core each) collected from Augusta and Hudbay drilled core
provides a preliminary mineralogical characterization of the Rosemont deposit.
In bulk terms, the total sulfide volume content of the non-oxidized mineralized
skarn is less than 2.7% . Pyrite and chalcopyrite comprise approximately 25% and
35% of the total sulfides content, respectively; along with bornite (20%) and
chalcocite (12%). The ratio of these main sulfide minerals is variable through
the stratigraphy of the deposit owing to competing, over-printing pulses of
mineralization and possible supergene effects. Mineralization in the Horquilla
formation is richer in bornite and chalcocite (40% and 35% of total sulfides,
respectively) and lower in pyrite and chalcopyrite (5% and 15% respectively)
compared to the other mineralized units. Molybdenite is a minor phase but
appears to be distributed throughout the skarn and in peripheral portions of the
deposit. Gold and silver are present in small amounts across the deposit and are
thought to be contained in the primary sulfide minerals. Chalcocite, covellite,
native copper and a suite of other secondary copper oxide and carbonate minerals
are found in fault and fracture zones in the skarn.
Page 7-10
|
|
Rosemont Project |
| Form
43-101F1 Technical Report |
7.7
Mineralization Domains
Three mineralization domains (oxide, mixed and sulfide) were
defined based on the soluble to total copper ratio (“ASCu/Tcu”) collected in the
Augusta (2005-2012) and Hudbay (2014 and 2015) drilling programs. The Augusta
analytical protocol included soluble copper assays only in zones where copper
oxides were observed in core. Hudbay’s 2014 and 2015 programs included soluble
copper assays for all samples regardless of the dominant logged mineralogy.
For the domains definition the ASCu/TCu ratio was modelled in
Leapfrog using samples with TCu > 0.05% . Two ASCu/TCu ratio shells were
interpolated (spheroidal indicator interpolant) for values of > 0.3 and >
0.5. The remaining part of the deposit constitutes the sulfide domain.
The oxidized zones including the 0.3 – 0.5 ASCu/TCu (Mixed) and
the > 0.5 ASCu/TCu (Oxide) in part are bounded by a continuous blanket with a
gentle east-dipping attitude. The blanket is defined by a sharp decrease in
ASCu/TCu ratios that coincides with the LAF.
Other irregular oxidized zones are located in the hanging wall
of the Backbone Fault with special development at the intersection with the
Weigles Butte Fault, where a bulbous body of mixed mineralization projects
deeply down-dip into the Horquilla Formation.
Some significant differences were noted between the current and
previous domaining outcomes (Figure 7-9). Augusta domain modelling was built on
down hole coding based on the soluble copper data selectively collected in some
holes and visual examination of core. The new modelling is based exclusively on
analytical data spread throughout the mineralized zones, including the hole core
length unbiased acid soluble data collected by Hudbay. This new approach allows
refining the shape and continuity of the domains within the upper and lower
plate. In the upper plate the oxide blanket topography is better resolved and in
the lower plate the continuity of the mixed and oxide zones associated with
faults and fractures is better constrained.
Page 7-11
|
|
Rosemont Project |
| Form
43-101F1 Technical Report |
FIGURE 7-9: MINERALIZATION DOMAINS SECTION 11,555,500 N
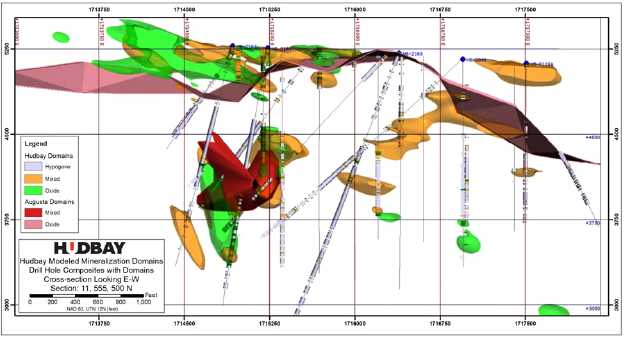
7.8
Alteration and Skarn Development
The Rosemont deposit consists of copper-molybdenum-silver-gold
mineralization primarily hosted in skarn that formed in the Paleozoic rocks as a
result of the intrusion of quartz latite to quartz monzonite porphyry
intrusions. Bornite-chalcopyrite-molybdenite mineralization occurs as veinlets
and disseminations in the skarn.
Garnet-diopside-wollastonite skarn, which formed in impure
limestone, is the most important skarn type volumetrically. Diopside-serpentine
skarn which formed in dolomitic rocks is less significant. Marble was developed
in the most purest carbonate rocks, while the more siliceous, silty rocks were
converted to hornfels. Both marble and hornfels are relatively poor hosts to
mineralization. The main skarn minerals are accompanied by quartz, potassium
feldspar, amphibole, magnetite, epidote, chlorite and clay minerals. Quartz
latite to quartz monzonite intrusive rocks host strong quartz-sericite-pyrite
alteration with minor mineralization. Where the mineralized package of Paleozoic
rocks and quartz-latite intrusive outcrop on the western side of the deposit,
near surface weathering and oxidation has produced disseminated and
fracture-controlled copper oxide minerals.
The Mesozoic and lesser Paleozoic rocks above the LAF are
propylitically altered to an assemblage including epidote, chlorite, calcite,
and pyrite. Copper mineralization is irregularly developed. The rocks are
commonly deeply weathered and limonitic. The original chalcopyrite is typically
oxidized to chrysocolla, copper wad and copper carbonates. Supergene chalcocite
is locally present.
Page 7-12
|
|
Rosemont Project |
| Form
43-101F1 Technical Report |
7.9
Clay Proxies
Geochemical proxies were developed using mineralogy data paired
to multi-element geochemistry. This allowed populating the whole length of the
core drilled in 2014 and 2015 with relevant clay estimates, and modelling the
distribution of both Mg and swelling clays within the deposit.
Magnesium-rich clays (“Mg-clays”), defined as the combined
percentage of talc + serpentine, were analyzed by XRD and QEMSCAN as part of the
metallurgical work. A total of 431 samples were analyzed by XRD and 107 samples
were analyzed by QEMSCAN.
Swelling clays (“Sw-clays”) were analyzed using cation exchange
capacity (“CEC”) for a total of 431 samples also for metallurgical work.
Sw-clays were collectively determined as a group in which individual swelling
clay types were not discriminated.
For Mg-clays, the QEMSCAN data was used as a training data set
to fit a multi-linear regression (MLR) using the multi-element geochemical
analysis as input variables. QEMSCAN was preferred, given that it has better
detection limits than XRD mineralogy. The XRD data has approximately 83% of
observations below the detection limit for Mg-clays and, accordingly, it is not
suitable to fit the models. For Sw-clays, the CECF proxies data was used as
training data set to fit a MLR model using the multi-element geochemical
analysis as input variables.
Higher magnesium clay content is generally associated with a
dolomitic protore (e.g. Epithaph) and higher swelling clays with the
siliciclastic component of the chemical sedimentary rocks (e.g. Earp).
7.9.1 Ore
Types
A 6 node classification and regression tree (“CART”) was used
to classify ore types using 107 measurements of total copper rougher recoveries
(“RCu %”) as the response variable. The bond work index (“BWI”), sag power index
(“SPI”), Sw-clay, Mg-clay; talc + serpentine, and the ratio of soluble copper
relative to total copper (pctCuox = Soluble Cu/TCu), a proxy for oxidation of
ore minerals, were used as predictor variables in the CART model. The results of
the regression tree indicate that the most important variables in hierarchical
order are pctCuox, Sw-clay, and Mg-clay.
The CART model suggests that the Rosemont deposit can be
subdivided in at least 6 ore types (Figure 7-10). Ore types 1 and 2 are
considered clean material. Ore types 3 and 4 are clay-rich material; in which
ore type 4 is Mg-clay rich. Ore types 5 and 6 are highly oxidized ores including
mixed material (Ore 5) and oxide (Ore 6) material (Figure 7-10).
Once the ore types were established, the geochemical data of
these groups were used to create proxies for ore types of the entire deposit.
Mineralogical data collected for metallurgical purposes was used to train
geochemical data. Mg-clays were analyzed by QEMSCAN (107 samples). Sw-clays were
analyzed using CEC for a total of 431 samples. Sw-clays were collectively
determined as a group in which; individual Sw-clay types were not discriminated.
Page 7-13
|
|
Rosemont Project |
| Form
43-101F1 Technical Report |
Mixed and oxide materials (Ore 5a and Ore 5b, respectively)
were modeled using the pctCuox. Geochemical proxies for both Sw-Clays and
Mg-clays were developed. For Mg-clays, the QEMSCAN data was used as a training
data set to fit a multi-linear regression (“MLR”) using the multi-element
geochemical analysis as input variables. For Sw-clays, the CEC data was used as
training data set to fit a MLR model using the multi-element geochemical
analysis as input variables.
FIGURE 7-10: ORE TYPES CART MODEL
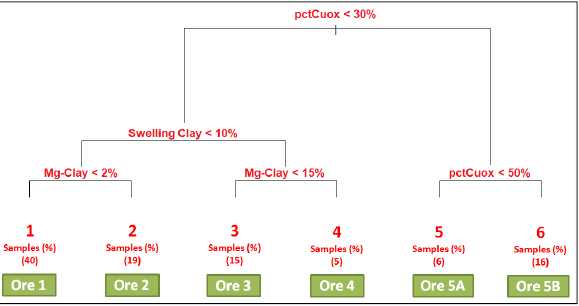
Page 7-14
|
|
Rosemont Project |
| Form
43-101F1 Technical Report |
8 DEPOSIT TYPE
The Rosemont deposit consists of copper-molybdenum-silver-gold
mineralization primarily hosted in skarn that formed in the Paleozoic rocks as a
result of the intrusion of quartz latite to quartz monzonite porphyry
intrusions. Genetically, skarns form part of the suite of deposit styles
associated with porphyry copper centers, although intrusive rocks are
volumetrically minor within the resource area. The skarns were formed as the
result of thermal and metasomatic alteration of Paleozoic carbonate and to a
lesser extent Mesozoic clastic rocks. Near surface weathering has resulted in
the oxidation of the sulfides in the overlying Mesozoic units.
Mineralization is mostly in the form of primary (hypogene)
copper, molybdenum and silver bearing sulfides, found in stockwork veinlets and
disseminated in the altered host rock. Some oxidized copper mineralization is
also present in the upper portion of the deposit. The oxidized mineralization is
primarily hosted in Mesozoic rocks, but is also found in Paleozoic rocks on the
west side of the deposit and deeper along some faults. The oxidized
mineralization occurs as mixed copper oxide and copper carbonate minerals.
Locally, enrichment of supergene chalcocite and associated secondary
mineralization are found in and beneath the oxidized mineralization.
The Twin Buttes Mine, operated by Anaconda and later by Cyprus,
was developed on a deposit with a number of geologic similarities, located
approximately 20 miles (32 kilometers) to the west of Rosemont. The Twin Buttes
mine was in production from 1969 to 1994. In addition, the Asarco Mission Mine,
also located about 20 miles (32 kilometers) to the west of Rosemont, has some
common geologic characteristics.
Page 8-1
|
|
Rosemont Project |
| Form
43-101F1 Technical Report |
9 EXPLORATION
Prospecting began in the Rosemont and Helvetia Mining Districts
in the mid-1800s and by 1875 copper production was first recorded, which
continued sporadically until 1951. By the late 1950s, exploration drilling had
discovered the Rosemont deposit. A succession of major mining companies
subsequently conducted exploratory drilling of the Rosemont deposit and the
nearby Broadtop Butte, Peach Elgin and Copper World mineralized areas.
Augusta acquired the Rosemont property in 2005 and performed
infill drilling at the Rosemont deposit along with exploration geophysical
surveys. A Titan 24 induced polarization/resistivity (“DCIP”) survey over the
Rosemont deposit, performed in 2011, discovered significant chargeability
anomalies which are partially-tested. These anomalies appear to define
mineralization and also certain unmineralized lithologic units. A regional scale
airborne magnetics survey was also completed in 2008.
Two infill drilling campaigns were completed by Hudbay in and
beneath the Rosemont deposit in the fall of both 2014 and 2015. In addition to
chemical assaying, magnetic susceptibility and conductivity measurements were
taken using the Terraplus’ KT-10 & KT-20 instruments at approximately every
10-feet (3 meters) intervals of recovered core from the drilling program. The
magnetic susceptibility data has been used from both drilling programs as a
constraint for a 3D inversion of the deposit with an interpretation in progress.
A single test-line of DCIP data was collected over the Rosemont deposit using
the DIAS Geophysical (3D Survey/Mapping) in April 2015 for comparison to the
previously completed Titan 24 survey.
Hudbay analyzed all samples of the 2014 and 2015 drilling
programs with ICP multi-element geochemistry. This new geochemical data set was
used to classify rocks according to chemical indexes in a ternary diagram
defined by Siliciclatic, Limestone and Dolomitic vertices. The lithogeochemical
groups honour the deposit stratigraphy and geochemical attributes and proved to
be a useful tool for geological modeling and vectoring.
A mapping and geochemical sampling program was completed in the
latter half of 2015 on the Rosemont property to reassess the interpretation of
the regional geology and deposit setting. This was followed by a structural
interpretation using both surface and drill core measurements to aid in the
geotechnical evaluation of the Project.
Page 9-1
|
|
Rosemont Project |
| Form
43-101F1 Technical Report |
10
DRILLING
Extensive drilling has been conducted at the Rosemont deposit
by several successive property owners. The most recent drilling was by Hudbay,
with prior drilling campaigns completed by Banner, Anaconda Mining Co., Anamax
and Asarco and Augusta. Table 10-1 summarizes the drill holes used to
estimate the current mineral resource estimate, with regional exploration holes
excluded.
TABLE 10-1: ROSEMONT DEPOSIT DRILLING SUMMARY
|
Company |
Time Period |
Drill Holes |
| Number |
Feet |
Meters |
|
Banner Mining |
1950s to 1963 |
3 |
4,300 |
1,311 |
|
Anaconda Mining |
1963 to 1973 |
113 |
136,838 |
41,708 |
|
Anamax |
1973 to 1986 |
52 |
54,350 |
16,566 |
|
ASARCO |
1988 to 2004 |
11 |
14,695 |
4,479 |
|
Augusta |
2005 to 2012 |
87 |
132,525 |
40,394 |
|
Hudbay |
2014 to 2015 |
90 |
168,286 |
51,294 |
|
Total |
|
355 |
510,780 |
155,686 |
The drill holes in the database were all drilled using diamond
drilling (coring) methods. In some cases, the top portion of the older holes
were drilled using a rock bit to set the collar or by rotary drilling methods
and then switching to core drilling before intercepting mineralization. A map
showing the location of the drill holes by company is provided in Figure 10-1
along with an outline of the mineral resource pit shell limits for the
Rosemont deposit. Exploration holes drilled using rotary or older “churn” drill
holes were excluded from the resource database.
In all of the drilling campaigns, efforts were consistently
made to obtain representative samples by drilling either H-size (2.5 inch or
63.5 mm diameter) or N-size (1.9 inch or 47.6 mm diameter) core.
Core recoveries within the ore zone for the Hudbay and Augusta
drilling programs average 96% and core recoveries within the pit elsewhere
average 89%, lending confidence that quality samples were obtained including for
oxidised intervals. Generally, drill programs were on east-west grid lines
spaced approximately 200 feet (61 meters) apart.
Page 10-1
|
|
Rosemont Project |
| Form
43-101F1 Technical Report |
FIGURE 10-1: ROSEMONT DEPOSIT DRILL HOLE LOCATIONS BY COMPANY

The majority of the Anaconda Mining Co., Anamax and Asarco
drill core is available and was systematically re-logged by Augusta personnel to
be geologically consistent with their drilling from 2005 to 2012. In addition,
with re-logging, they completed some re-sampling for geochemical analyses.
Page 10-2
|
|
Rosemont Project |
| Form
43-101F1 Technical Report |
10.1
Banner Mining Company (1961 to 1963)
The first significant core drilling campaign on the Property
was by the Banner, beginning in about 1961. Banner completed primarily shallow
diamond drill holes, many of which were subsequently deepened by Anaconda Mining
Co. Three drill holes included in the resource database were shallow holes
initially collared by Banner and were significantly deepened during subsequent
drilling programs conducted by Anaconda Mining Co.,. These holes have a combined
length of 4,300 feet (1,311 meters).
10.2
The Anaconda Mining Co., (1963 to 1986)
Anaconda acquired Banner Rosemont Holdings around 1963 and
conducted exploration at the Rosemont deposit and in adjacent mineralized areas.
Between the years of 1963 and 1973, they completed 113 diamond drill holes at
Rosemont for a total of 136,838 feet (41,708 meters). These holes were primarily
drilled vertically. Down-hole and collar surveys completed by company surveyors
were conducted during drilling or immediately following drill hole completion
for selected holes. Anaconda drilled approximately 85% of the larger N-size core
and 15% of the smaller B-size core (1.4 inch or 36.4 mm diameter). Overall core
recovery was more than 85%.
Exploration subsequently transferred to Anamax Mining Co., (an
Anaconda Mining Co., and Amax Inc., joint venture) around 1973, which continued
extensive diamond drilling and analytical work until 1986. Anamax completed 52
core holes for a total of 54,350 feet (16,566 meters). These holes were almost
exclusively drilled as angle holes inclined -45° to -55° to the west,
approximately perpendicular to the east-dipping, Paleozoic, metasedimentary host
rocks. Down-hole and collar surveys by company surveyors were conducted during
drilling or immediately following drill hole completion for the majority of the
holes. Anamax drilled approximately 80% N-sized core and 20% B-sized core, with
an overall core holes recovery of more than 88%.
10.3
ASARCO Mining Co., (1988 to 2004)
Asarco acquired the Rosemont property in 1988 and conducted
exploration until 2004, completing 11 vertical drill holes for a total of 14,695
feet (4,479 meters) in the deposit area (a 12th hole was drilled to the east of
the deposit and is not part of the Project’s database). Data was available from
eight of the Asarco core holes in the Rosemont deposit area and were
incorporated into Hudbay’s resource estimate. Down-hole survey data, if taken,
were not available for the Asarco holes. Drill hole collars were surveyed by
company surveyors. The size of core collected by Asarco was predominantly
N-sized. Core recovery information was not available but re-logging by Augusta
personnel indicated it to be of similar quality to that of other drilling
campaigns.
10.4
Augusta Resource (2005 to 2012)
Augusta optioned the Rosemont property in 2005 and conducted
diamond drilling in several campaigns, from 2005 to 2012. In total, Augusta
completed 87 core holes for a total of 132,525 feet (40,394 meters). Of these, 60 holes were drilled for the
purposes of delineating the deposit and providing infill information, while six
were exploration holes outside of the planned pit area, but close enough to be a
part of the resource database. The remaining 21 core holes support geotechnical
(13) or metallurgical (8) studies. Augusta holes were usually collared by
rock-bitted through overburden, and then drilled with larger HQ-sized core as
deeply as possible and finished with NQ-sized core if a reduction in core size
was required due to ground conditions.
Page 10-3
|
|
Rosemont Project |
| Form
43-101F1 Technical Report |
Most of the holes were oriented vertically, although a few of
the holes were inclined to intercept targets from reasonably accessible drill
pad locations. All drill holes were down-hole surveyed using a Reflex EZ-Shot
survey instrument which measures inclination/dip and azimuth direction, with
measurements generally taken every 100 feet (30 meters) down the hole during
2008 and every 200 or 500 feet (61 or 152 meters) down the hole during 2005,
2006 and 2011 to 2012 drill campaigns. The initial drill hole collar locations
were surveyed by Putt Surveying of Tucson, Arizona, while all later drilling
locations were measured and certified by Darling Environmental & Surveying
of Tucson, Arizona.
10.5
Hudbay (2014 to 2015)
Shortly after acquiring the Project, Hudbay initiated a 44 core
hole drill program in September 2014 and completed 93,122 feet (28,384 meters)
of diamond drilling by December 2014. The Phase I drill program was conducted
entirely within the Rosemont resource, on patented claims and was designed to
gain an initial understanding of the geological setting and mineralization,
provide infill drilling density along with metallurgical, geochemical and
geophysical data.
Diamond drilling was primarily HQ-sized core as deeply as
possible and finished with NQ-sized core, if a reduction in core size was
required due to ground conditions. If ground conditions warranted, drill holes
were collared in larger PQ size (3.3 inch or 83 mm diameter) and reduced to HQ
as ground conditions improved. Drilled length and respective recoveries were PQ
4,326 feet (1,319 meters) with 83.5% recovery, HQ 85,583 feet (26,086 meters)
with 95.9% recovery, and NQ 3,213 feet (979 meters) with 92.8% recovery
(statistics include HB-2119 that was abandoned due to poor ground conditions
after drilling approximately 200 feet (60 meters).
Forty-three of the drill holes were orientated vertically, with
one inclined in order to intercept a target area from an accessible drill pad
location. Down hole surveying was conducted on 200 feet (61 meters) intervals
with either a Multishot Reflex or a Surface Recording Gyro Survey instrument,
both instruments measured inclination/dip and azimuth direction. Collar
locations were surveyed and certified by Darling Environmental & Surveying
of Tucson, Arizona
From August to November 2015, Hudbay completed a 46 core hole,
75,164 feet (22,910 meters) diamond drill program. The Phase II drill program
was conducted entirely within the Rosemont resource, on patented claims and was
designed to gain a further understanding of the geological setting and
mineralization, provide infill drilling density along with metallurgical,
geotechnical, geochemical and geophysical data.
Page 10-4
|
|
Rosemont Project |
| Form
43-101F1 Technical Report |
Diamond drilling was primarily HQ-sized core as deeply as
possible and finished with NQ-sized core, if a reduction in core size was
required due to ground conditions. If ground conditions warranted, drill holes
were collared in larger PQ size and reduced to HQ as ground conditions improved.
Twenty-two of the drill holes were oriented vertically, with 24 inclined drill
holes. Eight holes were inclined for drilling oriented core utilizing the Reflex
ACT III instrument to gather geotechnical structural data, and 16 holes were
inclined in order to intercept a target area from an accessible drill pad
location. Down hole surveying was conducted on 200 feet (61 m) intervals with
either a Multishot Reflex or a Surface Recording Gyro Survey instrument, both
instruments measured inclination/dip and azimuth direction. Collar locations
were surveyed and certified by Darling Environmental & Surveying of Tucson,
Arizona.
Page 10-5
|
|
Rosemont Project |
| Form
43-101F1 Technical Report |
11 SAMPLING
PREPARATION, ANALYSES, AND SECURITY
11.1
Hudbay 2014
11.1.1 Core
Logging
The drilling contractors thoroughly cleaned the drill core
retrieved from the core tube before piecing all the segments together in the
core boxes. Footage marker blocks were inserted in the core boxes after each run
to indicate the relative down-hole depth. Core boxes were labelled with the hole
name, box number and from - to footage measurements before securely closing the
box with a tightly fitted lid. Core boxes were delivered to the core processing
areas of either Rosemont Camp or Hidden Valley Ranch by the drilling
contractors, and neatly stacked on top of pallets. Private 24-hour per day
security guards administered by Securitas Inc., controlled site access and
oversaw sample security at each camp and drill site.
Core boxes were loaded onto conveyor racks by the
geotechnicians and geologists for logging. Prior to measuring the core recovery
parameters and Rock Quality Data (“RQD”), visual checks were performed for
incorrect placement and orientation of core fragments. Any discrepancies caused
by mislabeled or misplaced footage tags were resolved by consulting the drilling
contractors. The drill core was marked with cut lines designed to provide the
most representative split.
Standard parameters for core recovery and RQD for each drill
run were measured by either the trained geotechnicians or geologists and
recorded on tablets. The RQD program was administrated and monitored by the
consulting engineering firm CNI. All core logging was completed by experienced
contract geologists. At the start of each drilling campaign, all geologists were
provided with three days of training on the rock types, alterations,
mineralization and structures found on the property.
All drill holes were logged using tablets networked to a
FileMaker Inc. (FileMaker) database hosted on a laptop using a local hotspot
network. Drill core was divided into sub intervals based on the rock types
observed by the geologists. A local formation name was assigned to each interval
if a positive identification was made. Each interval was further described for
alteration, mineralization, and oxidation state of the primary sulfides. Any
significant veins found were also logged along with identifiable structures.
11.1.2 Sample
Selection
All core samples for assaying were assigned by the core logging
geologist. The typical sample interval was about 5 feet (1.5 meters) while being
mindful of lithological contacts. Geologists were responsible for filling out
two of the three paper tags for each sample in the sampling book with the hole
name and sample interval. Sample tag numbers along with the sampled intervals
were also entered into the core logging database. For core samples, two of the
three tags were stapled into the core box at the starting point of each sample,
one to remain there, and the second to accompany the sampled split in the sample bag. Lines were drawn on the core
using a permanent marker to indicate the beginning and end of each sample. For
QA/QC samples consisting of duplicates (two coarse rejects and analyses to be
generated from the same interval), two sets of sample tags were stapled into the
core box, and a double line was drawn on the core. For other QA/QC samples
(standards and blanks), a single sample tag was stapled into the core box
indicating the QA/QC sample’s relative position in the sequence and the sample
type.
Page 11-1
|
|
Rosemont Project |
| Form
43-101F1 Technical Report |
11.1.3 Core
Photographs
Completely logged core boxes with the sample intervals marked
and sample tags inserted were passed on to geotechnicians who photographed all
core boxes individually or in groups of two using a digital camera (Nikon
Coolpix L830) mounted to a tripod in natural light. The hole name, box numbers
and the from and to intervals were written on a white board, which was
photographed with the core boxes along with a color patch and a scale for
reference. All photos taken were loaded on to a laptop computer dedicated to
core photos and reviewed by the on-site database manager or the lead
geotechnician. Any photos deemed unacceptable were retaken by the
geotechnicians. All core photos were renamed by the site database manager based
on hole name, box numbers and intervals and uploaded to the Google Drive.
11.1.4 Core
Cutting
Prior to cutting core, the database manager printed a sample
list for each drill hole that included the sample identification number, hole
name, sample type and the start and end footage of each sample. This list was
used by the geotechnicians to label sample bags. At the core cutting station, a
bucket was lined with the correctly labelled sample bag and the corresponding
core box was placed on to the work table next to the core saw. The core cutters
separated one of the two sample tags stapled in the core box at the start of the
sample and placed them in the sample bag. For coarse duplicate samples, the
second QA/QC sample tag was also placed in the same bag. Core was cut along the
cut line drawn by the geologist and the right half of the sample was placed in
the sample bag and the left was placed back in the core box. In gouge and rubble
intervals, an aluminium sampling scoop was used to separate the gouge into two
halves in the core boxes and the right half was scooped into the sample bag.
Completed sample bags were closed using the bag draw strings and secured at the
neck using two zip ties. These bags were moved to a dry storage area away from
the core cutting saws and stacked in orderly rows. All saws and sampling buckets
were rinsed with water after cutting each sample to prevent cross contamination.
11.1.5 Sample
Dispatching
Samples were dispatched using the dispatching module in the
core logging database. Samples were dispatched typically in batches of 100
samples from the same drill hole. A requisition form was automatically created
that listed the range of sample numbers, job order number, requested analytical
codes and any special instructions. A corresponding sample list for each
requisition was also created. The requisition form and the sample list were
emailed to the preparation laboratory prior to sample shipment. QA/QC samples
including Blanks and Standards were prepared by the database manager prior to sample shipment. On the day of sample
shipment, sample bags were cross-checked with the sample requisition list before
packing them into large sacks placed on wooden pallets. These sacks were secured
to the wooden pallets using shrink wrap and strap cables before being loaded on
the truck.
Page 11-2
|
|
Rosemont Project |
| Form
43-101F1 Technical Report |
11.1.6 Sample
Preparation
Drill core samples were picked up at the core processing
facilities and transported via UPS to Inspectorate America Corporation’s
(“Inspectorate”) preparation facility at Sparks, Nevada, USA. Samples were
weighed upon arrival, dried at 60°C, and crushed in jaw crushers to ≥70% passing
through 10 mesh (2 mm). The entire crushed sample was homogenized, riffle split,
and a 1,000 g subsample was pulverized to ≥85% passing through 200 mesh (75 μm)
using Essa standard steel grinding bowls. Jaw crushers, preparation pans, and
grinding bowls were cleaned by brush and compressed air between samples.
Cleaning with a quartz wash was conducted between jobs and between highly
mineralized samples.
Once samples were pulverized a 150 g subsample pulp was
collected and air freighted to Bureau Veritas Commodities Canada Ltd., (“Bureau
Veritas”) in Vancouver, Canada, for analysis. The remaining 850 g master pulps
and the coarse rejects were stored temporarily at the Inspectorate laboratory
and then moved to a storage facility in Tucson.
Bureau Veritas is independent from Hudbay and has a quality
system that is compliant with the International Standards Organization (“ISO”)
9001 Model for Quality Assurance and ISO/IEC 17025 General Requirements for the
Competence of Testing and Calibration Laboratories.
The sample preparation, analysis, and security procedures are
considered industry standard, adequate, and acceptable.
11.1.7 Bulk
Density
A total of 922 samples in 43 drill holes were collected for
specific gravity determinations at the Inspectorate preparation facility. The
drill core samples, 4 to 6 inches (10 to 15 cm) long, were taken every 100 feet
(30 meters) from half-split core.
At the laboratory, samples were dried at 105°C overnight and
then allowed to cool to room temperature. The initial weight of the sample is
determined using a top loading balance and recorded. Balances are calibrated
using a 10 g, 50 g and 250 g calibration weight. The sample is immersed in a pan
containing molten paraffin, then immediately removed from the molten paraffin
and shaken a few times to remove excess wax while hardening. The wax coated
sample is reweighed using the top loader and the weight is recorded. The
standard water displacement method is then used to calculate the specific
gravity.
The method is industry standard and suitable for bulk density
determinations.
Page 11-3
|
|
Rosemont Project |
| Form
43-101F1 Technical Report |
11.1.8 Assay
Methodology
A total of 18,361 drill core samples were analyzed for 45
elements by Inductively Coupled Plasma Mass Spectrometry (ICP-MS) after 4-acid
digestion (Method MA200). The specifics of the analyses for copper, molybdenum
and silver are given in Table 11-1. Samples with concentrations above the upper
limit of detection and those with copper ≥ 8,000 ppm and molybdenum ≥ 3,200 ppm
were systematically re-assayed by high-grade 4-acid digestion, Method MA370, and
ICP-OES. The 8,000 and 3,200 ppm copper and molybdenum grade thresholds,
respectively, were selected to maintain accuracy at grade levels within 20% of
the upper limit of detection in Method MA200.
TABLE 11-1: BUREAU VERITAS ASSAY SPECIFICATIONS
|
Element |
Cu |
Cu over
limits
|
Cu
Soluble
|
Mo |
Mo over
limits
|
Ag |
Au |
|
Unit |
ppm |
% |
% |
ppm |
% |
ppm |
ppm |
|
Lower Detection Limit |
0.1 |
0.001 |
0.001 |
0.1 |
0.001 |
0.1 |
0.005 |
|
Upper Detection Limit |
10,000 |
- |
10 |
4,000 |
- |
200 |
10 |
|
Digestion |
4 acids |
4 acids |
Sulfuric acid at
5% |
4 acids |
4 acids |
4 acids |
Fire assay |
|
Instrumental Finish |
ICP-MS |
ICP-OES |
AAS |
ICP-MS |
ICP-OES |
ICP-MS |
AAS |
|
Method Code |
MA200 |
MA370 |
GC921 |
MA200 |
MA370 |
MA200 |
FA430
|
To investigate the oxidation of primary copper sulfides, all
drill core samples were analyzed for acid soluble copper (“ASCu”) Method GC921
with an acid leach at room temperature using 5% sulfuric acid
(H2SO4). Samples were agitated in a mechanical shaker for
one hour, and then made up to volume with demineralised water. The solution was
filtered and analyzed by Atomic Absorption Spectroscopy (“AAS”).
Gold was analyzed in all samples from seven selected drill
holes across the Rosemont deposit. A total 3,155 samples were analyzed for gold;
which represents approximately 18% of Hudbay’s 2014 drilling and sampling
program. Gold was determined by lead-collection fire assay fusion, for total
sample decomposition, and AAS instrumental finish (“Method FA430”). Fire assays
were performed on 30 g subsample pulps to circumvent potential problems due to
nugget effect.
As part of Hudbay’s QA/QC program, QA/QC samples, shown in
Table 11-2, were systematically introduced in the sample stream to assess
adequate sub-sampling procedures, potential cross-contamination, precision, and
accuracy. On average, the sampling program included 6% certified reference
materials (“CRM”), 6% certified blanks, and 6% coarse duplicates. Blanks and
CRMs were prepared by Ore Research and Exploration (“OREAS”) in Australia. All
QA/QC samples were analyzed following the same analytical procedures as those
used for the drill core samples.
Page 11-4
|
|
Rosemont Project |
| Form
43-101F1 Technical Report |
TABLE 11-2: SUMMARY OF QA/QC SAMPLES
|
Category |
No. of samples |
Relative
Frequency1 |
Type |
Elements |
|
OREAS 501b |
214 |
1.2% |
CRM |
Cu-Mo-Ag-Au |
|
OREAS 502b |
211 |
1.1% |
CRM |
Cu-Mo-Ag-Au |
|
OREAS 503b |
210 |
1.1% |
CRM |
Cu-Mo-Ag-Au |
|
OREAS 504b |
198 |
1.1% |
CRM |
Cu-Mo-Ag-Au |
|
OREAS 902 |
55 |
0.3% |
CRM |
Cu-Mo-Ag-
Cu Soluble |
|
OREAS 930 |
179 |
1.0% |
CRM |
Cu-Mo-Ag |
|
OREAS 22d |
534 |
3.0% |
Certified Blank |
Cu-Mo-Ag-Au |
|
OREAS 26a |
554 |
3.0% |
Certified Blank |
Cu-Mo |
|
Duplicates |
1,086 |
6.0% |
Coarse Duplicate |
Cu-Mo-Ag |
|
Duplicates |
189 |
5.9%2 |
Coarse Duplicate |
Cu-Mo-Ag-Au |
1Frequencies estimated relative to a sampling
program comprising 18,361 samples
2Frequencies estimated relative
to 3,155 samples analyzed for gold
11.1.9 Blanks
Certified OREAS blanks, shown in Table 11-3, were inserted into
the sample stream approximately one every twenty samples to monitor potential
cross-contamination.
TABLE 11-3: OREAS CERTIFIED BLANKS
| |
Cu |
Mo |
Ag |
Au |
| Unit |
ppm |
ppm |
ppm |
ppb |
| OREAS 22d |
9.23 |
2.36 |
<0.1 |
<1 |
| OREAS 26a |
50 |
1.50 |
- |
- |
| Certified Method |
4 acids |
4 acids |
4 acids |
Fire assay |
Fine and coarse blanks were systematically inserted at the same
rate for a total of 1,088 blanks representing 5.9% of the sampling program.
OREAS 22d is a certified fine blank prepared from quartz sand. OREAS 26a is a
certified coarse blank sourced from fresh and non-mineralized olivine basalt.
Fine blank OREAS 22d and coarse blank OREAS 26a were used to
assess potential contamination during assaying and sample preparation,
respectively. These blanks contain low trace level concentrations of copper,
molybdenum, silver, and gold. Blank failure due to potential contamination
issues is documented when the blank values exceed five times the lower limit of
detection. For those blanks with concentration levels above the lower detection
limits the failure thresholds are set to values that exceed the certified best
value (“CBV”) plus three standard deviations. A summary of the blank performance
is shown in Table 11-4.
Page 11-5
|
|
Rosemont Project |
| Form
43-101F1 Technical Report |
TABLE 11-4: SUMMARY OF BLANK PERFORMANCE
| Fine Blank OREAS
22d |
| Element |
No. of
Blanks |
Failed
Blanks |
Failure Rate |
Maximum
Contamination of CBV |
Average
Contamination
of CBV |
| Cu |
534 |
32 |
6.0% |
7.4 ppm |
1.7 ppm |
| Mo |
534 |
12 |
2.2% |
4.0 ppm |
1.2 ppm |
| Ag |
534 |
1 |
0.2% |
3.2 ppm |
3.2 ppm |
| Au |
89 |
0 |
0.0% |
0 |
0 |
| Coarse Blank OREAS
26a |
| Element |
No. of
Blanks |
Failed
Blanks |
Failure Rate |
Maximum
Contamination of CBV |
Average
Contamination
of CBV |
| Cu |
554 |
39 |
7.0% |
294 ppm |
40 ppm |
| Mo |
554 |
8 |
1.4% |
69 ppm |
19 ppm |
| Ag |
554 |
1 |
0.2% |
0.1 ppm |
0.1 ppm |
| Au |
98 |
0 |
0% |
0 |
0 |
A total of 1,088 blank samples were systematically inserted
along with the drill core samples and analyzed at Bureau Veritas. Contamination
with copper and gold was insignificant. There are very few isolated cases of
contamination at high-grade levels for silver and molybdenum. However, the
overall blank failure rates are very low ranging from 0 to 7%.
The performance of blanks indicates no significant issues with
contamination and therefore it is concluded that the results are acceptable and
adequate for the resource estimation.
11.1.10 Standards
OREAS certified reference materials, as shown in Table 11-5,
were inserted one every twenty samples. In total, 1,067 CRMs were analyzed for a
total insertion rate of 5.8% .
TABLE 11-5: OREAS CERTIFIED REFERENCE MATERIAL
| Unit |
Cu
% |
Mo
ppm |
Ag
ppm |
Au
ppm |
Cu Soluble
% |
| OREAS 501b |
0.260 |
99 |
0.778 |
0.248 |
- |
| OREAS 502b |
0.773 |
238 |
2.090 |
0.495 |
- |
| OREAS 503b |
0.531 |
319 |
1.540 |
0.695 |
- |
| OREAS 504b |
1.110 |
499 |
3.070 |
1.610 |
- |
| OREAS 902 |
0.301 |
12.2 |
0.343 |
- |
0.111 |
| OREAS 930 |
2.520 |
<1.5 |
9.0 |
- |
- |
| Certified Method |
4 acids |
4 acids |
4 acids |
Fire assay |
Sulfuric acid at 5%
|
OREAS 501b to 504b represent a blend of porphyry copper-gold
mineralization, barren gangue, and minor quantities of copper and molybdenum
concentrate. Copper and gold mineralization occurs as stockwork quartz veins and
disseminations associated with potassic alteration. Primary copper sulfides
include bornite and chalcopyrite.
OREAS 902 was prepared from oxidized copper ore hosted in
dolomitic, carbonaceous, and argillaceous sedimentary rocks. Copper oxides
consist primarily of malachite, cuprite, chrysocolla, and chalcocite.
Chalcopyrite is the primary copper sulfide.
Page 11-6
|
|
Rosemont Project |
| Form
43-101F1 Technical Report |
OREAS 930 was prepared from a copper orebody hosted in
carbonaceous siltstones and mudstones. Sulfides include chalcopyrite, bornite,
pyrrhotite, pyrite, sphalerite, galena, and cubanite.
More than 30 and up to 214 samples were analyzed per CRM, as
summarized in Table 11-6, which provide sufficient information to set acceptance
criteria relative to the average (“AV”) and standard deviation (“SD”) of the
actual assay values of the CRMs. However, if the absolute relative bias is
>10% the acceptance criteria is set relative to the CBV and standard
deviation recommended by the CRM certificates.
TABLE 11-6: SUMMARY OF CRM PERFORMANCE
| Total Cu (ppm) |
| Standard |
No. of Samples |
No. of Failures |
Failure Rate |
CRM Value (ppm) |
Assay Average |
Relative Bias |
| OREAS 501b |
214 |
0 |
0.0% |
2,600 |
2,581 |
-0.7% |
| OREAS 502b |
211 |
0 |
0.0% |
7,730 |
7,532 |
-2.6% |
| OREAS 503b |
210 |
0 |
0.0% |
5,310 |
5,241 |
-1.3% |
| OREAS 504b |
198 |
2 |
1.0% |
11,100 |
11,000 |
-0.9% |
| OREAS 902 |
55 |
1 |
1.8% |
3,010 |
3,028 |
+0.6% |
| OREAS 930 |
179 |
4 |
2.2% |
25,200 |
25,480 |
+1.1% |
| |
| Mo (ppm) |
| Standard |
No. of Samples |
No. of Failures |
Failure Rate |
CRM Value (ppm) |
Assay Average |
Relative Bias |
| OREAS 501b |
214 |
2 |
0.9% |
99 |
96 |
-3.0% |
| OREAS 502b |
211 |
0 |
0.0% |
238 |
230 |
-3.4% |
| OREAS 503b |
210 |
2 |
1.0% |
319 |
310 |
-2.8% |
| OREAS 504b |
198 |
1 |
0.5% |
499 |
487 |
-2.4% |
| OREAS 902 |
55 |
2 |
3.6% |
12.2 |
11.9 |
-2.5% |
| |
| Ag (ppm) |
| Standard |
No. of Samples |
No. of Failures |
Failure Rate |
CRM Value (ppm) |
Assay Average |
Relative Bias |
| OREAS 501b |
214 |
4 |
1.9% |
0.778 |
0.78 |
+0.3% |
| OREAS 502b |
211 |
2 |
0.9% |
2.09 |
2.17 |
+3.8% |
| OREAS 503b |
210 |
0 |
0.0% |
1.54 |
1.61 |
+4.5% |
| OREAS 504b |
198 |
3 |
1.5% |
3.07 |
3.28 |
+6.8% |
| OREAS 902 |
55 |
9 |
16.4% |
0.343 |
0.38 |
+10.8% |
| OREAS 930 |
179 |
25 |
14.0% |
9.00 |
9.98 |
+10.9% |
| |
| Au (ppm) |
| Standard |
No. of Samples |
No. of Failures |
Failure Rate |
CRM Value (ppm) |
Assay Average |
Relative Bias |
| OREAS 501b |
37 |
0 |
0% |
0.248 |
0.252 |
+1.6% |
| OREAS 502b |
35 |
0 |
0% |
0.495 |
0.496 |
+0.2% |
| OREAS 503b |
32 |
0 |
0% |
0.695 |
0.697 |
+0.3% |
| OREAS 504b |
34 |
0 |
0% |
1.610 |
1.596 |
-0.9% |
| |
| Soluble Copper (ppm) |
| Standard |
No. of Samples |
No. of Failures |
Failure Rate |
CRM Value (ppm) |
Assay Average |
Relative Bias |
| OREAS 902 |
55 |
0 |
0% |
1,110 |
1,140 |
+2.7% |
Page 11-7
|
|
Rosemont Project |
| Form
43-101F1 Technical Report |
Accordingly, CRM assayed values within AV±2SD and isolated
values between AV±2SD and AV±3SD were accepted. In contrast, two consecutive
assayed values between AV±2SD and AV±3SD and all values outside the AV±3SD were
rejected and triggered re-analysis.
To evaluate the accuracy of assaying using CRMs, the relative
analytical bias was calculated after excluding the outlier values located
outside the AV±3SD:
Bias (%) = 100*[(AVeo/CBV)-1]
AVeo represents the average of actual assay values after
excluding outliers. The analytical bias was assessed according to the following
ranges: good between 0 and ±5%, reasonable between ±5% and ±10%, and
unacceptable for values ±10%.
The analytical bias of CRMs for total copper, molybdenum,
soluble copper, and gold was good with values in the range between -3.4% and
+2.7% (Table 11-6).
The analytical bias of silver in OREAS 501b to 504b (0.8 to 3
ppm Ag) was good to reasonable, with values between +0.3% and +6.8% . However,
silver in OREAS 902 and 930 displayed a larger analytical bias, approximately
+11% (Table 11-6).
The large bias of silver in OREAS 902 is attributed to the low
silver content and large variance (0.343 ppm, SD = 0.043) of this CRM. The
certified silver content of OREAS 902 is between three and four times the lower
limit of detection (0.1 ppm), and the relative standard deviation (12%) of this
CRM is larger than the analytical bias of +11%. Good performance is expected at
values at least 10 times the lower limit of detection. Therefore, the
performance of OREAS 902 is considered reasonable.
The certified best value for silver of OREAS 930 (9.00 ppm, SD
= 1.09) is more than 10 times the lower detection limit. This CRM displayed a
bias of 10.9% which is considered unacceptable (Table 11-6). However, the bias
is lower than the relative standard deviation of this CRM which is 12%. To
further investigate this issue, pulp duplicate re-analysis were resubmitted to
Bureau Veritas laboratory for all failed OREAS 930 including eight drill core
pulp samples centered on the failed CRMs. In total, 21 failed OREAS 930 and 135
drill core pulp samples with silver between 0.1 and 116 ppm were re-analyzed.
After re-assaying, 86% of CRMs yielded silver values within the certified best
value. Despite the poor reproducibility of OREAS 930, 90% of the re-assayed
drill core pulps in the sample stream of OREAS 930 yielded similar results
(silver 01.-117 ppm) evaluated for an absolute relative difference between pulp
pairs equal to or smaller than 10%.
The CRM analysis indicates that the analytical accuracy for
total copper, molybdenum, and soluble copper is of good quality for the resource
estimation. The cause of the poor performance of silver in OREAS 930 is
attributed to the large variability (SD = 1.09) of this CRM. It is also noted
that OREAS 930 includes minerals such as sphalerite, galena, and cubanite, which
are not found in significant quantities at Rosemont. Given the analysis
discussed above, and good performance of silver in OREAS 501b to 504b, it is concluded that the accuracy for
silver is also adequate for resource estimation.
Page 11-8
|
|
Rosemont Project |
| Form
43-101F1 Technical Report |
11.1.11 Duplicates
Coarse duplicates, approximately one in every twenty samples,
were requested to Bureau Veritas laboratory in order to monitor sub-sampling
precision. Accordingly, after crushing to 10 mesh (2 mm), a 1,000 g coarse
duplicate sub-sample was riffle split and pulverized to ≥85% passing through 200
mesh (75 μm). The duplicate sample was analyzed immediately after its paired
sample. A total of 1,086 coarse duplicate samples were inserted for a total rate
of 6%. Quarter-core twin sample duplicates and pulp duplicates were not analyzed
during Hudbay’s 2014 drilling program.
Coarse duplicates were reviewed using the hyperbolic method
(Table 11-2) developed by AMEC (Simón, 2004). Minimum and maximum element
concentrations of the sample pairs are plotted in the y and x axis,
respectively. In the Minimum-Maximum diagrams, all samples plot along and above
the x = y line and the failure boundary is given by the equation
y2=m2x2+b2. The coarse duplicates
were evaluated using a failure boundary that asymptotically approaches the line
with slope “m” corresponding to a 15% absolute relative error (“RE”). The RE is
calculated as the absolute value of the pair difference divided by the pair
average and expressed in percentage. An acceptable level of sub-sampling
variance is achieved when the failure rate does not exceed 10% of all sample
pairs.
The failure rates of the duplicate pairs for total copper,
molybdenum, silver, gold and soluble copper range between 4% to 6% based on the
hyperbolic method for an absolute relative error of 15% (Table 11-7, Figure
11-1 to Figure 11-4). It is concluded that the sub-sampling
procedures were adequate for all metals used in the resource model.
TABLE 11-7: SUMMARY OF COARSE DUPLICATE ANALYSIS
| Element |
No. of
Samples |
No. of
Failures |
Failure Rate |
Accepted
Absolute RE |
| Cu |
1,086 |
58 |
5.3% |
15% |
| Mo |
1,086 |
66 |
6.1% |
15% |
| Ag |
1,086 |
66 |
6.1% |
15% |
| Au |
189 |
8 |
4.2% |
15% |
| Soluble Cu |
1,086 |
65 |
6.0% |
15% |
Page 11-9
|
|
Rosemont Project |
| Form
43-101F1 Technical Report |
FIGURE 11-1: COPPER COARSE DUPLICATE MINIMUM AND MAXIMUM PLOT

FIGURE 11-2: MOLYBDENUM COARSE DUPLICATE MINIMUM AND MAXIMUM
PLOT
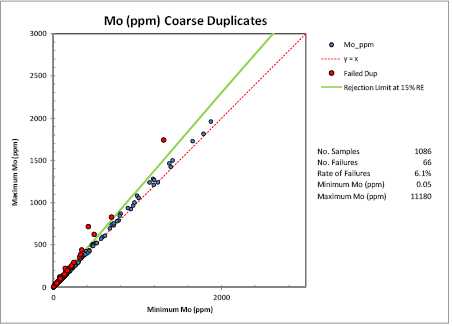
Page 11-10
|
|
Rosemont Project |
| Form
43-101F1 Technical Report |
FIGURE 11-3: SILVER COARSE DUPLICATE MINIMUM AND MAXIMUM PLOT

FIGURE 11-4: SOLUBLE COPPER COARSE DUPLICATE MINIMUM AND
MAXIMUM PLOT
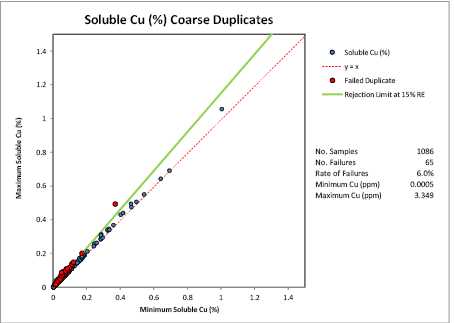
11.1.12 Check Assaying
A total of 1,000 representative pulp samples (5.5%) were
selected and re-analyzed at SGS Canada Inc. (“SGS”) laboratory in Vancouver.
This laboratory is independent from Hudbay and has a quality system that is
compliant with the International Standards Organization (“ISO”) 9001 Model for Quality Assurance and ISO/IEC 17025 General Requirements for
the Competence of Testing and Calibration Laboratories. Only samples with ≥500
ppm copper were submitted for re-analysis at the secondary laboratory.
Page 11-11
|
|
Rosemont Project |
| Form
43-101F1 Technical Report |
CRMs, certified blanks, and pulp duplicates were inserted along
with the check samples following the same protocols used for monitoring Bureau
Veritas. However, pulp duplicates, rather than coarse duplicates, were submitted
to SGS. Duplicates and CRMs indicate that SGS achieved good levels of precision
and accuracy. The overall bias deduced from the CRMs was -2.3% for copper, -4.5%
for molybdenum, -2% for silver, and +2.1% for soluble copper. The analysis of
blanks identified a few cases of economically insignificant copper contamination
with average contamination of <30 ppm copper. It is concluded that the assay
results from SGS are of good quality to evaluate the performance of Bureau
Veritas.
A Reduced-to-Major-Axis regression (“RMA”) was used to evaluate
the check samples (Kermack and Haldane, 1950). The RMA regression calculates an
unbiased fit for values that are independent from each other. The coefficient of
determination (R2) is used to assess the variance explained by the
linear relationship between the pairs. The bias, expressed as a percent, is
calculated as Bias (%) = 1-RMAS in which RMAS is the slope of the RMA
regression.
There is a good fit for copper (R2 = 0.996), silver
(R2 = 0.976), molybdenum (R2 = 0.993), soluble copper
(R2 = 0.970), and gold (R2 = 0.987) . The slope of the RMA
regression for all metals ranges between 0.93 and 1.01 and all intercepts are
below the practical limit of detection and approximate zero, as shown in Figure
11-5, where the black line represents the y = x line and the red dash line
represents the RMA regression line.
The overall analytical bias of Bureau Veritas relative to SGS
is +1.2% for copper, -1.0% for silver, +2.7% for molybdenum, +6.8% for soluble
copper and -2.0% for gold. The overall bias estimated by the RMA regression
analysis indicates that the accuracy achieved by Bureau Veritas for copper,
molybdenum, silver, soluble copper is of good quality for resource estimation.
Page 11-12
|
|
Rosemont Project |
| Form
43-101F1 Technical Report |
FIGURE 11-5: XP PLOTS OF CHECK ASSAY DATA, COMPARING PRIMARY
LABORATORY BUREAU VERITAS TO SECONDARY LABORATORY SGS
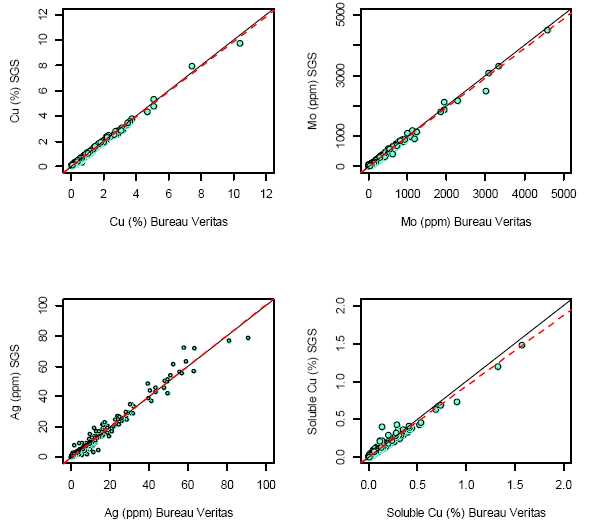
11.2
Hudbay 2015
For consistency, the 2015 drilling campaign followed identical
core logging, sample selection, core cutting, sample dispatching, and sample
preparation protocols as those followed in 2014 as previously described in
detail. The only notable exception in 2015 was the closure of Hidden Valley camp
as all logging related activities took place at Rosemont camp which was expanded
to accommodate up to 8 core logging geologists at a given time.
11.2.1 Bulk
Density
A total of 755 samples in 46 drill holes were collected for
specific gravity determinations at the Inspectorate preparation facility. The
drill core samples, 4 to 6 inches (10 to 15 cm) long, were taken every 100 feet
(30 meters) from half-split core and wax-coated following similar procedures to
those used during the 2014 drilling program as previously described in detail.
Page 11-13
|
|
Rosemont Project |
| Form
43-101F1 Technical Report |
11.2.2 Assay
Methodology
A total of 46 drill holes were sampled from top to bottom and
assayed following the same digestion and analytical procedures used during 2014
and described in detail on Table 11-1, Section 11.1.
During 2015, 14,844 drill core samples were analyzed for 45
elements, including copper, molybdenum, and silver by ICP-MS after 4-acid
digestion (“Method MA200”). All samples were also analyzed for ASCu (“Method
GC921”) with a 5% sulfuric acid (H2SO4) leach at room
temperature. For gold assays, 5 drill holes were sampled from top to bottom with
a total of 1,957 samples, 13% of Hudbay’s 2015 program, assayed by
lead-collection fire assay fusion (Table 11-1).
QA/QC protocols, duplicates, CRMs, and certified blanks, were
similar to those used during the 2014 drilling program. However, OREAS 930 was
replaced by OREAS 931 (Table 11-8). The QA/QC samples were systematically
introduced to assess adequate sub-sampling procedures, potential
cross-contamination, precision, and accuracy. The sampling program included 6%
CRM, 6% certified blanks, and 6% coarse duplicates. Blanks and CRMs were
prepared by OREAS in Australia. All QA/QC samples were analyzed following the
same analytical procedures as those used for the drill core samples.
TABLE 11-8: SUMMARY OF QA/QC SAMPLES
|
No. of samples |
Relative
Frequency1
|
Type |
Elements |
| OREAS 501b |
160 |
1.1% |
CRM |
Cu-Mo-Ag-Au |
| OREAS 502b |
166 |
1.1% |
CRM |
Cu-Mo-Ag-Au |
| OREAS 503b |
160 |
1.1% |
CRM |
Cu-Mo-Ag-Au |
| OREAS 504b |
158 |
1.1% |
CRM |
Cu-Mo-Ag-Au |
| OREAS 902 |
91 |
0.6% |
CRM |
Cu-Mo-Ag-
Cu Soluble |
| OREAS 931 |
159 |
1.1% |
CRM |
Cu-Mo-Ag |
| OREAS 22d |
436 |
2.9% |
Certified Blank |
Cu-Mo-Ag-Au |
| OREAS 26a |
438 |
2.9% |
Certified Blank |
Cu-Mo |
| Duplicates |
870 |
5.8% |
Coarse Duplicate |
Cu-Mo-Ag |
| Duplicates |
115 |
5.9%2 |
Coarse Duplicate |
Cu-Mo-Ag-Au |
1Frequencies estimated relative to a sampling
program comprising 14,868 samples
2Frequencies estimated relative
to 1,957 samples analyzed for gold
11.2.3 Blanks
Fine and coarse blanks were systematically inserted at the same
rate for a total of 874 blanks representing 6% of the sampling program. OREAS
22d is a certified fine blank prepared from quartz sand. OREAS 26a is a
certified coarse blank sourced from fresh and non-mineralized olivine basalt.
The certified values for OREAS blanks are shown on Table 11-3.
Page 11-14
|
|
Rosemont Project |
| Form
43-101F1 Technical Report |
OREAS 22d and OREAS 26a contain low trace level concentrations
of copper, molybdenum, silver, and gold. Blank failure due to potential
contamination issues is documented when the blank values exceed five times the
lower limit of detection. For those blanks with concentration levels above the
lower detection limits the failure thresholds are set to values that exceed the
certified best value (CBV) plus three standard deviations. A summary of the
blank performance is shown in Table 11-9.
TABLE 11-9: SUMMARY OF BLANK PERFORMANCE
| Fine Blank OREAS 22d |
| Element |
No. of
Blanks |
Failed
Blanks |
Failure Rate |
Maximum
Contamination of
CBV |
Average
Contamination of
CBV |
| Cu |
436 |
17 |
3.9% |
45 ppm |
7 ppm |
| Mo |
436 |
9 |
2.1% |
1 ppm |
1 ppm |
| Ag |
436 |
0 |
0 |
0 |
0 |
| Au |
57 |
0 |
0 |
0 |
0 |
| Coarse Blank OREAS 26a |
| Element |
No. of
Blanks |
Failed
Blanks |
Failure Rate |
Maximum
Contamination of
CBV |
Average
Contamination of
CBV |
| Cu |
438 |
13 |
3.0% |
40 ppm |
10 ppm |
| Mo |
438 |
1 |
0.2% |
12 ppm |
12 ppm |
| Ag |
438 |
0 |
0 |
0 |
0 |
| Au |
57 |
0 |
0 |
0 |
0 |
Contamination with copper, silver, and gold was insignificant
(Table 11-9). There are very few cases of contamination at high-grade levels (12
ppm) of molybdenum. However, the overall blank failure rates are <3%.
The performance of blanks indicates no significant issues with
contamination; therefore, it is concluded that the results are acceptable and
adequate for the resource estimation.
11.2.4 Standards
OREAS certified reference materials (Table 11-10) were inserted
one every twenty samples. In total, 894 CRMs were analyzed for a total insertion
rate of 6.0% .
TABLE 11-10: OREAS CERTIFIED REFERENCE MATERIAL
| Unit |
Cu
% |
Mo
Ppm |
Ag
ppm |
Au
ppm |
Cu Soluble
%
|
| OREAS 501b |
0.260 |
99 |
0.778 |
0.248 |
- |
| OREAS 502b |
0.773 |
238 |
2.090 |
0.495 |
- |
| OREAS 503b |
0.531 |
319 |
1.540 |
0.695 |
- |
| OREAS 504b |
1.110 |
499 |
3.070 |
1.610 |
- |
| OREAS 902 |
0.301 |
12.2 |
0.343 |
- |
0.111 |
| OREAS 931 |
3.82 |
- |
14.04 |
- |
- |
| Certified Method |
4 acids |
4 acids |
4 acids |
Fire assay |
Sulfuric acid at 5%
|
Page 11-15
|
|
Rosemont Project |
| Form
43-101F1 Technical Report |
The geological matrices for OREAS 501b to 504b and OREAS 902
are described in detail in Section 11. OREAS 931 is composed of a geological
matrix, similar to OREAS 930, prepared from a copper ore body hosted in
carbonaceous siltstones and mudstones mineralized with chalcopyrite, bornite,
pyrrhotite, pyrite, sphalerite, galena, and cubanite.
Between 90 and 170 samples were analyzed per CRM (Table 11-8),
which is sufficient information to set acceptance criteria relative to the
average (“AV”) and standard deviation (“SD”) of the actual assay values of the
CRMs. However, if the absolute relative bias is >10% the acceptance criteria
is set relative to the CBV and standard deviation recommended by the CRM
certificates.
The analytical bias for copper, molybdenum, and gold was good
ranging between -2.5% and +1.1% (Table 11-11). The bias for soluble copper was
reasonable at +6.3% .
The analytical bias of silver in OREAS 501b to 504b (0.8 to 3
ppm Ag) was good to reasonable with values between -1.1% and +7.7% . However,
silver in OREAS 902 and 931 displayed larger analytical bias (+14.1% to +16%).
The large bias of silver in OREAS 902 and OREAS 931 is
attributed to the low silver content of OREAS 902 and large variability of
silver in these standards with relative standard deviations of 13% and 14%,
respectively. The average silver value measured for these CRMs from the assays
is within 1 and 2 SD of the CBV, respectively. Thus, the performance of silver
in OREAS 902 and OREAS 931 is considered reasonable (Table 11-11).
Pulp duplicate re-analyses were requested to Bureau Veritas
laboratory for all failed silver assays for OREAS 902 and OREAS 931 including
six drill core pulp samples centred on the failed CRMs. In total, 21 failed CRMs
and 126 drill core pulp samples with silver between 0.1 and 36.6 ppm were
reanalyzed. After re-assaying, 90% of CRMs yielded silver values within the CBV
and 92% of the re-assayed drill core pulps in the sample stream yielded similar
results (0.1 - 27.8 ppm silver) evaluated for an absolute relative difference
between pulp pairs equal to or smaller than 10%.
The CRM analysis indicates that the analytical accuracy for
total copper, molybdenum, soluble copper, silver, and gold is of good quality
for the resource estimation.
Page 11-16
|
|
Rosemont Project |
| Form
43-101F1 Technical Report |
TABLE 11-11: SUMMARY OF CRM PERFORMANCE
| Total Cu (ppm) |
| Standard |
No. of
Samples |
No. of
Failures |
Failure Rate |
CRM Value
(ppm) |
Assay
Average |
Relative
Bias |
| OREAS 501b |
160 |
2 |
1.3% |
2,600 |
2,589 |
-0.4% |
| OREAS 502b |
166 |
3 |
1.8% |
7,730 |
7,539 |
-2.5% |
| OREAS 503b |
160 |
1 |
1.3% |
5,310 |
5,233 |
-1.4% |
| OREAS 504b |
158 |
1 |
0.6% |
11,100 |
10,971 |
-1.2% |
| OREAS 902 |
91 |
2 |
2.2% |
3,010 |
3,003 |
-0.2% |
| OREAS 931 |
159 |
1 |
0.6% |
38,200 |
38,488 |
+0.8% |
| Mo (ppm) |
| Standard |
No. of
Samples |
No. of
Failures |
Failure Rate |
CRM Value
(ppm) |
Assay
Average |
Relative
Bias |
| OREAS 501b |
160 |
1 |
0.6% |
99 |
97 |
-1.7% |
| OREAS 502b |
166 |
1 |
0.6% |
238 |
236 |
-0.7% |
| OREAS 503b |
160 |
2 |
1.2% |
319 |
313 |
-1.9% |
| OREAS 504b |
158 |
1 |
0.6% |
499 |
491 |
-1.6% |
| OREAS 902 |
91 |
0 |
0% |
12.2 |
11.9 |
-2.4% |
| Ag (ppm) |
| Standard |
No. of
Samples |
No. of
Failures |
Failure Rate |
CRM Value
(ppm) |
Assay
Average |
Relative
Bias |
| OREAS 501b |
160 |
2 |
1.3% |
0.778 |
0.77 |
-1.1% |
| OREAS 502b |
166 |
3 |
1.8% |
2.09 |
2.16 |
+3.3% |
| OREAS 503b |
160 |
2 |
1.3% |
1.54 |
1.59 |
+3.5% |
| OREAS 504b |
158 |
0 |
0% |
3.07 |
3.31 |
+7.7% |
| OREAS 902 |
91 |
14 |
15.4% |
0.343 |
0.40 |
+16.0% |
| OREAS 931 |
159 |
13 |
8.2% |
14.04 |
16.01 |
+14.1% |
| Au (ppm) |
| Standard |
No. of
Samples |
No. of
Failures |
Failure Rate |
CRM Value
(ppm) |
Assay
Average |
Relative
Bias |
| OREAS 501b |
23 |
0 |
0% |
0.248 |
0.251 |
+1.1% |
| OREAS 502b |
22 |
0 |
0% |
0.495 |
0.493 |
-0.4% |
| OREAS 503b |
20 |
0 |
0% |
0.695 |
0.693 |
-0.2% |
| OREAS 504b |
21 |
0 |
0% |
1.610 |
1.600 |
-0.7% |
| Soluble Copper (ppm) |
| Standard |
No. of
Samples |
No. of
Failures |
Failure Rate |
CRM Value
(ppm) |
Assay
Average |
Relative
Bias |
| OREAS 902 |
91 |
1 |
1.1% |
1,110 |
1,180 |
+6.3% |
Page 11-17
|
|
Rosemont Project |
| Form
43-101F1 Technical Report |
11.2.5
Duplicates
Coarse duplicates, approximately one in every twenty samples,
were requested to Bureau Veritas laboratory in order to monitor sub-sampling
precision (Section 11.1.11) . Accordingly, after crushing to 10 mesh (2 mm), a
1,000 g coarse duplicate sub-sample was riffle split and pulverized to ≥85%
passing through 200 mesh (75 μm). The duplicate sample was analyzed immediately
after its paired sample.
A total of 870 coarse duplicate samples were inserted for a
total rate of 6%. Quarter-core twin sample duplicates and pulp duplicates were
not analyzed during Hudbay’s 2015 drilling program. The coarse duplicates were
evaluated using the hyperbolic method developed by AMEC (Simón, 2004) and
explained in detail on Section 11.1.11.
TABLE 11-12: SUMMARY OF COARSE DUPLICATE ANALYSIS
| Element |
No. of
Samples |
No. of
Failures |
Failure
Rate |
Accepted
Absolute RE |
| Cu |
870 |
71 |
8.2% |
20% |
| Mo |
870 |
72 |
8.3% |
20% |
| Ag |
870 |
25 |
2.9% |
20% |
| Au |
115 |
0 |
0% |
20% |
| Soluble Cu |
870 |
69 |
7.9% |
20% |
The results from the coarse duplicate analysis are presented on
Table 11-12 and illustrated on Figure 11-6 to Figure 11-9. During
2015, an acceptable level of sub-sampling variance was achieved with, failure
rates between 0% and 8.3%, for sample pairs evaluated for a maximum absolute
relative error of 20% (Table 11-12). It is noteworthy that the sub-sampling
variance achieved during 2015 was larger than the variance indicated by the
coarse duplicates analysis during Hudbay’s 2014 drilling program (Table 11-7).
During 2014, an acceptable level of sub-sampling variance was achieved for an
absolute relative error of 15%.
Despite the larger sub-sampling variance observed during the
2015 program, the duplicate failure rate for a maximum RE of 20% is acceptable
for all metals used in the resource model.
Page 11-18
|
|
Rosemont Project |
| Form
43-101F1 Technical Report |
FIGURE 11-6: COPPER COARSE DUPLICATE MINIMUM AND MAXIMUM PLOT
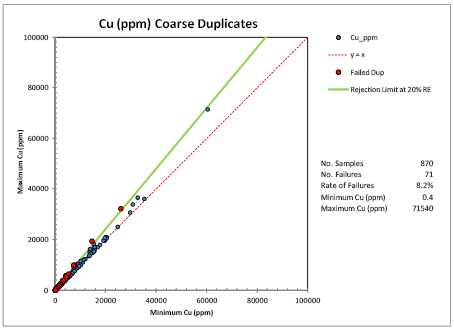
FIGURE 11-7: MOLYBDENUM COARSE DUPLICATE MINIMUM AND MAXIMUM
PLOT

Page 11-19
|
|
Rosemont Project |
| Form
43-101F1 Technical Report |
FIGURE 11-8: SILVER COARSE DUPLICATE MINIMUM AND MAXIMUM PLOT
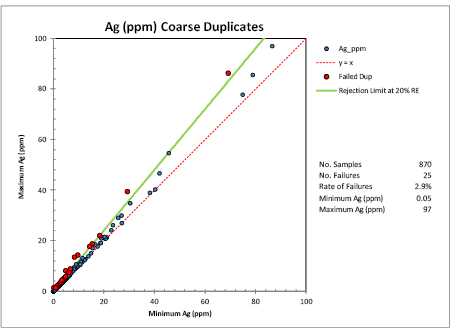
FIGURE 11-9: SOLUBLE COPPER COARSE DUPLICATE MINIMUM AND
MAXIMUM PLOT
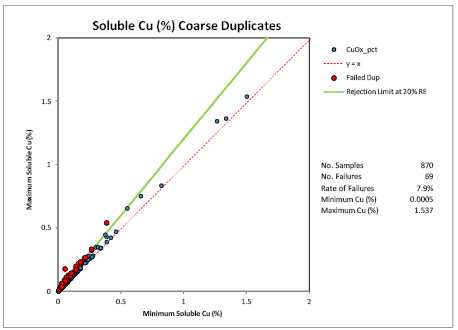
11.2.6 Check
Assaying
A total of 742 representative pulp samples (5%) were selected
and re-analyzed at SGS Canada Inc. (“SGS”) laboratory in Vancouver. Only samples
with ≥1000 ppm copper were submitted for re-analysis at the secondary
laboratory.
Page 11-20
|
|
Rosemont Project |
| Form
43-101F1 Technical Report |
CRMs, certified blanks, and pulp duplicates were inserted along
with the check samples following the same protocols used for monitoring Bureau
Veritas. However, pulp duplicates, rather than coarse duplicates, were submitted
to SGS. Duplicates and CRMs indicate that SGS achieved good levels of precision
and accuracy. The overall bias deduced from the CRMs was +2.7% for copper, -5.8%
for molybdenum, +14% for silver, and +2% for soluble copper. The large bias of
silver is explained by the large variance of silver in OREAS 931. The analysis
of blanks indicates that there was no economically significant contamination. It
is concluded that the assay results from SGS are of good quality to evaluate the
performance of Bureau Veritas.
A Reduced-to-Major-Axis regression (“RMA”) was used to evaluate
the check samples (Kermack and Haldane, 1950). The RMA regression calculates an
unbiased fit for values that are independent from each other (Section 11.1.12) .
FIGURE 11-10: XP PLOTS OF CHECK ASSAY DATA, COMPARING PRIMARY
LABORATORY BUREAU VERTIAS TO SECONDARY LABORATORY SGS
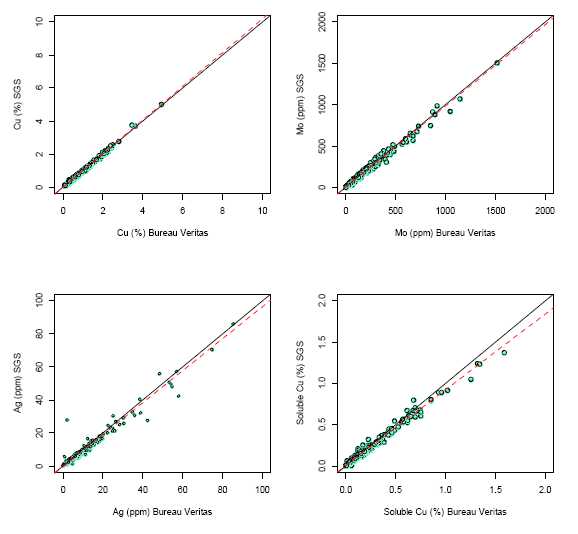
Page 11-21
|
|
Rosemont Project |
| Form
43-101F1 Technical Report |
There is a good fit for copper (R2 = 0.999), silver
(R2 = 0.979), molybdenum (R2 = 0.990), soluble copper
(R2 = 0.989), and gold (R2 = 0.977) . The slope of the RMA
regression for all metals ranges between 0.92 and 1.02 and all intercepts are
below the practical limit of detection and approximate zero, as shown in Figure
11-5, where the black line represents the y = x line and the red dash line
represents the RMA regression line.
The overall analytical bias of Bureau Veritas relative to SGS
is -2.17% for copper, +3.32% for silver, +1.66% for molybdenum, +8.25% for
soluble copper and +2.55% for gold. The overall bias estimated by the RMA
regression analysis indicates that the accuracy achieved by Bureau Veritas for
copper, molybdenum, silver, soluble copper, and gold is of good quality for
resource estimation.
11.3
Augusta
A detailed description of sample preparation procedures and
data verification processes conducted by Augusta are provided in several reports
including two NI 43-101 technical reports prepared by M3 Engineering &
Technology Corporation (2009, 2012). However, Hudbay conducted its own technical
review and verification of the data; the results of which are summarized in this
section.
11.3.1 Sample
Preparation
Overall, the documented protocols for handling diamond drill
core, data security, drill core sampling, and sample custody by Augusta are
acceptable and industry standard. All core drilled by Augusta was systematically
logged for RQD, lithology, alteration, mineralization, and structures. Logging
was paper-based and later recorded in spreadsheets. Geologists marked the logged
core for cutting with diamond rock saws and sampling was conducted on half-split
core. Samples were collected at fixed 5 feet (1.5 meters) intervals, assigned a
unique sample number, and securely sealed in sample bags. The sample intervals
were shortened to accommodate smaller zones with abrupt changes in copper and
molybdenum mineralization, but typically the sampled intervals straddle
geological boundaries.
11.3.2 Bulk
Density
Augusta analyzed a total of 391 drill core samples across the
Rosemont deposit for their specific gravity (“SG”) at Skyline Assayers &
Laboratories (“Skyline”), Tucson, Arizona, USA. Skyline followed a protocol
based on the differential weight of the sample in air and water. No paraffin
coating was applied.
The SG results obtained by Augusta compare well with those
measured by Hudbay at Inspectorate during its 2014 and 2015 drilling programs,
as shown in Figure 11-11. The global average (2.74) and median (2.70) SG values
of 391 samples measured at Skyline are comparable with the average (2.69) and
median (2.66) of 954 samples analyzed by Hudbay during 2014, and 755 samples
analyzed in 2015 (average= 2.72, median= 2.69) . It is concluded that the SG
reported by Augusta are of good quality and appropriate for resource estimation.
Page 11-22
|
|
Rosemont Project |
| Form
43-101F1 Technical Report |
FIGURE 11-11: BOXPLOTS OF SG MEASURED BY HUDBAY AND AUGUSTA
AT INSPECTORATE AND SKYLINE LABORATORIES, RESPECTIVELY

11.3.3 Assay
Methodology
Augusta assayed drill core samples at Skyline’s laboratory in
Tucson, Arizona. Drill core samples were dried before being crushed using jaw
crushers to produce a coarse fraction with ≥70% passing through 10 mesh (2 mm).
The entire crushed sample was homogenized, riffle split, and a 300 to 400 g
subsample split was pulverized to pass ≥95% through 150 mesh (105 μm) using Essa
standard steel grinding bowls. Jaw crushers, preparation pans, and grinding
bowls were cleaned with compressed air between samples. Coarse rejects and pulps
were returned to Augusta.
Table 11-13 summarizes the assay methodologies and instrumental
finishes conducted by Skyline.
Page 11-23
|
|
Rosemont Project |
| Form
43-101F1 Technical Report |
TABLE 11-13: ASSAY SPECIFICATIONS – SKYLINE
| Element |
Cu |
Cu Soluble |
Mo |
Mo |
Ag |
Ag |
Au |
| Lower Detection Limit |
100 ppm |
100 ppm |
50 ppm |
10 ppm |
0.4 pm |
0.1 ppm |
0.005ppm |
| Upper Detection Limit |
10% |
5% |
1% |
1% |
100 ppm |
100 ppm |
3 ppm |
| Digestion |
3 acids HCl- HNO3-
HClO4 |
Sulfuric acid at 10%
H2SO4- Na2SO3 |
3 acids HCl- HNO3-
HClO4 |
3 acids HCl- HNO3-
HClO4 |
Aqua Regia HCl-HNO3-
|
Aqua Regia HCl-
HNO3- |
Fire assay |
| Instrumental Finish |
AAS |
AAS |
ICP-OES |
ICP-OES |
AAS |
AAS |
AAS |
| Method Code |
MEA |
Cu-AS |
MEA |
MEA |
FA-O8 |
FA-08 |
FA-01 |
| Time Period |
2005-2012 |
2005-2012 |
2005-2006 |
2006-2012 |
2005 |
2005-2012 |
2005-2012
|
In total 21,197 samples were analyzed for total copper and
16,619 samples for molybdenum. Total copper and molybdenum were dissolved using
a hot 3-acid digestion at 250°C and subsequently analyzed by AAS and ICP-OES,
respectively. The lower detection limits for molybdenum are high relative to the
average molybdenum grade of the Rosemont deposit (Table 11-13).
A total of 9,030 samples were analyzed for soluble copper using
an acid leach at 10% sulfuric acid with sodium sulfite. The acid leach was
conducted for an hour at room temperature and the solution was analyzed by AAS.
Silver, analyzed in 15,334 samples, was digested using an aqua
regia leach in 0.25 g subsample pulp and analyzed by AAS. Two different lower
limits of detection, 0.4 and 0.1 ppm, were used in 2005. The 0.4 ppm detection
limit is high relative to the average silver grade of the deposit. However, the
lower limit of detection was improved in the following years (Table 11-13).
A total of 4,932 samples were analyzed for gold by fire assay
with an AAS finish.
Augusta conducted its own internal QA/QC program to
independently evaluate the quality of the assays reported by Skyline. Standards
and blanks were systematically inserted in the sample stream. Duplicates were
not periodically inserted. The QA/QC program was initially provided by
Geochemist, Kenneth A. Lovstrom (deceased). After 2006 the QA/QC program was
managed by Geochemist, Shea Clark Smith of Minerals Exploration &
Environmental Geochemistry.
Skyline is a certified laboratory accredited in accordance with
the recognized International Standard ISO/IEC 17025:2005 General Requirements
for the Competence of Testing and Calibration Laboratories. The sample
preparation, analysis, and security procedures followed by Skyline are
considered industry standard.
Page 11-24
|
|
Rosemont Project |
| Form
43-101F1 Technical Report |
11.3.4
Blanks
In order to track potential contamination processes Augusta
inserted non-certified blanks in the sample stream for an average insertion rate
of 2%. Coarse barren marble and fine quartz sand were used as blanks in early
drill programs through 2007, after which the marble blank was no longer used.
The marble blank was used after high grade samples as a cleaner and to test for
cross contamination, and this blank was excluded from statistical analyses
because its contained metal content is unknown. The distinction between these
two blanks was not documented by Augusta in the database and the results are
evaluated as a combined single blank.
The assays results for copper, molybdenum, silver, and gold
indicate that the blanks are barren relative to the metals of economic interest
and appropriate to assess contamination. Blank failure due to potential
contamination issues is triggered when the blank values exceed five times the
lower limit of detection. A few cases of contamination at higher grade levels
are documented for silver and molybdenum. However, all metals of economic
interest have very low failure rates ranging from 0 to 6%, indicating that
contamination is not a significant problem in the samples analyzed at Skyline as
shown in Table 11-14.
TABLE 11-14: SUMMARY OF BLANK PERFORMANCE AT SKYLINE
| Element |
Count |
Failed
Blanks
|
Failure
Rate
(%) |
Maximum
Contamination |
Average
Contamination |
| Cu |
553 |
5 |
1.0% |
690 ppm |
310 ppm |
| Ag |
552 |
33 |
6.0% |
7.6 ppm |
0.9 ppm |
| Mo |
440 |
7 |
1.6% |
120 ppm |
40 ppm |
| Au |
123 |
0 |
0.0% |
0 |
0 |
11.3.5 Standards
Augusta used 14 standard reference materials (“SRM”) inserted
in the sample stream with an average insertion rate of 4.3% . The insertion rate
is appropriate to assess the accuracy of the data.
Standards KM5, GRS3, GRS4, OC43, and OC48 were developed by Mr.
Lovstrom. The R-series standards were prepared at MEG Labs in Carson City,
Nevada. M3 Engineering & Technology Corporation (2012) has indicated that
the MEG SRMs were prepared from mineralized rock collected from the Rosemont
deposit with best values (“BV”) determined following a round robin program from
a minimum of 25 samples analyzed by at least 5 different laboratories. The
certificates of the SRMs used by Augusta are not available and details of the
digestion protocols, sample matrix, and analytical finish are unknown.
Table 11-15 provides a summary of best values, standard
deviations, and relative standard deviations (“RSD”) for the SRMs extracted from
internal reports by Augusta. There are no records in the database indicating the
use of SRM R4A. Therefore, the analysis presented here is based on the
Page 11-25
|
|
Rosemont Project |
| Form
43-101F1 Technical Report |
13 remaining SRMs. Table 11-16 summarizes the analytical
performance of the SRMs used by Augusta.
TABLE 11-15: STANDARD REFERENCE MATERIALS – AUGUSTA
| Total Cu (%) |
| SRM |
Best Value |
SD |
RSD |
| KM5 |
0.99 |
0.02 |
1.5% |
| GRS3 |
1.23 |
0.03 |
2.0% |
| GRS4 |
2.02 |
0.02 |
1.0% |
| R1 |
0.47 |
0.02 |
3.2% |
| R2 |
0.72 |
0.02 |
2.8% |
| R4A |
1.43 |
0.02 |
1.4% |
| R4B |
0.57 |
0.02 |
3.5% |
| R4C |
0.39 |
0.02 |
3.8% |
| R4D |
0.30 |
0.02 |
6.7% |
| R4E |
0.22 |
0.01 |
4.5% |
| R4F |
0.14 |
0.01 |
7.1% |
| R4G |
0.07 |
0.01 |
14.3% |
| |
| Mo (%) |
| SRM |
Best Value |
SD |
RSD |
| OC43 |
0.035 |
0.001 |
2.9% |
| OC48 |
0.078 |
0.004 |
5.1% |
| R1 |
0.025 |
0.003 |
10.0% |
| R2 |
0.017 |
0.002 |
11.8% |
| R4A |
0.032 |
0.002 |
6.2% |
| R4B |
0.030 |
0.002 |
6.7% |
| R4C |
0.033 |
0.002 |
6.1% |
| R4D |
0.018 |
0.002 |
8.3% |
| R4E |
0.011 |
0.001 |
9.1% |
| R4F |
0.010 |
0.001 |
10.0% |
| R4G |
0.016 |
0.001 |
6.2% |
| |
| Ag (ppm) |
| SRM |
Best Value |
SD |
RSD |
| R1 |
5.1 |
0.52 |
10.20% |
| R2 |
7.1 |
0.74 |
10.44% |
| R4A |
7.0 |
0.84 |
11.96% |
| R4B |
3.9 |
0.49 |
12.60% |
| R4C |
3.1 |
0.58 |
18.89% |
| R4D |
2.4 |
0.67 |
28.51% |
| R4E |
1.7 |
0.64 |
36.99% |
| R4F |
1.4 |
0.66 |
46.81% |
| R4G |
1.2 |
0.80 |
66.81% |
Page 11-26
|
|
Rosemont Project |
| Form
43-101F1 Technical Report |
TABLE 11-16: PERFORMANCE OF STANDARD REFERENCE MATERIALS AT
SKYLINE
| Total Cu
(%) |
| SRM |
No. of
Samples |
No. of
Failures |
Failure Rate
(%) |
SRM Best
Value |
Skyline
Average |
Relative
Bias |
| KM5 |
59 |
0 |
0.0% |
0.99 |
1.01 |
+2.0% |
| GRS3 |
18 |
0 |
0.0% |
1.23 |
1.12 |
-8.9% |
| GRS4 |
20 |
1 |
5.0% |
2.02 |
1.90 |
-5.9% |
| R1 |
417 |
15 |
3.6% |
0.47 |
0.47 |
0.0% |
| R2 |
233 |
2 |
0.9% |
0.72 |
0.71 |
-1.4% |
| R4B |
33 |
1 |
3.0% |
0.57 |
0.57 |
0.0% |
| R4C |
151 |
1 |
0.7% |
0.39 |
0.40 |
+2.6% |
| R4D |
74 |
2 |
2.7% |
0.30 |
0.30 |
0.0% |
| R4E |
90 |
1 |
1.1% |
0.22 |
0.21 |
-4.5% |
| R4F |
93 |
3 |
3.2% |
0.14 |
0.14 |
0.0% |
| R4G |
23 |
1 |
4.3% |
0.07 |
0.07 |
0.0% |
| Total |
1,211 |
|
|
|
|
|
| |
| Mo
(%) |
| SRM |
No. of
Samples |
No. of
Failures |
Failure Rate
(%) |
SRM Best
Value |
Skyline
Average |
Relative
Bias |
| OC43 |
22 |
0 |
0.0% |
0.035 |
0.034 |
-2.9% |
| OC48 |
21 |
1 |
4.8% |
0.078 |
0.073 |
-6.4% |
| R1 |
233 |
6 |
2.6% |
0.025 |
0.025 |
0.0% |
| R2 |
225 |
1 |
0.4% |
0.017 |
0.018 |
+5.9% |
| R4B |
33 |
0 |
0.0% |
0.030 |
0.029 |
-3.3% |
| R4C |
141 |
1 |
0.7% |
0.033 |
0.031 |
-6.1% |
| R4D |
51 |
1 |
2.0% |
0.018 |
0.018 |
0.0% |
| R4E |
81 |
2 |
2.5% |
0.011 |
0.009 |
-18.2% |
| R4F |
74 |
2 |
2.7% |
0.010 |
0.009 |
-10.0% |
| R4G |
23 |
1 |
4.3% |
0.016 |
0.014 |
-12.5% |
| Total |
904 |
|
|
|
|
|
| Ag
(ppm) |
| SRM |
No. of
Samples |
No. of
Failures |
Failure Rate
(%) |
SRM Best
Value |
Skyline
Average |
Relative
Bias |
| R1 |
233 |
14 |
6.0% |
5.1 |
5.1 |
0.0% |
| R2 |
225 |
2 |
0.9% |
7.1 |
7.0 |
-1.4% |
| R4B |
25 |
1 |
4.0% |
3.9 |
3.8 |
-2.6% |
| R4C |
124 |
6 |
4.8% |
3.1 |
2.5 |
-19.4% |
| R4D |
51 |
1 |
2.0% |
2.4 |
2.0 |
-16.7% |
| R4E |
41 |
0 |
0.0% |
1.7 |
1.3 |
-23.5% |
| R4F |
122 |
1 |
0.8% |
1.4 |
1.0 |
-28.6% |
| R4G |
21 |
0 |
0.0% |
1.2 |
0.5 |
-58.3% |
| Total |
842 |
|
|
|
|
|
The analytical accuracy for copper was good to reasonable for
all SRMs analyzed at Skyline with relative bias ranging from -9% to +3% (Table
11-16). Two SRMs (R4E and R4G) displayed poor accuracy for molybdenum with
negative bias of less than -10%. However, 90% of the SRMs measured for
molybdenum displayed relative bias between -10% and +6% indicating good to
reasonable accuracies for molybdenum SRMs at grade levels of ≥ 100 ppm.
Page 11-27
|
|
Rosemont Project |
| Form
43-101F1 Technical Report |
The results of the standards analyzed for silver indicate good
to reasonable accuracies at grade levels ≥3 ppm. However, all SRMs with
recommended best values <3 ppm silver displayed unacceptable negative bias
between -58% and -19% (R4C to R4G; Table 11-16). The poor performance of these
silver standards is attributed to several factors including imprecise
characterization of the standards and silver grades close to the lower detection
limit. For instance, the reported RSDs for standards R4C to R4G range from 19 to
67% indicating poor precision in the determination of the recommended best
values (Table 11-15). The large RSDs diminish the value of these standards as
reference materials.
It is concluded that the analytical accuracy achieved by
Skyline for all metals of economic interest is good to reasonable and therefore
adequate for resource estimation.
11.3.6
Duplicates
Augusta did not insert duplicates periodically within the
sample stream. On average, only 0.2% coarse duplicate (<50 samples) samples
were analyzed. The insertion of duplicates is significantly below recommended
rates of 2% to 6%. There are insufficient duplicate samples to correctly
evaluate batch reproducibility.
11.3.7 Check
Assays
Augusta resubmitted sample pulps to Skyline for check assays.
The significance of the check samples to independently estimate the confidence
of Skyline is diminished given that a secondary laboratory was not used. Augusta
submitted an average of 1.5% of samples for re-analysis of copper, molybdenum,
silver, and soluble copper. The check assay rate is lower than a recommended
rate of 4% to 5%.
A RMA was used to evaluate the check samples. The coefficient
of determination (R2) is used to assess the variance explained by the
linear relationship between the pairs and is calculated as Bias (%) = 1-RMAS in
which RMAS is the slope of the RMA regression.
Augusta re-assayed 373 samples for copper, 326 samples for
silver, 326 samples for molybdenum, and 203 samples for soluble copper. The RMA
regression for the sample pairs was calculated after removing extreme outliers
that clearly represent switched samples. In total, there were three outliers for
copper, four outliers for silver, two outliers for molybdenum, and one outlier
for soluble copper.
There is a good fit for copper (R2 = 0.999), silver
(R2 = 0.992), molybdenum (R2 = 0.995), and soluble copper
(R2 = 0.968) . The slope of the RMA regression for all metals ranges
between 0.98 and 1.04 and all the intercepts approximate zero and are below the
lower limit of detection for each element. The overall bias of the primary
analysis relative to the check assays is +1.0% for copper, +2.0% for silver,
+1.6% for molybdenum, and -3.7% for soluble copper. However, on a per sample
basis, >10% relative error (“RE”) is observed for silver grades ≤ 3 ppm and
molybdenum grades ≤ 50 ppm. This is expected given the use of relatively high
lower limits of detection for these metals (Table 11-13).
Page 11-28
|
|
Rosemont Project |
| Form
43-101F1 Technical Report |
The overall bias estimated by the RMA regression analysis
indicates that the global accuracy for copper, molybdenum, silver, and soluble
copper is good for resource estimation.
11.4
Historic
Table 11-17 provides historical sample preparation procedures
and data verification processes conducted by several property owners prior to
2005.
TABLE 11-17: ROSEMONT DEPOSIT DRILLING SUMMARY
| Company |
Time Period |
No. of Drill Holes |
Metres Drilled |
| Banner |
1950s to 1963 |
3 |
1,311 |
| Anaconda |
1963 – 1973 |
113 |
41,708 |
| Anamax |
1973 – 1986 |
52 |
16,566 |
| ASARCO |
1988 – 2004 |
11 |
4,479 |
| Total |
|
179 |
64,008 |
11.4.1 Sample
Preparation
For over 50 years, significant diamond drilling, drill core
sampling, and assaying programs were executed by several property owners
preceding Hudbay and Augusta. Records are not available with details of sampling
and security protocols used by these property owners.
Banner, Anaconda, and Anamax used similar methodologies for
drill core logging and sampling. In general, lithology, alteration, structures,
and mineralization were documented on paper logs. Drill core was half-split
using mechanical splitters and sampled for assaying. Mineralized intervals were
entirely sampled with sample length ranging from 1 to 5 feet (0.3 to 1.5
meters). Poorly mineralized intervals were sampled every 20 to 30 feet (6 to 10
meters) along 5 feet (1.5 meters) intervals.
Asarco logged drill core following the same methodology used by
Banner, Anaconda, and Anamax. All geological information was captured on paper
logs. The length of drill core samples was variable and subjected to the
criteria of core logging geologists. Typical sampling intervals were
approximately 10 feet (3 meters) in length.
Augusta data verification program included re-logging of the
majority of available drill core mostly from Anaconda, Anamax, and Asarco
following the procedures described in Section 11.3.1. The information was
collected on paper logs and typed in spreadsheets. Augusta confirmed that
historical drill core recoveries were better than 85% (M3 Engineering &
Technology Corporation, 2009). Augusta also sampled intervals of historical
drill core to fill-in missing analytical information and conducted a re-sampling
program of 10 historical drill holes for data verification purposes.
11.4.2 Quality
Control Evaluation
There are no available QA/QC records for sample preparation and
assaying methodologies for Banner, Anaconda, and Anamax. These previous property
owners regularly analyzed drill core
Page 11-29
|
|
Rosemont Project |
| Form
43-101F1 Technical Report |
samples for total copper and molybdenum. Silver was regularly
analyzed by Anamax, but not commonly assayed by Banner and Anaconda. Visible
oxidized zones were analyzed by soluble copper, but molybdenum was commonly not
analyzed for oxide zone samples.
Copper, molybdenum, silver, and soluble copper were analyzed at
Anaconda and Anamax in-house laboratories. The only existing record of digestion
methodologies and analytical instruments used by these laboratories was provided
by former Anaconda Chief Chemist, Mr. Dale Wood, in phone interviews on November
28, 2005, and January 21, 2006 (M3 Engineering & Technology Corporation
2009, 2012). Accordingly, copper and molybdenum were preliminary screened using
x-ray fluorescence (“XRF”). Samples with > 0.2% Cu and > 200 pm Mo were
then selected for wet chemical analysis. There is no documentation on the
methods used to analyze silver and soluble copper.
Sample pulps for XRF analysis were placed on Mylar® film or
prepared by adding cellulite and pressing it into a ring. There is no
documentation on the type of XRF instrument, XRF technique, and internal
laboratory QA/QC protocols.
Wet chemical analysis was a hot 3-acid digestion with
hydrochloric, nitric, and perchloric acid, with a few drops of hydrofluoric
acid. Copper and molybdenum were analyzed by colorimetry following
phenolthylanaline titration for copper and iodine titration for molybdenum.
There are no records on the model of colorimeters and internal laboratory QA/QC
protocols.
11.4.3
ASARCO
Asarco assayed drill core samples for total copper, molybdenum,
and ASCu at Skyline; which is a certified laboratory accredited in accordance
with the recognized International Standard ISO/IEC 17025:2005 General
Requirements for the Competence of Testing and Calibration Laboratories.
However, there are no records of the QA/QC practices followed by Asarco to
independently monitor the quality performance of Skyline. Descriptions of
digestion methodologies and analytical instruments are not available for the
assay results conducted by Asarco.
11.4.4 Augusta
Re-Sampling Program
Augusta collected twin samples in 10 historical drill holes to
verify the assay results reported by historical drilling and sampling programs.
The remaining half-split core was sampled entirely along intervals similar to
the original intervals sampled by previous property owners. Nine of these drill
holes were drilled by Anaconda and Anamax and one (AH-4) by Asarco. Anaconda and
Anamax used their in-house laboratories for assaying, whereas Asarco used
Skyline. Copper and molybdenum were re-analyzed in all holes and only three
drill holes were reanalyzed for silver. The twin sample re-assays were conducted
at Skyline.
Duplicate analysis shows poor reproducibility of each
individual Anaconda and Anamax assay relative to their twin sample analyzed by
Augusta at Skyline. The poor reproducibility is attributed to factors including sample heterogeneity and poor analytical
precision and accuracy of the Wet and XRF methods used by the Anaconda and
Anamax laboratories.
Page 11-30
|
|
Rosemont Project |
| Form
43-101F1 Technical Report |
However, on a drill hole by drill hole comparison, the average
historical copper assays display differences of less than 10% relative to the
assays at Skyline, as shown in Table 11-18. Overall, the slightly lower copper
content is deemed to result from the deterioration of these historical core
samples over time (i.e. oxidation).
TABLE 11-18: COMPARISON OF HISTORICAL ASSAY RESULTS AND TWIN
HALF-SPLIT CORE SAMPLES ANALYZED BY AUGUSTA AT SKYLINE
| Copper |
| Drill Hole |
Cu (%)
Historic |
Cu (%) Re-
Analyzed |
No. of Samples |
Bias (%) |
Historic
Laboratory |
| A-804 |
0.45 |
0.43 |
315 |
+4.7% |
Anaconda-Anamax |
| A-813 |
0.51 |
0.51 |
239 |
0.0% |
Anaconda-Anamax |
| A-821 |
0.57 |
0.53 |
302 |
+7.5% |
Anaconda-Anamax |
| A-834 |
0.48 |
0.45 |
282 |
+6.7% |
Anaconda-Anamax |
| A-858 |
0.35 |
0.34 |
199 |
+2.9% |
Anaconda-Anamax |
| 1485 |
0.43 |
0.39 |
239 |
+10.3% |
Anaconda-Anamax |
| 1508 |
0.94 |
0.90 |
207 |
+4.4% |
Anaconda-Anamax |
| 1916 |
0.39 |
0.39 |
256 |
0.0% |
Anaconda-Anamax |
| 1917 |
0.24 |
0.25 |
63 |
-4.0% |
Anaconda-Anamax |
| AH-4 |
0.37 |
0.38 |
255 |
-2.6% |
Skyline |
| Molybdenum |
| Drill Hole |
Mo (ppm)
Historic |
Mo (ppm)
Re-Analyzed |
No. of
Samples |
Bias (%) |
Historic
Laboratory |
| A-804 |
70 |
50 |
244 |
+40.0% |
Anaconda-Anamax |
| A-813 |
330 |
280 |
178 |
+17.9% |
Anaconda-Anamax |
| A-821 |
380 |
290 |
230 |
+31.0% |
Anaconda-Anamax |
| A-834 |
180 |
180 |
244 |
0.0% |
Anaconda-Anamax |
| A-858 |
180 |
160 |
199 |
+12.5% |
Anaconda-Anamax |
| 1485 |
170 |
60 |
239 |
+183.3% |
Anaconda-Anamax |
| 1508 |
240 |
230 |
207 |
+4.3% |
Anaconda-Anamax |
| 1916 |
260 |
160 |
257 |
+62.5% |
Anaconda-Anamax |
| 1917 |
230 |
130 |
65 |
+76.9% |
Anaconda-Anamax |
| AH-4 |
90 |
90 |
226 |
0.0% |
Skyline |
| Silver |
| Drill Hole |
Ag (ppm)
Historic |
Ag (ppm)
Re-Analyzed |
No. of
Samples |
Bias (%) |
Historic
Laboratory |
| A-804 |
10.8 |
8.0 |
208 |
+35.0% |
Anaconda-Anamax |
| A-813 |
10.6 |
5.9 |
|
+79.7% |
Anaconda-Anamax |
| A-821 |
10.2 |
4.6 |
|
+121.7% |
Anaconda-Anamax |
Molybdenum reported by the Anaconda and Anamax laboratories
(Wet and XRF) show significant positive bias of up to 183% on a drillhole by
drillhole basis, relative to the twin samples analyzed at Skyline in Table
11-18. The average historical molybdenum over 2,136 samples is 195 ppm versus an
average of 145 ppm in the twin samples, as shown in Figure 11-12. Relative to
the twin samples, molybdenum reported as wet assays is 20% higher whereas XRF
values are 130% higher. To circumvent problems related to the strong positive
bias of the Anamax and Anaconda data, molybdenum grades reported by wet assays
were multiplied by 0.85 and those reported by XRF by 0.45. After factoring, the
average molybdenum in 2,136 assays by Wet and XRF is 147 ppm and compares well
with an average of 145 ppm molybdenum in the twin samples, as shown in Figure
11-12. The factored molybdenum was used for resource estimation to minimize the
impact of the large positive bias in the historical data.
Page 11-31
|
|
Rosemont Project |
| Form
43-101F1 Technical Report |
FIGURE 11-12: BOXPLOTS OF RAW MOLYBDENUM DATA AND FACTORED
DATA REPORTED BY WET AND XRF (A-A = ANACONDA-ANAMAX AND Y-AXIS IN LOGARITHMIC
SCALE)
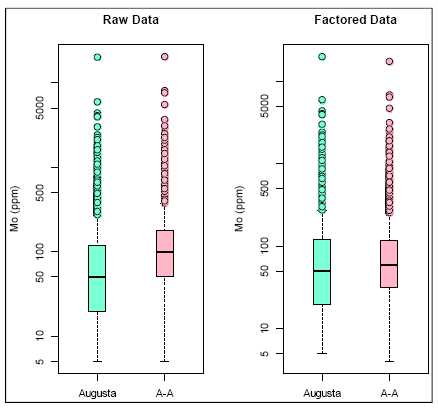
Silver reported by Anamax and Anaconda in-house laboratory also
display a high bias of over 35% relative to the twin samples. However, due to
the very small population of re-analyzed silver from only three holes and the
Anaconda and Anamax representing approximately 12% of the entire dataset, the
author decided not to impact the silver values until further investigation is
complete.
Overall, the copper and molybdenum assays by Asarco (drill hole
AH-4) compare well with the twin samples with very low bias. No silver was
reported by Asarco.
In 2011, Augusta compared the historical drilling data to its
more recent drilling results. Even though there were no twin holes drilled on
the Property, six metallurgical holes located 13 to 29 feet from the historical
holes were used for comparison purposes.
Page 11-32
|
|
Rosemont Project |
| Form
43-101F1 Technical Report |
For most comparisons, copper grades show only minor variability
with an average copper grade of 0.65% Cu for Augusta 0.65% Cu and 0.63% Cu for
the historical data. Augusta concluded that the grade difference was linked to
the natural variability of the skarn mineralization and the spacing between the
Augusta and historical drilling.
More information can be found in the Rosemont feasibility study
published by Augusta in 2012 and available on SEDAR website
(http://www.sedar.com).
In the opinion of the author, the results from the re-assay
program of Augusta and the comparison of metallurgical holes with closely
located historical holes validated the use of historical copper and silver
assays for resource estimation while Hudbay continues to perform confirmatory
drilling. Thus far, this confirmation of drilling has confirmed resource quality
and permitted the expansion of resource tonnage down the plunge of the deposit.
The Molybdenum grade shows an over-estimation bias of approximately 15% in the
historical drilling and this data was corrected prior to being used for resource
estimation.
Page 11-33
|
|
Rosemont Project |
| Form
43-101F1 Technical Report |
12 DATA
VERIFICATION
12.1
Drill Hole Database
Hudbay built an entirely new drill hole database from all
pre-Hudbay drilling and assaying information. Orix Geoscience Inc. was employed
to digitally enter collar, downhole surveys and assay information from scanned
drill logs and assay certificates for all holes drilled prior to Augusta.
The following subsections describe the process Hudbay used to
build a completely new database of the drilling, assay values and the steps
taken to verify the information. All pre-Augusta (prior to 2005) drill holes
will hereby be referred to as “historical drill holes”.
The author’s opinion is that the data verification is adequate
for the purposes used in the Technical Report.
12.1.1 Drill Hole
Collars
Drill hole collar coordinates of historical drilling were
reported in a local Anaconda grid system. The coordinates were converted to
NAD83 UTM Zone 12N using MapInfo software by Augusta in 2005. The conversion was
based on a best fit transformation using drill hole collars and corners from
patented claim boundaries (approximately 6,000 points in total). This conversion
is verified by plotting the converted coordinates against a drill hole collar
compilation map prepared by Anamax Mining Co., in 1979 and the results are
within acceptable margin of error (+/- 5 feet). Further verification was
provided by Richard Darling, who located and surveyed 12 of these historical
holes in UTM coordinates in 2006 and 2008.
Augusta drill hole collars were surveyed by J. Edmonson in 2006
and Darling Geomatics from 2006 to 2012 using a Trimble GLONASS (“Trimble”)
sub-centimeter survey grade GPS. Darling Geomatics were also employed for
surveying Hudbay drill hole collars using the same Trimble unit. All coordinates
are reported in UTM Zone 12, NAD 83 horizontal datum in International Feet and
NAVD 88 vertical datum in International Feet.
12.1.2 Downhole
Surveys
Downhole survey files exist for 25 of the 181 historical drill
holes, as shown in Table 12-1. The majority of the downhole surveys were
conducted by Mollen-Hauer Surveying Company using a gyroscope that measured the
drift angle and azimuth. The readings were generally recorded every 100 feet (30
meters). From the record sheets it cannot be determined if the azimuth recorded
was adjusted for magnetic declaration, hence no further adjustments were made to
these readings. However, of the 181 historical drill holes, 136 were drilled
vertically.
Page 12-1
|
|
Rosemont Project |
| Form
43-101F1 Technical Report |
TABLE 12-1: DOWNHOLE SURVEYS OF HISTORICAL DRILLING
|
Company |
Surveyed by |
Instrument |
Number of Holes |
Year |
|
Anaconda Mining |
Eastco |
Single Shot |
4 |
1966 |
|
Anamax |
Anamax |
Gyroscope |
1 |
1974 |
|
Anamax |
Parsons Surveying Company |
Gyroscope |
3 |
1974 |
|
Anamax |
Mollen-Hauer
Surveying
Company |
Gyroscope |
17 |
1974-1983
|
Downhole surveys were conducted on all Augusta drill holes
using a Reflex EZ-Shot which measures the dip and azimuth. The surveys were
measured at 500 feet (152 meters) intervals by the drilling contractors of
Layne-Christensen and Boart Longyear.
In 2014, Hudbay completed downhole surveys on either 200 feet
(61 meters) intervals using a Reflex EZ Shot tool or on 50 feet (15 meters)
intervals using a gyroscopic tool for their drill hole program, as shown in
Table 12-2. Except for the single shot surveys measured using a Reflex EZ-Shot,
all down hole data was digitally imported from the instrument into the database.
Data was further assessed for reliability based on corresponding magnetic
readings, subsequently discarding any readings above the threshold magnetic
field.
In 2015, Reflex EZ shot tool was used to survey angled holes
every 200 feet (61 meters) while drilling, and the gyroscopic tool was used to
survey the holes every 50 feet (15 meters) at the conclusion of drilling (see
Table 12-3). Single shot measurements were used to monitor the dip of the drill
holes during its progress, while the gyroscopic readings are treated as the
official downhole surveys with the exception of two holes for which no gyro
survey was conducted. All data was digitally imported into the database from the
instrument output files.
TABLE 12-2: HUDBAY 2014 DOWNHOLE RESULTS
|
Surveyed by |
Instrument |
Number of Holes |
|
Major Drilling |
Reflex EZ-Shot |
5 |
|
Layne-Christensen / Major Drilling |
Reflex EZ-Trac |
14 |
|
IDS Directional Surveys |
Televiewer |
3 |
|
Southwest Geophysics |
GyroTracer Directional |
21 |
TABLE 12-3: HUDBAY 2015 DOWNHOLE SURVEYS
| Surveyed by |
Instrument |
Number of Holes |
| Layne-Christensen /National Drilling |
Reflex EZ-Shot |
26 |
| Southwest Geophysics |
GyroTracer Directional |
44 |
Page 12-2
|
|
Rosemont Project |
| Form
43-101F1 Technical Report |
12.1.3 Historical
and Augusta Assay Information
Hudbay acquired a compiled drill hole database from Augusta in
2014. In order to verify the data, Hudbay undertook the task of re-creating the
historical assay database from the original paper certificates. The services of
Orix Geosciences were employed to retrieve drill hole name, sample number, start
and end depth of sample, assay values, and analytical methods from scanned
copies of the historical paper certificates. Assay values were entered as
reported on the paper logs including the lower than the detection limit values
in the original reported units.
The newly compiled database was rechecked against the paper
copies by Hudbay personnel to identify and fix any data entry errors and typos.
Reoccurrences of sample identification for 590 samples from various sampling
campaigns are present in the database, hence it was ruled out as the primary
field for each sample. A unique key combining the drill hole name, along with
start and end depth of the sample was created to adequately identify and index
all of the samples in the database. Each assay field passed through several
validation queries that flagged records outside of expected range, missing
values and potential mismatch of characters.
In an effort to improve the density of analyses where core was
only partially analyzed, Augusta performed a re-sampling program in conjunction
with re-logging historic drill holes. Augusta also completely re-analyzed 10
historic drill holes as a validation of the quality of the historic analyses. In
this process they collected over 1,800 samples (9,334 feet) of core. The
re-analysis was completed at Skyline laboratories in Tucson.
Re-assay data was appended into the new Hudbay database as a
separate column if the hole number matched perfectly with down-the-hole depth
intervals. There were 10,056 samples that match this criterion with total
footage of about 43,200 feet (13,200 meters). For approximately 1,000 samples,
where the down-the-hole depth intervals did not match the original intervals
Hudbay employed a weighted average method to import the re-assay information.
Augusta drilled 81 holes from 2005 to 2012 that were sampled
and assayed. Laboratory assay certificates for all these holes were provided
digitally by Skyline. Hudbay imported these digital certificates directly into
their database.
For each original sample interval, every element assayed was
ranked using the following criteria shown in Table 12-4. A separate field for
each element was populated using the defined ranking with historical information
given preference over re-assay, and for copper and molybdenum ranking Wet over
XRF analysis. In instances where the original data is missing or reported as
“Nil”, the next best ranked value was chosen. An associated data source field
for every ranked assay documents the origin of the assay value in the database.
Less than detection limits are reported as half the limit and assay unit
measurements for the re-assay program were converted to historical units. All
fields without any data to report are represented by a “-1” to distinguish them
from a missing value.
Page 12-3
|
|
Rosemont Project |
| Form
43-101F1 Technical Report |
TABLE 12-4: DRILL HOLE ASSAY RANKING
| Metal |
Historical Information |
Re-assay at
Skyline |
| Wet |
XRAY |
| Copper |
1 |
2 |
3 |
| Molybdenum |
1 |
2 |
3 |
| Copper Soluble |
1 |
2 |
| Silver |
1 |
2 |
| Lead |
1 |
2 |
| Zinc |
1 |
2 |
| Gold |
N/A |
1 |
Augusta measured 391 SG samples from both the historical and
their drill programs. This point data was merged into the assay database by
matching corresponding sample interval and down-the-hole depth.
12.1.4 Hudbay
Assay Information
For the 2014 drilling campaign, Hudbay enlisted the services of
an independent consultant to build a custom core logging database using the
FileMaker database platform. This database was further enhanced and tested by
Hudbay personnel. As the logging and sampling was completed at two different
sites (Rosemont Camp and Hidden Valley Camp), separate clones of the main
database were created and dispatched onto two laptop computers dedicated to data
capture. Core logging and sampling was recorded on to a single database at each
camp with up to seven geologists logging core simultaneously using tablets.
The second drilling campaign in 2015 eliminated the usage of
Hidden Valley Camp and all core logging activities were centralized at Rosemont
Camp. All logging was completed using tablets synced with a centralized
FileMaker database hosted on a laptop.
Quality assurance protocols built into the core logging
database prevented the loggers from duplicating sample numbers and entering out
of range values for sample intervals. Sample types were restricted to a
down-drop list in order to prevent several variations of a sample type. For
quick data input and to prevent data entry errors, the sampling module was
designed to predict the sample number, the interval length and the down-the-hole
depths based on previous entered values, while allowing the users to edit and
adjust the predicted values at their discretion. The sampling module was
improved further in 2015 by pre-assigning sample numbers and sample types for
each core logging geologist. This prevented incidents of incorrectly assigning
sample types and typos in the sample numbers.
The sampling module portion of the FileMaker database generated
color coded reports for each logged drill hole that listed hole name, depth
interval, sample number and type of sample. These reports were visually examined
by the lead geotechnician prior to core cutting and any sample overlaps or skipped samples were brought to the attention of
the on-site database manager. Any discrepancies were fixed immediately in the
database and the reports were reprinted.
Page 12-4
|
|
Rosemont Project |
| Form
43-101F1 Technical Report |
The sample dispatch module of the FileMaker database was used
to create assay requisition forms to submit samples to the assay laboratory, as
well as export the samples included in each requisition to a PDF and CSV file.
To maintain consistency, sampling dispatching was handled by the on-site
database manager.
In order to minimize data loss, each of the databases was
regularly saved. The FileMaker database created a backup of the data three hours
on the host laptop. The database manager also saved a copy on a flash drive at
the end of the day which was uploaded to a Google Drive. The updated copy of the
database was merged into a centralized database at Hudbay’s Toronto office and
backed up on a different server on a daily basis.
The database manager in Toronto reviewed all the samples and
logging from the previous day and communicated any edits or discrepancies that
required amendments by the core loggers. Maintenance and updates to the field
databases were carried out on bi-weekly basis.
Digital copies of the assay certificates received from the
assay laboratory were imported into the main FileMaker database in Toronto by
the database manager using custom-built importers. All fields were imported as
they appeared on the certificates without substituting values for codes or
special characters. All element fields in the database are named appropriately
to include the element name, analytical method and units of measurement.
Attribute fields which include hole name, down hole depths, sample type and
requisition identification were populated using lookup functions for each sample
number. A sample tracking module was created to track all jobs submitted to the
assay laboratory along with analytical methods, number of samples and the date
samples were sent and received.
SG samples were entered into the logging database by the
geologist. The SG measured results were later imported into the assay table by
matching the depth of the sample and assay interval.
An Open Database Connectivity was established between FileMaker
database and Excel to import sample interval table and the sample assay table. A
copy of this Excel workbook was placed in a secure location on the Hudbay server
that was accessible to a small group of approved Hudbay personnel. These Excel
files were imported into several different software (Minesight, Target for
Geosoft, Leapfrog etc.) that allowed further validation of the data.
Overall quality of samples taken, recorded and submitted to the
laboratory was excellent with few data entry errors that were identified and
corrected. Of the 21,647 samples submitted from the Phase I campaign only one
sample was lost. No samples were reportedly lost from the 17,485 samples
submitted during the Phase II campaign. Importing the assay certificates
directly into the database virtually eliminated any data entry errors.
In the author’s opinion, the drill hole and assay database is
acceptable for resource estimation.
Page 12-5
|
|
Rosemont Project |
| Form
43-101F1 Technical Report |
12.1.5 Data
Security
The historical assay database and the Hudbay assay database are
administered by the database manager with working copies kept on the local drive
of a secure computer and backups placed on a secure location on a Hudbay server.
Any requests for edits to the database are made to the database manager who
updates all the copies. All paper copies of the historical assay certificates
and logs are available on the Hudbay’s internal Sharepoint website with
restricted access.
Moving forward, all of the Rosemont historical and current data
will be migrated to the AcQuire platform that provides robust data security and
long-term data storage solutions.
Page 12-6
|
|
Rosemont Project |
| Form
43-101F1 Technical Report |
13 MINERAL PROCESSING
AND METALLURGICAL TESTING
13.1
Overview
Recorded metallurgical testwork on Rosemont ores comprises work
beginning as early 1974 by Anamax Mining Company. Following Augusta’s
acquisition of the Rosemont group of properties in 2005, Augusta continued the
work and concluded it with the publication of NI 43-101 technical reports, the
first in 2007, followed by another dated August 28, 2012. These reports were
authored by M3 Engineering & Technology QPs.
Following its acquisition of Rosemont in 3Q2014, Hudbay
completed two drilling programs (the first commencing late 2014 and the second
in late 2015) and initiated a series of phased metallurgical testing programs,
each designed to advance its understanding of the deposit and metallurgical
performance in response to treatment.
A mine planning effort was also initiated, beginning with an
effort that utilized the two phases of drilling and associated metallurgical
testwork programs that were conducted through 2014 and 2015. In early 2016, an
updated block model was developed, and the mine plan was subsequently updated in
mid-2016 to reflect the changes in the understanding of the deposit. The new
mine plan drove some changes to pit phasing and mining sequences (see additional
detail about the updated model and new mine plan in Sections 14 through 16).
The principal objectives of the phased metallurgical testing
programs were to:
- Enhance the understanding of the Rosemont resource
- Confirm the quality of the prior metallurgical testwork
- Identify downstream processing methods, forecast recoveries and quality of
final products
- Evaluate characteristics of tailing products
- Derive a required ore processing flowsheet and size process equipment
Three composite samples were prepared for metallurgical testing
in 2015, and among these were a set of three samples that corresponded to ore
that was projected (under the earlier mine plan) to report from the mine during
the first five years of operation, the second five years, and a third sample for
the balance of operations.
As reporting from the first phase of metallurgical testwork
programs became available, a revised set of composites was prepared to further
enhance the understanding of the orebody, more particularly as it related to
metallurgical performance in the presence of clays, as well as process equipment
sizing and selection (principally flotation and dewatering equipment). For this
phase of the testwork, a subset of these composites was selected again on the
basis of when the ore was scheduled to report from the mine (again, under the
earlier draft of the mine plan), this time with date ranges chosen as production
years 1 through 3, 4 through 7, and after year 7. Again, due to timing all of
these composites were chosen using the production schedule from the original
mine plan.
Page 13-1
|
|
Rosemont Project |
| Form
43-101F1 Technical Report |
The period descriptors for these several composites may not be
strictly accurate under the revised mine plan developed by Hudbay in 2016 since
testing has shown copper recovery to be strongly correlated to the ratio of
sulfide copper to total copper, regardless of ore type or location in the
deposit. The balance of this report section will discuss:
- Historical metallurgical testwork programs
- Hudbay’s phased metallurgical testwork program
- Principal conclusions and recommendations that result from this body of
work
13.2
Historical Metallurgical Testwork Summary
The information presented in the following historical summary
was important to Hudbay’s early understanding of Rosemont mineralogy and
Augusta’s strategies for liberating metals of interest from the deposit. It was
this early review and investigation of the prior work that drove the definition
of the subsequent drilling and metallurgical testing program implemented
immediately following Hudbay’s acquisition of Rosemont. Subsequent drilling,
sampling and metallurgical testing programs discussed in later paragraphs of
this Section will provide an appreciation of the evolution of Hudbay’s
understanding of the deposit and final conclusions with respect to processing
strategies, flowsheet development and forecasts of recoveries and product
quality.
13.2.1 Early
Work
The earliest reported testwork on Rosemont ores comprising
preliminary grinding and flotation tests was completed by Anamax Mining Company
in 1974. This early work was followed by a larger testwork campaign by Augusta
in 2006-2007 to support the preparation of a feasibility study and technical
report. Further testwork was then completed by Augusta between 2008 and 2013 to
support engineering design and updates to the original technical report. The
description of the Augusta work is provided in this Section and was part of the
“Rosemont Copper Project, NI 43-101 Technical Report”, dated August 28, 2012.
Historical metallurgical testwork programs were undertaken by
Mountain State R&D International (“MSRDI”), SGS and G&T Metallurgical
Services, with dewatering and rheology testing undertaken by Pocock, Outotec and
FLSmidth. Early attempts to characterize the deposit were difficult due to the
large differences in mineralogy and high degree of variability within the major
lithologies. The testwork programs had previously isolated and tested different
lithologies and period composites without successfully correlating metallurgical
performance with specific ore types
The balance of this Section summarizes the results of the
previous metallurgical test programs, those conducted prior to Hudbay’s
acquisition of Rosemont. These are more fully described in Augusta’s technical
report titled “Rosemont Copper Project, NI 43-101 Technical Report, Updated
Feasibility Study” dated August 28, 2012.
Page 13-2
|
|
Rosemont Project |
| Form
43-101F1 Technical Report |
13.2.2
Basis
The earliest existing records of metallurgical testing are from
the period 1974 to 1975, at which time grinding and flotation tests were
performed. In the first half of 2006, Augusta initiated test-work to provide a
better understanding of the metallurgy of the Rosemont mineralization and
establish criteria for the design of a process facility.
The program tested both composites and individual variability
samples and are considered to be fairly representative of the variety of ore
conditions within the deposit.
13.2.3
Mineralization & Ore Types
The ore contains three main copper sulfide minerals (in order
of relative abundance): chalcopyrite, bornite, and chalcocite/covellite. The
deposit was described as having three major and several minor lithological
units, within which the various types of sulfide mineralization occur:
- Horquilla
- Earp
- Colina
- Other including Epitaph and Escabrosa
Two samples of ground Horquilla sulfide material were examined
by detailed mineralogical modal analysis. The result of this analysis indicated
a large difference in copper mineralogy within the Horquilla rock type and
association of silver and gold with the copper sulfide minerals.
Molybdenite,
MoS2, was the only molybdenum mineral
identified.
The copper oxide minerals identified as primarily chrysocolla,
tenorite, malachite, and azurite. Oxide resources are distributed in three major
rock units as follows:
- Arkose
- Porphyry – Quartz Monzonite (“QMP”) or Quartz Latite (“QLP”)
- Andesite
13.2.4 Comminution
Work
Grinding mill sizing parameters were provided to mill
manufacturers for use in their mill sizing methods. The mill sizing parameters
are shown in Table 13-1.
TABLE 13-1: GRINDING MILL SIZING PARAMETERS
| Parameter |
Value |
| CWi |
4.90 |
| RWi |
12.40 |
| BWi |
11.40 |
| Tonnage |
3,400 tph |
| SAG Mill Feed Size |
150,000µ |
| Transfer Size |
3,000µ |
| Ball Mill Product Size |
105µ |
Page 13-3
|
|
Rosemont Project |
| Form
43-101F1 Technical Report |
13.2.5 Flotation
Testwork
Flotation test-work was performed during the years 1974 to 1975
and 2006 to 2008. The tests included bench-scale rougher-scavenger and cleaner
tests, rougher variability tests, and rougher cleaner optimization tests. Based
on the test results the flotation conditions were indicated to be as follows:
- Primary grinding to P80 = 105μ
- Rougher flotation pH= 9.7 to 10.8
- AP-238 and AX-343 collectors
- Regrind to P80 = 74μ
- One stage of cleaner flotation
The result of the variability tests indicated that the grind
size has an effect on both copper recovery and rougher concentrate grade. The
mineralogical modal analyses indicated that the chalcopyrite liberates at a
coarser size, between 150 and 75μ, than bornite and chalcocite. The molybdenite
began to liberate from the gangue between 150 and 75μ, but remained locked to a
significant degree with gangue to about 22μ.
13.2.6 Molybdenum
Testwork
During 2008, flotation tests were conducted at MSRDI on
composite samples of five individual rock lithology samples and one composite
sample representing the material expected to be processed during the first three
years of process plant operation. The test program was designed to examine the
process of producing molybdenite concentrate.
The bulk (copper-molybdenite) flotation concentrate from
mineralized Horquilla produced a molybdenite concentrate grading 52.7%
molybdenum with a 93% molybdenum recovery from bulk concentrate. The results of
testing the other samples indicated lower molybdenite concentrate grades and
with variable molybdenite recovery from the bulk concentrate with the procedure
used. The results of the testing are presented in Table 13-2.
TABLE 13-2: MOLYBDENITE FLOTATION
| Molybdenite
Flotation |
Sample
|
Concentrate Assay % |
Recovery % Mo
|
| Cu |
Mo |
Insol |
| Horquilla |
0.44 |
52.7 |
1.8 |
93.0 |
| Colina |
0.70 |
26.5 |
16.9 |
96.5 |
| Earp |
0.50 |
42.8 |
6.5 |
93.0 |
| Epitaph |
0.30 |
39.3 |
17.5 |
55.7 |
| Escabrosa |
0.50 |
27.9 |
25.8 |
84.8 |
| 1 – 3 Year Composite |
0.06 |
41.6 |
13.5 |
96.5 |
13.2.7 2012
Metallurgical Test Program
In 2012, a metallurgical test program was designed by Augusta
to prepare composite samples representing four periods of expected mine
production and test them by bench scale test procedures. The test procedures followed the treatment methods
proposed for the proposed process plant. The metallurgical test composite
samples were prepared from half-core from six holes drilled in late 2011. The
half-core drill segments were selected so that the composite samples were
representative of grade, lithology, and spatial characteristics of material
predicted to be produced during the mine operating periods of years 1 through 3,
years 4 through 7, years 8 through 12, and years 13 through 21. The composition
of the composite samples by lithology is shown in Table 13-3.
Page 13-4
|
|
Rosemont Project |
| Form
43-101F1 Technical Report |
TABLE 13-3: LITHOLOGY OF COMPOSITE SAMPLES
Lithology
|
Composite Samples
Representing Expected Mine Production Years |
| 1 through 3 |
4 through 7 |
8 through 12 |
13 through 21 |
| Epitaph |
|
|
10% |
16% |
| Colina |
|
11% |
17% |
25% |
| Earp |
16% |
28% |
23% |
16% |
| Horquilla |
84% |
61% |
50% |
43% |
The result of closed circuit flotation tests are summarized in
Table 13-4:
TABLE 13-4: 2012 CLOSED CIRCUIT FLOTATION RESULTS
| Period |
Copper
Recovery |
Molybdenum
Recovery |
Final Bulk Concentrate
Grade |
| Copper |
Molybdenum |
Silver |
| Yr 1-3 |
87.9% |
62% |
41% |
1.02% |
502ppm |
| Yr 4-7 |
81.2% |
2.5% |
44% |
0.047% |
NA |
| Yr 8-12 |
92% |
84% |
28% |
1.22% |
NA |
| * Yr 13-21 1st
composite |
75.8% |
31.1% |
36% |
0.56% |
NA |
| * Yr 13-21 2nd
composite |
91.4% |
66% |
37% |
0.84% |
NA |
* Note: Core submitted for the years 13 to 21 composite were
found to have a higher content of oxidized material than was expected to be
mined during that phase of mining and resulted in low overall metal recovery.
For that reason, a second composite was assembled containing a lesser percentage
of oxidized material and the flotation tests were repeated.
The anomalous value obtained for the molybdenum recovery (years
4-7) was checked by re-testing the same composite sample, resulting in improved
rougher concentrate molybdenum recovery of 40% to 60%. Previous results from
testing samples containing the Colina mineralization indicated that lower
molybdenum recovery was to be expected, however the cause was not specifically
known at the time.
Additional analysis of the concentrate produced in the testwork
(years 8-12) showed that the concentrate contained low amounts of contaminants
such as arsenic (<80 g/ton) and mercury (0.8 g/ton) and contained both gold
(1.91 g/ton) and silver (294 g/ton).
13.2.8 Principal
Observations
The significant conclusions that can be drawn from the prior
metallurgical testing program are as follows:
- Rosemont ore responds well to proven and widely used mineral separation
techniques.
Page 13-5
|
|
Rosemont Project |
| Form
43-101F1 Technical Report |
- Concentrate grade vs. recovery and flotation feed grind size vs. recovery
relationships were established and follow expected trends.
- Early process plant design criteria were developed on the basis of this
work.
13.3
Hudbay Metallurgical Testing Programs
Following the acquisition of the Project in the third quarter
of 2014, Hudbay undertook a series of additional drilling, sampling and
metallurgical testwork programs. Drilling programs were undertaken in late 2014
and 2015, and are discussed in greater detail in Section 10 of this Report.
In 2014, Hudbay engaged XPS Consulting & Testwork Services
(“XPS”) to undertake mineral characterization and metallurgical testwork. Base
Met Laboratory (“BML”) was engaged in late 2015 to provide confirmation testwork
of the XPS testwork and additional process optimization.
The Hudbay metallurgical testing programs are separated into
the following phases:
- XPS Phase 1: Variability Test Program
- XPS Phase 2: Geometallurgical Variables
- XPS Phase 3: Copper / Moly Separation, flotation response to clays
- BML Confirmation Testing
- Production Period Testwork
13.4
XPS Phase 1
In late 2014, Hudbay initiated a variability test program (XPS
Phase 1) that would improve the understanding of the mineral and lithological
data and help define geo-metallurgical characteristics. The objective was to
improve the correlation between mineralogy/geology and metallurgical variability
observed in prior metallurgical testwork conducted by others.
The data presented in this section is taken from the 2015 SGS
report on grindability characteristics of samples provided by XPS.
All of the samples in this program were analyzed by Inductively
Coupled Plasma (ICP), X-Ray Diffraction (“XRD”), Quantitative Evaluation of
Minerals by Scanning electron microscopy (“QEMSCAN”), Cation Exchange Capacity
(“CEC”) and Near-Infrared (“NIR”). ICP measured elemental assays while XRD
measured mineral composition. CEC and NIR analysis determined the clay content
and other alteration minerals content.
A total of 140 samples (Met1A, Met1B and Met2 samples) were
sent to SGS Canada in Lakefield, Ontario for comminution testing, specifically
for the JK drop-weight test, the SPI® test and the Bond ball mill grindability
test at a closing size of 150 mesh (106 µm). JK drop-weight tests require
coarser material and hence this testing was only possible on the 33 new full HQ
core samples (Met2).
Statistics from the comminution test results are summarized in
Table 13-5.
Page 13-6
|
|
Rosemont Project |
| Form
43-101F1 Technical Report |
TABLE 13-5: XPS PHASE 1 - COMMINUTION TEST STATISTICS*
|
Statistic |
DWT |
SPI
(min) |
BWi
(kWh/tonne) |
Relative
Density* |
A x b
|
ta
|
|
Average |
2.84 |
46.9 |
0.54 |
94.6 |
13.0 |
|
Standard Deviation |
0.17 |
17.1 |
0.31 |
54.4 |
2.5 |
|
Minimum* |
2.56 |
94.2 |
1.49 |
24.9 |
8.2 |
|
Median |
2.83 |
45.6 |
0.49 |
82.1 |
13.0 |
|
75th Percentile |
2.94 |
37.0 |
0.39 |
117 |
14.4 |
|
90th Percentile |
3.06 |
25.1 |
0.22 |
151 |
16.0 |
|
Maximum* |
3.28 |
18.6 |
0.14 |
401 |
21.7 |
* Reference: 5a-SGS-14816-001 FINAL Rpt
Apr 17 2015.pdf
13.4.1 General
Observations
Hudbay’s technical services team initiated an effort to map
geochemical characteristics of the various ore types, intending to utilize this
data as predictors of recovery on the basis of ore type, indicators of clay
distribution in the orebody, and other proxies. While this work has produced
results, a stronger indicator of recovery is the sulfide component of total
copper in the sample. Hudbay will continue to develop the geochemical database
with the intent to leverage its value during subsequent project execution and
operational phases.
Results from the XPS Phase 1 sample characterization and
testwork program suggested the following:
- There was significant variability within the major lithologies with
respect to copper oxide, clay content and ore hardness.
- All of the samples tested contained measurable amounts of swelling and/or
magnesium- bearing clays, indicating widespread clay presence in the deposit
and across all ore types.
- Swelling clay, as identified by its CEC content, varied widely from 4% to
over 30%, averaging about 8.5%.
- Magnesium-bearing clays, including serpentine and talc, varied from 0% to
over 35%, with an average of 1.8%.
Sample analysis results also showed that copper oxide varies
widely, from 0% to 90%, averaging about 5.4% for these samples.
13.4.2 Comminution
Results
Both JK drop-weight test (“DWT”) and Bond ball mill work index
(“BWI”) results ranged from very soft to very hard while SAG Power Index (“SPI”)
test results ranged from soft to very hard. A 75th percentile DWT Axb
of 37.0 was determined based on 33 samples, while a 75th percentile
BWI of 14.4 kWh/ton was determined based on 140 samples. A 75th
percentile parameters were chosen as the basis for design of the comminution
circuit.
Page 13-7
|
|
Rosemont Project |
| Form
43-101F1 Technical Report |
13.4.3 Flotation
Results
The XPS Phase 1 flotation program consisted of rougher kinetic
flotation tests for 107 samples (Met1A and Met1B). These tests followed a
standardized flotation schedule drawn from previous work, employing the
following conditions:
- PAX 50 g/tonne (0.1 lb/ton).
- Fuel Oil 30 g/tonne (0.06 lb/ton).
- MIBC 30 g/tonne (0.06 lb/ton).
- Lime to pH 9.5.
- Target grind P80 105 μm.
There was no attempt in Phase 1 to optimize flotation
conditions. Grind determinations were recorded for each test. Lab results report
the following average (rougher feed) grind sizes by sample type:
| Sample |
P80, μm |
Std Deviation, μm |
| Met1A |
94 |
21 |
| Met1B |
107 |
31 |
Clay content, and specifically swelling (CEC) clay content,
appears to have an impact on flotation recovery. However, the impact is not
consistent across all of the tests. Samples with swelling clay content above
about 12% typically yielded lower rougher recoveries.
Rougher flotation results showed a high level of variability,
however, a strong correlation was determined between oxide copper (defined as
the ratio of acid soluble copper to total copper) and rougher flotation recovery
as shown in Figure 13-1.
Page 13-8
|
|
Rosemont Project |
| Form
43-101F1 Technical Report |
FIGURE 13-1: % COPPER ROUGHER FLOTATION RECOVERY VS % ACID
SOLUBLE / TOTAL COPPER

13.5
XPS Phase 2
The principal objective of the XPS Phase 2 testwork was to
investigate the key geo-metallurgical variables identified in Phase 1, which
are:
- Copper oxide content
- Swelling clays
- Magnesium clays
- Ore hardness
A series of composites were prepared, three according to
production period criteria (production years 1 through 5, 6 through 10, and 11
through LOM), and four geometallurgical subtype composites and were tested under
the Phase 2 testwork program as follows:
- Base 1: Main sulfide ore, Production Years 1 – 5
- Base 2: Main sulfide ore, Production Years 6 – 10
- Base 3: Main sulfide ore, Production Years > 10
- Sub 4: ~25% copper oxide ore
- Sub 5A: Swelling clay (CEC) rich ore >10%
- Sub 5B: Magnesium clay (Serpentine and talc) rich ore >10%
- Sub 6: Hard sulfide ore with BWi >14
- Note: “Production years” above refers to the preliminary, not final 2016
mine plan
The results of this phase of testwork are reported in the
Geometallurgical Program Technical Review (XPS, 2015b).
Page 13-9
|
|
Rosemont Project |
| Form
43-101F1 Technical Report |
13.5.1 Mineralogy
Phase 2 composites were submitted for mineralogical
characterization using XRD with Rietveld Refinement, CEC analysis and QEMSCAN
along with Electron Probe Micro-analysis (“EPMA”) to validate phase compositions
and copper deportments.
XRD analysis was completed as a cross-check to the QEMSCAN
analyses and was found to correlate well. A summary of the QEMSCAN data is
presented in Table 13-6. As QEMSCAN is limited in its ability to isolate and
quantify both fine clays and swelling species, CEC analysis was used to define
the swelling-clay content. These results are presented in Table 13-7.
TABLE 13-6: XPS PHASE 2 - QEMSCAN ANALYSIS
| Mineral |
Base 1 |
Base 2 |
Base 3 |
Sub 4 |
Sub 5A |
Sub 5B |
Sub 6 |
| Serpentine Talc Clays |
2.2 |
3.4 |
6.4 |
1.3 |
2.6 |
18.7 |
0.9 |
| Muscovite |
0.5 |
0.9 |
1.0 |
0.8 |
3.4 |
0.5 |
2.4 |
| Biotite |
0.7 |
1.1 |
1.4 |
1.3 |
4.8 |
1.9 |
3.5 |
| Chlorite |
1.7 |
2.6 |
1.8 |
2.7 |
4.0 |
3.0 |
2.0 |
| Quartz |
23.3 |
15.4 |
7.1 |
25.5 |
24.5 |
0.3 |
19.1 |
| K-Feldspar |
7.0 |
8.4 |
3.1 |
9.2 |
13.6 |
0.4 |
21.7 |
| Garnet |
24.2 |
16.5 |
14.6 |
21.7 |
8.5 |
5.8 |
11.0 |
| Calcite |
17.9 |
26.9 |
39.5 |
23.3 |
14.6 |
40.5 |
6.4 |
| Pyrite |
0.4 |
0.5 |
0.2 |
0.1 |
0.3 |
0.7 |
0.3 |
| Chalcopyrite |
0.4 |
0.9 |
1.0 |
0.3 |
0.7 |
1.0 |
0.7 |
| Bornite |
0.2 |
0.2 |
0.1 |
0.1 |
0.1 |
0.3 |
0.3 |
| Chalcocite/Cov. |
0.1 |
0.2 |
0.1 |
0.2 |
0.3 |
0 |
0.1 |
| Cu Oxide-other |
0.1 |
0.3 |
0.1 |
0.8 |
0.1 |
0.1 |
0.1 |
| Other |
21.3 |
22.7 |
23.6 |
12.7 |
22.4 |
26.8 |
31.5 |
| Total |
100.0 |
100.0 |
100.0 |
100.0 |
100.0 |
100.0 |
100.0 |
TABLE 13-7: XPS PHASE 2 - CEC ANALYSIS
| Test |
Base 1 |
Base 2 |
Base 3 |
Sub 4 |
Sub 5A |
Sub 5B |
Sub 6 |
| CEC |
7.1 |
9.5 |
5.9 |
6.3 |
10.6 |
6.1 |
8.3 |
Based on a combination of the EPMA mineral composition data and
the QEMSCAN modal abundance data, the elemental deportment by mineral can be
calculated for copper as is summarized in Table 13-8.
TABLE 13-8: XPS PHASE 2 - COPPER DEPORTMENT BY MINERAL
SPECIES
|
Minerals |
Base 1 |
Base 2 |
Base 3 |
Sub 4 |
Sub 5A |
Sub 5B |
Sub 6 |
|
Chalcopyrite |
33.4 |
49.1 |
67.2 |
24.8 |
39.4 |
58.1 |
48.1 |
|
Bornite |
31.5 |
18.2 |
16.2 |
7.6 |
11.1 |
32.7 |
28.9 |
|
Chalcocite |
20.5 |
22.0 |
8.3 |
32.9 |
33.1 |
3.1 |
18.5 |
|
Covellite |
6.1 |
1.3 |
0.1 |
1.3 |
4.8 |
0.0 |
0.1 |
|
Other Sulfides |
0.4 |
0.3 |
0.2 |
0.4 |
4.3 |
0.3 |
0.1 |
|
Total Sulfide Copper |
92.0 |
90.9 |
92.1 |
67.1 |
92.8 |
94.3 |
95.6 |
|
Chrysocolla |
0.6 |
2.1 |
0.9 |
3.9 |
0.1 |
0.0 |
0.1 |
|
Cu Chlorite |
3.6 |
3.6 |
3.3 |
5.3 |
5.1 |
4.1 |
3.0 |
|
Goethite |
0.8 |
0.8 |
0.3 |
3.2 |
0.5 |
0.4 |
0.3 |
|
Cu Oxide Other |
2.8 |
2.3 |
3.4 |
20.0 |
1.5 |
0.9 |
1.0 |
Page 13-10
|
|
Rosemont Project |
| Form
43-101F1 Technical Report |
|
Minerals |
Base 1 |
Base 2 |
Base 3 |
Sub 4 |
Sub 5A |
Sub 5B |
Sub 6 |
|
Other |
0.1 |
0.2 |
0.0 |
0.1 |
0.0 |
0.1 |
0.0 |
|
Total Oxide Copper |
8.0 |
9.1 |
7.9 |
32.9 |
7.2 |
5.7 |
4.4 |
|
TOTAL |
100 |
100 |
100 |
100 |
100 |
100 |
100 |
|
Cu-Oxide by Assay |
5.1 |
7.7 |
7.1 |
24.7 |
3.8 |
5.7 |
3.0 |
In general terms, testwork conducted on the composited samples
provide the following as indicators of variability in the orebody:
- Copper oxide content is variable and continues at depth.
- Copper deportment to chalcopyrite increases with depth while chalcocite
and bornite contents are reduced.
- Base 2 composite has relatively high molybdenum levels when compared to
others.
- Base 2 composite has elevated CEC clay content relative to Base 1 and Base
3.
- Serpentine and talc content increases with depth (Base 3 has three times
the Mg clay content of Base 1)
- Fe and Si contents decrease with depth, while Ca and Mg contents increase.
- Calcite content increases from Base 1 to Base 3.
13.5.2 Results -
Phase 2 Flotation Testwork
XPS conducted over 104 flotation tests to investigate the
effect of primary grind size, reagents, pH modifiers, dispersants and rougher
and cleaner pulp densities in parallel with locked cycle testing. A primary
grind size of 140 μm was selected for subsequent flotation testing on all
composites.
Locked cycle tests were undertaken on Base 1, Base 2, Sub 4 and
Sub 5A. The locked cycle flotation test results are given in Table 13-9.
TABLE 13-9: XPS PHASE 2 - LOCKED CYCLE TEST RESULTS
| Sample |
Test |
Stream |
Mass
Percent |
Grade - Percent |
Distribution -
Percent |
| Cu |
Mo |
Cu |
Mo |
| Base 1 |
Float
094 Cycles 3-5 |
Feed |
100 |
0.58 |
0.012 |
100 |
100 |
| Cu Concentrate |
1.5 |
31.2 |
0.451 |
82.7 |
59.7 |
| Cu Cleaner Tail |
4.8 |
0.69 |
0.041 |
5.7 |
16.8 |
| Cu Rougher Tail |
93.7 |
0.07 |
0.003 |
11.6 |
23.6 |
| Base 2 |
Float
114 Cycles 4-6 |
Feed |
100 |
0.59 |
0.022 |
100 |
100 |
| Cu Concentrate |
1.7 |
22.1 |
0.394 |
64.0 |
30.1 |
| Cu Cleaner Tail |
11.0 |
0.88 |
0.070 |
16.5 |
34.7 |
| Cu Rougher Tail |
87.3 |
0.13 |
0.009 |
19.6 |
35.2 |
| Base 2 |
Float
145 Cycles 4-6 |
Feed |
100 |
0.59 |
0.022 |
100 |
100 |
| Cu Concentrate |
1.6 |
28.2 |
0.624 |
74.7 |
44.6 |
| Cu Cleaner Tail |
10.4 |
0.30 |
0.037 |
5.3 |
17.4 |
| Cu Rougher Tail |
88.0 |
0.14 |
0.010 |
20.0 |
38.0 |
| Sub 4 |
Float
104 Cycles 4-6 |
Feed |
100 |
0.54 |
0.005 |
100 |
100 |
| Cu Concentrate |
1.0 |
31.9 |
0.198 |
61.3 |
43.3 |
| Cu Cleaner Tail |
3.1 |
0.75 |
0.009 |
4.4 |
5.7 |
| Cu Rougher Tail |
95.8 |
0.19 |
0.003 |
34.3 |
51.0 |
| Sub 5A |
Float
103 Cycles 4-6 |
Feed |
100 |
0.46 |
0.010 |
100 |
100 |
| Cu Concentrate |
1.7 |
22.6 |
0.327 |
81.6 |
54.4 |
Page 13-11
|
|
Rosemont Project |
| Form
43-101F1 Technical Report |
Sample
|
Test
|
Stream |
Mass
Percent |
Grade - Percent
|
Distribution -
Percent
|
| Cu |
Mo |
Cu |
Mo |
| Cu Cleaner Tail |
6.9 |
0.44 |
0.033 |
6.6 |
22.6 |
| Cu Rougher Tail |
91.5 |
0.06 |
0.003 |
11.8 |
22.9 |
13.6
XPS Phase 3
The XPS Phase 3 of work focused on the separation of copper and
molybdenum, investigating the flotation response of blended high-clay ore
mixtures and the effect of calcium rich water on flotation behavior.
13.6.1
Copper-Molybdenum Separation Testwork
Copper-Molybdenum separation testwork was of necessity
constrained by the limited sample available, a consequence of the relatively
small quantity of Cu/Mo concentrate available for testwork. Subsequent
paragraphs will describe general conclusions that may be drawn from the
copper-moly testwork that has been completed, and suggests some additional work
that may be required during project execution and operational phases of the
Project.
Stored cleaner 1 concentrate from XPS Phase 2 tailings
generation work was upgraded to produce a copper-molybdenum bulk concentrate
suitable for copper-molybdenum separation. Application of three additional
stages of cleaning raised the copper grade to 35.8%, 40.6% and 41.4% copper,
respectively.
The copper cleaner 4 concentrate, or copper molybdenum bulk
concentrate, was split for assays, mineralogical analysis, a scoping separation
test and the remainder used for the copper molybdenum demonstration test.
To depress the copper minerals, the pH of the bulk concentrate
was elevated to pH 12 with lime and then treated with sodium hydrosulfide
(NaHS). Unfortunately for this phase of the testwork, there was not enough
molybdenum rougher concentrate to do more than a single stage of molybdenum
cleaning.
13.6.2
Observations & Discussion
While the results above suggest that additional stages of
cleaning may be required to produce an acceptable bulk copper concentrate,
subsequent analysis has demonstrated that acceptable CuMo concentrate grades can
be achieved by applying staged flotation reactor (“SFR”) flotation technology in
the bulk cleaner circuit flowsheet. SFR flotation cells have been proven to
achieve recovery rates equivalent to or better than conventional flotation cells
while realizing exceptionally high upgrade ratios. This performance is
accomplished though separating the three phases of flotation (particle
collection, bubble disengagement, and froth recovery) into different zones such
that each phase can be optimized independent of the others. To further enhance
upgrading performance, under-froth dilution/wash water can be applied in the
froth recovery unit to significantly improve gangue rejection from the concentrate product. Accordingly, the incorporation of
SFR flotation technology in the flotation circuit design supersedes the need for
additional stages of cleaning.
Page 13-12
|
|
Rosemont Project |
| Form
43-101F1 Technical Report |
13.6.3 Results –
Phase 3 Copper – Moly Separation
The results from this test are shown in Table 13-10.
TABLE 13-10: XPS PHASE 3 - MOLYBDENUM SEPARATION TEST
|
|
Mass %
|
Grades |
Recovery |
Cu
% |
Mo
% |
MgO
% |
Cu
% |
Mo
% |
MgO
% |
|
Mo Cleaner Concentrate |
0.4 |
3.45 |
30.7 |
5.38 |
0.0 |
38.5 |
7.8 |
|
Mo Rougher Concentrate |
1.5 |
19.4 |
18.0 |
4.48 |
0.7 |
79.6 |
22.8 |
|
Mo Rougher Tails |
98.5 |
41.2 |
0.07 |
0.23 |
99.3 |
20.4 |
77.2 |
|
Cleaner 4 Concentrate (Recalculated) |
100.0 |
40.9 |
0.34 |
0.29 |
- |
- |
- |
Copper was depressed producing a molybdenum concentrate of
30.7% molybdenum upgraded from 18% and 0.34% molybdenum in the molybdenum
rougher concentrate and bulk concentrate respectively. This corresponds to 79.6%
molybdenum recovery from the bulk concentrate to the molybdenum rougher
concentrate and 38.5% molybdenum recovery to the molybdenum cleaner. Additional
cleaning stages were not pursued in this program due to the small sample size
available.
13.6.4 Flotation
of Composite Blends and Water Testwork
Blends were made up of clean ore (“Sub 6”), swelling-clay ore
(“Sub 5A”) and magnesium-clay ore (“Sub 5B”) to determine if the blends behaved
as the sum of the components. Additionally, one test was conducted with calcium
saturated water. This water was used in all stages of grinding and flotation for
Float 158, which was otherwise identical to the fresh water equivalent test in
Float 150. The results are summarized in Table 13-11 and
Table 13-12.
TABLE 13-11: XPS PHASE 3 - FLOTATION BLENDS TEST
RESULTS
|
Test |
Sub 6 |
Sub 5A |
Sub 5B |
Rougher |
Cleaner 1, 2 |
Overall Circuit |
| R%Cu |
%Cu |
R%Cu |
%Cu |
R%Cu |
%Cu |
|
Float 105 |
100 |
- |
- |
92.0 |
16.6 |
93.9 |
29.3 |
86 |
29.3 |
|
Float 093 |
- |
100 |
- |
90.4 |
3.7 |
77.3 |
22.1 |
70 |
22.1 |
|
Float 121 |
- |
- |
100 |
75.8 |
1.7 |
74.4 |
24.3 |
56 |
24.3 |
|
Float 150 |
75 |
25 |
- |
88.4 |
8.7 |
94.1 |
28.7 |
83 |
28.7 |
|
Prediction |
75 |
25 |
- |
91.6 |
9.4 |
90.2 |
27.6 |
83 |
27.6 |
|
Float 149 |
75 |
- |
25 |
88.8 |
4.7 |
70.5 |
24.5 |
63 |
24.5 |
|
Prediction |
75 |
- |
25 |
87.8 |
5.7 |
89.5 |
28.2 |
79 |
28.2 |
|
Float 151 |
75 |
12.5 |
12.5 |
86.7 |
6.2 |
70.7 |
27.3 |
61 |
27.3 |
|
Prediction |
75 |
12.5 |
12.5 |
89.7 |
7.1 |
89.9 |
27.9 |
81 |
27.9 |
|
Float 152 |
50 |
25 |
25 |
85.4 |
3.5 |
75.2 |
25.6 |
64 |
25.6 |
|
Prediction |
50 |
25 |
25 |
87.3 |
4.4 |
85.6 |
26.4 |
75 |
26.4 |
Page 13-13
|
|
Rosemont Project |
| Form
43-101F1 Technical Report |
TABLE 13-12: XPS PHASE 3 - FLOTATION WATER TEST RESULTS
|
|
Sub 6 |
Sub 5A |
Sub 5B |
Rougher |
Cleaner 1, 2 |
Overall Circuit |
| R%Cu |
%Cu |
R%Cu |
%Cu |
R%Cu |
%Cu |
|
Float 150 |
75 |
25 |
- |
88.4 |
8.7 |
94.1 |
28.7 |
83 |
28.7 |
|
Float 158* |
75 |
25 |
- |
91.0 |
10.6 |
79.7 |
29.9 |
73 |
29.9 |
* High calcium water test.
The rougher results were close but generally slightly less than
the mathematical weighted sum of the end member floats. However, cleaner results
departed from predictions for the magnesium-clay blends as well as for the
calcium-saturated float. Cleaner tests were conducted at low densities (ranging
from 4 to 18% w/w solids) leaving reagent strategy, dispersants and physical
set-up as possible mitigation factors.
13.7
BML Confirmation Testing
BML conducted a testwork program at their Kamloops laboratory
in late 2015. The main objective was to confirm the flotation process parameters
developed by XPS during the Phase 1 and Phase 2 testwork and to replicate the
locked cycle results with the Base 1 and Base 2 samples. Results of this
testwork are summarized in BML report BL065.
The test program was completed using two period composites,
Base 1 and Base 2. The main difference between these replicate tests and
previous XPS tests was the use of traditional manual froth scraping and shorter
flotation times. More specifically, tests conducted at BML were performed with
constant froth levels and a technician manually recovering froth, while the XPS
program used a mechanical froth paddle system with level manipulation to achieve
desired mass recoveries.
Further, BML locked cycle tests used three stages of cleaning
and returned the cleaner scavenger concentrate and cleaner 2 tail to cleaner 1
rather than regrind as these streams should already be sufficiently reground.
The basic parameters of the XPS flowsheet were confirmed for
Base 1, however, BML’s Base 2 LCT grade-recovery performance was different,
producing a higher copper concentrate grade of 34.5% (versus 28.2%) and lower
copper recovery of 63.8% (versus 74.7%) . Analysis of these results suggests
that they are essentially different points on the same grade-recovery curve.
13.8
BML Production Period Testwork
In early 2016, production period samples, based on the
131-million tons/y mine plan developed for Hudbay by Independent Mining
Consultants (“IMC”) in November 2015, were bench tested for additional
metallurgical and project engineering data. The purpose of this program was to
add detail to the prior metallurgical testwork results in key areas in order to
improve confidence in recovery and concentrate quality forecasts, as well as for
sizing downstream process equipment, most notably the tailing dewatering and filtration equipment necessary to
accomplish the drystack tailing deposition strategy. Results of this testing
program are recorded in BML report BL076.
Page 13-14
|
|
Rosemont Project |
| Form
43-101F1 Technical Report |
A program of batch and locked cycle testing was performed using
the previously developed flowsheet and basic reagent scheme. In addition, SFR
rougher pilot testing was done in parallel to the bench testing. Due to wall
effects of the small SFR pilot units, the results of the pilot plant rougher
tests fell short of bench test (conventional) results, thus SFR cells were not
incorporated in the rougher flotation circuit design.
As noted previously, these “period composites” are not strictly
accurate when referenced to the new 2016 Mine Plan; regardless, given the strong
correlation of copper recovery to the sulfide copper component of the ore,
moderate shifting of period composites in terms of production phase are not
expected to materially impact the recovery conclusions.
TABLE 13-13: PRODUCTION COMPOSITES
|
Composite |
Years |
Grade |
Acid Soluble Cu |
| %Cu |
%Mo |
ASCu/TCu, % |
|
Period |
1 1 – 3 |
0.54 |
0.013 |
9 |
|
Period |
2 4 – 6 |
0.48 |
0.013 |
13 |
|
Period |
3 7 - LOM |
0.72 |
0.018 |
13 |
13.8.1 Production
Period Mineralogy
The feed sample mineral content was analyzed by SEM-EDX and XRD
and the results presented in Table 13-14.
TABLE 13-14: BML MINERAL CONTENT
|
|
SEM-EDX |
XRD |
|
Mineral |
Period 1 |
Period 2 |
Period 3 |
Period 1 |
Period 2 |
Period 3 |
|
Chalcopyrite |
0.39 |
0.44 |
0.59 |
|
|
|
|
Tetrahedrite |
0.01 |
0.01 |
0.02 |
|
|
|
|
Bornite |
0.21 |
0.29 |
0.61 |
|
|
|
|
Chalcocite/Covellite |
0.07 |
0.13 |
0.29 |
|
|
|
|
Other Copper |
0.01 |
0.00 |
0.05 |
|
|
|
|
Sphalerite |
0.04 |
0.05 |
0.07 |
|
|
|
|
Arsenopyrite |
0.00 |
0.01 |
0.00 |
|
|
|
|
Pyrite |
0.26 |
0.28 |
0.60 |
|
|
|
|
Molybdenite |
0.00 |
0.00 |
0.02 |
|
|
|
|
Fluorite |
0.1 |
0.1 |
0.1 |
|
|
|
|
Apatite |
0.1 |
0.2 |
0.1 |
|
|
|
|
Carbonates |
7.3 |
16 |
16 |
11 |
21 |
20 |
|
Oxides |
0.4 |
0.5 |
0.5 |
|
|
|
|
Quartz |
25 |
12 |
12 |
18 |
9 |
10 |
|
Feldspars |
16 |
18 |
15 |
18 |
17 |
17 |
|
Mica |
1.5 |
2.1 |
1.8 |
0.0 |
2.5 |
1.5 |
|
Pyroxene |
22 |
23 |
24 |
20 |
19 |
20 |
|
Clays |
0.2 |
05 |
0.4 |
7.0 |
7.2 |
8.4 |
|
Olivine |
0.0 |
0.1 |
0.1 |
|
|
|
|
Talc |
0.1 |
0.7 |
0.3 |
|
|
|
Page 13-15
|
|
Rosemont Project |
| Form
43-101F1 Technical Report |
|
|
SEM-EDX |
XRD |
|
Mineral |
Period 1 |
Period 2 |
Period 3 |
Period 1 |
Period 2 |
Period 3 |
|
Epidote |
3.0 |
1.8 |
2.3 |
1.2 |
0.0 |
0.0 |
|
Chlorite |
0.9 |
2.4 |
3.3 |
2.3 |
0.0 |
3.8 |
|
Garnet |
19 |
10 |
16 |
22 |
13 |
16 |
|
Amphibole |
1.0 |
1.7 |
1.6 |
0.0 |
1.6 |
1.8 |
|
Serpentine |
0.0 |
4.0 |
2.0 |
0.0 |
4.0 |
0.8 |
|
Other minerals |
2.0 |
5.5 |
2.6 |
1.2 |
6.3 |
1.6 |
|
Total |
100.0 |
100.0 |
100.0 |
100.0 |
100.0 |
100.0 |
The chemical, mineralogical and clay analyses were performed
using the same laboratories as the previous Phase 2 test program. The swelling
clay content as determined by CEC is given in Table 13-15.
TABLE 13-15: BML CEC ANALYSIS
| Test |
Period 1 |
Period 2 |
Period 3 |
| CEC |
7.0 |
7.2 |
8.4 |
The composite samples were dominated by pyroxene, quartz,
feldspars, garnet and carbonates. Previous testwork indicated several minerals
that may affect flotation performance and include the serpentine group minerals,
swelling clays (CEC), talc and fluorine bearing minerals (apatite, fluorite and
micas). Period 1 had the lowest levels of these minerals while Period 2 had the
highest.
As determined by SEM-EDX, sulfide content ranged from 1 to 2
percent of the feed, and were for the most part copper minerals with low levels
of pyrite and trace levels of sphalerite, tetrahedrite and arsenopyrite.
The previously developed flowsheet and reagent scheme were used
as a basis in the production period test program. The primary grind size was
140µm, and small changes in reagent additions and trial of gangue dispersants
were investigated. Preliminary rougher and cleaner tests were performed prior to
executing the locked cycle tests.
13.8.2 Results of
Production Period Testwork
Rougher flotation tests indicated the addition of sodium
hexametaphosphate (“SHMP”), a dispersant/chelating agent improved control of the
non-sulfide gangue. The performance of Period composites 2 and 3 improved copper
recovery by 8 and 3 units respectively. The batch cleaner tests showed shorter
regrind time and reduced copper losses from cleaner tailings stream.
Based on BML results, the locked cycle tests averaged 97%
recovery of the sulfide copper in the roughers and 93.7% copper recovery in the
cleaners. Concentrate grade varied from 32% for Period 1, 34% for Period 2 and
38% for Period 3. The locked cycle test results for the Period composites
together with the XPS replicate testing done previously at BML is given in Table
13-16.
Page 13-16
|
|
Rosemont Project |
| Form
43-101F1 Technical Report |
TABLE 13-16: BML LOCKED CYCLE TEST RESULTS
| Sample |
Test
|
Stream |
Mass
Percent |
Grade - Percent |
Distribution - Percent
|
| Cu |
Mo |
Cu |
Mo |
| Base 1 |
Float
011
Cycles D+E |
Feed |
100 |
0.58 |
0.012 |
100 |
100 |
| Cu Concentrate |
1.2 |
36.5 |
0.298 |
78.5 |
32.2 |
| Cu Cleaner Tail |
7.1 |
0.79 |
0.046 |
9.7 |
28.0 |
| Cu Rougher Tail |
91.7 |
0.08 |
0.005 |
11.9 |
39.8 |
| Base 2 |
Float
012
Cycles D+E |
Feed |
100 |
0.61 |
0.022 |
100 |
100 |
| Cu Concentrate |
1.2 |
32.7 |
0.586 |
64.0 |
32.0 |
| Cu Cleaner Tail |
12.6 |
0.44 |
0.029 |
9.1 |
16.9 |
| Cu Rougher Tail |
86.2 |
0.19 |
0.013 |
26.9 |
51.0 |
| Base 2 |
Float
014
Cycles D+E |
Feed |
100 |
0.60 |
0.022 |
100 |
100 |
| Cu Concentrate |
1.1 |
34.5 |
0.558 |
63.8 |
28.0 |
| Cu Cleaner Tail |
10.3 |
0.56 |
0.035 |
9.6 |
16.1 |
| Cu Rougher Tail |
88.5 |
0.18 |
0.014 |
26.6 |
55.8 |
| Period 1 |
Float
Avg. 20,23,26
Cycles D+E |
Feed |
100 |
0.53 |
0.011 |
100 |
100 |
| Cu Concentrate |
1.5 |
31.9 |
0.620 |
90.4 |
82.7 |
| Cu Cleaner Tail |
3.7 |
0.45 |
0.013 |
3.1 |
4.3 |
| Cu Rougher Tail |
94.8 |
0.037 |
0.002 |
5.9 |
13.0 |
| Period 2 |
Float
Avg. 21,24,27
Cycles D+E |
Feed |
100 |
0.48 |
0.011 |
100 |
100 |
| Cu Concentrate |
1.05 |
33.9 |
0.497 |
73.1 |
48.8 |
| Cu Cleaner Tail |
4.3 |
1.03 |
8.7 |
6.6 |
9.5 |
| Cu Rougher Tail |
94.6 |
0.093 |
0.005 |
18.2 |
41.6 |
| Period 3 |
Float
Avg. 22,25,28
Cycles D+E |
Feed |
100 |
0.73 |
0.016 |
100 |
100 |
| Cu Concentrate |
1.45 |
37.6 |
0.625 |
75.0 |
57.0 |
| Cu Cleaner Tail |
4.1 |
1.24 |
0.024 |
7.1 |
6.4 |
| Cu Rougher Tail |
94.4 |
0.14 |
0.006 |
18.0 |
36.6 |
13.9
Concentrate Quality
Fluorine is a deleterious element identified in Rosemont copper
concentrates. Fluorine levels in copper concentrate above 350-400 ppm typically
incur a penalty, with concentrates often rejected by smelters at fluorine levels
greater than 900-1,000 ppm.
To mitigate the risk of copper concentrate rejection in the
event of higher than normal fluorine levels, the maximum design fluorine grade
in concentrate is 800 ppm. Cleaner flotation tests show that upgrading the
concentrate rejects entrained fluorine. Available fluorine assays from locked
cycle test of 8 concentrate samples are summarized in Figure 13-2. Four of these
tests were carried out with only two stages of cleaning; the results suggest
that additional cleaning tends to improve copper grade and decrease fluorine
levels.
Page 13-17
|
|
Rosemont Project |
| Form
43-101F1 Technical Report |
FIGURE 13-2: LCT FINAL CONCENTRATE FLUORINE LEVELS
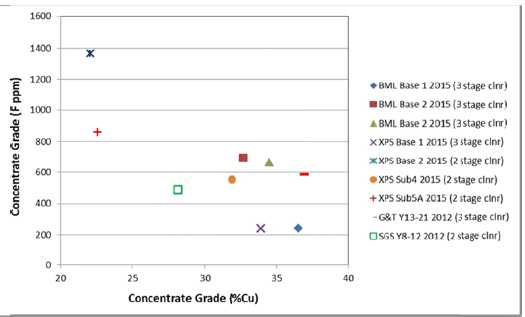
The LCT results show that fluorine can be managed to acceptable
levels (less than 800 ppm) with the use of two stage cleaning and froth washing.
Good results were achieved with the Base 1 (Year 1-5) composite. Fluorine levels
tended to be higher for later period composites.
Testing of concentrates also indicated that other common
contaminants, such as arsenic and mercury, were found in concentrations
sufficiently low to not warrant concern.
Given the presence of secondary copper sulfides and the need to
produce a higher grade concentrate to reject fluorine, final concentrate grades
may vary y from 30-38% Cu. Nominal concentrate grades of 32% Cu for Years 1-5
and 33% Cu for Years 6-LOM were selected for equipment sizing. Operating
assumptions included in the mill production model utilize concentrate grades of
32% Cu for operating years 1 through 3, 34% in year 4, and 35% in year 5 and
beyond on the basis of expected increase in requirement to reject fluorine from
concentrate.
13.10
Tailings Dewatering
Tailings samples were generated by XPS to be tested by Andritz,
Bilfinger, FLSmidth (FLS), Outotec and Pocock for water separation and recovery
from tailing prior to deposition in the DSTF. As expected, clay content and size
distribution has a significant effect on tailings dewatering. The samples with
lower clay content (Base 1 and Sub 4) generally achieved the highest thickener
underflow densities. As expected, specific high clay samples (Sub 5A and Sub 5B)
achieved lower densities across most tests.
On average, the high compression thickener tests achieved
underflow densities 3%–4% higher than the high rate thickening tests. Generally,
high rate thickeners could be expected to achieve an underflow density of 65%
for lower clay content ore, while high compression thickeners could be expected to achieve an underflow density up to 65% even for
higher clay content ore (Sub 5A and Sub 5B).
Page 13-18
|
|
Rosemont Project |
| Form
43-101F1 Technical Report |
A solids loading rate of 0.6 ton/m2/h was sufficient
to achieve the target underflow density and samples achieved an overflow clarity
lower than 200 ppm based on dynamic thickening testwork.
Tailings Proctor compaction testwork indicated the maximum
moisture criteria to achieve compaction of 15.2% (equivalent to a
dry-weight-basis moisture of 18%). The target moisture for tailings filtration
was therefore deemed to be 15%.
A key outcome from the filtration testwork was that membrane
filters can achieve lower moisture content at higher machine throughputs
compared to the chamber, or recessed plate, filter press. The 15% moisture
target was generally achieved after one minute with membrane filters. Increasing
feed pressure and air blowing times generally improved the results.
The tailings material produced during the Period composite
testing was sent for filtration and thickening tests. Together with the previous
filtration results, the laboratory filtration rates were scaled to industrial
sized filter criteria (pressure, mechanical time, filtering area, etc.) to
determine the number of filters required in the engineering design. Filter
sizing and counts considered the anticipated clay content as a component of mill
feed according to the mine plan, and as determined by the resource clay proxy
model.
13.11
Recovery Estimates
On the basis of the body of testwork that exists, including
both the historical testwork, and the testing programs completed by Hudbay since
the acquisition of Rosemont in 2014, forecasts of recovery, concentrate grade
and quality, as well as characteristics of the resultant tailing product have
been developed. The following paragraphs summarize the best estimate of these
criteria.
13.11.1 Copper
(Cu)
The results from the XPS Phase 1 and 2 and BML Replicate and
Period testing as well as prior locked cycle tests (LCTs) confirmed there is a
strong relationship between copper recovery and the content of oxide copper in
the feed, as determined by acid soluble assay. Overall, rougher flotation
recoveries of the copper sulfide component of the feed averaged 96.5%, and
cleaner flotation recoveries averaged 93% of the copper sulfide component. The
results from the various test programs were consolidated and modelled and
resulted in the following equation to forecast recovery of copper as a function
of total and ASCu in the feed:
Copper Recovery (%) = (1-ASCu:TCu) x
90
Overall copper recovery corresponding to the 2016 mine plan
presented in this report is summarized in TABLE 13-17,
expressed as percent of TCu:
Page 13-19
|
|
Rosemont Project |
| Form
43-101F1 Technical Report |
TABLE 13-17: PRODUCTION RECOVERY PROFILE
|
|
Production Years |
|
|
1−5 |
6−10 |
11−15 |
16−LOM |
1−LOM |
|
Head Grade %Tcu |
0.53% |
0.53% |
0.39% |
0.28% |
0.45% |
|
Ratio %AsCu |
10.0% |
8.6% |
12.0% |
15.2% |
10.6% |
|
Copper Recovery |
81% |
82% |
79% |
71% |
80% |
Note: Based on Mine Plan RP16AUG Mine Plan
13.11.2 Molybdenum
(Mo)
The ability to fully characterize molybdenum recoveries has
been hampered because of limited sample availability on which to conduct
testing. Nevertheless, a reasonable effort has been made to forecast molybdenum
recoveries and molybdenum concentrate quality.
The limited XPS and BML copper-molybdenum separation testing
provides the basis for the viability of producing separate molybdenum
concentrate. In the production year composites, the Mo recovery into the Cu/Mo
concentrate ranged as follows:
- Period 1 Composites: 83%
- Period 2 Composites: 49%
- Period 3 Composites: 62.8%
The Cu/Mo separation testing into Mo rougher concentrate
reported Mo recoveries of 94% with 92% of the Cu reporting to the tails or Cu
concentrate. A Mo separation circuit recovery factor of 90% was applied to the
period sample bulk recoveries to estimate overall recovery of Molybdenum as
follows;
| Production Period
|
|
Mo
Recovery |
|
| |
|
|
|
| Period 1 (Yrs. 1-3) |
|
74.4% |
|
| |
|
|
|
| Period 2 (Yrs. 4-6) |
|
43.9% |
|
| |
|
|
|
| Period 3 (Yrs. 7-LOM) |
|
51.3% |
|
| |
|
|
|
| LOM Average |
|
53.4% |
|
In accordance with the RP16Aug Mine Plan and corresponding mill
production schedule, the calculated Mo recovery figures were adjusted slightly
to account for expected additional losses during the initial production ramp-up
period.
Mo rougher concentrate grades were low (15%-22%) and additional
testing is recommended, especially to improve performance in the presence of
talc.
13.11.3 SILVER
(Ag)
The head samples in XPS and BML testing ranged from 4.5 -9.0
grams per ton, averaging approximately 6 grams per ton in the feed ore. The Ag
assays in the copper concentrates ranged from 260 to 460 grams per ton averaging
323 grams per ton. There were no assays performed on the tails, the Ag recovery
is estimated based on feed and concentrate mass and assays.
Page 13-20
|
|
Rosemont Project |
| Form
43-101F1 Technical Report |
The 2016 production schedule developed by Hudbay processes ore
with an average Ag content of 0.16 troy ounces/ton or 5.4 g/ton, similar to the
test composite samples. Given an estimated Ag grade of the Cu concentrate of 323
g/ton (average test composite assays) the average recovery is:
Average Ag Recovery LOM =
74.4%
13.11.4 GOLD
(Au)
Similarly to the silver, gold recovery can be estimated based
using ore feed and concentrate grades as there are no tails assays.
The head samples in the XPS and BML testing ranged from 0.03
-0.05 grams per ton, averaging approximately 0.04 grams per ton in the ore feed.
The Au assays in the copper concentrates ranged from 1.1 to 2.8 g/ton, averaging
2.1 g/ton. Similar to the Ag recovery, the gold recovery estimate is based on
feed and concentrate assays;
Average Au Recovery LOM =
65.1%
However, gold had not been systematically assayed in all the
drill holes and is therefore not part of the 2016 resource estimate.
Nevertheless, 66 drill holes were assayed for gold, representing 17% of all the
assaying conducted on the property. A geostatistical analysis was performed on
the drill holes with gold results and has shown good similitude between the gold
grade assayed in the drill holes and the gold grade assayed in the metallurgical
tests heads.
13.12
Conclusions and Recommendations
The following paragraphs summarize, on the basis of the
preceding narrative describing both the historical metallurgical testing
programs, as well as the programs completed by Hudbay in the time since
acquiring the Project. These recommendations will serve as the basis for the
production phase recovery criteria that will drive inputs into the economic
model for the Project.
Principal conclusions:
| |
1) |
Despite the work of Augusta and the extensive work of
Hudbay on matters of lithology and ore type, as well as to associate
recoveries by ore type, the overwhelming evidence of the testwork, both
past and present is that recovery is driven primarily by the component of
soluble copper in the ore sample. When the grade of the sample is
discounted by the amount of oxide ore in the sample, recovery of the
remaining copper in sulfide minerals is 90%. |
| |
2) |
While lithology appears not to control to any significant
degree the recovery of sulfide copper, it does appear to influence
molybdenum recovery and more importantly grade of molybdenum
concentrate. |
| |
3) |
Contaminants (Fluorine) may affect concentrate quality,
but subsequent testwork, completed late in the period of time that Hudbay
has been evaluating this project suggests that
fluorine can be controlled in copper concentrate through flotation
equipment selection and operational strategies in a way that minimizes
concerns with respect to concentrate quality over the life of the
mine. |
Page 13-21
|
|
Rosemont Project |
| Form
43-101F1 Technical Report |
| |
4) |
Clay in the ore with high concentrations was shown to
have a detrimental effect on flotation performance under standard
conditions, however, altering conditions (reducing pulp density,
dispersing agent addition) was shown to counteract the negative effects.
On average, clay content in the ore is expected to remain below
concentrations that could result in reduced metal recovery, and when
elevated clay contents are encountered, mitigating operational strategies
in the process and blending strategies in the mine can be invoked if
necessary to offset any negative effects. |
| |
5) |
The tailing properties have been sufficiently
characterized as well as the dewatering performance of vendor equipment
over the life of the operation to satisfy the estimated number, type and
size of tailing filters for this Project. To be conservative, expansion
space has been allocated for additional filtering equipment, to the extent
that it may be necessary. |
13.13 Discussion and Recommendations
While the production period composites used in the latter
stages of the testwork campaign are no longer an exact match for the operating
years they were intended to represent due to recent changes to the mine plan,
the test results are nonetheless representative of changes in ore conditions as
mining progresses deeper into the deposit.
It is recommended that efforts continue in seeking to utilize
the extensive geometallurgical database to identify trends and metallurgical
indicators that can inform and optimize production plans.
There is ample information in the database regarding serpentine
group minerals, but not specifically for talc. There remains some uncertainty
for Molybdenum production with respect to the occasional presence of talc in
test samples and its potential to interfere with the production of saleable Mo
concentrate. It is recommended to study the occurrence of talc in the deposit to
better understand the potential effects on Mo production.
Although it has been concluded that fluorine can be readily
rejected from copper concentrate, further study is recommended to develop
understanding of ore conditions and indicators that trigger elevated fluorine
content in concentrate.
Page 13-22
|
|
Rosemont Project |
| Form
43-101F1 Technical Report |
14 MINERAL
RESOURCE ESTIMATE
Hudbay prepared a 3D block model of the Rosemont deposit using
MineSight® version 11.00 -3, an industry standard commercial software that
specializes in geologic modelling and mine planning. A Lerchs-Grossman (“LG”)
cone algorithm was applied to the block model to establish the component of the
deposit that has a “reasonable prospect of economic extraction”. The 3D block
model and determination of the mineral resources at the Rosemont deposit were
performed by Hudbay personnel following Hudbay procedures. The work was reviewed
and approved by Cashel Meagher, P.Geo., Chief Operating Officer for Hudbay,
Qualified Person and author of this Technical Report.
14.1
Key Assumptions of Model
As shown in Table 14-1, there are 356 drill holes totalling
approximately 510,951 feet within the Rosemont database used to support the
mineral resource estimation.
TABLE 14-1: DRILLING DATA BY COMPANY
|
Company |
Time Period |
Number of
Drill
holes |
Total
Length
(in feet) |
|
Banner (Anaconda) |
1950 - 1963 |
3 |
4,300 |
|
Anaconda |
1963 - 1971 |
113 |
136,838 |
|
Anamax |
1973 -1983 |
52 |
54,350 |
|
Asarco |
1988 - 1992 |
11 |
14,695 |
|
Augusta |
2005 - 2012 |
87 |
132,483 |
|
Hudbay |
2014 |
44 |
93,122 |
|
Hudbay |
2015 |
46 |
75,164 |
|
Summary |
356 |
510,951 |
The drill hole database was provided in Microsoft Excel® format
with a cut-off date for mineral resource estimate purposes of January
19th, 2016. The files were imported as collar, downhole survey and
assay data into MineSight® Version 11.00 -3.
The topographic surface is based on two LIDAR surveys performed
in 2006 (10-feet contours) and 2008 (2-feet contours) by Cooper Aerial. Drill
hole collars were compared to the topographic surface and only minor differences
(98% of < 5 feet) in elevation between drill hole collars and the surveyed
topography were found and corrected.
14.2
Wireframe Models and Mineralization
The Rosemont deposit trends approximately along an azimuth of
N020° with a general dip of 50° to the east. The Backbone Fault forms the
footwall contact along the entire length of the Rosemont deposit. Geologically,
Rosemont is a skarn deposit. Higher grade mineralization correlates with the
Horquilla, Earp (upper and lower) and, Epitaph lithologies and also with the
intensity of skarn alteration. The Rosemont deposit is continuous along a strike
length of 4,000 feet (1,200 m) in north-south direction, 3,000 feet (900 m) in an east-west direction
and to a vertical depth of approximately 2,500 feet (750 m).
Page 14-1
|
|
Rosemont Project |
| Form
43-101F1 Technical Report |
Three sets of structures were recognized, a north-northeast
trending set, an east-west trending set and a gently east dipping set. The
structures locally offset mineralization but some also appear to control
mineralization, especially the oxidation.
Interpretations of the lithology, oxidation state, fault
structures and ore types were built with Leapfrog® version 3.01 using the
structural information, core angles and geochemical proxies developed by Hudbay.
Figure 14-1 presents the Rosemont lithologies. Refer to Table 14-2 for the
lithology legend. The details regarding geochemical proxy models developed by
Hudbay to model the different lithologies and ore types can be found in section
seven of this Technical Report.
Oxidation levels of the deposit have been modelled using the
acid soluble copper to total copper ratio, where a ratio of ≥ 50% is defined as
oxide, ≥30 and <50% as mixed and <30% as sulfides as shown in Figure 14-2.
As mentioned in section seven of this Technical Report, six
different ore types, based on their level of oxidation, swelling and magnesium
clays content, are found at Rosemont. Figure 14-3 presents the Rosemont ore
types.
Page 14-2
|
|
Rosemont Project |
| Form
43-101F1 Technical Report |
FIGURE 14-1: 3D VIEW OF INTERPRETED
LITHOLOGY WIREFRAMES, LOOKING
NORTHWEST
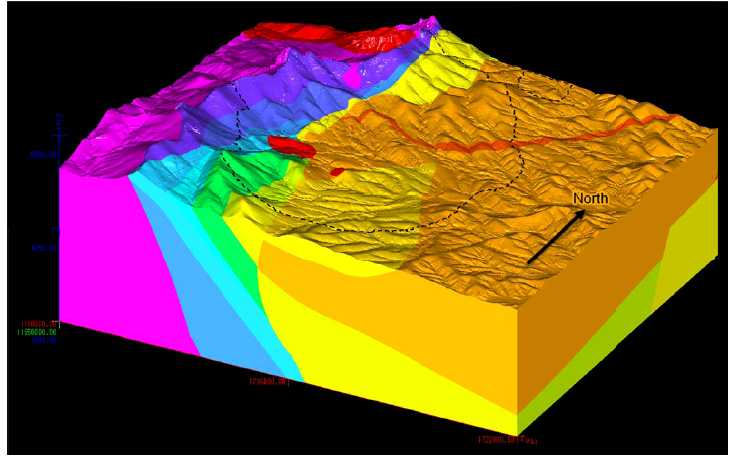
Note: Lithology colour legend is
approximately the same as that shown in Table 14-2.
Resource pit is represented by the dashed black line.
The resource pit is not indicative of the mine
plan.
Page 14-3
|
|
Rosemont Project |
| Form
43-101F1 Technical Report |
TABLE 14-2: LEGEND OF INTERPRETED WIREFRAMES
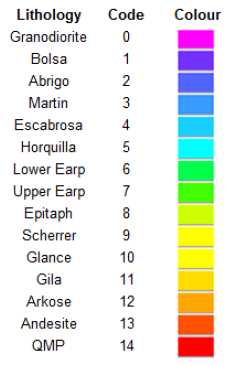
Page 14-4
|
|
Rosemont Project |
| Form
43-101F1 Technical Report |
FIGURE 14-2: 3D VIEW OF INTERPRETED
OXIDATION WIREFRAMES, LOOKING
NORTHWEST
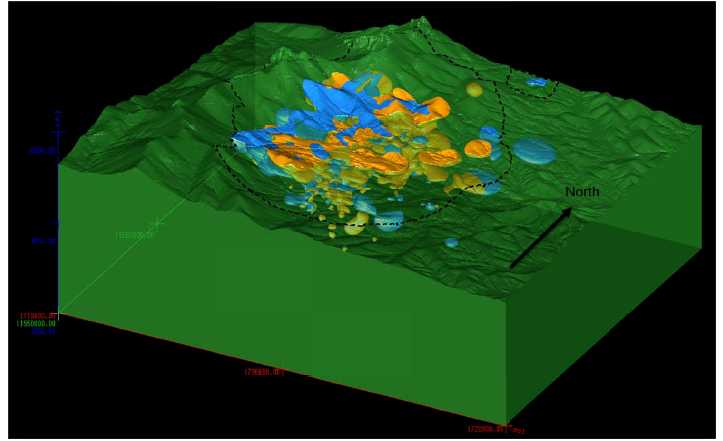
Note: Oxide in blue, Mixed in orange
and Sulfides and un-altered in green.
Resource pit is represented by the
dashed black line. The resourc e pit is not
indicative of the mine plan .
Page 14-5
|
|
Rosemont Project |
| Form
43-101F1 Technical Report |
FIGURE 14-3: EW CROSS
SECTION OF THE ORE TYPES WIREFRAMES
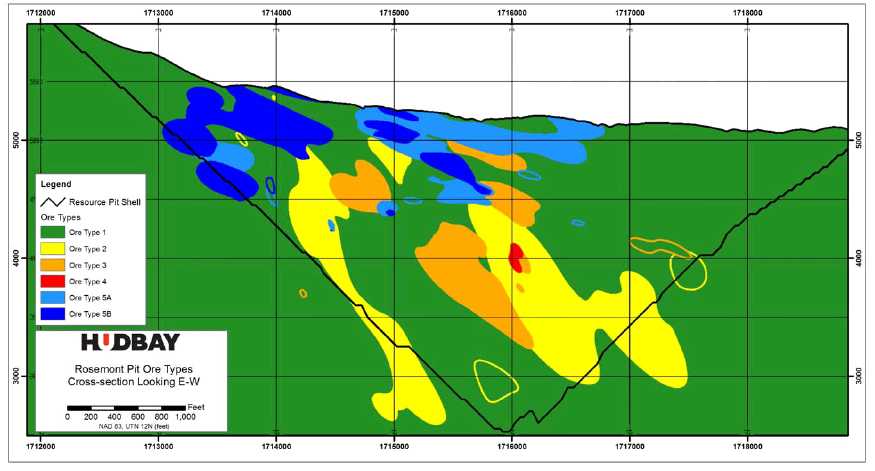
Note: Resource pit is
represented by the black line. The resource pit is
not indicative of the mine plan.
Page 14-6
|
|
Rosemont Project |
| Form
43-101F1 Technical Report |
14.3
Exploratory Data Analysis
Exploratory data analysis (“EDA”) comprised basic statistical
evaluation of the assays and composites for total copper, acid-soluble copper,
molybdenum, silver and sample length.
14.4
Assays
The Table 14-3 presents the number of samples collected and
total length anaylzed by element.
TABLE 14-3: SAMPLES AND LENGTH ANALYZED

14.4.1 Box Plots
Box plots of the basic statistics for TCu, ASCu, molybdenum
(Mo) and silver (Ag), for each lithology within the sulfide portion of the
deposit are displayed in Figure 14-4 to Figure 14-7.
These box plots confirm that most of the mineralization of
economic interest in sulfides will occur in the four main units of the lower
plate group with some high copper grade also occurring in the Andesite, Arkose
and QMP units. The minor units exhibit higher skewness in the copper sample
statistics. Molybdenum and silver statistics display a high skewness in all the
lithological units.
Page 14-7
|
|
Rosemont Project |
| Form
43-101F1 Technical Report |
FIGURE 14-4: BOX PLOTS OF
TOTAL COPPER ASSAYS IN
SULFIDES
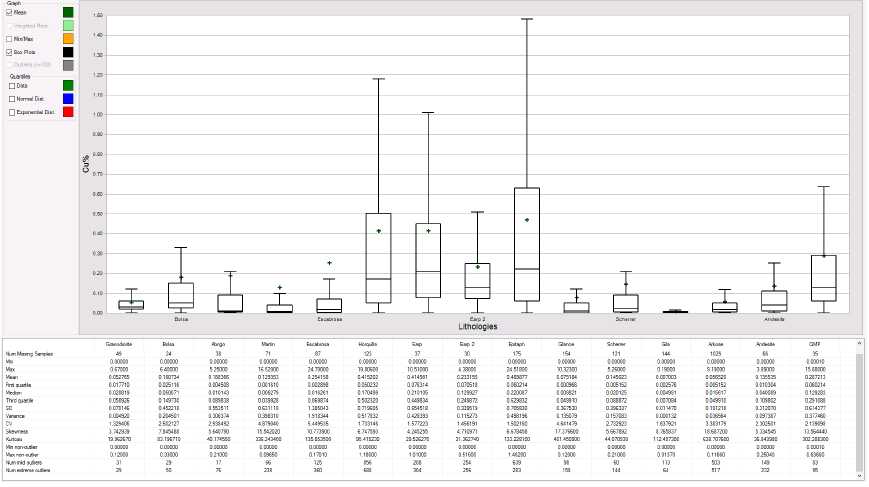
Page 14-8
|
|
Rosemont Project |
| Form
43-101F1 Technical Report |
FIGURE 14-5: BOX PLOTS OF ACID
SOLUBLE COPPER IN SULFIDES
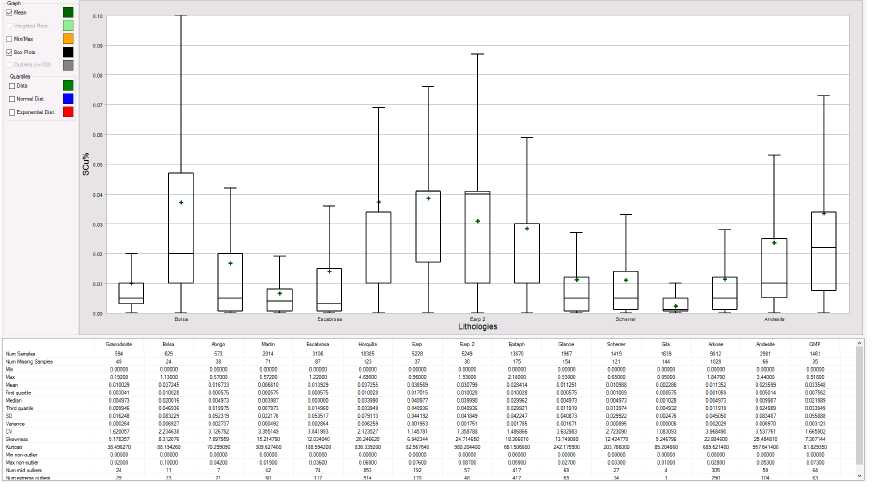
Page 14-9
|
|
Rosemont Project |
| Form
43-101F1 Technical Report |
FIGURE 14-6: BOX PLOTS OF
MOLYBDENUM ASSAYS IN SULFIDES

Page 14-10
|
|
Rosemont Project |
| Form
43-101F1 Technical Report |
FIGURE 14-7: BOX PLOTS OF
SILVER ASSAYS IN SULFIDES
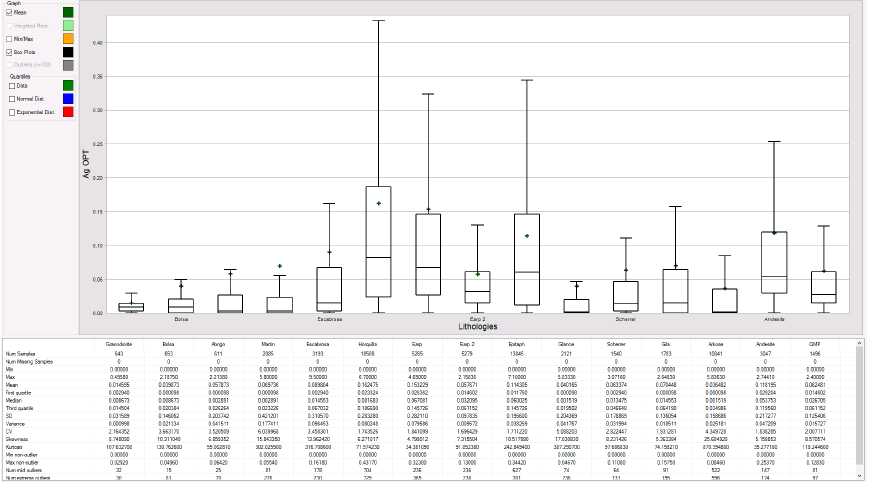
Page 14-11
|
|
Rosemont Project |
| Form
43-101F1 Technical Report |
14.4.2 Grade
Capping
Since most of the lithological units show a high skewness in
the statistical distribution of the metal grade, length weighted, log-scaled
probability plots and deciles analysis of the assays were used to define grade
outliers for TCu, ASCu, molybdenum (Mo) and silver (Ag) within each of the
separately evaluated domains. The capping thresholds are shown below in Table
14-4.
TABLE 14-4: CAPPING THRESOLDS BY LITHOLOGY
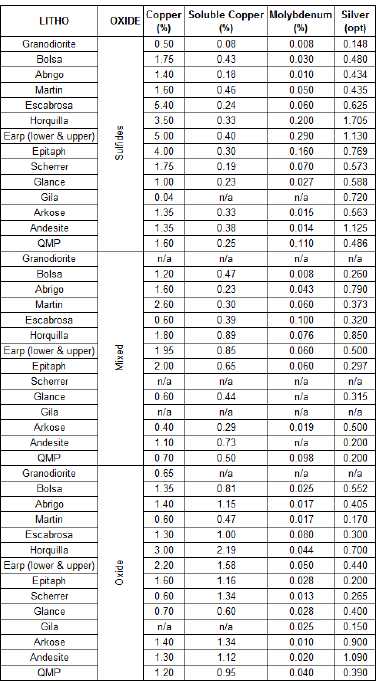
Page 14-12
|
|
Rosemont Project |
| Form
43-101F1 Technical Report |
14.4.3 Assay
Statistics
Exploratory data analysis of assay statistics are summarized by
uncapped and capped grades in Table 14-5, Table 14-6, Table 14-7 and Table 14-8.
Since the earlier drill programs were mostly focused on copper, not all samples
were analyzed for Mo and Ag and the exploratory data analysis shows fewer assays
for these metals. There are a total of 9,174 samples with missing molybdenum
assays and 21,578 missing silver assays. Capping was completed on the assays
prior to compositing.
TABLE 14-5: ASSAY STATISTICS FOR TOTAL COPPER BY LITHOLOGY IN
SULFIDES
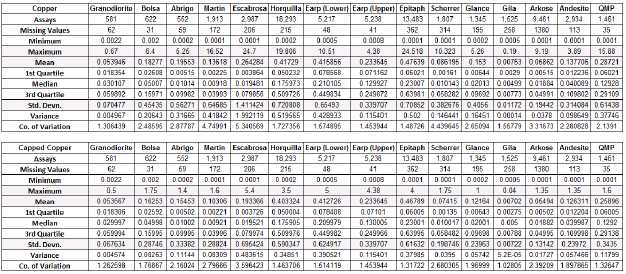
TABLE 14-6: ASSAY STATISTICS FOR ACID SOLUBLE COPPER BY
LITHOLOGY IN SULFIDES
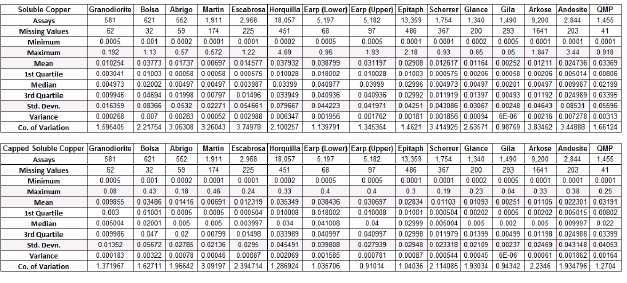
Page 14-13
|
|
Rosemont Project |
| Form
43-101F1 Technical Report |
TABLE 14-7: ASSAY STATISTICS FOR MOLYBDENUM BY LITHOLOGY IN
SULFIDES
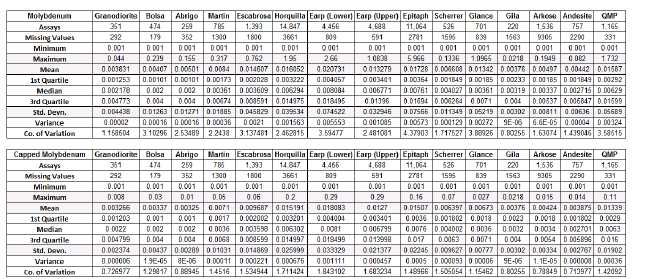
TABLE 14-8: ASSAY STATISTICS FOR SILVER BY LITHOLOGY IN
SULFIDES
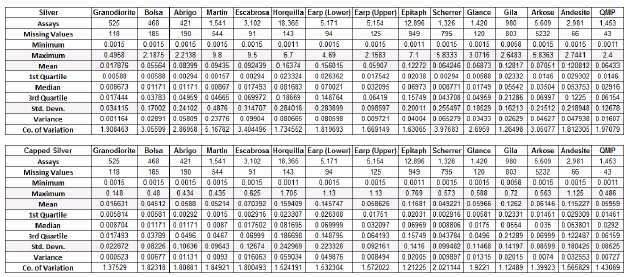
Page 14-14
|
|
Rosemont Project |
| Form
43-101F1 Technical Report |
14.4.4 Scatter
Plots, Regression Analyses, Grade Adjustments and Analysis of Gold
Exploratory data analysis of assay scatter plots were examined
between TCu, ASCu, molybdenum (Mo) and silver (Ag).
14.4.4.1 Silver Adjustment
The scatter plot for silver against total copper is shown in
Figure 14-8.
FIGURE 14-8: SCATTER PLOT OF CAPPED SILVER AND CAPPED COPPER,
ALL LITHOLOGY DOMAINS

The scatter plot shows a relatively poor correlation
(correlation coefficient of 0.58) between total copper and silver when looking
at all the data. Better correlations were found when filtering by lithology and
oxidation state. A reduction-to-major-axis (“RMA”) regression analyses was
performed on silver against total copper for all the lithologies. Missing silver
assays were assigned silver grades using the regression formula with copper
grades when the correlation coefficient was above 0.7. The regression parameters
used in the formula y = mx + b for assays within each lithology domain are
tabulated in Table 14-9. Where the correlation coefficients were inferior to
0.7, missing silver values were replaced by zero as a conservative approach.
Page 14-15
|
|
Rosemont Project |
| Form
43-101F1 Technical Report |
TABLE 14-9: ASSAY RMA REGRESSION PARAMETERS, SILVER AGAINST
COPPER
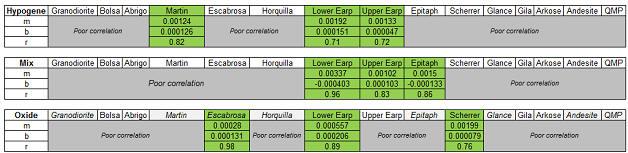
Note: Regression parameters shown above using the formula y =
mx + b. Slope is given by standard deviation silver / standard deviation of
total copper.
14.4.4.2 Molybdenum Adjustment
In regards to the relationship between copper and molybdenum,
the scatter plot of molybdenum against copper shows a poor correlation
(correlation coefficient of 0.09) as shown in Figure 14-9. Given the poor
correlation, no effort was made to calculate RMA equations.
FIGURE 14-9: SCATTER PLOT OF CAPPED MOLYBDENUM AND CAPPED
COPPER, ALL LITHOLOGY DOMAINS

A bias in historical molybdenum assays analysed by Wet
geochemical and X-ray analytical methods has been observed. As a result of the
poor correlation between copper and molybdenum, no regression could be applied
to the assays. Instead, two correction factors were applied to the affected
historical assays, as described in Section 11 of this Technical Report. The
formulas are given below:
Mo (corrected) = Mo (Wet) x 0.85
Mo (corrected) = Mo (X-ray) x 0.45
Page 14-16
|
|
Rosemont Project |
| Form
43-101F1 Technical Report |
Figure 14-10 presents the QQ plot between the original and the
corrected molybdenum grade.
FIGURE 14-10: QQ PLOT OF ORIGINAL MOLYBDEMUM GRADE VERSUS
CORRECTED MOLYBDENUM GRADE
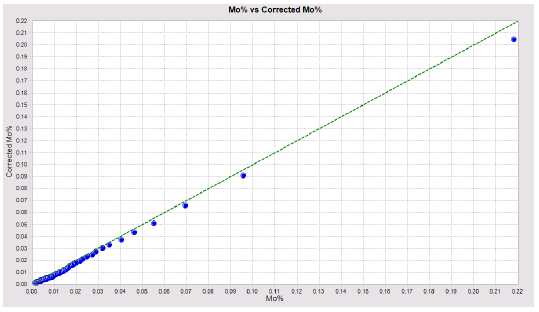
14.4.4.3 Preliminary Analysis of Gold
Out of the 356 drill holes within the Rosemont database, only
66 drill holes were analyzed for gold, which representing only 17% of all the
assaying conducted on the property. Table 14-10 presents the basic statistics of
the drill data by company, while Figure 14-11 to Figure 14-13 present the box
plots per lithology and oxidation state. Refer to Table 14-2 for the code
equivalency.
TABLE 14-10: DRILLING DATA BY COMPANY
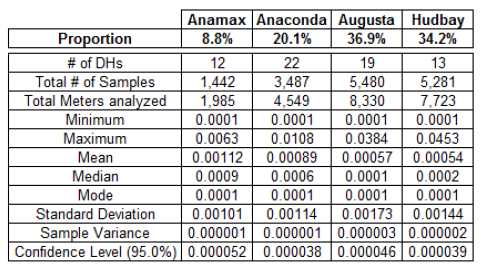
Page 14-17
|
|
Rosemont Project |
| Form
43-101F1 Technical Report |
FIGURE 14-11: BOX PLOT OF GOLD IN OXIDE
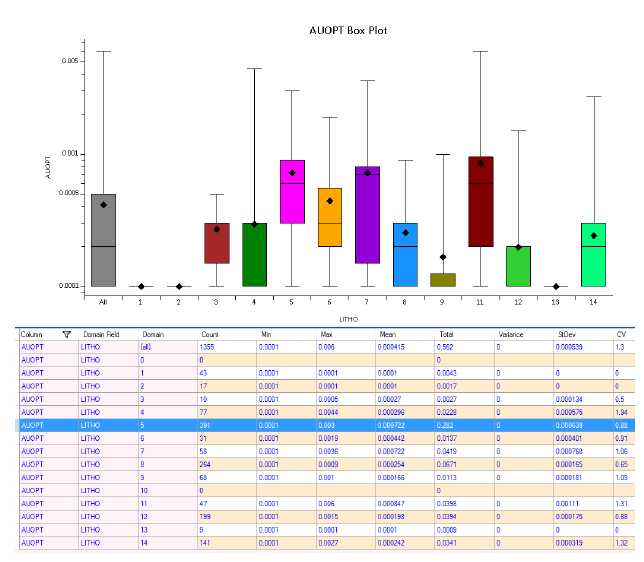
Page 14-18
|
|
Rosemont Project |
| Form
43-101F1 Technical Report |
FIGURE 14-12: BOX PLOT OF GOLD IN MIX
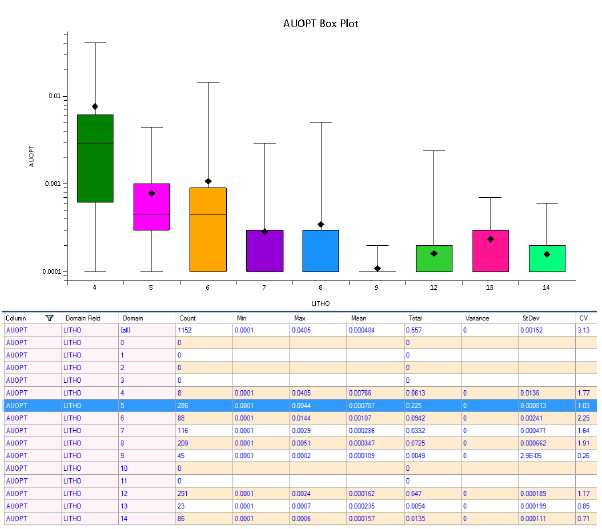
Page 14-19
|
|
Rosemont Project |
| Form
43-101F1 Technical Report |
FIGURE 14-13: BOX PLOT OF GOLD IN HYPOGENE
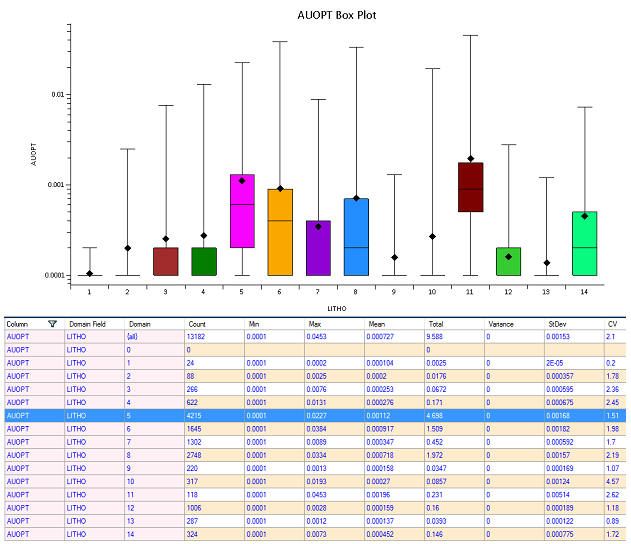
In order to evaluate the global gold content of the Rosemont
deposit, assay intervals were regularized by compositing drill hole data. The 25
ft intervals (+/- 12.5 feet of threshold) were composited using “honor geology”
from the coded drill hole file. Once composited, oxidation levels were coded
into the composite file.
For bias assessment purposes, assay intervals were also
composited into 50 ft lengths (+/- 25 feet of threshold) using the same
methodology. The 50 ft composites were used to estimate nearest neighbor
models.
Down-the-hole and directional correlograms of gold were
calculated using SAGE® software. However, given the limited number of pairs, the
correlograms structures were found to be too erratic to produce meaningful
variogram parameters. When directional correlograms were valid, the range
continuity of the gold structures extended between 200 ft to 400 ft.
Page 14-20
|
|
Rosemont Project |
| Form
43-101F1 Technical Report |
The preliminary gold grade estimation was completed on the 25ft
length composites using Inverse-Distance-Squared (“IDW”) grade interpolation
method and three passes with increasing requirements using a composite and block
matching system based on the lithology and oxidation codes.
The preliminary gold grade estimation was validated to ensure
appropriate honoring of the input data. Nearest-neighbor (NN) from 50 ft
composites was used to validate the IDW. Overall, no significant differences
were observed.
Even though the gold grade estimation is well-constrained by
three-dimensional wireframes representing geologically realistic volumes of
mineralization, the confidence level is considered “low” given the lack of data.
Considering the fact that only a limited number of gold assay results are
available, the gold mineralization for the Rosemont deposit cannot be classified
under the 2014 CIM Definition Standards for Mineral Resources.
Nevertheless, the basic statistics of gold in the drill hole
database and the interpolated blocks are showing similitude with the amount of
gold measured from the head grade of the metallurgical tests (i.e. 0.03 to 0.05
g/ton or 0.0008 to 0.001 once per ton). Additional work should be undertaken to
gain a better understanding of the gold distribution within the Rosemont
deposit, both for the grade content and its spatial distribution.
14.4.5 Contact
Profiles
Exploratory data analysis (“EDA”) of contact plots displaying
average grades of Cu, ASCu, Mo and Ag by distance classes on either side of the
contact between each lithology domain were created. The contact profiles show
that there are sharp (hard), gradual (firm) and no (soft) changes in metal grade
across the contacts. An example is shown in Figure 14-14 for the Earp
lithologies. A matrix of boundary conditions for sulfide material is shown in
Table 14-11, Table 14-12, Table 14-13 and Table 14-14.
Page 14-21
|
|
Rosemont Project |
| Form
43-101F1 Technical Report |
FIGURE 14-14: CONTACT PROFILE, UPPER AND LOWER EARP
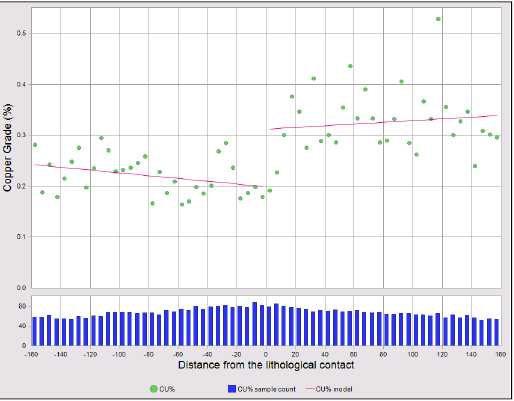
Page 14-22
|
|
Rosemont Project |
| Form
43-101F1 Technical Report |
TABLE 14-11: MATRIX OF
BOUNDARY CONDITIONS, TOTAL
COPPER
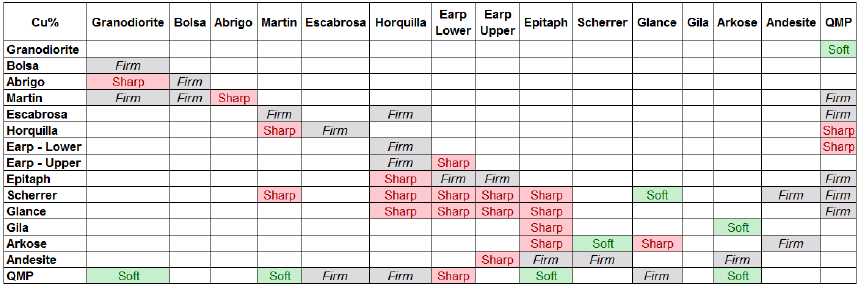
Page 14-23
|
|
Rosemont Project |
| Form
43-101F1 Technical Report |
TABLE 14-12: MATRIX OF
BOUNDARY CONDITIONS, ACID SOLUBLE
COPPER
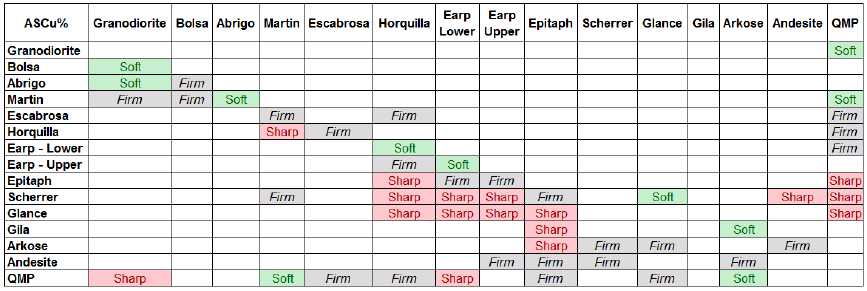
Page 14-24
|
|
Rosemont Project |
| Form
43-101F1 Technical Report |
TABLE 14-13: MATRIX OF
BOUNDARY CONDITIONS, MOLYBDENUM
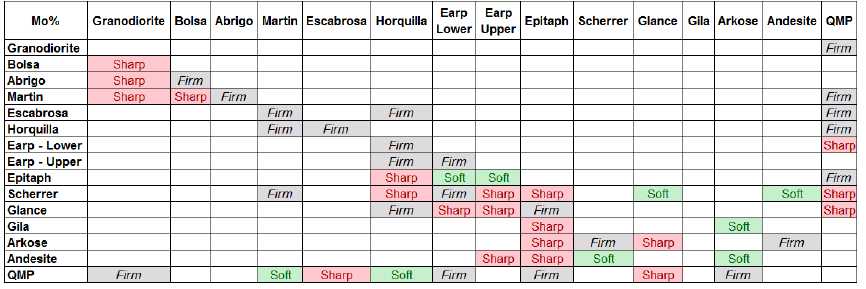
Page 14-25
|
|
Rosemont Project |
| Form
43-101F1 Technical Report |
TABLE 14-14: MATRIX OF
BOUNDARY CONDITIONS, SILVER
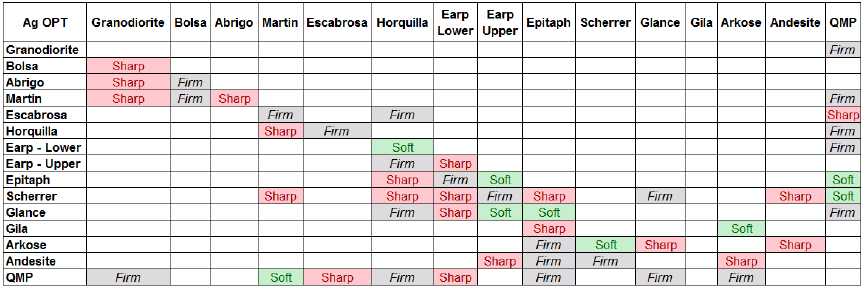
Page 14-26
|
|
Rosemont Project |
| Form
43-101F1 Technical Report |
14.5
Composites
In order to normalize the weight of influence for each sample,
assay intervals were regularized by compositing drill hole data into 25-feet
lengths using lithology boundaries to break composites. The 25-foot intervals
(+/- 12.5 feet of threshold) were composited using “honor geology” from the
coded drill hole file. For bias assessment purposes, assay intervals were also
composited into 50-foot lengths (+/- 25 feet of threshold) using the same
methodology. The 50-foot composites were used to estimate nearest neighbor
models. Exploratory data analysis of the 25-foot composite statistics for TCu,
ASCu, molybdenum (Mo) and silver (Ag) are shown in Table 14-15, Table 14-16,
Table 14-17 and Table 14-18.
TABLE 14-15: LENGTH WEIGHTED UNCAPPED AND CAPPED 25-FOOT
COMPOSITE STATISTICS, COPPER IN SULFIDES
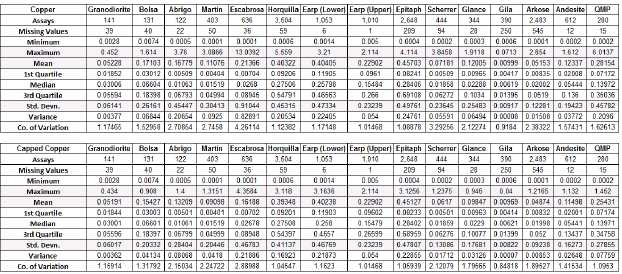
TABLE 14-16: LENGTH WEIGHTED UNCAPPED AND CAPPED 25-FOOT
COMPOSITE STATISTICS, ACID SOLUBLE COPPER IN SULFIDES
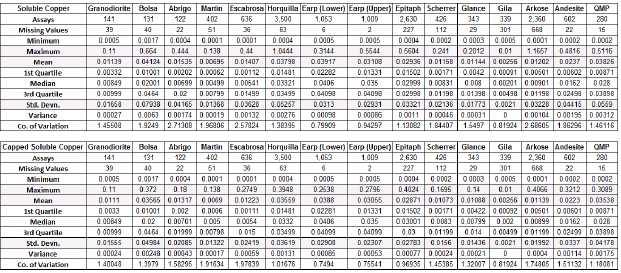
Page 14-27
|
|
Rosemont Project |
| Form
43-101F1 Technical Report |
TABLE 14-17: LENGTH WEIGHTED UNCAPPED AND CAPPED 25-FOOT
COMPOSITE STATISTICS, MOLYBDENUM IN SULFIDES
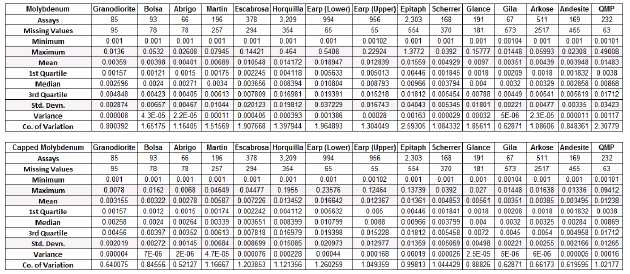
TABLE 14-18: LENGTH WEIGHTED UNCAPPED AND CAPPED 25-FOOT
COMPOSITE STATISTICS, SILVER IN SULFIDES

The length weighted mean grades of both 25-foot and 50-foot
length composites are similar to those of the assays; therefore, providing
confidence that the compositing process is working as intended. The appreciable
amounts of sulfide mineralization, located within the Horquilla, Earp (lower and
upper), and Epitaph lithologies, consist of low to moderate CV values for all
metal types. These CV values suggest that no further domaining is warranted and
that a linear interpolation method can be used. Linear interpolation was also
used for the other lithological units given their minor contribution to the
mineralization of economic interest. Applying non-linear interpolation methods
and/or revisions of the wireframing criteria will be further investigated for
these lithologies in future updates of the resource model.
Page 14-28
|
|
Rosemont Project |
| Form
43-101F1 Technical Report |
Histogram and basic statistics for capped total copper within
the Horquilla lithology unit are shown in Figure 14-15.
FIGURE 14-15: HISTOGRAM, 25-FOOT COPPER COMPOSITES, HORQUILLA
LITHOLOGY
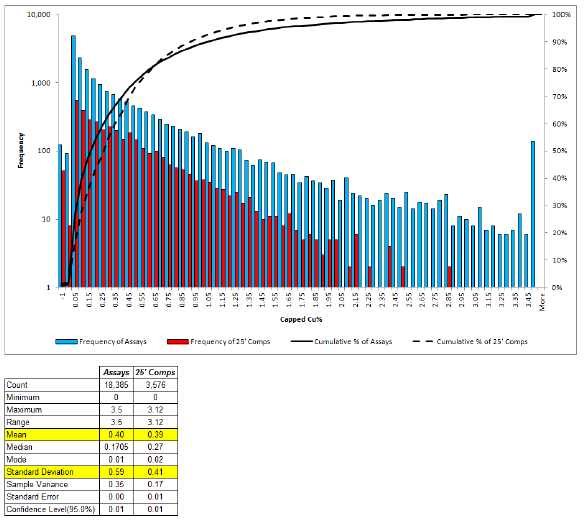
14.6
Variography
Down-hole and directional correlograms for total copper,
acid-soluble copper, molybdenum and silver using three combined groups of
lithologies were created using SAGE® software. The Footwall Group of lithologies
lies to the west of the Backbone Fault and includes the Granodiorite, Bolsa,
Abrigo, Martin and Escabrosa. The Lower Plate group of lithologies lies on the
hanging wall of the Backbone Fault and includes Horquilla, Earp (lower and
upper) and Epitaph. The Upper Plate group of lithologies lies above the Lower
Plate group and includes Scherrer, Glance, Gila, Arkose, Andesite and the QMPs.
Due to a limited number of pairs in the oxide and mixed zones, the analysis was
conducted on oxidation state only rather than lithology.
Page 14-29
|
|
Rosemont Project |
| Form
43-101F1 Technical Report |
The total copper variograms show very low to moderate nugget
effects with values between 2% and 52% of the total variance for the sulfide
mineralization. The ranges of correlation generally vary between 340 and 2,000
feet (103 and 609 meters). The downhole variogram for the lower plate group of
lithologies is shown in Figure 14-16.
FIGURE 14-16: DOWNHOLE VARIOGRAM COPPER, LOWER GROUP OF
LITHOLOGIES IN SULFIDES
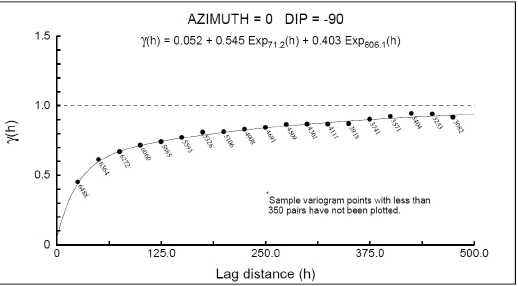
A nugget and a nested exponential model were fitted to the
experimental correlograms. An example of a variogram showing the anisotropy of
the fitted model, together with the three principal directions is shown in
Figure 14-17 and Figure 14-18. Correlogram model parameters for TCu, ASCu,
molybdenum (Mo) and silver (Ag) are shown in Table 14-19.
Page 14-30
|
|
Rosemont Project |
| Form
43-101F1 Technical Report |
FIGURE 14-17: CORRELOGRAM OF THE MAIN STRUCTURE OF COPPER,
LOWER GROUP OF LITHOLOGIES IN SULFIDES
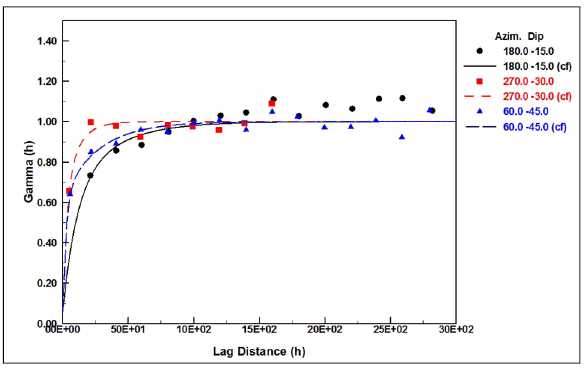
FIGURE 14-18: CORRELOGRAM OF THE NESTED STRUCTURE OF COPPER,
LOWER GROUP OF LITHOLOGIES IN SULFIDES
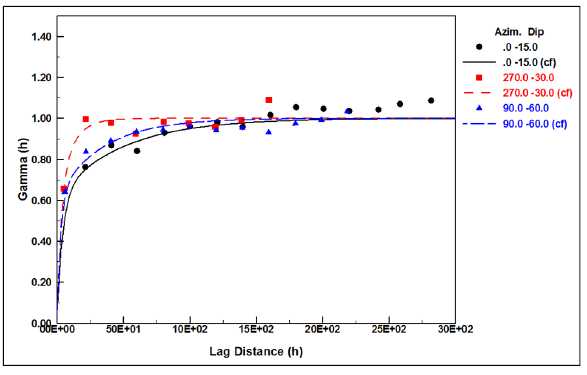
Page 14-31
|
|
Rosemont Project |
| Form
43-101F1 Technical Report |
TABLE 14-19: VARIOGRAM
MODELS AND ROTATION ANGLES
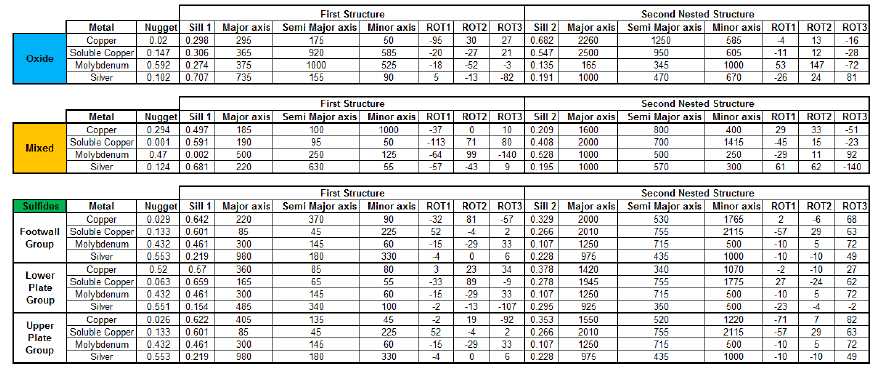
Note: Ranges are in feet and search ellipse
orientations are given using MEDS rotation
convention.
Page 14-32
|
|
Rosemont Project |
| Form
43-101F1 Technical Report |
14.7
Estimation and Interpolation Methods
Lithology solids were used to code assay and composite
intervals. The same solids were used to code blocks in the model based on a
minimum 50% majority code threshold. Aside from the lithologies in the footwall
of the backbone fault which have a limited number of composites, metal grade
estimation used a composite and block matching system based on the lithology and
oxidation codes. For example, in the case of the Horquilla lithology in the
sulfides, only composites coded as Horquilla and sulfides were used to estimate
block grades. In the case of swelling and magnesium clays, the ore types solids
were used to code the assays, composites and blocks.
The block model consists of regular blocks (50 feet along
strike x 50 feet across strike x 50 feet vertically). The block size was chosen
such that geological contacts are reasonably well reflected and to support a
large-scale open pit mining scenario.
The interpolation plan was completed on the uncapped and capped
composites, 25 feet in length, using ordinary kriged (“OK”) grade interpolation
method using three passes with increasing search distances.
The composite selection parameters for grade estimation in each
domain (minimum, maximum, and maximum number of composites per hole) were
selected to minimize bias. Table 14-20 and Table 14-21 show the search distances
and search ellipse orientations for the estimation domains.
The first interpolation pass is restricted to a minimum of nine
composites, a maximum of 12 composites (with a maximum of three composites per
hole) and quadrant declustering. The second interpolation pass is restricted to
a minimum of six composites, a maximum of 12 composites (with a maximum of three
composites per hole) and quadrant declustering. Finally, the third interpolation
pass is restricted to a minimum of four composites, a maximum of 12 composites
(with a maximum of three composites per hole) without quadrant declustering.
Since the skarn mineralization and alteration system is driving
the copper mineralization and the clays alteration at Rosemont, the copper
interpolation plans were used to interpolate the magnesium and swelling clays
content in every block using the ore types code matching between the composites
and the blocks.
The swelling and magnesium clays were interpolated using the
same multi pass system as describe above. At the end of the interpolation runs,
some blocks located in small pods of ore type 2, 3, 4, 5A and 5B were left
un-interpolated since they did not meet the interpolation requirements for the
number of composites. In order to interpolate these isolated blocks, two
additional interpolation pass had to be used. One used a minimum of two
composites to interpolate the swelling and magnesium clays and the another one
used a minimum of one composite.
The ordinary kriging (“OK”) interpolation results were
validated against a NN model and an IDW model. The three models show similar
values, hence giving confidence in the clays interpolation.
Page 14-33
|
|
Rosemont Project |
| Form
43-101F1 Technical Report |
TABLE 14-20: COPPER AND ACID
SOLUBLE COPPER GRADE
MODEL INTERPOLATION PLANS
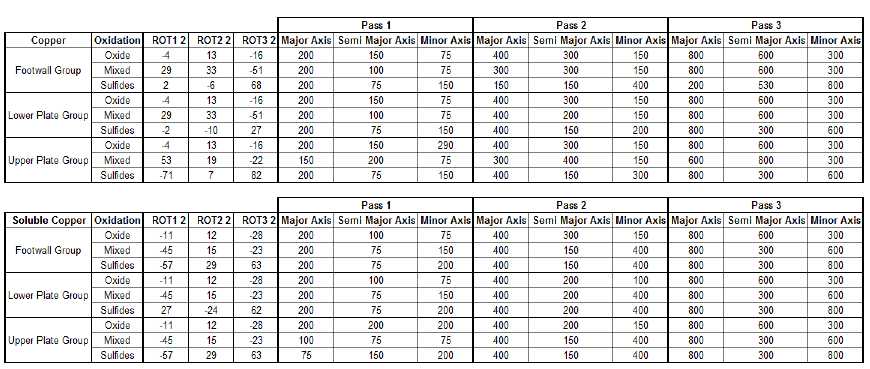
Note: Ranges are in feet and search ellipse
orientations are given using MEDS rotation
convention.
Page 14-34
|
|
Rosemont Project |
| Form
43-101F1 Technical Report |
TABLE 14-21: MOLYBDENUM AND
SILVER GRADE MODEL
INTERPOLATION PLANS
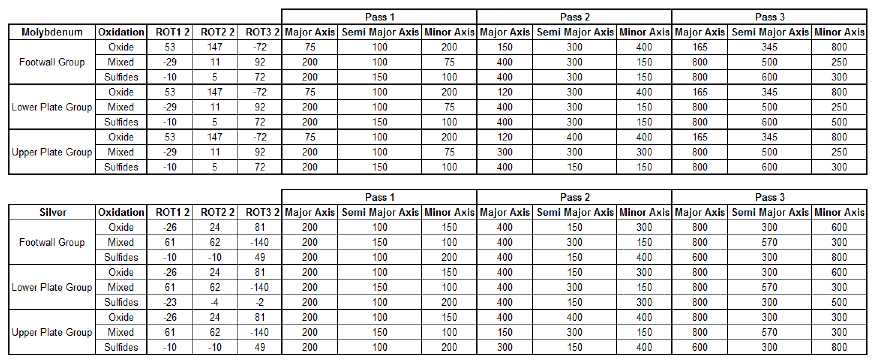
Note: Ranges are in feet and search ellipse
orientations are given using MEDS rotation
convention.
Page 14-35
|
|
Rosemont Project |
| Form
43-101F1 Technical Report |
14.8
Tonnage Factor Assignment
There are a total of 2,486 specific gravity (SG) measurements
in the drill hole database, including 2,066 Hudbay measurements with matching
full geochemistry analysis. The pre-Hudbay specific gravity measurements were
performed using a non-wax sealed immersion technique. The Hudbay measurements
were performed by Inspectorate laboratory using a wax-sealed immersion technique
to measure the weight of each sample in air and in water.
The lithologies identified at the Rosemont deposit display
variable density contrast between the chemical sediments such as the limestones
and dolostones, and the siliclastic sediments and crystalline rocks. In order to
circumvent the relative low number of specific gravity measurements available,
two linear regression models were developed based on the Hudbay specific gravity
measurements and the geochemistry data. One linear regression model was fitted
for the chemical sediments while the other model was adapted to the siliclastic
sediments and crystalline rocks.
Table 14-22 presents the measured specific gravity measurements
and the predicted specific measurements by decile and quantile.
TABLE 14-22: MEASURED COMPARED TO CALCULATED SPECIFIC
GRAVITY
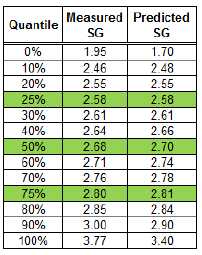
Missing SG measurements in the Hudbay drill holes were replaced
by the calculated SG linear regression models. Table 14-23 shows the
number of samples with density measurements and their basic statistics.
Page 14-36
|
|
Rosemont Project |
| Form
43-101F1 Technical Report |
TABLE 14-23: SPECIFIC GRAVITY MEASUREMENTS PER LITHOLOGY AND
OXIDATION STATE
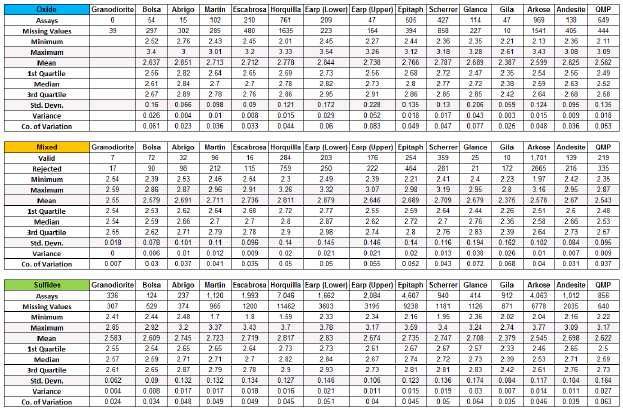
Since the skarn mineralization and alteration system was
driving the copper mineralization and therefore the density, the copper
interpolation plans were used to interpolate the specific density in every block
using the lithology and oxidation code matching between the composites and the
blocks. Figure 14-19 displays the relationship between the copper grade and the
density values.
FIGURE 14-19: SCATTERPLOT OF TOTAL COPPER AND SPECIFIC
GRAVITY
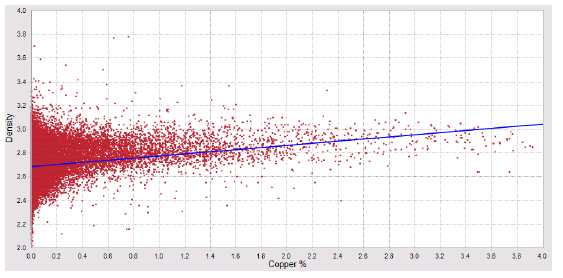
Page 14-37
|
|
Rosemont Project |
| Form
43-101F1 Technical Report |
The OK interpolation results were validated against a NN model
and an IDW model. The three models show a similar distribution (Figure 14-20),
confirming the absence of a global bias. The blocks that did not have a SG value
after the interpolation were assigned an average SG value based on lithology and
oxidation level (Table 14-24).
FIGURE 14-20: OK, IDW AND NN SPECIFIC GRAVITY DISTRIBUTION
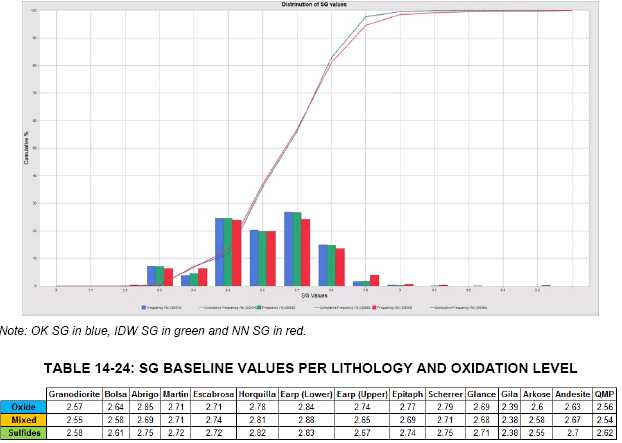
Tonnage factors were calculated from the SG values using the
formula TF = 2,000 / (SG * 62.42797) .
The final tonnage factors are shown below in Table 14-25. The
tonnage factors have been used directly as the dry bulk tonnage factors to
report the tonnage estimates of the mineral resource.
Page 14-38
|
|
Rosemont Project |
| Form
43-101F1 Technical Report |
TABLE 14-25: TONNAGE
FACTORS BY LITHOLOGY AND OXIDATION
STATE
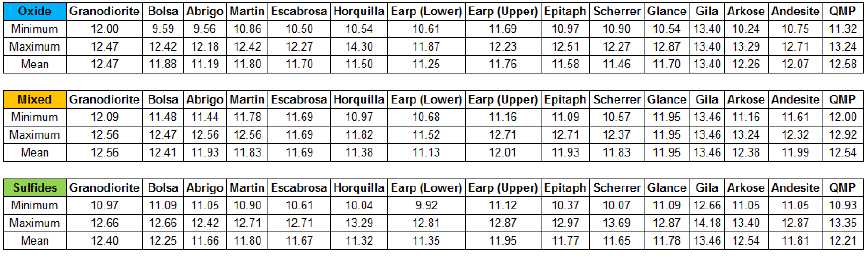
Page 14-39
|
|
Rosemont Project |
| Form
43-101F1 Technical Report |
14.9
Block Model Validation
The Rosemont block model was validated to ensure appropriate
honoring of the input data by the following methods:
- Visual inspection of the OK block model grades in plan and section views
in comparison to composites grade
- Metal removed via grade capping methodology
- Comparison between the interpolation methods of NN using 50-foot
composites and IDW were created to confirm the absence of global bias in the
OK grade model
- Swath plot comparisons of the estimation methods to investigate local bias
- Review of block model OK quality control parameters
- Comparison of the grade tonnage curves and statistics by estimation method
14.10
Visual Inspection
Visual inspection of block grade versus composited data was
conducted in section and plan view. The visual inspection of block grade versus
composited data showed a good reproduction of the data by the model. An
east-west oriented cross-section is provided in Figure 14-21 to Figure 14-24.
Page 14-40
|
|
Rosemont Project |
| Form
43-101F1 Technical Report |
FIGURE 14-21: VERTICAL E-W
SECTION 11,554,900 SHOWING OK
MODEL AND COMPOSITES - COPPER
GRADE
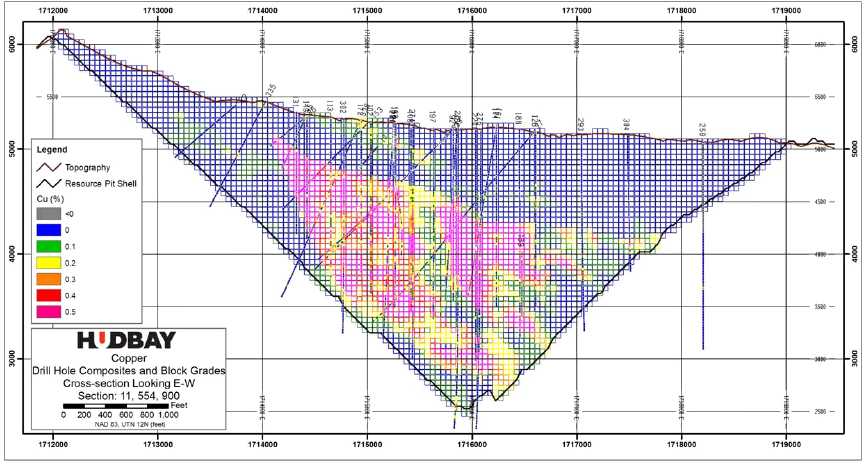
Note: The resource pit is not
indicative of the mine plan
Page 14-41
|
|
Rosemont Project |
| Form
43-101F1 Technical Report |
FIGURE 14-22: VERTICAL E-W
SECTION 11,554,900 SHOWING OK
MODEL AND COMPOSITES – ACID SOLUBLE
COPPER GRADE
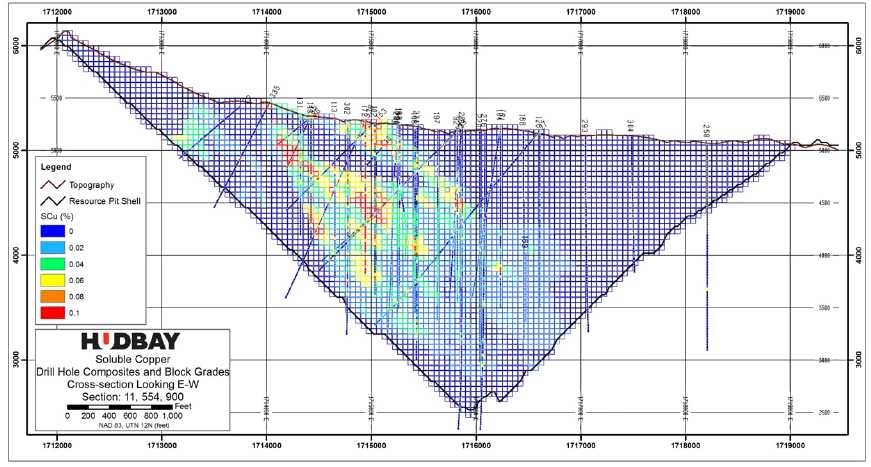
Note: The resource pit is not
indicative of the mine plan.
Page 14-42
|
|
Rosemont Project |
| Form
43-101F1 Technical Report |
FIGURE 14-23: VERTICAL E-W
SECTION 11,554,900 SHOWING OK
MODEL AND COMPOSITES - MOLYBDENUM
GRADE

Note: The resource pit is not
indicative of the mine plan.
Page 14-43
|
|
Rosemont Project |
| Form
43-101F1 Technical Report |
FIGURE 14-24: VERTICAL E-W
SECTION 11,554,900 SHOWING OK
MODEL AND COMPOSITES – SILVER
GRADE
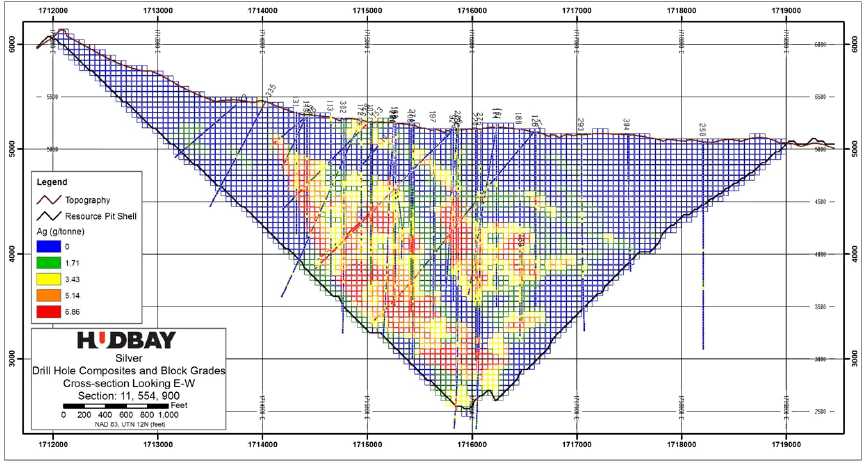
Note: The resource pit is not
indicative of the mine plan.
Page 14-44
|
|
Rosemont Project |
| Form
43-101F1 Technical Report |
14.11
Metal Removed by Capping
The impact of capping was evaluated by estimating uncapped and
capped grade models. Generally, the amounts of metal removed by capping in the
models are consistent with the difference of the capped and uncapped assays. The
percentages of metal removed by capping from the assays, NN, IDW and OK models
in the blocks above $5.7/ton NSR contained within the resource pit are shown in
Table 14-26 to Table 14-29. The amount of capping appears appropriate within the
Horquilla, Earp (upper and lower) and Epitaph with a difference of approximately
0 to 3% for copper, 0 to 13% for ASCu, 4 to 22% for molybdenum and 1 to 8% for
silver.
Page 14-45
|
|
Rosemont Project |
| Form
43-101F1 Technical Report |
TABLE 14-26: ASSAY, NN, IDW AND OK
MODEL, COPPER REMOVED BY
CAPPING IN BLOCKS WITHIN THE
RESOURCE PIT AND ABOVE $5.7/TON NSR
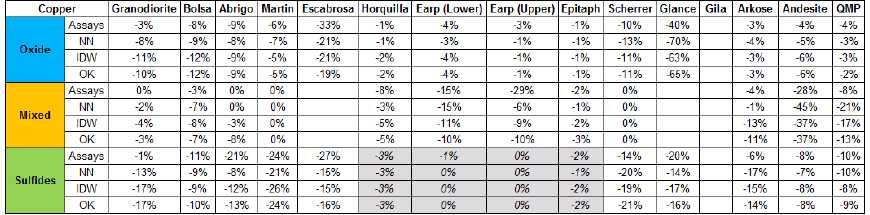
TABLE 14-27: ASSAY, NN, IDW AND OK
MODEL, ACID SOLUBLE COPPER
REMOVED BY CAPPING IN BLOCKS
WITHIN THE RESOURCE PIT AND ABOVE
$5.7/TON NSR
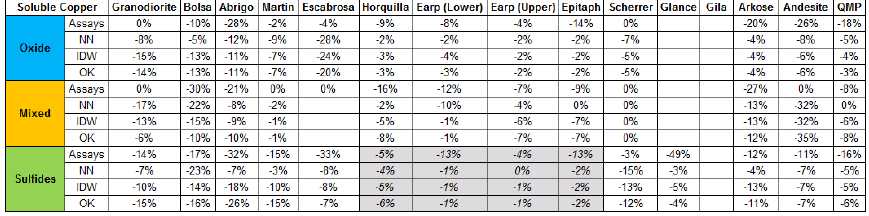
Page 14-46
|
|
Rosemont Project |
| Form
43-101F1 Technical Report |
TABLE 14-28: ASSAY, NN, IDW AND OK
MODEL, MOLYBDENUM REMOVED BY
CAPPING IN BLOCKS WITHIN THE
RESOURCE PIT AND ABOVE $5.7/TON NSR
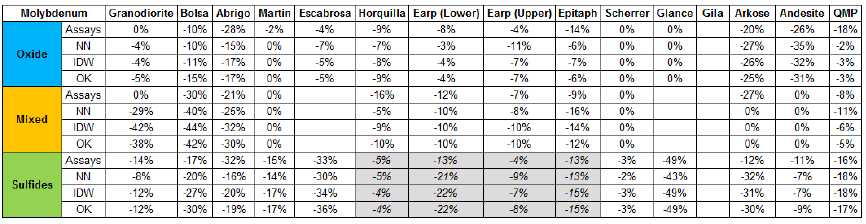
TABLE 14-29: ASSAY, NN, IDW AND OK
MODEL, SILVER REMOVED BY
CAPPING IN BLOCKS WITHIN THE
RESOURCE PIT AND ABOVE $5.7/TON NSR
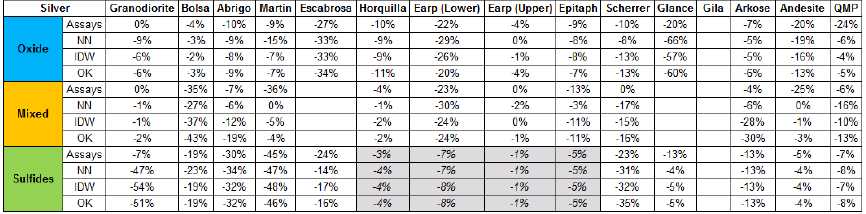
Page 14-47
|
|
Rosemont Project |
| Form
43-101F1 Technical Report |
14.12
Global Bias Checks
A comparison between the interpolation methods estimates was
completed on all the blocks within the resource pit shell that have NSR values
greater than $5.7/ton for global bias in the grade estimates. Differences
between the NN, IDW and OK grades are acceptable in Horquilla, Earp (lower and
upper) and Epitaph, with differences within 0% to 3% for copper, 0% to 3% for
ASCu, 0% to 5% for molybdenum and 0% to 6% for silver. The differences are
summarized in Table 14-30 to Table 14-33.
Page 14-48
|
|
Rosemont Project |
| Form
43-101F1 Technical Report |
TABLE 14-30: NN, IDW AND OK MODEL
STATISTICS MEAN BLOCK GRADE
COMPARISONS FOR COPPER IN BLOCKS
WITHIN THE RESOURCE PIT AND ABOVE
$5.7/TON NSR
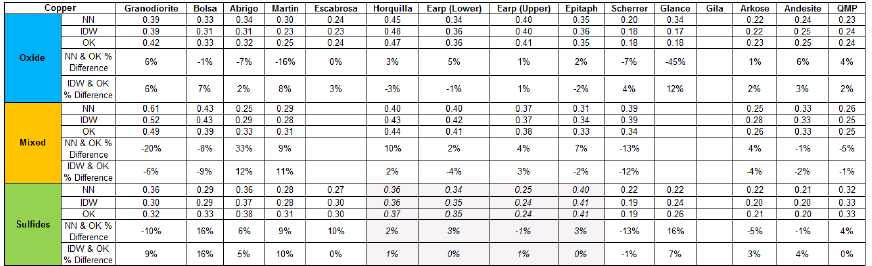
TABLE 14-31: NN, IDW AND OK MODEL
STATISTICS MEAN BLOCK GRADE
COMPARISONS FOR ACID SOLUBLE COPPER IN
BLOCKS WITHIN THE RESOURCE PIT AND
ABOVE $5.7/TON NSR
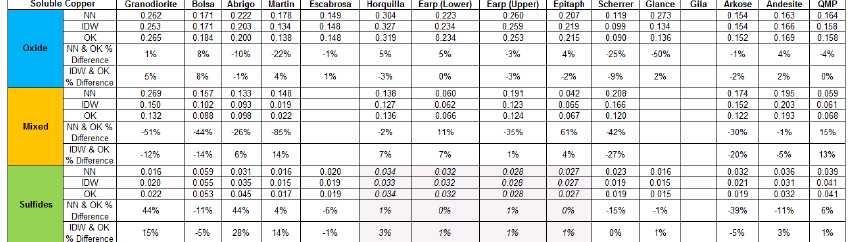
Page 14-49
|
|
Rosemont Project |
| Form
43-101F1 Technical Report |
TABLE 14-32: NN, IDW AND OK MODEL
STATISTICS MEAN BLOCK GRADE
COMPARISONS FOR MOLYBDENUM SILVER IN
BLOCKS WITHIN THE RESOURCE PIT AND
ABOVE $5.7/TON NSR
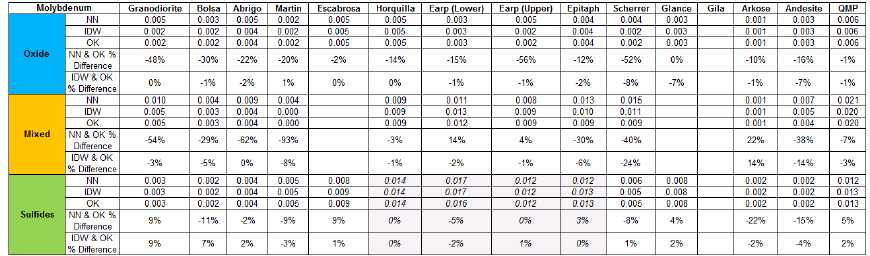
TABLE 14-33: NN, IDW AND OK MODEL
STATISTICS MEAN BLOCK GRADE
COMPARISONS FOR SILVER IN BLOCKS
WITHIN THE RESOURCE PIT AND ABOVE
$5.7/TON NSR
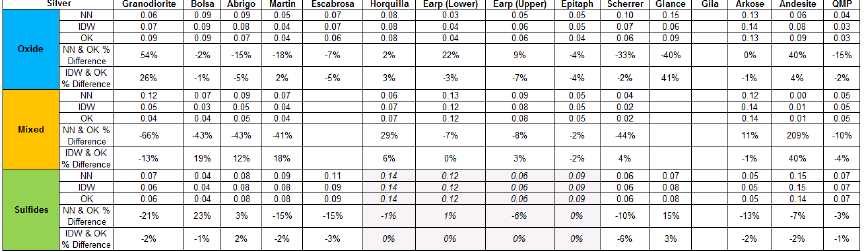
Page 14-50
|
|
Rosemont Project |
| Form
43-101F1 Technical Report |
14.13
Local Bias Checks
A local bias check was performed by plotting the average total
copper, acid soluble copper, molybdenum and silver of the NN, IDW and OK models
in swath plots oriented along the model northing, easting and elevation.
In reviewing the swath plots, only minor discrepancies were
found between the different grade models. In areas where there is extrapolation
beyond the drill holes, the swath plots indicate less agreement for all
variables. The copper, acid soluble copper, molybdenum and silver swath plots
for Measured and Indicated blocks are shown below in Figure 14-25 to Figure
14-36.
Page 14-51
|
|
Rosemont Project |
| Form
43-101F1 Technical Report |
FIGURE 14-25: MEASURED AND
INDICATED BLOCKS ABOVE
$5.7/TON NSR WITHIN THE RESOURCE PIT
SHELL, COPPER SWATH PLOT BY
EASTING
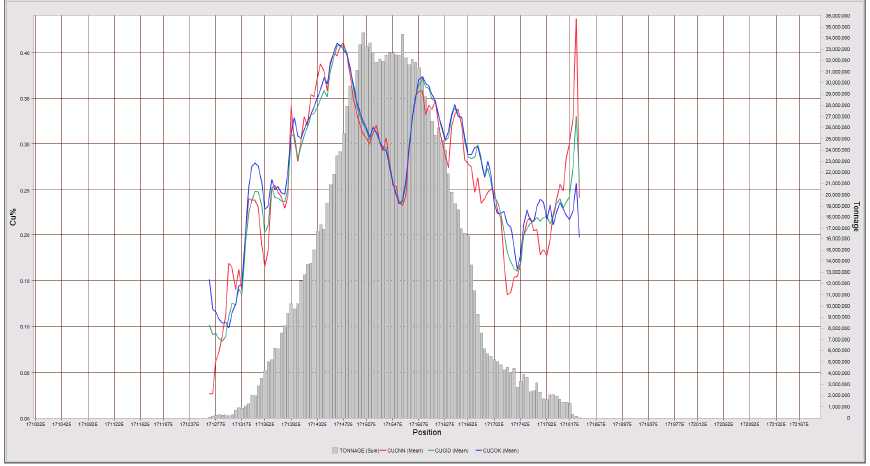
Note: Line charts show the grades and
histogram shows the tons. Green line represents IDW
model. Red line represents NN model. Blue line
represents OK model.
Page 14-52
|
|
Rosemont Project |
| Form
43-101F1 Technical Report |
FIGURE 14-26: MEASURED AND
INDICATED BLOCKS ABOVE
$5.7/TON NSR WITHIN THE RESOURCE PIT
SHELL, COPPER SWATH PLOT BY
NORTHING
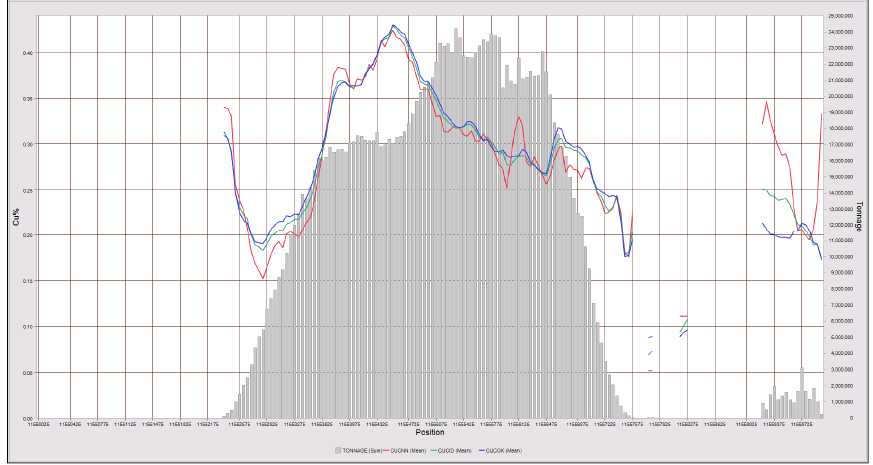
Note: Line charts show the grades and
histogram shows the tons. Green line represents IDW
model. Red line represents NN model. Blue line
represents OK model.
Page 14-53
|
|
Rosemont Project |
| Form
43-101F1 Technical Report |
FIGURE 14-27: MEASURED AND
INDICATED BLOCKS ABOVE
$5.7/TON NSR WITHIN THE RESOURCE PIT
SHELL, COPPER SWATH PLOT BY
ELEVATION
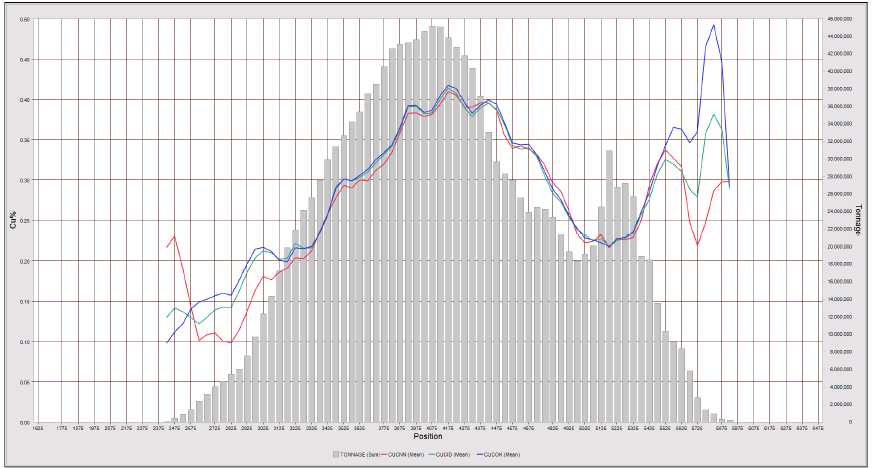
Note: Line charts show the grades and
histogram shows the tons. Green line represents IDW
model. Red line represents NN model. Blue line
represents OK model.
Page 14-54
|
|
Rosemont Project |
| Form
43-101F1 Technical Report |
FIGURE 14-28: MEASURED AND
INDICATED BLOCKS ABOVE
$5.7/TON NSR WITHIN THE RESOURCE PIT
SHELL, ACID SOLUBLE COPPER
SWATH PLOT BY EASTING
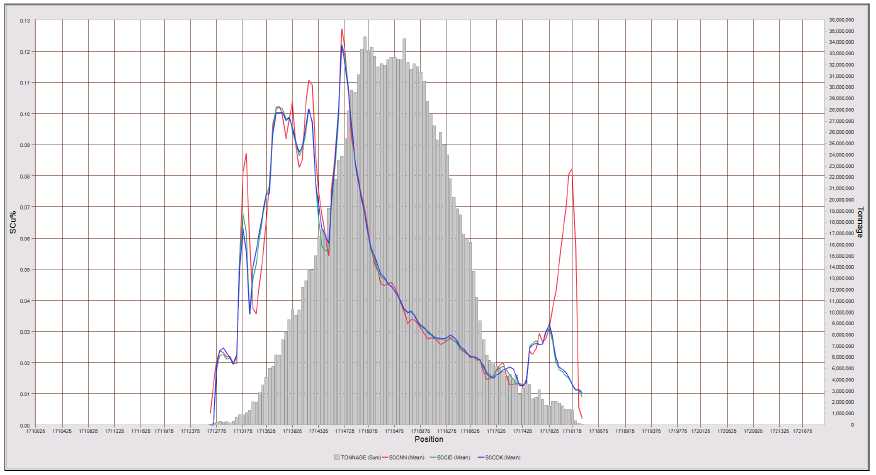
Note: Line charts show the grades and
histogram shows the tons. Green line represents IDW
model. Red line represents NN model. Blue line
represents OK model.
Page 14-55
|
|
Rosemont Project |
| Form
43-101F1 Technical Report |
FIGURE 14-29: MEASURED AND
INDICATED BLOCKS ABOVE
$5.7/TON NSR WITHIN THE RESOURCE PIT
SHELL, ACID SOLUBLE COPPER
SWATH PLOT BY NORTHING
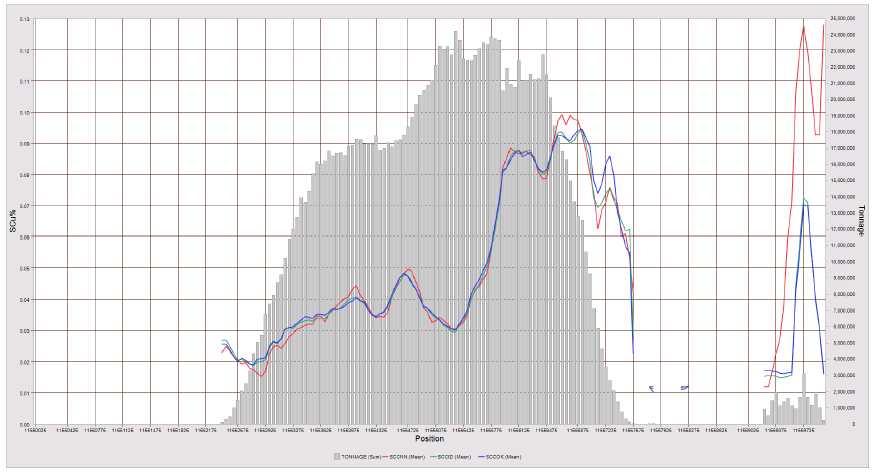
Note: Line charts show the grades and
histogram shows the tons. Green line represents IDW
model. Red line represents NN model. Blue line
represents OK model.
Page 14-56
|
|
Rosemont Project |
| Form
43-101F1 Technical Report |
FIGURE 14-30: MEASURED AND
INDICATED BLOCKS ABOVE
$5.7/TON NSR WITHIN THE RESOURCE PIT
SHELL, ACID SOLUBLE COPPER
SWATH PLOT BY ELEVATION
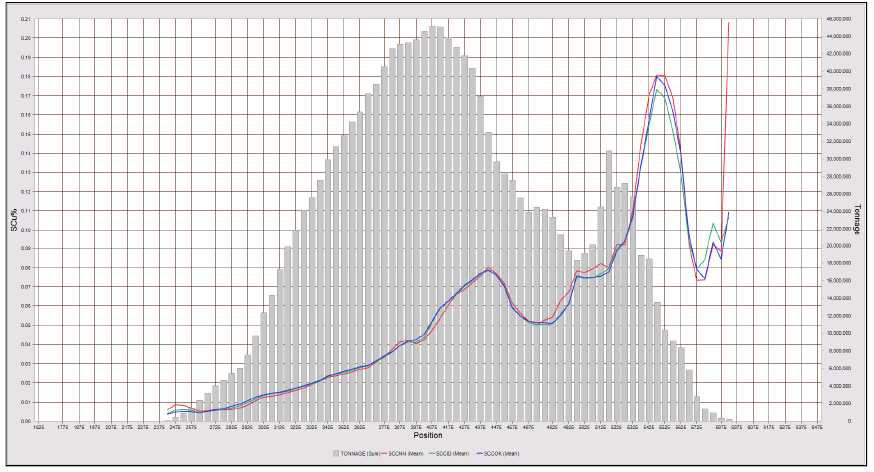
Note: Line charts show the grades and
histogram shows the tons. Green line represents IDW
model. Red line represents NN model. Blue line
represents OK model.
Page 14-57
|
|
Rosemont Project |
| Form
43-101F1 Technical Report |
FIGURE 14-31: MEASURED AND
INDICATED BLOCKS ABOVE
$5.7/TON NSR WITHIN THE RESOURCE PIT
SHELL, MOLYBDENUM SWATH PLOT BY
EASTING
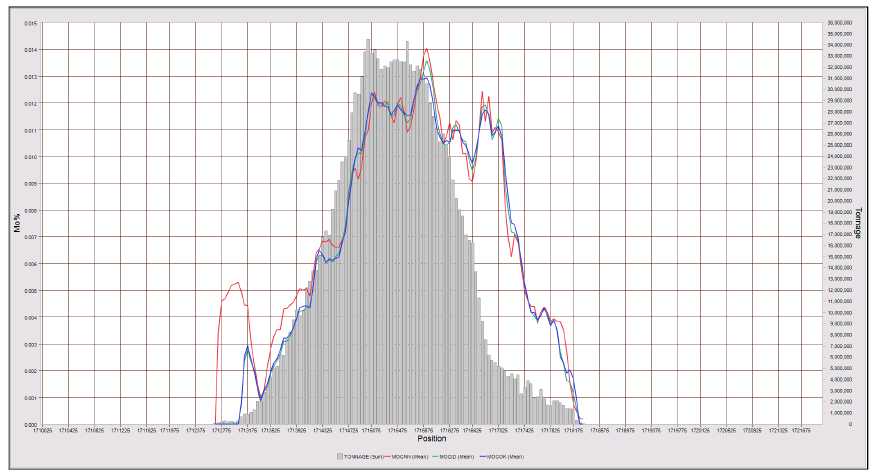
Note: Line charts show the grades and
histogram shows the tons. Green line represents IDW
model. Red line represents NN model. Blue line
represents OK model.
Page 14-58
|
|
Rosemont Project |
| Form
43-101F1 Technical Report |
FIGURE 14-32: MEASURED AND
INDICATED BLOCKS ABOVE
$5.7/TON NSR WITHIN THE RESOURCE PIT
SHELL, MOLYBDENUM SWATH PLOT BY
NORTHING
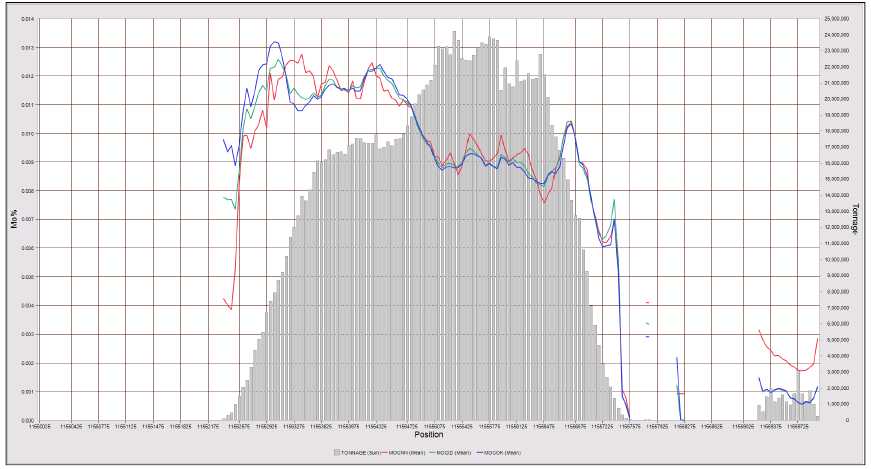
Note: Line charts show the grades and
histogram shows the tons. Green line represents IDW
model. Red line represents NN model. Blue line
represents OK model.
Page 14-59
|
|
Rosemont Project |
| Form
43-101F1 Technical Report |
FIGURE 14-33: MEASURED AND
INDICATED BLOCKS ABOVE
$5.7/TON NSR WITHIN THE RESOURCE PIT
SHELL, MOLYBDENUM SWATH PLOT BY
ELEVATION
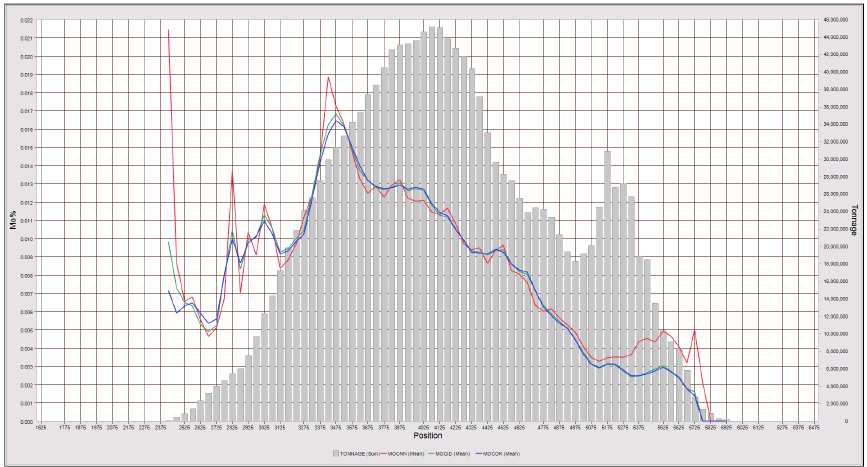
Note: Line charts show the grades and
histogram shows the tons. Green line represents IDW
model. Red line represents NN model. Blue line
represents OK model.
Page 14-60
|
|
Rosemont Project |
| Form
43-101F1 Technical Report |
FIGURE 14-34: MEASURED AND
INDICATED BLOCKS ABOVE
$5.7/TON NSR WITHIN THE RESOURCE PIT
SHELL, SILVER SWATH PLOT BY
EASTING
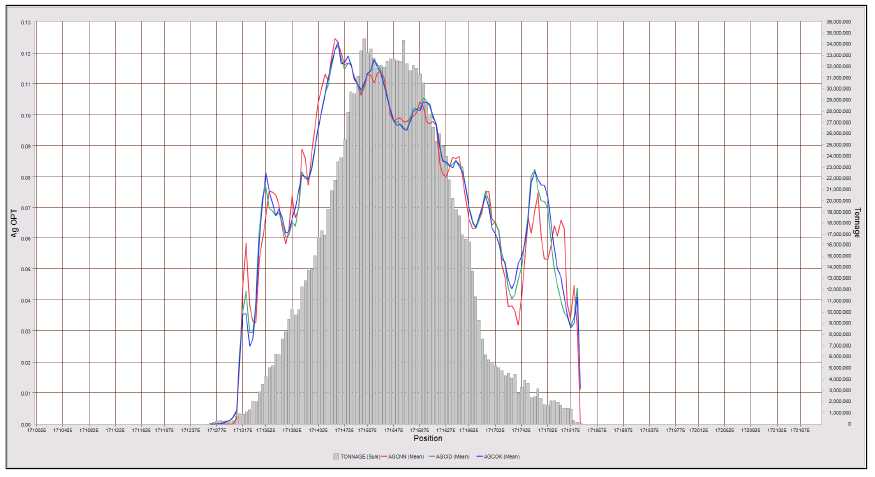
Note: Line charts show the grades and
histogram shows the tons. Green line represents IDW
model. Red line represents NN model. Blue line
represents OK model.
Page 14-61
|
|
Rosemont Project |
| Form
43-101F1 Technical Report |
FIGURE 14-35: MEASURED AND
INDICATED BLOCKS ABOVE
$5.7/TON NSR WITHIN THE RESOURCE PIT
SHELL, SILVER SWATH PLOT BY
NORTHING
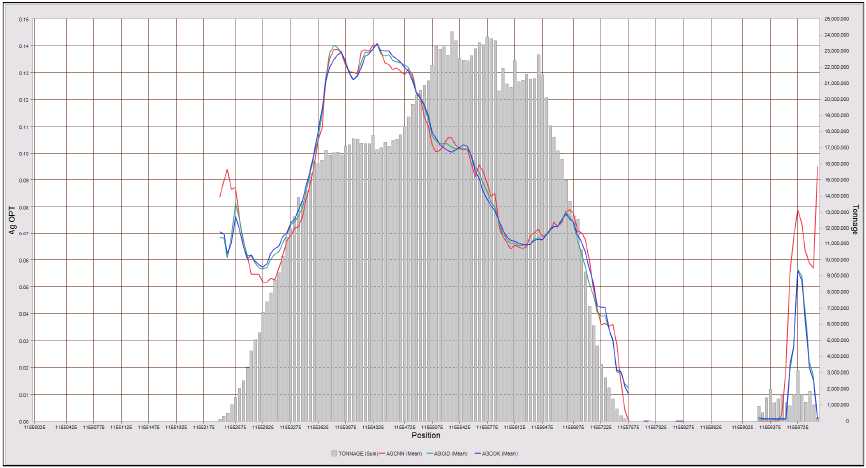
Note: Line charts show the grades and
histogram shows the tons. Green line represents IDW
model. Red line represents NN model. Blue line
represents OK model.
Page 14-62
|
|
Rosemont Project |
| Form
43-101F1 Technical Report |
FIGURE 14-36: MEASURED AND
INDICATED BLOCKS ABOVE
$5.7/TON NSR WITHIN THE RESOURCE PIT
SHELL, SILVER SWATH PLOT BY
ELEVATION
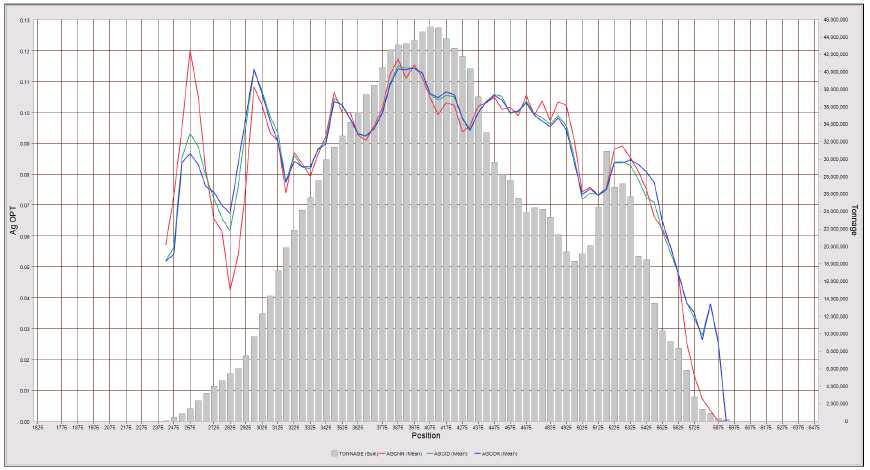
Note: Line charts show the grades and
histogram shows the tons. Green line represents IDW
model. Red line represents NN model. Blue line
represents OK model.
Page 14-63
|
|
Rosemont Project |
| Form
43-101F1 Technical Report |
14.14
Block Model Quality Control
The closest distance of a composite (“CDIST”), the maximum
distance of a composite (“MDIST”), the average distance of composites (“ADIST”),
the number of composites (“NCOMP”), the number of holes (“NHOLE”), the number of
quadrants (“QUAD”) used for the OK interpolation of copper were recorded in the
block model.
The standard deviation of the kriging (“KSTD”), the regression
slope (“RSLOP”), the local error (“LOCA”L), the relative variance (“RELVA”) and
the relative variance index (“RVI”) were also recorded in the block model. Table
14-34 presents the quality control parameters recorded in the block model from
the OK resource estimation.
TABLE 14-34: QUALITY CONTROL STATISTICS OF THE COPPER
INTERPOLATION IN MEASURED AND INDICATED BLOCKS ABOVE $5.7/TON NSR WITHIN THE
RESOURCE PIT SHELL
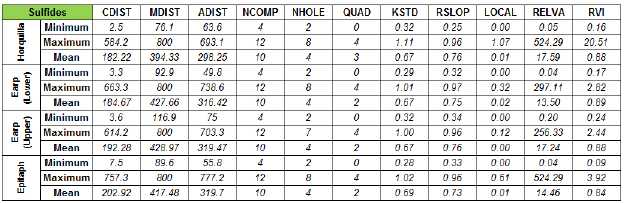
Overall, in the Horquilla, Earp (lower and upper) and Epitaph
units of the sulfides, the average distance of the composites used to
interpolate the grades in the measured and indicated blocks ranges from 298 to
319-foot, with an average of 10 composites used from more than 3 drill holes.
The average standard deviation of the kriging for the bulk of the mineralization
ranges from 0.67 to 0.69, indicating a high variability of the copper
mineralization which is to be expected in a skarn deposit.
14.15
Grade-Tonnage Statistics
The 50 ft x 50 ft x 50 ft block size is considered suitable for
a large scale open pit mining operation with production rates between 75,000 to
100,000 tons per day. Table 14-35 presents the grade-tonnage statistics of
copper for each interpolation method at different cut-offs.
Page 14-64
|
|
Rosemont Project |
| Form
43-101F1 Technical Report |
TABLE 14-35: GRADE-TONNAGE STATISTICS, COPPER
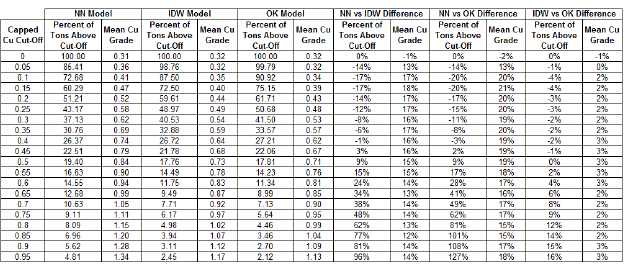
The grade-tonnage curve for total copper is shown in Figure
14-37 as a way to present the overall assessment of the Measured and Indicated
resources.
Page 14-65
|
|
Rosemont Project |
| Form
43-101F1 Technical Report |
FIGURE 14-37: NN, IDW AND OK COPPER
GRADE -TONNAGE CURVES, ALL
LITHOLOGIES IN MEASURED AND INDICATED
BLOCKS ABOVE $5.7/TON NSR
WITHIN THE RESOURCE PIT SHELL
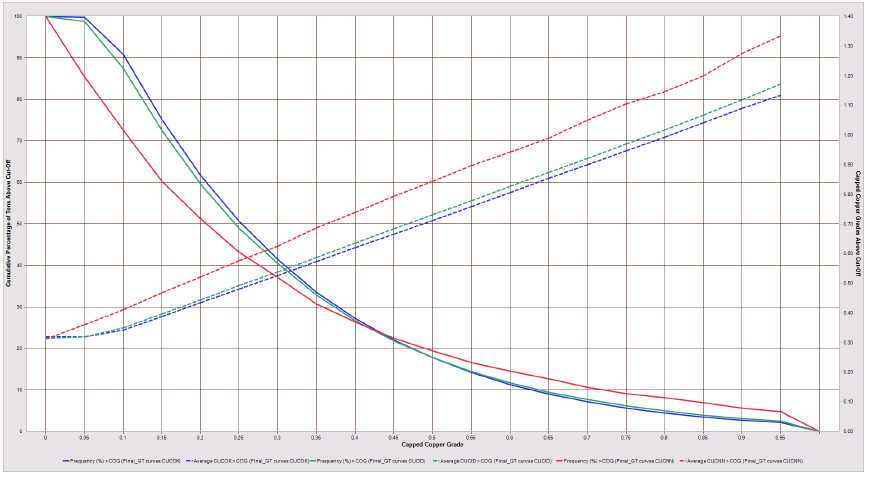
Note: Solid lines represent tons,
dashed lines represent grades, green
represents IDW model, red represents NN model and
blue represents OK model
Page 14-66
|
|
Rosemont Project |
| Form
43-101F1 Technical Report |
14.16
Classification of Mineral Resource
The resource category classification used for Rosemont relies
on the relative difference between the kriged grade and the composites grades,
and the Resource Classification Index (RCI) which uses the following
formula3:
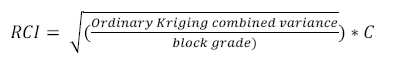
C is a calibration factor based on the distance of the
composites, the number of composites, number of quadrants and number of drill
holes using the following formula:

The RCI values corresponding to the 50th (0.216) and
95th (0.971) percentiles of the distribution of blocks with total
copper grade above 0.1% contained within the resource pit were determined and
used as thresholds for the Measured and Indicated resource categories,
respectively.
Under this classification system, in order for a block to be
considered as a Measured resource, the RCI value must be less than 0.216, the
relative difference less than 0.15 and have a CDIST of less than 500 feet. In
order for a block to be considered as an indicated resource, the RCI value must
be less than 0.971, the relative difference less than 0.15 and have a CDIST of
less than 500 feet. Blocks were classified as inferred resources when at least
two drill holes were used to interpolate the grades within one of the three
interpolation passes.
A smoothing algorithm was applied to remove isolated blocks of
Measured within areas of mostly indicated category or isolated indicated blocks
within areas of mostly Measured category blocks. Proportions of Measured and
Indicated category blocks were not changed significantly by this process. Figure
14-38 presents the resource categories for a typical cross section.
______________________________________________________
3
Arik, A. 2002,” Resource Classification Index”, MineSight in the
Foreground.
Page 14-67
|
|
Rosemont Project |
| Form
43-101F1 Technical Report |
FIGURE 14-38: VERTICAL E-W
SECTION 11,554,600 SHOWING
RESOURCE CLASSIFICATION AND DRILL
HOLES

Page 14-68
|
|
Rosemont Project |
| Form
43-101F1 Technical Report |
14.17
Third Party Review
Hudbay requested Tim Maunula & Associates Consulting Inc.
to perform an independent validation of the block model. The following minor
issues were highlighted by the third party validation:
- Interpolation plan of the NN model was different than the IDW and OK
models
- A small portion of blocks in the model estimated IDW values, but no
estimated OK values and vice versa
These issues were corrected and the content of this Technical
Report, including the tons and grades estimate, reflects these changes.
Based on the review, the third party has concluded that the
mineral resources for the Project have been prepared using industry standard
best practices and the methodology for the resource classification conforms to
the requirements of the CIM Definition Standards.
14.18
Internal Peer Review
Hudbay Peru Technical Service group performed a full validation
of the block model. The following minor issues were highlighted by the peer
review:
- The Escabrosa formation should be interpolated with the lower plate units
- A low grade shell should be use to separate the high grade and low grade
zones in Earp formation
- Resource classification assignation should include a distance component.
Measured or Indicated blocks with CDIST > 500 feet should be reclassified
as Inferred. Inferred blocks with ADIST < 300 feet should be reclassified
as Indicated.
These recommendations were implemented and the content of this
report, including the tons and grade estimate, reflects these changes.
14.19
Reasonable Prospects of Economic Extraction
The component of the mineralization within the block model that
meets the requirements for reasonable prospects of economic extraction was based
on the application of an LG cone pit algorithm. The mineral resources are
therefore contained within a computer generated open pit geometry.
The following assumptions were applied to the determination of
the mineral resources:
- Economic benefit was applied to Measured, Indicated and Inferred
classified material within the resource cone.
Page 14-69
|
|
Rosemont Project |
| Form
43-101F1 Technical Report |
- No effort was made to establish a pit with maximum return on investment;
consequently, the mineral resource cone was the direct result of the following
metal prices: $3.15/lb copper, $11.00/lb molybdenum, $18.00/oz silver with a
revenue ratio of 1.0, i.e. break- even logic.
- A constant 45-degree pit slope was used for the resource estimate.
- No haulage increment or bench discounting was applied to the resource
estimate.
The LG cone input parameters are summarized in Table 14-36.
TABLE 14-36: LERCHS-GROSSMAN CONE INPUTS
| |
Unit |
Value |
| Mining |
Mineralized
Material |
$/ton mined |
$1.00 |
| Waste Material |
$/ton mined |
$1.00 |
| Processing |
Oxide |
$/ton processed |
$4.00 |
| Mixed and Sulfide |
$/ton processed |
$5.00 |
| G&A |
$/ton processed |
$0.70 |
| Recovery |
Copper |
Oxide |
% |
65 |
| Mixed |
% |
40 |
| Sulfide |
% |
85 |
| Molybdenum |
Oxide |
% |
0 |
| Mixed |
% |
30 |
| Sulfide |
% |
60 |
| Silver |
Oxide |
% |
0 |
| Mixed |
% |
40 |
| Sulfide |
% |
75 |
| Metal Price |
Copper |
$/lb |
$3.15 |
| Molybdenum |
$/lb |
$11.00 |
| Silver |
$/troy oz |
$18.00 |
| Slope Angle |
Constant degrees |
45 |
Note: The recoveries in oxide present the recoverable portion
of the sulfides by the process plan flotation. The cost and price inputs are
considered approximation and were used to test the economic viability of the
resource. The cost and price inputs differ from the ones used for the reserve,
which used more accurate numbers.
The reporting of the mineral resource by NSR within the LG pit
shell, reflects the combined benefit of producing copper, molybdenum and silver
as per the following equations based on mineralized type, in addition to mine
operating and processing costs:
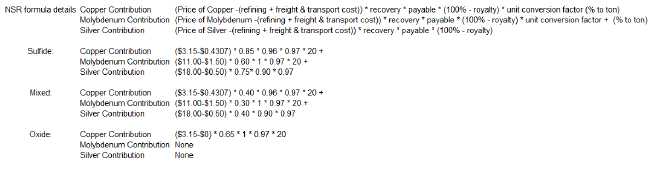
Page 14-70
|
|
Rosemont Project |
| Form
43-101F1 Technical Report |
The copper equivalency is calculated, using metal contributions
and economic inputs as noted above, for each block using the following formula:

In oxide material, since molybdenum and silver are not
considered, the copper equivalency value equals the copper value.
Table 14-37 presents the economic parameters used in addition
to the LG cone inputs to calculate the NSR and CuEq formulas mentioned above.
TABLE 14-37: ECONOMIC PARAMETERS
| Freight |
Copper |
$/ton of
Concentrate |
$130.00 |
| Smelter Charges |
Copper |
$/ton of
concentrate |
$72.00 |
| Molybdenum |
$/lb of
molybdenum includes freight |
$1.50 |
| Refining Charges |
Copper |
$/lb of copper |
$0.08 |
| Silver |
$/troy oz of
silver |
$0.50 |
| Smelting Terms |
Copper |
% concentrate |
30 |
| % payable |
96 |
| Molybdenum |
% concentrate
grade |
50 |
| % payable |
99 |
| Silver |
% payable |
90 |
| Royalty |
% |
3 |
Note: The cost and price inputs are considered approximation
and were used to test the economic viability of the resource. The cost and price
inputs differ from the ones used for the reserve, which used more accurate
numbers.
14.20
Mineral Resource Statement Inclusive of Mineral Reserve
Mineral resources for the Rosemont deposit were classified
under the 2014 CIM Definition Standards for Mineral Resources and Mineral
Reserves4 by application of a NSR that reflects the combined benefit
of producing copper, molybdenum and silver in addition to mine operating,
processing and off-site costs.
The mineral resources, classified as Measured, Indicated and
Inferred and are inclusive of the mineral reserves. Table 14-38 summarizes the
resource estimate.
Mineral resources that are not mineral reserves do not have
demonstrated economic viability. Due to the uncertainty that may be associated
with Inferred mineral resources it cannot be assumed that all or any part of
Inferred resources will be upgraded to an Indicated or Measured resource.
_________________________________________________________________
4
Ontario Securities Commission web site
(http://www.osc.gov.on.ca/en/15019.htm)
Page 14-71
|
|
Rosemont Project |
| Form
43-101F1 Technical Report |
TABLE 14-38: RESOURCE BY CATEGORY, MINERALIZED ZONE AND NSR
CUT-OFF
(1)(2)(3)(4)(5)(6)(7)(8)(9)(10)

Notes:
| |
1. |
The above mineral resources include mineral
reserves. |
| |
2. |
Domains were modelled in 3D to separate mineralized rock
types from surrounding waste rock. The domains were based on core logging,
structural and geochemical data. |
| |
3. |
Raw drill hole assays were composited to 25-foot lengths
broken at lithology boundaries. |
| |
4. |
Capping of high grades was considered necessary and was
completed for each domain on assays prior to compositing. |
| |
5. |
Block grades for copper, molybdenum and silver were
estimated from the composites using OK interpolation into 50 ft x 50 ft x
50 ft blocks coded by domain. |
| |
6. |
Tonnage factors were interpolated by lithology and
mineralized zone. Tonnage factors are based on 2,066 measurements
collected by Hudbay and previous operators. |
| |
7. |
Blocks were classified as Measured, Indicated or Inferred
in accordance with CIM Definition Standards 2014. |
| |
8. |
Mineral resources are constrained within a computer
generated pit using the LG algorithm. Metal prices of $3.15/lb copper,
$11.00/lb molybdenum and $18.00/troy oz silver. Metallurgical recoveries
of 85% copper, 60% molybdenum and 75% silver were applied to sulfide
material. Metallurgical recoveries of 40% copper, 30% molybdenum and 40%
silver were applied to mixed material. A metallurgical recovery of 65% for
copper was applied to oxide material. NSR was calculated for every model
block and is an estimate of recovered economic value of copper,
molybdenum, and silver combined. Cut-off grades were set in terms of NSR
based on current estimates of process recoveries, total process and
G&A operating costs of $5.70/ton for oxide, mixed and sulfide
material. |
| |
9. |
The oxide resource will be processed in the mill via
flotation |
| |
10. |
Totals may not add up correctly due to
rounding. |
14.21
Sensitivity of the Mineral Resource
The sensitivity of the mineral resource was assessed for
changes in copper, molybdenum and silver by reporting the estimation at lower
and several higher NSR cut-offs, as shown in Table 14-39, Table 14-40, and Table
14-41. The results show that the mineral resource is not highly sensitive to
small increases in NSR cut-offs (a proxy for changes in metal prices), therefore
concluding that the mineral resource is robust with respect to the inputs used
to estimate.
Page 14-72
|
|
Rosemont Project |
| Form
43-101F1 Technical Report |
TABLE 14-39: MEASURED RESOURCE BY MINERALIZED ZONE AND
MULTIPLE NSR CUTOFFS
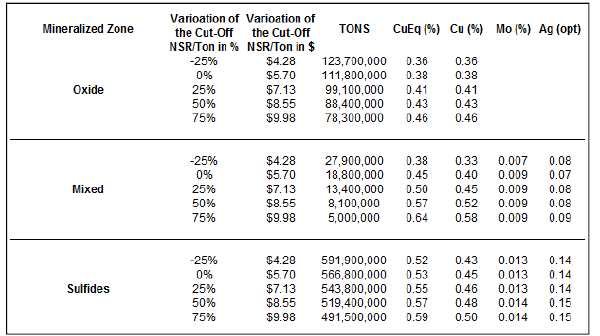
Note: Using a $5.70 per ton baseline NSR cut-off for oxide,
mixed and sulfide material.
TABLE 14-40: INDICATED RESOURCE BY MINERALIZED ZONE AND
MULTIPLE NSR CUTOFFS
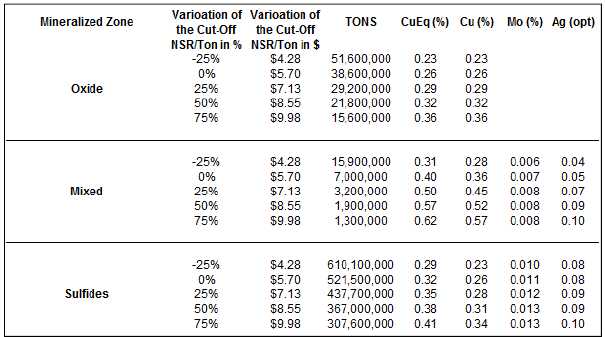
Note: Using a $5.70 per ton baseline NSR cut-off for oxide,
mixed and sulfide material.
Page 14-73
|
|
Rosemont Project |
| Form
43-101F1 Technical Report |
TABLE 14-41: INFERRED RESOURCE BY MINERALIZED ZONE AND
MULTIPLE NSR CUTOFFS
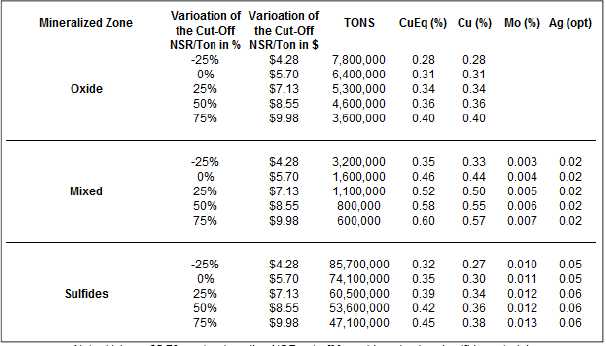
Note: Using a $5.70 per ton baseline NSR cut-off for oxide,
mixed and sulfide material.
14.22
Comparison with the 2012 Resource Estimates
A review and comparison of 2017 Hudbay mineral resource and
2012 Augusta mineral resource was completed. The results (Table 14-42) of
measured and indicated resources show that Hudbay reports a tonnage 29% higher,
with copper grades 8% lower to those estimated in 2012. Molybdenum and silver
grades are 17% and 4% lower than those reported in 2012. The 2017 oxide tonnage
shows a difference of +137% with +106% copper grades.
TABLE 14-42: MEASURED AND INDICATED, COMPARISON TO 2012
AUGUSTA ESTIMATE
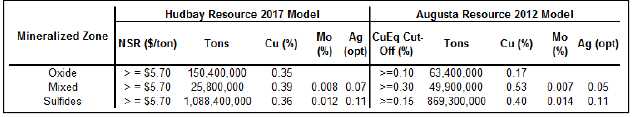
The difference in sulfide measured and indicated tonnage is
partially a result of reinterpretation of the oxide blanket surface, as
discussed in Section 7 of this report. Molybdenum grades are lower as a result
of factoring of historical molybdenum assays, as discussed in Section 11 of this
report. Silver grades are lower as a result of using regression against copper
to assign values to samples with missing silver assays.
Page 14-74
|
|
Rosemont Project |
| Form
43-101F1 Technical Report |
The significantly higher oxide tonnage and grade compared to
the 2012 estimate was a result of lowering of the oxide blanket surface. The
reduction of tons in the Inferred category is a direct result of the infill
drilling completed by Hudbay in 2014 and 2015. The comparison is shown in Table
14-43.
TABLE 14-43: INFERRED, COMPARISON TO 2012 AUGUSTA
ESTIMATE
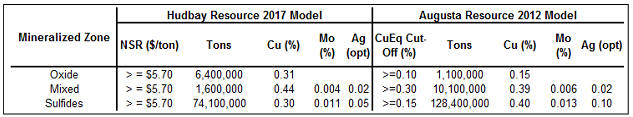
14.23
Factors That May Affect the Mineral Resource Estimate
Areas of uncertainty that may materially impact the mineral
resource estimate includes:
- Long-term commodity price assumptions
- Operating cost assumptions
- Metal recovery assumptions used and changes to the metallurgical recovery
assumptions as a result of new metallurgical testwork
- Changes to the tonnage and grade estimates may vary as a result of more
drilling, new assay and tonnage factor information
- Assumptions as to the ability to maintain patented mining claims and
surface rights, access to the site, obtain environmental and other regulatory
permits and obtain social license to operate
14.24
Conclusions
The mineral resource estimation is well-constrained by
three-dimensional wireframes representing geologically realistic volumes of
mineralization. Exploratory data analysis conducted on assays and composites
shows that the wireframes are suitable domains for mineral resource estimation.
Grade estimation has been performed using an interpolation plan designed to
minimize bias in the average grade.
As a result of validation steps conducted on the mineral
resource block model the following was concluded:
- Visual inspection of block grade versus composited data shows a good
reproduction of the data by the model.
- Checks for global bias in the grade estimates of the block model show
differences within acceptable levels (typically less than 3%) between the NN,
IDW and the OK models.
- Checks for local bias (swath plots) indicate good agreement between the
NN, IDW and OK for all variables.
Page 14-75
|
|
Rosemont Project |
| Form
43-101F1 Technical Report |
- A review and comparison of the 2017 Hudbay estimate and 2012 Augusta
estimate showed that the 2017 block model has greater tonnage and lower grades
than previously reported. The oxide tonnage and grade are significantly higher
in the 2017 model mainly due to lowering of the oxide blanket surface.
The impact of grade capping was evaluated by estimating
uncapped and capped assay data. Generally, the amounts of metal removed by
capping does not exceed 5%.
Mineral resources are constrained and reported using economic
and technical criteria such that the mineral resource has reasonable prospects
of economic extraction.
The estimated mineral resources for the Project conform to the
requirements of 2014 CIM Definition Standards – for Mineral Resources and
Mineral Reserves and requirements in Form 43-101F1 of NI 43-101, Standards of
Disclosure for Mineral Projects.
14.25
Recommendations
The author recommends that Hudbay further investigate the
cause(s) of the differences in average molybdenum grade of the historical
assays. Hudbay should also evaluate the application of nonlinear interpolation
or wireframing methods in the minor geological units.
It is also recommended that Hudbay further investigate
change-of-support correction and alternative approach to resource classification
taking into account the high production rate. This should be performed to ensure
that the resource classification properly reflect the reduced risk when a large
volume is mined and delivered to the mill on a quarterly and annual basis.
Finally, in order to better understand the distribution of gold
with sufficient confidence, the following steps should be taken:
| |
1. |
Select drill hole intervals located in zones that will be
mine as ore and sent to the mill and perform gold analysis on the pulps to
test the robustness of the proxy model. |
| |
2. |
Perform a variography analysis of the new dataset and
re-interpolate the gold grade following the same method as described in
this Technical Report. |
Page 14-76
|
|
Rosemont Project |
| Form
43-101F1 Technical Report |
15 MINERAL RESERVES ESTIMATE
The Mineral Reserves estimate for the Project are based on a
LOM which uses the block model described in Section 14, Mineral Resource
Estimates, with economic value calculation per block (NSR in $/ton) and mining,
processing, and engineering detail parameters. The mineral reserve economics are
described in Section 22.
This Mineral Reserves estimate has been determined and reported
in accordance with NI 43-101 and the classifications adopted by CIM Council in
November 2014. NI 43-101 defines Mineral Reserves as “the economically mineable
part of measured and indicated mineral resources.”
The Mineral Reserves estimate for the Project, which is
presented in this report, was prepared by Hudbay (Javier Toro - Director,
Technical Services) and under the supervision of Cashel Meagher.
This Technical Report includes refinements of certain aspects
of the Project’s mine plan. While consistency with issued and pending
environmental permits and analysis related thereto has always been a key
requirement for this effort, updates to the original mine plan will be
necessary. To the extent that any regulatory agency concludes that the current
plan requires additional environmental analysis or modification of an existing
permit, the intent will be to work with that agency to either complete the
required process or to adjust the current mine plan as necessary.
15.1
Pit Optimization
Revenue created from the Project will be generated from the
sale of copper and molybdenum concentrates to smelters and roasters who will
further refine the product. In addition, the copper concentrate contains payable
silver quantities.
Pit optimization of multi-element revenue generating deposits
like Rosemont can either be performed on the grade equivalent of all the revenue
generating elements expressed in terms of the predominant metal (copper in
Rosemont), or on the NSR.
A copper grade equivalent optimization model is simpler to
implement than a NSR model but is not able to adequately represent the many
variables used in the calculation of revenues as a NSR model can. Hudbay has
therefore decided to use a NSR optimization model despite its additional
complexity.
LG analyses were conducted using the Rosemont deposit model
(described in Section 14) to determine the ultimate pit limits and best
extraction sequence for open pit mine design (six pit phases were selected).
Only mineral resources classified as Measured or Indicated were considered as
potential ore in the LG analyses; all inferred resources were treated as waste.
Page 15-1
|
|
Rosemont Project |
| Form
43-101F1 Technical Report |
15.1.1 Block
model
The Block Model used for the Mineral Reserves estimation has
the original Mineral Resources estimation described in Section 14 as a base,
which has a Selective Mining Unit (“SMU”) of 50x50x50 feet.
The optimized models, which were created to simulate the actual
mining practice by utilizing the SMU block sizes, were considered undiluted
models.
An economic subroutine was developed to compute a NSR value for
each block in the deposit model. This computer algorithm incorporates block
grades, expected smelting/refining contracts (i.e., payables and deductions),
metallurgical recoveries and projected market prices for each metal (Cu, Mo and
Ag) to yield a net revenue value expressed in terms of US Dollars per ton. The
subroutine also applies to mining, ore processing and general/administration
costs to calculate a net dollar value per block, which includes adjustments for
surface topography. Concurrently, a NSR value in $ per ton is computed and
stored in the block model.
15.1.2
Metallurgical Recoveries
Metal recoveries were derived from metallurgical testwork
conducted by XPS. These tests included: grinding and flotation testwork. The
metallurgical testwork is fully described in Section 13.
Based on results from this testwork, Table 15-1 presents the
metallurgical recoveries used in the LG evaluations and subsequent mineral
reserve estimation. Only the three primary metals, copper, molybdenum and silver
were modelled and used in the revenue calculations. No recovery of molybdenum or
silver from oxide ore was projected.
TABLE 15-1: METALLURGICAL RECOVERIES USED IN LERCHS-GROSSMAN
EVALUATIONS
| Metal |
Oxide Ore |
Sulfide Ore |
Mixed Ore |
| Copper1 |
90.0 % |
90.0 % |
90.0 % |
| Molybdenum |
- |
63.0 % |
30.0 % |
| Silver |
- |
75.5 % |
38.0 % |
Note: 1. Expressed as recoveries of the quantity of copper
contained in sulfides.
15.1.3 Economic
Parameters
Table 15-2 summarizes the economic parameters and offsite costs
used in the base-case LG evaluations of the Rosemont deposit.
Page 15-2
|
|
Rosemont Project |
| Form
43-101F1 Technical Report |
TABLE 15-2: BASE-CASE LERCHS-GROSSMAN ECONOMIC
PARAMETERS
|
Parameter |
Units |
Value |
|
Revenue |
|
|
|
Metal Price |
|
|
|
Copper |
$/lb |
3.15 |
|
Molybdenum |
$/lb |
11.00 |
|
Silver |
$/oz |
18.00 |
|
Payable Contained Metal
|
|
|
|
Copper |
% |
96.5% |
|
Molybdenum |
% |
99.0% |
|
Silver |
% |
90.5% |
|
Concentrate grades |
|
|
|
Copper |
% |
30% |
|
Moly concentrate grade |
|
|
|
Molybdenum |
% |
45% |
|
Concentrate Moisture
Content |
|
|
|
Copper concentrate |
% |
8.0% |
|
Moly
concentrate |
% |
8.0% |
|
Smelting Charges |
|
|
|
Smelting charges - Cu conc (dry) |
$/dst Cu conc |
72.57 |
|
Roasting charges - Mo conc (dry) |
$/dst Mo conc |
1.50 |
|
Marketing Cost |
$/dst Cu conc |
5.08 |
|
Selling Cost (Freight)
|
|
|
|
Transport
Cu conc |
$/dst conc |
137.55 |
|
Refining charges |
|
|
|
Cu |
$/lb Cu |
0.08 |
|
Ag |
$/oz Ag |
0.50 |
|
S+T+R cost |
$/lb Cu |
0.4517 |
|
Royalties |
|
|
|
Royalties
|
% of NSR |
3.0% |
|
Cost |
|
|
|
Mining Cost |
|
|
|
Ore |
$/tmined |
1.14 |
|
Waste |
$/tmined |
1.14 |
|
Incremental Cost by Bench |
|
|
|
Up |
$/tmined |
- |
|
Down |
$/tmined |
0.024 |
|
G&A Cost |
|
|
|
Ore |
$/milled |
1.00 |
|
Process Cost |
|
|
|
Sulfide |
$/milled |
5.00 |
|
Mixed |
$/milled |
5.00 |
|
Oxide |
$/milled |
5.00 |
The in-situ NSR value is first calculated and coded into each
block in the model. This is to allow the pit optimization of the multi-element
Rosemont deposit to be carried out on the in-situ NSR values. The following
process is the procedure that was developed in order to achieve the NSR
calculation:
- In-situ NSR is the net value of metals contained in a concentrate produced
from an ore block after smelting and refining. Using the concentrator recovery
of the metals with the concentrate and the grade of the concentrate produced,
the mass pull of each block in the
resource model expressed in terms of tons of
concentrate per ton of ore processed is first estimated.
Page 15-3
|
|
Rosemont Project |
| Form
43-101F1 Technical Report |
- The value of the payable metals in the concentrate is then calculated
based on agreed payable metal content in the concentrate subject to deductions
with smelters, refineries and roasters. In the case of the copper concentrate,
the payable precious metal silver is added to the value of the payable copper.
For the molybdenum concentrate, only the molybdenum metal is payable.
- From the value of the payable metals, the selling costs, which include
marketing costs, transportation costs, port charges, insurance costs, shipping
costs, and smelting charges expressed in $/dmt concentrate and other
deductions like the refining charges and price participation (if applicable)
expressed in $/payable metal are taken out to obtain the gross concentrate NSR
value (before royalties).
- The applicable royalties are then deducted from the gross concentrate NSR
value to obtain the net concentrate NSR value (after royalty). The concentrate
NSR value calculations described above are applied for both the copper and
molybdenum concentrates.
- The concentrate NSR value after royalty for the copper and molybdenum
concentrates are then multiplied by their respective mass pull expressed in
tons of concentrate produced per tonne of ore processed to obtain the
contribution of each metal in the concentrate to the in- situ NSR value.
- The in-situ NSR of each block in the normalized resource model is the sum
of the in-situ NSR value from the copper concentrate and the molybdenum
concentrate.
Only Measured and Indicated Resource model block categories
with NSR values greater than their processing costs are considered potential ore
while blocks which have NSR values less than their processing costs are
considered waste.
Process plant recoveries, throughput, operating costs, and
concentrate grades vary by ore type. Consistent with ore reserve reporting
guidelines, only Measured and Indicated resources are coded to generate revenues
in the NSR model. Inferred resources are coded and reported as waste.
Processing metal recoveries for copper and silver are fixed
numbers depending on metallurgical domain while molybdenum is calculated by
formula linked to molybdenum and copper feed grades, and copper recovery. Copper
and silver grades in the copper concentrate are calculated by formula. The grade
of molybdenum in the molybdenum concentrate is a fixed number.
15.1.4 NSR Input
Parameters
The revenue, recovery and cost input parameters used for pit
optimization are shown in Table 15-1 and Table 15-2.
Page 15-4
|
|
Rosemont Project |
| Form
43-101F1 Technical Report |
15.1.5 Pit Slope
Guidance
Overall slope angles used on the LG evaluations were derived
from the geotechnical recommendations made by CNI & Hudbay for pit slope
designs. The overall slopes were adjusted to accommodate the recommended slope
angles and the anticipated placement of internal haulage ramps along the pit
walls in certain design sectors to be used as berms (step outs). Hudbay assigned
slopes angles for each block of resources model, and a slope code was assigned
to the block representing each of the pit slopes. The slope codes and pit slopes
are then read as input to the LG analysis. The plan view and the design
parameters by sector are shown in Figure 15-1 and Table 15-3
respectively.
FIGURE 15-1: PLAN VIEW CONTOURS OF SELECTED LERCHS-GROSSMAN
PIT SHELL
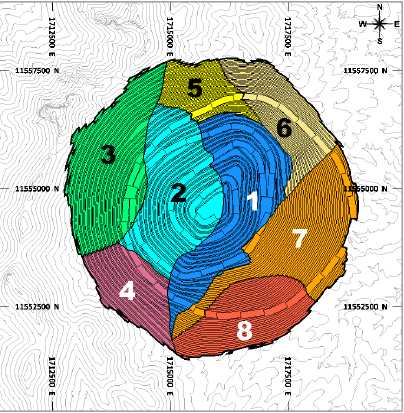
TABLE 15-3: OVERALL SLOPE ANGLES USED IN LERCHS-GROSSMAN
ANALYSIS
Geotechnical
Sector |
Bench Height,
feet |
Bench Face
Angle° |
Inter-Ramp
Slope Angle° |
Catch
Bench, feet |
Overall Slope
Angle° |
| 1 |
100 |
70 |
50 |
48 |
42 |
| 2 |
100 |
65 |
46 |
50 |
40 |
| 3 |
100 |
65 |
48 |
44 |
45 |
| 4 |
100 |
65 |
48 |
44 |
45 |
| 5 |
50 |
65 |
46 |
25 |
43 |
| 6 |
50 |
65 |
44 |
29 |
41 |
| 7 |
50 |
55 |
33 |
42 |
31 |
| 8 |
50 |
55 |
33 |
42 |
31 |
Page 15-5
|
|
Rosemont Project |
| Form
43-101F1 Technical Report |
15.1.6
Lerchs-Grossman Analyses
All LG analyses were restricted to prevent the pit shells from
crossing the topographic ridge immediately west of the deposit. This was done
due to permit constraints.
The base-case LG pit shell 40 is defined by the recoveries and
economic parameters listed in Table 15-1 and Table 15-2, respectively. This pit
shell contains about 710 million tons of Measured and Indicated mineral resource
above an internal NSR cut-off of $6.00/ton. The resulting stripping ratio is
about 2.24:1 (tons waste per ton of ore). However, this is not the pit shell
selected for pit design Several economic analyses were developed for each nested
pit. The purpose of this assessment was to evaluate free discounted cash flow,
revenue, stripping ratio, development and sustaining capital. Figure 15-2
presents the results of the LG price and price sensitivity analyses,
respectively.
FIGURE 15-2: ROSEMONT WHITTLE RESULTS, REVENUE FACTOR
SENSITIVITY

Pit shell 30 was generated at a 0.80 revenue factor and
contains approximately 622 M st of Ore and 1,269 M st of Waste. The pit shell
captures about 99.3% of the Net Cash flow of the base revenue factor (RF) 1 pit
shell 40. This pit generates a lower stripping ratio, better economics greater
total revenue, and capital costs than other pits evaluated for the Project.
The selected LG pit shell 30 is shown in plan view in Figure
15-3 and in cross-section view in Figure 15-4.
Page 15-6
|
|
Rosemont Project |
| Form
43-101F1 Technical Report |
FIGURE 15-3: PLAN VIEW CONTOURS OF SELECTED LERCHS-GROSSMAN
PIT SHELL

FIGURE 15-4: AA’ SECTION VIEW OF SELECTED LERCHS-GROSSMAN PIT
SHELL
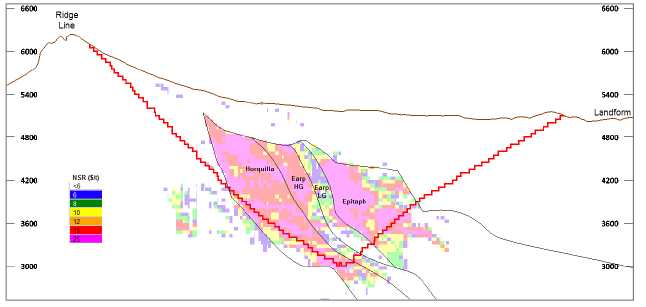
15.1.7 Pit Design
Criteria
Design criteria for final pit takes into consideration the
geotechnical recommendations summarized earlier in Table 15-3, pushback (mine
phase) width, phase sequence, haul roads and access, berms, ditches as well as
other engineering considerations. Mine phase, or pushback, widths are typically
Page 15-7
|
|
Rosemont Project |
| Form
43-101F1 Technical Report |
320 feet. The summary parameters used in the design of the
ultimate pit are presented in Table 15-4.
TABLE 15-4: PIT DESIGN PARAMETERS
| Parameter |
Value |
| Bench height |
50 – 100 feet |
| Bench face angle |
55 – 70° |
| Catch bench interval |
25 – 50 feet |
| Road width (including ditch & safety berm) |
110 feet |
| Nominal road gradient |
10 % |
| Minimum pushback width |
320 feet |
15.2
Mineral Reserves
The Rosemont Mineral Reserves estimation is based on Measured
and Indicated resources. Therefore, the potential exists for Inferred Mineral
Resources within the ultimate pit to be included and reported as waste, as they
currently do not meet the economic and mining requirements to be categorized as
Mineral Reserves. It cannot be assumed that all or any part of Inferred mineral
resources will ever be upgraded to a higher category.
The mining phase and ultimate pit designs were applied to the
3D resource block model of the deposit described in Section 14 to estimate
contained tonnages and grades.
15.2.1 Ore
Definition Parameters
The base-case price and operating cost estimates presented in
Table 15-2 are used as the economic envelope to define ore in the mineral
reserve estimates.
Mineralized oxide and mixed materials that are indicated to be
economic (above an internal NSR cut-off of $6.00/ton) in the optimized pit
analysis are included in the pit ore reserves for this study.
15.2.2 Material
Densities
Bulk material densities, which vary by rock type, were read
from values stored in the resource block model. These assignments are described
in more detail in Section 14. Generally, rock tonnage factors range between 11.7
ft3/ton and 12.4 ft3/ton, with an average of 12.10
ft3/ton for the rock contained within the ultimate pit.
15.2.3
Dilution
The Rosemont deposit is a well-disseminated polymetallic
deposit that has large ore zones above the anticipated internal cut-off grade.
With the planned bulk mining method, external ore dilution along the ore - waste
contact edges is generally assessed to determine whether the feed grade from the
run of mine production is adequately represented by those predicted from the
resource block model.
Page 15-8
|
|
Rosemont Project |
| Form
43-101F1 Technical Report |
The resource block model dimensions are 50x50x50 feet. The
interpolated metal grade is averaged for the entire block. When the Project
commences operations, ore feed will be delineated by implementing a detailed
blasthole sampling program. Drill blast patterns will be smaller, 30 feet to 30
feet, than the resource block dimensions, thereby providing a better definition
than from the resource model. This new definition will be provided by a new
block model built by assays from blastholes projects, dynamic or short range
block model, which is a common practice in Hudbay operations.
The author has confirmed that enough geological dilution is
already incorporated in the resource model due to the smoothing effect of
kriging. Based on experience in similar types of skarn deposits and scale of
operation, it is reasonable to use the resource tonnes and grade from the
individual 50 ft x 50 ft x 50 ft blocks from the resource model without any
additional adjustment for ore losses or mining dilution.
15.2.4 Mineral
Resource and Mineral ReserveStatement
Proven and probable mineral reserves for the Rosemont deposit
are summarized in Table 15-5. Proven and probable mineral reserves within the
designed final pit total 592 million tons grading 0.45% Cu, 0.012% Mo and 0.13
oz Ag/ton. There are 1.25 billion tons of waste material, resulting in a
stripping ratio of 2.1:1 (tons waste per ton of ore). Total material in the pit
is 1.84 billion tons. Contained metal in proven and probable mineral reserves is
estimated at 5.30 billion pounds of copper, 142 million pounds of molybdenum and
79 million ounces of silver.
Nearly 80% of the mineral reserves in the Rosemont ultimate pit
are classified as proven with the remaining 20% identified as probable. The
classifications are based on the exploration drilling in the Rosemont deposit.
All of the mineral reserves estimate reported are contained in the mineral
resource estimates presented in Section 14.
The Rosemont ultimate pit contains approximately 10 million
tons of inferred mineral resources that are above the $6.00/ton NSR cut-off
value for ore. Inferred mineral resources are considered too speculative
geologically to have the economic considerations applied to them that would
enable them to be categorized as mineral reserves.
The mineral reserves estimate presented in this report is
dependent on market prices for the contained metals, metallurgical recoveries
and ore processing, mining and general/administration cost estimates. Mineral
reserve estimates in subsequent evaluations of the Rosemont deposit may vary
according to changes in these factors. As of the effective date of this report,
there are no other known mining, metallurgical, infrastructure or other relevant
factors that may materially affect the mineral reserve estimates.
Proven and Probable mineral reserves for the Rosemont deposit
are summarized in Table 15-5 and classified by ore type in Table 15-6.
Illustrations of the ultimate pit in plan and section view against economic
shell 30 are shown in Figure 15-5 and Figure 15-6.
Page 15-9
|
|
Rosemont Project |
| Form
43-101F1 Technical Report |
TABLE 15-5: PROVEN AND PROBABLE MINERAL RESERVES IN ROSEMONT
FINAL PIT
|
|
Short Tons |
TCu1 % |
SCu2 % |
ASCu3 % |
Mo % |
Ag opt |
NSR $/t |
CuEq4 %
|
|
Proven |
469,708,117 |
0.48 |
0.43 |
0.05 |
0.012 |
0.14 |
22.1 |
0.56 |
|
Probable |
122,324,813 |
0.31 |
0.28 |
0.03 |
0.010 |
0.09 |
14.7 |
0.38 |
|
Total |
592,032,930 |
0.45 |
0.40 |
0.05 |
0.012 |
0.13 |
20.57 |
0.53 |
Notes:
| |
1. |
TCu % corresponds to the total copper grade. |
| |
2. |
SCu % grade corresponds to the sulfide copper in the Ore.
As per formula SCU = TCU – ASCu |
| |
3. |
ASCu % grade corresponds to the soluble copper. |
| |
4. |
CuEq% is calculated based on metal prices of $3.15/lb Cu,
$11.00/lb Mo and $18.00/oz Ag. |
TABLE 15-6: PROVEN AND PROBABLE MINERAL RESERVES IN ROSEMONT
FINAL PIT BY ORE TYPE
|
Ore Type |
Short Tons |
TCu1 % |
SCu2 % |
ASCu3 % |
Mo % |
Ag opt |
NSR $/t |
CuEq4 %
|
|
Sulfide |
542,969,276 |
0.45 |
0.41 |
0.04 |
0.013 |
0.14 |
21.5 |
0.53 |
|
Proven |
431,620,325 |
0.49 |
0.45 |
0.04 |
0.013 |
0.15 |
23.1 |
0.57 |
|
Probable |
111,348,950 |
0.31 |
0.29 |
0.03 |
0.011 |
0.09 |
15.1 |
0.38 |
|
Mixed |
26,477,889 |
0.33 |
0.25 |
0.08 |
0.007 |
0.07 |
11.8 |
0.37 |
|
Proven |
18,743,016 |
0.34 |
0.25 |
0.09 |
0.008 |
0.08 |
12.0 |
0.39 |
|
Probable |
7,734,873 |
0.30 |
0.24 |
0.06 |
0.007 |
0.05 |
11.3 |
0.34 |
|
Oxide5 |
22,585,766 |
0.50 |
0.24 |
0.26 |
- |
- |
9.8 |
0.50 |
|
Proven |
19,344,776 |
0.52 |
0.24 |
0.28 |
- |
- |
9.9 |
0.52 |
|
Probable |
3,240,990 |
0.38 |
0.22 |
0.17 |
- |
- |
8.9 |
0.38 |
|
Total |
592,032,930 |
0.45 |
0.40 |
0.05 |
0.012 |
0.13 |
20.6 |
0.53 |
Notes:
| |
1. |
TCu % corresponds to the total copper grade. |
| |
2. |
SCu % grade corresponds to the sulfide copper in the Ore.
As per formula SCU = TCU – ASCu |
| |
3. |
ASCu % grade corresponds to the soluble copper. |
| |
4. |
CuEq% is calculated based on metal prices of $3.15/lb Cu,
$11.00/lb Mo and $18.00/oz Ag. |
| |
5. |
Oxide ore refers only to the sulfide copper
species. |
Page 15-10
|
|
Rosemont Project |
| Form
43-101F1 Technical Report |
FIGURE 15-5: PLAN VIEW OF ROSEMONT FINAL PIT AND ECONOMIC
SHELL 30
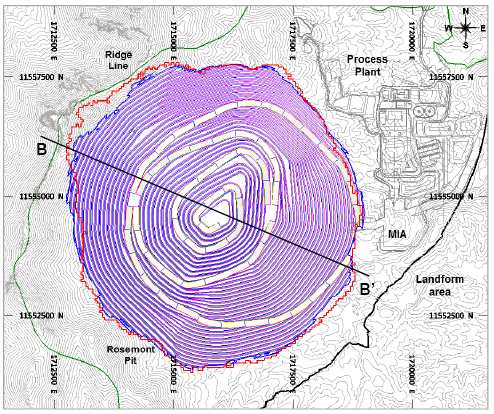
FIGURE 15-6: SECTION VIEW BB’ OF ROSEMONT FINAL PIT AND
ECONOMIC SHELL 30
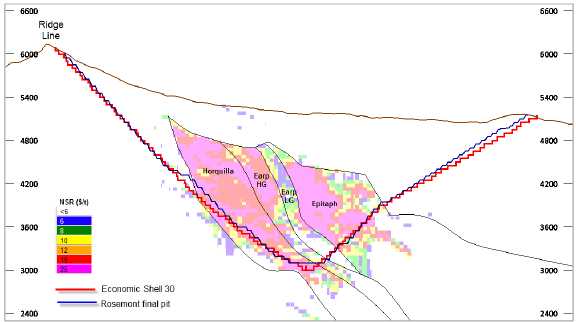
Table 15-7 presents the mineral resource estimates exclusive of
the mineral reserve estimates, i.e. the mineral resources located inside the
resource pit shell and outside of the pit design. It represents
Page 15-11
|
|
Rosemont Project |
| Form
43-101F1 Technical Report |
the portion of the mineral resources estimate with potential
for economic extraction after the current mineral reserves estimate has been
mined and processed.
TABLE 15-7: ROSEMONT MINERAL EXCLUSIVE RESOURCE
ESTIMATES
| Measured |
TONS |
NSR Cut Off |
CuEq (%) |
Cu (%) |
Mo (%) |
Ag (opt) |
| Oxide |
54,000,000 |
> = $5.70 |
0.41 |
0.41 |
|
|
| Mix |
5,000,000 |
> = $5.70 |
0.45 |
0.41 |
0.008 |
0.047 |
| Hypogene |
118,700,000 |
> = $5.70 |
0.44 |
0.36 |
0.014 |
0.117 |
| Summary |
177,700,000 |
|
0.43 |
0.38 |
0.009 |
0.079 |
| |
|
|
|
|
|
|
| Indicated |
TONS |
NSR Cut Off |
CuEq (%) |
Cu (%) |
Mo (%) |
Ag (opt) |
| Oxide |
18,600,000 |
> = $5.70 |
0.27 |
0.27 |
|
|
| Mix |
2,600,000 |
> = $5.70 |
0.36 |
0.34 |
0.005 |
0.037 |
| Hypogene |
392,000,000 |
> = $5.70 |
0.31 |
0.25 |
0.012 |
0.080 |
| Summary |
413,200,000 |
|
0.31 |
0.25 |
0.011 |
0.076 |
| |
|
|
|
|
|
|
| Measured + Indicated |
TONS |
NSR Cut Off |
CuEq (%) |
Cu (%) |
Mo (%) |
Ag (opt) |
| Oxide |
72,700,000 |
> = $5.70 |
0.38 |
0.38 |
|
|
| Mix |
7,600,000 |
> = $5.70 |
0.42 |
0.38 |
0.007 |
0.044 |
| Hypogene |
510,700,000 |
> = $5.70 |
0.34 |
0.27 |
0.012 |
0.088 |
| Summary |
591,000,000 |
|
0.35 |
0.29 |
0.011 |
0.077 |
| |
|
|
|
|
|
|
| Inferred |
TONS |
NSR Cut Off |
CuEq (%) |
Cu (%) |
Mo (%) |
Ag (opt) |
| Oxide |
3,500,000 |
> = $5.70 |
0.33 |
0.33 |
|
|
| Mix |
1,300,000 |
> = $5.70 |
0.47 |
0.45 |
0.004 |
0.019 |
| Hypogene |
63,900,000 |
> = $5.70 |
0.35 |
0.29 |
0.011 |
0.049 |
| Summary |
68,700,000 |
|
0.35 |
0.30 |
0.010 |
0.046 |
Notes:
| |
1. |
Domains were modelled in 3D to separate mineralized rock
types from surrounding waste rock. The domains were based on core logging,
structural and geochemical data. |
| |
2. |
Raw drill hole assays were composited to 25-foot lengths
broken at lithology boundaries. |
| |
3. |
Capping of high grades was considered necessary and was
completed for each domain on assays prior to compositing. |
| |
4. |
Block grades for copper, molybdenum and silver were
estimated from the composites using OK interpolation into 50 ft x 50 ft x
50 ft blocks coded by domain. |
| |
5. |
Tonnage factors were interpolated by lithology and
mineralized zone. Tonnage factors are based on 2,066 measurements
collected by Hudbay and previous operators. |
| |
6. |
Blocks were classified as Measured, Indicated or Inferred
in accordance with CIM Definition Standards 2014. |
| |
7. |
Mineral resources are constrained within a computer
generated pit using the LG algorithm. Metal prices of $3.15/lb copper,
$11.00/lb molybdenum and $18.00/troy oz silver. Metallurgical recoveries
of 85% copper, 60% molybdenum and 75% silver were applied to sulfide
material. Metallurgical recoveries of 40% copper, 30% molybdenum and 40%
silver were applied to mixed material. A metallurgical recovery of 65% for
copper was applied to oxide material. NSR was calculated for every model
block and is an estimate of recovered economic value of copper,
molybdenum, and silver combined. Cut-off grades were set in terms of NSR
based on current estimates of process recoveries, total process and
G&A operating costs of $5.70/ton for oxide, mixed and sulfide
material. |
| |
8. |
The oxide resource will be processed in the mill via
flotation. |
| |
9. |
Totals may not add up correctly due to
rounding. |
15.2.5 Factors
That May Affect the Mineral Reserves Estimate
Areas of uncertainty that may materially impact the mineral
resource estimate includes:
- Long-term commodity price assumptions.
- Operating cost assumptions.
- Metal recovery assumptions used and changes to the metallurgical recovery
assumptions as a result of new metallurgical testwork.
- Changes to the tonnage and grade estimates may vary as a result of more
drilling, new assay and tonnage factor information.
Page 15-12
|
|
Rosemont Project |
| Form
43-101F1 Technical Report |
15.2.6
Comparison with the 2012 Mineral Reserves
A review and comparison of 2017 Hudbay mineral reserves and
2012 Augusta mineral reserves was completed. The results (Table 15-8) of proven
and probable reserves show that Hudbay reports a tonnage 11% lower, with copper
grades 2% higher. Molybdenum and silver grades are 17% lower and 11% higher,
respectively, to those estimated in 2012.
TABLE 15-8: PROVEN AND PROBABLE, COMPARISON TO 2012 AUGUSTA
RESERVE ESTIMATE
|
Category |
Hudbay Reserves 2017 |
Augusta Reserves 2012
Model |
| Tons |
Cu (%) |
Mo (%) |
Ag
(opt) |
Tons |
TCu
(%) |
Mo (%) |
Ag
(opt) |
|
Proven |
469,708,117 |
0.48 |
0.012 |
0.14 |
308,075,000 |
0.46 |
0.015 |
0.12 |
|
Probable |
122,324,813 |
0.31 |
0.010 |
0.09 |
359,131,000 |
0.42 |
0.014 |
0.12 |
|
TOTAL |
592,032,930 |
0.45 |
0.012 |
0.13 |
667,206,000 |
0.44 |
0.014 |
0.12 |
The changes between 2012 and 2017 Reserves estimate can be
mostly attributed to a revision of the mining, processing and general &
administration cost assumptions, resulting in a marginally higher cut-off in
2017.
Page 15-13
|
|
Rosemont Project |
| Form
43-101F1 Technical Report |
16
MINING METHODS
16.1
Mine Overview
The Rosemont deposit is a large tonnage, skarn-hosted,
porphyry-intruded, copper-molybdenum deposit located in close proximity to the
surface. The Project will be a traditional open pit shovel/truck operation. The
Project consists of open pit mining and flotation of sulfide minerals to produce
commercial grade concentrates of copper and molybdenum. Payable silver will
report to the copper concentrate.
The proposed pit operations will be conducted from 50-foot-high
benches using large-scale mine equipment, including: 10-5/8-inch-diameter rotary
blast hole drills, 60 yd3 class electric mining shovels, 46 yd3
class hydraulic shovel, 25 yd3 front-end loader, and 260-ton
capacity off-highway haul trucks.
The Rosemont final pit will measure approximately 6,000 feet
east to west, 6,000 feet north to south, and have a total depth of approximately
2,900 feet down to 3,100 feet (AMSL). There is one primary WRSA, which is
located 1,200 feet south east of the Rosemont final pit. The processing facility
is located approximately 1,000 feet east of the final pit, while the dry stack
tailings facility (“DSTF”) is located 1,500 feet southeast of the Rosemont pit.
The final pit and facilities can be seen in Figure 16-1.
The mine production plan contains 592 million tons of ore and
approximately 1.25 billion tons of waste, yielding a life of mine waste to ore
stripping ratio of 2.1 to 1. The mine has a 19-year life (including
pre-stripping period but excluding initial haul road development), with ore to
be delivered to the processing plant at a throughput of 90,000 tpd. Mine
operations are scheduled for 24 hours per day, 365 days per year. A mining rate
of 132 million tons per year through year 11 will be required to provide the
assumed nominal process feed rate of 32.9 million tons of ore per year. From
year 12 through year 18, the annual mining rate decreases due to lower stripping
ratios, starting with an average of 50 million tons per year and ending with
approximately 33 million tons in production year 18. Ore shortfall will be made
up from stockpiled ore.
Page 16-1
|
|
Rosemont Project |
| Form
43-101F1 Technical Report |
FIGURE 16-1: ROSEMONT MINE PLAN SITE LAYOUT
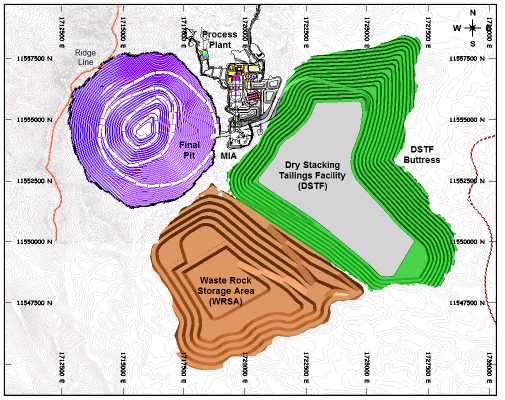
16.2
Mine Phases
16.2.1 Design
Criteria
Mine phases and ultimate pit for the Project are designed for
large-scale mining equipment (specifically, 60 yd3 class electric
shovels and 260-ton haulage trucks) and are derived from the selected LG pit
shells described in the previous section. The design process included smoothing
pit walls, eliminating or rounding significant noses and notches that may affect
slope stability, and providing access to working faces by developing internal
ramps (dual ramp for final pit). The summarized parameters used in the design of
mine pit phases are presented in Table 16-1.
TABLE 16-1: PIT DESIGN PARAMETERS
| Parameter |
Value |
| Bench height |
50 – 100 feet |
| Bench face angle |
55 – 70° |
| Catch bench interval |
25 – 50 feet |
| Road width (including ditch & safety berm) |
110 feet |
| Nominal road gradient |
10 % |
| Minimum pushback width |
320 feet |
Page 16-2
|
|
Rosemont Project |
| Form
43-101F1 Technical Report |
16.2.2 Pit Slopes
Angles
For the pit design, the targeted minimum mining width is 320
feet and employs the wall slope design provided by CNI and Hudbay. Table 16-2
lists the configuration of the recommended pit slope configuration for each
sector, and Figure 16-2 shows the Ultimate Pit Slope Design with the
corresponding Geotechnical Sectors.
TABLE 16-2: ROSEMONT SLOPE GUIDANCE
Geotechnical
Sector |
Bench
Height, feet |
Bench Face
Angle° |
Inter-Ramp
Slope Angle° |
Catch
Bench, feet |
Overall Slope
Angle° |
| 1 |
100 |
70 |
50 |
48 |
42 |
| 2 |
100 |
65 |
46 |
50 |
40 |
| 3 |
100 |
65 |
48 |
44 |
45 |
| 4 |
100 |
65 |
48 |
44 |
45 |
| 5 |
50 |
65 |
46 |
25 |
43 |
| 6 |
50 |
65 |
44 |
29 |
41 |
| 7 |
50 |
55 |
33 |
42 |
31 |
| 8 |
50 |
55 |
33 |
42 |
31 |
FIGURE 16-2: ROSEMONT GEOTECHNICAL SECTORS

16.2.3 Mine Phases
and Ultimate Pit
Six mining phases define the extraction sequence for the
Rosemont deposit. The phase development strategy consists of extracting the
higher metal grades along with minimum strip ratios during the initial years to maximize the economic benefits of
the ore-body, while enabling smooth transitions in waste stripping throughout
the life of the mine to ensure enough ore exposure for mill feed.
Page 16-3
|
|
Rosemont Project |
| Form
43-101F1 Technical Report |
Mine Phase 1
The starter pit, Phase 1, is fit approximately to the LG pit
shell defined by a $1.26/lb Cu price (equivalent to 40% of base metal price
sensitivity case). This pit is located about 3,500 feet west of the primary
crusher and ranges in elevation from 5,800 to 4,350 feet AMSL. The phase is
approximately 3,000 feet wide east-west and 4,000 feet north-south. The upper
benches will be dozed down until haul road access can be developed to the 5,700
feet elevation (AMSL). Phase 1 will develop approximately 85 million tons of ore
at a stripping ratio of 2.2:1 (tons waste per ton of total ore). An illustration
of the Phase 1 pit is shown in Figure 16-3.
Phase 1 material will be accessed via a haul road, 2C, which
will be constructed from the pit exit eastward to the primary crusher. This road
will also branch off towards the WRSA. These roads will be used for the life of
the Project, and will also be extended to access the DSTF.
The pit entrance is at the 5,150 feet elevation (AMSL), and a
ramp from that location enters the pit in a counter clockwise direction. The
ramp switches back at the 4,950, and 4,650 feet elevations (AMSL) before
reversing to a counter clockwise direction to the bottom of the pit. All benches
are accessed by a double lane width haul road.
FIGURE 16-3: PLAN VIEW OF MINING PIT PHASE 1
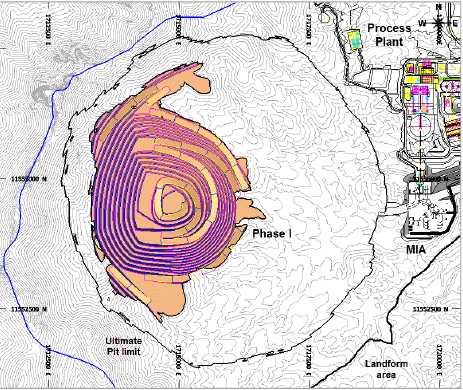
Page 16-4
|
|
Rosemont Project |
| Form
43-101F1 Technical Report |
Mine Phase 2
Mining Phase 2 will expand the pit roughly 600 feet to the
north, 400 feet to the east and 500 feet to the southeast. Bench toe elevations
will range from 5,450 to 4,050 feet (AMSL). The phase is 2,500 feet wide
east-west and 4,000 feet north-south. Phase 2 will supply over 88 million tons
of ore. The average stripping ratio for this pushback is 1.3:1. An illustration
of the Phase 2 pit is shown in Figure 16-4.
The pit entrance is at the 5,150 feet elevation (AMSL), and a
ramp from that location enters the pit in a counter clockwise direction. The
ramp switches back at the 4,950, and 4,650 feet elevations (AMSL).
FIGURE 16-4: PLAN VIEW OF MINING PIT PHASE 2
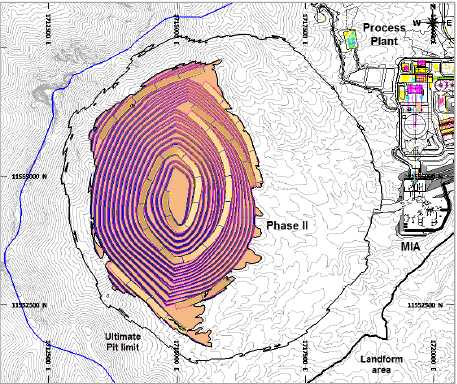
Mine Phase 3
The open pit is further expanded 500 to 600 feet to the east
with the development of Phase 3. The easternmost limits of this pushback lie
about 2,500 feet west of the primary crusher. Benches will range between 5,500
and 3,750 feet toe elevations (AMSL). The phase is 3,400 feet wide east-west and
5,000 feet long north-south. Over 75 million tons of ore will be generated by
Phase 03 at an average stripping ratio of 2.4:1.
The pit entrance is at the 5,150 feet elevation (AMSL), and a
ramp from that location enters the pit in a counter clockwise direction. The
ramp switches back at the 4,950 feet elevation (AMSL) to the bottom of the pit.
An illustration of the Phase 3 pit is shown in Figure 16-5.
Page 16-5
|
|
Rosemont Project |
| Form
43-101F1 Technical Report |
FIGURE 16-5: PLAN VIEW OF MINING PIT PHASE 3
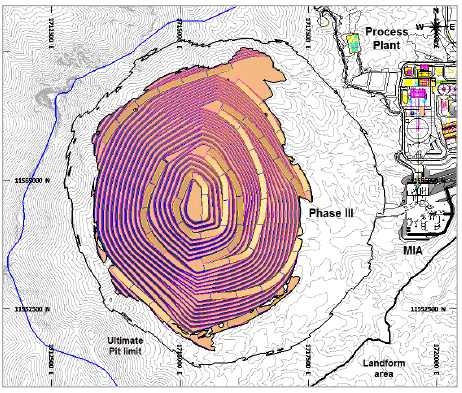
Mine Phase 4
Phase 4 will expand the open pit about 600 feet to the east and
400 feet to the north. The easternmost limits of this pushback lie about 2,000
feet west of the primary crusher. Phase 4 benches range in elevation between
5,300 and 3,650 feet AMSL. The phase is 2,500 feet wide east-west and 5,500 feet
north-south. Phase 4 will produce nearly 64 million tons of ore at a stripping
ratio of 2.9:1. Phases 2, 3 and 4 fit approximately to the LG pit shell defined
by a $1.30/lb Cu price (equivalent to 41% of base case metal price sensitivity).
This expansion from the Phase 1 pit is split into 3 separate pushbacks, all in
the same general direction. For each phase expansion, the ramp on the east side
of the pit is re-developed. An illustration of the Phase 4 pit is shown in
Figure 16-6.
The pit entrance is at the 5,100 feet elevation (AMSL), and a
ramp from that location enters the pit in a counter clockwise direction. The
ramp switches back at the 4,850, 4,450, and 4,200 feet elevations (AMSL) before
reversing to a clockwise direction to the bottom of the pit.
Page 16-6
|
|
Rosemont Project |
| Form
43-101F1 Technical Report |
FIGURE 16-6: PLAN VIEW OF MINING PIT PHASE 4

Mine Phase 5
Phase 5 is fit approximately to the LG pit shell defined by a
$1.50/lb Cu price (equivalent to 47% of base case metal price value
sensitivity). Mining Phase 5 expands the pit approximately 300 feet to the north
and 600 feet to the east. The easternmost limits of this pushback lie about
1,200 feet west of the primary crusher. Phase 5 bench elevations range between
5,300 and 3,450 feet (AMSL). The phase is 3,000 feet wide east-west and 5,000
feet north-south. Phase 5 will produce nearly 60 million tons of ore at a
stripping ratio of 2.5:1. The ramp on the east side of the pit is developed for
this phase. An illustration of the Phase 5 pit is shown in Figure 16-7.
The pit entrance is at the 5,050 feet elevation (AMSL), and a
ramp from that location enters the pit in a counter clockwise direction. The
ramp switches back at the 4,800, 4,450, 4,200 and 3,900-feet elevations (AMSL)
before reversing to a counter clockwise direction to the bottom of the pit.
Page 16-7
|
|
Rosemont Project |
| Form
43-101F1 Technical Report |
FIGURE 16-7: PLAN VIEW OF MINING PIT PHASE 5
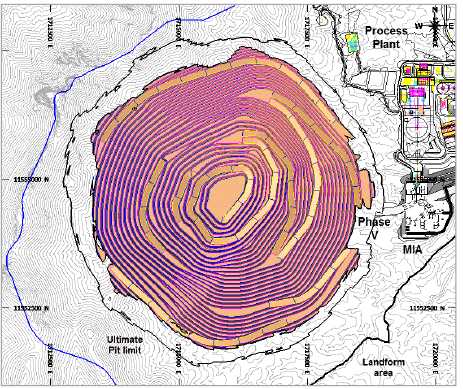
Mine Phase 6 and Ultimate Pit
The final pushback, Phase 6, extends the open pit from 300 to
600 feet along the east side to its ultimate limits and down to its maximum
depth at the 3,100 feet elevation (AMSL). The ultimate pit will be about 6,000
feet wide east-west and 6,500 feet wide north-south. Phase 6 is fit
approximately to the LG pit shell defined by a $2.52/lb Cu price (equivalent to
80% of base case metal price value sensitivity). Phase 6 will generate nearly
220 million tons of ore at a stripping ratio of 2.0:1. An illustration of the
Phase 6 pit, or final pit, is shown in Figure 16-8.
Total ore reserves extracted from the six mining phases are
estimated to be 592 million tons and will generate 1.25 billion tons of waste
material. Approximately 55 million tons of medium and low grade oxide, mixed and
sulfide ore will be stockpiled.
Page 16-8
|
|
Rosemont Project |
| Form
43-101F1 Technical Report |
FIGURE 16-8: PLAN VIEW OF MINING PIT PHASE 6 (ULTIMATE PIT)

Final configuration of mine phases is presented in plan view in
Figure 16-9 and in cross section in Figure 16-10. Mineral reserves for the
Rosemont deposit by mine phase are summarized in Table 16-3 and classified by
ore type in Table 16-4.
Page 16-9
|
|
Rosemont Project |
| Form
43-101F1 Technical Report |
FIGURE 16-9: PLAN VIEW OF ROSEMONT MINE PHASES
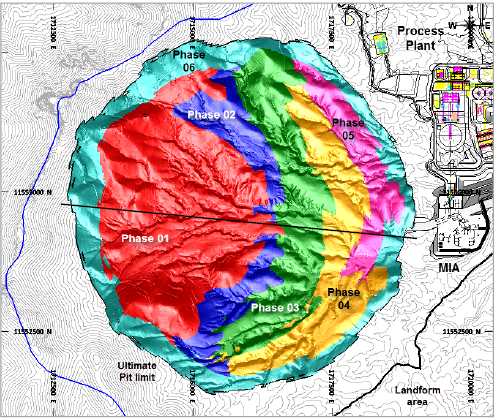
FIGURE 16-10: AA’ SECTION VIEW OF ROSEMONT MINE
PHASES

Page 16-10
|
|
Rosemont Project |
| Form
43-101F1 Technical Report |
TABLE 16-3: ROSEMONT MINE PHASES MINERAL RESERVES
|
|
Ore M
Tons |
TCu
% |
SCu
% |
ASCu
% |
Mo
% |
Ag
opt |
NSR
$/t |
CuEq
% |
Waste
M Tons |
Total
M Tons |
S.R. |
|
PH01 |
84.8 |
0.49 |
0.43 |
0.06 |
0.011 |
0.16 |
21.80 |
0.57 |
190.3 |
275.1 |
2.24 |
|
PH02 |
88.3 |
0.43 |
0.38 |
0.05 |
0.010 |
0.15 |
19.77 |
0.51 |
115.6 |
203.9 |
1.31 |
|
PH03 |
74.8 |
0.50 |
0.45 |
0.04 |
0.012 |
0.15 |
23.18 |
0.58 |
177.9 |
252.7 |
2.38 |
|
PH04 |
63.5 |
0.53 |
0.50 |
0.03 |
0.014 |
0.13 |
25.26 |
0.62 |
182.5 |
246.0 |
2.87 |
|
PH05 |
59.4 |
0.47 |
0.44 |
0.03 |
0.014 |
0.12 |
22.65 |
0.56 |
150.3 |
209.8 |
2.53 |
|
PH06 |
221.2 |
0.39 |
0.34 |
0.05 |
0.012 |
0.12 |
17.64 |
0.46 |
431.9 |
653.1 |
1.95 |
|
Total |
592.0 |
0.45 |
0.40 |
0.05 |
0.012 |
0.13 |
20.57 |
0.53 |
1,248.6 |
1,840.6 |
2.11 |
Notes:
| |
1. |
TCu % corresponds to the total copper grade. |
| |
2. |
SCu % grade corresponds to the sulfide copper in the Ore.
As per formula SCU = TCU – ASCu |
| |
3. |
ASCu % grade corresponds to the soluble copper. |
| |
4. |
CuEq% is calculated based on metal prices of $3.15/lb Cu,
$11.00/lb Mo and $18.00/oz Ag. |
TABLE 16-4: ROSEMONT MINE PHASES, MINERAL RESERVES BY ORE
TYPE
|
|
Ore
M Tons |
TCu
% |
SCu
% |
ASCu
% |
Mo
% |
Ag
opt |
NSR
$/t |
CuEq
% |
|
PH01 |
84.8 |
0.49 |
0.43 |
0.06 |
0.011 |
0.16 |
21.80 |
0.57 |
|
Sulfide |
74.8 |
0.50 |
0.45 |
0.05 |
0.011 |
0.16 |
23.27 |
0.58 |
|
Mixed |
4.2 |
0.28 |
0.21 |
0.08 |
0.008 |
0.09 |
10.15 |
0.34 |
|
Oxide |
5.8 |
0.56 |
0.28 |
0.28 |
0.006 |
0.13 |
11.33 |
0.56 |
|
PH02 |
88.3 |
0.43 |
0.38 |
0.05 |
0.010 |
0.15 |
19.77 |
0.51 |
|
Sulfide |
78.8 |
0.44 |
0.40 |
0.04 |
0.010 |
0.16 |
20.84 |
0.52 |
|
Mixed |
7.5 |
0.30 |
0.23 |
0.07 |
0.007 |
0.09 |
11.34 |
0.35 |
|
Oxide |
2.0 |
0.43 |
0.22 |
0.20 |
0.004 |
0.13 |
9.23 |
0.43 |
|
PH03 |
74.8 |
0.50 |
0.45 |
0.04 |
0.012 |
0.15 |
23.18 |
0.58 |
|
Sulfide |
70.7 |
0.50 |
0.47 |
0.04 |
0.012 |
0.15 |
23.86 |
0.59 |
|
Mixed |
2.7 |
0.32 |
0.26 |
0.06 |
0.007 |
0.06 |
12.29 |
0.36 |
|
Oxide |
1.4 |
0.41 |
0.25 |
0.16 |
0.005 |
0.08 |
10.18 |
0.41 |
|
PH04 |
63.5 |
0.53 |
0.50 |
0.03 |
0.014 |
0.13 |
25.26 |
0.62 |
|
Sulfide |
62.3 |
0.54 |
0.50 |
0.03 |
0.015 |
0.13 |
25.55 |
0.62 |
|
Mixed |
1.1 |
0.30 |
0.22 |
0.08 |
0.008 |
0.04 |
10.69 |
0.34 |
|
Oxide |
0.1 |
0.36 |
0.21 |
0.15 |
0.003 |
0.10 |
8.62 |
0.36 |
|
PH05 |
59.4 |
0.47 |
0.44 |
0.03 |
0.014 |
0.12 |
22.65 |
0.56 |
|
Sulfide |
58.1 |
0.48 |
0.45 |
0.03 |
0.015 |
0.12 |
22.90 |
0.56 |
|
Mixed |
1.2 |
0.29 |
0.24 |
0.05 |
0.011 |
0.05 |
11.53 |
0.34 |
|
Oxide |
0.1 |
0.37 |
0.27 |
0.10 |
0.002 |
0.09 |
11.02 |
0.37 |
|
PH06 |
221.2 |
0.39 |
0.34 |
0.05 |
0.012 |
0.12 |
17.64 |
0.46 |
|
Sulfide |
198.3 |
0.38 |
0.35 |
0.03 |
0.013 |
0.12 |
18.44 |
0.46 |
|
Mixed |
9.8 |
0.38 |
0.27 |
0.10 |
0.007 |
0.05 |
12.86 |
0.42 |
|
Oxide |
13.2 |
0.49 |
0.22 |
0.27 |
0.004 |
0.09 |
9.10 |
0.49 |
|
Grand Total |
592.0 |
0.45 |
0.40 |
0.05 |
0.012 |
0.13 |
20.57 |
0.53 |
Notes:
| |
1. |
TCu % corresponds to the total copper grade. |
| |
2. |
SCu % grade corresponds to the sulfide copper in the Ore.
As per formula SCU = TCU – ASCu |
| |
3. |
ASCu % grade corresponds to the soluble copper. |
| |
4. |
CuEq% is calculated based on metal prices of $3.15/lb Cu,
$11.00/lb Mo and $18.00/oz Ag. |
| |
5. |
Oxide ore refers only to the sulfide copper
species. |
Page 16-11
|
|
Rosemont Project |
| Form
43-101F1 Technical Report |
16.3
Mine Schedule and Production Plan
16.3.1 Production
Scheduling Criteria
The operating and scheduling criteria used to develop the
mining sequence plans are summarized in Table 16-5 below.
TABLE 16-5: MINE PRODUCTION SCHEDULE CRITERIA
|
Parameter |
Value |
|
Annual Ore Production Base Rate |
32,850,000 tons |
|
Daily Ore Production Base Rate |
90,000 tons |
|
Operating Hours per Shift |
12 |
|
Operating Shifts per Day |
2 |
|
Operating Days per Week |
7 |
|
Scheduled Operating Days per Year |
365 |
|
Number of Mine Crews |
4 |
Pit and mine maintenance operations will be scheduled
around-the-clock. Allowances for downtime and weather delays have been included
in the mine equipment and manpower estimations.
A mill ramp up period for concentrator start-up has been
considered. Provisions are included to reach full and steady production
(throughput) by the end of the sixth month of year one of operation. The mill
production targets schedule is presented in Table 16-6. The author believes this
period is attainable, considering Hudbay’s recent experience in building a
similar project in Peru (ramp-up to full production was also approximately 6
months).
TABLE 16-6: MILL RAMP-UP SCHEDULE
|
Month |
|
Days |
Efficiency |
Design
tph
|
Ramp Up
Factor
|
Mill Ore
000 tpm
|
Mill Ore
000 tpd
|
|
1 |
Q1 |
31 |
92.1% |
4,073 |
30% |
837 |
27.0 |
|
2 |
28 |
92.1% |
4,073 |
40% |
1,008 |
36.0 |
|
3 |
31 |
92.1% |
4,073 |
75% |
2,093 |
67.5 |
|
4 |
Q2 |
30 |
92.1% |
4,073 |
87% |
2,349 |
78.3 |
|
5 |
31 |
92.1% |
4,073 |
95% |
2,651 |
85.5 |
|
6 |
30 |
92.1% |
4,073 |
100% |
2,700 |
90.0
|
16.3.2 Mill Feed
and Cut-Off Grade Strategy
An elevated cut-off grade strategy has been implemented to
bring forward the higher grade ore from the pit into the early part of the ore
production schedule. Delivering higher grade ore to the mill in the early years
will improve the net present value and internal rate of return of the Project.
NSR values are calculated for each block in the resource model
to represent the net Cu, Mo, and Ag metal values. The pit reserves are estimated
based on a cut-off with an NSR value of $6.00/ton. This
Page 16-12
|
|
Rosemont Project |
| Form
43-101F1 Technical Report |
is the minimum value of mineralized material that will cover
the processing and G&A costs, and is therefore reserved for mill feed.
Priority plant feed will consist of high grade material (NSR
above $12.00/ton) . The medium and low grade material (NSR between $6.00 and
$12.00/ton) will be fed as needed and will otherwise be stockpiled.
Mill feed strategy considers that high grade ore stockpiled
during the pre-stripping period will be processed during the first year of plant
production, utilizing a dynamic stockpile located near the primary crushing
facility.
16.3.3 Overburden
Stripping Requirements
Mineral reserve tabulations by bench and by phase, and a mine
production scheduling program (MSSO, a module from MineSight® software) were
used to analyze long-term stripping requirements for the Project. Elevation and
phase order dependencies and sinking rate controls were used in conjunction with
mill ore production targets and an internal NSR cut-off of $6.00/ton to simulate
open pit mining. The program, through successive iterations, allows the user to
examine waste stripping rates over the life of the mine and their impact on ore
exposure and mill head grades.
The stripping analysis determined that a minimum preproduction
stripping of approximately 94 million tons of waste was required. Approximately
11 million tons of ore will also be mined and stockpiled during this period. The
estimated Year 1 waste stripping total is 100 million tons, followed by 87
million tons for Year 2. The estimated waste stripping from Year 3 through Year
11 will average about 95 million tons per year to maintain a minimum of six
months of ore exposure levels for uninterrupted ore deliveries to the mill.
Waste stripping rates will decline to an annual average of 32 million tons for
the next 3-year period, and then drop to an average of 5 million tons for the
last 3 production years as the final mining phase approaches the pit bottom.
Preproduction stripping is planned to be conducted over a
12-month timeframe and will ramp up according to the delivery of mining
equipment (particularly electric shovels) and the hiring and training of work
crews. The long-term and peak mining rates suggest the use of at least two large
(60 yd3 class) electric shovels, one large (25 yd3)
front-end loader and a hydraulic shovel (46 yd3). Ramp-up for the
mine is a part of the mine schedule target for total movement capacity by
period.
16.3.4 Mine
Plan
Mining sequence plans have been developed on a quarterly basis
from preproduction through to the end of year 5, and on an annual basis through
to year 19. The preproduction period consists of four quarters, or 12 months.
A mine life of approximately 19 years of production is
projected by this development plan. Peak mining rates of 367,000 tpd of total
material are planned in year 1 until year 11. Average mining rates during years 12-14 are planned to be 180,000 tpd d of
total material, and then reduce to an average of 105,000 tpd from years 15 – 17
as the strip ratio drops.
Page 16-13
|
|
Rosemont Project |
| Form
43-101F1 Technical Report |
During the pre-production period before the first ore is
delivered to the mill, the pit will be pre-stripped of waste to expose ore and
develop the upper benches for subsequent pushbacks. Specifically, pre-stripping
will occur in pit Phase 1 for ore exposure and in Phase 2 to 6 for development.
By the end of pre-production, the Phase 1 pit will be down to the 5,150-foot
bench. At the end of this period, the ore will be exposed to deliver
uninterrupted ore to the mill. Phase 2 will be stripped sufficiently ahead to
ensure a supply of ore for mill feed by Year 2.
The mine schedule drawings for life of the mine are shown in
Figure 16-11 to Figure 16-31. Mine schedule details regarding total annual
movement, stripping ratios, mill feed by lithology and by ore type are presented
in Figure 16-32 to Figure 16-34. The estimated mine production schedule is
summarized in Table 16-7.
The development of the WRSA (Section 16.4.1) and dry stack
tailing facility buttres ss (Section 16.4.2) was designed to allow concurrent
reclamation of the facilities. Materials are placed at final slope angles
required by the reclamation and closure plan conceptually approved by the USFS.
Revegetation will start once the next lift is completed, this provides the
opportunity for early bond release in some areas of the facility minimizing
closure requirements at the end of the life of the facility. All elevations
shown are in feet (AMSL).
FIGURE 16-11: MINE PLAN END OF PERIOD PRE-PRODUCTION
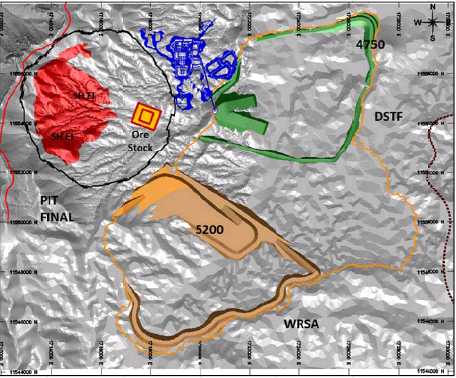
Page 16-14
|
|
Rosemont Project |
| Form
43-101F1 Technical Report |
FIGURE 16-12: MINE PLAN END OF PERIOD YEAR 1
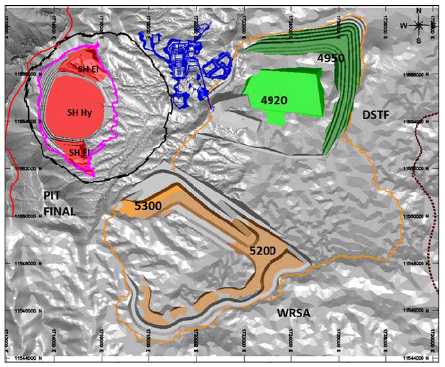
FIGURE 16-13: MINE PLAN END OF PERIOD YEAR 2

Page 16-15
|
|
Rosemont Project |
| Form
43-101F1 Technical Report |
FIGURE 16-14: MINE PLAN END OF PERIOD YEAR 3
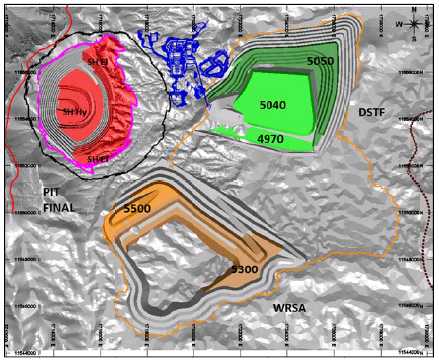
FIGURE 16-15: MINE PLAN END OF PERIOD YEAR 4
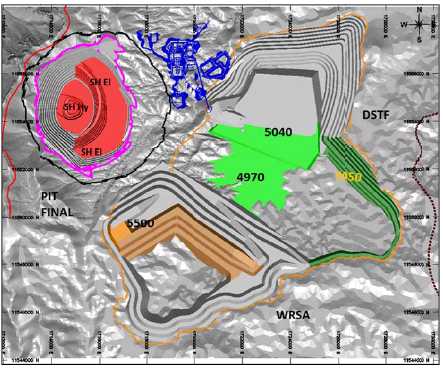
Page 16-16
|
|
Rosemont Project |
| Form
43-101F1 Technical Report |
FIGURE 16-16: MINE PLAN END OF PERIOD YEAR 5
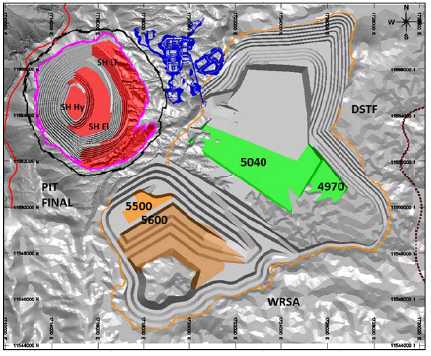
FIGURE 16-17: MINE PLAN END OF PERIOD YEAR 6

Page 16-17
|
|
Rosemont Project |
| Form
43-101F1 Technical Report |
FIGURE 16-18: MINE PLAN END OF PERIOD YEAR 7
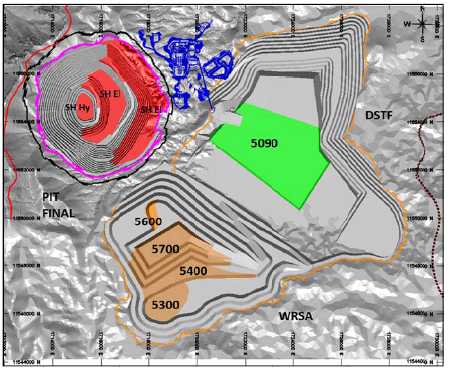
FIGURE 16-19: MINE PLAN END OF PERIOD YEAR 8
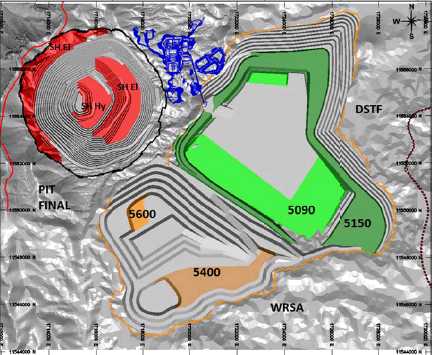
Page 16-18
|
|
Rosemont Project |
| Form
43-101F1 Technical Report |
FIGURE 16-20: MINE PLAN END OF PERIOD YEAR 9

FIGURE 16-21: MINE PLAN END OF PERIOD YEAR 10
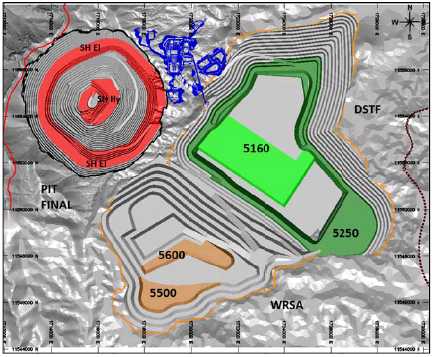
Page 16-19
|
|
Rosemont Project |
| Form
43-101F1 Technical Report |
FIGURE 16-22: MINE PLAN END OF PERIOD YEAR 11
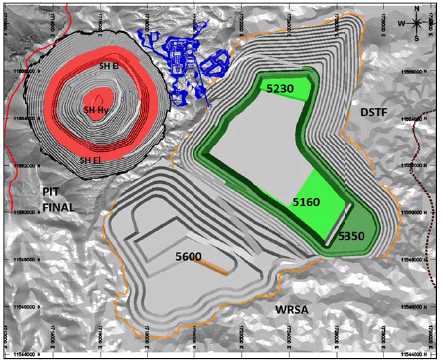
FIGURE 16-23: MINE PLAN END OF PERIOD YEAR 12
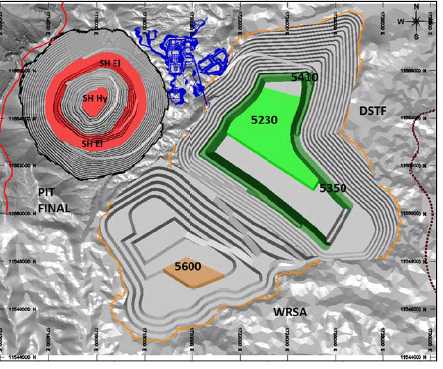
Page 16-20
|
|
Rosemont Project |
| Form
43-101F1 Technical Report |
FIGURE 16-24: MINE PLAN END OF PERIOD YEAR 13

FIGURE 16-25: MINE PLAN END OF PERIOD YEAR 14
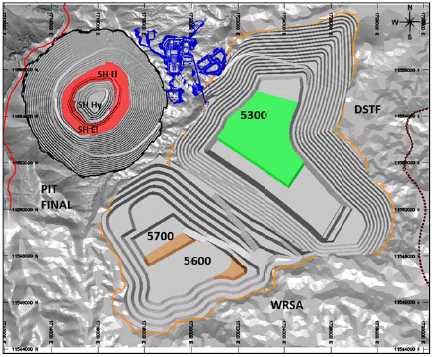
Page 16-21
|
|
Rosemont Project |
| Form
43-101F1 Technical Report |
FIGURE 16-26: MINE PLAN END OF PERIOD YEAR 15
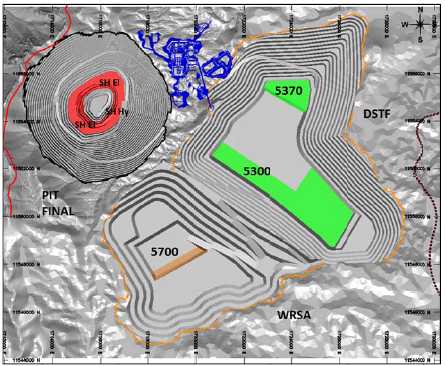
FIGURE 16-27: MINE PLAN END OF PERIOD YEAR 16
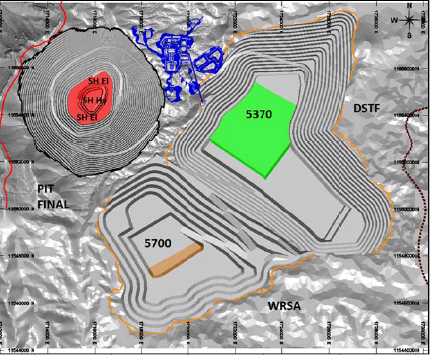
Page 16-22
|
|
Rosemont Project |
| Form
43-101F1 Technical Report |
FIGURE 16-28: MINE PLAN END OF PERIOD YEAR 17
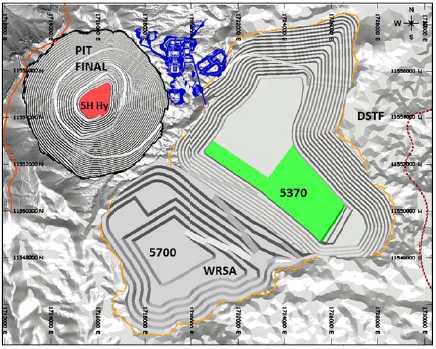
FIGURE 16-29: MINE PLAN END OF PERIOD YEAR 18
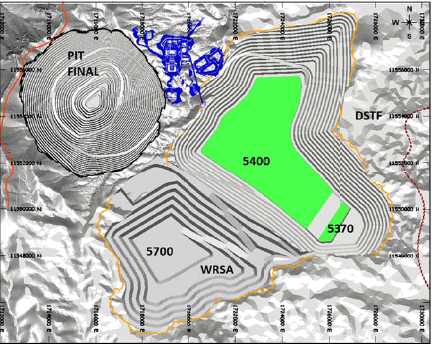
Page 16-23
|
|
Rosemont Project |
| Form
43-101F1 Technical Report |
FIGURE 16-30: MINE PLAN END OF PERIOD YEAR 19
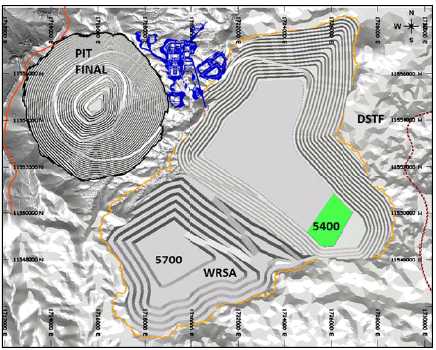
FIGURE 16-31: MINE PLAN, FINAL TOPOGRAPHY
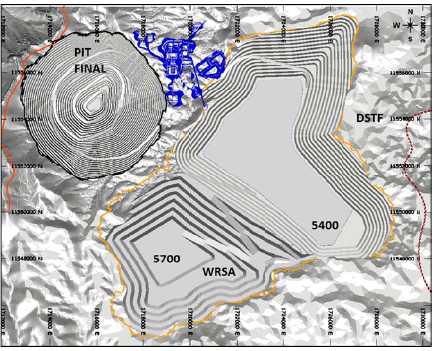
Page 16-24
|
|
Rosemont Project |
| Form
43-101F1 Technical Report |
TABLE 16-7: MINE PRODUCTION
SCHEDULE – LOM RP16AUG
| |
|
Yr -1 |
Yr1 |
Yr2 |
Yr3 |
Yr4 |
Yr5 |
Yr6 |
Yr7 |
Yr8 |
Yr9 |
Yr10 |
Yr11 |
Yr12 |
Yr13 |
Yr14 |
Yr15 |
Yr16 |
Yr17 |
Yr18 |
Yr19 |
Total |
| Mill |
M Tons |
- |
28.1 |
32.9 |
32.9 |
32.9 |
32.9 |
32.9 |
32.9 |
32.9 |
32.9 |
32.8 |
32.9 |
32.9 |
32.8 |
32.9 |
32.9 |
32.9 |
32.9 |
32.9 |
5.5 |
592.0 |
| SCu % |
- |
0.43 |
0.50 |
0.50 |
0.44 |
0.51 |
0.55 |
0.48 |
0.55 |
0.39 |
0.46 |
0.32 |
0.30 |
0.34 |
0.37 |
0.39 |
0.36 |
0.24 |
0.14 |
0.12 |
0.40 |
| TCu % |
- |
0.51 |
0.55 |
0.54 |
0.49 |
0.55 |
0.59 |
0.51 |
0.61 |
0.44 |
0.49 |
0.37 |
0.36 |
0.40 |
0.40 |
0.42 |
0.39 |
0.28 |
0.19 |
0.18 |
0.45 |
| ASCu% |
- |
0.08 |
0.05 |
0.05 |
0.05 |
0.05 |
0.05 |
0.04 |
0.06 |
0.05 |
0.04 |
0.05 |
0.06 |
0.06 |
0.04 |
0.03 |
0.03 |
0.04 |
0.06 |
0.06 |
0.05 |
| Ox% |
- |
16% |
9% |
9% |
12% |
10% |
9% |
9% |
11% |
14% |
10% |
14% |
15% |
15% |
11% |
9% |
9% |
14% |
24% |
24% |
12% |
| Mo % |
- |
0.01 |
0.01 |
0.01 |
0.01 |
0.01 |
0.01 |
0.01 |
0.02 |
0.01 |
0.01 |
0.01 |
0.01 |
0.01 |
0.01 |
0.02 |
0.02 |
0.01 |
0.01 |
0.00 |
0.01 |
| Ag opt |
- |
0.16 |
0.18 |
0.16 |
0.17 |
0.17 |
0.18 |
0.13 |
0.14 |
0.10 |
0.13 |
0.10 |
0.10 |
0.12 |
0.12 |
0.14 |
0.14 |
0.11 |
0.07 |
0.07 |
0.13 |
| CuEq % |
- |
0.59 |
0.64 |
0.63 |
0.58 |
0.64 |
0.69 |
0.60 |
0.70 |
0.50 |
0.58 |
0.43 |
0.43 |
0.48 |
0.48 |
0.52 |
0.49 |
0.34 |
0.23 |
0.21 |
0.53 |
| NSR $/t |
- |
21.8 |
25.6 |
25.3 |
22.6 |
25.7 |
28.0 |
24.2 |
27.8 |
19.3 |
23.3 |
16.4 |
15.6 |
17.9 |
19.1 |
20.6 |
19.6 |
12.9 |
7.2 |
6.3 |
20.6 |
| SWCL % |
- |
6.0 |
7.1 |
8.3 |
8.4 |
8.2 |
8.9 |
8.9 |
8.7 |
7.9 |
7.0 |
7.1 |
7.6 |
8.5 |
7.7 |
6.5 |
6.3 |
6.9 |
8.5 |
7.9 |
7.7 |
| MGCL % |
- |
1.4 |
2.6 |
3.2 |
2.5 |
4.6 |
4.8 |
4.4 |
5.7 |
2.6 |
4.5 |
3.5 |
3.8 |
3.0 |
3.9 |
3.7 |
4.2 |
2.3 |
1.5 |
1.2 |
3.4 |
| BWI Kw-Hr/t |
- |
13.6 |
13.2 |
12.9 |
12.8 |
12.3 |
13.3 |
12.6 |
13.1 |
12.7 |
12.7 |
13.1 |
12.9 |
12.2 |
11.7 |
12.2 |
12.6 |
13.2 |
13.3 |
12.4 |
12.8 |
| SPM- |
M Tons |
- |
0.1 |
- |
- |
- |
- |
- |
- |
- |
- |
- |
0.4 |
- |
- |
- |
- |
- |
1.7 |
4.6 |
1.2 |
8.0 |
| SPM+ |
M Tons |
1.7 |
1.2 |
0.9 |
2.2 |
0.4 |
1.0 |
0.3 |
0.1 |
0.2 |
- |
- |
- |
- |
- |
- |
- |
- |
- |
- |
- |
8.0 |
| SPO- |
M Tons |
- |
0.3 |
- |
- |
- |
- |
- |
- |
- |
- |
- |
0.2 |
- |
- |
- |
- |
- |
1.0 |
3.7 |
0.8 |
5.9 |
| SPO+ |
M Tons |
1.9 |
0.7 |
0.6 |
0.6 |
0.3 |
0.7 |
0.1 |
- |
1.0 |
- |
- |
- |
- |
- |
- |
- |
- |
- |
- |
- |
5.9 |
| SPS- |
M Tons |
- |
3.2 |
- |
- |
- |
- |
- |
- |
- |
- |
- |
2.9 |
- |
- |
- |
- |
- |
14.0 |
24.6 |
3.5 |
48.3 |
| SPS+ |
M Tons |
7.7 |
2.3 |
10.9 |
10.4 |
2.1 |
4.2 |
6.1 |
1.7 |
3.0 |
- |
- |
- |
- |
- |
- |
- |
- |
- |
- |
- |
48.3 |
| WRSA |
M Tons |
78.2 |
45.5 |
58.5 |
47.3 |
75.0 |
93.3 |
23.0 |
97.3 |
23.7 |
47.2 |
27.1 |
1.0 |
9.9 |
15.8 |
8.4 |
3.6 |
5.8 |
5.7 |
- |
- |
666.3 |
| DSTF |
M Tons |
15.6 |
54.1 |
28.2 |
38.7 |
21.3 |
- |
69.6 |
- |
71.4 |
51.9 |
72.1 |
98.1 |
51.7 |
9.5 |
- |
- |
- |
- |
- |
- |
582.3 |
| Total |
M Tons |
105.0 |
132.0 |
132.0 |
132.0 |
132.0 |
132.0 |
132.0 |
132.0 |
132.0 |
132.0 |
132.0 |
132.0 |
94.0 |
58.0 |
41.0 |
36.0 |
39.0 |
39.0 |
33.0 |
5.0 |
1,903.0
|
| Notes: CuEq% is calculated based on metal prices of
$3.15/lb Cu, $11.00/lb Mo and $18.00/oz Ag. |
| Ox%: Oxide
Ratio, between Soluble Copper and total copper, as per formula: ASCu% /
TCu%. |
| SWCL%:
Swelling clays grade. |
| MGCL%:
Magnesium clays grade. |
| BWI: Bond
Work Index. |
| SPM-: Mixed
Ore Stockpile (Out). |
| SPM+: Mixed
Ore Stockpile (In). |
| SPO-: Oxide
Ore Stockpile (Out). |
| SPO+: Oxide
Ore Stockpile (In). |
| SPS-:
Sulfide Ore Stockpile (Out). |
| SPS+:
Sulfide Ore Stockpile (In). |
| WRSA: Waste
rock facility destination. |
| DSTF: Dry
stack tailings facility destination. |
Page 16-25
|
|
Rosemont Project |
| Form
43-101F1 Technical Report |
FIGURE 16-32: ROSEMONT MINE SCHEDUULE, MATERIAL MOVEMENT
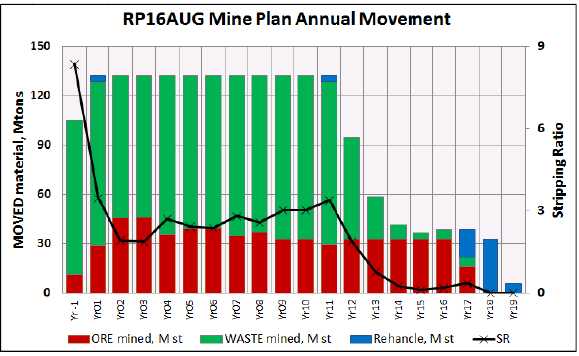
FIGURE 16-33: ROSEMONT MINE SCHEDULE, MILL FEED ORE BY
LITHOLOGY
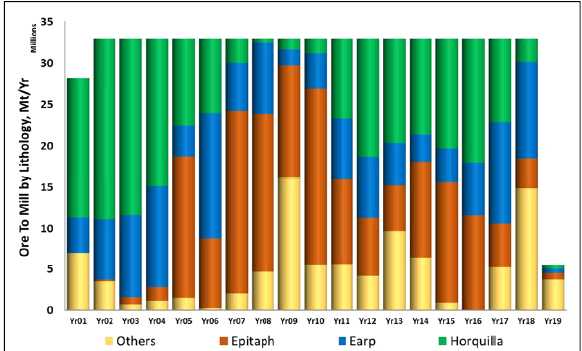
Note: Ore Mill in others lithology are Abrigo 9.6Mt@0.42%Cu,
Andesite 16Mt@0.23% Cu, Arkose 13.5Mt@0.21%Cu, Bolsa 6.3Mt@0.3 8%Cu, Escabrosa
9.8Mt@0.54%Cu, Glance 4.7Mt@0.22%Cu, Granodiorite 2Mt@0.62%Cu, Martin
5.7Mt@0.31%Cu, QMP 17.7M t@0.40%Cu and Scherrer 7.5Mt @0.35%Cu, which represents
16% of the total Ore mill.
Page 16-26
|
|
Rosemont Project |
| Form
43-101F1 Technical Report |
FIGURE 16-34: ROSEMONT MINE SCHEDULE, MILL FEED ORE BY ORE
TYPE
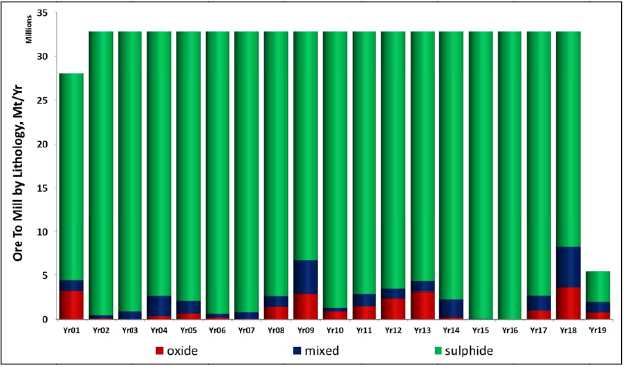
16.4
Mine Facilities
16.4.1 WRSA
Overburden and other waste rock encountered in the course of
mining will be placed into the WRSA located to the south and southeast of the
planned open pit and into landform area. The design criteria for the WRSA area
and associated haul roads are summarized in Table 16-8 below. The general mine
site layout is shown in Figure 16-1.
TABLE 16-8: WRSA DESIGN CRITERIA
|
Parameter |
Value |
|
Angle of Repose |
37° |
|
Average Tonnage Factor (with swell) |
16.02 ft3/ton |
|
Overall Slope Angle |
3.5H:1V |
|
Total Height, feet |
600 |
|
Haul Road, feet |
120 |
|
Max Elevation, feet (AMSL) |
5700 |
One of the objectives in the early years of operation
(specifically, Years 1 to 5) is to construct a series of buttresses and berms
around the eastern and southern perimeters of the DSTF and WRSA respectively,
for permit commitment. These buttresses and berms will also allow re-grading and
re-vegetation of the facilities side slopes at much earlier time periods than
with traditional mine waste rock closure plans.
Page 16-27
|
|
Rosemont Project |
| Form
43-101F1 Technical Report |
The WRSA berms and internal loading plan are designed to
facilitate subsequent re-grading and concurrent reclamation. Side slopes in the
WRSA will be re-graded to a maximum of 3:1 (horizontal: vertical) slopes. The
WRSA loading plan will consist of haul trucks end-dumping waste rock in 100-foot
lifts at the angle of repose (approximately 37°). The WRSA crests will be set
back to allow simple dozing of the crests down to meet the target re-graded
slope angles to support concurrent reclamation.
16.4.2 DSTF
Buttress
Dry stack tailing resulting from processing mine ore will be
placed behind the buttresses constructed from mine waste rock. Any acid
generating waste will be disposed in the DSTF buttress. The DSTF is north of the
WRSA and east-northeast of the pit. The design criteria for the DSTF and
associated haul roads are summarized in Table 16-9 below. The general mine site
layout is shown in Figure 16-1.
TABLE 16-9: DSTF BUTTRESS ROCK STORAGE DESIGN
CRITERIA
|
Description |
Unit |
|
Angle of Repose |
37° |
|
Average Tonnage Factor (with swell) |
16.02 ft3/ton |
|
Overall Slope Angle |
3.5H:1V |
|
Total Height, feet |
700 |
|
Haul Road, feet |
120 |
|
Max Elevation, feet (AMSL) |
5,490 |
The DSTF and WRSA are described in more detail in Section 18.4
of this report. As the mine matures, waste rock generation declines which forces
maximum utilization during many of the early years to construct the buttress in
the DSTF and berms in the WRSA. The DSTF buttress construction is planned to be
finished by the end of year 13 with sufficient capacity to store the remainder
of the tailing material generated during the 19-year mine life. Table 16-10
summarizes LOM Waste distribution for WRSA and DSTF. A cross section N-S view of
DSTF buttress by year is shown in Figure 16-35.
Page 16-28
|
|
Rosemont Project |
| Form
43-101F1 Technical Report |
TABLE 16-10: LOM WASSTE ROCK
DISTRIBUTION AND LANDFORMI NG STORAGE
PLAN
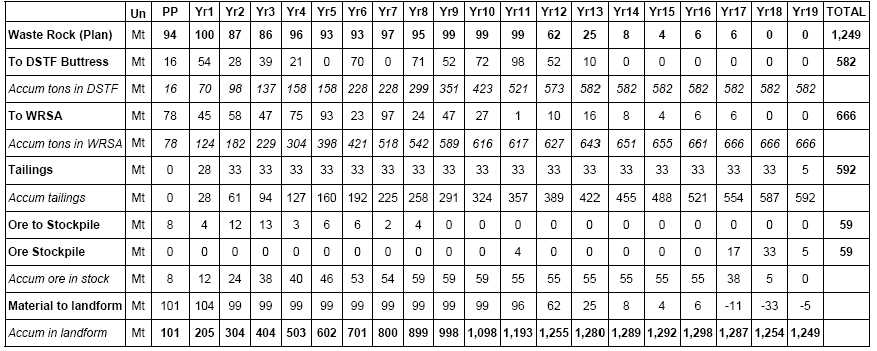
FIGURE 16-35: DSTF NS SECTION VIEW, LOM
BUTTRESS BY YEAR
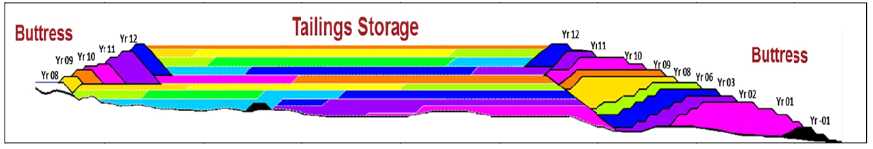
Page 16-29
|
|
Rosemont Project |
| Form
43-101F1 Technical Report |
16.5
Mine Equipment
16.5.1 Equipment
Operating Parameter
Mine equipment was selected based on the production
requirements shown in Table 16-7. During the first quarter of preproduction, a
46 yd3 hydraulic excavator and a 25 yd3 loader will be
matched with 260-ton-class haul trucks; supported with dozers, graders and water
trucks to develop the initial mine area. At the end of the second quarter of
preproduction, the first 60 yd3 class electric shovel will come on
line followed by one more in preproduction third quarter.
The mine will operate two 12-hour shifts per day, for 365 days
a year. No significant weather delays are expected and the mine will not be shut
down for holidays. The craft work schedule will consist of a standard four crew
rotation.
Material characteristics used to determine productivity
calculations are listed in Table 16-11. Although there are several different
rock types at Rosemont, the weighted average of all rock types was used for
production estimation. Major loading and haulage equipment will be equipped with
electronic load monitors, which will ensure optimum loading. All equipment
production is reported in dry short tons, which is consistent with the reserve
model. Moisture content is expected to range between 3 and 4 percent; for
haulage calculations 3.5 percent was used.
TABLE 16-11: MATERIAL CHARACTERISTICS
|
Parameter |
Value |
|
In Situ Bulk Density |
11.85 cubic feet per ton |
|
Material Swell |
40 Percent |
|
Loose Density |
16.02 cubic feet per ton |
|
Moisture Content |
3.5 Percent
|
16.5.2 Mine
Equipment Calculation
Mine equipment requirements were developed based on the annual
tonnage movement projected by the mine production schedule in Table 16-7, bench
heights of 50 feet, two twelve hour shifts per day, 365 days per year operation,
with manufacturer machine specifications and material characteristics specific
to the deposit.
Specific manufacturer’s models used in this study are only
intended to represent the size and class of equipment selected. The final
equipment manufacturer selection will be done as required to meet delivery dates
and current need of the operation.
A summary of fleet requirements by time period for major mine
equipment is shown in Table 16-12. Furthermore, Table 16-13 lists equipment
KPI’s, Availability and Utilization, and equipment productivity used to
dimension equipment fleets for the different mine operations.
Page 16-30
|
|
Rosemont Project |
| Form
43-101F1 Technical Report |
This represents equipment necessary to perform the following
mine tasks:
- Mine site clearing and topsoil salvage and stockpiling
- Construction of the main haul roads
- Production and pre-split drilling
- Loading and hauling of sulfide ore to the primary crusher (located on the
east side of the pit), and waste rock to WRSA and DSTF areas
- Maintaining mine haulage and access roads
- Maintaining WRSA, DSTF, berms, and re-grading of slopes and final surfaces
Page 16-31
|
|
Rosemont Project |
| Form
43-101F1 Technical Report |
TABLE 16-12: MAJOR FLEET
REQUIREMENTS FOR LOM
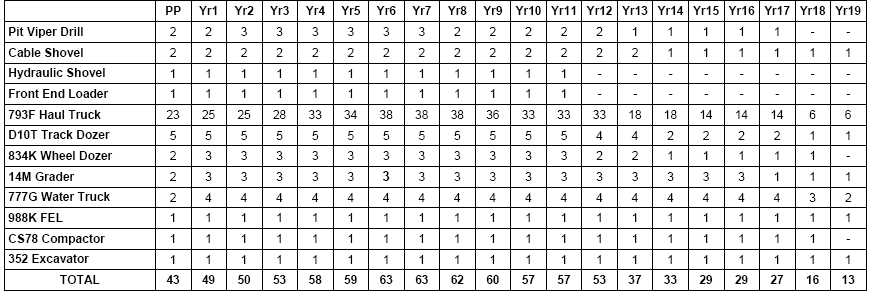
Page 16-32
|
|
Rosemont Project |
| Form
43-101F1 Technical Report |
16-13: MAJOR EQUIPMENT KPI AND
PRODUCTIVITY
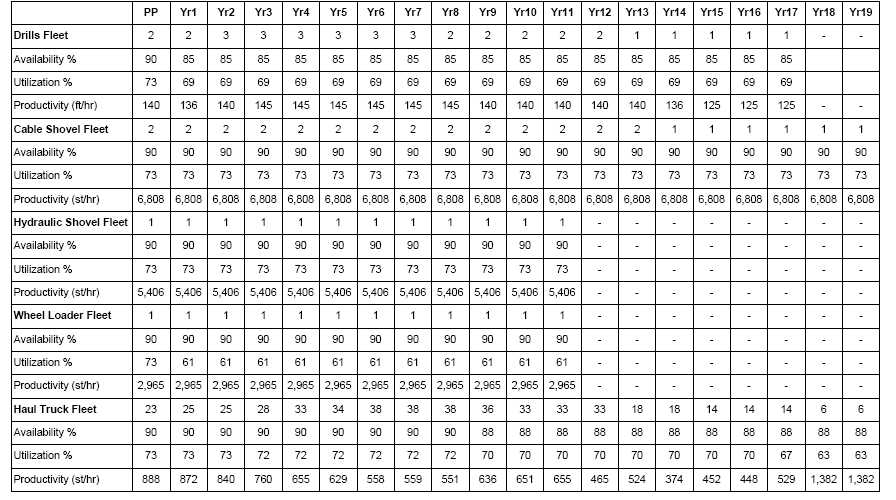
Page 16-33
|
|
Rosemont Project |
| Form
43-101F1 Technical Report |
16.6
Mine Operations
16.6.1 Drilling
and Blasting
Production drilling will be done using 10-5/8 inch holes on a
30-foot by 30-foot pattern for ore and 33-foot by 33-foot pattern for waste.
Blast hole depth will be 50 feet with 5 feet of sub-drilling. Subgrade drilling
in limestones and skarns may be increased if hard toe conditions are
encountered.
Drilling speed rates will vary between 129-153 feet per hour
depending on the rock type and mineralization. The penetration rates are
consistent with rates being used by other mines like Constancia which is
currently in operation and has characteristics similar to Rosemont.
Powder factors varied between 0.29 – 0.43 pounds per ton
depending on rock type and mineralization. Ammonium nitrate and fuel oil
(“ANFO”) blasting agents will be loaded in dry holes, while wet holes will be
pumped dry and sleeved before loading with ANFO. If this cannot be accomplished,
emulsion will be used as a wet hole explosive.
Drills will be outfitted with GPS and electronic sensing units
to allow recording of penetration rates in drill holes to assist in determining
decking requirements for individual holes. Drill productivities are expected to
range between 8,500 and 10,500 tons per hour (“tph”), depending on rock type.
16.6.2
Loading
Major loading equipment consists of two 60 yd3 class
electric shovels, one 46 yd3 hydraulic excavator and a 25 yd3
front-end loader. On average, 71% of total material movement will be
handled by the electric shovels, 22% by the hydraulic shovel and 7% by the front
end loader.
The equipment was selected to work a 50-foot bench height and
load 260 ton-class trucks. For this study, the 260-ton-class trucks were chosen
based on economics, but the loading fleet is sized for the larger trucks to give
the operator flexibility in fleet selection at a later date.
Loading 260-ton trucks with a 60 yd3 class shovel
requires three passes at 35 seconds per cycle, 30 second spot and queuing for a
total load time of 2.30 minutes per truck. Loading the 260-ton trucks with 46
yd3 hydraulic excavator requires four passes at 35 seconds per pass,
a 30-second spot time and queuing time, for total load time of 2.8 minutes.
Finally, 260-ton trucks loaded with a 25 yd3 FEL require seven passes
at 40 seconds per pass, a 30-second spot time and queuing time, for total load
time of 5.2 minutes.
Loading equipment production rates vary during equipment start
up, and according to operator training and experience. After reaching a steady
state, the 60 yd3 class shovel productivity will be 6,800 tph,
hydraulic shovel will be 5,400 tph and the loader productivity will be 2,800
tph. Loading productivity is directly related to how well the
shovel-loader/trucks match, the material being loaded and the haulage profile.
Page 16-34
|
|
Rosemont Project |
| Form
43-101F1 Technical Report |
16.6.3
Hauling
The 260-ton class truck was chosen based on an economic
evaluation and as a result of the support in the region. Main factors
influencing the study were fuel burn, tire costs and repair costs. Truck fleet
requirements vary from 23 units at the start of pre-production to 38 by year 6.
The fleet remains constant from year 6 until year 8, when the waste volumes
start to decrease and only 18 units are required. In year 18, the truck
requirements decrease to 6 units. An average load factor of 260 tons was used
for production calculations for haulage trucks.
16.6.4 Support
Equipment
Major support equipment includes mine equipment that is not
directly responsible for production, but which is scheduled on a regular basis
to maintain in-pit and ex-pit haul roads, pit benches, WRSA and DSTF and to
perform miscellaneous construction work as needed. Equipment operating
requirements were estimated for this equipment based on the major mine equipment
support requirements and WRSA slope re-grading schedules. Equipment in the mine
support fleet includes:
| |
● |
Crawler dozers, D10T2 class |
| |
● |
Rubber-tired dozers, 834K class |
| |
● |
Motor graders, 14H class |
| |
● |
Water trucks, 777G class |
In general, the rubber-tired 834K-class dozers will be used in
the pit to clean up around the primary loading units, with the track dozers used
for haul road construction, pit development, WRSA and DSTF management, and final
re-grading requirements. The graders and water trucks will be used to maintain
roads and control dust.
16.7
Mine Engineering
16.7.1
Geotechnical and Mine Planning
CNI was contracted by Hudbay to provide an update of their
geotechnical recommendations for slope angles for the open pit development of
the Rosemont deposit. The current and previous work included geologic and
geotechnical mapping, drilling, rock strength testing and slope stability
analysis to determine pit slope design criteria that is consistent with industry
norms for safety and cost effectiveness. CNI provided a report in May 2016 -
Feasibility-Level Geotechnical Study for The Rosemont Deposit.
Based on the CNI report, Hudbay worked to find the best
strategy to combine geotechnical engineering, pit design, mine planning and
operational point of view. With regards to geotechnical engineering and pit
design, the following considerations have been made:
| |
● |
Concave pit design which is more stable that a convex pit |
| |
● |
Height of ultimate pit is more than 2,900 feet deep at an elevation of
3,100 feet (AMSL) |
| |
● |
A two ramp ingress/egress system |
Page 16-35
|
|
Rosemont Project |
| Form
43-101F1 Technical Report |
| |
● |
Drainage system following the main haulage
ramps |
| |
● |
Mining sequence, by phases and periods: |
| |
|
|
| |
|
o |
Final pit wall will be established during year 08 (Figure
16-19) |
| |
|
o |
On-going evaluation of new data resulting from actual pit
development |
With respect to the general mine development sequence, Hudbay
has developed the following strategy:
| |
● |
As part of the pit dewatering plan, three pumping wells
will be installed close to the Phase I development area. As currently
planned, these holes will be core drilled using PQ diameter to obtain
additional geological, geotechnical, and hydrogeological information.
During year 5, one additional pumping well will be developed with the same
strategy (multifunction hole). |
| |
● |
Pre-stripping will expose several geological faults
identified during the geotechnical study, allowing for better definition,
exact location, geotechnical properties and behavior. |
| |
● |
The strategy will remain the same as the mine progresses
and other faults are encountered. Mine development will include specific
design parameters to minimize the unintended structural issues,
specifically: |
| |
|
|
| |
|
o |
Inter ramp angle controls and review for optimization
(wall phases) |
| |
|
o |
Bench face angles |
| |
|
o |
Control wall damage with blasting analyses |
| |
|
o |
Blasting control (VPP) |
| |
|
o |
Ground control (survey, water level) |
| |
|
o |
Slope monitoring system |
RQD (%) and the hardness block model have been developed to
support a geotechnical strategy for mine design to be implemented for mine
planning and operations. Figure 16-36 to Figure 16-39 show plan and section
views of the block model and final Rosemont pit.
Page 16-36
|
|
Rosemont Project |
| Form
43-101F1 Technical Report |
FIGURE 16-36: ROSEMONT GEOTEECHNICAL SECTORS
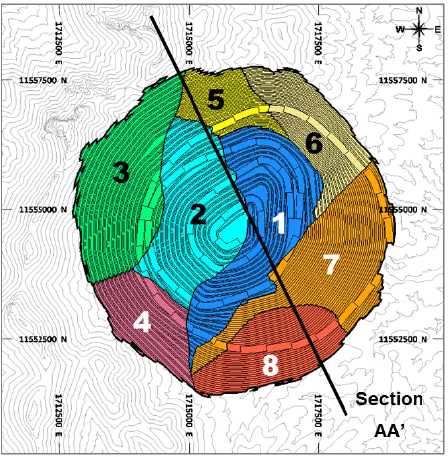
FIGURE 16-37: SECTION AA’ SHOWING RQD VAALUES IN FINAL
ROSEMONT PIT
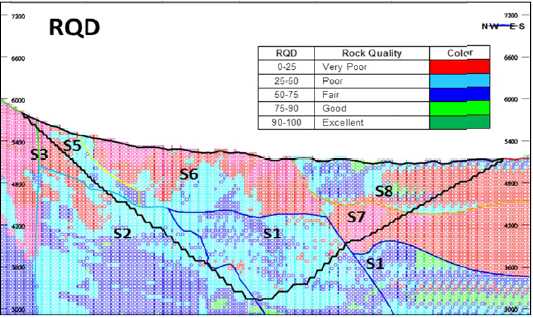
Page 16-37
|
|
Rosemont Project |
| Form
43-101F1 Technical Report |
FIGURE 16-38: ROSEMONT FINAL PIT, LITHOLOGY IN FINAL WALL
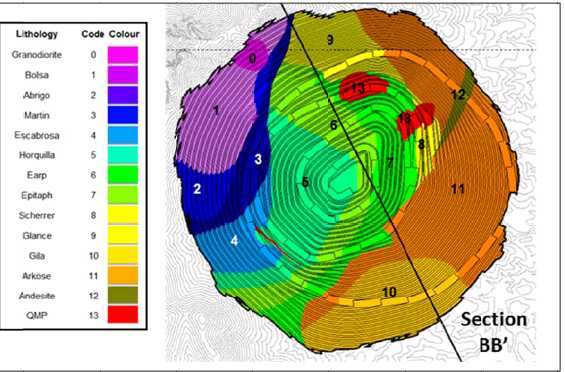
FIGURE 16-39: SECTION BB’ SHOWING HARD VALUES IN FINAL
ROSEMONT PIT
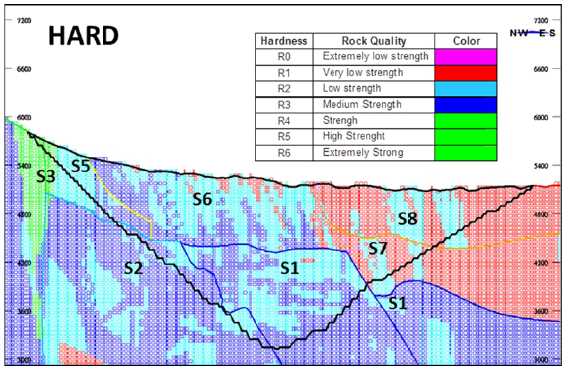
Page 16-38
|
|
Rosemont Project |
| Form
43-101F1 Technical Report |
16.7.2
Hydrogeology and Mine Planning
Neirbo Hydrogeology was contracted by Hudbay to provide a
hydrogeological study. Based on a refined and localized version of the 2010
Regional Groundwater Model prepared for the Environmental Impact Statement (EIS)
process, Neirbo provided a report in May 2016 –Hydrogeological Study for The
Rosemont deposit. Based on the Neirbo report, Hudbay worked to find the best
strategy to combine: pit dewatering, pit design, mine planning and operational
objectives.
The following general strategy has been considered:
| |
● |
Starting the drilling and pumping before pre-stripping and continuing
during the pre- stripping |
| |
● |
Dynamic updating of the hydrogeological parameters and model for each
well |
| |
● |
Monitoring wells focused on dewatering |
| |
● |
Active and passive depressurization verification according to mining
advance |
| |
● |
Updating the areas indicating high and low conductivity |
| |
● |
Establishing an operational correlation between the geological,
geotechnical and hydrogeological parameters |
The pit dewatering plan consists of:
| |
● |
10 wells during pre-production (14,850 feet) |
| |
● |
10 additional wells between year 1 to year 5 (10,800 feet) |
| |
● |
10 additional wells after year 5 |
| |
● |
Annual horizontal drain sustaining capital cost ($ 3M) was considered for
the arkose material as it will be mined every year in the mine’s life |
| |
● |
Limited by pre-production pumping described in the EIS as 18,500 acre-feet
of water |
The pit opens up in the central-western zone; away from the
final walls which is expected to provide an opportunity to:
| |
● |
Pre-mining |
| |
|
|
| |
|
o |
To control the inter ramp angle (“IRA”) and the bench
face angle (“BFA”) |
| |
|
o |
To manage the water with wells and superficial water
management |
| |
|
o |
To install and monitor the impact of 14 pumping
wells |
| |
|
|
|
| |
● |
Year 1 |
| |
|
|
| |
|
o |
As the mine expands through Phase 1, monitoring of the
effects of the pumping wells will continue. This will include water
captured via the in-pit ponds |
| |
|
o |
Phase 2 will begin in year one and monitoring of the
pumping wells and surface ponds will continue. |
| |
|
|
|
| |
● |
Year 2 |
Page 16-39
|
|
Rosemont Project |
| Form
43-101F1 Technical Report |
| |
|
o |
Phases 1 and 2 will remain the active mining areas
supported by the original pumping wells and ponds. |
| |
|
|
| |
● |
Year 3 |
| |
|
|
|
| |
|
o |
Beginning in Year 3 and continuing for the remainder of
the mine’s life, additional wells will be drilled to achieve the drawdown
and depressurization requirements necessary to safely advance the ore
extraction sequence. |
Figure 16-40 presents LOM well holes in the final Rosemont pit,
and Table 16-13 summarizes LOM well holes for the pre-production and operating
stages.
FIGURE 16-40: SECTION AA’ SHOWING HARD VALUES IN FINAL
ROSEMONT PIT
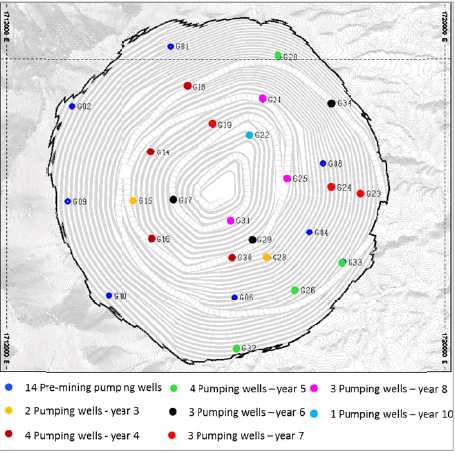
16.8
Manpower Requirements
16.8.1 Mine
Operations Manpower
Mine supervision, technical staff, mine maintenance, wor rkshop
personnel and equipment operator requirements over the life of the mine are
based on the mine plan. During the Pre-Production period, direct (workshop and
operators) and indirect (Staff, supervision and technicians) requirements total
337, building up to 424 in the steady production (132 M ton per year) and is
shown in Table 16-14.
Page 16-40
|
|
Rosemont Project |
| Form
43-101F1 Technical Report |
Hourly mine operation personnel requirements are calculated
based on equipment operating hour requirements, fleet estimation, shown in Table
16-12. Maintenance personnel are calculated based on estimated maintenance
repair time for mining equipment. The percent of maintenance to total hourly
personnel averages 32% throughout the mine life.
The schedule assumed that the hourly personnel would be hired
two months prior to the date they were actually required on-site to facilitate
training requirements for MSHA, Safety, Environmental and other required
training which is captured in the mining costs. Operation training is captured
in Operational Readiness estimates.
Mine staff manpower employees and salaries were developed for
Mine Administration, Mine Geology, Mine Operations, and Mine Maintenance.
Salaries were a composite of information provided by Hudbay which was calibrated
against local mine salaries. Salary information includes wages, burden and bonus
for staff employees.
TABLE 16-14: LABOR ESTIMATION FOR ROSEMONT MINE
OPERATIONS
|
Item |
Category |
Mine Operations Labor
Requirements (Steady Production) |
|
Mine Operations |
Direct Labor |
227 (Operators for
shovels, trucks, drills and auxiliary equipment) |
|
Workshop Personnel |
Direct Labor |
90 (Mechanics, Welder,
Electrician and Helpers) |
|
General Mine Staff |
Indirect Labor |
34 (Management,
Supervision & Laborer) |
|
Technical Services |
Indirect Labor |
26 (Mine Engineer,
Geologist, Geotechnical and Surveyor) |
|
Mine Maintenance |
Indirect Labor |
47 (Management,
Supervision and Technicians) |
|
TOTAL |
424
|
16.8.2
Process Operations Manpower
Hourly process plant operation personnel requirements are
estimated based on hourly equipment operating criterion, and fleet estimation as
shown in Table 16-15. Maintenance personnel are determined based on estimated
maintenance repair time for equipment. The percent of maintenance to total
hourly personnel averages 32% throughout for the mine life.
Operating labor costs are based on staffing levels developed by
the Project for a copper molybdenum concentrator with a DSTF.
Staff positions were grouped into four broad categories:
| |
1. |
Mill Management |
| |
|
|
| |
2. |
Mill Operations |
| |
|
|
| |
3. |
Mill Maintenance |
| |
|
|
| |
4. |
Mill Technical Services |
Staff numbers are based on 24-hour operating coverage with
personnel working 12-hour shifts on a four crew roster system. Labor positions
categorized are summarized in Table 16-15.
Page 16-41
|
|
Rosemont Project |
| Form
43-101F1 Technical Report |
No labor has been included for an analytical laboratory because
there will be no on-site facility for this purpose. Mine, plant, and concentrate
quality samples will transported off site to a contract laboratory.
Besides staff labor, allowances have been made for contract
labor for major periodic tasks. This is to free up staff maintenance personnel
and allow them to perform required/preventative maintenance tasks while the
affected circuits are down.
TABLE 16-15: LABOR ESTIMATION FOR ROSEMONT PROCESS
OPERATIONS
|
Item |
Mine Operations Labor
Requirements (Steady Production) |
|
Mill Management |
22 (Management and
Supervision) |
|
Mill Operations |
76 (Operations
Technicians) |
|
Mill Maintenance |
38 (Trade Workers and
Technicians) |
|
Mill Technical Services |
15 (Engineers and
Technicians) |
|
TOTAL |
151
|
16.8.3
General and Administration (G&A)
General and Administration has been derived from each area
within the G&A group. The estimate for each area was built up using project
manpower inputs and industry standards values.
The G&A group consist of the following departments and are
showed in Table 16-16:
| |
1. |
General Administration - includes general office, legal
and corporate affairs areas. |
| |
|
|
| |
2. |
Procurement - included in this area are administration
and logistic. |
| |
|
|
| |
3. |
Safety |
| |
|
|
| |
4. |
IT- Information and Technology and support |
| |
|
|
| |
5. |
Accounting – includes controller, payroll, taxes and
finance staff. |
| |
|
|
| |
6. |
Environmental – included in this area are permitting,
monitoring, and mitigation personnel. |
| |
|
|
| |
7. |
Human Resources |
Page 16-42
|
|
Rosemont Project |
| Form
43-101F1 Technical Report |
TABLE 16-16: LABOR ESTIMATION FOR ROSEMONT G&A OPERATIONS
|
Item |
G&A Labor Requirements
(Steady Production) |
|
General Administration |
16 (Management, Legal, and
Corporate Affairs) |
|
Procurement |
17 (Administration and
Logistic) |
|
Safety |
8 |
|
IT |
8 |
|
Accounting |
12 (Controller, Payroll,
Taxes, Finance) |
|
Environmental |
22 (Monitors, Technicians)
|
|
Human Resources |
5 |
|
TOTAL |
88 |
Page 16-43
|
|
Rosemont Project |
| Form
43-101F1 Technical Report |
17
RECOVERY METHODS
17.1
Introduction
The Project process plant is a conventional copper-molybdenum
concentrator and process design is typical of concentrators treating low sulfur
copper porphyry-skarn style ores. The process involves crushing, grinding,
flotation, molybdenum separation, concentrate dewatering, and tailings
dewatering.
With minor modifications, the plant is designed to process on
average 90,000 ton/d (32.8 million ton/y) of ore. The Project details included
in this section were specifically designed and evaluated to fall within the
permitted facility constraints included in the EIS and State of Arizona permits
while optimizing production, minimizing costs and ramping up production as
quickly as technically and environmentally as possible. State of Arizona
Department of Environmental Quality (ADEQ) permits that were issued based on
early designs will be amended to include designs included in the EIS and this
section; these amendments are customary in the state.
This Technical Report includes refinements of certain aspects
of the Project’s mine plan. While consistency with issued and pending
environmental permits and analysis related thereto has always been a key
requirement for this effort, updates to the original mine plan will be
necessary. To the extent that any regulatory agency concludes that the current
plan requires additional environmental analysis or modification of an existing
permit, the intent will be to work with that agency to either complete the
required process or to adjust the current mine plan as necessary.
17.1.1
Facility Layout and Location
The plant will be located east of the open pit and has been
arranged in a north-south orientation. Ore flow is from south to north with the
ROM stockpile and dump pad located to the south and concentrate filtration and
load-out located at the north end of the facility.
ROM ore will be transported from the mine to the primary
crusher by off-highway haulage trucks. After crushing the ore, it will be
conveyed to the Coarse Ore Stockpile to then be conveyed to the concentrator
facility.
Copper concentrate produced at the concentrator facility will
be loaded onto highway haul trucks for transportation to smelting and refining
facilities. Molybdenum concentrate will be bagged and loaded onto trucks for
shipment to market.
An overall view of the processing facilities is given in Figure
17-1.
Page 17-1
|
|
Rosemont Project |
| Form
43-101F1 Technical Report |
FIGURE 17-1: OVERALL VIEW OF PROCESS PLANT LOOKING NORTH
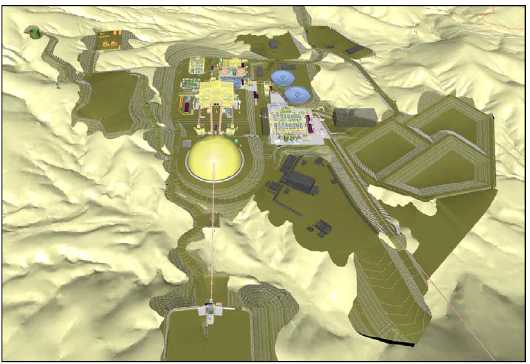
17.1.2
Facility Description
The process plant is modelled after the Constancia Copper
Project design with changes made in certain areas. In some cases, ore
characteristics, local conditions and permitting constraints have dictated that
changes be made such as the filter plant for dry stack tailings.
With minor modifications, the plant is designed to process
90,000 tpd (32,850,000 tpy). Production during the first year of operation is
expected to fall short of full capacity (28,114,000 tons) to account for a
staggered commissioning schedule and brief ramp-up and optimization period.
Annual concentrate production is expected to reach an average of 344,000 tons.
The coarse ore stockpile, grinding areas, pebble crushers,
conveyors, molybdenum plant, and filter plant process areas will be covered and
painted to match the natural landscape. Design reviews were held to ensure that
safety, environmental, permitting, technical, quality, constructability,
maintainability and operability considerations had been correctly addressed.
Key facility design criteria are summarized in Table 17-1.
Page 17-2
|
|
Rosemont Project |
| Form
43-101F1 Technical Report |
TABLE 17-1: KEY FACILITY DESIGN CRITERIA
|
Parameter |
Units |
Value |
|
Plant capacity |
Mton/yr |
32.9 |
|
Copper feed grade |
Avg % |
0.48 |
|
Copper feed grade |
Max % |
0.66 |
|
Molybdenum feed grade |
Avg % |
0.014 |
|
Molybdenum feed grade |
Max % |
0.023 |
|
Copper concentrate grade |
% |
32 |
|
Molybdenum concentrate grade |
% |
45 |
The design grades were selected on the basis of the prevailing
mine plan in order to properly size flotation cells, pumps and pump boxes,
pipelines, tanks, and concentrate de-watering and handling equipment to ensure
adequate unit operation capacities under the vast majority of circumstances.
While it is possible for feed grade to the plant to fall outside of range of
these parameters, these excursions are expected to be both rare and brief, and
can be managed with relative ease. Average and monthly maximum copper head
grades in the current mine plan are 0.447% and 0.670%, respectively.
17.2
Buildings
The facility will include buildings for the following:
- Administration Facilities comprised of the Administration Building,
Medical Clinic/Emergency Response Building, vehicular staging pads and
dedicated vehicular parking areas.
- Security Gatehouse and Weighbridge (truck scale) are located at the
entrance to the plant.
- Plant Maintenance Building where all routine plant maintenance activities
are conducted. Additional ancillary space includes a secure tool crib, parts
store and electrical and instrument shop.
- Metallurgical Lab which includes space for sample preparation and testing.
- Plant Change House that provides space for plant workers to shower, change
and use the restroom.
- Plant Production & Maintenance Office for plant and maintenance staff.
- Plant Control Room, a modular building housing the plant control
operators.
- Plant Warehouse Building with Plant Warehouse Office and external
warehouse yard.
17.3
Processing Plant
The process plant design is based on a combination of
metallurgical testwork, Project production plan and in-house information.
Benchmarking has been used to define and support the design parameters. This
includes the copper-molybdenum separation circuit where testwork has been
limited to a few tests. This is due to the relatively large sample mass required
for a more detailed molybdenum testwork program and analysis.
Page 17-3
|
|
Rosemont Project |
| Form
43-101F1 Technical Report |
The molybdenum plant design is based primarily on projected
mass flows, grades and densities as well as the recent Constancia plant design.
The flowsheet has been developed from previous feasibility
study work, value engineering studies and recent testwork. The Rosemont process
plant includes the following unit processes and facilities:
- Primary crushing.
- Crushed ore stockpile and reclaim.
- Parallel SABC grinding lines with pebble crushing.
- Copper flotation comprising rougher flotation, concentrate regrind, and
two stage cleaning.
- Cu-Mo concentrate thickening.
- Molybdenum flotation including roughing, concentrate regrind and five
stages of cleaning.
- Molybdenum concentrate thickening, filtration and drying.
- Copper concentrate thickening and filtration.
- Copper concentrate load out and storage.
- Tailings thickening, filtration and dry stacking.
- Reagents storage and distribution (including lime slaking, flotation
reagents, water treatment and flocculant).
- Grinding media storage and addition.
- Water services (including fresh water, fire water, gland water, cooling
water and process water).
- Potable water treatment and distribution.
- Air services (including high pressure air and low pressure process air).
- Plant control rooms.
A generalized process flow diagram (PFD) is provided in Figure
17-2.
Page 17-4
|
|
Rosemont Project |
| Form
43-101F1 Technical Report |
FIGURE 17-2: PROCESS PLANT PROCESS FLOW DIAGRAM
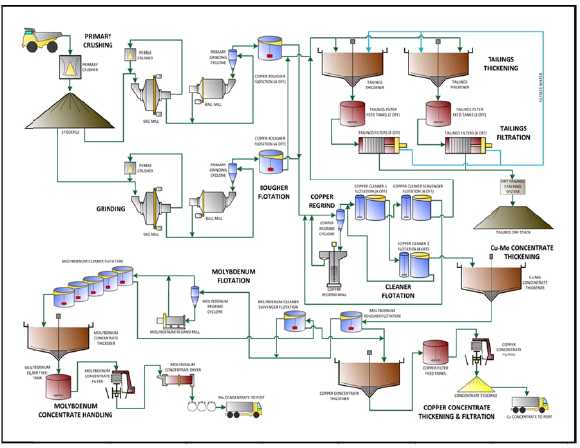
The flowsheet consists of primary crushing, followed by two
parallel SAG, ball milling and pebble crushing (SABC) circuits, copper flotation
with regrinding ahead of cleaning, a moly separation circuit, concentrate
thickening and filtering and tailings thickening, filtering and dry stacking.
With minor modifications, the process plant is designed to
treat on average 90,000 tons/d (or 32.8 million ton/y).
Key design criteria used in the plant design are summarized in
Table 17-2.
TABLE 17-2: KEY DESIGN CRITERIA
|
Parameter |
Units |
Value |
|
Plant capacity |
tons/day |
90,000 |
|
Flotation feed size, P80 |
µm |
140 |
|
Flotation feed density, nominal |
% solids (w/w) |
34 |
|
Flotation feed density, minimum1
|
% solids (w/w) |
28 |
|
Tailings thickener underflow density |
% solids (w/w) |
65 |
|
Tailings filter cake moisture |
% |
15 |
Notes: 1. Minimum density at which design rougher minimum
residence time can be achieved.
Pagee 17-5
|
|
Rosemont Project |
| Form
43-101F1 Technical Report |
The process plant capacity was determined by a combination of
ore characterization testwork, environmental factors and regulatory constraints,
mine planning, engineering estimation, and financial analysis to define best
economic return for the Project. Flotation feed size was selected on the basis
of the best balance of moderating energy input in the grinding circuit and
achievement of recovery targets. Flotation feed density design values are based
on the results of numerous flotation tests and typical industry practice.
Tailings dewatering targets are selected on the basis of thickening and
filtration testwork, capacity requirements, and environmental compliance
limitations. Equipment and unit operations throughout the plant have been
designed to meet these requirements on a routine basis.
The overall annual plant operating schedule is 8,059 hours (92%
of available hours). Operating availability is summarized in Table 17-3.
TABLE 17-3: PLANT UTILIZATION SUMMARY
|
Description |
Units |
Value |
|
Crusher Utilization |
% |
75 |
|
Grinding and Flotation Availability |
% |
93.0 |
|
Concentrate Filter Utilization |
% |
84 |
|
Tailings Filtration and Dry Stack
Utilization1 |
% |
98.6 |
|
Overall Concentrator Asset Efficiency2
|
% |
92.1 |
1factored on a mill runtime
basis 2assumes production ceases when ore flow to the SAG mill is
interrupted
Availability estimates are based on typical industry experience
for plants of similar size and configuration and utilizing typical maintenance
and operating practices. A 99% utilization factor is applied to the availability
to derive the asset efficiency factor, which accounts for non-productive time
unrelated to mechanical maintenance or failure such as shut-down (grind-out) and
start-up, lack of ore, or other upstream/downstream constraints.
17.4
Crushing
17.4.1
Primary Crushing
The Primary Crusher is a 60 x 113 size Gyratory Crusher fitted
with manganese steel concave and mantle liners. The primary crusher was selected
based on the required mill feed rate, expected ROM feed size distribution, ore
bulk density, crushing work index, stockpile capacity, and SAG feed size. The
design crusher feed rate is 6,000 tons/h with a capacity of 90,000 tons/d, based
on a crusher availability of 75% and a 20% catch-up capacity factor. Design
parameters including the expected range of feed size distributions and crushing
work indices were provided to vendors to confirm throughput performance and
motor power requirements. The primary crusher dump pocket is designed to allow
two trucks to dump simultaneously, one from each side. It has the capacity to
hold two truckloads, approximately 520 tons in total.
Page 17-6
|
|
Rosemont Project |
| Form
43-101F1 Technical Report |
FIGURE 17-3: PRIMARY CRUSHER
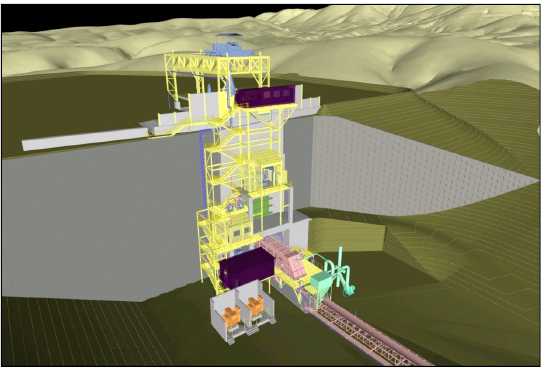
A modular Crusher Control Room is located above the ROM wall to
provide a direct line of sight to the dump pocket as well as the Stockpile Feed
Conveyor. The Control Room includes space for crushing plant operators and two
mine fleet controllers who manage the truck fleet. It is fitted with washroom
and break facilities. A water spray system is fitted at each corner of the dump
pocket for dust control when trucks are dumping. Dust generated in the transfer
point between the Feeder and the Stockpile Feed Conveyor is captured by a
dedicated Cartridge Dust Collector. Dust generated in the crusher vault is
vented to the dump hopper and controlled by the water spray system.
17.4.2
Stockpile Feed Conveyor
Crushed ore is transferred from the Primary Crusher to the
Crushed Ore Stockpile by a Stockpile Feed Conveyor. The conveyor belt is 72
inches wide and 1,014 feet in length with a 211-foot lift and has capacity to
convey 6,600 tons/h of crushed feed to the stockpile (i.e. crusher capacity
+10%). The conveyor is covered outside the Stockpile Dome to minimize dust
emissions.
The conveyor is driven by two 1,200 HP drives (one mounted on
each side of the drive pulley) complete with high speed disc brake and variable
speed drive for controlled start-up. The drives are located adjacent to the
gravity take-up.
17.4.3
Coarse Ore Stockpile and Reclaim
Crushed ore for both grinding lines is stored in a single
Conical Ore Stockpile. The stockpile is enclosed by a dome structure with an
impervious colored fabric cover (approx. 380 feet diameter and 164 feet high) as
shown in Figure 17-4.
Page 17-7
|
|
Rosemont Project |
| Form
43-101F1 Technical Report |
The Stockpile Cover consists of a structural steel multi-arch
frame pinned to a circular ring beam at the center of the dome and pinned at
ground level to a concrete ring beam. A 20-foot-wide path around the stockpile
perimeter provides access for dozer and equipment travel inside the cover. Two
sets of access doors are included to allow machinery access to the stockpile
area.
Live capacity of the stockpile will range between 23,000 to
51,000 tons (6 to 12 hours at full production rate and dependent on prevailing
ore characteristics), representing 14% to 28% of the total stockpile capacity of
198,000 tons. Stockpile ore in dead storage can be reclaimed by heavy equipment
(dozer and/or excavator) to allow for up to two additional days’ interruption of
feed from the primary crusher.
FIGURE 17-4: STOCKPILE FABRIC COVER

Coarse ore is reclaimed from the stockpile by four 72-inch wide
Apron Feeders, two for each grinding line. Each Apron Feeder is fitted with a
variable-speed drive and has the capacity to provide 100% of the full tonnage
rate to its respective SAG mill.
17.5
Grinding
17.5.1
SAG and Ball Mill Grinding
The selected grinding circuit consists of two parallel SABC
grinding lines, each comprising one SAG mill in closed circuit with a sizing
screen and pebble crusher followed by a ball mill in closed circuit with
hydrocyclones. The selected grinding mills are summarized as follows:
- SAG mills – 36 feet diameter (inside shell) x 24 feet effective grinding
length (EGL) with 18 MW twin pinion drives (9 MW per pinion). Motors are
controlled via an SER / hyper synchronous variable speed drive.
Page 17-8
|
|
Rosemont Project |
| Form
43-101F1 Technical Report |
- Ball mills – 26 feet diameter (inside shell) x 40.5 feet effective
grinding length (EGL) with 16.4 MW GMD.
Mill size and power requirements were determined via Ausgrind,
Ausenco’s proprietary power-based comminution calculation program using the
75th percentile values of ore parameters (ore competency and
hardness). RQD was also used to adjust SAG feed size based on a correlation
identified between RQD and sample depth. A +10% design factor was also added to
the SAG motor specification to ensure mill power limitations would not be a
significant factor for achieving throughput targets.
The mills are positioned at right angles to the Feed Conveyor
as shown Figure 17-5 to minimize footprint. A full-width platform is located in
between the Grinding Mills to provide sufficient space for Mill relining
activities.
FIGURE 17-5: GRINDING BUILDING FROM STOCKPILE LOOKING NORTH
(ROOF AND WALLS REMOVED)
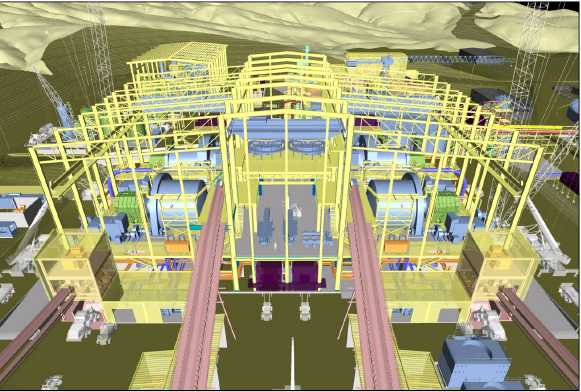
17.5.2
Pebble Crushing and Conveyor Systems
Measured ore competency shows that an SABC grinding circuit
with a pebble crusher is required. Pebble crushers were selected based on
crusher feed rate, ore characteristics and competency factors, pebble top size,
and crusher product size. Pebble rate is expected to vary from 510 tph (15% to
25% of new SAG mill feed nominally), up to 700 tph (30% with worn SAG mill
grates).
Page 17-9
|
|
Rosemont Project |
| Form
43-101F1 Technical Report |
Cone crushers (one per grinding line) were selected for pebble
crushing duty and will have sufficient capacity of 495 tph to over 1000 tph
depending on liner profile and gap setting.
FIGURE 17-6: PEBBLE CRUSHING LOOKING SOUTH FROM THE GRINDING
AREA
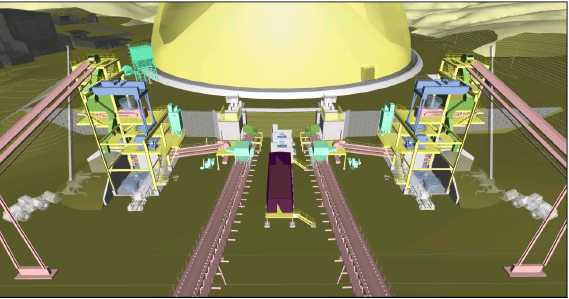
Pebbles from each SAG Mill are transferred to the Pebble
Crusher Bin via the 54-inch Pebble Conveyors. Tramp metal is captured by two
cross-belt self-cleaning magnets arranged in series for each crusher.
The Pebble Conveyor discharges onto a diverter gate which
directs the material to the Pebble Crushing Bin or allows bypass to the Pebble
Conveyor Bypass Bunker or the Pebble Crusher Product Conveyor.
17.6
Copper Flotation
The Copper Flotation Area is positioned perpendicular to the
Grinding Area taking advantage of the ground sloping west to east as shown in
Figure 17-7.
The circuit consists of two parallel trains of Rougher
Flotation Cells. A third train of Cells includes the first and second stage
Cleaner Cells as well as the Cleaner Scavenger Cells and is arranged parallel to
the Rougher Cells.
Page 17-10
|
|
Rosemont Project |
| Form
43-101F1 Technical Report |
FIGURE 17-7: COPPER FLOTATION

The copper flotation circuit consists of two parallel trains of
four rougher flotation cells followed by rougher concentrate regrind and two
stages of cleaner flottation. Flotation feed, from primary cyclone overflow,
reports to two rougher flotation trains each consisting of four forced air
mechanical flotation tank cells. The Copper Rougher Flotation Cells are
conventional 630 m³ (22,000 ft3) tank cells with 650 HP direct drive
arrangement and are fed low pressure air by blowers. The two lines provide a
total of 34 minutes’ residence time at the nominal feed density (34% solids) and
28 minutes’ residence time at 28% solids feed density at a potential 90,000
tpd.
The rougher flotation cells produce a low grade
copper-molybdenum (Cu-Mo) concentrate that requires further liberation and
upgrading. Copper rougher concentrate is combined in the copper regrind feed
hopper and pumped to the regrind cyclones for classification.
The copper rougher tailings stream from each train are combined
and gravitate to the flotation tailings thickener feed distributor via a
cross-cut sampler r. The cleaner scavenger concentrate can also be directed to
the regrind feed hopper if required. The underflow from the copper regrind
cyclone cluster reports to the regrind mill, which overflows back into the
copper regrind feed hopper.
The overf flow from the regrind mill cyclone cluster is pumped
directly to the copper cleaner flotation circuit. The copper cleaner circuit
consists of two stages of cleaning and one bank of cleaner scavenger cells.
The first cleaner consists of four forced-air mechanical staged
flotation reactor (“SFR”) flotation cells complete with froth wash water system
to minimize non-sulfide gangue entrainment. The second cleaners also comprise
four forced-air mechanical SFR cellls with froth wash water systems.
The Copper Cleaner 1, Copper Cleaner 2 and Cleaner Scavenger
flotation cells will be SFRs. The Copper Cleaner 1 and Cleaner Scavenger cells
will have approximately 3,900 feet³ of volumetric capacity, while the Copper
Cleaner 2 will have 1600 feet³ of volumetric capacity.
Page 17-11
|
|
Rosemont Project |
| Form
43-101F1 Technical Report |
SFR flotation cells were selected for the cleaner duty due to
their ability to achieve high upgrade ratios with a relatively small footprint
and reduced air and power consumption.
The online stream analyzer (“OSA”) is located in a dedicated
area on the west side of the facility. Major concentrate and tailings streams
are pumped to the OSA to allow optimization of reagent additions and flotation
performance. Samples are collected using Gravity Samplers or Pressure Samplers
at the pump discharges and transferred to the OSA using peristaltic pumps. The
samples are sorted by a multiplexer and are returned to the process by
horizontal centrifugal pumps after analysis.
17.6.1
Copper Regrind
The Copper Regrind circuit consists of a Copper Regrind Mill
Feed Hopper and a Copper Regrind Cyclone Cluster in a closed circuit with the
Copper Regrind Mill, as shown inFigure 17-8.
FIGURE 17-8: COPPER REGRIND AREA LOOKING WEST
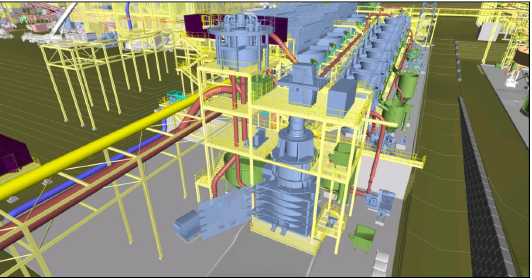
The concentrate regrind mill was selected based on the expected
range of concentrate feed rate (rougher mass pull), estimated feed size and
product size (40 µm). Regrind product size was selected based on mineralogy
studies and locked cycle flotation tests.
A typical regrind cyclone partition curve was used to estimate
cyclone underflow size distribution and cyclone mass split. The estimated
nominal recirculating load based on simulated size distributions was 170% with
regrind mill feed size F80 (cyclone underflow) approximating 70-75
µm.
Regrind mill power requirements were estimated based on the
overall flotation circuit mass balance, grind-size target as determine by
testwork programs (40 µm), and Ausenco’s in-house regrind specific energy data
set calculations. A VertiMill with 3000 kWh motor was selected for regrinding
duty.
Page 17-12
|
|
Rosemont Project |
| Form
43-101F1 Technical Report |
17.6.2
Copper-Molybdenum Concentrate Thickening
The bulk copper-molybdenum (Cu-Mo) concentrate is pumped from
the copper flotation circuit to the Cu-Mo concentrate thickener via a trash
screen. The trash screen removes coarse oversize that can damage or block
downstream equipment, e.g. copper pressure filter ports and metallurgical
samplers. Trash reports to a collection box via a chute. Trash screen undersize
gravitates to the copper-molybdenum concentrate thickener via a thickener feed
box.
Cu-Mo concentrate is thickened to reduce the volume of residual
copper flotation reagents in the molybdenum flotation feed.
Thickener overflow from the Cu-Mo concentrate thickener is
pumped to the tailings thickener where it is recovered as process water. Cu-Mo
concentrate thickener underflow is pumped to the molybdenum flotation circuit by
centrifugal pumps.
The Cu-Mo concentrate thickener and molybdenum flotation
circuit can be bypassed if required by diverting the bulk Cu-Mo concentrate
(from copper flotation) direct to the copper concentrate thickener.
The area is bunded and can contain the entire volume of a
Filter Feed Tank combined with the Copper Area bund. Any further spillage
overflows into the site drainage system and reports to the primary settling
basin.
17.7
Copper-Molybdenum Separation
The molybdenum separation circuit consists of rougher flotation
cells followed by a regrind circuit, five stages of cleaner flotation and one
stage of cleaner scavenger flotation. All flotation cells, with the exception of
the fifth cleaner cell (Jameson cell), are self-aspirated mechanical flotation
cells fitted with covers. All self-aspirated cells are driven by a v-belt drive.
The Molybdenum Plant is shown in Figure 17-9.
Page 17-13
|
|
Rosemont Project |
| Form
43-101F1 Technical Report |
FIGURE 17-9: MOLYBDENUM PLANT LOOKING WEST (ROOF AND WALLS
REMOVED)
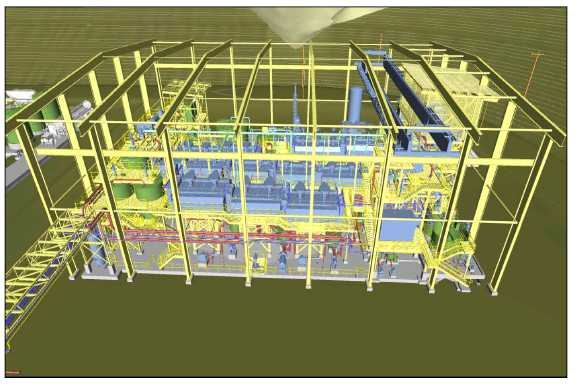
Flotation cells selected for the molybdenum separation circuit
are summarized as follows:
- Rougher – six 988 ft3 (28 m3) self-aspirated inert
gas cells in a 2-2-2 configuration.
- Cleaner 1 – five 495 ft3 (14 m3) self-aspirated
inert gas cells in a 1-2-2 configuration.
- Cleaner scavenger – four 495 ft3 (14 m3)
self-aspirated inert-gas cells in a 2-2 configuration.
- Cleaner 2 – four 495 ft3 (14 m3) self-aspirated
inert gas-cells in a 2-2 configuration.
- Cleaner 3 – five 300 ft3 (8.5 m3) self-aspirated
inert-gas cells in a 2-3 configuration.
- Cleaner 4 – four 152 ft3 (4.3 m3) self-aspirated
inert-gas cells in a 2-2 configuration.
- Cleaner 5 – single Jameson flotation cell.
The layout takes advantage of gravity used from Molybdenum
Cleaner 5 through to Molybdenum Cleaner 2 with only the concentrate flows being
pumped. Gravity transfer is used from Molybdenum Cleaner 1 to the Molybdenum
Cleaner Scavenger and the rougher cells tails.
The molybdenum flotation circuit separates molybdenum and
copper minerals as separate concentrates from a bulk Cu-Mo concentrate.
An OSA is used to monitor metal contents and solids
concentrations in the feed, final concentrate, cleaner scavenger tailings and
rougher tailings streams and allow operators to optimize reagent additions and
flotation performance.
Page 17-14
|
|
Rosemont Project |
| Form
43-101F1 Technical Report |
17.7.1
Molybdenum Scrubbing System
The scrubbing system comprises of a Molybdenum Scrubber and
uses caustic soda. The scrubbing system is mounted between the NaHS and plant
diesel area and includes redundancy of all components for safety reasons. The
scrubber removes gas from all the flotation cells, hopper and tanks via an
elevated pipe network, converts gases to NaHS by using caustic soda addition
(through intermediate bulk containers “IBCs”) and discharges clean air through
the main stack.
17.8
Molybdenum Concentrate Thickening, Filtration and
Drying
The molybdenum concentrate handling circuit consists of a small
concentrate thickener, pressure filter, dryer and concentrate bag loading
system. Molybdenum concentrate gravitates from the molybdenum plant OSA to the
molybdenum concentrate thickener via a thickener feed box.
The concentrate thickener overflow reports to the tailings
thickener. Molybdenum concentrate solids settle for collection at the underflow
cone at a density of 60% w/w solids. The thickener underflow stream is pumped to
an agitated filter feed tank by peristaltic pumps. A trash screen is located
prior to the filter feed tank. The trash screen removes coarse oversize that may
damage or block the filter.
High pressure air for the concentrate filter is supplied by a
dedicated air compressor. High pressure air for drying is stored in a dedicated
air receiver. Filter membrane pressing is supplied by the filter pressing water
pump. Molybdenum filter cake is discharged from the filter and directed to a
concentrate dryer via a screw feeder. The molybdenum concentrate dryer is a
Holoflite dryer with a thermal oil heater and off-gas scrubber. The Holoflite
drier reduces concentrate moisture to approximately 5% w/w.
Dried concentrate is stored in a bin ready to be bagged in the
bagging station. The storage bin is sized to allow bagging of concentrate on
dayshift only. Bagged concentrate is weighed and labelled prior to being loaded
onto trucks by fork lift.
17.9
Copper Concentrate Dewatering and Storage
17.9.1
Copper Concentrate Dewatering
Concentrate thickeners were sized using benchmarked typical
unit settling rates for copper concentrates with comparable size distribution
and mineral composition. Thickener feed rates were based on maximum design
copper head grades at 90,000 tpd. Copper-molybdenum and final copper concentrate
thickeners with diameters of 79 feet (24 meters) were selected based on a unit
settling rate of 2 ft2/tpd (0.2 tonne/m2/h).
Two pressure filters were selected for the copper concentrate
filter duty. The nominated filters are expected to operate with sufficient
design margin; however, if additional filter capacity is required, each filter
can be expanded from 1,162 ft2 (108 m2) to 1,550 ft2
(144 m2) with the installation of additional plates.
Page 17-15
|
|
Rosemont Project |
| Form
43-101F1 Technical Report |
17.9.2
Copper Concentrate Storage and Load Out
Copper concentrate filter cake is discharged by gravity to a
covered stockpile. A front-end loader (FEL) is used to maximize concentrate
storage within the covered building. The covered building provides storage
capacity for up to 5,000 tons at average production rates.
Copper concentrate is loaded into containers which are then
covered and sealed. These containers sit on top of trucks licensed for use on
the highway for transport from the mine site to a storage terminal.
An automated truck wash washes concentrate from the road trucks
as they leave the concentrate storage building. Wash water and solids are
recovered in a sump and pumped to the copper concentrate thickener.
Road trucks are weighed on a weighbridge located at the main
security gate prior to leaving the mine site.
The Copper Concentrate area consists of the Concentrate Filter
building and storage shed. Compressed air services are located to the west and
the Electrical Rooms are located on the east side.
The Concentrate Filter Building, shown in Figure 17-10,
houses filters and ancillary equipment such as control panels and mufflers.
FIGURE 17-10: COPPER CONCENTRATE FILTRATION, STORAGE AND LOAD
OUT LOOKING SOUTH
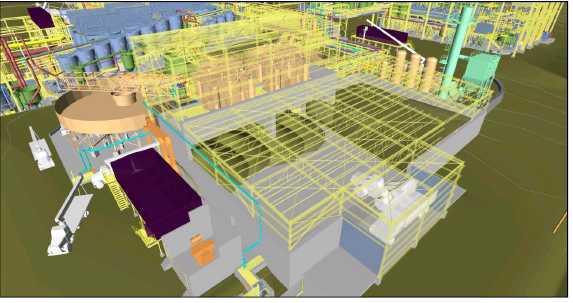
Page 17-16
|
|
Rosemont Project |
| Form
43-101F1 Technical Report |
17.10
Tailings Thickening
The copper rougher tailings streams are combined with the
copper cleaner scavenger tailings and the concentrate thickener overflow streams
and gravitate to the tailings thickener feed distributor via a metallurgical
cross-cut sampler. Tailings slurry is split into two uniform feed streams and
directed to each thickener. Flocculant is added to the thickener feed streams to
enhance settling.
The tailings thickening circuit consists of a tailings feed
distribution box and two 213 feet (65 meters) diameter high compression
thickeners to thicken flotation tailings to 65% w/w solids and recover process
water to the process water tank.
FIGURE 17-11: TAILING THICKENERS LOOKING EAST
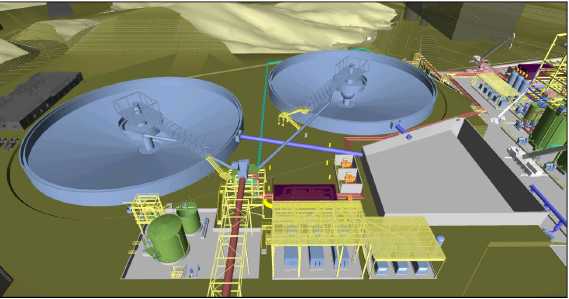
Tailings thickeners were selected as part of an overall
tailings dewatering strategy that involved optimising underflow density to
maximize downstream filtration rates, and were sized based on settling rate data
derived from testwork conducted by FLSmidth, Outotec, Bilfinger, and Pocock
Industrial. Optimum underflow density targets a narrow range below the point
where the slurry yield stress inhibits handling by centrifugal pumps (without
shear thinning systems).
17.11
Tailings Filtration Plant
The tailings filter area as shown in Figure 17-12 is located on
the east side of the plant. The design consists of two identical parallel trains
of filter feed tanks, and utilities such as compressed air and water.
Page 17-17
|
|
Rosemont Project |
| Form
43-101F1 Technical Report |
FIGURE 17-12: TAILINGS FILTER PLANT (ROOF AND WALLS REMOVED)
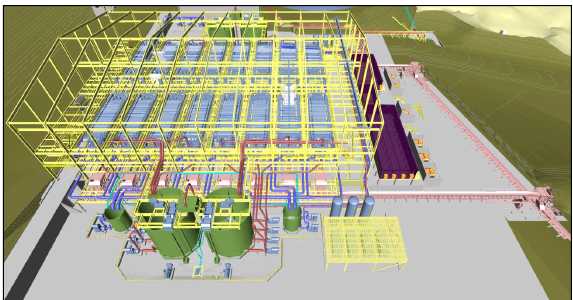
Thickened underflow is pumped from the tailings thickeners to
two lines of agitated filter feed tanks. Filter feed tank design has a 4.5 -hour
residence time.
The design allows for a total of 20 filters to be installed in
order to process ore requirements over the life of mine. Nevertheless, as a risk
mitigation strategy, additional space has been allowed for the installation of 4
additional filters, in the event that they may be required. Filter cake from the
filters discharges to a single belt feeder via a set of ‘bomb-bay’ doors. The
belt feeder operates continuously but at a low rate to deliver filter cake to
the downstream conveyor continuously over the full cycle time of the filter.
The overland conveyor to the discharge point for the tailings
stacking system is 2,171 feet long with 211-foot lift. The drive is installed at
the head end, as is the gravity take-up system. The conveyor is driven by two
1200 HP drives mounted one on each side of the drive pulley.
The control room for this area is mounted on the upper deck
central to the building on the west end. This bay includes a drive-through for
trucks and other mobile equipment. The east end includes a drop down zone for
filter components loading onto a truck.
17.11.1
Tailings Stacking
Dried tailings from each tailing transfer conveyor is
discharged to a single overland tailings conveyor. This conveyor delivers
tailings via a bifurcated chute to either the primary or secondary stacking
system, which comprise the material handling system for the DSTF.
Page 17-18
|
|
Rosemont Project |
| Form
43-101F1 Technical Report |
FIGURE 17-13: TAILINGS SHIFTABLE CONVEYOR/MOBILE TRIPPER

The detailed design and selection philosophy for the stacking
equipment considers the following drivers:
- Minimize stacker downtime for changeovers between lifts and sweeps.
- Maintain stacker progression rates within practical limitations.
- Maximize evaporative drying of the stacked tailings.
- Minimize stacker and conveyor costs.
- Equipment should be mechanically robust to minimize unplanned downtime.
- Stack material in a way which addresses geotechnical considerations,
including equipment setback distances
- Permit constraints.
Dry Tailings Stacking Mobile Conveyors operate in series and
transport tailings from the Mobile Tripper to the Extendable Mobile Dry Tailings
Stacker. During operation, the number of these conveyors required is dependent
on the final tailings deposition location relative to the position of the
Shiftable Conveyor and Mobile Tripper.
17.12
Reagents and Consumables
The main reagent area is located at the west end of the copper
flotation area, with the flocculant area being located next to the tailings
thickeners. All of the reagents required for the molybdenum plant are handled
inside the molybdenum building.
Page 17-19
|
|
Rosemont Project |
| Form
43-101F1 Technical Report |
FIGURE 17-14: REAGENTS AREA
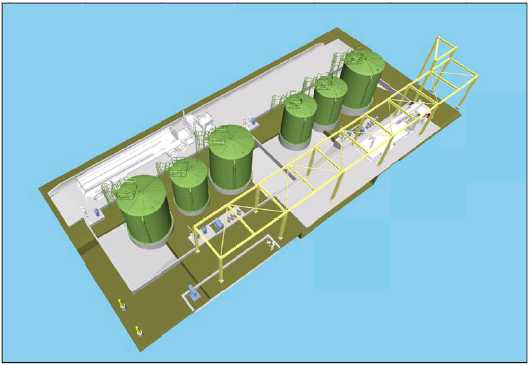
Major process reagents and consumables are received and stored
on site as either dry product or bulk liquids. Where required, dedicated mixing,
storage and dosing facilities are provided for each reagent.
- Lime is used to increase slurry pH and subsequently depress minor pyrite
in copper flotation.
- Collector (SIBX) - Sodium isobutyl xanthate (“SIBX”) is used as the
collector in the bulk copper-molybdenum flotation circuit.
- Promoter-Cytec AP3894 promoter is added as a secondary collector in the
bulk copper- molybdenum flotation circuit.
- Frother-Methyl isobutyl carbinol (“MIBC”) is used to provide a stable
froth in the copper flotation cells.
- Diesel fuel oil is used as a collector/promoter to assist flotation of
molybdenum minerals in the copper and molybdenum flotation circuits.
- Sodium hydrosulfide (“NaHS”) is used in the molybdenum flotation circuit
as a depressant for non-molybdenum minerals.
- Sodium silicate can be used in the molybdenum flotation circuit as a
dispersant for fine non-sulfide gangue and clay-bearing minerals.
- Flocculant is used as a settling aid in the concentrate and flotation
tailings thickeners.
- Carbon dioxide is used to control pH to 9.0-10.0 in the molybdenum rougher
and cleaner conditioning tanks.
Page 17-20
|
|
Rosemont Project |
| Form
43-101F1 Technical Report |
- Nitrogen is used in the molybdenum flotation cells to minimize oxygen
entrainment and maximize depression of copper. A small pressure swing
adsorption (“PSA”) plant supplies nitrogen to the molybdenum flotation
circuit.
- Additional miscellaneous reagents are required in the plant; however,
these are expected to be used in relatively small quantities.
17.13
Plant Services
17.13.1
Process Water Services
Fresh water is sourced from wells located on the western side
of the Santa Rita Mountains and is pumped through a series of booster tanks and
pumps to the fresh water tank located above the plant site.
- Fire water.
- Potable water including a water treatment plant.
- Gland seal water.
- Cooling water including chillers and closed loop cooling system.
Process water for ‘general use’ is sourced from the tailings
thickener overflow (including concentrate thickener overflow and tailings filter
filtrate water) and the fresh water tank as required. Supplementary water
sources used for process water make-up include:
- Plant site run-off collected in the primary settling basin.
- Crusher stormwater pond.
- Mine pit sump and pit storm water pond.
- Mine ground water dewatering wells.
Process water is stored in the process water pond. Process
water pond pumps transfer water from the storage pond to the process water tank.
Excess water in the process water tank overflows back to the process water pond.
The tailings thickener overflow streams report directly to the
process water tank for immediate distribution and use. Process water pumps
distribute process water to the grinding mills, copper flotation, regrind
circuits and lime slaking plant. Cloth wash water pumps distribute process water
to the tailings filters for automated cloth washing and manifold flushing.
17.13.2
Air Services
Three separate plant air compressors provide air service
throughout the plant. Due to its remote location, the primary crusher is
serviced by a dedicated air compressor with an air dryer and filter system.
Page 17-21
|
|
Rosemont Project |
| Form
43-101F1 Technical Report |
17.14
Process Control Strategy
17.14.1
Process Plant PCS
The process control system (“PCS”) is an integrated plant-wide
design, enabling the start-up, monitoring and control and shutdown of equipment
from the plant control rooms.
The process plant is monitored and controlled from three
separate control rooms:
- Crusher control room.
- Main control room (located in the flotation area).
- Tailings control room (located in the tailings filtration building).
Operators can control the plant via PC-based human machine
interface (“HMI”) stations. Each HMI station provides dynamic graphical
representation of the plant operation; equipment control functions; alarm
displays; event logging; trending; data collection and reporting to assist in
analysis of plant operations.
Where specific equipment forms part of an approved vendor
package and drives are controlled from a vendor control panel, a communications
interface is used to enable remote control and monitoring from the PCS. This
includes digital and analogue signals for alarms; faults; instrumentation and
monitoring; motor and valve control; process variables and interlock controls.
The crusher control room contains a single HMI station with two
monitors. The HMI station provides dedicated control of the crushing plant
area.
The main control room contains three HMI stations, each with
two monitors. The main control room provides dedicated control of the main plant
areas. Control of the crusher and tailings areas is also possible from the main
control room. An engineering development workstation is also located in the main
control room building.
The tailings control room contains one HMI station with two
monitors. The HMI station provides dedicated control of the tailings filtration
and dry stack areas.
17.14.2
On-Stream Analysers
Plant instrumentation includes OSA that are used to
continuously monitor copper, molybdenum, iron and density in key process streams
and assist with optimizing concentrate grade and recovery.
Dedicated OSA systems are provided in the copper and molybdenum
flotation circuits. Each OSA unit is centrally located in the respective plant
and elevated to allow gravity discharge of samples to sample return pumps. Each
analyzer has two 6-channel multiplexers. Sub-samples for shift composites are
collected automatically.
A single PSA is installed to continuously measure the particle
size of the copper regrind cyclone overflow.
Page 17-22
|
|
Rosemont Project |
| Form
43-101F1 Technical Report |
17.14.3
Closed Circuit Television (CCTV) Systems
A closed-circuit television (“CCTV”) system is used to assist
control room operators in monitoring the operation of plant and equipment.
The CCTV system provides real-time monitoring with archived
recording for a nominal period. Camera types include fixed cameras and cameras
with remote pan-tilt and/or zoom functions accessible by the control room
operators.
Page 17-23
|
|
Rosemont Project |
| Form
43-101F1 Technical Report |
18
PROJECT INFRASTRUCTURE
This section addresses the infrastructure facilities that will
support the Rosemont mine and processing facilities. The infrastructure
facilities include the access roads into the plant site, source of electrical
power and power distribution, source of fresh water and water distribution,
DSTF, WRSA, transportation and shipping, communications, and mobile
equipment.
This Technical Report includes refinements of certain aspects
of the Project’s mine plan. While consistency with issued and pending
environmental permits and analysis related thereto has always been a key
requirement for this effort, updates to the original mine plan will be
necessary. To the extent that any regulatory agency concludes that the current
plan requires additional environmental analysis or modification of an existing
permit, the intent will be to work with that agency to either complete the
required process or to adjust the current mine plan as necessary.
18.1
Access Roads, Plant Roads and Haul
Roads
Access and plant roads consist of an access road into the plant
from State Highway 83, in-plant roads, haul roads and a security patrol road
around the toe of the WRSA and DSTF. The plant and access roads are shown in
Figure 18-1.
FIGURE 18-1: PLANT AND ACCESS ROAD
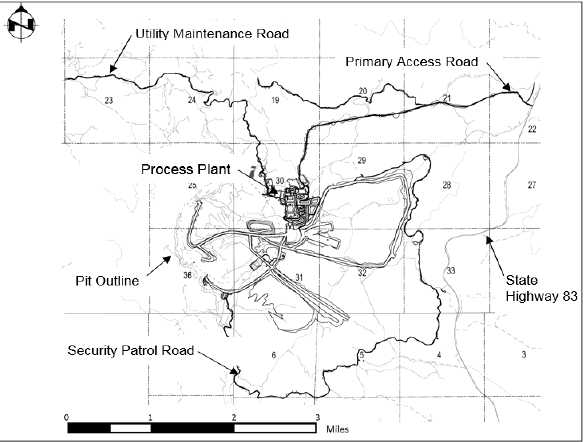
Page 18-1
|
|
Rosemont Project |
| Form
43-101F1 Technical Report |
The access road to the property starts at State Highway 83 at a
point between mile markers 46 and 47 and ends at the main guard house at the
entrance to the plant. The intersection of the access road with State Highway 83
will be modified to provide safe ingress and egress from the access road in
compliance with ADOT and AASHTO standards. Modifications will include a
northbound acceleration lane, northbound left turn lane and a southbound right
turn lane.
In-plant roads extend from the plant entrance both through and
around the perimeter of the process facilities. Secondary roads, such as the
utility maintenance road, leave this perimeter road to serve the main
substation, water storage tank, and access the utility corridor. As per the
State of Arizona Air Quality Control Permit and the EIS analysis, specific
in-plant roads will be paved to reduce dust emissions.
Haul roads used for access to and construction of perimeter
waste rock buttresses shall be a minimum of 150 feet wide to allow trucks to
turn around with the roadway surface.
A security patrol road will be provided around the toe of the
WRSA and the DSTF along the security fence line for security to monitor the
plant boundaries and provide maintenance access to the WRSA and DSTF.
18.2
Power Supply and Distribution
Pursuant to the Certificate of Environmental Compatibility
(“CEC”) issued by the Arizona Corporation Commission (ACC) on June 12, 2012, TEP
will provide the electrical power supply for the Rosemont mine and process
facilities. The total connected load for the Rosemont mine and process
facilities is estimated to be approximately 183 MVA and will require a
transmission voltage of 138 kV.
The proposed Toro Switchyard, located approximately 3 miles
south of Sahuarita Road and 3.5 miles east of I-19 near the Country Club Road
and Corto Road alignments will tap into the existing 138kV transmission line
that extends from the South Substation to the Green Valley Substation. The
transmission line follows a 13.2 -mile-long route originating at the Toro
Switchyard and terminating on Rosemont private property at the Rosemont
Switchyard, Figure 18-2.
Distribution power tapping from the Rosemont Switchyard to the
substation will provide power to the process plant and the mine.
Page 18-2
|
|
Rosemont Project |
| Form
43-101F1 Technical Report |
FIGURE 18-2: CEC APPROVED UTILITY CORRIDOR FOR 138KV
TRANSMISSION LINE
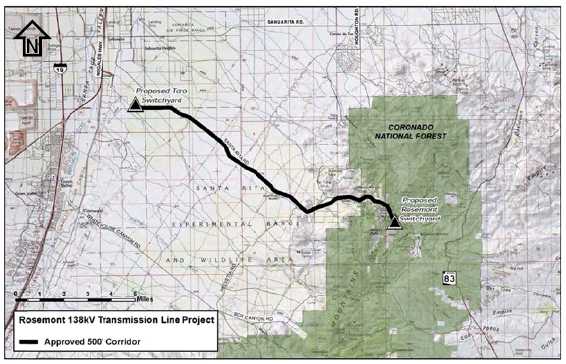
18.3
Water Supply and Distribution
The fresh water design requirement for the Rosemont facilities
is 3,500 gallons per minute (“gpm”) and peak of 5,000 gpm. The delivery
requirements are based on the draft overall site water balance developed by
Ausenco which takes into consideration dust control, process make-up water,
process fresh water requirements, and potable water. The source of water supply
identified for the Project is groundwater in the basin-fill deposits of the
upper Santa Cruz basin, which lies west of the Project and the Santa Rita
Mountains. The Project has a permit to withd draw groundwater for Mineral
Extraction and Metallurgical Processing in the amount of 6,000 acre-feet per
year for 20 years.
Rosemont Copper has acquired a 53-acre land parcel near Santa
Rita and Davis Roads (Sanrita West), and a 20-acre parcel near Santa Rita Road
and Country Club Drive (Sanrita South, or Station No. 1 site), for the purpose
of constructing and operating a production well field for the Rosemont water
supply.
The wells will deliver water to pump station no. 1 located at
Sanrita South. There are three (3) other pump stations located strategically
along the alignment of the water piipeline to pump the necessary water to the
storage tank located at the mine site, Figure 18-3.
Page 18-3
|
|
Rosemont Project |
| Form
43-101F1 Technical Report |
FIGURE 18-3: UTILITY CORRIDOR FOR WATER LINE
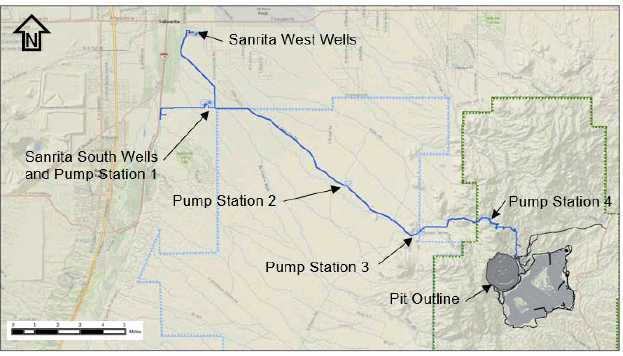
The pipeline will discharge to the Rosemont fresh/fire water
tank, which serves to provide storage and reserve for the operations. The lower
portion of the tank, with an approximate capacity of 300,000 gallons, will be
reserved for the fire water system. Flow of fire water and fresh water is
provided by gravity.
Water will be provided to a potable water system, fresh water
system, process water system, and fire water system.
The potable water system consists of a potable water treatment
package, potable water tank and a distribution network delivering potable water
by gravity to all ancillary buildings, process facilities, restrooms, and safety
showers. The fresh water system consists of the gravity distribution network
from the fresh water storage tank to the process facilities requiring fresh
water. The fresh water usage is for gland water pump seals, fresh water make-up
to the mills, flotation plant make-up, and reagent make-up. The process water
system consists of a process water pond that collects process water from the
concentrate and tailings de-watering equipment for recycling back into the
circuit. The fire water system consists of a gravity distribution network from
the fresh water / fire water storage tank to a system of hydrants around the
ancillary buildings and process facilities.
Rosemont has voluntarily committed to recharging 105% of the
groundwater used during operations. Thus far, 45,000 acre-feet of water
resulting in nearly 42,600 acre-feet of storage credits have been recharged back
into the Tucson Active Management Area, the area of planned withdrawal.
Additionally, in an effort to reduce water usage, Rosemont is committed to use
dry stack tailings instead of conventional tailings. The tailings dewatering
system is expected to recycle about 15,000,000 gallons of water per day.
Page 18-4
|
|
Rosemont Project |
| Form
43-101F1 Technical Report |
18.4
Tailings Management
The Rosemont DSTF has been designed to receive dewatered
tailings from the processing plant at a nominal rate of 90,000 dry tpd. This
material will be stacked behind large containment buttresses constructed from
pit run waste rock.
The deposition of dewatered tailings, waste rock and overburden
will be initiated with a series of perimeter buttresses and berms. The staging
of these buttresses will also allow reclamation to begin early in the operation.
Soil will be salvaged from pit and WRSA and DSTF for use as a vegetation growth
medium. The dewatered tailings deposition will incorporate staged waste rock
buttresses for visual screening and to improve mechanical and erosional
stability of the tailings.
18.4.1
DSTF Location and Design
Design criteria and objectives for the original dry stacked
tailings facility included:
- Provision of secure long-term storage of a minimum 500 million tons (Mt),
which is sufficient for the ore to be mined and processed during the Project
life;
- Location within the immediate general area of the mine (approximately
five-mile radius from the proposed mine pit);
- Prevention of airborne release of tailings solids to the environment by
provision of dust suppression measures;
- Compliance with all applicable regulations including Arizona Best
Available Demonstrated Control Technology (“BADCT”) standards;
- Creation of a site-specific design that accounts for local factors
including climate, geology, hydrogeology, seismicity and vegetation; and
- Establishment of an effective and efficient reclamation program, with a
focus on concurrent reclamation.
Advantages of the dry stacked tailings over a conventional
tailings impoundment is that it eliminates the need for an engineered embankment
and seepage containment system, maximizes water conservation and minimizes water
makeup requirements, results in a very compact site limiting disturbance to a
single drainage, and allows opportunities for concurrent reclamation and
provisions for dust control.
The selected site is located just east of the proposed mill
site in Barrel Canyon. The DSTF site is characterized by terrain sloping
generally east from the plant area to the Barrel Canyon, which generally runs
north south in this area.
The design was developed based on hydrological and geotechnical
studies that included review of regional climate data, drilling and testing
programs, and laboratory characterization of subsurface and tailings samples.
Page 18-5
|
|
Rosemont Project |
| Form
43-101F1 Technical Report |
18.4.2
DSTF Stability
The DSTF is designed as a low hazard facility with waste rock
placed as buttressing material. The filtered tailings lifts will densify under
successive controlled conveyor lift placement and will result in an increase in
the lower lift fill strength over time. The DSTF stability analyses considered
the maximum ultimate height at the maximum section through the facility for
downstream and upstream stability.
The tailings will be placed in a dewatered state for acceptable
handleability during conveyance and trafficability of the tailing surface, which
will limit susceptibility to liquefaction under dynamic loading. However,
limited higher moisture zones within the tailings mass created by meteoric water
may occur. This condition was considered in the stability modelling by applying
reduced shear strength to thin layers within the tailings mass at various levels
to simulate these higher moisture zones and to evaluate the subsequent
earthquake resistance of the facility.
Thus, adequate factors of safety for static and pseudo-static
were obtained from the stability analyses based on the selected parameters and
proposed facility. The use of dry stack tailings as oppose to conventional
tailing impoundments eliminates the danger of dam failure typically seen with
tailings ponds.
The slope stability analyses performed on the outer slope
indicate the dry stack tailings operations can be constructed with stable 3H:1V
inter-bench slopes and an overall stable slope of approximately 3.5H:1V.
18.4.3
Hydrologic Modeling
Modelling calculations performed for the EIS indicate that
infiltration of rain into the DSTF did not develop. The resistance to
infiltration is a function of the fine-grained nature of the crushed and ground
tailings material and the compaction that will occur with placement and facility
construction.
Much of the DSTF will ultimately lie above the ultimate
groundwater capture zone predicted by the groundwater models. Within this zone,
any seepage that may occur would ultimately flow via groundwater to the open
pit. The portions of the facility not included in this capture zone will
generate seepage and is permitted under the Aquifer Protection Permit program in
the state of Arizona. Water entrained in the DSTF that comprises drain-down has
been chemically analyzed and modeled and is not expected to exceed AWQS at
compliance locations, located around the perimeter of the facilities. The ADEQ
evaluated the potential for seepage and issued permits based on their analysis.
Modelling and analytical results indicate that seepage constituent
concentrations will be below the AWQS for regulated constituents. This modeling
is supported by 174 geochemical samples of waste rock evaluated during the EIS
process as well as ten tailings samples specifically reviewed by the Arizona
Department of Environmental Quality during the Aquifer Protection Permit
process. Samples were subject to combinations of testing to determine their acid
generating potential, whole rock analysis, synthetic precipitation leach
procedure testing, meteoric water mobility testing, and humidity cell testwork.
The tests performed on the waste rock showed a net neutralization potential of 225. This is considered highly
buffering (zero or less being acid generating) ensuring that the buttress
materials will not generate acid rock drainage (ARD) The tailings testing
resulted in analysis of seepage that supported the ADEQ determination.
Page 18-6
|
|
Rosemont Project |
| Form
43-101F1 Technical Report |
Later work continues to support this finding and is consistent
with prior testwork. Mineralogical analysis of 107 drill core composite samples
(Section 7.6) indicating that Rosemont ore will contain less than 3% by weight
sulfide (potentially acid generating) minerals, most of which will be recovered
as valuable concentrates in the process. The analysis also indicates that the
ore will contain approximately 20% carbonates (calcite, dolomite) which are
alkaline and will serve to neutralize any acidic species that could be generated
by decomposition residual sulfide minerals in the process plant tailings.
Pit-run waste rock will consist largely of limestone and skarn rock types, with
some andesite, quartz monzonite porphyry, and arkose. The presence of
substantial quantities of limestone and skarn (97%) along with low-sulfide
content, supports the analysis in the EIS that determined there is a large
buffering capacity within the buttress materials which will minimize the
potential generation of ARD.
18.4.4
Surface Water Control
Once the perimeter buttresses/berms are placed across the
drainages and washes, stormwater run-on will be limited by ponding stormwater
upstream of the dry stack areas. Stormwater runoff sediments from the waste rock
buttresses will be captured in sediment basins located downstream of the
tailings facility. During operations, the tailings surface will be sloped away
from the waste rock buttresses to limit potential water impoundment against the
buttresses. Perimeter ditches will be constructed at the upgradient outer edges
of the tailings surface to retain and evaporate water.
18.4.5
DSTF Operations
Dewatered tailings will be delivered by conveyor and placed
with a radial stacker. A dozer might be used to spread the dry tailings to
provide a suitable surface for the conveyor and stacker as needed.
An initial starter buttress will be constructed with waste
rock. Concurrent tailings placement and buttress construction using waste rock
placement will occur throughout the life of the tailings facility. Waste rock
will be advanced ahead of the tailings level in successive lifts using the
upstream construction method. The waste rock buttresses will accommodate haul
traffic and outer slopes generally of 3H:1V with benches to achieve an overall
sloped facility of 3.5H:1V.
18.5
Communications
There are requirements for accounting, purchasing, maintenance,
and general office business as well as specialized requirements for control
systems.
The two most common options are to design separate data
networking and telecommunication systems or to integrate the two into a common
infrastructure. For this Project, the proposed approach is integration.
Page 18-7
|
|
Rosemont Project |
| Form
43-101F1 Technical Report |
A voice over I/P (VoIP) phone system will be a part of the
office network and VoIP handsets will be used for voice communication.
The office ethernet network will support accounting, payroll,
maintenance, and other servers as well as individual user computers. High
bandwidth routers and switches will be used to logically segment the system and
to provide the ability to monitor and control traffic over the network.
The control system ethernet network will support the screen,
historian, and alarm servers and connect to the Control Room computers as well
as the Programmable Logic Controllers and other control systems provided with
ethernet communication capabilities. This system will incorporate redundancy and
will be designed to minimize traffic and latencies. No phone or user computer
will be connected to this system.
A security system will also be incorporated into the plant
network. Using a dedicated video server and monitors, I/P cameras utilizing
power over ethernet connections will be plugged into dedicated switches.
Security cameras are typically located in storerooms, parking lots, visitor
lobbies, warehouses, and areas where sensitive materials are kept.
Mobile radios will also be used by the mine and plant operation
personnel for daily control and communications while outside the offices.
Page 18-8
|
|
Rosemont Project |
| Form
43-101F1 Technical Report |
19
MARKET STUDIES AND CONTRACTS
Hudbay has a marketing division that is responsible for
establishing and maintaining all marketing and sales administrations of
concentrates and metals. The Project’s copper concentrates are expected to be a
clean, high grade concentrate containing small gold and silver by-product
credits which will be suitable as a feedstock for smelters globally.
Approximately 50% of the copper concentrate production has been contracted under
long term sales contracts.
Table 19-1 below summarizes the key assumptions for the sale of
Rosemont’s copper concentrate.
TABLE 19-1: COPPER CONCENTRATE
|
|
Units
|
LOM Total /
Average |
|
Copper Concentrate Base Treatment Charge |
$ / dry short ton con |
$73 |
|
Copper Refining Charge |
$ / lb Cu |
$0.08 |
|
Silver Refining Charge |
$ / oz Ag |
$0.50 |
|
|
|
|
|
Copper Concentrate Transport & Freight |
$ / wet short ton con |
$127 |
|
LOM Copper Grade in Copper Concentrate |
% Total Cu |
34.3% |
|
Moisture Content of Copper Concentrate |
% H2O |
8.0% |
No deleterious elements are expected to be produced in
quantities which would result in material selling penalties.
A precious metals stream agreement with Silver Wheaton
Corporation for 100% of payable gold and silver from the Project was entered
into on February 11, 2010. Under the agreement, Hudbay will receive payments
equal to the lesser of the market price and $450 per ounce for gold and $3.90
per ounce for silver, subject to 1% annual escalation after three years.
Rosemont is expected to produce a marketable 45% molybdenum
concentrate. Table 19-2 summarizes the key assumptions for the sale of
Rosemont’s molybdenum concentrate.
TABLE 19-2: MOLYBDENUM CONCENTRATE
|
|
Units
|
LOM Total /
Average |
|
Molybdenum Concentrate Base Treatment Charge |
$ / lb Mo |
$1.50 |
|
Molybdenum Concentrate Transport & Freight |
$ / wet short ton con |
$124 |
|
LOM Molybdenum Grade in Molybdenum Concentrate |
% Mo |
45.0% |
|
Moisture Content of Molybdenum Concentrate |
% H2O |
8.0% |
Page 19-1
|
|
Rosemont Project |
| Form
43-101F1 Technical Report |
20 ENVIRONMENTAL
STUDIES, PERMITTING, AND
SOCIAL
OR COMMUNITY IMPACT
The Project permitting status is well advanced and continues to
progress since July 2007. The final approvals required include the Final Record
of Decision (“ROD”) from the U.S. Forest Service (“USFS”) and the 404 Permit
from the U.S. Army Corps of Engineers (“USACE”). There have been over 450 days
of public comment associated with this Project that have culminated in over
43,500 comments. All comments have been reviewed, categorized, and either
incorporated or answered by the various State and Federal agencies.
Since issuing the Final Environmental Impact Statement
(“FEIS”), the USFS has issued two Supplemental Information Reports (“SIR”) and a
Supplemental Biological Assessment (“SBA”), both of which were required after
the Draft ROD was issued in December 2013. The SIRs considered whether new
information or changed circumstances remained within the scope of the effects
disclosed in the FEIS. The second SIR was issued to summarize on-going analysis
and reporting completed since the first SIR was produced in 2015. Nothing
disclosed to date would indicate that the information in either SIR falls
outside the effects considered in the FEIS, which would require the FEIS to be
supplemented.
The SBA evaluated the sighting of a jaguar and ocelot and
resulted in the reinitiation of consultation with the U.S. Fish and Wildlife
Service (“USFWS”). This consultation process included species such as the
ocelot, the yellow-billed cuckoo, the Mexican garter snake, and other aquatic
species. The reinitiated consultation was completed in April 2016 and culminated
in an Amended Final Reinitiated Biological and Conference Opinion (“BO”) similar
to the one produced in 2013. Both BO’s stated that the Project would not
jeopardize the existence of any endangered species. The next step will be to
issue a Final ROD. The Final ROD will trigger a requirement for an updated
operating plan ( MPO) that will include measures to be taken so the Project will
meet the requirements of the ROD, including measures to mitigate adverse
environmental impacts.
The USACE Division Offices are evaluating the 404 permit
application, the record, and the mitigation package that will go into making
their permit decision. The mitigation package is designed to mitigate impacts to
a total of 68.8 acres, which consists of 40.4 acres of ephemeral channels on the
Project site plus the 28.4 acres of off-site indirect impacts. This mitigation
incorporates the restoration of a floodplain that was impacted by agriculture;
mitigation for two sites impacts by grazing, poor roadway maintenance, and other
activities; as well as preservation of sites near to the Project site. Once the
USACE evaluation is complete, and a positive permit decision is made, the terms
and conditions of the permit and appropriate financial assurance will be
negotiated.
At this time, State of Arizona environmental permits and
approvals have been issued for the Project, and these permits remain in force
and are current. Two of the permits (air and groundwater protection) will need
to be amended to match the applicable Federal permits. The Project continues to
comply with these current State permit terms and conditions.
Page 20-1
|
|
Rosemont Project |
| Form
43-101F1 Technical Report |
As stated above, the Project details included in this document
were specifically designed and evaluated to fall within the permit constraints
included in the EIS and State of Arizona permits with amendments. This Technical
Report includes refinements of certain aspects of the Project’s mine plan. While
consistency with issued and pending environmental permits and analysis related
thereto has always been a key requirement for this effort, updates to the
original mine plan will be necessary. To the extent that any regulatory agency
concludes that the current plan requires additional environmental analysis or
modification of an existing permit, the intent will be to work with that agency
to either complete the required process or to adjust the current mine plan as
necessary.
Certain permits issued for the site have specific design and
monitoring requirements built into the permits. In particular, the Project meets
(and in some design elements exceeds) the Arizona Department of Environmental
Quality (ADEQ) Best Available Demonstrate Control Technology (BADCT)
requirements. BADCT covers specific requirements for any “discharging facility”
and includes items such as specific liner requirements for ponds, design
requirements for WRSA and DSTF including seismic design requirements as well as
geochemical characterization requirements for possible discharges. In addition,
the aquifer protection permit (APP) issued by ADEQ has specific groundwater
monitoring requirements that requires quarterly monitoring for various
parameters in specific wells.
The USFS has incorporated the permit requirements required by
ADEQ, as well as other agencies, into their Mitigation Measures listed in the
FEIS (Appendix B of the FEIS). FEIS mitigation measures also cover mitigation
measures requirements to cover areas of interest/concern to the USFS. These
requirements will be incorporated into the Final ROD and into the updated MPO.
Mitigation Measures in the FEIS include categories such as:
- Geology, Minerals, and Paleontology
- Soils and Revegetation
- Groundwater Quality and Quantity
- Surface Water Quantity and Quality
- Seeps, Springs, and Riparian
- Geology, Minerals, and Paleontology
- Biological Resources
- Landownership and Boundary Management
- Dark Skies
- Visual Resources
- Recreation and Wilderness
- Hazardous Materials
- Transportation/Access
- Noise
- Public Health and Safety
- Cultural Resources
- Air Quality and Climate Change
- Fire and Fuels
Page 20-2
|
|
Rosemont Project |
| Form
43-101F1 Technical Report |
- Power Use
- Community Programs
Certain permits issued require financial assurance to ensure
the success of mitigation, while others are solely to ensure that adequate funds
are available at closure. The requisite bonds for the Project are expected to be
obtained from the surety market with an estimated annual bond fee of 2% of the
bond’s notional value.
Currently the Project has bonds in place to cover $40,000 in
surface reclamation costs for the Arizona State Mine Inspector (AMSI), and
$4,300,000 for the ADEQ APP permit specifically for closure of discharging
facilities. It is expected that the bond for ADEQ will be reduced once the
permit amendment is completed. Additionally, the reclamation bond with ASMI is
expected to be incorporated into the USFS bonding.
In addition, a USFS bond will be required to cover reclamation
and closure costs and will be updated in 3-year increments throughout the life
of the Project. The required bonding for the initial 3-year period will be
negotiated with the USFS during their review of the MPO. Hudbay has estimated
and included fees for a $65 million USFS bond through construction and
operations with some curtailment in the final four years of operations as
certain reclamation activities are completed. Although the final amount of the
USFS bond remains to be negotiated, the notional bond value is not expected to
differ materially from this estimate.
The USACE bond will be a performance bond with a long-term
management component to ensure the mitigation proposed is successful. The
overall USACE bonding has been estimated at approximately $50 million; however,
this bond package will need to be negotiated and the estimate includes items
that may be eliminated in the final negotiation. Initial bond amounts have been
estimated at $35 million with $15 million long-term bonding added during the
first ten years of operation. The USACE bond is not expected to be required
after the tenth year of operations.
It is also expected that the bond for ADEQ will be reduced once
the permit amendment is completed. Additionally, the reclamation bond with ASMI,
currently at $40,000, is expected to increase to $4 million once mine
construction commences. However, Hudbay expects the requirements related to this
bond to be covered by the USFS bonding pending future negotiation with ASMI and
USFS. At this time, Hudbay has assumed that a $4M ASMI bond will stay in place
during the construction and operation of the mine.
With regard to community outreach and other social commitments,
the following provides a summary of costs associated with those items:
- $650,000 for the relocation of the Arizona Trail;
- $6,500,000 to $7,500,000 to repair the pavement, install bus pull outs,
and replace guard rails on a 12-mile stretch of State Route 83, the main
roadway connecting I-10 to the entrance road into the Project;
Page 20-3
|
|
Rosemont Project |
| Form
43-101F1 Technical Report |
- $25 million endowment fund for conservation purposes. The development of
this endowment trust will fund priority community projects including
recreation, cultural, and environmental conservation projects. Currently
proposals under consideration by the Forest Service set annual funding of up
to $1.5 million depending on annual production and metal prices and is subject
to a cap of $25 million. By agreement, 10% of this endowment is available to
the Mescalero Apache tribe for grants for specific cultural and educational
projects.
- $500,000 in annual community donations.
In addition, there are specific mitigation and data recovery
obligations related to archaeological (cultural) sites associated with the
Project. These specific requirements are a culmination of negotiations between
the USFS and the Tribes with input from various state agencies, other
cooperators, and Hudbay.
Details on permit status and authorizations for current project
activities are included in Appendix A3-1.
20.1
Reclamation and Closure Plan
The Reclamation and Closure Plan is based on several key
components, referred herein as initiatives. These initiatives provide the
physical and philosophical foundation that will remain constant throughout the
operation of the facility. As related to this Plan, some of these initiatives
include:
- Beginning with the end in mind. The placement of materials in the various
storage areas is based on the final closure configuration. For example, the
overall out-slopes of the Landform will generally be 3.5H:1V (H: Horizontal,
V: Vertical) with inter-bench slopes at 3.0H:1V. The placement of waste rock
that comprises the outer shell of the Landform, i.e., the outer slopes of the
waste rock buttresses/berms, will incorporate setbacks to facilitate efficient
regrading to achieve the final design slopes.
- Constructing outer facility berms/buttresses. During the initial years of
mine development, waste rock from stripping operations will be preferentially
placed along portions of the outer footprint of the WRSA (berms) and the DSTF
(buttresses). In addition to defining the outer footprint, placement of these
outer berms/buttresses will be used to help screen active mining operations
from vantage points in the area, such as from SR 83, and will serve to isolate
mining activities and protect down-gradient surface water quality. Regarding
the DSTF area, an outer waste rock buttress will serve to stabilize the dry
tailings stacks and prevent the erosion of tailings into the down-gradient
drainages.
Page 20-4
|
|
Rosemont Project |
| Form
43-101F1 Technical Report |
- Concurrently reclaiming the outer surfaces of the WRSA and DSTF.
Reclamation of the Landform will not be deferred to the end of the Project.
Concurrent reclamation, as practicable, is planned for the outer shell
encompassing the WRSA and DSTF. Growth media (soil) and woody debris will be
salvaged from the facility footprints and placed directly on reclaimed areas
or stockpiled for future use. Reclamation of the outer shell of the Landform
also includes the construction of stormwater management features, such as
channels and drop structures, in order to divert as much stormwater
down-gradient as practicable. The final reclaimed surfaces will have a soil
(growth media) cover or a combination of rock/soil cover and will be
revegetated using a seed mixture appropriate for the Project area.
- Using modern technology to minimize the generation of impacted water. The
Rosemont operation will include milling operations for sulfide ores.
Conventional slurry line and settling pond technology for tailings disposal
will not be used at Rosemont. Tailings will instead be mechanically filtered
to 18% (or less) moisture content by weight and stacked behind a waste rock
buttress. The formation and migration of seepage from this tailings disposal
system is negligible. The dry stack tailings disposal method also facilitates
the ability to concurrently reclaim the facility as described above.
To the maximum extent practicable, the final landform is graded
to route as much stormwater runoff off the reclaimed surface and into the
down-gradient flow system. Bench channels and drop chutes are constructed on the
surface to direct stormwater down-gradient toward lower Barrel Canyon drainage.
Building facilities within the Plant Site are removed and the area regraded. The
Plant Site area will be also regraded with the intent to route as much
stormwater down-gradient as practicable – in this case to the McCleary Canyon
drainage which feeds the lower Barrel Canyon drainage. Reclaimed areas are
covered with growth media (soil salvaged from the facility footprints) and
revegetated.
The reclamation and closure of the Utility Corridor includes
the removal of facilities (such as the water and power lines and pump stations)
and the regrading and revegetation of disturbed areas.
Page 20-5
|
|
Rosemont Project |
| Form
43-101F1 Technical Report |
21
CAPITAL AND OPERATING COSTS
21.1
Introduction
Capital costs are estimated in constant 2016 US dollars.
21.2
Capital Costs
The total initial capital required to construct the processing
plant, purchase mining equipment and pre-strip the pit is estimated to be $1,921
million including 15% contingency on all items as shown in Table 21-1.
TABLE 21-1: INITIAL CAPITAL COST SUMMARY
|
Initial Capital |
000 US $ |
|
Site Wide |
42,433 |
|
Mining |
474,070 |
|
Process Plant |
670,525 |
|
Site Services and Utilities |
21,802 |
|
Internal Infrastructure |
127,300 |
|
External Infrastructure |
113,954 |
|
Common Construction Facilities |
50,914 |
|
EPCM Services |
107,009 |
|
Owner’s Cost |
312,895 |
|
Total Initial Capital |
1,920,903
|
The initial capital investment represents the total project
cost; including facility costs, infrastructure costs and Owner’s Costs. The
estimate is based on inputs from various organizations as follows:
- Ausenco: Process Plant
- Ausenco and M3: Plant Infrastructure
- Ausenco and M3: DSTF
- Knight Piésold: Engineering quantities relating to Heavy Civil Works
(“HCW”): geotechnical, haul roads, buttresses, WRSA and diversion channels
- Stantec: Water Infrastructure
- Tucson Electric Power: Power Infrastructure
- Hudbay: Owner’s Costs
The estimate was produced using Prism Project Estimator based
on a bottom-up approach. The overall capital cost estimate meets the Association
for Advancement of Cost Engineers (“AACE”) Class 3 requirement of an accuracy
range between -10% and +20% of the final project cost (excluding contingency).
It has a base date of end of March 2016 with no allowance for escalation. This
assessment is based on:
- Project maturity 10 – 40%
- Engineering progress on the processing plant was approximately 38%
complete
Page 21-1
|
|
Rosemont Project |
| Form
43-101F1 Technical Report |
• Engineering
progress on the off-site infrastructure was approximately 50% complete
Process plant costs were estimated by Ausenco with input from
various consulting firms including Knight Piésold. Construction labor rates and
productivities were developed on a discipline by discipline basis with input
from major industrial contractors in the Southwest U.S. Labor rates, supply
rates and productivities were benchmarked against projects of similar size and
scope.
External infrastructure for the water supply system was
designed and estimated by Stantec. External infrastructure for the power supply
was designed and estimated by costs were provided by Tucson Electric Power.
Direct cost estimate quantities were derived from engineering
lists, material take-offs, consultant databases (previous projects) and vendor
input as shown in the table below:
|
Description |
WBS |
Earthworks |
Concrete |
Structural |
Platework |
Piping |
E & I |
|
Geology and Mine Design /Mining
(infrastructure only) |
1000+2000 |
Preliminary Design |
Preliminary Design |
Preliminary Design |
Preliminary Design |
Factor |
Factor |
|
Process Plant |
3000 |
Preliminary Design
|
Preliminary Design
|
Preliminary Design
|
Preliminary Design
|
Preliminary Design
and Previous Project |
Preliminary Design
|
|
Primary Crusher |
3110 |
|
Stockpile Feed Conveyor |
3120 |
Vendor |
Vendor |
|
Stockpile and Reclaim |
3210 |
Preliminary Design
|
Preliminary Design
|
|
Grinding |
3220 |
|
Pebble Crushing |
3230 |
Previous Project |
|
Pebble Crushing Conveying |
3240 |
Vendor |
Vendor |
|
Copper Flotation |
3250 |
Preliminary Design
|
Preliminary Design
|
|
Copper Regrind |
3260 |
|
Copper Concentrate Thickening |
3270 |
|
Copper Concentrate Filtration and Loadout |
3280 |
|
Tailings Thickening |
3290 |
|
Molybdenum Plant |
3300 |
Previous Project |
Preliminary Design and Previous
Project |
Previous Project |
| Preliminary Design
|
Preliminary Design
|
Preliminary Design
|
|
Reagents |
3400 |
|
Plant Services |
3500 |
Previous Project |
| Preliminary Design
|
|
Tailings Filter Plant |
3600 |
|
Site Services and Utilities |
4000 |
Preliminary Design and Previous
Project |
Previous Project |
|
Site Stormwater Ponds |
4100 |
Preliminary |
N/A |
Page 21-2
|
|
Rosemont Project |
| Form
43-101F1 Technical Report |
|
Description |
WBS |
Earthworks |
Concrete |
Structural |
Platework |
Piping |
E & I |
|
Plant Fuel Storage and Distribution |
4200 |
|
Design |
N/A |
|
|
|
|
Sewerage and Waste Management |
4300 |
Factor |
|
Communications and IT |
4400 |
N/A |
N/A |
N/A |
|
Site Infrastructure |
5000 |
Preliminary
Design |
Preliminary
Design |
Preliminary
Design |
|
Tailings Management |
5500 |
N/A |
Vendor |
Vendor |
Vendor |
Vendor |
|
External Infrastructure |
6000 |
Preliminary
Design |
Preliminary
Design |
N/A |
Preliminary
Design |
Preliminary
Design |
Project indirect costs were developed based on construction
sequencing plans and quotes for EPCM service providers. Owner’s Costs were
developed by Rosemont Copper based on quoted equipment costs, third-party
technical experts and in-house estimates.
A contingency component of $251M or 15% is included in the
initial capital cost. No contingency is included in sustaining capital. All sunk
costs are excluded from the capital cost estimates.
The estimate was reviewed against Constancia’s actual costs by
the Hudbay project team. An independent review of the capital cost estimate was
performed by M3 Engineering and Technology; who has experience with mining
projects in the US and benchmarked the estimate against other local projects of
similar size.
The LOM sustaining capital costs are estimated to be $387
million excluding capitalized stripping and $1,168 million including capitalized
stripping. Sustaining capital costs associated with mining include new mine
equipment purchases and major rebuilds, ongoing haul road construction and
expansions to the truck shop and heavy truck fuel facility. Sustaining capital
for the processing plant includes three tailings stacking expansions, upgrades
to the regrind mill, and the installation of a SHMP mixing facility. Sustaining
capital also includes the installation of buttress drop structures.
TABLE 21-2: SUSTAINING CAPITAL
|
Sustaining Capital |
000 $
|
|
Mining – Equipment and Rebuilds |
138,898 |
|
Mining – Equipment Major Repair |
170,123 |
|
Mining – Heavy Civil Works |
19,540 |
|
Mining – Facilities |
6,445 |
|
Plant – Tailing Stacking Expansions |
23,855 |
|
Plant – Upgrades |
3,417 |
|
Plant – Ramp-up Support |
4,970 |
|
Buttress Drop Structures |
12,515 |
|
Light Vehicles & Misc |
7,100 |
|
Total Sustaining Capital |
|
|
(Excluding Capitalized Stripping) |
386,865
|
|
|
|
|
Capitalized Stripping |
780,897 |
|
Total Sustaining Capital Expenditures
(Including Capitalized Stripping) |
1,167,762
|
Page 21-3
|
|
Rosemont Project |
| Form
43-101F1 Technical Report |
21.3
Operating Costs
Operating costs were developed by Hudbay based on a bottom-up
approach and utilizing budget quotes from local suppliers, Arizona operations
experience, and labor costs within the region. Site visits were conducted to
other facilities currently utilizing dry stack technology to better understand
the operations and maintenance requirements. Mining operating costs were
validated against actual costs at Constancia.
The total LOM operating costs, including off-site costs
(transport, TCRCs, etc.) are estimated at $12.34/ton milled (before deducting
capitalized stripping) and $11.02/ton milled (after deducting capitalized
stripping) as shown in Table 21-3. The mining costs below do not include
pre-stripping costs as these are included in the development capital cost.
TABLE 21-3: OPERATING COST SUMMARY
|
|
Before Deducting Capitalized
Stripping
|
After Deducting Capitalized
Stripping
|
Unit Cost
($/ton
milled) |
Annual Average
19 Year LOM
(000 $) |
Unit Cost
($/ton
milled) |
Annual Average
19 Year LOM
(000 $) |
|
Mining ($/ton moved) |
$1.08 |
$101,997 |
$0.64 |
$60,897 |
|
|
|
|
|
|
|
Mining |
$3.27 |
$101,997 |
$1.95 |
$60,897 |
|
Processing |
$4.71 |
$146,723 |
$4.71 |
$146,723 |
|
G&A, Other |
$1.26 |
$39,245 |
$1.26 |
$39,245 |
|
Total Mine / Mill / G&A |
$9.24 |
$287,965 |
$7.92 |
$246,865 |
|
|
|
|
|
|
|
Off-Site Costs |
$3.10 |
$96,993 |
$3.10 |
$96,993 |
|
|
|
|
|
|
|
Total |
$12.34 |
$384,958 |
$11.02 |
$343,858 |
Reclamation costs of approximately $25M (which are incurred
over the 19 year LOM) and closure costs of approximately $9M are included in
operating G&A costs.
The total C1 cash costs and sustaining cash costs (net of
by-product credits at stream prices) over the LOM and over the first 10 years
are shown in Table 21-4. C1 cash costs include mining, milling, G&A and
offsite costs. Sustaining cash costs include C1 costs plus royalties and
sustaining capital.
TABLE 21-4: CASH COSTS (NET OF BY-PRODUCT CREDITS AT STREAM
PRICES)
Cash Costs
(Net of
By-Product Credits at Stream Prices) |
Units |
Before
Deducting
Capitalized
Stripping |
After
Deducting
Capitalized
Stripping |
| Years 1-10 Average C1 Cash Costs |
$ / lb Cu in con |
$1.40 |
$1.14 |
| Years 1-10 Average C1 Cash Costs + Royalties
+ Sustaining Capex |
$ / lb Cu in con |
$1.59 |
$1.59 |
| LOM C1 Cash Costs |
$ / lb Cu in con |
$1.47 |
$1.29 |
| LOM C1 Cash Costs + Royalties + Sustaining
Capex |
$ / lb Cu in con |
$1.65 |
$1.65 |
Page 21-4
|
|
Rosemont Project |
| Form
43-101F1 Technical Report |
21.4
Working Capital Costs
Working capital for accounts receivable and accounts payable
will vary over the mine life based on revenue, operating costs and capital
costs. The working capital estimate is based on 33% of revenue as accounts
receivable and 33% of cost of goods sold and capital costs as accounts payable
in a given quarter. This is equivalent to an approximate 30-day delay in
converting revenue to cash and an approximate 30-day delay in paying cash for
capital and operating costs. All of the working capital is assumed to be
recaptured by the end of the mine life and the closing value of the account is
zero.
Page 21-5
|
|
Rosemont Project |
| Form
43-101F1 Technical Report |
22 ECONOMIC
ANALYSIS
22.1
Key Model Assumptions
All figures in the economic analysis are shown on an unlevered
100% Project basis (except where indicated in Section 22.5) and include the
impact of the existing precious metals stream with Silver Wheaton.
22.1.1
Metal Prices
The economic viability of the Project has been evaluated using
the metal prices outlined in Table 22-1. The metal prices used in the economic
analysis are based on a blend of consensus metal price forecasts from over 30
well known financial institutions and Wood Mackenzie.
TABLE 22-1: METAL PRICE ASSUMPTIONS
|
Metal |
Unit |
Price |
|
Spot Copper |
$/lb |
$3.00 |
|
Spot Molybdenum |
$/lb |
$11.00 |
|
Spot Silver |
$/oz |
$18.00 |
|
Streamed Silver1 |
$/oz |
$3.90 |
1. Subject to a 1% annual inflation
adjustment
The terms of the existing precious metals streaming agreement
with Silver Wheaton were included in the analysis. Silver Wheaton will make
upfront cash payments totaling $230 million to fund initial development capital
in exchange for 100% of the silver and gold production from Rosemont. Silver
Wheaton will make ongoing payments of $3.90 per ounce of silver and $450 per
ounce of gold subject to a 1% inflation adjustment starting on the third
anniversary of production.
Although gold is not part of the current reserve estimate,
metallurgical testing has demonstrated economic concentrations of gold in copper
concentrate as outlined in Section 13. Over the LOM, approximately 309 thousand
ounces of gold are expected to be recovered in copper concentrate (although the
financial impact has not been included).
At the effective realized prices including the impact of the
stream, the revenue breakdown at Rosemont is approximately 92% copper, 6%
molybdenum, and 2% silver.
22.1.2
Life of Mine Model Summary
The key mine and mill operating assumptions used in the cash flow
model are outlined in Table 22-2.
Page 22-1
|
|
Rosemont Project |
| Form
43-101F1 Technical Report |
TABLE 22-2: MINE AND MILL OPERATING ASSUMPTIONS USED IN THE
FINANCIAL MODEL (100% PROJECT BASIS)
|
|
Units |
LOM Total /
Average |
|
Mine Plan |
|
|
|
Ore Mined
Waste Mined (Excluding Pre-Strip)1 |
M short ton
M
short ton |
592
1,155 |
|
Strip Ratio (Excluding Pre-Strip)1
Total
Copper Grade Milled |
Waste/Ore
%
TCu |
2.0
0.45% |
|
Sulfide Copper Grade Milled |
% Sulfide Cu |
0.40% |
|
Molybdenum Grade Milled |
% Mo |
0.012% |
|
Silver Grade Milled |
oz/short ton Ag |
0.133 |
|
LOM Metallurgical Recoveries |
|
|
|
Sulfide Copper Recovery |
% Sulfide Cu |
90.0% |
|
Effective Total Copper Recovery
Molybdenum Recovery |
% TCu
% Mo |
80.4%
53.4% |
|
Silver Recovery |
% Ag |
74.4% |
|
LOM Concentrate Specifications |
|
|
|
Copper Grade in Copper Concentrate
Molybdenum Grade in
Molybdenum Concentrate |
% TCu
% Mo |
34.3%
45.0% |
|
Moisture Content of Copper & Molybdenum Concentrates |
% H2O |
8.0% |
|
Production & Mill Throughput |
|
|
|
Design Mill Throughput |
k short ton / day |
90 |
|
Mine Life (Including Processed Stockpiles)
Years 1-10
Average Annual Copper Production |
Years
k short
ton Cu in con |
19
140 |
|
LOM Average Annual Copper Production
LOM Average Annual
Molybdenum Production |
k short ton Cu in
con
k short ton Mo in con |
112
2.0 |
|
LOM Average Annual Silver Production |
k oz Ag in con |
3,095 |
1. Pre-stripping costs included as part of the development
capital costs
Key capital and operating cost assumptions used in the cash
flow model are outlined in Table 22-3.
Page 22-2
|
|
Rosemont Project |
| Form
43-101F1 Technical Report |
TABLE 22-3: CAPITAL AND OPERATING COST ASSUMPTIONS USED IN
THE FINANCIAL MODEL (100% PROJECT BASIS)
|
|
Units
|
LOM Total /
Average |
|
Capital Costs |
|
|
|
Development Capital (Including Pre-Strip) 1 |
$M |
$1,921 |
|
Development Capital Less Upfront Stream Proceeds |
$M |
$1,691 |
|
LOM Sustaining Capital (Excluding Capitalized Stripping)
|
$M |
$387 |
|
Capitalized Stripping |
$M |
$781 |
|
LOM Sustaining Capital (Including Capitalized Stripping)
|
$M |
$1,168 |
|
Onsite Operating Costs
(Before Deducting
Capitalized Stripping) |
|
|
|
Mining (Before Deducting of Capitalized Stripping) |
$ / short ton moved |
$1.08 |
|
Mining (Before Deducting of Capitalized Stripping) |
$ / short ton milled |
$3.27 |
|
Milling |
$ / short ton milled |
$4.71 |
|
On-Site G&A2 |
$ / short ton milled |
$1.26 |
|
Total Onsite Operating Costs |
$ / short ton milled |
$9.24 |
|
Onsite Operating Costs
(After Deducting
Capitalized Stripping) |
|
|
|
Mining (After Deducting Capitalized Stripping) |
$ / short ton moved |
$0.64 |
|
Mining (After Deducting Capitalized Stripping) |
$ / short ton milled |
$1.95 |
|
Milling |
$ / short ton milled |
$4.71 |
|
On-Site G&A2 |
$ / short ton milled |
$1.26 |
|
Total Onsite Operating Costs |
$ / short ton milled |
$7.92 |
|
Offsite Operating Costs |
|
|
|
Copper Concentrate Base Treatment Charge |
$ / dry short ton con |
$73 |
|
Copper Refining Charge |
$ / lb Cu |
$0.08 |
|
Silver Refining Charge |
$ / oz Ag |
$0.50 |
|
Copper Concentrate Transport & Freight |
$ / wet short ton con |
$127 |
|
Molybdenum Concentrate Base Treatment Charge |
$ / lb Mo |
$1.50 |
|
Molybdenum Concentrate Transport & Freight |
$ / wet short ton con |
$124 |
|
Cash Costs (Net of By-Product Credits at Stream
Prices)
Before Deducting Capitalized Stripping |
|
|
|
Years 1-10 Average C1 Cash Costs |
$ / lb Cu in con |
$1.40 |
|
Years 1-10 Average C1 Cash Costs + Royalties + Sustaining
Capex |
$ / lb Cu in con |
$1.59 |
|
LOM C1 Cash Costs |
$ / lb Cu in con |
$1.47 |
|
LOM C1 Cash Costs + Royalties + Sustaining Capex |
$ / lb Cu in con |
$1.65 |
|
Cash Costs (Net of By-Product Credits at Stream
Prices)
After Deducting Capitalized Stripping |
|
|
|
Years 1-10 Average C1 Cash Costs |
$ / lb Cu in con |
$1.14 |
|
Years 1-10 Average C1 Cash Costs + Royalties + Sustaining
Capex |
$ / lb Cu in con |
$1.59 |
|
LOM C1 Cash Costs |
$ / lb Cu in con |
$1.29 |
|
LOM C1 Cash Costs + Royalties + Sustaining Capex |
$ / lb Cu in con |
$1.65
|
| 1. |
15% contingency is included. |
| 2. |
G&A also includes property tax, reclamation and
closure costs. |
Page 22-3
|
|
Rosemont Project |
| Form
43-101F1 Technical Report |
Rosemont’s annual copper production (contained copper in
concentrate) and C1 cash costs (net of by-products at stream prices after
deducting capitalized stripping) are shown below in Figure 22-1. Over the first
10 years, annual production is expected to average 140 thousand tons of copper
at an average C1 cash cost of $1.14/lb. Over the 19 year LOM, annual production
is expected to average 112 thousand tons of copper at an average C1 cash cost of
$1.29/lb.
FIGURE 22-1: ROSEMONT ANNUAL COPPER PRODUCTION AND C1 CASH
COSTS
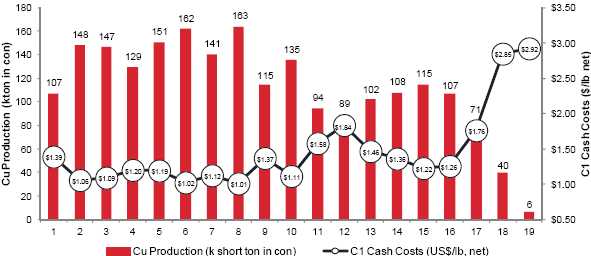
22.1.3
Taxes and Royalties
22.1.3.1 Applicable Tax Rates
The Project will be subject to a federal income tax rate of 35%
(effectively reduced to 32% by the Section 199 deduction, a manufacturing and
production credit available in the U.S.) and an alternative federal minimum tax
rate of 20% (effectively reduced to 17% by the Section 199 deduction). A state
income tax rate of 4.9% is also applicable to the Project. The amount of state
tax payable in a given period reduces the amount of taxable income that is
subject to federal income tax.
A depletion allowance of 15% has been utilized to reduce
taxable income. It is determined as a percentage of gross income from the
property, not to exceed 50% of taxable income before the depletion deduction.
The gross income from the property is defined as metal revenue less downstream
costs (smelting, refining and transportation). Taxable income is defined as
gross income minus operating expenses, overhead expenses, depreciation and state
taxes.
A 2.5% severance tax is imposed in Arizona in lieu of sales tax
on mining minerals. The net severance base is 50% of the difference between
gross value of production and the production cost. The amount of tax is
calculated by multiplying the net severance base by 2.5% . Severance tax is
considered an income tax and is included in cash income taxes.
Page 22-4
|
|
Rosemont Project |
| Form
43-101F1 Technical Report |
Rosemont has accrued approximately $123 million in net
operating losses and approximately $333 million in depreciable capital that can
be used to offset future income taxes.
The combined effective tax rate (excluding property tax which
is included as part of G&A costs) varies in any given year but amounts to
approximately 37% of taxable income over the life of mine.
22.1.4
Depreciation
Tax depreciation was applied to the development capital costs
depending on the classification of capital as detailed in Table 22-4. 70% of the
development capital associated with the pre-strip is expensed in the year it
occurs and the remaining 30% is depreciated on a 5-year straight line basis.
TABLE 22-4: TAX DEPRECIATION FOR DEVELOPMENT CAPITAL
|
|
Development Capital
(Excluding
Infrastructure &
Pre-Strip) |
Pre-Strip
Development
Capital |
Infrastructure
Development
Capital |
|
Year 1 |
10.71% |
20.00% |
5.00% |
|
Year 2 |
19.13% |
20.00% |
9.50% |
|
Year 3 |
15.03% |
20.00% |
8.55% |
|
Year 4 |
12.25% |
20.00% |
7.70% |
|
Year 5 |
12.25% |
20.00% |
6.93% |
|
Year 6 |
12.25% |
- |
6.23% |
|
Year 7 |
12.25% |
- |
5.90% |
|
Year 8 |
6.13% |
- |
5.90% |
|
Year 9 |
- |
- |
5.91% |
|
Year 10 |
- |
- |
5.90% |
|
Year 11 |
- |
- |
5.91% |
|
Year 12 |
- |
- |
5.91% |
|
Year 13 |
- |
- |
5.90% |
|
Year 14 |
- |
- |
5.91% |
|
Year 15 |
- |
- |
5.90% |
|
Year 16 |
- |
- |
2.95% |
|
Total |
100% |
100% |
100% |
Sustaining capital was depreciated on 7-year straight-line
basis for tax purposes (14.29% annually).
22.1.4.1 Royalties
A 3% NSR royalty exists on the Project and is included in the
economic analysis.
22.2
Annual Cash Flow Model
A summary of the annual cash flow model is outlined in Table
22-5.
Page 22-5
|
|
Rosemont Project |
| Form
43-101F1 Technical Report |
TABLE 22-5: ANNUAL CASH FLOW MODEL
Page 22-6
|
|
Rosemont Project |
| Form
43-101F1 Technical Report |
Page 22-7
|
|
Rosemont Project |
| Form
43-101F1 Technical Report |
Page 22-8
|
|
Rosemont Project |
| Form
43-101F1 Technical Report |
Page 22-9
|
|
Rosemont Project |
| Form
43-101F1 Technical Report |
22.3
Financial Analysis (100% Project Basis)
Rosemont (on a 100% basis) has an unlevered after-tax NPV8% of
$769 million and a 15.5% after-tax IRR at a copper price of $3.00/lb as
summarized in Table 22-6. The Project NPV and IRR are calculated using end of
period quarterly discounting in the quarter before initial development capital
is spent.
TABLE 22-6: LIFE OF MINE FINANCIAL METRICS (100% PROJECT
BASIS)
|
|
Units |
LOM Total |
|
Gross Revenue (Stream Prices) |
$M |
$13,377 |
|
TCRCs |
$M |
($1,837) |
|
On-Site Operating Costs
(after deducting capitalized
stripping) |
$M |
($4,691) |
|
Royalties |
$M |
($368) |
|
Operating Margin |
$M |
$6,480
|
|
Development Capital |
$M |
($1,921) |
|
Stream Upfront Payment |
$M |
$230 |
|
Sustaining Capital (excludes capitalized stripping) |
$M |
($387) |
|
Capitalized Stripping |
$M |
($781) |
|
Pre-Tax Cash Flow |
$M |
$3,622
|
|
Cash Income Taxes |
$M |
($718) |
|
After-Tax Free Cash Flow |
$M |
$2,903
|
|
After-Tax NPV8% |
$M |
$769 |
|
After-Tax NPV10% |
$M |
$496 |
|
After-Tax IRR |
% |
15.5% |
|
After-Tax Payback Period |
Years |
5.2
|
22.4
Sensitivity Analysis (100% Project
Basis)
The NPV8% (100% Project basis) was sensitized based on
percentage changes in various input assumptions above or below the base case.
Each input assumption change was assumed to occur independently from changes in
other inputs. The sensitivity analysis is summarized in Figure 22-2. The Project
is most sensitive to the copper price followed by initial capital costs, on-site
operating costs, and the molybdenum price.
Page 22-10
|
|
Rosemont Project |
| Form
43-101F1 Technical Report |
FIGURE 22-2: NPV8% SENSITIVITY (100% BASIS)
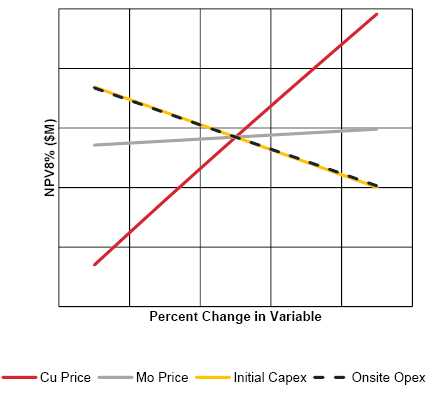
Table 22-7 below reports the after-tax NPV8%, NPV10%, IRR and
payback of the Project (on a 100% basis) at various flat copper prices assuming
all other inputs remain constant.
TABLE 22-7: AFTER-TAX NPV8%, NPV10% AND IRR SENSITIVITY AT
VARIOUS FLAT COPPER PRICES (100% BASIS)
|
|
Flat Copper Price ($/lb) |
|
|
$2.50 |
$2.75 |
$3.00 |
$3.25 |
$3.50 |
|
After-Tax NPV8% ($M) |
$45 |
$412 |
$769 |
$1,115 |
$1,448 |
|
After-Tax NPV10% ($M) |
($122) |
$192 |
$496 |
$792 |
$1,076 |
|
After-Tax IRR (%) |
8.5% |
12.2% |
15.5% |
18.5% |
21.2% |
|
After-Tax Payback (years) |
6.9 |
5.9 |
5.2 |
4.4 |
4.3 |
22.5
Project Ownership Impact on Valuation
The existing Joint Venture Agreement requires cash payments
from UCM totaling $106 million to the JV in order for UCM to complete its
earn-in for 20% ownership of the Project. The payments will be made on an
installment basis to fund the initial development capital, and payments will
commence once certain milestones are achieved. The NPV attributable to Hudbay is
improved beyond 80% of the standalone Project NPV due to the JV payments, and
the IRR attributable to Hudbay is improved beyond the standalone Project IRR as
a result of the reduced time period between development capital spending and positive Project cash flow. Table 22-8
shows the adjusted key financial metrics attributable to Hudbay.
Page 22-11
|
|
Rosemont Project |
| Form
43-101F1 Technical Report |
TABLE 22-8: KEY FINANCIAL METRICS ATTRIBUTABLE TO
HUDBAY
|
|
Units |
LOM Total |
|
Development Capital (100% Basis) |
$M |
$1,921 |
|
Stream Upfront Payment |
$M |
($230) |
|
Joint Venture Earn-in Payment |
$M |
($106) |
|
JV Share of Remaining Capital (20%) |
$M |
($317) |
|
JV Loan Repayment to Hudbay1 |
$M |
($20) |
|
Hudbay's Share of Development Capital |
$M |
$1,248 |
|
After-Tax NPV8% to Hudbay |
$M |
$719 |
|
After-Tax NPV10% to Hudbay |
$M |
$499 |
|
After-Tax IRR to Hudbay |
% |
17.7% |
|
After-Tax Payback Period to Hudbay |
Years |
4.9 |
1. Hudbay is funding the JV’s share of project expenditures
until receipt of material permits and approximately $20M in principal and
accrued interest is due to Hudbay.
Page 22-12
|
|
Rosemont Project |
| Form
43-101F1 Technical Report |
23 ADJACENT
PROPERTIES
The author is not aware of any relevant work on properties
immediately adjacent to the Project.
Page 23-1
|
|
Rosemont Project |
| Form
43-101F1 Technical Report |
24 OTHER RELEVANT
DATA AND INFORMATION
A unpublished draft feasibility study was completed for the
Project which included information on the basis of design, infrastructure,
design strategies, Project Execution Strategy, risks assessments and
recommendations. The EPCM team has also completed a draft construction execution
plan.
24.1
Project Implementation
A draft project execution plan was delivered to Hudbay as part
of the draft DFS. The Project will be executed following a classical “EPCM”
(Engineering, Procurement and Construction Management) model, which is an
industry standard for projects of the magnitude and complexity of the Project.
Figure 24-1 describes the Project delivery strategy. The project execution
strategy will remain preliminary until the Project is funded and approved to
begin after which Hudbay’s Project Team will be developed, roles defined,
positions filled and strategies confirmed or modified.
Hudbay’s Project Technical Services is self-delivering the mine
development scope for the Project and Hudbay’s Project Team is responsible for
the offsite facilities and for the management of the specialist engineering and
consulting services providers. The EPCM services provider is responsible for the
process plant and related facilities, as well as for the overall project
construction management and Health Safety Environmental Community (“HSEC”).
FIGURE 24-1: OVERALL CONSTRUCTION MANAGEMENT & HSEC
(EPCM)
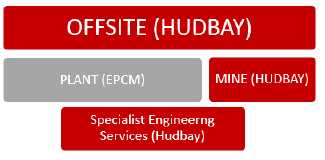
The general intent of Hudbay’s Project Team is to provide
managerial and technical resources to safely and responsibly manage and control
scope, cost, schedule and the quality of the work in the field. The Hudbay
Project Team has been assigned responsibility for the management of all aspects
of engineering, procurement and construction, with oversight in compliance from
the Arizona Business Unit leadership. All communications, coordination and
control of services providers and contractors are directed through Hudbay’s
Project Team.
The roles and responsibilities for the Hudbay’s Project
Management group are detailed below.
24.1.1
Project Director
The Project Director has the overall responsibility for meeting
the Owner’s requirements and completing the Project within budget and on
schedule.
Page 24-1
|
|
Rosemont Project |
| Form
43-101F1 Technical Report |
24.1.2
Area Managers
There are four Area Managers reporting to the Project Director
who are accountable for the Project Management of specific scope including:
24.1.3 F
unctional Managers
The Project Director and Area Managers are supported by
functional managers and teams in the areas of:
-
Project Services including cost control, administration and document
control
-
Project Planning and Scheduling
-
Commercial including Risk, Procurement and Contracts
-
Engineering
-
Systems Integration
-
Operational Readiness
24.1.4
Hudbay’s Rosemont Project Internal Stakeholders
Hudbay’s Project internal stakeholders include the Project
Services group, Business Development, Social Responsibility, Environmental,
Finance, Legal, Internal Audit and Technical Services Teams.
24.1.5
Project Sponsors Team
The purpose of the Sponsors team is to remove barriers to
success, provide guidance and direction and facilitate the alignment of the
integrated team, providing a culture driven to meet the project requirement and
to celebrate the project successes.
24.1.6
EPCM Services Provider
EPCM scope is principally the detail engineering of the Process
Plant and related facilities, from the dump pocket of the primary crusher to the
discharge of tailing conveying systems at the tailing management facility. The
scope also includes all water piping and pumping systems, as well as
infrastructure such as distribution power and communication. On the concentrate
side, the scope extends to the discharge of the concentrate filters, from which
point the concentrate will be loaded onto trucks using front-end loaders for
shipment.
Page 24-2
|
|
Rosemont Project |
| Form
43-101F1 Technical Report |
Procurement scope includes all of the major equipment packages
plus supply of major bulk commodities such as structural steel, pipe electrical
cable and cable ladder. These will be free-issued to the Contractors for
installation. Contract packages prepared by EPCM service provider will detail
the scope of construction work by package, as well as applicable interfaces and
battery limits including responsibility for traffic and logistics, receipt,
storage and issue of provided materials and equipment.
The EPCM service provider has responsibility for construction
management for the overall Project. Other service providers will provide
services in general support of the CM effort. An example is a specialty civil
engineering firm who will provide field quality assurance services for Heavy
Civil Works (“HCW”) projects.
Through the process of advancing the Project to its current
state, the EPCM scope also includes bringing in management systems and oversight
to ensure delivery of a project that meets Project business objectives and
commitments. During the course of the work, Hudbay’s Project Team will monitor
and manage EPCM’s performance in this respect.
24.1.7
Project Execution Plan
Various plans have been preliminarily developed to be included
in the overall Project Execution Plan such as:
-
Project Delivery Strategy
-
Health, Safety, Environmental and Community Plans – to include
implementation of systems, orientations, security, badging, transportation,
emergency response, solid waste removal, compliance inspections, site specific
programs, drug/alcohol testing,
-
Construction Management Environmental Plan – The plan is based on
compliance with the Arizona Business Unit’s Environmental Plan and details
implementation of management systems.
-
Engineering Execution Plan – Details strategy, processes and standards for
delivery of the Engineering deliverables to ensure HSEC, schedule, cost and
quality objectives.
-
Procurement Management Plan – The main objective is to purchase the
equipment and bulk materials required for the Project and manage risks. It
will detail out sole source tender procedures, bidding, supplier relations and
supply chain management, packaging plan, bulks, and procurement management
software. Included in this plan is a sub-plan for materials and equipment
management.
-
Contracting Management Plan – The Contracting Strategy has been developed
considering the strengths of local Contractors and their ability to provide
skilled labor, engineered and bulk materials such as earthworks and concrete
and in some instances equipment such as concrete batch plants, as an example.
In general, horizontal packages favoring Contractor’s strengths have been
preferred over vertical packages where a single Contractor coordinates
the work of numerous subcontractors or self
performs work that is not a proven core capability.
Page 24-3
|
|
Rosemont Project |
| Form
43-101F1 Technical Report |
- Construction Execution Plan – The Construction Execution Plan is developed
to safely deliver a quality finished product in a cost effective and timely
manner. The Project will be carried out in accordance with EPCM and Hudbay’s
Rosemont Copper Construction Management and HSEC Management Policies to
maximise construction efficiency, do no harm to the health and safety of the
Project team and minimize impact on the environment and surrounding community.
24.2
Risk Assessments
The Project has undergone various risk assessments and
workshops during the years. These risk assessments were mainly isolated to
project specific scopes, therefore, facilitated and maintained by Hudbay’s
engineering consultant firms.
TABLE 24-1: RISK ASSESSMENTS
| Document |
Date |
Authoring Entity |
| Risk Model Workshop Results |
25 June 2015 |
M3/Amec |
| Project Risk Assessment from Geological Point
of View, Rev 1 |
16 July 2015 |
Knight Piésold |
| Hazard Identification Review Results |
3-4 Nov. 2015 |
Ausenco |
| Project Risk Register |
11 March 2016 |
Ausenco |
During June 2016, the Project team took ownership of the risk
assessment and conducted an internal facilitated workshop. The facilitator took
into consideration the previous assessments, interviews with Hudbay personnel,
and a review of documentation (draft DFS, schedule, etc.) to compile a list of
underlying assumptions. This list served as the basis for potential risk which
were discussed, quantified/measured, and to some extent mitigated.
Following up quarterly with the risk assessments, a second
session occurred in November 2016.
Page 24-4
|
|
Rosemont Project |
| Form
43-101F1 Technical Report |
25 INTERPRETATION
AND CONCLUSIONS
The purpose of this Technical Report is to present Hudbay’s
estimate of the mineral reserves and mineral resources for the Project based on
the current mine plan, the current state of metallurgical testing, operating
cost and capital cost estimates. This Technical Report includes refinements of
certain aspects of the Project’s mine plan. While consistency with issued and
pending environmental permits and analysis related thereto has always been a key
requirement for this effort, updates to the original mine plan will be
necessary. To the extent that any regulatory agency concludes that the current
plan requires additional environmental analysis or modification of an existing
permit, the intent will be to work with that agency to either complete the
required process or to adjust the current mine plan as necessary.
The results of “feasibility study” level work conducted partly
by external contractors and partly internally by Hudbay, completion of drill
program and bench marking including Hudbay’s Constancia mine has resulted in the
following fundamental conclusions:
- The Rosemont deposit consists of copper-molybdenum-silver-gold
mineralization primarily hosted in skarn formed on a chemical/siliciclastic
sedimentary sequence after the intrusion of Laramide quartz monzonite porphyry
intrusions.
- A new geological model was built based on chemostratigraphy and
lithogeochemistry using ICP multi-element assays (4 acid digestion) from
33,000 samples covering the full footage of the 2014 and 2015 Hudbay drilling
programs. Geochemical based geological model reduces uncertainties in the
formational, lithological and alteration logging. The updated geological model
incorporated a revised structural framework based on a surface and downhole
structural review.
- The resource economic parameters utilized are slightly different than
those supporting the mineral reserve statement. The cost and price inputs for
the mineral resource economic parameters are considered to represent
reasonable estimates and were used to test the economic viability of the
resource. Although these cost and prices differ from the ones used for the
mineral reserves, it is the opinion of the QP that changing the resource
parameters would not materially change the output of the reserve.
- A proven and probable reserve of 592 million tons has been identified and
its economic viability demonstrated. An additional 591 million tons of
measured and indicated resources and 69 million tons of inferred resources
have been identified and outlined as having further potential for economic
extraction once the mineral reserves have been extracted.
- Mining equipment performance and maintenance requirements and costs are
benchmarked from Constancia’s actual operating information and are robust.
- Metallurgical testwork has confirmed that the Rosemont ores respond well
to proven and widely used sulfide mineral processing techniques.
- The tailing properties have been sufficiently characterized as well as the
dewatering performance of vendor equipment over the life of the operation to
satisfy the estimated number, type and size of tailing filters for this
Project. To be conservative, expansion space has been allocated for additional
filtering equipment, to the extent that it may be necessary.
Page 25-1
|
|
Rosemont Project |
| Form
43-101F1 Technical Report |
- The Project process plant design has been modelled after the operating
Constancia processing plant’s flow sheet and is sufficiently robust to
routinely achieve key production targets such as throughput, recovery, and
concentrate grade as stated in the production schedule, based on the
metallurgical testing conducted.
- Flexibility exists within the mine plan to optimize plant recovery and
performance through the management of feed types including clays, oxides and
hardness.
- The Project is one of many large projects scheduled to be constructed. The
author believes that schedule slip will be the principal pressure on cost
should the Project experience construction delays. In the opinion of the
author, the contingency allotted to construction capital cost should mitigate
most cost risk. At the time of publication of this Technical Report, committed
and spent dollars would raise this contingency to approximately 15% of the
required project capital as estimated in the dDFS.
- Related to the capital costs, M3 Engineering and Amec Foster Wheeler
(acting under a Joint Venture agreement) and Ausenco each completed a value
engineering phase and independently produced capital estimates for the project
which were within 5% of each other. Since then, Ausenco has also completed a
feasibility quality capital estimate, benchmarked their findings with
Constancia (and other similar projects), and engaged third party construction
contractors and various consulting firms to provide additional input into the
estimate. Hudbay has also completed an independent third party review of the
feasibility study estimate.
- The net present value of the project is most sensitive to the price of
copper. The resulting project NPV8% ($769 million) and IRR (15.5%) utilizing
the current Hudbay long term view on metal prices, TCRC’s and other economic
assumptions, in the opinion of the author, support the declaration of mineral
reserves as outlined in the CIM guidelines.
- The project execution plan is modelled after the Constancia delivery
method. Many key personnel who developed the Constancia mine are members of
the Project who will be involved in the development of the Project and
therefore considered a robust project execution plan.
The Project is uniquely located in a copper mining jurisdiction
that has sustained economic copper production for close to 140 years. Since it
is located approximately 30 miles from Tucson, it is expected to have a
significant impact on employment and economic gain for the region. The proposed
mining, processing, and logistics plan provides a step forward in innovation and
sustainability. The dry stack tailings deposition proposed would be among the
largest in size and address industry and stakeholder concerns regarding the use
of water and the stability of tailings impoundment facilities. The proposed
design and operating practice that will be applied in respect of the Project is
expected to set a new standard by which other large mining projects are judged
with respect to their impact on stakeholders, the ecology and the
environment.
In recognition of the scarcity of world economic copper
reserves in an environment of ever increasing consumption of the metal, Hudbay
has carefully considered the ecological, environmental, and ethical extraction
methods to be applied to the Project in an effort to set it apart from others in
the world. This Project located in a first world leading nation, where
extraction and production is governed by laws with due process and human rights
fundamental to the consumer.
Page 25-2
|
|
Rosemont Project |
| Form
43-101F1 Technical Report |
This Technical Report also concludes that the estimated mineral
reserves and mineral resources for the Project conform to the requirements of
2014 CIM Definition Standards – for Mineral Resources and Mineral Reserves and
requirements in Form 43-101F1 of NI 43-101, Standards of Disclosure.
Page 25-3
|
|
Rosemont Project |
| Form
43-101F1 Technical Report |
26
RECOMMENDATIONS
The Author recommends the following:
- The author recommends that Hudbay further investigate the cause(s) of the
differences in average molybdenum grade from the historical assays. Hudbay
should also evaluate the application of non-linear interpolation or
wireframing methods in the minor geological units.
- Consideration of a program of drill hole twinning of the pre-Augusta
drilling to bolster the confidence of the re-assaying campaign as conducted by
Augusta.
- Further investigate change-of-support correction and alternative
approaches to resource classification taking into account the high production
rate. This should be performed to ensure that the resource classification
properly reflects the reduced risk when a large volume is mined and delivered
to the mill on a quarterly and annual basis.
- It is recommended by the author that 5% of the samples should be sent for
check assay in future drill hole campaigns.
- Future drilling campaigns should consider the by-product credit
contribution of gold noted contained in copper concentrate produced through
testing and increase the confidence in geological continuity such that it can
be included in the reserve statement.
- Metallurgical testwork has confirmed that marketable copper concentrates
can be produced. Mine and mill production sequencing and planning will require
care to manage clay content that can adversely affect flotation and tailings
filtration.
- A geometallurgical program is recommended as a component of the operating
plan to further refine, monitor and optimize the mine to mill performance. It
is concluded that fluorine can be readily rejected from copper concentrate,
and further study is recommended to develop understanding of ore conditions
and indicators that trigger elevated fluorine content in concentrate.
- Ongoing optimization of pit slope designs should be conducted during
operation accounting for more detailed mapping of local alterations, jointing,
and faulting. These observations and compilation can then provide the basis
for revised slope geometry and pushback (mining phase) configurations that
have the potential to increase mineral reserves and reduce overall stripping
requirements.
Page 26-1
|
|
Rosemont Project |
| Form
43-101F1 Technical Report |
27
REFERENCES
Anzalone, S.A., 1995, The Helvetia Area Porphyry Systems, Pima
County, Arizona; in Pierce, F.W., and Bolm, J.G. eds., Porphyry Copper Deposits
of the American Cordillera: Tucson, Arizona Geological Society Digest 20, p.
436-441.
AACE International, 2012. AACE International Recommended
Practice No.47R-11. Cost Estimate Classification System – As applied in the
Mining and Mineral Processing Industries. Rev. July 6, 2012.
Barra, F., Ruiz, J., Valencia, V. A., Ochoa-Landín, L.,
Chesley, J. T., & Zurcher, L. (2005). Laramide porphyry Cu-Mo mineralization
in northern Mexico: Age constraints from Re-Os geochronology in molybdenite.
Economic Geology,100(8), 1605-1616.
Base Met Laboratories (BML), 2016. Verification of Rosemont
Process Parameters. BL0065. January 8, 2016.
Briggs D. F., 2014. History of Helvetia-Rosemont Mining
District, Pima County, Arizona. June 2014.
Call & Nicholas, Inc. (CNI), 2016. Feasibility-Level
Geotechnical Study for Rosemont Deposit. May 2016.
Copper State Engineering, Inc. 2014. Geotechnical Investigation
Report for West Side Portion of Proposed Water Transmission Pipeline, Rosemont
Copper, Pima County, Arizona. June 19, 2014.
Drewes, Harald, Fields, R.A., Hirschberg, D.M., and Bolm, K.S.,
2002, Spatial digital database for the tectonic map of southeast Arizona: U.S.
Geological Survey Miscellaneous Investigations Series Map I-1109, Digital
database, ver. 2.0, published scale 1:125.000, 2 sheets accessed September 9,
2012 at http://pubs.usgs.gov/imap/i1109/i1109_e.pdf [sheet 1 of 2] and
http://pubs.usgs.gov/imap/i1109/i1109_w.pdf [sheet 2 of 2].
Kermack, K.A., Haldane, J.B.S., 1950. Organic Correlation and
Allometry. Biometrika 37 (1/2), 30-41.
Knight Piésold Consulting, 2016. Rosemont Project, Dry Stack
Tailing Facility Preliminary Geotechnical Slope Stability Analysis, Rev. 1.
January 28, 2016.
M3 Engineering & Technology Corporation, 2009. Rosemont
Copper Project Updated Feasibility Study.
M3 Engineering and Technology Corporation, 2012. Rosemont
Copper Project: NI 43-101 Technical Report, Updated Feasibility Study, Pima
County, Arizona, USA. Revision 0. Project No. M3-PN 08036. Prepared for Augusta
Resource Corporation. Tucson, AZ: M3 Engineering and Technology Corporation.
August 28, 2012.
Page 27-1
|
|
Rosemont Project |
| Form
43-101F1 Technical Report |
Maher, D. J. Reconstruction of middle Tertiary extension and
Laramide porphyry copper systems, east-central Arizona: Unpublished Ph. D. Diss.
thesis, University of Arizona, 2008.
Neirbo Hydrogeology, 2016. Prefeasibility Dewatering Plan and
Analyses. Rosemont Project. Prepared for Hudbay. May 2016.
Ramussen, J., Hoag, C. and Horstman, K., 2012. Geology of the
Northern Santa Rita Mountains, Arizona. Arizona Geological Society Fall Field
Trip September 15, 2012.
SGS Canada Inc., 2015. An investigation into The Grindability
Characteristics of Three Samples from the Rosemont Deposit. Prepared for XPS
Consulting and Testwork Services. June 17, 2015.
Simón, A., 2004. Evaluation of Twin and Duplicate Samples: The
Hyperbolic Method. AMEC Peru Ltda, Internal Document, 2pp.
Terracon Consultants, Inc. 2015. Preliminary Geotechnical
Engineering Report. Rosemont Well System, South Old Nogales Highway, Sahuarita,
Arizona. December 7, 2015.
Tetra Tech, 2009. Plant Site Geotechnical Report, Rosemont
Copper Project. Prepared for Rosemont Copper. August 2009.
Wardrop, 2005. Technical Report on the Rosemont Property, Pima
County, Arizona, June 3, 2005, 145 pp.
XPS Consulting & Testwork Services, 2015a. BWi and SAG
Variability Analysis of Rosemont Composites. MET 1A, MET 1B, MET 2. Prepared for
Hudbay Mining. July 16, 2015.
XPS Consulting & Testwork Services, 2015b. Rosemont Project
Phase II Geometallurgical Program Technical Review. September 10, 2015.
Page 27-2
|
|
Rosemont Project |
| Form
43-101F1 Technical Report |
28
SIGNATURE PAGE
This NI 43-101 technical report titled “Mineral Resource
Estimate, Rosemont Project, Pima County, Arizona, USA”, dated and effective as
of March 30, 2017 was prepared and signed by the following author:
Dated this 30th day of March, 2017.
(signed) Cashel Meagher
_________________________Signature of Qualified Person
Cashel Meagher, P.Geo. Senior Vice President & Chief
Operating Officer, Hudbay
Page 28-1
|
|
Rosemont Project |
| Form
43-101F1 Technical Report |
29 CERTIFICATES
OF QUALIFIED PERSONS
CASHEL MEAGHER
CERTIFICATE OF QUALIFICATION
Re: Rosemont Project Technical Report, March 30,
2017
I, Cashel Meagher, B. Sc., P. Geo, of Toronto, Canada, do
hereby certify that:
| 1. |
I am currently employed as Senior Vice President and
Chief Operating Officer, with Hudbay Minerals Inc., 25 York St, Suite 800,
Toronto Ontario. |
| |
|
| 2. |
I graduated from Saint Francis Xavier University with a
Joint Advanced major in Geology and Chemistry in 1994. |
| |
|
| 3. |
I am a member in good standing with the Association of
Professional Geoscientists of Ontario, member #1056. |
| |
|
| 4. |
I have practiced my profession continuously over 20 years
and have been involved in mineral exploration, project evaluation,
resource and reserve evaluation, and mine operations in underground and
open pit mines for base metal and precious metal deposits in North and
South America. |
| |
|
| 5. |
I have read the definition of “qualified person” set out
in National Instrument 43-101 (“NI 43-101”) and certify that by reason of
my education and affiliation with a professional association and past
relevant work experience, I fulfil the requirements to be a “qualified
person” for the purpose of NI 43-101. |
| |
|
| 6. |
I have reviewed and approved the Summary of the Technical
Report and I am responsible for the preparation of this Technical Report
titled “NI 43-101 Technical Report, Rosemont Project, Pima County,
Arizona, USA” (the “Technical Report”), dated March 30, 2017. |
| |
|
| 7. |
I last visited the property on April 21, 2016. I also
visited it several times prior to that date. |
| |
|
| 8. |
As of the date of this certificate, to the best of my
knowledge, information and belief, the Technical Report contains all
scientific and technical information that is required to be disclosed to
make the Technical Report not misleading. |
| |
|
| 9. |
I am not independent of the Issuer. Since I am an
employee of the Issuer, a producing issuer, I fall under subsection 5.3(3)
of NI 43-101 where “a technical report required to be filed by a producing
issuer is not required to be prepared by or under supervision of an
independent qualified person”. |
| |
|
| 10. |
I have been directly involved with the Rosemont Project
property, which is the subject of the Technical Report, continuously since
January, 2016. |
| |
|
| 11. |
I have read NI 43-101 and Form 43-101F1, and the
Technical Report has been prepared in compliance with the instrument and
form. |
| |
|
| 12. |
I consent to the public filing of the Technical Report
with any stock exchange, securities commission or other regulatory
authority and any publication by them, including electronic publication in
the public company files on their websites accessible by the public, of
the Technical Report. |
Page 29-1
|
|
Rosemont Project |
| Form
43-101F1 Technical Report |
Dated as of March 30, 2017.
Original signed by:
Cashel Meagher, P.Geo.
Senior Vice President & Chief Operating Officer, Hudbay
Page 29-2
|
|
Rosemont Project |
| Form
43-101F1 Technical Report |
30 A1-1
LAND TENURE
The following tables identify the patented claims, unpatented
claims, and fee owned associated lands.
Page 30-1
|
|
Rosemont Project |
| Form
43-101F1 Technical Report |
A1-2 Rosemont Project Patented Claims
| COUNT |
PARCEL NO. |
PROPERTY NAME |
SECTION-TOWNSHIP-RANGE
|
ASSESSED
ACRES |
2015 FEES
|
| 1 |
305540020 |
BLACK BESS |
13-18-15 |
13.540 |
$12.21 |
| 2 |
305540030 |
FLYING DUTCHMAN |
13-18-15 |
20.380 |
$12.21 |
| 3 |
305540040 |
WISCONSIN |
13-18-15 |
20.660 |
$12.21 |
| 4 |
305540050 |
EXCHANGE |
13-18-15 |
20.660 |
$12.21 |
| 5 |
305540060 |
EXCHANGE NO. 2 |
13-18-15 |
6.590 |
$12.21 |
| 6 |
305540070 |
COPPER WORLD |
13-18-15 |
20.660 |
$12.21 |
| 7 |
305540080 |
OWOSKO |
13-18-15 |
20.660 |
$12.21 |
| 8 |
305540090 |
BLACK HORSE |
13-18-15 |
13.810 |
$12.21 |
| 9 |
305540100 |
BRUNSWICK |
13-18-15 |
18.660 |
$12.21 |
| 10 |
305540110 |
ANTELOPE |
13-18-15 |
17.360 |
$12.21 |
| 11 |
305550010 |
NEWMAN |
14-18-15 |
16.500 |
$12.21 |
| 12 |
305550040 |
CHANCE |
14-18-15 |
20.160 |
$12.21 |
| 13 |
305550050 |
BLACK HAWK |
14-18-15 |
11.360 |
$12.21 |
| 14 |
305550060 |
TELEMETER |
14-18-15 |
8.150 |
$12.21 |
| 15 |
305550070 |
WEST END |
14-18-15 |
19.530 |
$12.21 |
| 16 |
305550080 |
HATTIE |
14-18-15 |
12.190 |
$12.21 |
| 17 |
305550090 |
SILVER SPUR |
14-18-15 |
8.610 |
$12.21 |
| 18 |
305550100 |
SLIDE |
14-18-15 |
12.880 |
$12.21 |
| 19 |
305550110 |
BACK BONE |
14-18-15 |
19.070 |
$12.21 |
| 20 |
305550130 |
BUZZARD |
14-18-15 |
20.660 |
$12.21 |
| 21 |
305550140 |
HEAVY WEIGHT |
14-18-15 |
20.660 |
$12.21 |
| 22 |
305550150 |
LIGHT WEIGHT |
14-18-15 |
20.660 |
$12.21 |
| 23 |
305560040 |
PEACH |
15-18-15 |
18.070 |
$12.21 |
| 24 |
305560050 |
SOUTH END |
15-18-15 |
17.810 |
$12.21 |
| 25 |
305560060 |
MONITOR |
15-18-15 |
13.320 |
$12.21 |
| 26 |
305560070 |
GAP |
15-18-15 |
16.250 |
$12.21 |
| 27 |
305580080 |
WATER WISH |
23-18-15 |
20.660 |
$12.21 |
| 28 |
305580090 |
NEW MEXICO |
23-18-15 |
15.130 |
$12.21 |
| 29 |
305580100 |
GRIZZLY |
23-18-15 |
20.660 |
$12.21 |
| 30 |
305580110 |
OLD DICK |
23-18-15 |
20.130 |
$12.21 |
| 31 |
305580120 |
AMERICAN |
23-18-15 |
20.100 |
$12.21 |
| 32 |
305580130 |
RECORDER |
23-18-15 |
6.700 |
$12.21 |
| 33 |
305580140 |
MOHAWK |
23-18-15 |
13.550 |
$12.21 |
| 34 |
305580150 |
WEDGE |
23-18-15 |
19.310 |
$12.21 |
| 35 |
305580160 |
DAN |
23-18-15 |
2.480 |
$12.21 |
| 36 |
305580170 |
GENERAL |
23-18-15 |
9.170 |
$12.21 |
| 37 |
305580180 |
ELGIN |
23-18-15 |
14.000 |
$12.21 |
| 38 |
305580190 |
SUNSETE |
23-18-15 |
0.667 |
$12.21 |
| 39 |
305580200 |
TELEPHONE |
23-18-15 |
18.660 |
$12.21 |
| 40 |
305580220 |
ELGIN MILLSITE |
23-18-15 |
4.994 |
$12.21 |
| 41 |
305580250 |
DAN MILLSITE |
23-18-15 |
2.856 |
$12.21 |
| 42 |
305580260 |
WEDGE MILLSITE |
23-18-15 |
4.987 |
$12.21 |
| 43 |
305580270 |
OLD DICK MILLSITE |
23-18-15 |
2.196 |
$12.21 |
| 44 |
305590060 |
ARCOLA |
24-18-15 |
20.660 |
$12.21 |
| 45 |
305590070 |
BONNIE BLUE |
24-18-15 |
20.660 |
$12.21 |
| 46 |
305590080 |
KING |
24-18-15 |
20.660 |
$12.21 |
| 47 |
305590090 |
EXILE |
24-18-15 |
16.020 |
$12.21 |
| 48 |
305590100 |
VULTURE |
24-18-15 |
15.730 |
$12.21 |
| 49 |
305590110 |
ISLE ROYAL |
24-18-15 |
20.660 |
$12.21 |
| 50 |
305590120 |
INDIAN CLUB |
24-18-15 |
19.200 |
$12.21 |
| 51 |
305590130 |
A.O.T. |
24-18-15 |
14.200 |
$12.21 |
| 52 |
305590140 |
BALTIMORE |
24-18-15 |
9.620 |
$12.21 |
| 53 |
305590150 |
PILOT |
24-18-15 |
14.700 |
$12.21 |
| 54 |
305590160 |
LITTLE DAVE |
24-18-15 |
20.660 |
$12.21 |
| 55 |
305590170 |
COPPER FEND |
24-18-15 |
20.660 |
$12.21 |
Page 30-2
|
|
Rosemont Project |
| Form
43-101F1 Technical Report |
| COUNT |
PARCEL NO. |
PROPERTY NAME |
SECTION-TOWNSHIP-RANGE |
ASSESSED
ACRES |
2015
FEES |
| 56 |
305590180 |
TALLY HO |
24-18-15 |
20.380 |
$12.21 |
| 57 |
305590190 |
LEADER |
24-18-15 |
20.660 |
$12.21 |
| 58 |
305590200 |
OMEGA |
24-18-15 |
20.660 |
$12.21 |
| 59 |
305590220 |
ECLIPSE COPPER |
24-18-15 |
20.660 |
$12.21 |
| 60 |
305590230 |
SCHWAB |
24-18-15 |
9.261 |
$12.21 |
| 61 |
305590240 |
NARRAGANSETT BAY |
24-18-15 |
12.428 |
$12.21 |
| 62 |
305590250 |
LANDOR |
24-18-15 |
15.870 |
$12.21 |
| 63 |
305590260 |
WARD |
24-18-15 |
17.693 |
$12.21 |
| 64 |
305590270 |
ALTA COPPER |
24-18-15 |
18.180 |
$12.21 |
| 65 |
305590280 |
BROAD TOP |
24-18-15 |
17.150 |
$12.21 |
| 66 |
305590290 |
MALACHITE |
24-18-15 |
20.660 |
$12.21 |
| 67 |
305600040 |
YORK |
25-18-15 |
13.380 |
$12.21 |
| 68 |
305600050 |
OLCOTT |
25-18-15 |
5.485 |
$12.21 |
| 69 |
305600060 |
HILO CONSOLIDATED |
25-18-15 |
12.190 |
$12.21 |
| 70 |
305600070 |
ELDON |
25-18-15 |
18.984 |
$12.21 |
| 71 |
305600080 |
RAINBOW |
25-18-15 |
7.765 |
$12.21 |
| 72 |
305600090 |
AJAX CONSOLIDATED |
25-18-15 |
13.980 |
$12.21 |
| 73 |
305600100 |
CUBA |
25-18-15 |
12.030 |
$12.21 |
| 74 |
305600110 |
FALLS |
25-18-15 |
16.340 |
$12.21 |
| 75 |
305600130 |
OLD PUT CON |
25-18-15 |
20.650 |
$12.21 |
| 76 |
305600140 |
FRANKLIN |
25-18-15 |
20.540 |
$12.21 |
| 77 |
305600150 |
CUSHING |
25-18-15 |
15.040 |
$12.21 |
| 78 |
305600160 |
CENTRAL |
25-18-15 |
17.860 |
$12.21 |
| 79 |
305600170 |
POTOMAC |
25-18-15 |
20.620 |
$12.21 |
| 80 |
305610010 |
MARION |
36-18-15 |
20.660 |
$12.21 |
| 81 |
305610030 |
EXCELSIOR |
36-18-15 |
20.575 |
$12.21 |
| 82 |
305610040 |
EMPIRE |
36-18-15 |
10.210 |
$12.21 |
| 83 |
305610050 |
ALTAMONT |
36-18-15 |
20.610 |
$12.21 |
| 84 |
305610060 |
ERIE |
36-18-15 |
19.610 |
$12.21 |
| 85 |
305610080 |
CHICAGO |
36-18-15 |
16.660 |
$12.21 |
| 86 |
305610090 |
COCONINO |
36-18-15 |
14.100 |
$12.21 |
| 87 |
305630020 |
OLUSTEE |
19-18-16 |
20.520 |
$12.00 |
| 88 |
305630040 |
AMOLE |
19-18-16 |
17.921 |
$12.00 |
| 89 |
305640020 |
CHICAGO MILLSITE |
29-18-16 |
5.000 |
$13.70 |
| 90 |
305640030 |
COCONINO MILLSITE |
29-18-16 |
5.000 |
$13.70 |
| 91 |
305640040 |
OLD PUT MILLSITE |
29-18-16 |
5.000 |
$13.70 |
| 92 |
305640050 |
OREGON MILLSITE |
29-18-16 |
5.000 |
$13.70 |
| 93 |
305640060 |
OLD PAP MILLSITE |
29-18-16 |
5.000 |
$13.70 |
| 94 |
305640070 |
AJAX CONSOLIDATED MILLSITE |
29-18-16 |
5.000 |
$13.70 |
| 95 |
305650020 |
R. G. INGERSOLL |
30-18-16 |
20.620 |
$12.00 |
| 96 |
305650040 |
PATRICK HENRY |
30-18-16 |
19.050 |
$12.00 |
| 97 |
305660050 |
MOHAWK SILVER |
01-19-15 |
19.760 |
$7.89 |
| 98 |
305660060 |
TREMONT |
01-19-15 |
12.860 |
$7.89 |
| 99 |
30554012A |
BLUE POINT |
13-18-15 |
19.288 |
$12.21 |
| 100 |
30555012A |
HEAVY WEIGHT MILLSITE |
14-18-15 |
5.000 |
$12.21 |
| 101A |
30558021A |
TELEPHONE MILLSITE |
23-18-15 |
4.610 |
$12.21 |
| 102 |
30558023A |
RECORDER MILLSITE |
23-18-15 |
2.640 |
$12.21 |
| 101B |
30558023B |
TELEPHONE, RECORDER &
AMERICAN MILLSITE |
23-18-15 |
3.830 |
$12.21 |
| 103 |
30558024A |
AMERICAN MILLSITE |
23-18-15 |
4.540 |
$12.21 |
| 104 |
30559021A |
OMEGA FIRST EXTENSION SOUTH |
24-18-15 |
20.660 |
$12.21 |
| 105A |
30560003A |
DAYLIGHT |
25-18-15 |
13.210 |
$12.21 |
| 105B |
30560003B |
DAYLIGHT |
30-18-16 |
5.960 |
$12.21 |
| 106 |
30560012A |
OLD PAP COPPER |
25-18-15 |
20.650 |
$12.21 |
| 107 |
30560012D |
FALLS NO. 2 |
25-18-15 |
7.320 |
$12.21 |
| 108 |
30560012F |
WEDGE NO. 2 |
25-18-15 |
1.280 |
$12.21 |
Page 30-3
|
|
Rosemont Project |
| Form
43-101F1 Technical Report |
| COUNT |
PARCEL NO. |
ROPERTY NAME |
SECTION-TOWNSHIP-RANGE
|
ASSESSED
ACRES |
2015
FEES |
| 109 |
30560012G |
WEDGE |
25-18-15 |
6.600 |
$12.21 |
| 110 |
30560012H |
SANTA RITA FRACTION |
25-18-15 |
0.980 |
$12.21 |
| 111A |
30560012J |
SANTA RITA #13 |
25-18-15 |
10.520 |
$12.21 |
| 112 |
30561007A |
OREGON COPPER |
36-18-15 |
16.080 |
$12.21 |
| 113A |
30561007D |
SANTA RITA #15 |
36-18-15 |
13.590 |
$12.21 |
| 114 |
30561007E |
SANTA RITA #14 |
36-18-15 |
19.160 |
$12.21 |
| 115 |
30561007F |
SANTA RITA #12 |
36-18-15 |
19.620 |
$12.21 |
| 116 |
30561007G |
LAST CHANCE NO. 1 |
36-18-15 |
15.600 |
$12.21 |
| 117 |
30561007H |
LAST CHANCE NO. 2 |
36-18-15 |
18.270 |
$12.21 |
| 118 |
30561007J |
SANTA RITA #26 |
36-18-15 |
20.030 |
$12.21 |
| 119 |
30561007K |
SANTA RITA #27 |
36-18-15 |
18.760 |
$12.21 |
| 120A |
30561007L |
SANTA RITA #28 |
36-18-15 |
18.570 |
$12.21 |
| 121 |
30562034C |
SANTA RITA #16 |
31-18-16 |
18.920 |
$12.00 |
| 113B |
30562034D |
SANTA RITA #15 |
31-18-16 |
6.440 |
$12.00 |
| 120B |
30562034E |
SANTA RITA #28 |
31-18-16 |
2.010 |
$12.00 |
| 111B |
30562034F |
SANTA RITA #13 |
31-18-16 |
7.510 |
$12.00 |
| 122 |
30563003A |
CUPRITE |
19-18-16 |
20.660 |
$12.00 |
| 123 |
30564008A |
FRANKLIN MILLSITE |
29-18-16 |
5.000 |
$12.00 |
| 124 |
30565003A |
LA FAYETTE |
30-18-16 |
13.950 |
$12.00 |
| 125 |
30565003D |
SANTA RITA #4 |
30-18-16 |
19.000 |
$12.00 |
| 126 |
30565003E |
SANTA RITA #5 |
30-18-16 |
19.020 |
$12.00 |
| 127 |
30565003F |
SANTA RITA #6 |
30-18-16 |
18.990 |
$12.00 |
| 128A |
30565003G |
SANTA RITA #8A |
25-18-15 |
3.660 |
$12.00 |
| 129A |
30565003H |
SANTA RITA #9 |
30-18-16, 31-18-16 |
19.580 |
$12.00 |
| 130 |
30565003J |
SANTA RITA #10 |
30-18-16, 31-18-16 |
20.560 |
$12.00 |
| 131 |
30565003K |
SANTA RITA #11 |
31-18-16 |
20.560 |
$12.00 |
| 128B |
30565003L |
SANTA RITA #8A |
25-18-15,(S/B 30-18-16) |
10.750 |
$12.00 |
| 129B |
30565003M |
SANTA RITA #9 |
25-18-15 |
1.020 |
$12.00 |
| 132A |
30565005A |
DAN WEBSTER |
30-18-16 |
15.190 |
$12.00 |
| 132B |
30565005B |
DAN WEBSTER |
25-18-15 |
3.770 |
$12.00 |
| PATENTED CLAIM TOTALS |
2003.520 |
$1,705.08 |
Page 30-4
|
|
Rosemont Project |
| Form
43-101F1 Technical Report |
A1-3 Rosemont Project Unpatented Claims
| COUNT |
UNPATENTED CLAIM NAME |
BLM SERIAL NUMBER |
ANNUAL FEE |
| 1 |
York Fraction |
AMC2198 |
$155.00 |
| 2 |
Travis #1 |
AMC2199 |
$155.00 |
| 3 |
Jim |
AMC2200 |
$155.00 |
| 4 |
Isle Royal Fraction |
AMC2201 |
$155.00 |
| 5 |
Indian Club Fraction |
AMC2202 |
$155.00 |
| 6 |
Pilot Fraction |
AMC2203 |
$155.00 |
| 7 |
A.O.T. Fraction |
AMC2204 |
$155.00 |
| 8 |
Malachite Fraction |
AMC2211 |
$155.00 |
| 9 |
MAX 121 B/Relocation |
AMC13284 |
$155.00 |
| 10 |
MAX 123 B/Relocation |
AMC13286 |
$155.00 |
| 11 |
MAX 125 B/Relocation |
AMC13288 |
$155.00 |
| 12 |
MAX 126 B/Relocation |
AMC13289 |
$155.00 |
| 13 |
MAX 127 B/Relocation |
AMC13290 |
$155.00 |
| 14 |
MAX 128 B/Relocation |
AMC13291 |
$155.00 |
| 15 |
MAX 129 B/Relocation |
AMC13292 |
$155.00 |
| 16 |
MAX 130 B/Relocation |
AMC13293 |
$155.00 |
| 17 |
MAX 131 B/Relocation |
AMC13294 |
$155.00 |
| 18 |
MAX 132 B/Relocation |
AMC13295 |
$155.00 |
| 19 |
MAX 133 B/Relocation |
AMC13296 |
$155.00 |
| 20 |
MAX 134 B/Relocation |
AMC13297 |
$155.00 |
| 21 |
MAX 135 B/Relocation |
AMC13298 |
$155.00 |
| 22 |
MAX 136 B/Relocation |
AMC13299 |
$155.00 |
| 23 |
MAX 137 B/Relocation |
AMC13300 |
$155.00 |
| 24 |
MAX 138 B/Relocation |
AMC13301 |
$155.00 |
| 25 |
MAX 139 B/Relocation |
AMC13302 |
$155.00 |
| 26 |
MAX 140 B/Relocation |
AMC13303 |
$155.00 |
| 27 |
MAX 141 B/Relocation |
AMC13304 |
$155.00 |
| 28 |
MAX 142 B/Relocation |
AMC13305 |
$155.00 |
| 29 |
MAX 143 B/Relocation |
AMC13306 |
$155.00 |
| 30 |
MAX 144 B/Relocation |
AMC13307 |
$155.00 |
| 31 |
MAX 145 B/Relocation |
AMC13308 |
$155.00 |
| 32 |
MAX 146 B/Relocation |
AMC13309 |
$155.00 |
| 33 |
MAX 147 B/Relocation |
AMC13310 |
$155.00 |
| 34 |
MAX 148 B/Relocation |
AMC13311 |
$155.00 |
| 35 |
MAX 149 B/Relocation |
AMC13312 |
$155.00 |
| 36 |
MAX 150 B/Relocation |
AMC13313 |
$155.00 |
| 37 |
MAX 151 B/Relocation |
AMC13314 |
$155.00 |
| 38 |
MAX 152 B/Relocation |
AMC13315 |
$155.00 |
| 39 |
MAX 153 B/Relocation |
AMC13316 |
$155.00 |
| 40 |
MAX 154 B/Relocation |
AMC13317 |
$155.00 |
| 41 |
MAX 155 B/Relocation |
AMC13318 |
$155.00 |
| 42 |
MAX 156 B/Relocation |
AMC13319 |
$155.00 |
| 43 |
Rosaland |
AMC14972 |
$155.00 |
| 44 |
Michael M |
AMC14973 |
$155.00 |
| 45 |
Lydia J |
AMC14974 |
$155.00 |
| 46 |
Ida D |
AMC14975 |
$155.00 |
| 47 |
D & D #1 |
AMC14976 |
$155.00 |
| 48 |
D & D II |
AMC14977 |
$155.00 |
| 49 |
Frijole |
AMC14978 |
$155.00 |
| 50 |
Frijole II |
AMC14979 |
$155.00 |
Page 30-5
|
|
Rosemont Project |
| Form
43-101F1 Technical Report |
| COUNT |
UNPATENTED CLAIM NAME |
BLM SERIAL NUMBER |
ANNUAL FEE |
| 51 |
Frijole III |
AMC14980 |
$155.00 |
| 52 |
Frijole IV |
AMC14981 |
$155.00 |
| 53 |
Frijole V |
AMC14982 |
$155.00 |
| 54 |
Frijole VII |
AMC14984 |
$155.00 |
| 55 |
Frijole VIII |
AMC14985 |
$155.00 |
| 56 |
Frijole IX |
AMC14986 |
$155.00 |
| 57 |
Frijole X |
AMC14987 |
$155.00 |
| 58 |
Frijole XI |
AMC14988 |
$155.00 |
| 59 |
Frijole XI Extension |
AMC14989 |
$155.00 |
| 60 |
Deering Springs No. 2 A/Relocation
|
AMC15002 |
$155.00 |
| 61 |
Deering Springs No. 4 A/Relocation
|
AMC15003 |
$155.00 |
| 62 |
Deering Springs No. 6 A/Relocation
|
AMC15004 |
$155.00 |
| 63 |
Deering Springs No. 8 A/Relocation
|
AMC15005 |
$155.00 |
| 64 |
Deering Springs No. 10 A/Relocation
|
AMC15006 |
$155.00 |
| 65 |
Deering Springs No. 12 A/Relocation
|
AMC15007 |
$155.00 |
| 66 |
Deering Springs No. 14 A/Relocation
|
AMC15008 |
$155.00 |
| 67 |
Deering Springs No. 15 A/Relocation
|
AMC15009 |
$155.00 |
| 68 |
Deering Springs No. 16 A/Relocation
|
AMC15010 |
$155.00 |
| 69 |
Deering Springs No. 17 A/Relocation
|
AMC15011 |
$155.00 |
| 70 |
Deering Springs No. 21 A/Relocation
|
AMC15012 |
$155.00 |
| 71 |
Deering Springs No. 22 A/Relocation
|
AMC15013 |
$155.00 |
| 72 |
Deering Springs No. 23 A/Relocation
|
AMC15014 |
$155.00 |
| 73 |
Deering Springs No. 24 A/Relocation
|
AMC15015 |
$155.00 |
| 74 |
Deering Springs No. 25 A/Relocation
|
AMC15016 |
$155.00 |
| 75 |
Deering Springs No. 26 A/Relocation
|
AMC15017 |
$155.00 |
| 76 |
Deering Springs No. 27 A/Relocation
|
AMC15018 |
$155.00 |
| 77 |
Deering Springs No. 28 A/Relocation
|
AMC15019 |
$155.00 |
| 78 |
Deering Springs No. 29 A/Relocation
|
AMC15020 |
$155.00 |
| 79 |
Deering Springs No. 30 A/Relocation
|
AMC15021 |
$155.00 |
| 80 |
Deering Springs No. 31 A/Relocation
|
AMC15022 |
$155.00 |
| 81 |
Deering Springs No. 32 A/Relocation
|
AMC15023 |
$155.00 |
| 82 |
Deering Springs No. 33 A/Relocation
|
AMC15024 |
$155.00 |
| 83 |
Deering Springs No. 34 A/Relocation
|
AMC15025 |
$155.00 |
| 84 |
Deering Springs No. 35 A/Relocation
|
AMC15026 |
$155.00 |
| 85 |
Deering Springs No. 36 A/Relocation
|
AMC15027 |
$155.00 |
| 86 |
Deering Springs No. 37 A/Relocation
|
AMC15028 |
$155.00 |
| 87 |
Deering Springs No. 38 A/Relocation
|
AMC15029 |
$155.00 |
| 88 |
Deering Springs No. 39 A/Relocation
|
AMC15030 |
$155.00 |
| 89 |
Deering Springs No. 42 A/Relocation
|
AMC15031 |
$155.00 |
| 90 |
Deering Springs No. 51 A/Relocation
|
AMC15032 |
$155.00 |
| 91 |
Deering Springs No. 52 A/Relocation
|
AMC15033 |
$155.00 |
| 92 |
Kid 1 |
AMC25210 |
$155.00 |
| 93 |
Kid 2 |
AMC25211 |
$155.00 |
| 94 |
Kid 3 |
AMC25212 |
$155.00 |
| 95 |
Kid 4 |
AMC25213 |
$155.00 |
| 96 |
Kid 5 |
AMC25214 |
$155.00 |
| 97 |
Kid 6 |
AMC25215 |
$155.00 |
| 98 |
Kid 7 |
AMC25216 |
$155.00 |
| 99 |
Kid 8 |
AMC25217 |
$155.00 |
| 100 |
Kid 9 |
AMC25218 |
$155.00 |
Page 30-6
|
|
Rosemont Project |
| Form
43-101F1 Technical Report |
| COUNT |
UNPATENTED CLAIM NAME |
BLM SERIAL NUMBER |
ANNUAL FEE |
| 101 |
Kid 10 |
AMC25219 |
$155.00 |
| 102 |
Kid 11 |
AMC25220 |
$155.00 |
| 103 |
Kid 12 |
AMC25221 |
$155.00 |
| 104 |
Kid 13 |
AMC25222 |
$155.00 |
| 105 |
Kid 14 |
AMC25223 |
$155.00 |
| 106 |
Kid 15 |
AMC25224 |
$155.00 |
| 107 |
Kid 16 |
AMC25225 |
$155.00 |
| 108 |
Kid 17 |
AMC25226 |
$155.00 |
| 109 |
Kid 18 |
AMC25227 |
$155.00 |
| 110 |
Kid 19 |
AMC25228 |
$155.00 |
| 111 |
Kid 20 |
AMC25229 |
$155.00 |
| 112 |
Kid 21 |
AMC25230 |
$155.00 |
| 113 |
Kid 22 |
AMC25231 |
$155.00 |
| 114 |
Kid 23 |
AMC25232 |
$155.00 |
| 115 |
Kid 24 |
AMC25233 |
$155.00 |
| 116 |
Kid 25 |
AMC25234 |
$155.00 |
| 117 |
Kid 26 |
AMC25235 |
$155.00 |
| 118 |
Kid 27 |
AMC25236 |
$155.00 |
| 119 |
Kid 28 |
AMC25237 |
$155.00 |
| 120 |
Kid 29 |
AMC25238 |
$155.00 |
| 121 |
Kid 34 |
AMC25243 |
$155.00 |
| 122 |
Kid 35 |
AMC25244 |
$155.00 |
| 123 |
Kid 36 |
AMC25245 |
$155.00 |
| 124 |
Kid 37 |
AMC25246 |
$155.00 |
| 125 |
Kid 38 |
AMC25247 |
$155.00 |
| 126 |
Kid 39 |
AMC25248 |
$155.00 |
| 127 |
Kid 40 |
AMC25249 |
$155.00 |
| 128 |
Kid 41 |
AMC25250 |
$155.00 |
| 129 |
Kid 42 |
AMC25251 |
$155.00 |
| 130 |
Kid 43 |
AMC25252 |
$155.00 |
| 131 |
Kid 44 |
AMC25253 |
$155.00 |
| 132 |
Kid 45 |
AMC25254 |
$155.00 |
| 133 |
Kid 46 |
AMC25255 |
$155.00 |
| 134 |
Kid 47 |
AMC25256 |
$155.00 |
| 135 |
Wasp 52 |
AMC25257 |
$155.00 |
| 136 |
Wasp 53 |
AMC25258 |
$155.00 |
| 137 |
Wasp 54 |
AMC25259 |
$155.00 |
| 138 |
Wasp 55 |
AMC25260 |
$155.00 |
| 139 |
Wasp 56 |
AMC25261 |
$155.00 |
| 140 |
Wasp 57 |
AMC25262 |
$155.00 |
| 141 |
Wasp 58 |
AMC25263 |
$155.00 |
| 142 |
Wasp 60 |
AMC25264 |
$155.00 |
| 143 |
Wasp 61 |
AMC25265 |
$155.00 |
| 144 |
Wasp 101 |
AMC25268 |
$155.00 |
| 145 |
Wasp 102 |
AMC25269 |
$155.00 |
| 146 |
Wasp 103 |
AMC25270 |
$155.00 |
| 147 |
Wasp 104 |
AMC25271 |
$155.00 |
| 148 |
Wasp 105 |
AMC25272 |
$155.00 |
| 149 |
Wasp 106 |
AMC25273 |
$155.00 |
| 150 |
Wasp 107 |
AMC25274 |
$155.00 |
Page 30-7
|
|
Rosemont Project |
| Form
43-101F1 Technical Report |
| COUNT |
UNPATENTED CLAIM NAME |
BLM SERIAL NUMBER |
ANNUAL FEE |
| 151 |
Wasp 111 |
AMC25275 |
$155.00 |
| 152 |
Wasp 112 |
AMC25276 |
$155.00 |
| 153 |
Wasp 113 |
AMC25277 |
$155.00 |
| 154 |
Wasp 114 |
AMC25278 |
$155.00 |
| 155 |
Wasp 115 |
AMC25279 |
$155.00 |
| 156 |
Wasp 116 |
AMC25280 |
$155.00 |
| 157 |
Wasp 117 |
AMC25281 |
$155.00 |
| 158 |
Wasp 118 |
AMC25282 |
$155.00 |
| 159 |
Wasp 119 |
AMC25283 |
$155.00 |
| 160 |
Wasp 120 |
AMC25284 |
$155.00 |
| 161 |
Wasp 121 |
AMC25285 |
$155.00 |
| 162 |
Wasp 122 |
AMC25286 |
$155.00 |
| 163 |
Wasp 123 |
AMC25287 |
$155.00 |
| 164 |
Wasp 124 |
AMC25288 |
$155.00 |
| 165 |
Wasp 125 |
AMC25289 |
$155.00 |
| 166 |
Wasp 126 |
AMC25290 |
$155.00 |
| 167 |
Wasp 127 |
AMC25291 |
$155.00 |
| 168 |
Wasp 128 |
AMC25292 |
$155.00 |
| 169 |
Wasp 129 |
AMC25293 |
$155.00 |
| 170 |
Wasp 130 |
AMC25294 |
$155.00 |
| 171 |
Wasp 201 |
AMC25295 |
$155.00 |
| 172 |
Wasp 202 |
AMC25296 |
$155.00 |
| 173 |
Wasp 203 |
AMC25297 |
$155.00 |
| 174 |
Wasp 204 |
AMC25298 |
$155.00 |
| 175 |
Wasp 205 |
AMC25299 |
$155.00 |
| 176 |
Wasp 206 |
AMC25300 |
$155.00 |
| 177 |
Wasp 207 |
AMC25301 |
$155.00 |
| 178 |
Wasp 208 |
AMC25302 |
$155.00 |
| 179 |
Wasp 209 |
AMC25303 |
$155.00 |
| 180 |
Wasp 210 |
AMC25304 |
$155.00 |
| 181 |
Wasp 211 |
AMC25305 |
$155.00 |
| 182 |
Wasp 212 |
AMC25306 |
$155.00 |
| 183 |
Wasp 213 |
AMC25307 |
$155.00 |
| 184 |
Wasp 214 |
AMC25308 |
$155.00 |
| 185 |
Wasp 215 |
AMC25309 |
$155.00 |
| 186 |
Wasp 216 |
AMC25310 |
$155.00 |
| 187 |
Wasp 217 |
AMC25311 |
$155.00 |
| 188 |
Wasp 218 |
AMC25312 |
$155.00 |
| 189 |
Wasp 313 |
AMC25349 |
$155.00 |
| 190 |
Wasp 315 |
AMC25351 |
$155.00 |
| 191 |
Wasp 317 |
AMC25353 |
$155.00 |
| 192 |
Wasp 319 |
AMC25355 |
$155.00 |
| 193 |
Wasp 321 |
AMC25357 |
$155.00 |
| 194 |
Wasp 323 |
AMC25359 |
$155.00 |
| 195 |
Wasp 325 |
AMC25361 |
$155.00 |
| 196 |
Wasp 327 |
AMC25363 |
$155.00 |
| 197 |
Wasp 329 |
AMC25365 |
$155.00 |
| 198 |
Wasp 331 |
AMC25367 |
$155.00 |
| 199 |
Wasp 333 |
AMC25369 |
$155.00 |
| 200 |
Wasp 335 |
AMC25371 |
$155.00 |
Page 30-8
|
|
Rosemont Project |
| Form
43-101F1 Technical Report |
| COUNT |
UNPATENTED CLAIM NAME |
BLM SERIAL NUMBER |
ANNUAL FEE |
| 201 |
Wasp 337 |
AMC25373 |
$155.00 |
| 202 |
Wasp 339 |
AMC25375 |
$155.00 |
| 203 |
Wasp 341 |
AMC25377 |
$155.00 |
| 204 |
Wasp 343 |
AMC25379 |
$155.00 |
| 205 |
Wasp 344 |
AMC25380 |
$155.00 |
| 206 |
Wasp 345 |
AMC25381 |
$155.00 |
| 207 |
Wasp 346 |
AMC25382 |
$155.00 |
| 208 |
Wasp 347 |
AMC25383 |
$155.00 |
| 209 |
Wasp 348 |
AMC25384 |
$155.00 |
| 210 |
Wasp 349 |
AMC25385 |
$155.00 |
| 211 |
Wasp 350 |
AMC25386 |
$155.00 |
| 212 |
Wasp 351 |
AMC25387 |
$155.00 |
| 213 |
Wasp 352 |
AMC25388 |
$155.00 |
| 214 |
Wasp 353 |
AMC25389 |
$155.00 |
| 215 |
Wasp 354 |
AMC25390 |
$155.00 |
| 216 |
Max 41 |
AMC25662 |
$155.00 |
| 217 |
Max 43 |
AMC25664 |
$155.00 |
| 218 |
Max 45 |
AMC25666 |
$155.00 |
| 219 |
Max 47 |
AMC25668 |
$155.00 |
| 220 |
Max 49 |
AMC25670 |
$155.00 |
| 221 |
Max 71 |
AMC25692 |
$155.00 |
| 222 |
Max 72 |
AMC25693 |
$155.00 |
| 223 |
Max 73 |
AMC25694 |
$155.00 |
| 224 |
Max 74 |
AMC25695 |
$155.00 |
| 225 |
Max 75 |
AMC25696 |
$155.00 |
| 226 |
Max 76 |
AMC25697 |
$155.00 |
| 227 |
Max 77 |
AMC25698 |
$155.00 |
| 228 |
Max 78 |
AMC25699 |
$155.00 |
| 229 |
Max 79 |
AMC25700 |
$155.00 |
| 230 |
Max 80 |
AMC25701 |
$155.00 |
| 231 |
Max 81 |
AMC25702 |
$155.00 |
| 232 |
Max 82 |
AMC25703 |
$155.00 |
| 233 |
Max 83 |
AMC25704 |
$155.00 |
| 234 |
Max 84 |
AMC25705 |
$155.00 |
| 235 |
Max 85 |
AMC25706 |
$155.00 |
| 236 |
Max 86 |
AMC25707 |
$155.00 |
| 237 |
Max 87 |
AMC25708 |
$155.00 |
| 238 |
Max 88 |
AMC25709 |
$155.00 |
| 239 |
Max 89 |
AMC25710 |
$155.00 |
| 240 |
Max 90 |
AMC25711 |
$155.00 |
| 241 |
Max 91 |
AMC25712 |
$155.00 |
| 242 |
Max 93 |
AMC25714 |
$155.00 |
| 243 |
Max 95 |
AMC25716 |
$155.00 |
| 244 |
Max 97 |
AMC25718 |
$155.00 |
| 245 |
Max 99 |
AMC25720 |
$155.00 |
| 246 |
Max 101 |
AMC25722 |
$155.00 |
| 247 |
Max 102 |
AMC25723 |
$155.00 |
| 248 |
Max 103 |
AMC25724 |
$155.00 |
| 249 |
Max 104 |
AMC25725 |
$155.00 |
| 250 |
Max 105 |
AMC25726 |
$155.00 |
Page 30-9
|
|
Rosemont Project |
| Form
43-101F1 Technical Report |
| COUNT |
UNPATENTED CLAIM NAME |
BLM SERIAL NUMBER |
ANNUAL FEE |
| 251 |
Max 106 |
AMC25727 |
$155.00 |
| 252 |
Max 107 |
AMC25728 |
$155.00 |
| 253 |
Max 108 |
AMC25729 |
$155.00 |
| 254 |
Max 109 |
AMC25730 |
$155.00 |
| 255 |
Max 110 |
AMC25731 |
$155.00 |
| 256 |
Max 111 |
AMC25732 |
$155.00 |
| 257 |
Max 112 |
AMC25733 |
$155.00 |
| 258 |
Max 113 |
AMC25734 |
$155.00 |
| 259 |
Max 114 |
AMC25735 |
$155.00 |
| 260 |
Max 115 |
AMC25736 |
$155.00 |
| 261 |
Max 116 |
AMC25737 |
$155.00 |
| 262 |
Max 117 |
AMC25738 |
$155.00 |
| 263 |
Max 118 |
AMC25739 |
$155.00 |
| 264 |
Max 119 |
AMC25740 |
$155.00 |
| 265 |
Max 120 |
AMC25741 |
$155.00 |
| 266 |
Elk 1 |
AMC27423 |
$155.00 |
| 267 |
Elk 2 |
AMC27424 |
$155.00 |
| 268 |
Elk 3 |
AMC27425 |
$155.00 |
| 269 |
Elk 4 |
AMC27426 |
$155.00 |
| 270 |
Elk 5 |
AMC27427 |
$155.00 |
| 271 |
Elk 6 |
AMC27428 |
$155.00 |
| 272 |
Elk 35 |
AMC27451 |
$155.00 |
| 273 |
Elk 36 |
AMC27452 |
$155.00 |
| 274 |
Elk 37 |
AMC27453 |
$155.00 |
| 275 |
Elk 39 |
AMC27455 |
$155.00 |
| 276 |
Elk 41 |
AMC27457 |
$155.00 |
| 277 |
Elk 43 |
AMC27459 |
$155.00 |
| 278 |
Elk 45 |
AMC27461 |
$155.00 |
| 279 |
Elk 70 |
AMC27465 |
$155.00 |
| 280 |
Elk 71 |
AMC27466 |
$155.00 |
| 281 |
Elk 72 |
AMC27467 |
$155.00 |
| 282 |
Elk 73 |
AMC27468 |
$155.00 |
| 283 |
Elk 74 |
AMC27469 |
$155.00 |
| 284 |
Elk 75 |
AMC27470 |
$155.00 |
| 285 |
Elk 76 |
AMC27471 |
$155.00 |
| 286 |
Elk 77 |
AMC27472 |
$155.00 |
| 287 |
Elk 78 |
AMC27473 |
$155.00 |
| 288 |
Elk 79 |
AMC27474 |
$155.00 |
| 289 |
Elk 80 |
AMC27475 |
$155.00 |
| 290 |
Elk 81 |
AMC27476 |
$155.00 |
| 291 |
Elk 83 |
AMC27478 |
$155.00 |
| 292 |
Elk 85 |
AMC27480 |
$155.00 |
| 293 |
Elk 87 |
AMC27482 |
$155.00 |
| 294 |
Alpine #5 |
AMC27513 |
$155.00 |
| 295 |
Alpine #6 |
AMC27514 |
$155.00 |
| 296 |
Alpine #7 |
AMC27515 |
$155.00 |
| 297 |
Alpine #8 |
AMC27516 |
$155.00 |
| 298 |
Alpine #9 |
AMC27517 |
$155.00 |
| 299 |
Alpine #10 |
AMC27518 |
$155.00 |
| 300 |
Alpine #11 |
AMC27519 |
$155.00 |
Page 30-10
|
|
Rosemont Project |
| Form
43-101F1 Technical Report |
| COUNT |
UNPATENTED CLAIM NAME |
BLM SERIAL NUMBER |
ANNUAL FEE |
| 301 |
Alpine #12 |
AMC27520 |
$155.00 |
| 302 |
Alpine #13 |
AMC27521 |
$155.00 |
| 303 |
Alpine #14 |
AMC27522 |
$155.00 |
| 304 |
Alpine #15 |
AMC27523 |
$155.00 |
| 305 |
Alpine #16 |
AMC27524 |
$155.00 |
| 306 |
Alpine #17 |
AMC27525 |
$155.00 |
| 307 |
Alpine #18 |
AMC27526 |
$155.00 |
| 308 |
Alpine #19 |
AMC27527 |
$155.00 |
| 309 |
Alpine #20 |
AMC27528 |
$155.00 |
| 310 |
Alpine #21 |
AMC27529 |
$155.00 |
| 311 |
Alpine #22 |
AMC27530 |
$155.00 |
| 312 |
Alpine #23 |
AMC27531 |
$155.00 |
| 313 |
Alpine #24 |
AMC27532 |
$155.00 |
| 314 |
Santa Rita Wedge |
AMC28871 |
$155.00 |
| 315 |
Buzzard No. 5 |
AMC36021 |
$155.00 |
| 316 |
Shadow #4 |
AMC36025 |
$155.00 |
| 317 |
John 1 |
AMC36026 |
$155.00 |
| 318 |
John 2 |
AMC36027 |
$155.00 |
| 319 |
Flying Dutchman No. 2 |
AMC36028 |
$155.00 |
| 320 |
Flying Dutchman No. 3 |
AMC36029 |
$155.00 |
| 321 |
Flying Dutchman No. 4 |
AMC36030 |
$155.00 |
| 322 |
Flying Dutchman No. 5 |
AMC36031 |
$155.00 |
| 323 |
Flying Dutchman No. 6 |
AMC36032 |
$155.00 |
| 324 |
Black Bess No. 2 |
AMC36034 |
$155.00 |
| 325 |
K.W.L. |
AMC36036 |
$155.00 |
| 326 |
G.E.J. |
AMC36037 |
$155.00 |
| 327 |
R.F.E. |
AMC36038 |
$155.00 |
| 328 |
R.C.M. |
AMC36039 |
$155.00 |
| 329 |
Sycamore #1 |
AMC36040 |
$155.00 |
| 330 |
Sycamore #2 |
AMC36041 |
$155.00 |
| 331 |
Sycamore #3 |
AMC36042 |
$155.00 |
| 332 |
Sycamore #4 |
AMC36043 |
$155.00 |
| 333 |
Sycamore #5 |
AMC36044 |
$155.00 |
| 334 |
Sycamore #6 |
AMC36045 |
$155.00 |
| 335 |
Sycamore #7 |
AMC36046 |
$155.00 |
| 336 |
Sycamore #8 |
AMC36047 |
$155.00 |
| 337 |
Sycamore #9 |
AMC36048 |
$155.00 |
| 338 |
Sycamore #10 |
AMC36049 |
$155.00 |
| 339 |
Sycamore #11 |
AMC36050 |
$155.00 |
| 340 |
Sycamore #12 |
AMC36051 |
$155.00 |
| 341 |
Naragansett Extension #1 |
AMC36052 |
$155.00 |
| 342 |
Naragansett Ext. #2 |
AMC36053 |
$155.00 |
| 343 |
Naragansett Extension #3 |
AMC36054 |
$155.00 |
| 344 |
Naragansett Extension #4 |
AMC36055 |
$155.00 |
| 345 |
Naragansett Extension #5 |
AMC36056 |
$155.00 |
| 346 |
Naragansett Extension #6 |
AMC36057 |
$155.00 |
| 347 |
Naragansett Extension #7 |
AMC36058 |
$155.00 |
| 348 |
Naragansett Extension #8 |
AMC36059 |
$155.00 |
| 349 |
Narragansett Ext. No. 9 |
AMC36060 |
$155.00 |
| 350 |
Schwab Extension #1 North West |
AMC36061 |
$155.00 |
Page 30-11
|
|
Rosemont Project |
| Form
43-101F1 Technical Report |
| COUNT |
UNPATENTED CLAIM NAME |
BLM SERIAL NUMBER |
ANNUAL FEE |
| 351 |
Rocky 1 |
AMC36062 |
$155.00 |
| 352 |
Amole No. 2 |
AMC36063 |
$155.00 |
| 353 |
Falls No. 3 |
AMC36065 |
$155.00 |
| 354 |
Falls No. 4 |
AMC36066 |
$155.00 |
| 355 |
Perry No. 1 |
AMC36067 |
$155.00 |
| 356 |
Perry #2 |
AMC36068 |
$155.00 |
| 357 |
Perry #3 |
AMC36069 |
$155.00 |
| 358 |
Perry #4 |
AMC36070 |
$155.00 |
| 359 |
Perry #7 |
AMC36073 |
$155.00 |
| 360 |
Perry #8 |
AMC36074 |
$155.00 |
| 361 |
Perry #9 |
AMC36075 |
$155.00 |
| 362 |
Perry #10 |
AMC36076 |
$155.00 |
| 363 |
Perry #11 |
AMC36077 |
$155.00 |
| 364 |
Perry #12 |
AMC36078 |
$155.00 |
| 365 |
Perry #15 |
AMC36081 |
$155.00 |
| 366 |
Perry #16 |
AMC36082 |
$155.00 |
| 367 |
Perry #17 |
AMC36083 |
$155.00 |
| 368 |
Perry #18 |
AMC36084 |
$155.00 |
| 369 |
Gunsite 1-A |
AMC36086 |
$155.00 |
| 370 |
Gunsite No. 2 |
AMC36087 |
$155.00 |
| 371 |
Gunsite No. 3 |
AMC36088 |
$155.00 |
| 372 |
Gunsite No. 4 |
AMC36089 |
$155.00 |
| 373 |
Gunsite 5A |
AMC36090 |
$155.00 |
| 374 |
Gunsite 6-B |
AMC36091 |
$155.00 |
| 375 |
Gunsite No. 7 |
AMC36092 |
$155.00 |
| 376 |
Gunsite 7A |
AMC36093 |
$155.00 |
| 377 |
Gunsite No. 8 |
AMC36094 |
$155.00 |
| 378 |
Gunsite No. 9 |
AMC36095 |
$155.00 |
| 379 |
Gunsite No. 10 |
AMC36096 |
$155.00 |
| 380 |
Gunsite No. 11 |
AMC36097 |
$155.00 |
| 381 |
Gunsite No. 12 |
AMC36098 |
$155.00 |
| 382 |
Gunsite No. 13 |
AMC36099 |
$155.00 |
| 383 |
Gunsite No. 14 |
AMC36100 |
$155.00 |
| 384 |
Gunsite No. 15 |
AMC36101 |
$155.00 |
| 385 |
Gunsite No. 16 |
AMC36102 |
$155.00 |
| 386 |
Gunsite No. 17 |
AMC36103 |
$155.00 |
| 387 |
Gunsite No. 18 |
AMC36104 |
$155.00 |
| 388 |
Gunsite No. 19 |
AMC36105 |
$155.00 |
| 389 |
Gunsite No. 20 |
AMC36106 |
$155.00 |
| 390 |
Gunsite No. 21 |
AMC36107 |
$155.00 |
| 391 |
Gunsite No. 22 |
AMC36108 |
$155.00 |
| 392 |
Gunsight No. 23 |
AMC36109 |
$155.00 |
| 393 |
Gunsite No. 24 |
AMC36110 |
$155.00 |
| 394 |
Gunsite No. 25 |
AMC36111 |
$155.00 |
| 395 |
Gunsite No. 26 |
AMC36112 |
$155.00 |
| 396 |
Gunsite No. 27 |
AMC36113 |
$155.00 |
| 397 |
Gunsight No. 28 |
AMC36114 |
$155.00 |
| 398 |
Gunsight No. 29 |
AMC36115 |
$155.00 |
| 399 |
Gunsight No. 30 |
AMC36116 |
$155.00 |
| 400 |
Gunsight No. 31 |
AMC36117 |
$155.00 |
Page 30-12
|
|
Rosemont Project |
| Form
43-101F1 Technical Report |
| COUNT |
UNPATENTED CLAIM NAME |
BLM SERIAL NUMBER |
ANNUAL FEE |
| 401 |
Gunsight No. 32 |
AMC36118 |
$155.00 |
| 402 |
Gunsight No. 33 |
AMC36119 |
$155.00 |
| 403 |
Gunsight No. 35 |
AMC36121 |
$155.00 |
| 404 |
Gunsight No. 36 |
AMC36122 |
$155.00 |
| 405 |
Gunsight No. 37 |
AMC36123 |
$155.00 |
| 406 |
Gunsight No. 38 |
AMC36124 |
$155.00 |
| 407 |
Gunsight No. 39 |
AMC36125 |
$155.00 |
| 408 |
Gunsight No. 40 |
AMC36126 |
$155.00 |
| 409 |
Gunsight No. 41 |
AMC36127 |
$155.00 |
| 410 |
Gunsight No. 42 |
AMC36128 |
$155.00 |
| 411 |
Gunsight No. 43 |
AMC36129 |
$155.00 |
| 412 |
Gunsight 44 |
AMC36130 |
$155.00 |
| 413 |
Gunsight #45 |
AMC36131 |
$155.00 |
| 414 |
Gunsight #46 |
AMC36132 |
$155.00 |
| 415 |
Gunsight #47 |
AMC36133 |
$155.00 |
| 416 |
Gunsight #48 |
AMC36134 |
$155.00 |
| 417 |
Gunsight #49 |
AMC36135 |
$155.00 |
| 418 |
Gunsight #50 |
AMC36136 |
$155.00 |
| 419 |
Williams Folly |
AMC36137 |
$155.00 |
| 420 |
Williams Folly #2 |
AMC36138 |
$155.00 |
| 421 |
Santa Rita #1 |
AMC46740 |
$155.00 |
| 422 |
Santa Rita #2 |
AMC46741 |
$155.00 |
| 423 |
Santa Rita #3 |
AMC46742 |
$155.00 |
| 424 |
Santa Rita #7 |
AMC46746 |
$155.00 |
| 425 |
Santa Rita #17 |
AMC46756 |
$155.00 |
| 426 |
Santa Rita #18 |
AMC46757 |
$155.00 |
| 427 |
Santa Rita #19 |
AMC46758 |
$155.00 |
| 428 |
Santa Rita #20 |
AMC46759 |
$155.00 |
| 429 |
Santa Rita #21 |
AMC46760 |
$155.00 |
| 430 |
Santa Rita #22 |
AMC46761 |
$155.00 |
| 431 |
Santa Rita #23 |
AMC46762 |
$155.00 |
| 432 |
Santa Rita #24 |
AMC46763 |
$155.00 |
| 433 |
Santa Rita #25 |
AMC46764 |
$155.00 |
| 434 |
Santa Rita #29 |
AMC46768 |
$155.00 |
| 435 |
Santa Rita #30 |
AMC46769 |
$155.00 |
| 436 |
Santa Rita #31 |
AMC46770 |
$155.00 |
| 437 |
Catalina #1 |
AMC46771 |
$155.00 |
| 438 |
Catalina #2 |
AMC46772 |
$155.00 |
| 439 |
Catalina #3 |
AMC46773 |
$155.00 |
| 440 |
Catalina #4 |
AMC46774 |
$155.00 |
| 441 |
Catalina #5A |
AMC46775 |
$155.00 |
| 442 |
Catalina #6A |
AMC46776 |
$155.00 |
| 443 |
Catalina #7 |
AMC46777 |
$155.00 |
| 444 |
Catalina #8 |
AMC46778 |
$155.00 |
| 445 |
Fred Bennett |
AMC46779 |
$155.00 |
| 446 |
Fred Bennett |
AMC46780 |
$155.00 |
| 447 |
Rosemont #9 |
AMC46781 |
$155.00 |
| 448 |
Rosemont #11 |
AMC46782 |
$155.00 |
| 449 |
Rosemont 11-A |
AMC46783 |
$155.00 |
| 450 |
Rosemont #12 |
AMC46784 |
$155.00 |
Page 30-13
|
|
Rosemont Project |
| Form
43-101F1 Technical Report |
| COUNT |
UNPATENTED CLAIM NAME |
BLM SERIAL NUMBER |
ANNUAL FEE |
| 451 |
Rosemont #13 |
AMC46785 |
$155.00 |
| 452 |
Rosemont #15 |
AMC46786 |
$155.00 |
| 453 |
Rosemont #16 |
AMC46787 |
$155.00 |
| 454 |
Rosemont #17 |
AMC46788 |
$155.00 |
| 455 |
Rosemont #18 |
AMC46789 |
$155.00 |
| 456 |
Rosemont 21 |
AMC46790 |
$155.00 |
| 457 |
Fred Bennett Fraction |
AMC46791 |
$155.00 |
| 458 |
Last Chance No. 3/Relocation |
AMC46794 |
$155.00 |
| 459 |
Cave |
AMC46796 |
$155.00 |
| 460 |
Strip |
AMC46800 |
$155.00 |
| 461 |
Cuba Fraction |
AMC46801 |
$155.00 |
| 462 |
Patrick Henry Fraction/Relocation |
AMC46802 |
$155.00 |
| 463 |
R. G. Ingersoll Fraction |
AMC46803 |
$155.00 |
| 464 |
Daylight Fraction |
AMC46804 |
$155.00 |
| 465 |
Travis #2 |
AMC46805 |
$155.00 |
| 466 |
Travis #3 |
AMC46806 |
$155.00 |
| 467 |
Travis #4 |
AMC46807 |
$155.00 |
| 468 |
Travis #5 |
AMC46808 |
$155.00 |
| 469 |
Travis #6 |
AMC46809 |
$155.00 |
| 470 |
Art |
AMC46810 |
$155.00 |
| 471 |
Al |
AMC46811 |
$155.00 |
| 472 |
Sam |
AMC46812 |
$155.00 |
| 473 |
Fred |
AMC46813 |
$155.00 |
| 474 |
Bert |
AMC46814 |
$155.00 |
| 475 |
Bob |
AMC46815 |
$155.00 |
| 476 |
Canyon No. 34 |
AMC47482 |
$155.00 |
| 477 |
Canyon No. 35 |
AMC47483 |
$155.00 |
| 478 |
Canyon No. 36 |
AMC47484 |
$155.00 |
| 479 |
Canyon No. 37 |
AMC47485 |
$155.00 |
| 480 |
Canyon No. 38 |
AMC47486 |
$155.00 |
| 481 |
Canyon No. 39 |
AMC47487 |
$155.00 |
| 482 |
Canyon No. 40 |
AMC47488 |
$155.00 |
| 483 |
Canyon No. 41 |
AMC47489 |
$155.00 |
| 484 |
Canyon No. 42 |
AMC47490 |
$155.00 |
| 485 |
Canyon No. 43 |
AMC47491 |
$155.00 |
| 486 |
Canyon No. 64 |
AMC47512 |
$155.00 |
| 487 |
Canyon No. 65 |
AMC47513 |
$155.00 |
| 488 |
Canyon No. 66 |
AMC47514 |
$155.00 |
| 489 |
Canyon No. 67 |
AMC47515 |
$155.00 |
| 490 |
Canyon No. 68 |
AMC47516 |
$155.00 |
| 491 |
Canyon No. 69 |
AMC47517 |
$155.00 |
| 492 |
Canyon No. 70 |
AMC47518 |
$155.00 |
| 493 |
Canyon No. 71 |
AMC47519 |
$155.00 |
| 494 |
Canyon No. 72 |
AMC47520 |
$155.00 |
| 495 |
Canyon No. 73 |
AMC47521 |
$155.00 |
| 496 |
Canyon No. 74 |
AMC47522 |
$155.00 |
| 497 |
Canyon No. 75 |
AMC47523 |
$155.00 |
| 498 |
Canyon No. 76 |
AMC47524 |
$155.00 |
| 499 |
Canyon No. 77 |
AMC47525 |
$155.00 |
| 500 |
Canyon No. 78 |
AMC47526 |
$155.00 |
Page 30-14
|
|
Rosemont Project |
| Form
43-101F1 Technical Report |
| COUNT |
UNPATENTED CLAIM NAME |
BLM SERIAL NUMBER |
ANNUAL FEE |
| 501 |
Canyon No. 79 |
AMC47527 |
$155.00 |
| 502 |
Telemeter Fraction |
AMC62785 |
$155.00 |
| 503 |
West End Fraction |
AMC62786 |
$155.00 |
| 504 |
Hattie Fraction |
AMC62787 |
$155.00 |
| 505 |
Cactus |
AMC64123 |
$155.00 |
| 506 |
Travis #7 |
AMC64124 |
$155.00 |
| 507 |
Fox #1 |
AMC64125 |
$155.00 |
| 508 |
Fox #2 |
AMC64126 |
$155.00 |
| 509 |
Fox #7 |
AMC64131 |
$155.00 |
| 510 |
Fox #13 |
AMC64133 |
$155.00 |
| 511 |
Cloud Rest |
AMC64134 |
$155.00 |
| 512 |
Big Windy |
AMC64135 |
$155.00 |
| 513 |
Big Windy Fraction |
AMC64136 |
$155.00 |
| 514 |
Blue Wing |
AMC64137 |
$155.00 |
| 515 |
Cloud Rest No. 1 |
AMC64138 |
$155.00 |
| 516 |
Kent #1 Long John |
AMC66835 |
$155.00 |
| 517 |
Kent #2 Patricia C. |
AMC66836 |
$155.00 |
| 518 |
Kent #3 Little Joe |
AMC66837 |
$155.00 |
| 519 |
Belle of Rosemont |
AMC66838 |
$155.00 |
| 520 |
John |
AMC74390 |
$155.00 |
| 521 |
Joe |
AMC74391 |
$155.00 |
| 522 |
Ben |
AMC74392 |
$155.00 |
| 523 |
Pete |
AMC74393 |
$155.00 |
| 524 |
Adolph Lewisohn |
AMC74394 |
$155.00 |
| 525 |
Adolph Lewisohn |
AMC74395 |
$155.00 |
| 526 |
Rosemont |
AMC74396 |
$155.00 |
| 527 |
Rosemont |
AMC74397 |
$155.00 |
| 528 |
Albert Steinfeld |
AMC74398 |
$155.00 |
| 529 |
Albert Steinfeld |
AMC74399 |
$155.00 |
| 530 |
Hugh Young |
AMC74400 |
$155.00 |
| 531 |
Hugh Young |
AMC74401 |
$155.00 |
| 532 |
Ethel |
AMC74402 |
$155.00 |
| 533 |
Albert |
AMC74403 |
$155.00 |
| 534 |
Rosemont #1 |
AMC74404 |
$155.00 |
| 535 |
Rosemont #2 |
AMC74405 |
$155.00 |
| 536 |
Rosemont #3 |
AMC74406 |
$155.00 |
| 537 |
Rosemont #4 |
AMC74407 |
$155.00 |
| 538 |
Rosemont #7 |
AMC74408 |
$155.00 |
| 539 |
Rosemont #8 |
AMC74409 |
$155.00 |
| 540 |
Rosemont #14 |
AMC74410 |
$155.00 |
| 541 |
Rosemont #19 |
AMC74411 |
$155.00 |
| 542 |
Rosemont #20 |
AMC74412 |
$155.00 |
| 543 |
Rosemont #20 |
AMC74413 |
$155.00 |
| 544 |
Rosemont #22 |
AMC74414 |
$155.00 |
| 545 |
Rosemont #23 |
AMC74415 |
$155.00 |
| 546 |
Rosemont #24 |
AMC74416 |
$155.00 |
| 547 |
Rosemont #25 |
AMC74417 |
$155.00 |
| 548 |
RX |
AMC74418 |
$155.00 |
| 549 |
Flying Dutchman #7A |
AMC75181 |
$155.00 |
| 550 |
Blue Point No. 2A |
AMC75182 |
$155.00 |
Page 30-15
|
|
Rosemont Project |
| Form
43-101F1 Technical Report |
| COUNT |
UNPATENTED CLAIM NAME |
BLM SERIAL NUMBER |
ANNUAL FEE |
| 551 |
Alpine #1A |
AMC75183 |
$155.00 |
| 552 |
Alpine #2A |
AMC75184 |
$155.00 |
| 553 |
Alpine #3A |
AMC75185 |
$155.00 |
| 554 |
Alpine #4A |
AMC75186 |
$155.00 |
| 555 |
Frijole VI A |
AMC95315 |
$155.00 |
| 556 |
Falcon 1A |
AMC99789 |
$155.00 |
| 557 |
Falcon 2A |
AMC99790 |
$155.00 |
| 558 |
Falcon 3A |
AMC99791 |
$155.00 |
| 559 |
Falcon 4A |
AMC99792 |
$155.00 |
| 560 |
Falcon 5A |
AMC99793 |
$155.00 |
| 561 |
Falcon 6A |
AMC99794 |
$155.00 |
| 562 |
Falcon 7A |
AMC99795 |
$155.00 |
| 563 |
Falcon 8A |
AMC99796 |
$155.00 |
| 564 |
Falcon 9A |
AMC99797 |
$155.00 |
| 565 |
Falcon 10A |
AMC99798 |
$155.00 |
| 566 |
Falcon 11A |
AMC99799 |
$155.00 |
| 567 |
Falcon 12A |
AMC99800 |
$155.00 |
| 568 |
Falcon 13A |
AMC99801 |
$155.00 |
| 569 |
Falcon 14A |
AMC99802 |
$155.00 |
| 570 |
Falcon 15A |
AMC99803 |
$155.00 |
| 571 |
Falcon 16A |
AMC99804 |
$155.00 |
| 572 |
Falcon 17A |
AMC99805 |
$155.00 |
| 573 |
Falcon 18A |
AMC99806 |
$155.00 |
| 574 |
Falcon 19A |
AMC99807 |
$155.00 |
| 575 |
Falcon 20A |
AMC99808 |
$155.00 |
| 576 |
Falcon 21A |
AMC99809 |
$155.00 |
| 577 |
Falcon 22A |
AMC99810 |
$155.00 |
| 578 |
Falcon 27A |
AMC99811 |
$155.00 |
| 579 |
Falcon 28A |
AMC99812 |
$155.00 |
| 580 |
Falcon 29A |
AMC99813 |
$155.00 |
| 581 |
Falcon 30A |
AMC99814 |
$155.00 |
| 582 |
Falcon 31A |
AMC99815 |
$155.00 |
| 583 |
Falcon 32A |
AMC99816 |
$155.00 |
| 584 |
Wasp 62A |
AMC99817 |
$155.00 |
| 585 |
Wasp 63A |
AMC99818 |
$155.00 |
| 586 |
Wasp 219A |
AMC99819 |
$155.00 |
| 587 |
Wasp 220A |
AMC99820 |
$155.00 |
| 588 |
Wasp 221A |
AMC99821 |
$155.00 |
| 589 |
Wasp 222A |
AMC99822 |
$155.00 |
| 590 |
Tecky |
AMC99823 |
$155.00 |
| 591 |
MIA 1A |
AMC117293 |
$155.00 |
| 592 |
MIA 2A |
AMC117294 |
$155.00 |
| 593 |
MIA 3A |
AMC117295 |
$155.00 |
| 594 |
MIA 4A |
AMC117296 |
$155.00 |
| 595 |
MIA 5A |
AMC117297 |
$155.00 |
| 596 |
MIA 6A |
AMC117298 |
$155.00 |
| 597 |
MIA 7A |
AMC117299 |
$155.00 |
| 598 |
MIA 8A |
AMC117300 |
$155.00 |
| 599 |
MIA 9A |
AMC117301 |
$155.00 |
| 600 |
MIA 12A |
AMC117304 |
$155.00 |
Page 30-16
|
|
Rosemont Project |
| Form
43-101F1 Technical Report |
| COUNT |
UNPATENTED CLAIM NAME |
BLM SERIAL NUMBER |
ANNUAL FEE |
| 601 |
MIA 13A |
AMC117305 |
$155.00 |
| 602 |
MIA 14A |
AMC117306 |
$155.00 |
| 603 |
BILLY C. |
AMC129394 |
$155.00 |
| 604 |
Hope-1 |
AMC303950 |
$155.00 |
| 605 |
Hope 2 |
AMC303951 |
$155.00 |
| 606 |
Hope-3 |
AMC303952 |
$155.00 |
| 607 |
Hope-4 |
AMC303953 |
$155.00 |
| 608 |
Hope-5 |
AMC303954 |
$155.00 |
| 609 |
Hope-6 |
AMC303955 |
$155.00 |
| 610 |
Hope-7 |
AMC303956 |
$155.00 |
| 611 |
Hope 8 |
AMC303957 |
$155.00 |
| 612 |
Hope-9 |
AMC303958 |
$155.00 |
| 613 |
Hope 10 |
AMC303959 |
$155.00 |
| 614 |
Hope-10A |
AMC303960 |
$155.00 |
| 615 |
Hope-11 |
AMC303961 |
$155.00 |
| 616 |
Hope-12 |
AMC303962 |
$155.00 |
| 617 |
Hope-13 |
AMC303963 |
$155.00 |
| 618 |
Hope-14 |
AMC303964 |
$155.00 |
| 619 |
Hope-15 |
AMC303965 |
$155.00 |
| 620 |
Hope-16 |
AMC303966 |
$155.00 |
| 621 |
Hope-17 |
AMC303967 |
$155.00 |
| 622 |
Hope-18 |
AMC303968 |
$155.00 |
| 623 |
Hope-19 |
AMC303969 |
$155.00 |
| 624 |
Hope-20 |
AMC303970 |
$155.00 |
| 625 |
Hope-21 |
AMC303971 |
$155.00 |
| 626 |
Hope-22 |
AMC303972 |
$155.00 |
| 627 |
Hope 23 |
AMC303973 |
$155.00 |
| 628 |
Hope-24 |
AMC303974 |
$155.00 |
| 629 |
Hope-25 |
AMC303975 |
$155.00 |
| 630 |
Hope-26 |
AMC303976 |
$155.00 |
| 631 |
Hope-27 |
AMC303977 |
$155.00 |
| 632 |
Hope-28 |
AMC303978 |
$155.00 |
| 633 |
H-29 |
AMC303979 |
$155.00 |
| 634 |
Hope-30 |
AMC303980 |
$155.00 |
| 635 |
Hope-31 |
AMC303981 |
$155.00 |
| 636 |
Hope 32 |
AMC303982 |
$155.00 |
| 637 |
Hope-33 |
AMC303983 |
$155.00 |
| 638 |
Hope-34 |
AMC303984 |
$155.00 |
| 639 |
Hope-35 |
AMC303985 |
$155.00 |
| 640 |
Hope-36 |
AMC303986 |
$155.00 |
| 641 |
Hope-37 |
AMC303987 |
$155.00 |
| 642 |
H-38A |
AMC313532 |
$155.00 |
| 643 |
H-39A |
AMC313533 |
$155.00 |
| 644 |
H-40A |
AMC313534 |
$155.00 |
| 645 |
H-41A |
AMC313535 |
$155.00 |
| 646 |
H-42A |
AMC313536 |
$155.00 |
| 647 |
H-43A |
AMC313537 |
$155.00 |
| 648 |
H-44A |
AMC313538 |
$155.00 |
| 649 |
H-45A |
AMC313539 |
$155.00 |
| 650 |
H-46A |
AMC313540 |
$155.00 |
Page 30-17
|
|
Rosemont Project |
| Form
43-101F1 Technical Report |
| COUNT |
UNPATENTED CLAIM NAME |
BLM SERIAL NUMBER |
ANNUAL FEE |
| 651 |
H-47A |
AMC313541 |
$155.00 |
| 652 |
H-48A |
AMC313542 |
$155.00 |
| 653 |
H-49A |
AMC313543 |
$155.00 |
| 654 |
H-50A |
AMC313544 |
$155.00 |
| 655 |
H-51A |
AMC313545 |
$155.00 |
| 656 |
H-52A |
AMC313546 |
$155.00 |
| 657 |
H-53A |
AMC313547 |
$155.00 |
| 658 |
H-54A |
AMC313548 |
$155.00 |
| 659 |
H-55A |
AMC313549 |
$155.00 |
| 660 |
H-56A |
AMC313550 |
$155.00 |
| 661 |
H-57A |
AMC313551 |
$155.00 |
| 662 |
H-58A |
AMC313552 |
$155.00 |
| 663 |
H-59A |
AMC313553 |
$155.00 |
| 664 |
H-60A |
AMC313554 |
$155.00 |
| 665 |
H-61A |
AMC313555 |
$155.00 |
| 666 |
H-62A |
AMC313556 |
$155.00 |
| 667 |
H-63A |
AMC313557 |
$155.00 |
| 668 |
H-64A |
AMC313558 |
$155.00 |
| 669 |
H-65A |
AMC313559 |
$155.00 |
| 670 |
H-66A |
AMC313560 |
$155.00 |
| 671 |
H-67A |
AMC313561 |
$155.00 |
| 672 |
H-68A |
AMC313562 |
$155.00 |
| 673 |
H-69A |
AMC313563 |
$155.00 |
| 674 |
H-70A |
AMC313564 |
$155.00 |
| 675 |
H-71A |
AMC313565 |
$155.00 |
| 676 |
H-72A |
AMC313566 |
$155.00 |
| 677 |
H-73A |
AMC313567 |
$155.00 |
| 678 |
H-74A |
AMC313568 |
$155.00 |
| 679 |
H-75A |
AMC313569 |
$155.00 |
| 680 |
H-76A |
AMC313570 |
$155.00 |
| 681 |
H-77A |
AMC313571 |
$155.00 |
| 682 |
H-78A |
AMC313572 |
$155.00 |
| 683 |
H-79A |
AMC313573 |
$155.00 |
| 684 |
H-80A |
AMC313574 |
$155.00 |
| 685 |
H-81A |
AMC313575 |
$155.00 |
| 686 |
H-82A |
AMC313576 |
$155.00 |
| 687 |
H-83A |
AMC313577 |
$155.00 |
| 688 |
H-84A |
AMC313578 |
$155.00 |
| 689 |
H-85A |
AMC313579 |
$155.00 |
| 690 |
H-86A |
AMC313580 |
$155.00 |
| 691 |
H-87A |
AMC313581 |
$155.00 |
| 692 |
H-88A |
AMC313582 |
$155.00 |
| 693 |
H-89A |
AMC313583 |
$155.00 |
| 694 |
H-90A |
AMC313584 |
$155.00 |
| 695 |
H-91A |
AMC313585 |
$155.00 |
| 696 |
H-92A |
AMC313586 |
$155.00 |
| 697 |
H-93A |
AMC313587 |
$155.00 |
| 698 |
H-94A |
AMC313588 |
$155.00 |
| 699 |
H-95A |
AMC313589 |
$155.00 |
| 700 |
H-96A |
AMC313590 |
$155.00 |
Page 30-18
|
|
Rosemont Project |
| Form
43-101F1 Technical Report |
| COUNT |
UNPATENTED CLAIM NAME |
BLM SERIAL NUMBER |
ANNUAL FEE |
| 701 |
H-97A |
AMC313591 |
$155.00 |
| 702 |
H-98A |
AMC313592 |
$155.00 |
| 703 |
H-99A |
AMC313593 |
$155.00 |
| 704 |
H-100A |
AMC313594 |
$155.00 |
| 705 |
H-101A |
AMC313595 |
$155.00 |
| 706 |
H-102A |
AMC313596 |
$155.00 |
| 707 |
H-103A |
AMC313597 |
$155.00 |
| 708 |
H-104A |
AMC313598 |
$155.00 |
| 709 |
H-105A |
AMC313599 |
$155.00 |
| 710 |
H-106A |
AMC313600 |
$155.00 |
| 711 |
H-107A |
AMC313601 |
$155.00 |
| 712 |
H-108A |
AMC313602 |
$155.00 |
| 713 |
H-109A |
AMC313603 |
$155.00 |
| 714 |
H-110A |
AMC313604 |
$155.00 |
| 715 |
H-111A |
AMC313605 |
$155.00 |
| 716 |
H-112A |
AMC313606 |
$155.00 |
| 717 |
H-113A |
AMC313607 |
$155.00 |
| 718 |
H-114A |
AMC313608 |
$155.00 |
| 719 |
H-115A |
AMC313609 |
$155.00 |
| 720 |
H-116A |
AMC313610 |
$155.00 |
| 721 |
H-117A |
AMC313611 |
$155.00 |
| 722 |
H-118A |
AMC313612 |
$155.00 |
| 723 |
H-119A |
AMC313613 |
$155.00 |
| 724 |
H-120A |
AMC313614 |
$155.00 |
| 725 |
H-121A |
AMC313615 |
$155.00 |
| 726 |
H-122A |
AMC313616 |
$155.00 |
| 727 |
H-123A |
AMC313617 |
$155.00 |
| 728 |
H-124A |
AMC313618 |
$155.00 |
| 729 |
H-125A |
AMC313619 |
$155.00 |
| 730 |
H-126A |
AMC313620 |
$155.00 |
| 731 |
H-127A |
AMC313621 |
$155.00 |
| 732 |
H-128A |
AMC313622 |
$155.00 |
| 733 |
H-129A |
AMC313623 |
$155.00 |
| 734 |
H-130A |
AMC313624 |
$155.00 |
| 735 |
H-131A |
AMC313625 |
$155.00 |
| 736 |
H-132A |
AMC313626 |
$155.00 |
| 737 |
H-133A |
AMC313627 |
$155.00 |
| 738 |
H-134A |
AMC313628 |
$155.00 |
| 739 |
H-135A |
AMC313629 |
$155.00 |
| 740 |
H-136A |
AMC313630 |
$155.00 |
| 741 |
H-137A |
AMC313631 |
$155.00 |
| 742 |
H-138A |
AMC313632 |
$155.00 |
| 743 |
H-139A |
AMC313633 |
$155.00 |
| 744 |
H-140A |
AMC313634 |
$155.00 |
| 745 |
H-141A |
AMC313635 |
$155.00 |
| 746 |
H-142A |
AMC313636 |
$155.00 |
| 747 |
H-143A |
AMC313637 |
$155.00 |
| 748 |
H-144A |
AMC313638 |
$155.00 |
| 749 |
H-145A |
AMC313639 |
$155.00 |
| 750 |
H-146A |
AMC313640 |
$155.00 |
Page 30-19
|
|
Rosemont Project |
| Form
43-101F1 Technical Report |
| COUNT |
UNPATENTED CLAIM NAME |
BLM SERIAL NUMBER |
ANNUAL FEE |
| 751 |
H-147A |
AMC313641 |
$155.00 |
| 752 |
H-148A |
AMC313642 |
$155.00 |
| 753 |
H-149A |
AMC313643 |
$155.00 |
| 754 |
H-150A |
AMC313644 |
$155.00 |
| 755 |
H-151A |
AMC313645 |
$155.00 |
| 756 |
H-152A |
AMC313646 |
$155.00 |
| 757 |
H-153A |
AMC313647 |
$155.00 |
| 758 |
H-154A |
AMC313648 |
$155.00 |
| 759 |
H-155A |
AMC313649 |
$155.00 |
| 760 |
H-156A |
AMC313650 |
$155.00 |
| 761 |
H-157A |
AMC313651 |
$155.00 |
| 762 |
H-158A |
AMC313652 |
$155.00 |
| 763 |
H-159A |
AMC313653 |
$155.00 |
| 764 |
H-160A |
AMC313654 |
$155.00 |
| 765 |
H-161A |
AMC313655 |
$155.00 |
| 766 |
H-162A |
AMC313656 |
$155.00 |
| 767 |
H-163A |
AMC313657 |
$155.00 |
| 768 |
H-164A |
AMC313658 |
$155.00 |
| 769 |
H-165A |
AMC313659 |
$155.00 |
| 770 |
H-166A |
AMC313660 |
$155.00 |
| 771 |
H-167A |
AMC313661 |
$155.00 |
| 772 |
H-168A |
AMC313662 |
$155.00 |
| 773 |
H-169A |
AMC313663 |
$155.00 |
| 774 |
H-170A |
AMC313664 |
$155.00 |
| 775 |
H-171A |
AMC313665 |
$155.00 |
| 776 |
H-177A |
AMC313671 |
$155.00 |
| 777 |
H-178A |
AMC313672 |
$155.00 |
| 778 |
H-179A |
AMC313673 |
$155.00 |
| 779 |
H-180A |
AMC313674 |
$155.00 |
| 780 |
H-181A |
AMC313675 |
$155.00 |
| 781 |
H-182A |
AMC313676 |
$155.00 |
| 782 |
H-183A |
AMC313677 |
$155.00 |
| 783 |
H-187A |
AMC313678 |
$155.00 |
| 784 |
H-188A |
AMC313679 |
$155.00 |
| 785 |
H-189A |
AMC313680 |
$155.00 |
| 786 |
H-190A |
AMC313681 |
$155.00 |
| 787 |
H-191A |
AMC313682 |
$155.00 |
| 788 |
H-192A |
AMC313683 |
$155.00 |
| 789 |
H-194A |
AMC313684 |
$155.00 |
| 790 |
H-195A |
AMC313685 |
$155.00 |
| 791 |
H-196A |
AMC313686 |
$155.00 |
| 792 |
H-197A |
AMC313687 |
$155.00 |
| 793 |
H-198A |
AMC313688 |
$155.00 |
| 794 |
H-199A |
AMC313689 |
$155.00 |
| 795 |
Hope No. 201 |
AMC330891 |
$155.00 |
| 796 |
Hope 201A |
AMC330892 |
$155.00 |
| 797 |
Hope No. 202 |
AMC330893 |
$155.00 |
| 798 |
Hope No. 203 |
AMC330894 |
$155.00 |
| 799 |
Hope No. 204 |
AMC330895 |
$155.00 |
| 800 |
Hope No. 205 |
AMC330896 |
$155.00 |
Page 30-20
|
|
Rosemont Project |
| Form
43-101F1 Technical Report |
| COUNT |
UNPATENTED CLAIM NAME |
BLM SERIAL NUMBER |
ANNUAL FEE |
| 801 |
Hope No. 206 |
AMC330897 |
$155.00 |
| 802 |
Hope No. 207 |
AMC330898 |
$155.00 |
| 803 |
Hope No. 208 |
AMC330899 |
$155.00 |
| 804 |
Hope No. 209 |
AMC330900 |
$155.00 |
| 805 |
Hope No. 210 |
AMC330901 |
$155.00 |
| 806 |
Hope No. 211 |
AMC330902 |
$155.00 |
| 807 |
Hope No. 212 |
AMC330903 |
$155.00 |
| 808 |
Hope No. 213 |
AMC330904 |
$155.00 |
| 809 |
Hope No. 214 |
AMC330905 |
$155.00 |
| 810 |
Hope No. 215 |
AMC330906 |
$155.00 |
| 811 |
Hope No. 216 |
AMC330907 |
$155.00 |
| 812 |
Hope No. 222 |
AMC330910 |
$155.00 |
| 813 |
Hope No. 223 |
AMC330911 |
$155.00 |
| 814 |
Hope No. 224 |
AMC330912 |
$155.00 |
| 815 |
Hope No. 225 |
AMC330913 |
$155.00 |
| 816 |
Hope 226A |
AMC330914 |
$155.00 |
| 817 |
Hope 227A |
AMC330915 |
$155.00 |
| 818 |
Hope 228A |
AMC330916 |
$155.00 |
| 819 |
Hope 229A |
AMC330917 |
$155.00 |
| 820 |
Hope No. 230 |
AMC330918 |
$155.00 |
| 821 |
Hope No. 231 |
AMC330919 |
$155.00 |
| 822 |
Hope No. 232 |
AMC330920 |
$155.00 |
| 823 |
Hope No. 233 |
AMC330921 |
$155.00 |
| 824 |
Hope No. 234 |
AMC330922 |
$155.00 |
| 825 |
Hope No. 235 |
AMC330923 |
$155.00 |
| 826 |
Hope No. 236 |
AMC330924 |
$155.00 |
| 827 |
Hope No. 237 |
AMC330925 |
$155.00 |
| 828 |
Hope No. 238 |
AMC330926 |
$155.00 |
| 829 |
Hope No. 239 |
AMC330927 |
$155.00 |
| 830 |
Hope No. 240 |
AMC330928 |
$155.00 |
| 831 |
Hope No. 241 |
AMC330929 |
$155.00 |
| 832 |
Hope No. 242 |
AMC330930 |
$155.00 |
| 833 |
Hope No. 243 |
AMC330931 |
$155.00 |
| 834 |
Hope No. 244 |
AMC330932 |
$155.00 |
| 835 |
Hope No. 245 |
AMC330933 |
$155.00 |
| 836 |
Hope No. 246 |
AMC330934 |
$155.00 |
| 837 |
Hope No. 250 |
AMC330935 |
$155.00 |
| 838 |
Hope No. 251 |
AMC330936 |
$155.00 |
| 839 |
Hope No. 252 |
AMC330937 |
$155.00 |
| 840 |
Hope No. 253 |
AMC330938 |
$155.00 |
| 841 |
Hope No. 254 |
AMC330939 |
$155.00 |
| 842 |
Hope No. 255 |
AMC330940 |
$155.00 |
| 843 |
Hope No. 256 |
AMC330941 |
$155.00 |
| 844 |
Hope No. 257 |
AMC330942 |
$155.00 |
| 845 |
Elk 47/Relocation |
AMC330943 |
$155.00 |
| 846 |
H-172 B/Relocation |
AMC331308 |
$155.00 |
| 847 |
H-173 B/Relocation |
AMC331309 |
$155.00 |
| 848 |
H-174 B/Relocation |
AMC331310 |
$155.00 |
| 849 |
H-175 B/Relocation |
AMC331311 |
$155.00 |
| 850 |
H-176 B/Relocation |
AMC331312 |
$155.00 |
Page 30-21
|
|
Rosemont Project |
| Form
43-101F1 Technical Report |
| COUNT |
UNPATENTED CLAIM NAME |
BLM SERIAL NUMBER |
ANNUAL FEE |
| 851 |
MMRE |
AMC367652 |
$155.00 |
| 852 |
HV 1 |
AMC380250 |
$155.00 |
| 853 |
HV 2 |
AMC380251 |
$155.00 |
| 854 |
HV 3 |
AMC380252 |
$155.00 |
| 855 |
HV 4 |
AMC380253 |
$155.00 |
| 856 |
ROSE 1 |
AMC385174 |
$155.00 |
| 857 |
ROSE 2 |
AMC385175 |
$155.00 |
| 858 |
ROSE 3 |
AMC385176 |
$155.00 |
| 859 |
ROSE 4 |
AMC385177 |
$155.00 |
| 860 |
ROSE 5 |
AMC385178 |
$155.00 |
| 861 |
ROSE 6 |
AMC385179 |
$155.00 |
| 862 |
ROSE 7 |
AMC385180 |
$155.00 |
| 863 |
ROSE 8 |
AMC385181 |
$155.00 |
| 864 |
ROSE 9 |
AMC385182 |
$155.00 |
| 865 |
HV 6 |
AMC387231 |
$155.00 |
| 866 |
HV 7 |
AMC387232 |
$155.00 |
| 867 |
HV 8 |
AMC387233 |
$155.00 |
| 868 |
HV 9 |
AMC387234 |
$155.00 |
| 869 |
HV 10 |
AMC387235 |
$155.00 |
| 870 |
HV 11 |
AMC387236 |
$155.00 |
| 871 |
HV 12 |
AMC387237 |
$155.00 |
| 872 |
HV 13 |
AMC387238 |
$155.00 |
| 873 |
HV 23 |
AMC387241 |
$155.00 |
| 874 |
HV 24 |
AMC387242 |
$155.00 |
| 875 |
HV 25 |
AMC387243 |
$155.00 |
| 876 |
HV 16 |
AMC390077 |
$155.00 |
| 877 |
HV 17 |
AMC390078 |
$155.00 |
| 878 |
HV 18 |
AMC390079 |
$155.00 |
| 879 |
HV 19 |
AMC390080 |
$155.00 |
| 880 |
HV 20 |
AMC390081 |
$155.00 |
| 881 |
HV 21 |
AMC390082 |
$155.00 |
| 882 |
HV 22 |
AMC390083 |
$155.00 |
| 883 |
WAIT-1 |
AMC390084 |
$155.00 |
| 884 |
WAIT-2 |
AMC390085 |
$155.00 |
| 885 |
WAIT-3 |
AMC390086 |
$155.00 |
| 886 |
WAIT-4 |
AMC390087 |
$155.00 |
| 887 |
WAIT-5 |
AMC390088 |
$155.00 |
| 888 |
WAIT-6 |
AMC390089 |
$155.00 |
| 889 |
WAIT-7 |
AMC390090 |
$155.00 |
| 890 |
WAIT-8 |
AMC390091 |
$155.00 |
| 891 |
WAIT-9 |
AMC390092 |
$155.00 |
| 892 |
WAIT-10 |
AMC390093 |
$155.00 |
| 893 |
WAIT-11 |
AMC390094 |
$155.00 |
| 894 |
WAIT-12 |
AMC390095 |
$155.00 |
| 895 |
WAIT-13 |
AMC390096 |
$155.00 |
| 896 |
WAIT-14 |
AMC390097 |
$155.00 |
| 897 |
WAIT-15 |
AMC390098 |
$155.00 |
| 898 |
WAIT-16 |
AMC390099 |
$155.00 |
| 899 |
WAIT-17 |
AMC390100 |
$155.00 |
| 900 |
WAIT-18 |
AMC390101 |
$155.00 |
Page 30-22
|
|
Rosemont Project |
| Form
43-101F1 Technical Report |
| COUNT |
UNPATENTED CLAIM NAME |
BLM SERIAL NUMBER |
ANNUAL FEE |
| 901 |
WAIT-19 |
AMC390102 |
$155.00 |
| 902 |
WAIT-20 |
AMC390103 |
$155.00 |
| 903 |
WAIT-21 |
AMC390104 |
$155.00 |
| 904 |
WAIT-22 |
AMC390105 |
$155.00 |
| 905 |
WAIT-23 |
AMC390106 |
$155.00 |
| 906 |
WAIT-24 |
AMC390107 |
$155.00 |
| 907 |
WAIT-25 |
AMC390108 |
$155.00 |
| 908 |
WAIT-26 |
AMC390109 |
$155.00 |
| 909 |
WAIT-27 |
AMC390110 |
$155.00 |
| 910 |
WAIT-28 |
AMC390111 |
$155.00 |
| 911 |
WAIT-29 |
AMC390112 |
$155.00 |
| 912 |
WAIT-30 |
AMC390113 |
$155.00 |
| 913 |
WAIT-31 |
AMC390114 |
$155.00 |
| 914 |
WAIT-32 |
AMC390115 |
$155.00 |
| 915 |
FALLS FRACTION |
AMC391154 |
$155.00 |
| 916 |
H-69B |
AMC391155 |
$155.00 |
| 917 |
NO CHANCE No. 3 |
AMC391156 |
$155.00 |
| 918 |
SCHWAB FRACTION |
AMC391157 |
$155.00 |
| 919 |
H FRAC. 1 |
AMC392445 |
$155.00 |
| 920 |
H FRAC. 2 |
AMC392446 |
$155.00 |
| 921 |
H FRAC. 3 |
AMC392447 |
$155.00 |
| 922 |
H FRAC. 4 |
AMC392448 |
$155.00 |
| 923 |
H FRAC. 5 |
AMC392449 |
$155.00 |
| 924 |
H FRAC. 6 |
AMC392450 |
$155.00 |
| 925 |
H FRAC. 7 |
AMC392451 |
$155.00 |
| 926 |
H FRAC. 8 |
AMC392452 |
$155.00 |
| 927 |
BILLY FRAC. |
AMC393532 |
$155.00 |
| 928 |
DSM 1 |
AMC393533 |
$155.00 |
| 929 |
DSM 2 |
AMC393534 |
$155.00 |
| 930 |
DSM 3 |
AMC393535 |
$155.00 |
| 931 |
DSM 4 |
AMC393536 |
$155.00 |
| 932 |
DSM 5 |
AMC393537 |
$155.00 |
| 933 |
DSM 6 |
AMC393538 |
$155.00 |
| 934 |
DSM 7 |
AMC393539 |
$155.00 |
| 935 |
DSM 8 |
AMC393540 |
$155.00 |
| 936 |
DSM 9 |
AMC393541 |
$155.00 |
| 937 |
DSM 10 |
AMC393542 |
$155.00 |
| 938 |
HV5 A |
AMC393543 |
$155.00 |
| 939 |
MIA FRAC 1 |
AMC393544 |
$155.00 |
| 940 |
MIA FRAC 2 |
AMC393545 |
$155.00 |
| 941 |
SON OF GUN 34 |
AMC394006 |
$155.00 |
| 942 |
RMT FRAC 1 |
AMC394561 |
$155.00 |
| 943 |
RMT FRAC 2 |
AMC394562 |
$155.00 |
| 944 |
RMT FRAC 3 |
AMC394563 |
$155.00 |
| 945 |
RMT FRAC 4 |
AMC394564 |
$155.00 |
| 946 |
NC-CF |
AMC396422 |
$155.00 |
| 947 |
Thankful |
AMC404128 |
$155.00 |
| 948 |
RCC-1 |
AMC411964 |
$155.00 |
| 949 |
RCC-2 |
AMC411965 |
$155.00 |
| 950 |
RCC-3 |
AMC411966 |
$155.00 |
Page 30-23
|
|
Rosemont Project |
| Form
43-101F1 Technical Report |
| COUNT |
UNPATENTED CLAIM NAME |
BLM SERIAL NUMBER |
ANNUAL FEE |
| 951 |
RCC-4 |
AMC411967 |
$155.00 |
| 952 |
RCC-5 |
AMC411968 |
$155.00 |
| 953 |
RCC-6 |
AMC411969 |
$155.00 |
| 954 |
RCC-7 |
AMC411970 |
$155.00 |
| 955 |
RCC-8 |
AMC411971 |
$155.00 |
| 956 |
RCC-9 |
AMC411972 |
$155.00 |
| 957 |
RCC-10 |
AMC411973 |
$155.00 |
| 958 |
RCC-11 |
AMC411974 |
$155.00 |
| 959 |
RCC-12 |
AMC411975 |
$155.00 |
| 960 |
RCC-13 |
AMC411976 |
$155.00 |
| 961 |
RCC-14 |
AMC411977 |
$155.00 |
| 962 |
RCC-15 |
AMC411978 |
$155.00 |
| 963 |
RCC-16 |
AMC411979 |
$155.00 |
| 964 |
RCC-17 |
AMC411980 |
$155.00 |
| 965 |
RCC-18 |
AMC411981 |
$155.00 |
| 966 |
RCC-19 |
AMC411982 |
$155.00 |
| 967 |
RCC-20 |
AMC411983 |
$155.00 |
| 968 |
RCC-21 |
AMC411984 |
$155.00 |
| 969 |
RCC-22 |
AMC411985 |
$155.00 |
| 970 |
RCC-23 |
AMC411986 |
$155.00 |
| 971 |
RCC-24 |
AMC411987 |
$155.00 |
| 972 |
RCC-25 |
AMC411988 |
$155.00 |
| 973 |
RCC-26 |
AMC411989 |
$155.00 |
| 974 |
RCC-27 |
AMC411990 |
$155.00 |
| 975 |
RCC-28 |
AMC411991 |
$155.00 |
| 976 |
RCC-29 |
AMC411992 |
$155.00 |
| 977 |
RCC-30 |
AMC411993 |
$155.00 |
| 978 |
RCC-31 |
AMC411994 |
$155.00 |
| 979 |
RCC-32 |
AMC411995 |
$155.00 |
| 980 |
RCC-33 |
AMC411996 |
$155.00 |
| 981 |
RCC-34 |
AMC411997 |
$155.00 |
| 982 |
RCC-35 |
AMC411998 |
$155.00 |
| 983 |
RCC-36 |
AMC411999 |
$155.00 |
| 984 |
RCC-37 |
AMC412000 |
$155.00 |
| 985 |
RCC-38 |
AMC412001 |
$155.00 |
| 986 |
RCC-39 |
AMC412002 |
$155.00 |
| 987 |
RCC-40 |
AMC412003 |
$155.00 |
| 988 |
RCC-41 |
AMC412004 |
$155.00 |
| 989 |
RCC-42 |
AMC412005 |
$155.00 |
| 990 |
RCC-43 |
AMC412006 |
$155.00 |
| 991 |
RCC-44 |
AMC412007 |
$155.00 |
| 992 |
RCC-45 |
AMC412008 |
$155.00 |
| 993 |
RCC-46 |
AMC412009 |
$155.00 |
| 994 |
RCC-47 |
AMC412010 |
$155.00 |
| 995 |
RCC-48 |
AMC412011 |
$155.00 |
| 996 |
RCC-49 |
AMC412012 |
$155.00 |
| 997 |
RCC-50 |
AMC412013 |
$155.00 |
| 998 |
RCC-51 |
AMC412014 |
$155.00 |
| 999 |
RCC-52 |
AMC412015 |
$155.00 |
| 1000 |
RCC-53 |
AMC412016 |
$155.00 |
Page 30-24
|
|
Rosemont Project |
| Form
43-101F1 Technical Report |
| COUNT |
UNPATENTED CLAIM NAME |
BLM SERIAL NUMBER |
ANNUAL FEE |
| 1001 |
RCC-54 |
AMC412017 |
$155.00 |
| 1002 |
RCC-55 |
AMC412018 |
$155.00 |
| 1003 |
RCC-56 |
AMC412019 |
$155.00 |
| 1004 |
RCC-57 |
AMC412020 |
$155.00 |
| 1005 |
RCC-58 |
AMC412021 |
$155.00 |
| 1006 |
RCC-59 |
AMC412022 |
$155.00 |
| 1007 |
RCC-60 |
AMC412023 |
$155.00 |
| 1008 |
RCC-61 |
AMC412024 |
$155.00 |
| 1009 |
RCC-62 |
AMC412025 |
$155.00 |
| 1010 |
RCC-63 |
AMC412026 |
$155.00 |
| 1011 |
RCC-64 |
AMC412027 |
$155.00 |
| 1012 |
RCC-65 |
AMC412028 |
$155.00 |
| 1013 |
RCC-66 |
AMC412029 |
$155.00 |
| 1014 |
RCC-67 |
AMC412030 |
$155.00 |
| 1015 |
RCC-68 |
AMC412031 |
$155.00 |
| 1016 |
RCC-69 |
AMC412032 |
$155.00 |
| 1017 |
RCC-70 |
AMC412033 |
$155.00 |
| 1018 |
RCC-71 |
AMC412034 |
$155.00 |
| 1019 |
RCC-72 |
AMC412035 |
$155.00 |
| 1020 |
RCC-73 |
AMC412036 |
$155.00 |
| 1021 |
RCC-74 |
AMC412037 |
$155.00 |
| 1022 |
RCC-75 |
AMC412038 |
$155.00 |
| 1023 |
RCC-76 |
AMC412039 |
$155.00 |
| 1024 |
RCC-77 |
AMC412040 |
$155.00 |
| 1025 |
RCC-78 |
AMC412041 |
$155.00 |
| 1026 |
RCC-79 |
AMC412042 |
$155.00 |
| 1027 |
RCC-80 |
AMC412043 |
$155.00 |
| 1028 |
RCC-81 |
AMC412044 |
$155.00 |
| 1029 |
RCC-82 |
AMC412045 |
$155.00 |
| 1030 |
RCC-83 |
AMC412046 |
$155.00 |
| 1031 |
RCC-84 |
AMC412047 |
$155.00 |
| 1032 |
RCC-85 |
AMC412048 |
$155.00 |
| 1033 |
RCC-86 |
AMC412049 |
$155.00 |
| 1034 |
RCC-87 |
AMC412050 |
$155.00 |
| 1035 |
RCC-88 |
AMC412051 |
$155.00 |
| 1036 |
RCC-89 |
AMC412052 |
$155.00 |
| 1037 |
RCC-90 |
AMC412053 |
$155.00 |
| 1038 |
RCC-91 |
AMC412054 |
$155.00 |
| 1039 |
RCC-92 |
AMC412055 |
$155.00 |
| 1040 |
RCC-93 |
AMC412056 |
$155.00 |
| 1041 |
RCC-94 |
AMC412057 |
$155.00 |
| 1042 |
RCC-95 |
AMC412058 |
$155.00 |
| 1043 |
RCC-96 |
AMC412059 |
$155.00 |
| 1044 |
RCC-97 |
AMC412060 |
$155.00 |
| 1045 |
RCC-98 |
AMC412061 |
$155.00 |
| 1046 |
RCC-99 |
AMC412062 |
$155.00 |
| 1047 |
RCC-100 |
AMC412063 |
$155.00 |
| 1048 |
AGAVE-1 |
AMC412064 |
$155.00 |
| 1049 |
AGAVE-2 |
AMC412065 |
$155.00 |
| 1050 |
AGAVE-3 |
AMC412066 |
$155.00 |
Page 30-25
|
|
Rosemont Project |
| Form
43-101F1 Technical Report |
| COUNT |
UNPATENTED CLAIM NAME |
BLM SERIAL NUMBER |
ANNUAL FEE |
| 1051 |
AGAVE-4 |
AMC412067 |
$155.00 |
| 1052 |
AGAVE-5 |
AMC412068 |
$155.00 |
| 1053 |
AGAVE-6 |
AMC412069 |
$155.00 |
| 1054 |
CONTINENTAL-1 |
AMC412070 |
$155.00 |
| 1055 |
CONTINENTAL-2 |
AMC412071 |
$155.00 |
| 1056 |
CONTINENTAL-3 |
AMC412072 |
$155.00 |
| 1057 |
CONTINENTAL-4 |
AMC412073 |
$155.00 |
| 1058 |
CONTINENTAL-5 |
AMC412074 |
$155.00 |
| 1059 |
CONTINENTAL-6 |
AMC412075 |
$155.00 |
| 1060 |
TAILOR |
AMC423213 |
$155.00 |
| 1061 |
AGAVE-7 |
AMC429429 |
$155.00 |
| 1062 |
AGAVE-8 |
AMC429430 |
$155.00 |
| 1063 |
AGAVE-9 |
AMC429431 |
$155.00 |
| 1064 |
RECORDER FRACTION |
AMC429432 |
$155.00 |
| UNPATENTED CLAIM TOTALS |
$164,920.00 |
Page 30-26
|
|
Rosemont Project |
| Form
43-101F1 Technical Report |
A1-4 Rosemont Project Fee Owned (Associated) Lands
| COUNT |
PARCEL
NO. |
PROPERTY NAME |
SECTION-TOWNSHIP-RANGE |
ASSESSED
ACRES |
2015
FEES |
| 1 |
305580280 |
HELVETIA RANCH (KILGORE/ANDERSEN) |
23-18-15 |
10.080 |
$460.00 |
| 2 |
305580330 |
HELVETIA RANCH ANNEX (AVRA
VALLEY/LEBRECHT |
23-18-15 |
40.000 |
$20.53 |
| 3 |
305580350 |
HELVETIA RANCH ANNEX (DE LA OSSA) |
23-18-15 |
10.000 |
$76.72 |
| 4 |
305580360 |
HELVETIA RANCH ANNEX (AVRA
VALLEY/LEBRECHT) |
23-18-15 |
10.000 |
$12.21 |
| 5 |
305580370 |
HELVETIA RANCH ANNEX (AVRA
VALLEY/LEBRECHT) |
23-18-15 |
20.000 |
$12.21 |
| 6 |
305580420 |
HELVETIA RANCH ANNEX (MAATR) |
23-18-15 |
40.000 |
$20.53 |
| 7 |
30553002D |
HELVETIA RANCH ANNEX NORTH (TERRA
BELLA) |
10-18-15 |
20.000 |
$12.21 |
| 8 |
30553002F |
HELVETIA RANCH ANNEX NORTH (TERRA
BELLA) |
10-18-15 |
120.000 |
$61.69 |
| 9 |
30553002G |
HELVETIA RANCH ANNEX NORTH (TERRA
BELLA) |
10-18-15 |
310.000 |
$159.51 |
| 10 |
30553002H |
HELVETIA RANCH ANNEX NORTH (AVRA
VALLEY/LEBRECHT) |
10-18-15 |
108.420 |
$55.73 |
| 11 |
30553004D |
HELVETIA RANCH ANNEX (AVRA
VALLEY/LEBRECHT) |
27-18-15 |
40.000 |
$20.53 |
| 12 |
30553004H |
HELVETIA RANCH ANNEX (AVRA
VALLEY/LEBRECHT) |
27-18-15 |
40.000 |
$20.53 |
| 13 |
30556001B |
HELVETIA RANCH ANNEX NORTH (AVRA
VALLEY/LEBRECHT |
15-18-15 |
313.110 |
$161.04 |
| 14 |
30556001C |
HELVETIA RANCH ANNEX NORTH (AVRA
VALLEY/LEBRECHT) |
15-18-15 |
67.800 |
$869.00 |
| 15 |
30557004B |
HELVETIA RANCH ANNEX (AVRA
VALLEY/LEBRECHT) |
22-18-15 |
5.000 |
$12.21 |
| 16 |
30557004C |
HELVETIA RANCH ANNEX (ADC/CALICA) |
22-18-15 |
52.480 |
$12.81 |
| 17 |
30557004D |
HELVETIA RANCH (KILGORE/ANDERSEN) |
22-18-15 |
10.000 |
$87.44 |
| 18 |
30557005B |
HELVETIA RANCH ANNEX (AVRA
VALLEY/LEBRECHT) |
22-18-15 |
20.000 |
$12.21 |
| 19 |
30557013B |
HELVETIA RANCH ANNEX (AVRA
VALLEY/LEBRECHT) |
22-18-15 |
35.000 |
$18.09 |
| 20 |
30557013C |
HELVETIA RANCH ANNEX (AVRA
VALLEY/LEBRECHT) |
22-18-15 |
40.000 |
$20.53 |
| 21 |
30557013D |
HELVETIA RANCH ANNEX (SUTTLES) |
22-18-15 |
20.000 |
$341.75 |
| 22 |
30557013E |
HELVETIA RANCH ANNEX (AVRA
VALLEY/LEBRECHT) |
22-18-15 |
40.000 |
$20.53 |
| 23 |
30557022C |
HELVETIA RANCH ANNEX (MAATR) |
22-18-15 |
40.000 |
$20.53 |
| 24 |
30558034C |
HELVETIA RANCH ANNEX (PIPELINE
TRIANGLE) |
23-18-15 |
2.190 |
$12.21 |
| 25 |
30562006B |
ROSEMONT RANCH |
14-18-16 |
34.120 |
$17.31 |
| 26 |
30562007D |
ROSEMONT RANCH |
15-18-16 |
40.000 |
$20.17 |
| 27 |
30562007F |
ROSEMONT RANCH |
15-18-16 |
40.000 |
$20.17 |
| 28 |
30562007G |
ROSEMONT RANCH |
15-18-16 |
70.590 |
$35.64 |
| 29 |
30562007H |
ROSEMONT RANCH |
15-18-16 |
160.000 |
$80.97 |
| 30 |
30562008C |
ROSEMONT RANCH (HIDDEN VALLEY) |
21-18-16 |
60.150 |
$23.35 |
| 31 |
30562008F |
ROSEMONT RANCH (HIDDEN VALLEY) |
21-18-16 |
35.060 |
$380.24 |
| 32 |
30562008G |
ROSEMONT RANCH (HIDDEN VALLEY) |
21-18-16 |
5.010 |
$472.95 |
| 33 |
30562008H |
ROSEMONT RANCH (HIDDEN VALLEY |
21-18-16 |
24.880 |
$12.99 |
| 34 |
30562008J |
ROSEMONT RANCH (HIDDEN VALLEY) |
21-18-16 |
35.270 |
$13.70 |
| 35 |
30562009A |
ROSEMONT RANCH |
23-18-16 |
160.000 |
$92.38 |
| 36 |
30562011A |
ROSEMONT RANCH |
27-18-16 |
40.000 |
$23.01 |
| 37 |
30562012A |
ROSEMONT RANCH |
32-18-16 |
20.000 |
$13.70 |
| 38 |
30562012C |
ROSEMONT RANCH |
32-18-16 |
180.000 |
$3,602.68 |
| FEE OWNED (ASSOCIATED) TOTALS |
2319.160 |
$7,330.01 |
Page 30-27
|
|
Rosemont Project |
| Form
43-101F1 Technical Report |
A2-1 Permits and Authorizations
Details on permit status and authorizations for current project
activities.
| PERMIT AND AUTHORIZATIONS TABLE |
Permit
|
Lead Agency and
Description
|
Submittal Date
|
Status
|
Issue Date
|
Term
|
| Federal Permits and Authorizations Issued |
| MSHA ID Number |
Mine Safety and Health Administration |
Paperwork filed for the Rosemont Copper Project |
Issued
02-03256 |
July 21, 2010 |
|
| Hazardous Waste Identification Number |
Environmental Protection Agency (EPA) – Issued
for hazardous waste can be generated and transported off site in
quantities in excess of 100 pounds. |
Submitted Requires a contingency plan. |
Received RCRA EPA ID Number:
AZR000509976 |
Sept 14, 2011 |
Life of the facility |
| State Permits and Authorizations Issued |
| Groundwater withdrawal permits |
ADWR – Groundwater withdrawal rights |
Mineral Extraction Right |
Issued
Permit No. 59- 215979.0000 |
Jan 18, 2008 |
20 years |
| Dam Safety Permit |
ADWR – Regulates the construction and operation
of large containment structures |
Storage Analysis submitted Feb 17, 2012 for
review by State Engineer |
No permit necessary as designed |
|
|
| Well Drilling Permit |
Arizona Department of Water Resources (ADWR) –
Issued anytime drilling may intercept water table |
On-going submittals for mineral exploration,
geotechnical, and hydrologic investigation activities |
Issued for current, still needed for future
activities
Issued for current wells
55-225120
55-225121
55-225122
55-225123
55-225124
55-225125
55-225126
55-225127 |
|
Until well or borehole closed |
| Water Right for Hydrologic testing |
ADWR |
Issued for production water well testing |
Expired – June 25, 2016
55-225120
55-225121 |
June 16, 2015 |
One year |
Page 30-28
|
|
Rosemont Project |
| Form
43-101F1 Technical Report |
| PERMIT AND AUTHORIZATIONS TABLE |
| Permit |
Lead Agency and Description |
Submittal Date |
Status |
Issue Date |
Term |
|
Class II Air Permit |
ADEQ |
Application submittal on Nov 23, 2011,
Activities must follow dust control plan |
Issued
Permit no. 55223 |
Jan 31, 2013 |
Five years |
|
Aquifer Protection Permit |
Arizona Department of
Environmental Quality
(ADEQ) – Groundwater
discharge permit (includes
Landfill) |
Application submitted
to ADEQ February 27,
2009,
Administratively complete on May 21, 2009 |
Issued
Permit No. P- 106100
Place ID
135845
LTF 49639 |
April 3, 2012 |
Life of facility once issued |
|
Type 2.02
General Permit |
ADEQ – Intermediate Stockpile Permit |
Submitted for three stockpiles |
Issued
Inventory 106100
LTF(s) 54136, 54138 and 59138 |
Feb 8, 2012 and
Jun 12, 2013
All revised May 26, 2016 |
7 years
May 2, 2018 and
May 14, 2020 |
|
Type 3.03
General Permit |
ADEQ – Vehicle/Equipment Wash |
Submitted for Southwest Energy nd Vehicle Wash
2 Quarter 2011 |
Issued
Inventory 106100
USAS No 509976-03
LTF 64358
Place ID 19883 |
Sep 12, 2011
Renewal form Jul 11, 2016 |
5 years
Sept 12, 2021 |
|
Stormwater permit |
ADEQ – Regulate stormwater discharge quality |
AZPDES MSGP for all onsite activities |
Covered AZMSG 2010- 003 AZMSG- 74939 |
Feb 7, 2013 |
Five years (2015 or until new general permit
issued) |
|
Construction Stormwater General Permit |
Arizona Department of Environmental Quality
(ADEQ) – Issued for construction activities |
The Notice of Intent (NOI) was received by ADEQ
on July 10, 2015 – inactive and unstaffed status |
Covered
AZCON 86646 |
Jul 10, 2015 |
Dec 31, 2018 |
|
401
Certification |
ADEQ |
Application submitted Jan 12, 2012
Surface Water Mitigation Plan accepted Dec 2014 |
Issued
Application NO SPL-2008- 00816-MB
ADEQ LTF 55425 |
Feb 3, 2015 |
No expiration |
Page 30-29
|
|
Rosemont Project |
| Form
43-101F1 Technical Report |
| PERMIT AND AUTHORIZATIONS TABLE |
| Permit |
Lead Agency and Description |
Submittal Date |
Status |
Issue Date |
Term |
|
Arizona Mined Land Reclamation Permit |
Arizona State Mine Inspector – Permit for
reclamation activities at a site. |
Submitted planned May 2008 |
Complete |
July 10, 2009 |
Life of facility – annual updates |
|
Start-up Notice for Mine Operations |
Arizona State Mine Inspector |
Registers mine with Arizona State Mine
Inspector |
Filed |
Sept 9, 2009 |
|
|
Agricultural Land Clearing Permit |
Arizona Department of Agriculture – Permit to
clear land |
Submittal prior to construction of facilities
or disturbance of state- protected native plants |
As needed |
|
|
|
Certificate of Environmental Compatibility |
Arizona Corporation Commission and the Line
Siting Committee |
Application for power line route submitted by
Tucson Electric Power on November 2 |
Issued (to TEP)
Docket No.
L-00000C-11-
0400-00164
Case No. 164 |
CEC signed Dec 19, 2011
Approved - Mar 21,
2012
Amended - Jun 12, 2012 |
Life of facility (Certificate expires in 7
years unless line carries power.) |
|
County Permits and Authorizations Issued |
|
Pima County Flood Control District Permit |
Pima County Flood Control |
Submitted planned Nov 2013 |
Issued and renewed
FPUP 13-640 (original)
FPUP 15- 170RP (renewal) |
May 2, 2016 |
One Year from date of issue |
|
Town Permits and Authorizations Issued |
|
Right of Way Encroachment |
Town of Sahuarita |
This is a 35’ encroachment is for a waterline
along Santa Rita Road |
Issued
License Contract No.
CO13-0029 |
June 24, 2013 |
none |
Page 30-30
|
|
Rosemont Project |
| Form
43-101F1 Technical Report |
| PERMIT AND AUTHORIZATIONS TABLE |
| Permit |
Lead Agency and Description |
Submittal Date |
Status |
Issue Date |
Term |
| Federal Permits and Authorizations – NOT Issued |
|
Mine Plan of Operation |
Forest Service – This permit is needed for
mining operations on
public lands.
Because all actions are
connected to EIS produced for this the MPO is needed to start ground
disturbing activities |
Plan was submitted in
sections:
• Mine Plan of Operations
and supporting
documents
– July 11, 2007
• Reclamation Plan –
August 7, 2007
•
Infrastructure Plan –
July 25, 2007 |
Sufficient for NEPA Analysis,
NOI issued in FR Mar 13,
2008
Final EIS issue Nov 2013
Draft ROD issued Dec 2013
Supplemental BO issued Apr 22, 2016 |
|
Life of mine |
|
404 permit |
Army Corps of Engineers – Allow operations in
Waters of the U.S. There is no formal Corps delineation to date Needed for
powerline, waterline, access road and discharge activities |
Preliminary Jurisdictional Delineation
submitted in May 2009 Application for 404 permit re-submitted October 11,
2011 Habitat Mitigation and Management Plans submitted – April to Aug 2014 |
Pubic Notice published Dec 5, 2011 |
|
|
|
Hazardous Materials Transportation Permit |
Department of Transportation (DOT) – Permit
needed to transport or received “hazardous materials” under the DOT
definitions. |
Registration and plan only - will be dependent
upon construction schedule but number should be in place prior to
construction start. |
|
|
1-3 years dependent upon permit |
|
Radio Licenses |
Federal Communications Commission (FCC) |
License already exists for current on- site
use, additional uses will require additional licenses that will be managed
by the contractor (Empire) |
Issued for current use – need larger project
use license |
|
|
|
Blasting License |
Bureau of Alcohol Tobacco and Firearms |
Submittal will be dependent upon development of
on- site facilities and blasting personnel |
|
|
|
Page 30-31
|
|
Rosemont Project |
| Form
43-101F1 Technical Report |
| PERMIT AND AUTHORIZATIONS TABLE |
| Permit |
Lead Agency and Description |
Submittal Date |
Status |
Issue Date |
Term |
| State Permits and Authorizations – NOT Issued |
|
State Land Right of Way |
Arizona State Land Department |
Applications Submitted in Nov 8, 2010 All
studies, surveys, and appraisals complete |
30-day notice letters issued in August 2012
awaiting auction |
|
|
|
Encroachment Permit |
Arizona Department of Transportation |
Traffic Impact Assessment was submitted in July
2010 and the Encroachment Permit application submitted Feb 28, 2011 |
Permit in draft, issuance keyed on ROD |
|
|
|
AZPDES DeMinimis Storm water Permit |
ADEQ |
Submitted as needed for project – well
development, drilling, etc. |
Issued as necessary and closed when not in use |
|
|
|
Septic System APP |
ADEQ – Onsite Wastewater Permit |
Awaiting design and percolation testing |
|
|
Life of facility (will be combined with
facility- wide APP) |
|
Hazardous Waste Identification Number |
ADEQ – Issued by EPA/ADEQ so hazardous waste
can be generated and transported off site in quantities in excess of 100
pounds. |
RCRA EPA ID Number: AZR000509976 Requires a
contingency plan. |
Issued – need to register number with State
when activities start |
|
Life of the facility |
|
County Permits and Authorizations – NOT Issued |
|
Hazardous Waste Management |
PCDEQ – registration with PCDEQ for all EPA ID
Nos. |
RCRA EPA ID Number: AZR000509976 |
Issued – need to register number with County
when activities start |
|
Life of facility |
|
Drinking Water System Registration |
PCDEQ – system plans need to be approved prior
to installation, registration for all non-community non-transient drinking
water systems |
Submittal prior to construction of system.
Sampling and emergency plans required. |
|
|
|
Page 30-32