UNITED STATES
SECURITIES AND EXCHANGE COMMISSION
Washington, D.C. 20549
FORM 10-K
(Mark One)
ANNUAL REPORT PURSUANT TO SECTION 13 OR 15(d) OF THE SECURITIES EXCHANGE ACT OF 1934 | |
For the Fiscal Year Ended February 1, 2020
or
TRANSITION REPORT PURSUANT TO SECTION 13 OR 15(d) OF THE SECURITIES EXCHANGE ACT OF 1934 | |
For the transition period from | to | ||
Commission file number 1-32545
(Exact name of registrant as specified in its charter) |
(State or other jurisdiction of incorporation or organization) | (I.R.S. Employer Identification No.) | |||
(Address of principal executive offices) | (Zip Code) | |||
Registrant's telephone number, including area code: (614) 237-7100
Securities registered pursuant to Section 12(b) of the Act:
Title of each class | Trading Symbol | Name of each exchange on which registered |
Securities registered pursuant to Section 12(g) of the Act: None
Indicate by check mark if the registrant is a well-known seasoned issuer, as defined in Rule 405 of the Securities Act. ☑ Yes ☐ No
Indicate by check mark if the registrant is not required to file reports pursuant to Section 13 or Section 15(d) of the Act. ☐ Yes ☑ No
Indicate by check mark whether the registrant (1) has filed all reports required to be filed by Section 13 or 15(d) of the Securities Exchange Act of 1934 during the preceding 12 months (or for such shorter period that the registrant was required to file such reports), and (2) has been subject to such filing requirements for the past 90 days. ☑ Yes ☐ No
Indicate by check mark whether the registrant has submitted electronically every Interactive Data File required to be submitted pursuant to Rule 405 of Regulation S-T (§ 232.405 of this chapter) during the preceding 12 months (or for such shorter period that the registrant was required to submit such files). ☑ Yes ☐ No
Indicate by check mark whether the registrant is a large accelerated filer, an accelerated filer, a non-accelerated filer, a smaller reporting company, or an emerging growth company. See definitions of "large accelerated filer," "accelerated filer," "smaller reporting company," and "emerging growth company" in Rule 12b-2 of the Exchange Act.
☑ | Accelerated filer | ☐ | |||||
Non-accelerated filer | ☐ | Smaller reporting company | |||||
Emerging growth company | |||||||
If an emerging growth company, indicate by check mark if the registrant has elected not to use the extended transition period for complying with any new or revised financial accounting standards provided pursuant to Section 13(a) of the Exchange Act. ☐
Indicate by check mark whether the registrant is a shell company (as defined in Rule 12b-2 of the Exchange Act). ☐ Yes ☑ No
The aggregate market value of voting stock held by non-affiliates of the registrant computed by reference to the price at which such voting stock was last sold, as of August 3, 2019, was $1,037,727,844 .
Number of shares outstanding of each of the registrant's classes of common stock, as of April 24, 2020: 64,291,421 Class A common shares and 7,732,786 Class B common shares.
DOCUMENTS INCORPORATED BY REFERENCE
Portions of the Registrant's definitive proxy statement relating to the 2020 Annual Meeting of Shareholders are incorporated by reference into Part III of this Annual Report on
Form 10-K.
DESIGNER BRANDS INC.
TABLE OF CONTENTS
Page | |
PART I | |
PART II | |
PART III | |
PART IV | |
All references to "we," "us," "our," "Designer Brands Inc.," or the "Company" in this Annual Report on Form 10-K mean Designer Brands Inc. and its subsidiaries.
We own many trademarks and service marks. This Annual Report on Form 10-K may contain trademarks, trade dress, and tradenames of other companies. Use or display of other parties' trademarks, trade dress or tradenames is not intended to and does not imply a relationship with the trademark, trade dress or tradename owner.
i
DESIGNER BRANDS INC.
TABLE OF CONTENTS TO FINANCIAL STATEMENTS
Page | |
ii
Cautionary Statement Regarding Forward-Looking Information for Purposes of the "Safe Harbor" Provisions of the Private Securities Litigation Reform Act of 1995
Certain statements in this Annual Report on Form 10-K may constitute forward-looking statements and are made pursuant to the safe harbor provisions of the Private Securities Litigation Reform Act of 1995, which reflect our current views with respect to, among other things, future events and financial performance. Examples of such forward-looking statements include references to our future expansion and our acquisitions. You can identify these forward-looking statements by the use of forward-looking words such as "outlook," "believes," "expects," "potential," "continues," "may," "will," "should," "would," "seeks," "approximately," "predicts," "intends," "plans," "estimates," "anticipates," or the negative version of those words or other comparable words. Any forward-looking statements contained in this Annual Report on Form 10-K are based upon current plans, estimates, expectations and assumptions relating to our operations, results of operations, financial condition, growth strategy and liquidity. The inclusion of this forward-looking information should not be regarded as a representation by us or any other person that the future plans, estimates or expectations contemplated by us will be achieved. Such forward-looking statements are subject to numerous risks, uncertainties and other factors that may cause actual results, performance or achievements to be materially different from any future results, performance or achievements expressed or implied by the forward-looking statements. In addition to other factors discussed elsewhere in this report, including those factors described under Part I, Item 1A. Risk Factors, some important factors that could cause actual results, performance or achievements to differ materially from those discussed in forward-looking statements include, but are not limited to, the following:
• | risks related to the outbreak of the coronavirus and other adverse public health developments; |
• | risks related to holdings of cash and investments and access to liquidity; |
• | risks related to our international operations, including international trade, our reliance on foreign sources for merchandise, exposure to foreign tax contingencies, and fluctuations in foreign currency exchange rates; |
• | maintaining strong relationships with our vendors, manufacturers, licensors, and retailer customers; |
• | our ability to successfully integrate acquired businesses or realize the anticipated benefits of the acquisitions after we complete our integration efforts; |
• | risks related to the loss or disruption of any of our distribution or fulfillment centers; |
• | our reliance on our loyalty programs and marketing to drive traffic, sales and customer loyalty; |
• | our ability to anticipate and respond to fashion trends, consumer preferences and changing customer expectations; |
• | failure to retain our key executives or attract qualified new personnel; |
• | risks related to the loss or disruption of our information systems and data and our ability to prevent or mitigate breaches of our information security and the compromise of sensitive and confidential data; |
• | our ability to comply with privacy laws and regulations, as well as other legal obligations; |
• | continuation of agreements with and our reliance on the financial condition of Stein Mart; |
• | our success in growing our store base and digital demand; |
• | our ability to protect our reputation and to maintain the brands we license; |
• | our ability to execute our strategies; |
• | fluctuation of our comparable sales and quarterly financial performance; |
• | uncertain general economic conditions; |
• | our competitiveness with respect to style, price, brand availability and customer service; |
• | the imposition of increased or new tariffs on our products; and |
• | uncertainty related to future legislation, regulatory reform, policy changes, or interpretive guidance on existing legislation. |
If one or more of these or other risks or uncertainties materialize, or if our underlying assumptions prove to be incorrect, actual results, performance or achievements may vary materially from what we have projected. Furthermore, new factors emerge from time to time and it is not possible for management to predict all such factors, nor can management assess the impact of any such factor on the business or the extent to which any factor, or combination of factors, may cause results to differ materially from those contained in any forward-looking statement. Any forward-looking statement speaks only as of the date on which such statement is made, and, except as required by law, we undertake no obligation to update any forward-looking statement to reflect events or circumstances after the date on which such statement is made or to reflect the occurrence of unanticipated events.
iii
PART I
ITEM 1. | BUSINESS |
Overview
Designer Brands Inc., originally founded as DSW Inc. and incorporated in the state of Ohio in 1969, is one of North America's largest designers, producers and retailers of footwear and accessories. We operate a portfolio of retail concepts in the U.S. and Canada under the DSW Designer Shoe Warehouse ("DSW"), The Shoe Company and Shoe Warehouse banners. Through Camuto LLC, a wholly owned subsidiary doing business as "Camuto Group," we design and produce footwear and accessories. We also own licensing rights for the Jessica Simpson footwear business and footwear and handbag licenses for Lucky Brand and Max Studio. In partnership with Authentic Brands Group LLC, a global brand management and marketing company, we have a 40% stake in ABG-Camuto, LLC ("ABG-Camuto"), a joint venture that acquired several intellectual property rights, including Vince Camuto, Louise et Cie, Sole Society, CC Corso Como, and others, and focuses on licensing and developing new category extensions to support the global growth of these brands. We have a licensing agreement with ABG-Camuto whereby we pay royalties on our net sales from the brands owned by ABG-Camuto. Our Affiliated Business Group ("ABG") partners with other retailers to help build and optimize their in-store and online footwear businesses by leveraging our sourcing network to produce a merchandise assortment that meets their needs. ABG currently provides services to 282 Stein Mart stores, Steinmart.com, and a Frugal Fannie's store through ongoing supply arrangements.
We present three reportable segments: the U.S. Retail segment, the Canada Retail segment, and the Brand Portfolio segment. The U.S. Retail segment includes stores operated in the U.S. under the DSW Designer Shoe Warehouse banner and its related e-commerce site. The Canada Retail segment, which is the result of the Town Shoes Limited ("TSL") acquisition, includes stores operated in Canada under The Shoe Company, Shoe Warehouse, DSW Designer Shoe Warehouse banners and related e-commerce sites. Together, the U.S. Retail and Canada Retail segments are referred to as the "retail segments." The Brand Portfolio segment, which is the result of the Camuto LLC acquisition, earns revenue from the sale of wholesale products to retailers, commissions for serving retailers as the design and buying agent for products under private labels ("First Cost"), and the sale of branded products on direct-to-consumer e-commerce sites. Our other operating segments, including ABG, are below the quantitative and qualitative thresholds for reportable segments and are aggregated into Other for segment reporting purposes.
Our fiscal year ends on the Saturday nearest to January 31. References to a fiscal year refer to the calendar year in which the fiscal year begins. This reporting schedule is followed by many national retail companies and typically results in a 52-week fiscal year, but occasionally will contain an additional week resulting in a 53-week fiscal year. The periods presented in these financial statements and selected financial data each consisted of 52 weeks, except for fiscal 2017 which consisted of 53 weeks.
Recent Developments
In March 2020, the World Health Organization declared the coronavirus ("COVID-19") outbreak a pandemic, which continues to spread throughout North America and worldwide. The health and safety of our customers and employees remain our top priority as we continue to make decisions during this rapidly evolving situation. We have taken decisive actions across our businesses to help protect employees, customers and others in the communities we serve. As a measure to limit the spread of the virus, effective March 18, 2020, we temporarily closed all of our stores in the U.S. and Canada. Our e-commerce business will continue to be available to customers and our stores will be used in the fulfillment of online orders to be shipped to customers or available for curbside pickup. During this unprecedented period of uncertainty, we have in place business continuity plans involving adjustments to operational plans, inventory disciplines, liquidity management, and reductions to our expense and capital expenditure plans. Such measures include implementing temporary leaves of absence for over 80% of our workforce without direct pay and pay reductions for nearly all employees not placed on temporary leave. The COVID-19 outbreak and the temporary closure of all of our stores has had a material adverse impact on our business, liquidity, financial condition, and results of operations.
On November 5, 2018, we completed the acquisition of Camuto LLC, a footwear design and brand development organization, from Camuto Group LLC (the "Sellers"). The acquisition of Camuto LLC gives us the capabilities to integrate Camuto Group produced products into our retail distribution networks from their existing national brands and to produce our exclusive branded products. Also on November 5, 2018, we formed the ABG-Camuto joint venture.
On May 10, 2018, we acquired the remaining interest in TSL that we did not previously own. Beginning with our second quarter of fiscal 2018, TSL ceased being accounted for under the equity method of accounting and was accounted for as a consolidated wholly owned subsidiary. Subsequent to the acquisition, and as a result of our strategic review, we exited the Town Shoes banner in Canada during fiscal 2018.
1
On March 4, 2016, we acquired Ebuys, Inc. ("Ebuys"), an off-price footwear and accessories retailer operating in digital marketplaces. Due to recurring operating losses incurred by Ebuys since its acquisition, as well as increased competitive pressures in the digital marketplace, we decided to exit the business and ended all operations in early fiscal 2018.
Competition
The footwear market is highly competitive with few barriers to entry. We compete against a diverse group of manufacturers and retailers, both small and large, including department stores, mall-based shoe stores, national chains, independent shoe retailers, single-brand specialty retailers, online shoe retailers, brand-oriented discounters, multi-channel specialty retailers and brand suppliers. In addition, our wholesale retailer customers sell shoes purchased from competing footwear suppliers with owned and licensed brands that are well-known. Many of these suppliers invest significantly in marketing their brands. In our retail segments, many of our competitors generally offer a more limited assortment at higher initial prices in a less convenient format than us and without the benefits of our customer loyalty programs. In addition, we believe we successfully compete against retailers who have attempted to duplicate our format because they typically offer assortments with fewer recognizable brands and more styles from prior seasons, unlike our current on-trend merchandise. We believe our stores provide a competitive advantage that drives growth through customer engagement by using self-service fixtures, stimulating digital sales, and providing a convenient location for customers to pick up and return products ordered online, as well as serving as geographically appropriate shipment centers for our digitally demanded products. In our Brand Portfolio segment, we compete primarily based on providing fashion-forward styles at high quality standards along with strong customer relationships.
Retail Segments
The following table presents the number of stores we operated at the end of each of the last three fiscal years by segment and by banner:
February 1, 2020 | February 2, 2019 | February 3, 2018 | ||||||
U.S. Retail segment - DSW Designer Shoe Warehouse | 521 | 516 | 512 | |||||
Canada Retail segment: | ||||||||
The Shoe Company / Shoe Warehouse | 118 | 112 | — | |||||
DSW Designer Shoe Warehouse | 27 | 27 | — | |||||
145 | 139 | — | ||||||
Total | 666 | 655 | 512 | |||||
Our growth strategy is to strengthen our position as a leading footwear and accessories retailer by expanding into new markets with the appropriate banners and store format, extending our customer reach through new categories and services, expanding our offering of exclusive brands, and creating a differentiated customer experience and strong value proposition. With our stores playing a key role in supporting our strong online demand growth and increasing fulfillment of that demand, we are regularly evaluating our real estate strategy to optimize how we can best serve the customers' shopping preferences. Our evaluation of potential new stores integrates information on demographics, co-tenancy, retail traffic patterns, site visibility and accessibility, store size and configuration, and lease terms. Our real estate decision-making entails an analysis of underlying demand for our products through both physical and digital channels. Our analysis also considers current penetration levels in markets we serve and our ability to deepen our market share and acquire new customers.
Banners
Our DSW banner stores, both in the U.S. and in Canada, are the destination for on-trend and fashion-forward footwear and accessory brands at a great value every single day. DSW stores tend to serve larger markets and average approximately 20,300 square feet. We offer a wide assortment of brand name dress, casual and athletic footwear and accessories for women, men and kids in stores and on e-commerce platforms.
The Shoe Company and Shoe Warehouse banner stores located in Canada offer on-trend footwear and accessory brands that target every-day family styles at a great value every single day. The Shoe Company and Shoe Warehouse stores tend to serve mid- to smaller markets and average approximately 5,300 square feet. We offer a select assortment of brand name dress, casual and athletic footwear and accessories for women, men and kids in stores and on e-commerce platforms, with a significant number of our products geared towards athletic and kids.
2
Our strong retail market position with all of our banners is driven by our competitive strengths in assortment, convenience, and value as described in more detail below.
Assortment
Our goal is to excite our customers with a competitive, compelling assortment of shoes and complementary accessories and services that fulfill a broad range of style and fashion preferences. We sell a large assortment of brand name, designer and exclusive branded merchandise. We purchase directly from over 580 domestic and foreign vendors, primarily in-season footwear that can be found in specialty and department stores. We offer a broad assortment of handbags, hosiery, jewelry and other accessories that appeal to our brand and fashion-conscious customers.
During fiscal 2019, the retail segments purchased approximately 6% of our merchandise through the Brand Portfolio segment, including First Cost sourced exclusive branded products and wholesale purchases of licensed products. By the end of fiscal 2020, we will have transitioned the sourcing of most of the exclusive branded products to the Brand Portfolio segment. Our other vendors include suppliers who manufacture their own merchandise, or supply merchandise manufactured by others, or both. Most of our domestic vendors import a large portion of their merchandise from abroad. We have quality control programs under which our buyers are involved in establishing standards for quality and fit, and we examine incoming merchandise in regard to color, material and overall quality. As our sales volume grows, we believe there will continue to be adequate sources available to acquire a sufficient supply of quality merchandise in a timely manner and on satisfactory economic terms. Our top three third-party vendors in the aggregate supply approximately 21% of our retail merchandise.
Our merchandising group continuously monitors current fashion trends, as well as historical sales trends, to identify popular styles and styles that may become popular in the upcoming season. We track performance and sales trends on a weekly basis and have a flexible buying process that allows us to reorder successful styles and cancel under-performing styles throughout each season. To keep our product mix fresh and on target, we test new fashions and actively monitor sell-through rates. We also identify new vendor and product category opportunities.
We separate our merchandise into four primary categories: women’s footwear, men’s footwear, kids' footwear, and accessories and other. The following table presents the percentages of the retail segments' total net sales attributable to each merchandise category:
Fiscal | ||||||||
2019 | 2018 | 2017 | ||||||
Women's footwear | 66 | % | 67 | % | 69 | % | ||
Men's footwear | 20 | % | 21 | % | 22 | % | ||
Kids' footwear | 7 | % | 5 | % | 2 | % | ||
Accessories and other | 7 | % | 7 | % | 7 | % | ||
Convenience
We provide our customers with the highest level of convenience based on our belief that customers should be empowered to control and personalize their shopping experiences.
In stores, our merchandise is displayed on the selling floor with self-service fixtures to enable customers to view and touch the merchandise. We believe this shopping experience provides our customers with maximum convenience as they are able to browse and try on merchandise without feeling rushed or pressured to make a purchasing decision. Merchandise is organized in a logical manner that groups together similar styles by gender, such as dress, casual, athletic, kids, and seasonal merchandise, for easy browsing.
Our omni-channel capabilities create an endless aisle for the customer. Customers can order additional styles, sizes, widths and categories. Online orders in the U.S. and Canada can be fulfilled from any one of our stores. Online orders from the U.S. can also be fulfilled from our fulfillment center or directly from our suppliers (referred to as "drop ship"). To further meet customer demand of how they receive products, we provide our customers options to buy online, pickup in store and buy online, ship to store.
Our order routing optimization system determines the best location to fulfill digitally demanded products, which allows us to optimize our operating profit. The fulfillment center processes U.S. orders, which are shipped to a customer's home or to a store
3
when an order is placed online and a customer requests it to be shipped to store. Orders originating from a store that cannot be fulfilled immediately in that store can either be fulfilled from our ship from store capability, from the fulfillment center (in the U.S.), or drop shipped from a vendor's warehouse.
Value for Our Customers
Our buying organization aims to provide customers with high quality, in-season fashion styles at attractive prices compared to the sale prices found at specialty retailers and department stores. In addition, we provide additional value through our VIP rewards programs in the U.S. and Canada where members earn points towards discounts on future purchases. Members also receive promotional offers and gifts with purchase offers. We employ a variety of methods, including email, direct mail and social media, to communicate exclusive offers to our rewards members. We have approximately 32 million members enrolled in our loyalty programs who have made at least one purchase over the last two years. In fiscal 2019, shoppers in the loyalty programs generated approximately 91% of the combined U.S. Retail and Canada Retail segments' net sales.
Brand Portfolio Segment
Our Brand Portfolio segment designs, develops and sources fashion footwear and accessories. We provide retailer customers and consumers a portfolio of licensed brands, including Vince Camuto, Louise et Cie, Sole Society, CC Corso Como, Jessica Simpson, Lucky Brand, and others. The Brand Portfolio segment earns revenue from the sale of wholesale products to retailers, First Cost commissions, and the sale of branded products on direct-to-consumer e-commerce sites, which include www.vincecamuto.com and www.solesociety.com. Wholesale retailer customers and First Cost customers include department stores, specialty stores, value priced retailers, national chains and online retailers. The Brand Portfolio segment sells branded products to the Company's retail segments and ABG.
Product Design
We have established a reputation for quality, on-trend merchandise. Our design teams are responsible for the creation and development of new product styles by utilizing our proven design process. Our designers monitor trends in footwear and apparel and work closely with our retailer customers to identify consumer preferences. Our future success will depend on our ability to anticipate and respond to fashion trends, consumer preferences and changing customer expectations. We believe our design process provides us with a competitive advantage allowing us to mitigate the risk of incurring costs associated with the production and distribution of less desirable designs.
Sourcing and Distribution
We source each of our product lines based on the individual design, style and quality specifications of the products. We do not own or operate manufacturing facilities; rather, we use our sourcing offices in China and Brazil to procure our products from third-party manufacturers. We are able to achieve consistent quality, competitive prices and on-time delivery based on the established relationships we have with these manufacturers. Prior to production, our sourcing offices inspect samples and prototypes of each style and monitor the quality of the production process. The manufacturers of our products are required to meet our quality, human rights, local compliance, safety and other standard requirements.
The following table presents the percentages of the Brand Portfolio segment's merchandise units sourced by country for fiscal 2019:
Percent of Units Sourced | ||
China | 83 | % |
Vietnam | 8 | % |
All other foreign locations | 9 | % |
We utilize a state-of-the-art distribution center in New Jersey to receive, sort and distribute our products to retailer customers and for drop ship orders.
4
Backlog
Most of the wholesale orders we receive are for deliveries over the following 180 days, subject to any subsequent cancellations. The backlog of wholesale orders at any particular time is affected by a number of factors, including cancellations, seasonality, the volume of customer e-commerce drop ship orders we fulfill, and the timing of wholesale customer purchases of our products. For example, wholesale customers are moving towards more frequent orders at lower volumes per order. Accordingly, a comparison of backlog from period to period may not be indicative of eventual shipments. This is particularly true in light of recent events resulting from the COVID-19 pandemic, which has resulted in material cancellations. As of February 1, 2020, we had a backlog of unfilled wholesale customer orders of $49.3 million, with subsequent cancellations of $30.2 million as a result of COVID-19. This compares to backlog of unfilled wholesale customer orders of $89.1 million as of February 2, 2019. The amount of backlog excludes intersegment orders and is not adjusted for estimated customer allowances, discounts and returns.
ABG-Camuto Joint Venture
ABG-Camuto is responsible for the growth and marketing of the brands held by the joint venture. We pay royalties to ABG-Camuto, with the royalty expense included in cost of sales, based on the sales of footwear, handbags and jewelry. ABG-Camuto also earns royalties on sales from third parties that license the brand names to produce non-footwear product categories. Given our 40% ownership interest in ABG-Camuto, we recognize earnings under the equity method, which will be included within the Brand Portfolio segment, as ABG-Camuto is considered an integral part of the Brand Portfolio segment business.
First Cost
As the design and buying agent for retailer customers, we utilize our expertise and relationships with manufacturers to facilitate the production of private label footwear to retailer customer specifications. Our First Cost model earns commission-based income while leveraging our overall design and sourcing infrastructure.
Additional Information
Intellectual Property
We have registered a number of trademarks, service marks and domain names in the U.S., Canada and internationally, including DSW®, DSW Shoe Warehouse® and DSW Designer Shoe Warehouse®. We also have a 40% interest in ABG-Camuto, which holds the intellectual property rights of Vince Camuto®, Louise et Cie®, Sole Society®, CC Corso Como®, and others. We have entered into a licensing agreement with ABG-Camuto whereby we pay royalties on our net sales from the brands owned by ABG-Camuto. We believe our trademarks and service marks have significant value and are important to building our name recognition. We also hold patents related to our unique store fixtures, which gives us greater efficiency in stocking and operating those stores that currently have the fixtures. We vigorously protect our patented fixture designs, as well as our packaging, private brand names, store design elements, marketing slogans and graphics.
Associates
As of February 1, 2020, we employed approximately 15,800 associates worldwide. None of our associates are covered by any collective bargaining agreements.
Seasonality
Our business is subject to seasonal merchandise trends driven by the change in weather conditions and our customers' interest in new seasonal styles. New spring styles are primarily introduced in the first quarter and new fall styles are primarily introduced in the third quarter.
Available Information
Information about Designer Brands Inc., including its reports filed with or furnished to the Securities and Exchange Commission ("SEC"), is available through Designer Brands Inc.'s website at www.designerbrands.com. Such reports are accessible at no charge through Designer Brands Inc.'s website and are made available as soon as reasonably practicable after such material is filed with or furnished to the SEC. The SEC also maintains a website that contains reports, proxy statements, and other information regarding issuers that file electronically with the SEC at www.sec.gov.
5
We have included our website addresses throughout this report as textual references only. The information contained on the websites referenced herein is not incorporated into this Form 10-K.
ITEM 1A. | RISK FACTORS |
In addition to the other information in this Annual Report on Form 10-K, shareholders or prospective investors should carefully consider the following risk factors when evaluating Designer Brands Inc. If any of the events described below occurs, our business, financial condition, results of operations and future growth prospects could be adversely affected.
Risks Relating to Our Business
The coronavirus outbreak has had, and may continue to have, a material adverse impact on our business, liquidity, financial condition, and results of operations.
In March 2020, the World Health Organization declared the coronavirus ("COVID-19") outbreak a pandemic, which continues to spread throughout North America and worldwide. The health and safety of our customers and employees remain our top priority as we continue to make decisions during this rapidly evolving situation. We have taken decisive actions across our businesses to help protect employees, customers and others in the communities we serve. As a measure to limit the spread of the virus, effective March 18, 2020, we temporarily closed all of our stores in the U.S. and Canada. Our e-commerce business will continue to be available to customers and our stores will be used in the fulfillment of online orders to be shipped to customers or available for curbside pickup. During this unprecedented period of uncertainty, we have in place business continuity plans involving adjustments to operational plans, inventory disciplines, liquidity management, and reductions to our expense and capital expenditure plans. Such measures include implementing temporary leaves of absence for over 80% of our workforce without direct pay and pay reductions for nearly all employees not placed on temporary leave. The COVID-19 outbreak and the temporary closure of all of our stores has had a material adverse impact on our business, liquidity, financial condition, and results of operations.
While we cannot foresee whether the outbreak of COVID-19 will be effectively contained, nor can we predict the severity and duration of its impact, based on our current understanding of governmental mandates and maintaining the health and safety of our customers and employees, we believe our stores will primarily begin re-opening in the second quarter of fiscal 2020 with a gradual return of store traffic through the remainder of fiscal 2020. As such, the impacts of COVID-19 to our businesses are highly uncertain and we will continue to assess the financial impacts. The disruption to the global economy and to our business, along with a sustained decline in our stock price, may lead to triggering events that may indicate that the carrying value of certain assets, including inventories, accounts receivables, long-lived assets, intangibles, and goodwill, may not be recoverable.
Restrictions under our Credit Facility could limit our ability to access the liquidity we need to run our business.
Our senior unsecured revolving credit agreement (the "Credit Facility"), with a maturity date of August 25, 2022, provides a revolving line of credit up to $400 million, with sub-limits for the issuance of up to $50 million in letters of credit, swing loan advances of up to $15 million, and the issuance of up to $75 million in foreign currency revolving loans and letters of credit. The Credit Facility may be used to provide funds for working capital, capital expenditures, and other expenditures.
Subsequent to February 1, 2020, we borrowed $205.0 million from the Credit Facility as a precautionary measure to increase our cash position and preserve financial flexibility considering uncertainty in the U.S. and global markets resulting from COVID-19, resulting in $2.0 million of available for borrowing. Our future operations may not generate sufficient liquidity to pay amounts that come due and our cash needs may increase in the future. In addition, our existing Credit Facility contains, and any future indebtedness that we may incur may contain, financial and other restrictive covenants that limit our ability to operate our business or raise capital. If we fail to comply with these covenants or to make payments under our indebtedness when due, then we would be in default under that indebtedness, which could, in turn, result in that and our other indebtedness becoming immediately payable in full.
On April 30, 2020, the Credit Facility was amended, which resulted in various changes including:
• | Provides for a lien on all of the Company's assets; |
• | Reduces the borrowing availability to $375.0 million on October 31, 2020, $350.0 million on January 30, 2021, $325.0 million on May 1, 2021, and $300.0 million on July 31, 2021; |
• | Redefines the components for calculating the leverage ratio and fixed charge coverage ratio to adjust for certain temporary impacts due to COVID-19; |
6
• | Changes the maximum leverage ratio covenant to 3.50:1 as of May 2, 2020, 4.00:1 as of August 1, 2020, 3.75:1 as of October 31, 2020, and 3.50:1 as of January 30, 2021 and as of the end of each fiscal quarter thereafter; |
• | Changes the minimum fixed charge coverage ratio to 1.25:1 as of May 2, 2020 and 1.05:1 as of August 1, 2020 and as of the end of each fiscal quarter thereafter; and |
• | Restricts the Company from paying dividends, making share repurchases, and making certain acquisitions. |
Our expanded international operations expose us to political, economic, operational, compliance and other risks.
As a result of several acquisitions, we have international operations, including in China, Canada and Brazil. The success of our international operations may be adversely affected by political, economic and social conditions beyond our control, local laws and customs, and legal and regulatory constraints, including compliance with applicable anti-bribery, anti-corruption, labor and currency laws and regulations. Risks inherent in our existing and future operations also include, among others, public health threats, such as the COVID-19 outbreak, the costs and difficulties of managing operations outside of the U.S., possible adverse tax consequences from changes in tax laws or the unfavorable resolution of tax assessments or audits, and greater difficulty in enforcing intellectual property rights. For example, we rely on manufacturers that operate outside the U.S., including China, and may disclose our intellectual property or other proprietary information to competitors or third parties, which could result in the distribution and sale of counterfeit versions of our products. Additionally, foreign currency exchange rates and fluctuations may negatively impact our financial results. Any of these events could have a material adverse effect on our business, financial condition, and results of operations.
We rely on our strong relationships with vendors to purchase brand name and designer merchandise at favorable prices. If these relationships were to be impaired, we may not be able to obtain a sufficient assortment of merchandise at attractive prices, and we may not be able to respond promptly to changing fashion trends, either of which could have a material adverse effect on our business and financial performance.
Our success depends, to a significant extent, on the willingness and ability of our vendors to supply us with sufficient inventory to stock our sales channels as we generally do not have long-term supply agreements or exclusive arrangements with any vendors. If we fail to maintain strong relationships with our existing vendors or if they fail to ensure the quality of merchandise they supply us, and if we cannot maintain or acquire new vendors of in-season brand name and designer merchandise, our ability to obtain a sufficient amount and variety of merchandise at favorable prices may be limited, which could have a negative impact on our business. Decisions by vendors to not sell to us or to limit the availability of their products to us could have a negative impact on our business. In addition, our inability to stock our sales channels with in-season merchandise at attractive prices could result in lower net sales and decreased customer interest in our sales channels, which could have a material adverse effect on our business. Further, if our merchandise costs increase due to increases incurred by our vendors in raw materials, energy, labor, or duties and taxes on imports, or other reasons, our ability to respond or the effect of our response could adversely affect our net sales or gross profit. During fiscal 2019, three key third-party vendors together supplied approximately 21% of our retail merchandise. The loss of, or a reduction in, the amount and quality of merchandise supplied by any one of these vendors could have an adverse effect on our business. In addition, any negative brand image, wide-spread product defects, or negative publicity related to these key vendors, or other vendors, could have a material adverse effect on our reputation and on our business.
The success of the Camuto Group business is dependent on our third-party manufacturers and other business partners.
The success of the Camuto Group business depends on our ability to obtain products from our third-party manufacturers on a timely basis, on acceptable terms and to our specifications. We do not exert direct control over the manufacturers' operations and cannot guarantee that any third-party manufacturer will have sufficient production capacity, meet our production deadlines or meet our product safety, social compliance, or quality standards. We typically do not have long-term supply contracts with our manufacturers, and the loss of any of our major manufacturers could disrupt our operations and adversely affect our business. In addition, we cannot predict the impact of global events such as inclement weather, natural disasters, public health threats, or acts of terrorism. Our manufacturers operate outside the U.S. and are also subject to additional risks associated with international trade, as discussed in more detail in other risk factors herein. If these third-party manufacturers do not perform their obligations, cease working with us, fail to meet our product safety, social compliance or quality standards, or are unable to provide us with the materials and services we need at prices and terms that are acceptable to us, such disruptions may cause product delays and shortages, failure to deliver quality products to our customers on a timely basis, and damage to our reputation, which could have a material adverse impact on our business and results of operations.
7
The success of the Camuto Group business is dependent on the strength of our relationships with our retailer customers, and reductions in or loss of sales to such customers could have a material adverse effect on our business and financial performance.
The Camuto Group business is dependent on sales of branded, licensed and private-label footwear and accessories to customers, primarily department stores and other specialty retailers. We typically do not have long-term contracts with our customers. Sales to these customers are generally on an order-by-order basis and are subject to the rights of cancellation and rescheduling by the customer. Failure to fill customers’ orders in a timely manner could harm our relationships with such customers. If any of our major customers experience a significant downturn in its business, including impacts from a downturn in the global economy as a result of the COVID-19 threat or other threats, or fails to remain committed to our products or brands, such customers may reduce or discontinue purchases from us. In addition, increased promotional activity by our wholesale customers could negatively impact the image of our brands and lead to reduced pricing or purchases of our products, which could have an adverse effect on our business. The Camuto Group business has four retailer customers that make up approximately 60% of its total net sales, and the loss of any or all of these customers would have a material adverse effect on the Brand Portfolio segment.
The loss or disruption of any of our distribution or fulfillment centers could have a material adverse effect on our business and operations.
For our U.S. Retail segment operations, the majority of our inventory is shipped directly from suppliers to our distribution center in Columbus, Ohio and a West Coast facility operated by a third party, where the inventory is then processed, sorted and shipped to one of our pool locations located throughout the country and then on to the stores. Our inventory can also be shipped directly from our fulfillment center, also located in Columbus, Ohio, and supported by a third-party service provider, to our customers. For our Canada Retail segment, we engage a logistics service provider to receive purchases and distribute to our stores. Through our ship from store capability, both in the U.S. and in Canada, inventory is shipped directly from our stores to customers. Through our drop ship program, inventory is shipped from the vendor's warehouse directly to the customer. For our Brand Portfolio segment, the majority of our inventory is shipped directly from factories to our distribution center in Westampton, New Jersey, where our wholesale inventory is then processed, sorted and provided to our customers' shipping carriers.
Our operating results depend on the orderly operation of our receiving, distribution, and fulfillment processes, which in turn depends on vendors' adherence to shipping schedules and our effective management of our facilities. We may not anticipate all the changing demands that our expanding operations will impose on our receiving, distribution, and fulfillment system, and events beyond our control, such as disruptions in operations due to public health threats, such as the COVID-19 outbreak, integration of new stores or customers, catastrophic events, labor disagreements, or shipping problems, that may result in delays in the delivery of merchandise to our stores and customers. While we maintain business interruption and property insurance, in the event any of our distribution and fulfillment centers shut down for any reason or if we were to incur higher costs and longer lead times in connection with a disruption at our distribution and fulfillment centers, our insurance may not be sufficient to cover the impact to the business.
We are dependent on our customer loyalty programs and marketing to drive traffic, sales and loyalty, and any decrease in membership or purchases from members could have a material adverse effect on our business.
Customer traffic is influenced by our marketing and our loyalty programs. We rely on our loyalty programs to drive customer traffic, sales and purchase frequency. Loyalty members earn points toward discounts on future purchases through our VIP rewards programs in the U.S. and Canada. Members also receive promotional offers and gifts with purchase offers. We employ a variety of marketing methods, including email, direct mail and social media, to communicate exclusive offers to our rewards members. We have approximately 32 million members enrolled in our loyalty programs who have made at least one purchase over the last two years. In fiscal 2019, shoppers in the loyalty programs generated approximately 91% of the combined U.S. Retail and Canada Retail segments' net sales. In the event that our rewards members do not continue to shop, we fail to add new members, the number of members decreases, or our marketing is not effective in driving customer traffic, such event could have a material adverse effect on our business.
8
We may be unable to anticipate and respond to fashion trends, consumer preferences and changing customer expectations, which could have a material adverse effect on our business.
Our merchandising strategy is based on offering the proper mix of products available to our customers, including our retailer customers. This requires us to anticipate and respond to numerous and fluctuating variables in fashion trends and other conditions in the markets in which our customers are situated. A variety of factors will affect our ability to maintain the proper mix of products, including: local economic conditions impacting customers' discretionary spending; unanticipated fashion trends; our ability to provide timely access to in-season merchandise at attractive prices; our success in distributing merchandise to our stores and our wholesale retailer customers in an efficient manner; and changes in weather patterns, which in turn affect consumer preferences. If we are unable to anticipate and fulfill the merchandise needs of our customers, we may experience decreases in our net sales and may be forced to increase markdowns in relation to slow-moving merchandise, either of which could have a material adverse effect on our business.
Being an omni-channel retailer is a business necessity to meet customer experience expectations and an opportunity to create a competitive advantage as our customers expect to be able to shop across multiple sales channels. In the event that our omni-channel strategy does not meet customer expectations or is not differentiated from our competitors, it may have a material adverse effect on our business.
Our failure to retain our existing senior management team and to continue to attract qualified new personnel could adversely affect our business.
Our business requires disciplined execution at all levels of our organization, which requires an experienced and talented management team. If we were to lose the benefit of the experience, efforts and abilities of any of our key executives and sourcing and buying personnel, our business could be adversely affected. We have entered into employment agreements with several key executives and also offer compensation packages designed to attract and retain talent. Furthermore, our ability to manage our expansion will require us to continue to train, motivate and develop our employees to maintain a high level of talent for future challenges and succession planning. Competition for these types of personnel is intense, and we may not be successful in attracting and retaining the personnel required to grow and operate our business.
The loss or disruption of information technology services could affect our ability to implement our growth strategy and have a material adverse effect on our business.
Our information technology systems are an integral part of our growth strategy in efficiently operating and expanding our business, in managing operations and protecting against security risks related to our electronic processing and transmitting of confidential customer and associate data. The requirements to keep our information technology systems operating at peak performance may be higher than anticipated and could strain our capital resources, management of any system upgrades, implementation of new systems and the related change management processes required with new systems and our ability to prevent any future information security breaches. In addition, any significant disruption of our data center could have a material adverse effect on those operations dependent on those systems, specifically, our store and e-commerce operations, our distribution and fulfillment centers and our merchandising team. While we maintain business interruption and property insurance, in the event of a data center shutdown, our insurance may not be sufficient to cover the impact to the business.
We accept orders through our e-commerce channels and are subject to various risks of operating online and mobile selling capabilities such as: the failure of our information technology infrastructure, including any third-party hardware or software, resulting in downtime or other technical issues; difficulty in integrating acquired businesses; reliance on third-party logistics providers to deliver our products to customers; inability to respond to technological changes; violations of state or federal laws; credit card fraud; or other information security breaches. Failure to mitigate these risks could have a material adverse effect on our business.
We face security risks related to our electronic processing of sensitive and confidential personal and business data. If we are unable to protect our data, a security breach could damage our reputation and have a material adverse effect on our business.
Given the nature of our business, we collect, process and retain sensitive and confidential customer and associate data, in addition to proprietary business information. We may be vulnerable to a data compromise, computer viruses, physical and electronic break-ins, and similar disruptions, which may not be prevented by our efforts to secure our computer systems. Security measures in place include, but are not limited to, vulnerability scanning and patching, web-application firewalls, reverse-proxies, network firewalls, two-factor authentication, identity and access management, data encryption, point-to-point encryption and tokenization, intrusion detection and prevention devices, endpoint detection and response software, and data
9
loss prevention software. Regular penetration tests of our networks are conducted by a third-party service provider and we leverage any findings to further enhance our security. We also employ secure file transfer options to provide security for processing, transmission and storage of confidential information. Our critical data is replicated and backed up to a separate secured data center. However, our efforts may not be able to prevent rapidly evolving types of cyber-attacks and a successful breach of our computer systems could result in misappropriation of personal, payment or sensitive business information. In addition, we rely on associates, contractors and other third parties who may attempt to circumvent our security measures in order to obtain such information and may purposefully or inadvertently cause a breach involving such information. Actual or anticipated attacks, as well as the integration of new or existing systems of acquired businesses, may cause us to incur increasing costs, including costs to deploy additional personnel and protection technologies, train employees, pay higher insurance premiums, and engage third-party specialists for additional services. An information security breach involving confidential and personal data could damage our reputation and our customers' willingness to shop in our stores or through our e-commerce platforms. In addition, we may incur material liabilities and remediation costs as a result of an information security breach, including potential liability for stolen customer or associate data, repairing system damage or providing credit monitoring or other benefits to customers or associates affected by the breach. In the event we experience an information security breach, our insurance may not be sufficient to cover the impact to the business. Although we have developed mitigating security controls to reduce our cyber risk and protect our data from loss or disclosure due to a security breach, including processes designed to reduce the impact of a security breach at a third-party vendor, such measures cannot provide absolute security.
Our failure to comply with privacy laws and regulations, as well as other legal obligations, could have a material adverse effect on our business.
State, federal and foreign governments are increasingly enacting laws and regulations governing the collection, use, retention, sharing, transfer and security of personally identifiable information and data. For example, the California Consumer Privacy Act of 2018, which took effect on January 1, 2020, imposes certain restrictions and disclosure obligations on businesses that collect personal information about California residents and provides for a private right of action, as well as penalties for noncompliance. We are subject to other consumer protection laws, including the Fair and Accurate Credit Transactions Act and the Telephone Consumer Protection Act. Additionally, the regulatory environment is increasingly demanding with frequent new and changing requirements concerning cybersecurity, information security and privacy, which may be inconsistent from one jurisdiction to another. Any failure by us or any of our business partners to comply with applicable laws, rules and regulations may result in investigations or actions against us by governmental entities, private claims and litigation, fines, penalties or other liabilities. Such events may increase our expenses, expose us to liabilities and impair our reputation, which could have a material adverse effect on our business.
If Stein Mart were to terminate our supply agreement, close a significant number of stores or liquidate, such event could have a material adverse effect on our business and financial performance.
We currently provide services through ABG to 282 Stein Mart stores and Steinmart.com through ongoing supply arrangements. Our contractual termination date for the supply agreement with Stein Mart is January 2021. Stein Mart has disclosed in its public filings that COVID-19 has adversely impacted their near-term revenues, earnings, liquidity and cash flows, and has required significant actions in response, including but not limited to, employee furloughs and store closings, all in an effort to mitigate such impacts. The extent of the impact of COVID-19 on their business and financial results will depend largely on future developments, including the duration of the spread of the outbreak within the U.S., the impact on capital and financial markets and the related impact on consumer confidence and spending, all of which are highly uncertain and cannot be predicted. Stein Mart also disclosed that continued prolonged store closure would impact their assessment of whether there is substantial doubt about their ability to continue as a going concern within one year after the date that their financial statements are issued and, based on their assessment, could result in the conclusion that substantial doubt exists. If Stein Mart were to terminate our supply agreement, close a significant number of stores or liquidate, such event could have a material adverse effect on our business and financial performance.
Our retail growth strategies could strain our resources and have a material adverse effect on our business and financial performance.
Our growth strategy in part depends on our ability to successfully open and operate new stores on a profitable basis, as well as expand the product lines and services we offer. We also continue to invest in our digital capabilities in order to deliver a high-quality, coordinated shopping experience for our customers, which requires substantial investment in technology. This continued growth could place increased demands on our financial, managerial, operational and administrative resources. We may not achieve our planned growth on a timely and profitable basis or achieve results in new locations similar to those
10
achieved in existing locations in prior periods. In addition, the growth in digital demand could result in a diversion of traffic from our stores.
Our ability to open and operate new stores on a timely and profitable basis depends on many factors, including our ability to identify suitable markets and sites for new store locations with financially stable co-tenants and landlords; negotiate acceptable lease terms; build-out or refurbish sites on a timely and effective basis; obtain sufficient financing and capital resources or generate sufficient cash flows from operations to fund growth; open new stores at costs not significantly greater than those anticipated; successfully open new stores in markets in which we currently have few or no stores; control the costs of other capital investments associated with store openings; hire, train and retain qualified managers and store personnel; and successfully integrate new stores into our existing infrastructure, operations, management and distribution systems or adapt such infrastructure, operations and systems to accommodate our growth. As a result, we may be unable to open new stores at the rates expected or at all. If we fail to successfully implement our growth strategy, the opening of new stores could be delayed or prevented, could cost more than anticipated and could divert resources from other areas of our business, any of which could have a material adverse effect on our business. To the extent that we open new stores in our existing markets, we may experience reduced net sales in existing stores in those markets. As our store base increases, our stores will become more concentrated in the markets we serve. As a result, the number of customers and financial performance of individual stores may decline and the average sales per square foot at our stores may be reduced, which could have a material adverse effect on our business. Further, changing local demographics at existing store locations may adversely affect financial performance at those stores. If we determine to close or relocate a store subject to a lease, we may remain obligated under the applicable lease for the balance of the lease term.
Initiatives to introduce new product and service offerings are designed to create growth and improve financial results. New product lines and services may not achieve or sustain profitability or market acceptance at levels sufficient to justify our investment, which could have a material adverse effect on our business. As we introduce enhancements to our point-of-sale ("POS") and e-commerce platforms or migrate to new platforms, we could experience downtime or other technical issues, which could have a material adverse effect on our business.
Our acquisition activity could disrupt our ongoing business and adversely impact our results of operations.
On May 10, 2018, we acquired the remaining interest in TSL and on November 5, 2018, we completed the acquisition of Camuto Group. The integration efforts for acquired businesses may disrupt our existing business or divert the attention of our management. Achieving the expected benefits depends in large part on our successful and timely integration of operations, systems, policies and procedures, and personnel of the acquired businesses. For example, we cannot ensure that Camuto Group will successfully be able to manage the additional volume of the retail segments' exclusive branded products transitioned to it. We cannot ensure that all of our integration efforts will be completed on a timely basis, as planned, or without substantial expense, delay or other operational problems. Until we make substantial progress with our integration efforts, we also face the risk that we may not be able to effectively manage the business and achieve planned results. We may be hindered by having limited system and reporting capabilities. Our operating results or financial condition may be adversely impacted by pre-existing claims or liabilities, both known and unknown. In addition, the integration process may strain our financial and managerial controls, reporting systems and procedures, and may also result in the diversion of management and financial resources from core business objectives. There can be no assurance that we will successfully integrate our businesses or that we will realize the anticipated benefits of the acquisitions after we complete our integration efforts.
Our failure to protect our reputation could have a material adverse effect on our brands.
The value of our brands is largely dependent on the success of our merchandise assortment and our ability to provide a consistent, high quality customer experience. Any negative publicity about us or the significant brands we offer may reduce demand for our merchandise. Failure to comply with ethical, social, product, labor, health and safety, accounting or environmental standards could also jeopardize our reputation and potentially lead to various adverse consumer actions. In addition, negative claims or publicity, including social media, regarding celebrities we have license and endorsement arrangements with could adversely affect our reputation and sales regardless of whether such claims are accurate. Consumer actions could include boycotts and negative publicity through social or digital media. Public perception about us or the products we carry, whether justified or not, could impair our reputation, involve us in litigation, damage our brand and have a material adverse effect on our business.
11
The reputation and competitive position for the Camuto Group business are dependent on our ability to maintain the brands we license.
In partnership with Authentic Brands Group LLC, a global brand management and marketing company, we formed ABG-Camuto, a joint venture in which we have a 40% interest. This joint venture acquired several intellectual property rights from the Sellers, including Vince Camuto, Louise et Cie, Sole Society, CC Corso Como, and others, and focuses on licensing and developing new category extensions to support the global growth of these brands. ABG-Camuto has entered into a licensing agreement with us, which will earn royalties from the net sales of Camuto Group under the brands acquired. In addition, we hold footwear licenses of Jessica Simpson, Lucky Brand, Max Studio, and, through a joint venture, Jennifer Lopez.
We rely on our ability to retain and maintain good relationships with the licensors and their ability to maintain strong, well-recognized brands and trademarks. The terms of our license agreements vary and are subject to renewal with various termination provisions. There can be no assurance that we will be able to renew these licenses. Even our longer-term or renewable licenses are typically dependent upon our ability to market and sell the licensed products at specified levels, and the failure to meet such levels may result in the termination or non-renewal of such licenses. Furthermore, many of our license agreements require minimum royalty payments, and if we are unable to generate sufficient sales and profitability to cover these minimum royalty requirements, we may be required to make additional payments to the licensors, which could have a material adverse effect on our business and results of operations.
We are constantly exploring new business opportunities and implementing initiatives. The failure to successfully execute our strategies may have a material adverse effect on our business, results of operations or financial condition.
We have expanded our products and markets in part through strategic acquisitions and we may continue to do so in the future. The continued development and implementation of new business opportunities and strategies involve numerous risks, including risks inherent in entering markets in which we may not have prior experience, and could distract management from our core business. In the event that we lose focus on our core business or are unsuccessful in the execution of our concept, it may have a material adverse effect on our business, results of operations or financial condition.
We are exposed to foreign tax contingencies as a result of the acquisition of Camuto Group, which could have a material adverse effect on our financial performance.
During the due diligence procedures performed related to the acquisition of Camuto Group, we identified probable contingent liabilities associated with unpaid foreign payroll and other taxes that could also result in assessed penalties and interest. We have developed an estimate of the range of outcomes related to these obligations of $28.1 million to $40.0 million for obligations we are aware of at this time. We are continuing to assess the exposure, which may result in material changes to these estimates, and we may identify additional contingent liabilities. We believe that the Sellers are obligated to indemnify us for any payments to foreign taxing authorities for the periods up to the acquisition date. Although a portion of the purchase price is held in escrow and another portion is held in a restricted bank account, there can be no assurance that we will successfully collect all amounts that we may be obligated to settle with the foreign taxing authorities.
Our sales and quarterly financial performance may fluctuate for a variety of reasons, including seasonal variability.
Our business is sensitive to consumer spending patterns, which in turn are subject to prevailing regional and national economic conditions and the general level of economic activity. Our comparable sales and quarterly results of operations have fluctuated in the past, and we expect them to continue to fluctuate in the future. A variety of other factors affect our sales and quarterly financial performance, including: uncertain macro-economic conditions and changes in the retail sales environment; changes in our merchandising strategy; timing and concentration of new store openings and related start-up costs; expenses associated with new stores, our omni-channel strategy and marketing expenses; changes in our merchandise mix; changes in and regional variations in demographic and population characteristics; timing of promotional events; seasonal fluctuations due to weather conditions; and actions by our competitors. Accordingly, our results for any one fiscal quarter are not necessarily indicative of the results to be expected for any other quarter, and comparable sales for any particular future period may increase or decrease. Our future financial performance may fall below the expectations of securities analysts and investors, which may adversely impact the price of our common shares.
In addition, our business is subject to seasonal merchandise trends when our customers' interest in new seasonal styles increases. New spring styles are introduced in the first quarter and new fall styles are introduced in the third quarter. As a result of seasonal merchandise trends, any factors negatively affecting us during these periods, including adverse weather, the timing and level of markdowns, fashion trends or unfavorable economic conditions, could have a material adverse effect on our business.
12
Risks Relating to the External Environment
Uncertain economic conditions and other events in the U.S. and other countries in which we operate can adversely affect consumer confidence and consumer spending habits, which could result in reduced net sales.
Consumer spending habits, including spending for the footwear and accessories that we sell, are affected by, among other things, prevailing economic conditions; levels of employment; salaries and wage rates; prevailing interest rates; income tax rates and policies; consumer confidence; and consumer perception of economic conditions. In addition, consumer purchasing patterns may be influenced by consumers' disposable income. Consumer confidence can also be affected by the domestic or international political environment. The outbreak or escalation of war, natural disasters, public health threats, such as the COVID-19 outbreak, or the occurrence of terrorist acts or other hostilities in or affecting the U.S. or other countries in which we operate, could lead to a decrease in spending by consumers. In an economic slowdown, we could experience lower net sales than expected on a quarterly or annual basis and be forced to delay or slow our expansion plans. Reduced net sales may result in reduced operating cash flows if we are not able to appropriately manage inventory levels or leverage expenses. These negative economic conditions could have a material adverse effect on our business.
We may be unable to compete in our highly competitive market, which could have a material adverse effect on our business.
The footwear market is highly competitive with few barriers to entry. We compete against a diverse group of manufacturers and retailers, both small and large, including department stores, mall-based shoe stores, national chains, independent shoe retailers, single-brand specialty retailers, online shoe retailers, brand-oriented discounters, multi-channel specialty retailers and brand suppliers. In addition, our wholesale retailer customers sell shoes purchased from competing footwear suppliers with owned and licensed brands that are well-known. Many of these suppliers invest significantly in marketing their brands. Our success depends on our ability to remain competitive with respect to assortment, quality, convenience and value. The performance of our competitors, as well as a change in their pricing policies as a result of the current economic environment, marketing activities and other business strategies, could have a material adverse effect on our business.
E-commerce networks have rapidly evolved while consumer receptiveness to shopping online has substantially increased. Competition from e-commerce players has significantly increased due to their ability to provide improved user experience, greater ease of buying goods, low or no shipping fees, faster shipping times and more favorable return policies. Businesses, including our suppliers, can easily launch online sites and mobile platforms at nominal costs by using commercially available software or partnering with any of a number of successful digital marketplace providers. Some of our suppliers use such platforms to compete with us by allowing consumers to purchase products directly through the supplier. Competitors with other revenue sources may also be able to devote more resources to marketing and promotional campaigns, adopt more aggressive pricing policies and devote more resources to websites, mobile platforms and applications and systems development.
We rely on foreign sources for our merchandise, and our business is therefore subject to risks associated with international trade.
All of the products we manufacture in the Brand Portfolio segment come from third-party facilities outside of the U.S., with 83% sourced from China, whereas our U.S. Retail and Canada Retail merchandise is purchased from both domestic and foreign vendors. Many of our domestic vendors import a large portion of their merchandise from abroad, with the majority manufactured in China. For this reason, we face risks inherent in purchasing from foreign suppliers, such as: public health threats, such as the COVID-19 outbreak, economic and political instability in countries where these suppliers are located; international hostilities or acts of war or terrorism affecting the U.S. or foreign countries from which our merchandise is sourced; increases in shipping costs; transportation delays and interruptions, including increased inspections of import shipments by domestic authorities; work stoppages; expropriation or nationalization; changes in foreign government administration and governmental policies; changes in import duties or quotas; compliance with trade and foreign tax laws; and local business practices, including compliance with foreign laws and with domestic and international labor standards. COVID-19 has led to work and travel restrictions within, to, and out of mainland China, which in turn has led to delays in workers returning, which may affect our and our vendors’ manufacturers. This viral outbreak may make it difficult for our suppliers and our vendors’ suppliers to source raw materials in China and other countries, manufacture goods in such countries, and export our products from such countries. If the severity and reach of the COVID-19 outbreak continues or increases, there may be significant and material disruptions to our supply chain and operations, and disruptions in the manufacture, shipment, and sale of our products. Such events may increase our costs and disrupt our operations, which could have a material adverse effect on our business, financial condition, and results of operations.
13
We require our business partners to operate in compliance with applicable laws and regulations and our internal requirements. However, we do not control such third parties or their labor and business practices. The violation of labor or other laws by one of our vendors could have a material adverse effect on our business.
The imposition of increased or new tariffs on our products could have a material adverse effect on our business and financial performance.
The U.S. government has placed tariffs on certain goods imported from China and may impose new tariffs on goods imported from China and other countries, including footwear and other products that we import. In retaliation, China has responded by imposing tariffs on a wide range of products imported from the U.S. and by adjusting the value of its currency. If renegotiations of existing tariffs are unsuccessful or additional tariffs or trade restrictions are implemented by the U.S. or other countries in connection with a global trade war, the resulting escalation of trade tensions could have a material adverse effect on world trade and the global economy. While it is still too early to predict whether or how the ongoing tariff negotiations between the U.S. and China will impact our business, the imposition of tariffs on footwear or other items imported by us from China could require us to increase prices to our customers or, if unable to do so, result in lowering our gross margin on products sold, which could have a material adverse effect on our business and financial performance. Alternatively, we may seek to shift production outside of China, resulting in significant costs and disruption to our business. Even in the absence of further tariffs or trade restrictions, the related uncertainty and the market's fear of an economic slowdown could lead to a decrease in consumer spending and we may experience lower net sales than expected. Reduced net sales may result in reduced operating cash flows if we are not able to appropriately manage inventory levels or leverage expenses.
Uncertainty in future changes to tax legislation, regulatory reform or policies could have a material adverse effect on our business.
Tax laws, regulations, and policies in various jurisdictions may be subject to significant change due to economic, political and other conditions. The U.S. tax reform legislation, referred to as the Tax Cuts and Jobs Act of 2017 (the "U.S. Tax Reform"), significantly changed how the U.S. taxes corporations and requires complex computations to be performed that were not previously required in U.S. tax law. The U.S. Treasury Department, the U.S. Internal Revenue Service, and other standard-setting bodies could interpret or issue guidance on how provisions of the U.S. Tax Reform will be applied or otherwise administered that is different from our interpretation. In addition, state, local or foreign jurisdictions may enact tax laws in response to the U.S. Tax Reform that could result in further changes to taxation and materially affect our financial position and results of operations.
Our cash and investments are subject to risks that could affect the liquidity of these investments.
As of February 1, 2020, we had cash and cash equivalents and investments of $111.5 million. Subsequent to February 1, 2020, we borrowed $205.0 million from the Credit Facility as a precautionary measure to increase our cash position and preserve financial flexibility considering uncertainty in the U.S. and global markets resulting from COVID-19. A portion of these are held as cash in operating accounts that are with financial institutions. While we regularly monitor the cash balances in our operating accounts and when possible adjust the balances as appropriate to be within Federal Deposit Insurance Corporation insurance limits, these cash balances could be lost or inaccessible if the underlying financial institutions fail or are subject to other adverse conditions in the financial markets.
While we generally invest in lower risk investments, investment risk has been and may further be exacerbated by credit and liquidity issues that have affected various sectors of the financial markets. Our access to cash and investments, their earning potential or our ability to invest in highly rated, low risk investments may be impacted by adverse conditions in the U.S. financial markets. These market risks associated with our cash and investments could have a material adverse effect on our business.
We are exposed to foreign currency risk.
We are primarily exposed to the impact of foreign exchange rate risk through our Canadian business where the functional currency is the Canadian dollar ("CAD"). Currency translation adjustments are included in accumulated other comprehensive loss. We also hold cash denominated in CAD with foreign currency exchange gains or losses recorded to income. The impact of all other foreign currencies is immaterial to our financial results and we currently do not utilize hedging instruments to mitigate foreign currency exchange risks.
14
Risks Relating to our Common Shares
Our amended articles of incorporation, amended and restated code of regulations and Ohio state law contain provisions that may have the effect of delaying or preventing a change in control of Designer Brands Inc. This could adversely affect the value of our common shares.
Our amended articles of incorporation authorize our Board of Directors to issue up to 100,000,000 preferred shares and to determine the powers, preferences, privileges, rights, including voting rights, qualifications, limitations and restrictions on those shares, without any further vote or action by the shareholders. The rights of the holders of our Class A common shares will be subject to, and may be adversely affected by, the rights of the holders of any preferred shares that may be issued in the future. The issuance of preferred shares could have the effect of delaying, deterring or preventing a change in control and could adversely affect the voting power of our common shares.
In addition, provisions of our amended articles of incorporation, amended and restated code of regulations and Ohio law, together or separately, could discourage potential acquisition proposals, delay or prevent a change in control or limit the price that certain investors might be willing to pay in the future for our common shares. Among other things, these provisions establish a staggered board, require a super-majority vote to remove directors, and establish certain advance notice procedures for nomination of candidates for election as directors and for shareholder proposals to be considered at shareholders' meetings.
We do not expect a trading market for the Company's Class B common shares to develop and therefore any investment in the Class B common shares may be effectively illiquid, unless such shares are converted into the Company's Class A common shares.
There is currently no public market for the Company's Class B common shares. We do not intend to list the Class B common shares on any securities exchange or any automated quotation system. As a result, there can be no assurance that a secondary market will develop, and we do not expect any market makers to participate in a secondary market. Because the Class B common shares are not listed on a securities exchange or an automated quotation system, it may be difficult to obtain pricing information with respect to the shares. Accordingly, there may be a limited number of buyers if a holder decided to sell their Class B common shares. This may affect the price a holder would receive upon such sale. Alternatively, a holder of such shares could convert them into Class A common shares, on a share for share basis, prior to selling. However, such conversion could affect the timing of any such sale, which may in turn affect the price a holder may receive upon such sale.
The Schottenstein Affiliates, entities owned by or controlled by Jay L. Schottenstein, the Executive Chairman of the Designer Brands Inc. Board of Directors, and members of his family, directly control or substantially influence the outcome of matters submitted for Designer Brands Inc. shareholder votes, and their interests may differ from other shareholders.
As of February 1, 2020, the Schottenstein Affiliates have approximately 52% of the voting power of the Company's outstanding common shares. The Schottenstein Affiliates directly control or substantially influence the outcome of matters submitted to Designer Brands Inc.'s shareholders for approval, including the election of directors, approval of mergers or other business combinations, and acquisitions or dispositions of assets. The interests of the Schottenstein Affiliates may differ from or be opposed to the interests of other shareholders, and their level of ownership and voting power in the Company may have the effect of delaying or preventing a subsequent change in control that may be favored by other shareholders.
The Schottenstein Affiliates engage in a variety of businesses, including, but not limited to, business and inventory liquidations, apparel companies and real estate investments. Opportunities may arise in the area of potential competitive business activities that may be attractive to the Schottenstein Affiliates and us. Our amended and restated articles of incorporation provide that the Schottenstein Affiliates are under no obligation to communicate or offer any corporate opportunity to us. In addition, the Schottenstein Affiliates have the right to engage in similar activities as us, do business with our suppliers and customers, and, except as limited by agreement, employ or otherwise engage any of our officers or employees.
Furthermore, as a "controlled company" within the meaning of The New York Stock Exchange ("NYSE") rules, the Company qualifies for and, in the future, may opt to rely on, exemptions from certain corporate governance requirements, including having a majority of independent directors, as well as having nominating and corporate governance and compensation committees composed entirely of independent directors.
15
ITEM 1B. | UNRESOLVED STAFF COMMENTS |
None.
ITEM 2. | PROPERTIES |
The following table summarizes the location and general use of our principal properties as of February 1, 2020 that we consider to be material to our business:
Facility | Location | Owned/Leased | Segment | Approximate Square Feet | |||||
Principal corporate office | Columbus, Ohio | Owned | Corporate, U.S. Retail and Other | 178,000 | |||||
Distribution center | Columbus, Ohio | Owned | U.S. Retail and Other | 625,000 | |||||
Fulfillment center(1) | Columbus, Ohio | Leased | U.S. Retail | 854,000 | |||||
Distribution center | Westampton, New Jersey | Leased | Brand Portfolio | 683,000 | |||||
U.S. retail stores(2) | 521 various U.S. locations | Leased | U.S. Retail | 10,570,000 | |||||
Canada retail stores(3) | 145 various Canadian locations | Leased | Canada Retail | 1,162,000 | |||||
Showrooms | 10 various U.S. locations | Leased | Brand Portfolio | 99,000 | |||||
Foreign sourcing offices | Two locations in China and one location in Brazil | Leased | Brand Portfolio | 123,000 | |||||
(1) | Our fulfillment center is leased from Schottenstein Affiliates, a related party, and expires in September 2022 with two renewal options of five years each. |
(2) | Our DSW U.S. stores average approximately 20,300 square feet. Most of the store leases are for a fixed term with options for extension periods, exercisable at our option, with 16 stores leased from Schottenstein Affiliates, a related party. |
(3) | The Shoe Company, Shoe Warehouse and DSW stores in Canada average approximately 8,000 square feet. Most of the store leases are for a fixed term with options for extension periods, exercisable at our option. |
We believe that our principal properties will meet our operational needs for the foreseeable future.
ITEM 3. | LEGAL PROCEEDINGS |
The information set forth in Note 16, Commitments and Contingencies - Legal Proceedings, of the Consolidated Financial Statements of this Annual Report on Form 10-K is incorporated herein by reference.
ITEM 4. | MINE SAFETY DISCLOSURES |
Not Applicable.
16
PART II
ITEM 5. | MARKET FOR THE REGISTRANT'S COMMON EQUITY, RELATED STOCKHOLDER MATTERS AND ISSUER PURCHASES OF EQUITY SECURITIES |
Common Shares
Our Class A common shares are listed for trading on the New York Stock Exchange ("NYSE") under the ticker symbol "DBI." There is currently no public market for the Company's Class B common shares, but the Class B common shares can be exchanged for the Company's Class A common shares at the election of the holder on a share for share basis. Holders of Class A common shares are entitled to one vote per share and holders of Class B common shares are entitled to eight votes per share on matters submitted to shareholders for approval. As of April 24, 2020, there were 179 holders of record of our Class A common shares and 13 holders of record of our Class B common shares. The number of holders of record is based upon the actual number of holders registered at such date and does not include holders of shares in "street names" or persons, partnerships, associates, corporations, or other entities identified in security position listings maintained by depositories.
Dividends
The payment of any future dividends is at the discretion of our Board of Directors and is based on our future earnings, cash flow, financial condition, capital requirements, changes in taxation laws, general economic condition and any other relevant factors. It is anticipated that dividends will be declared on a quarterly basis. Our Credit Facility allows the payments of dividends by us or our subsidiaries, provided that immediately before and after a dividend payment there is no event of default, as defined in our Credit Facility. Refer to Item 6. Selected Financial Data of this Annual Report on Form 10-K for additional information on our dividend history. On March 17, 2020, the Board of Directors declared a quarterly cash dividend payment of $0.10 per share for both Class A and Class B common shares. The dividend was paid on April 10, 2020 to shareholders of record at the close of business on March 30, 2020.
Share Repurchase Program
On August 17, 2017, the Board of Directors authorized the repurchase of an additional $500 million of Class A common shares under our share repurchase program, which was added to the $33.5 million remaining from the previous authorization. The share repurchase program may be suspended, modified or discontinued at any time, and we have no obligation to repurchase any amount of our common shares under the program. Shares will be repurchased in the open market at times and in amounts considered appropriate based on price and market conditions.
The following table sets forth the Class A common share repurchases during the most recent quarter:
(in thousands, except per share amounts) | (a) Total Number of Shares Purchased | (b) Average Price Paid per Share | (c) Total Number of Shares Purchased as Part of Publicly Announced Programs | (d) Approximate Dollar Value of Shares that May Yet Be Purchased Under the Programs | |||||||||
November 3, 2019 to November 30, 2019 | — | $ | — | — | $ | 334,935 | |||||||
December 1, 2019 to January 4, 2020 | — | $ | — | — | $ | 334,935 | |||||||
January 5, 2020 to February 1, 2020(1) | 1 | $ | 15.75 | — | $ | 334,935 | |||||||
1 | $ | 15.75 | — | ||||||||||
(1) | The total number of shares repurchased represents shares withheld in connection with tax payments due upon vesting of employee restricted stock awards. |
17
Performance Graph
The following graph compares our cumulative total shareholder return on our Class A common shares with the cumulative total returns of the Standard and Poor's ("S&P") MidCap 400 Index and the S&P MidCap 400 Retail Index, all of which are published indices. The comparison of the cumulative total returns for each investment assumes that $100 was invested on January 31, 2015 and that all dividends were reinvested. This comparison includes the period ended January 31, 2015 through the period ended February 1, 2020.
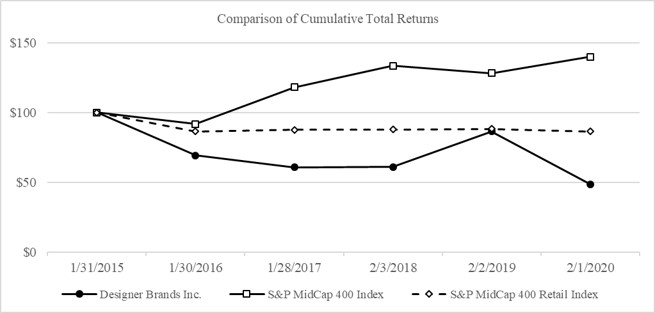
Company / Index | January 31, 2015 | January 30, 2016 | January 28, 2017 | February 3, 2018 | February 2, 2019 | February 1, 2020 | ||||||||||||||||||
Designer Brands Inc. | $ | 100.00 | $ | 69.31 | $ | 60.73 | $ | 60.96 | $ | 86.61 | $ | 48.67 | ||||||||||||
S&P MidCap 400 Index | $ | 100.00 | $ | 91.82 | $ | 118.23 | $ | 133.63 | $ | 128.32 | $ | 139.87 | ||||||||||||
S&P MidCap 400 Retail Index | $ | 100.00 | $ | 86.57 | $ | 87.62 | $ | 87.83 | $ | 88.37 | $ | 86.46 | ||||||||||||
18
ITEM 6. | SELECTED FINANCIAL DATA |
The following table sets forth various selected financial information. Such selected consolidated financial data should be read in conjunction with our Consolidated Financial Statements, including the notes thereto, set forth in Item 8. Financial Statements and Supplementary Data and Item 7. Management's Discussion and Analysis of Financial Condition and Results of Operations of this Annual Report on Form 10-K.
(in thousands, except percentages, per share and per square foot data, and store count) | Fiscal(1) | ||||||||||||||||||
2019(2) | 2018(3) | 2017 | 2016 | 2015 | |||||||||||||||
Statement of Operations Data: | |||||||||||||||||||
Net sales(4) | $ | 3,492,687 | $ | 3,177,918 | $ | 2,805,555 | $ | 2,713,355 | $ | 2,620,248 | |||||||||
Gross profit(4) | $ | 999,670 | $ | 938,689 | $ | 799,132 | $ | 779,898 | $ | 768,369 | |||||||||
Operating profit | $ | 127,299 | $ | 59,005 | $ | 125,058 | $ | 199,977 | $ | 213,551 | |||||||||
Net income (loss)(5) | $ | 94,497 | $ | (20,466 | ) | $ | 67,452 | $ | 124,419 | $ | 136,034 | ||||||||
Diluted earnings (loss) per share(5) | $ | 1.27 | $ | (0.26 | ) | $ | 0.84 | $ | 1.51 | $ | 1.54 | ||||||||
Weighted average number of diluted shares outstanding | 74,605 | 80,026 | 80,687 | 82,135 | 88,501 | ||||||||||||||
Balance Sheet Data: | |||||||||||||||||||
Cash and cash equivalents and investments | $ | 111,538 | $ | 169,087 | $ | 300,537 | $ | 287,091 | $ | 330,475 | |||||||||
Inventory | $ | 632,587 | $ | 645,317 | $ | 501,903 | $ | 499,995 | $ | 484,236 | |||||||||
Total assets | $ | 2,465,070 | $ | 1,620,584 | $ | 1,421,517 | $ | 1,436,884 | $ | 1,369,109 | |||||||||
Debt | $ | 190,000 | $ | 160,000 | $ | — | $ | — | $ | — | |||||||||
Total shareholders' equity | $ | 720,914 | $ | 832,377 | $ | 955,251 | $ | 942,236 | $ | 904,924 | |||||||||
Other Data: | |||||||||||||||||||
Comparable sales change(6) | 0.8 | % | 6.1 | % | (0.4 | )% | (3.0 | )% | 0.8 | % | |||||||||
Number of U.S. Retail stores: | |||||||||||||||||||
Beginning of period | 516 | 512 | 501 | 468 | 431 | ||||||||||||||
New stores | 7 | 9 | 15 | 34 | 40 | ||||||||||||||
Closed stores | (2 | ) | (5 | ) | (4 | ) | (1 | ) | (3 | ) | |||||||||
End of period | 521 | 516 | 512 | 501 | 468 | ||||||||||||||
Number of Canada Retail stores: | |||||||||||||||||||
Beginning of period | 139 | — | — | — | — | ||||||||||||||
Acquired stores | — | 180 | — | — | — | ||||||||||||||
New stores | 9 | — | — | — | — | ||||||||||||||
Closed stores | (3 | ) | (41 | ) | — | — | — | ||||||||||||
End of period | 145 | 139 | — | — | — | ||||||||||||||
Store square footage:(7) | |||||||||||||||||||
U.S. Retail | 10,570 | 10,529 | 10,485 | 10,336 | 9,805 | ||||||||||||||
Canada Retail | 1,162 | 1,150 | — | — | — | ||||||||||||||
Net sales per average square foot: | |||||||||||||||||||
U.S. Retail | $ | 260 | $ | 260 | $ | 246 | $ | 246 | $ | 258 | |||||||||
Canada Retail(8) | $ | 216 | $ | 212 | $ | — | $ | — | $ | — | |||||||||
ABG stores serviced | 283 | 287 | 293 | 395 | 379 | ||||||||||||||
Cash dividends per share | $ | 1.00 | $ | 1.00 | $ | 0.80 | $ | 0.80 | $ | 0.80 | |||||||||
(1) | All fiscal years are based on a 52-week year, except for fiscal 2017, which is based on a 53-week year. |
(2) | During fiscal 2019, we adopted the new accounting standard for leases, Accounting Standards Update ("ASU") 2016-02 and the related amendments. We elected to initially apply ASU 2016-02 as of February 3, 2019, with the recognition of $1.0 billion of lease assets and $1.1 billion of lease liabilities and a cumulative-effect adjustment that decreased retained |
19
earnings by $9.6 million for transition impairments related to previously impaired leased locations. Periods prior to February 3, 2019 were not restated. Upon transition to ASU 2016-02, we recognized lease liabilities based on the present value of the remaining future fixed lease commitments, net of outstanding tenant allowance receivables, with corresponding lease assets. Amounts for prepaid expenses, deferred rent, deferred construction and tenant allowances, the accrual for lease obligations, and favorable and unfavorable leasehold interests were netted against the lease assets.
(3) | On May 10, 2018, we acquired the remaining interest in TSL that we did not previously own. Beginning with our second quarter of fiscal 2018, TSL ceased being accounted for under the equity method of accounting and was accounted for as a consolidated wholly owned subsidiary. On November 5, 2018, we completed the acquisition of Camuto Group. |
(4) | We changed our presentation of net sales and gross profit for all periods presented to include commission income. Previously reported other revenue, which primarily included operating sublease income, was reclassified to operating expenses. |
(5) | Net income and diluted earnings per share for fiscal 2019 included net after-tax charges of $19.8 million, or $0.26 per diluted share, primarily related to integration and restructuring costs and impairment charges. Net loss and diluted loss per share for fiscal 2018 included net after-tax charges of $155.3 million, or $1.92 per diluted share, primarily related to impairment charges, acquisition-related activities, the exit of the Town Shoes banner, other restructuring costs, and the net tax expense impact of finalizing the U.S. Tax Reform implementation assessment. Net income and diluted earnings per share for fiscal 2017 included net after-tax charges of $55.5 million, or $0.68 per diluted share, primarily related to impairment charges, inventory write-downs, amortization of intangibles and the change in fair value of the contingent consideration liability associated with Ebuys, restructuring costs, foreign exchange net losses, and the initial net tax expense impact of implementing the U.S. Tax Reform. |
(6) | A store is considered comparable when in operation for at least 14 months at the beginning of the fiscal year. Stores are added to the comparable base at the beginning of the year and are dropped for comparative purposes in the quarter they are closed. Comparable sales include e-commerce sales. Stores in Canada from the TSL acquisition that were in operation for at least 14 months at the beginning of fiscal 2019, along with its e-commerce sales, were added to the comparable base beginning with the second quarter of fiscal 2019. Comparable sales for the Canada Retail segment exclude the impact of foreign currency translation and are calculated by translating current period results at the foreign currency exchange rate used in the comparable period in the prior year. For the Brand Portfolio segment, sales from the direct-to-consumer www.vincecamuto.com e-commerce site were added to the comparable base beginning with the fourth quarter of fiscal 2019. |
(7) | Store square footage represents the total amount of square footage as of the end of the fiscal year for stores and does not include ABG or square footage of the distribution and fulfillment centers. |
(8) | Canada Retail sales for fiscal 2018 included in the calculation of net sales per average square foot have been annualized on a full year basis. The calculation excludes the Town Shoes banner that was exited during fiscal 2018. |
ITEM 7. | MANAGEMENT'S DISCUSSION AND ANALYSIS OF FINANCIAL CONDITION AND RESULTS OF OPERATIONS |
This management's discussion and analysis of financial condition and results of operations contains forward-looking statements that involve various risks and uncertainties. See Cautionary Statement on page iii for a discussion of the uncertainties, risks and assumptions associated with these statements. This discussion is best read in conjunction with our Consolidated Financial Statements, including the notes thereto, set forth in Item 8. Financial Statements and Supplementary Data of this Annual Report on Form 10-K. The results of operations for the periods reflected herein are not necessarily indicative of results that may be expected for future periods, and our actual results may differ materially from those discussed in the forward-looking statements as a result of various factors, including but not limited to those listed under Item 1A. Risk Factors of this Annual Report on Form 10-K and included elsewhere in this Annual Report on Form 10-K.
The following discussion includes a comparison of our results of operations and liquidity and capital resources for fiscal 2019 and 2018. A discussion of a comparison of our results of operations and liquidity and capital resources for fiscal 2018 and 2017 has been omitted from this Form 10-K but may be found in Item 7. Management’s Discussion and Analysis of Financial Condition and Results of Operations of our Annual Report on Form 10-K for the fiscal year ended February 2, 2019, filed with the SEC on March 26, 2019.
20
Executive Overview
In March 2020, the World Health Organization declared the coronavirus ("COVID-19") outbreak a pandemic, which continues to spread throughout North America and worldwide. The health and safety of our customers and employees remain our top priority as we continue to make decisions during this rapidly evolving situation. We have taken decisive actions across our businesses to help protect employees, customers and others in the communities we serve. As a measure to limit the spread of the virus, effective March 18, 2020, we temporarily closed all of our stores in the U.S. and Canada. Our e-commerce business will continue to be available to customers and our stores will be used in the fulfillment of online orders to be shipped to customers or available for curbside pickup. During this unprecedented period of uncertainty, we have in place business continuity plans involving adjustments to operational plans, inventory disciplines, liquidity management, and reductions to our expense and capital expenditure plans. Such measures include implementing temporary leaves of absence for over 80% of our workforce without direct pay and pay reductions for nearly all employees not placed on temporary leave. The COVID-19 outbreak and the temporary closure of all of our stores has had a material adverse impact on our business, liquidity, financial condition, and results of operations.
While we cannot foresee whether the outbreak of COVID-19 will be effectively contained, nor can we predict the severity and duration of its impact, based on our current understanding of governmental mandates and maintaining the health and safety of our customers and employees, we believe our stores will primarily begin re-opening in the second quarter of fiscal 2020 with a gradual return of store traffic through the remainder of fiscal 2020. As such, the impacts of COVID-19 to our businesses are highly uncertain and we will continue to assess the financial impacts. The disruption to the global economy and to our business, along with a sustained decline in our stock price, may lead to triggering events that may indicate that the carrying value of certain assets, including inventories, accounts receivables, long-lived assets, intangibles, and goodwill, may not be recoverable.
In support of our long-term vision to become the leading footwear retailer in the U.S., we continue to invest in our differentiators. These include private labels, exclusive partnerships, our best in class loyalty programs, and customer experiences. We continually explore new ways to expand our audience and gain market share. We were pleased with the performance of our Canada Retail segment during fiscal 2019 with continued positive comparable sales and further margin growth, benefiting from moving their digital offering to the platform we use in the U.S. Following the first full year of operating the Camuto Group business, we remain on track to convert the production of the majority of our DSW private label to the Brand Portfolio segment in fiscal 2020. At that time, we expect to realize the benefits of having greater exclusivity in product offerings at higher margins.
We were faced with challenges both internally and externally in fiscal 2019, primarily during the second half of the year. During our fourth quarter, we were focused on stabilizing the business through remedying several issues within our control. Following the holidays, we instituted a patch for our new POS system that, combined with the discontinued practice of allowing multiple promotions for a single transaction, has positively impacted both net sales and gross profits. In addition, we adjusted our inventory positions and investments in marketing.
Comparable Sales Performance Metric
We consider comparable sales to be an important indicator of the performance of our retail and direct-to-consumer businesses, and investors may find it useful as such. Comparable sales is a primary metric commonly used throughout the retail industry. A store is considered comparable when in operation for at least 14 months at the beginning of the fiscal year. Stores are added to the comparable base at the beginning of the year and are dropped for comparative purposes in the quarter they are closed. Comparable sales include e-commerce sales. Stores in Canada from the TSL acquisition that were in operation for at least 14 months at the beginning of fiscal 2019, along with its e-commerce sales, were added to the comparable base beginning with the second quarter of fiscal 2019. Comparable sales for the Canada Retail segment exclude the impact of foreign currency translation and are calculated by translating current period results at the foreign currency exchange rate used in the comparable period in the prior year. For the Brand Portfolio segment, sales from the direct-to-consumer www.vincecamuto.com e-commerce site were added to the comparable base beginning with the fourth quarter of fiscal 2019. The calculation of comparable sales varies across the retail industry and, as a result, the calculations of other retail companies may not be consistent with our calculation.
21
Comparability
There are a number of items that affect comparability when reviewing our results of operations for fiscal 2019 and 2018. Significant items to consider include:
• | During fiscal 2019, we incurred integration and restructuring costs related to our prior year acquisition activity of $17.7 million, which consisted primarily of severance, fees for terminating joint ventures, and professional fees and other integration costs. Also during fiscal 2019, we recorded impairment charges of $7.8 million, including $4.8 million for operating lease assets and other property and equipment in the Brand Portfolio segment related to the planned consolidation of certain locations as part of our integration efforts and $3.0 million primarily for operating lease assets related to under-performing stores. |
• | During fiscal 2018, we recorded impairment charges of long-lived assets of $19.0 million, primarily for an abandoned corporate internal-use software that was under development and leasehold improvements related to under-performing stores, and as a result of our decision to exit the Town Shoes banner, we closed or re-branded all Town Shoes banner stores and recorded lease exit and other termination costs of $16.4 million. Also during fiscal 2018, we incurred restructuring costs of $5.6 million in severance, primarily related to changes in our store labor model and the exit of the Town Shoes banner, and we incurred acquisition-related costs and target acquisition costs of $27.9 million. In addition, fiscal 2018 included the wind-down operations of Ebuys, which included lease exit and other termination costs of $6.6 million and incremental income tax expense of $2.3 million. |
• | On May 10, 2018, we acquired the remaining interest in TSL that we did not previously own. TSL results were included in the consolidated results of operations as a wholly owned subsidiary beginning with the second quarter of fiscal 2018. For the first quarter of fiscal 2018, the loss from our equity investment interest in TSL was included in our consolidated results of operations. Due to the acquisition of the remaining interest in TSL, we remeasured to fair value our previously held assets, which included our equity investment in TSL and notes and accounts receivable from TSL. During fiscal 2018, as a result of the remeasurement, we recorded a loss of $34.0 million to non-operating expenses, net. Also during fiscal 2018, we reclassified a net loss of $12.2 million of foreign currency translation related to the previously held balances from accumulated other comprehensive loss to non-operating expenses, net. In addition, with the TSL acquisition being accounted for as a step acquisition, the purchase price included the fair value of our previously held assets, which considered the valuation of the TSL enterprise. This valuation identified that the resulting goodwill was not supportable as the value of the acquired net assets exceeded the enterprise fair value. As a result, during fiscal 2018, we recorded a goodwill impairment charge of $41.8 million, which resulted in impairing all of TSL’s goodwill. |
• | On November 5, 2018, we completed the acquisition of Camuto Group. Camuto Group's results were included in the consolidated results of operations as a wholly owned subsidiary beginning with the fourth quarter of fiscal 2018. During fiscal 2018, we recognized $5.3 million of additional cost of sales related to an inventory valuation step-up recorded as part of the acquisition. |
Financial Summary
Net sales increased to $3.5 billion for fiscal 2019 from $3.2 billion for fiscal 2018. The 9.9% increase in net sales was driven by incremental net sales from acquired businesses prior to the anniversary of their acquisitions, a 0.8% increase in comparable sales, and an increase for non-comparable store sales, partially offset by the impact of stores closed, primarily the Town Shoes banner stores, the decrease in Brand Portfolio sales after the anniversary of the acquisition, and the loss of sales from the exit of Ebuys.
In fiscal 2019, gross profit as a percentage of net sales was 28.6%, a decrease of 90 basis points from 29.5% in the previous year. The decrease in the gross profit rate was primarily due to the decline in the U.S. Retail segment primarily driven by higher shipping costs in the current year associated with higher digital penetration and a benefit recognized in fiscal 2018 as a result of adjusting our loyalty programs deferred revenue due to the relaunch of the DSW VIP rewards program. The Canada Retail segment gross profit margin improved primarily due to lower clearance activity with improvements in the inventory position and improved leverage in occupancy costs with the exit of the Town Shoes banner last year.
Net income for fiscal 2019 was $94.5 million, or $1.27 per diluted share, which included net after-tax charges of $19.8 million, or $0.26 per diluted share, primarily related to integration and restructuring expenses associated with the businesses acquired in fiscal 2018 and impairment charges. Net loss for fiscal 2018 was $20.5 million, or $0.26 loss per diluted share, which included net after-tax charges of $155.3 million, or $1.92 per diluted share, primarily related to impairment charges, acquisition-related activities, the exit of the Town Shoes banner, other restructuring costs, and the net tax expense impact of finalizing the U.S. Tax Reform implementation assessment.
22
We continue making investments in our business that support our long-term growth objectives. During fiscal 2019, we invested $77.8 million in capital expenditures compared to $65.4 million during fiscal 2018. Our capital expenditures during fiscal 2019 were primarily related to 16 new store openings, store remodels and business infrastructure.
Results of Operations
The following represents selected components of our consolidated results of operations, with associated percentages of net sales:
Fiscal | ||||||||||||||||||||
2019 | 2018 | Change | ||||||||||||||||||
(dollars in thousands, except per share amounts) | Amount | % of Net Sales | Amount | % of Net Sales | Amount | % | ||||||||||||||
Net sales(1) | $ | 3,492,687 | 100.0 | % | $ | 3,177,918 | 100.0 | % | $ | 314,769 | 9.9 | % | ||||||||
Cost of sales | (2,493,017 | ) | (71.4 | ) | (2,239,229 | ) | (70.5 | ) | (253,788 | ) | 11.3 | % | ||||||||
Gross profit(1) | 999,670 | 28.6 | 938,689 | 29.5 | 60,981 | 6.5 | % | |||||||||||||
Operating expenses(1) | (874,749 | ) | (25.1 | ) | (820,222 | ) | (25.7 | ) | (54,527 | ) | 6.6 | % | ||||||||
Income from equity investment in ABG-Camuto | 10,149 | 0.3 | 1,298 | 0.0 | 8,851 | 681.9 | % | |||||||||||||
Impairment charges | (7,771 | ) | (0.2 | ) | (60,760 | ) | (1.9 | ) | 52,989 | (87.2 | )% | |||||||||
Operating profit | 127,299 | 3.6 | 59,005 | 1.9 | 68,294 | 115.7 | % | |||||||||||||
Interest income (expense), net | (7,355 | ) | (0.2 | ) | 1,288 | 0.0 | (8,643 | ) | NM | |||||||||||
Non-operating expenses, net | (170 | ) | (0.0 | ) | (49,616 | ) | (1.6 | ) | 49,446 | (99.7 | )% | |||||||||
Income before income taxes and loss from equity investment in TSL | 119,774 | 3.4 | 10,677 | 0.3 | 109,097 | 1,021.8 | % | |||||||||||||
Income tax provision | (25,277 | ) | (0.7 | ) | (29,833 | ) | (0.9 | ) | 4,556 | (15.3 | )% | |||||||||
Loss from equity investment in TSL | — | — | (1,310 | ) | 0.0 | 1,310 | NM | |||||||||||||
Net income (loss) | $ | 94,497 | 2.7 | % | $ | (20,466 | ) | (0.6 | )% | $ | 114,963 | NM | ||||||||
Basic and diluted earnings (loss) per share: | ||||||||||||||||||||
Basic earnings (loss) per share | $ | 1.28 | $ | (0.26 | ) | $ | 1.54 | NM | ||||||||||||
Diluted earnings (loss) per share | $ | 1.27 | $ | (0.26 | ) | $ | 1.53 | NM | ||||||||||||
Weighted average shares used in per share calculations: | ||||||||||||||||||||
Basic shares | 73,602 | 80,026 | (6,424 | ) | (8.0 | )% | ||||||||||||||
Diluted shares | 74,605 | 80,026 | (5,421 | ) | (6.8 | )% | ||||||||||||||
NM - Not meaningful
(1) | We changed our presentation of net sales and gross profit for all periods presented to include commission income. Previously reported other revenue, which primarily included operating sublease income, was reclassified to operating expenses. |
23
Net Sales
The following summarizes the change in consolidated net sales from the previous fiscal year:
Fiscal | |||||||
(in thousands) | 2019 | 2018 | |||||
Consolidated net sales for the previous fiscal year | $ | 3,177,918 | $ | 2,805,555 | |||
Increase in comparable sales | 23,518 | 158,225 | |||||
Net increase from non-comparable store sales and other changes | 11,920 | 55,474 | |||||
Loss of net sales from closed stores | (50,342 | ) | (11,707 | ) | |||
Decrease in Brand Portfolio segment net sales after anniversary of acquisition | (7,687 | ) | — | ||||
Incremental external net sales from 2018 acquired businesses prior to the anniversary of their acquisitions | 342,992 | 309,961 | |||||
Loss of net sales from the exit of Ebuys and Gordmans | (5,632 | ) | (103,964 | ) | |||
Net sales during the 53rd week in fiscal 2017 | — | (35,626 | ) | ||||
Consolidated net sales | $ | 3,492,687 | $ | 3,177,918 | |||
The following summarizes net sales by segment:
Fiscal | Change | |||||||||||||||
(dollars in thousands) | 2019 | 2018 | Amount | % | Comparable Sales %(1) | |||||||||||
Segment net sales: | ||||||||||||||||
U.S. Retail | $ | 2,745,395 | $ | 2,738,989 | $ | 6,406 | 0.2 | % | 0.3% | |||||||
Canada Retail | 249,017 | 220,325 | 28,692 | 13.0 | % | 7.2% | ||||||||||
Brand Portfolio | 448,285 | 99,812 | 348,473 | 349.1 | % | 98.8% | ||||||||||
Other | 122,090 | 128,968 | (6,878 | ) | (5.3 | )% | 0.3% | |||||||||
Total segment net sales | 3,564,787 | 3,188,094 | 376,693 | 11.8 | % | 0.8% | ||||||||||
Elimination of intersegment net sales | (72,100 | ) | (10,176 | ) | (61,924 | ) | 608.5 | % | ||||||||
Consolidated net sales | $ | 3,492,687 | $ | 3,177,918 | $ | 314,769 | 9.9 | % | ||||||||
(1) | For the Canada Retail segment, stores from the TSL acquisition that were in operation for at least 14 months at the beginning of fiscal 2019, along with its e-commerce sales, were added to the comparable base beginning with the second quarter of fiscal 2019. For the Brand Portfolio segment, sales from the direct-to-consumer www.vincecamuto.com e-commerce site were added to the comparable base beginning with the fourth quarter of fiscal 2019. |
The increase in net sales was driven by incremental net sales from acquired businesses prior to the anniversary of their acquisitions, a 0.8% increase in comparable sales, and an increase for non-comparable store sales, partially offset by the impact of stores closed, primarily the Town Shoes banner stores, the decrease in Brand Portfolio sales after the anniversary of the acquisition, and the loss of sales from the exit of Ebuys. Within the U.S. Retail segment, comparable sales increased primarily due to higher comparable transactions driven by an increase in traffic, partially offset by a decline in comparable average dollar sales per transaction. Within the Canada Retail segment, comparable sales increased due to higher comparable average dollar sales per transaction, primarily as a result of the significant improvements to its digital platform and lower clearance inventory.
24
The following summarizes gross profit by segment:
Fiscal | |||||||||||||||||||||||
2019 | 2018 | Change | |||||||||||||||||||||
(dollars in thousands) | Amount | % of Segment Net Sales | Amount | % of Segment Net Sales | Amount | % | Basis Points | ||||||||||||||||
Segment gross profit: | |||||||||||||||||||||||
U.S. Retail | $ | 786,976 | 28.7 | % | $ | 840,174 | 30.7 | % | $ | (53,198 | ) | (6.3 | )% | (200 | ) | ||||||||
Canada Retail | 79,850 | 32.1 | % | 55,937 | 25.4 | % | 23,913 | 42.7 | % | 670 | |||||||||||||
Brand Portfolio | 114,170 | 25.5 | % | 18,920 | 19.0 | % | 95,250 | 503.4 | % | 650 | |||||||||||||
Other | 26,065 | 21.3 | % | 25,252 | 19.6 | % | 813 | 3.2 | % | 170 | |||||||||||||
1,007,061 | 940,283 | ||||||||||||||||||||||
Elimination of intersegment gross profit | (7,391 | ) | (1,594 | ) | |||||||||||||||||||
Consolidated gross profit | $ | 999,670 | 28.6 | % | $ | 938,689 | 29.5 | % | $ | 60,981 | 6.5 | % | (90 | ) | |||||||||
The U.S. Retail segment gross profit margin declined primarily driven by higher shipping costs in the current year associated with higher digital penetration and a benefit recognized in fiscal 2018 as a result of adjusting our loyalty programs deferred revenue due to the relaunch of the DSW VIP rewards program. The Canada Retail segment gross profit margin improved primarily due to lower clearance activity with improvements in the inventory position and improved leverage in occupancy costs with the exit of the Town Shoes banner last year. The Brand Portfolio segment gross profit for fiscal 2018 includes only the fourth quarter of activity following the acquisition whereas fiscal 2019 includes a full year of activity. The gross profit margin of the Brand Portfolio segment in fiscal 2018 was negatively impacted by the recognition to cost of sales of $5.3 million of inventory step-up value related to the valuation of inventory at acquisition.
Elimination of intersegment gross profit consisted of the following:
Fiscal | Change | |||||||||||||
(dollars in thousands) | 2019 | 2018 | Amount | % | ||||||||||
Elimination of intersegment activity - | ||||||||||||||
Net sales recognized by Brand Portfolio segment | $ | (72,100 | ) | $ | (10,176 | ) | $ | (61,924 | ) | 608.5 | % | |||
Cost of sales: | ||||||||||||||
Cost of sales recognized by Brand Portfolio segment | 51,068 | 8,098 | 42,970 | 530.6 | % | |||||||||
Recognition of intersegment gross profit for inventory previously purchased that was subsequently sold to external customers during the current period | 13,641 | 484 | 13,157 | 2,718.4 | % | |||||||||
Gross profit | $ | (7,391 | ) | $ | (1,594 | ) | $ | (5,797 | ) | 363.7 | % | |||
Operating Expenses
Operating expenses as a percentage of net sales were 25.1% and 25.7% for fiscal 2019 and fiscal 2018, respectively. The decrease as a percentage of net sales over the prior year was primarily driven by lower incentive compensation and marketing investments in fiscal 2019, and the impact of lease exit charges and acquisition-related costs in fiscal 2018, partially offset by the impact of including Camuto Group in the consolidated results and higher integration and restructuring charges in fiscal 2019.
Income from equity investment in ABG-Camuto
We account for our equity investment in ABG-Camuto using the equity method of accounting, with the net earnings attributable to our 40% investment being classified within operating profit. ABG-Camuto is an integral part of the Brand Portfolio segment given the licensing agreement between us and ABG-Camuto, which allows us to sell licensed branded products to wholesale customers. Income from equity investment in ABG-Camuto for fiscal 2018 includes only the fourth quarter of activity whereas fiscal 2019 includes a full year of activity.
25
Impairment charges
During fiscal 2019, we recorded impairment charges of $7.8 million, including $4.8 million for operating lease assets and other property and equipment in the Brand Portfolio segment related to the planned consolidation of certain locations as part of our integration efforts and $3.0 million primarily for operating lease assets related to under-performing stores ($2.3 million and $0.7 million for the U.S. Retail and Canada Retail segments, respectively). During fiscal 2018, we recorded impairment charges of $60.8 million, including $41.8 million for Canada Retail segment goodwill, $13.9 million for an abandoned corporate internal-use software that was under development and $5.1 million primarily for leasehold improvements related to under-performing stores. With the TSL acquisition being accounted for as a step acquisition, the purchase price included the fair value of our previously held assets, which considered the valuation of the TSL enterprise. This valuation identified that the resulting goodwill was not supportable as the value of the acquired net assets exceeded the enterprise fair value. As a result, during fiscal 2018, we recorded a goodwill impairment charge that resulted in impairing all of the Canada Retail segment’s goodwill.
Non-operating Expenses, net
Due to the acquisition of the remaining interest in TSL during the second quarter of fiscal 2018, we remeasured to fair value our previously held assets, which included our equity investment in TSL and notes and accounts receivable from TSL. As a result of the remeasurement, we recorded a loss of $34.0 million to non-operating expenses, net. Also during fiscal 2018, we reclassified a net loss of $12.2 million of foreign currency translation related to the previously held balances from accumulated other comprehensive loss to non-operating expenses, net.
Income Taxes
The effective tax rate for fiscal 2019 was 21.1% compared to 318.5% for fiscal 2018. The effective tax rates reflect the impact of federal, state and local, and foreign taxes. During fiscal 2019, we had $3.9 million valuation allowance release primarily related to the net operating loss utilization for our legal entity in Canada. During fiscal 2018, we had $2.1 million of tax expense due to finalizing the U.S. Tax Reform implementation and we had additional tax provision expense of approximately $20.0 million due to recording an additional valuation allowance and nondeductible discrete items, primarily related to the charges recorded as a result of the acquisition of TSL.
Liquidity and Capital Resources
Overview
Our primary ongoing operating cash flow requirements are for inventory purchases, capital expenditures for new stores, improving our information technology systems and infrastructure growth. Our working capital and inventory levels fluctuate seasonally. We are committed to a cash management strategy that maintains liquidity to adequately support the operation of the business, pursue our growth strategy and withstand unanticipated business volatility, including the impact of the outbreak of COVID-19. We believe that cash generated from our operations and the business continuity plans put in place, together with our current levels of cash and investments, as well as the use of our Credit Facility, as subsequently amended, are sufficient over the next 12 months to maintain our ongoing operations, support working capital requirements, and fund capital expenditures. The cash generated from operations is based on our expectation of re-opening our stores beginning primarily in the second quarter of fiscal 2020 with a gradual return of store traffic throughout the remainder of fiscal 2020. If additional liquidity is needed, we may take additional actions including adjusting our marketing spend, implement further employee furloughs, reducing the store labor requirements when stores open, and forego additional capital expenditures and other discretionary expenses.
Operating Cash Flows
For fiscal 2019, our net cash provided by operations was $196.7 million compared to $175.3 million for fiscal 2018. The increase in net cash provided by operating activities was driven by distributions received from our equity investment in ABG-Camuto and improved use of working capital over fiscal 2018, as fiscal 2018 had an increased use of cash to fund working capital requirements due to the addition of the acquired businesses.
26
Investing Cash Flows
For fiscal 2019, net cash used in investing activities was $27.4 million, which was due to capital expenditures of $77.8 million, partially offset by the net liquidation of our available-for-sale securities. For fiscal 2018, net cash used in investing activities was $282.0 million, which was due to the acquisitions of TSL and Camuto Group, capital expenditures of $65.4 million and $16.0 million of additional borrowings by TSL prior to the acquisition, partially offset by the net liquidation of our available-for-sale securities.
Financing Cash Flows
For fiscal 2019, net cash used in financing activities was $183.4 million, which was due to the payment of dividends and the repurchase of Class A common shares under the share repurchase program, offset by the additional borrowings on our revolving line of credit, net of payments made, of $30.0 million. During fiscal 2019, we repurchased 7.1 million Class A common shares at a cost of $141.6 million. For fiscal 2018, net cash provided by financing activities was $30.0 million, which was due to borrowings on our revolving line of credit of $160.0 million, offset primarily by the payment of dividends and the repurchase of Class A common shares under the share repurchase program. During fiscal 2018, we repurchased 2.0 million Class A common shares at a cost of $47.5 million.
Debt
Credit Facility- Our Credit Facility, with a maturity date of August 25, 2022, provides a revolving line of credit up to $400 million, with sub-limits for the issuance of up to $50 million in letters of credit, swing loan advances of up to $15 million, and the issuance of up to $75 million in foreign currency revolving loans and letters of credit. The Credit Facility may be used to provide funds for working capital, capital expenditures, share repurchases, other expenditures, and permitted acquisitions as defined by the Credit Facility. Our Credit Facility allows the payments of dividends by us or our subsidiaries, provided that immediately before and after a dividend payment there is no event of default, as defined in our Credit Facility.
Loans issued under the revolving line of credit bear interest, at our option, at a base rate or an alternate base rate as defined in the Credit Facility plus a margin based on our leverage ratio, with an interest rate of 3.4% as of February 1, 2020. Any loans issued in CAD bear interest at the alternate base rate plus a margin based on our leverage ratio. Interest on letters of credit issued under the Credit Facility is variable based on our leverage ratio and the type of letters of credit, with an interest rate of 1.8% as of February 1, 2020. Commitment fees are based on the average unused portion of the Credit Facility at a variable rate based on our leverage ratio. As of February 1, 2020 and February 2, 2019, we had $190.0 million and $160.0 million, respectively, outstanding under the Credit Facility. As of February 1, 2020, with the amount outstanding under the Credit Facility and $3.0 million in letters of credit issued, we had $207.0 million available for borrowings. Interest expense related to the Credit Facility includes interest on borrowings and letters of credit, commitment fees and the amortization of debt issuance costs.
Debt Covenants- The Credit Facility contains financial and other covenants, including, but not limited to, limitations on indebtedness, liens and investments, as well as the maintenance of a leverage ratio not to exceed 3.25:1 and a fixed charge coverage ratio not to be less than 1.75:1. A violation of any of the covenants could result in a default under the Credit Facility that would permit the lenders to restrict our ability to further access the Credit Facility for loans and letters of credit and require the immediate repayment of any outstanding loans under the Credit Facility. As of February 1, 2020, we were in compliance with all financial covenants.
Subsequent Events- Subsequent to February 1, 2020, we borrowed $205.0 million from the Credit Facility as a precautionary measure to increase our cash position and preserve financial flexibility considering uncertainty in the U.S. and global markets resulting from COVID-19, resulting in $2.0 million of available for borrowing.
On April 30, 2020, the Credit Facility was amended, which resulted in various changes including:
• | Provides for a lien on all of the Company's assets; |
• | Reduces the borrowing availability to $375.0 million on October 31, 2020, $350.0 million on January 30, 2021, $325.0 million on May 1, 2021, and $300.0 million on July 31, 2021; |
• | Redefines the components for calculating the leverage ratio and fixed charge coverage ratio to adjust for certain temporary impacts due to COVID-19; |
• | Changes the maximum leverage ratio covenant to 3.50:1 as of May 2, 2020, 4.00:1 as of August 1, 2020, 3.75:1 as of October 31, 2020, and 3.50:1 as of January 30, 2021 and as of the end of each fiscal quarter thereafter; |
27
• | Changes the minimum fixed charge coverage ratio to 1.25:1 as of May 2, 2020 and 1.05:1 as of August 1, 2020 and as of the end of each fiscal quarter thereafter; and |
• | Restricts the Company from paying dividends, making share repurchases, and making certain acquisitions. |
Capital Expenditure Plans
We expect to significantly reduce capital expenditures in fiscal 2020 in response to the COVID-19 outbreak. For fiscal 2020, we had started working on new stores and we are reevaluating those plans. Our future investments will depend primarily on the number of stores we will be required to open based on commitments previously made.
Off-Balance Sheet Liabilities and Other Contractual Obligations
We do not have any material off-balance sheet arrangements as defined by Item 303(a)(4) of Regulation S-K. The following table presents a summary of our minimum contractual commitments and obligations as of February 1, 2020:
Payments due by Period | |||||||||||||||||||
(in thousands) | Total | Less Than 1 Year | 1 - 3 Years | 3 -5 Years | More Than 5 Years | ||||||||||||||
Operating lease liabilities | $ | 1,165,894 | $ | 223,107 | $ | 428,585 | $ | 270,205 | $ | 243,997 | |||||||||
Debt, including estimated interest payments(1) | 206,881 | 6,565 | 200,316 | — | — | ||||||||||||||
Minimum license commitments(2) | 276,131 | 33,659 | 67,318 | 68,618 | 106,536 | ||||||||||||||
Purchase obligations(3) | 11,709 | 9,838 | 1,871 | — | — | ||||||||||||||
Total | $ | 1,660,615 | $ | 273,169 | $ | 698,090 | $ | 338,823 | $ | 350,533 | |||||||||
(1) | Interest payments on our revolving line of credit were estimated using the effective interest rate as of February 1, 2020 and assuming interest payments on $190.0 million outstanding on our revolving line of credit through August 25, 2022, the maturity date of our Credit Facility. |
(2) | Minimum license commitments include guaranteed minimum royalties, including amounts due to the ABG-Camuto joint venture, and fixed licensing and other fees due to other parties. |
(3) | Purchase obligations include commitments where we would not be able to cancel such obligations without payment or penalty, including items to be purchased for projects that were under construction or for which a lease has been signed. |
Recent Accounting Pronouncements
The information related to recent accounting pronouncements as set forth in Note 1, Significant Accounting Policies, of the Consolidated Financial Statements included in this Annual Report on Form 10-K is incorporated herein by reference.
Critical Accounting Policies and Estimates
As discussed in Note 1, Significant Accounting Policies, of the Consolidated Financial Statements included in this Annual Report on Form 10-K, the preparation of our consolidated financial statements in conformity with accounting principles generally accepted in the U.S. ("GAAP") requires management to make estimates and assumptions that affect the reported amounts of assets, liabilities, and disclosure of commitments and contingencies at the date of the consolidated financial statements and reported amounts of revenue and expenses during the reporting period. We base these estimates and judgments on factors we believe to be relevant, the results of which form the basis for making judgments about the carrying values of assets and liabilities that are not readily apparent from other sources. The process of determining significant estimates is fact-specific and takes into account factors such as historical experience, current and expected economic conditions, product mix, and in some cases, actuarial and appraisal techniques. We constantly re-evaluate these significant factors and make adjustments where facts and circumstances dictate.
While we believe that the factors considered provide a meaningful basis for the accounting policies applied in the preparation
of the consolidated financial statements, we cannot guarantee that our estimates and assumptions will be accurate. As the determination of these estimates requires the exercise of judgment, actual results may differ from those estimates, and such differences may be material to our consolidated financial statements.
28
We believe the following represent the most significant accounting policies, critical estimates and assumptions, among others, used in the preparation of our consolidated financial statements:
Policy | Judgments and Estimates | Effect if Actual Results Differ from Assumptions |
Business Combinations. We account for business combinations using the acquisition method of accounting, which requires that once control is obtained, all the assets acquired and liabilities assumed be recorded at their respective fair values at the date of acquisition. The determination of fair values of assets and liabilities acquired requires estimates and the use of valuation techniques when market value is not readily available. Any excess of purchase price over the fair value of net tangible and intangible assets acquired is allocated to goodwill. | The fair values for property and equipment were determined using the cost and market approaches. The fair value of inventories, which is made up of finished goods, was determined based on market assumptions for realizing a reasonable profit after selling costs. For intangible assets, we generally use an income approach to determine fair value. The income approach requires management to make significant estimates and assumptions. These estimates and assumptions may include the use of discount rates, growth rates, customer attrition rates, royalty rates, and forecasts of net sales and operating income. The discount rates applied to the projections reflect the risk factors associated with those projections. We determined that goodwill should be allocated to reporting units within the U.S. Retail and Brand Portfolio segments based on each reporting unit’s estimated benefit from the expected synergies from the Camuto Group acquisition. | We allocated $67.8 million of the goodwill to the U.S. Retail segment based primarily on a discounted cash flow of the sourcing benefit. The remaining $20.0 million of goodwill was allocated to the First Cost reporting unit within the Brand Portfolio segment based on the fair value of the reporting unit over the fair value of the net assets allocated to the reporting unit. Although we believe our estimates of fair value are reasonable, actual financial results could differ from those estimates due to the inherent uncertainty involved in making such estimates. Changes in assumptions concerning future financial results or other underlying assumptions could result in future impairment charges of long-lived assets and goodwill and other indefinite lived intangible assets, discussed in more detail below. |
Impairment of Goodwill and Other Indefinite Lived Intangible Assets. We evaluate goodwill and other indefinite lived intangible assets for impairment annually during our fourth quarter, or more frequently if an event occurs or circumstances change, such as material deterioration in performance or a significant and sustained decline in our stock price, that would indicate that impairment may exist. When evaluating for impairment, we may first perform a qualitative assessment to determine whether it is more likely than not that there is an impairment. If we do not perform a qualitative assessment, or if we determine that it is more likely than not that the carrying value exceeds its fair value, we will calculate the estimated fair value. Fair value is the price a willing buyer would pay and is typically calculated using a discounted cash flow analysis. Where deemed appropriate, we may also utilize a market approach for estimating fair value. Impairment charges are calculated as the amount by which the carrying amount exceeds its fair value, but not to exceed the carrying value for goodwill. | When assessing goodwill and other indefinite lived intangible assets for impairment, our decision to perform a qualitative impairment assessment is influenced by a number of factors, including the significance of the excess of the estimated fair value over carrying value at the last assessment date and the amount of time since the last quantitative fair value assessments. Our impairment calculations contain uncertainties as we are required to make assumptions and to apply judgment when estimating future cash flows, including projected revenue growth and operating income, as well as selecting an appropriate discount rate and assumed royalty rate. Estimates of revenue growth and operating income are based on internal projections considering past performance and forecasted growth, strategic initiatives, and the business environment impacting performance. The discount rate and royalty rate are selected based on market participant assumptions. These estimates are highly subjective, and our ability to realize the future cash flows used in our fair value calculations is affected by factors such as the success of strategic initiatives, changes in economic conditions, changes in our operating performance and changes in our business strategies. | As of February 1, 2020, we had $93.7 million in goodwill within the U.S. Retail segment, which is also the reporting unit, and $20.0 million within the Brand Portfolio segment for the First Cost reporting unit, and $15.5 million in indefinite-lived trademarks and tradenames. We determined the fair value of the reporting units and of the indefinite-lived intangibles was significantly in excess of their carrying value and a 10% decrease in fair value would not result in an impairment charge. Accordingly, we did not recognize an impairment charge during fiscal 2019. However, as we periodically reassess estimated future cash flows and asset fair values, changes in our estimates and assumptions may cause us to realize material impairment charges in the future. |
29
Policy | Judgments and Estimates | Effect if Actual Results Differ from Assumptions |
Asset Impairment of Long-lived Assets. We periodically evaluate the carrying amount of our long-lived assets, primarily property and equipment and operating lease assets, when events and circumstances warrant such a review to ascertain if any assets have been impaired. The carrying amount of a long-lived asset or asset group is considered impaired when the carrying value of the asset or asset group exceeds the expected future cash flows from the asset or asset group. The impairment loss recognized is the excess of the carrying value of the asset or asset group over its fair value. | Our reviews are conducted at the lowest identifiable level, which typically is at the store level for the majority of our long-lived assets. Fair value at the store level is typically based on projected discounted cash flows using a discount rate determined by management. We also review construction in progress projects, including internal-use software under development, for recoverability when we have a strategic shift in our plans. | A 10% change in our projected cash flows for our store fleet would not result in a material amount of additional impairment charges. To the extent these future projections or our strategies change, the conclusion regarding impairment may differ from our current estimates. |
Inventories. The U.S. Retail segment accounts for inventory using the retail inventory method and is stated at the lower of cost or market. Under the retail inventory method, the valuation of inventories at cost and the resulting gross profits are determined by applying a calculated cost-to-retail ratio to the retail value of inventories. The cost basis of inventories reflected on the balance sheet is decreased by charges to cost of sales at the time the retail value of the inventory is lowered by markdowns. The Canada Retail and Brand Portfolio segments account for inventory using the weighted average cost method and is stated at the lower of cost or net realizable value. We monitor aged inventory for obsolete and slow-moving inventory that may need to be liquidated at amounts below cost. Reductions to inventory values establish a new cost basis. Favorable changes in facts or circumstances do not result in an increase in the newly established cost basis. We perform physical inventory counts or cycle counts on all inventory on hand throughout the year and adjust the recorded balance to reflect the results. We record estimated shrinkage between physical inventory counts based on historical experience and recent results. | Inherent in the calculation of inventories are certain significant judgments and estimates, including setting the original merchandise retail value, markdowns, shrinkage, and liquidation values. Shrinkage is calculated as a percentage of sales from the last physical inventory date based on both historical experience as well as recent physical inventory results. Aged inventory may be written down using estimated liquidation values and cost of disposal based on historical experience. | If the reduction to inventories for markdowns, shrinkage, and aged inventories were to change by 10%, cost of sales would increase by approximately $4.3 million. |
Customer Allowances and Discounts. We reduce net sales by the amount of actual and remaining expected customer allowances and discounts. | Customer allowances are provided to our wholesale customers for margin assistance, co-op advertising support, and various other deductions. We estimate the reserves needed for margin assistance by reviewing inventory levels held by retailers, expected markdowns, gross margins realized, and other performance indicators. Other customer deductions are estimated using historical experience and anticipated future trends. Co-op advertising allowances are estimated based on arrangements with customers. We continually track the customer allowances and discounts provided to support our estimated reserves and adjust accordingly. | As of February 1, 2020, the reserve for customer allowances and discounts was $11.5 million. |
30
Policy | Judgments and Estimates | Effect if Actual Results Differ from Assumptions |
Leases. We recognize lease liabilities based on the present value of the future fixed lease commitments over the lease term with corresponding lease assets. The majority of our real estate leases provide for renewal options, which are typically not included in the lease term used for measuring the lease assets and lease liabilities as it is not reasonably certain we will exercise options. | We determine the discount rate for each lease by estimating the rate that we would be required to pay on a secured borrowing for an amount equal to the lease payments over the lease term. | As of February 1, 2020, a change in our discount rate of 100 basis points would have changed the recorded operating lease assets and liabilities by $31.0 million. |
Foreign Tax Contingencies. During the due diligence procedures performed related to the acquisition of Camuto Group, we identified probable contingent liabilities associated with unpaid foreign payroll and other taxes that could also result in assessed penalties and interest. | We developed an initial estimate of the range of outcomes related to these obligations and have since refined our estimates with additional analysis. Our current estimate of the range of outcomes is now $28.1 million to $40.0 million for obligations we are aware of at this time. We recorded a contingent liability for the low end of the range and an indemnification asset of $24.5 million representing the estimated amount we expect to collect under the terms of the securities purchase agreement with the Sellers. We are continuing to assess the exposure, which may result in material changes to these estimates, and we may identify additional contingent liabilities. We believe that the Sellers are obligated to indemnify us for any payments to foreign taxing authorities for the periods up to the acquisition date. Although a portion of the purchase price is held in escrow and another portion is held in a restricted bank account, there can be no assurance that we will successfully collect all amounts that we may be obligated to settle with the foreign taxing authorities. | As of February 1, 2020, our liability for foreign tax contingencies was $28.1 million with an estimated range of outcomes of $28.1 million to $40.0 million for obligations we are aware of at this time. |
Income Taxes. We determine the aggregate amount of income tax expense to accrue and the amount which will be currently payable based upon tax statutes of each jurisdiction we do business in. Deferred tax assets and liabilities, as a result of these timing differences, are reflected on our balance sheet for temporary differences that will reverse in subsequent years. A valuation allowance is established against deferred tax assets when it is more likely than not that some or all of the deferred tax assets will not be realized. We review and update our tax positions as necessary to add any new uncertain tax positions taken, or to remove previously identified uncertain positions that have been adequately resolved. Additionally, uncertain positions may be remeasured as warranted by changes in facts or law. | Tax laws, regulations, and policies in various jurisdictions may be subject to significant change due to economic, political and other conditions, and significant judgment is required in estimating our provision and accruals for taxes. There may be transactions that occur during the ordinary course of business for which the ultimate tax determination is uncertain. The U.S. Treasury Department, the U.S. Internal Revenue Service, and other standard-setting bodies could interpret or issue guidance on how provisions of tax laws, regulations, and policies will be applied or otherwise administered that is different from our interpretation. In addition, state, local or foreign jurisdictions may enact tax laws that could result in further changes to taxation and materially affect our financial position and results of operations. | As of February 1, 2020, we had a valuation allowance of $9.5 million and gross unrecognized tax benefits of $10.8 million. However, we may be required to make adjustments that may materially impact our provision for income taxes in the period in which the adjustments are made based on additional information, additional guidance or revised interpretations. |
ITEM 7A. | QUANTITATIVE AND QUALITATIVE DISCLOSURES ABOUT MARKET RISK |
We have market risk exposure related to interest rates and foreign currency exchange rates. Market risk is measured as the potential negative impact on earnings, cash flows or fair values resulting from a hypothetical change in interest rates or foreign currency exchange rates over the next year. We currently do not utilize hedging instruments to mitigate these market risks.
Interest Rate Risk
We hold available-for-sale securities, which are not materially affected by changes in market interest rates. Also, as of February 1, 2020, we had $190.0 million outstanding on our revolving line of credit under our Credit Facility. Borrowings under our Credit Facility are based on a variable rate of interest, which exposes us to interest rate market risks, particularly during a period of rising interest rates. The impact of a hypothetical 100 basis point increase in interest rates on our revolving line of credit would not result in a material amount of additional expense over a 12-month period based on the balance as of February 1, 2020.
Foreign Currency Exchange Risk
We are exposed to the impact of foreign exchange rate risk primarily through our operations in Canada where the functional currency is the Canadian dollar, as well as foreign denominated cash accounts. A hypothetical 10% movement in the exchange rates could result in a $2.1 million foreign currency translation fluctuation, which would be recorded in accumulated other comprehensive loss within the consolidated balance sheets, and $0.5 million of foreign currency revaluation, which would be recorded in non-operating expenses, net within the consolidated statements of operations.
ITEM 8. | FINANCIAL STATEMENTS AND SUPPLEMENTARY DATA |
Our consolidated financial statements and the Report of Independent Registered Public Accounting Firm thereon are filed pursuant to this Item 8 and are included in this report beginning on page F-1.
ITEM 9. | CHANGES IN AND DISAGREEMENTS WITH ACCOUNTANTS ON ACCOUNTING AND FINANCIAL DISCLOSURE |
None.
ITEM 9A. | CONTROLS AND PROCEDURES |
Evaluation of Disclosure Controls and Procedures
We, under the supervision and with the participation of our management, including our Chief Executive Officer and Chief Financial Officer, performed an evaluation of the effectiveness of our disclosure controls and procedures (as defined in Rules 13a-15(e) and 15d-15(e) under the Securities Exchange Act of 1934, as amended (the "Exchange Act")). Based on that evaluation, our Chief Executive Officer and Chief Financial Officer concluded, as of the end of the period covered by this Annual Report, that such disclosure controls and procedures were effective.
Management's Report on Internal Control over Financial Reporting
Management is responsible for establishing and maintaining adequate internal control over financial reporting for us (as defined in Rules 13a-15(f) and 15d-15(f) under the Exchange Act). Our internal control over financial reporting is designed to provide reasonable assurance regarding the reliability of financial reporting and the preparation of financial statements in accordance with accounting principles generally accepted in the United States of America. Management assessed the effectiveness of our internal control system as of February 1, 2020. In making its assessment, we used the criteria set forth by the Committee of Sponsoring Organizations of the Treadway Commission in Internal Control - Integrated Framework (2013). Based on this assessment, management concluded that our internal control over financial reporting was effective to provide reasonable assurance regarding the reliability of financial reporting.
Deloitte & Touche LLP, our independent registered public accounting firm, has issued an attestation report covering our internal control over financial reporting, as stated in its report on page F-1 of this Annual Report.
31
Changes in Internal Control over Financial Reporting
During fiscal 2018, we acquired TSL and Camuto Group and integrated TSL and Camuto Group into our system of internal controls during fiscal 2019. As a result, our internal control over financial reporting now includes controls and procedures with respect to transactions and account balances of TSL and Camuto Group. Other than the changes with regard to TSL and Camuto Group, no change was made in our internal control over financial reporting, as such term is defined in Exchange Act Rules 13a-15(f) and 15d -15(e), during our last fiscal quarter that has materially affected, or is reasonably likely to materially affect, our internal control over financial reporting.
ITEM 9B. | OTHER INFORMATION |
Fourth Amendment to Credit Agreement
The information set forth below is included herein for the purpose of providing disclosure under Item 1.01 (Entry into a Material Definitive Agreement) and Item 2.03 (Creation of a Direct Financial Obligation or an Obligation under an Off-Balance Sheet Arrangement of a Registrant) of Form 8-K.
On April 30, 2020, the Company and certain of its subsidiaries entered into a Fourth Amendment to the Credit Agreement (the "Amendment"), which amends the Credit Facility, dated as of August 25, 2017, as amended, among the Company as lead borrower, certain of the Company’s Canadian subsidiaries that may become borrowers thereunder, certain of the Company’s domestic subsidiaries as guarantors, the lenders party thereto, and PNC Bank, National Association as administrative agent (the "Agent") for the lenders. The Amendment, among other matters, makes the following modifications to the Credit Facility:
• | Provides for a lien on all of the Company's assets; |
• | Reduces the borrowing availability to $375.0 million on October 31, 2020, $350.0 million on January 30, 2021, $325.0 million on May 1, 2021, and $300.0 million on July 31, 2021; |
• | Redefines the components for calculating the leverage ratio and fixed charge coverage ratio to adjust for certain temporary impacts due to COVID-19; |
• | Changes the maximum leverage ratio covenant to 3.50:1 as of May 2, 2020, 4.00:1 as of August 1, 2020, 3.75:1 as of October 31, 2020, and 3.50:1 as of January 30, 2021 and as of the end of each fiscal quarter thereafter; |
• | Changes the minimum fixed charge coverage ratio to 1.25:1 as of May 2, 2020 and 1.05:1 as of August 1, 2020 and as of the end of each fiscal quarter thereafter; and |
• | Restricts the Company from paying dividends, making share repurchases, and making certain acquisitions. |
The foregoing summary of the Amendment does not purport to be complete and is subject to, and qualified in its entirety by reference to, the full text of the Amendment, which is filed as Exhibit 10.4.4 to this Annual Report on Form 10-K and incorporated herein by reference, and the Pledge and Security Agreement entered into as of April 30, 2020 by the Company and certain of its subsidiaries in favor of the Agent for the secured parties, which is filed as Exhibit 10.4.5 hereto and incorporated herein by reference.
PART III
ITEM 10. | DIRECTORS, EXECUTIVE OFFICERS AND CORPORATE GOVERNANCE |
The information contained under the captions "EXECUTIVE OFFICERS," "ELECTION OF DIRECTORS" and "OTHER DIRECTOR INFORMATION, BOARD COMMITTEES, AND CORPORATE GOVERNANCE INFORMATION" in our definitive Proxy Statement for the 2020 Annual Meeting of Shareholders, to be filed with the SEC pursuant to Regulation 14A promulgated under the Exchange Act (the "Proxy Statement"), is incorporated herein by reference.
32
ITEM 11. | EXECUTIVE COMPENSATION |
The information contained under the captions "COMPENSATION OF MANAGEMENT," "OTHER DIRECTOR INFORMATION, BOARD COMMITTEES, AND CORPORATE GOVERNANCE INFORMATION," "REPORT OF THE COMPENSATION COMMITTEE" and "COMPENSATION DISCUSSION AND ANALYSIS" in the Proxy Statement is incorporated herein by reference. Notwithstanding the foregoing, the information contained in the Proxy Statement under the caption "REPORT OF THE COMPENSATION COMMITTEE" shall be deemed furnished, and not filed, in this Annual Report on Form 10-K and shall not be deemed incorporated by reference into any filing we make under the Securities Act of 1933, as amended, or the Exchange Act.
ITEM 12. | SECURITY OWNERSHIP OF CERTAIN BENEFICIAL OWNERS AND MANAGEMENT AND RELATED STOCKHOLDER MATTERS |
The information contained under the caption "SECURITY OWNERSHIP OF CERTAIN BENEFICIAL OWNERS AND MANAGEMENT" in the Proxy Statement is incorporated herein by reference.
Equity Compensation Plan Information
The following table sets forth additional information, as of February 1, 2020, about our Class A common shares that may be issued upon the exercise of options and other rights under our existing equity compensation plans and arrangements, divided between plans approved by our shareholders and plans or arrangements not submitted to our shareholders for approval. The information includes the number of shares covered by, and the weighted average exercise price of, outstanding options, warrants and other rights and the number of shares remaining available for future grants, excluding the shares to be issued upon exercise of outstanding options, warrants and other rights.
Plan Category | (a) Number of securities to be issued upon exercise of outstanding options, warrants and rights(1)(2)(3) | (b) Weighted-average exercise price of outstanding options, warrants and rights(2) | (c) Number of securities remaining available for future issuance under equity compensation plans (excluding securities reflected in column (a))(3) | |||||||
Equity compensation plans approved by security holders | 6,667,818 | $ | 24.90 | 2,928,565 | ||||||
Equity compensation plans not approved by security holders | N/A | N/A | N/A | |||||||
Total | 6,667,818 | $ | 24.90 | 2,928,565 | ||||||
N/A - Not applicable
(1) | DSW Inc. 2005 Equity Incentive Plan. |
(2) | Includes 3,760,688 shares issuable pursuant to the exercise of outstanding stock options, 1,686,981 shares issuable pursuant to restricted stock units, 767,537 shares issuable pursuant to performance-based restricted stock units and 452,612 shares issuable pursuant to director stock units. Since the restricted stock units, performance-based restricted stock units and director stock units have no exercise price, they are not included in the weighted average exercise price calculation in column (b). |
(3) | DSW Inc. 2014 Equity Incentive Plan. |
ITEM 13. | CERTAIN RELATIONSHIPS AND RELATED TRANSACTIONS, AND DIRECTOR INDEPENDENCE |
The information contained under the captions "CERTAIN RELATIONSHIPS AND RELATED TRANSACTIONS" and "OTHER DIRECTOR INFORMATION, BOARD COMMITTEES, AND CORPORATE GOVERNANCE INFORMATION" in the Proxy Statement is incorporated herein by reference.
ITEM 14. | PRINCIPAL ACCOUNTING FEES AND SERVICES |
The information contained under the caption "AUDIT AND OTHER SERVICE FEES" in the Proxy Statement is incorporated herein by reference.
33
PART IV
ITEM 15. | EXHIBITS, FINANCIAL STATEMENT SCHEDULES |
(a)(1) Financial Statements
The documents listed below are filed as part of this Form 10-K:
Page | |
Report of Independent Registered Public Accounting Firm | |
Consolidated Statements of Operations for the years ended February 1, 2020, February 2, 2019 and February 3, 2018 | |
Consolidated Statements of Comprehensive Income (Loss) for the years ended February 1, 2020, February 2, 2019 and February 3, 2018 | |
Consolidated Balance Sheets as of February 1, 2020 and February 2, 2019 | |
Consolidated Statements of Shareholders' Equity for the years ended February 1, 2020, February 2, 2019 and February 3, 2018 | |
Consolidated Statements of Cash Flows for the years ended February 1, 2020, February 2, 2019 and February 3, 2018 | |
Notes to Consolidated Financial Statements | |
(a)(2) Consolidated Financial Statement Schedules:
Schedules not filed are omitted because of the absence of the conditions under which they are required or because the required information is included in the financial statements or the notes thereto.
(a)(3) and (b) Exhibits:
Exhibit No. | Description | |
2.1 | ||
2.2 | ||
2.3 | ||
2.3.1 | ||
2.3.2 | ||
3.1 | ||
3.2 | ||
4.1 | ||
4.2* | ||
34
Exhibit No. | Description | |
10.1 | ||
10.1.1 | ||
10.2# | ||
10.2.1# | ||
10.2.2# | ||
10.3# | ||
10.3.1# | ||
10.3.2#* | ||
10.3.3#* | ||
10.3.4#* | ||
10.3.5#* | ||
10.3.6#* | ||
10.4 | ||
10.4.1* | ||
10.4.2 | ||
10.4.3* | ||
10.4.4* | ||
10.4.5* | ||
10.5 | ||
10.6# | ||
10.7* | ||
10.8 | ||
10.9 | ||
10.9.1 | ||
35
Exhibit No. | Description | |
10.10 | ||
10.10.1 | ||
10.10.2 | ||
10.10.3 | ||
10.10.4 | ||
10.10.5 | ||
10.10.6 | ||
10.11# | ||
10.12 | ||
10.12.1 | ||
10.12.2 | ||
10.12.3 | ||
10.12.4 | ||
10.13 | ||
10.14# | ||
10.14.1# | ||
10.15# | ||
10.16# | ||
10.17# | ||
10.18# | ||
10.19#* | ||
36
Exhibit No. | Description | |
10.20#* | ||
10.20.1#* | ||
10.21#* | ||
21.1* | ||
23.1* | ||
24.1* | ||
31.1* | ||
31.2* | ||
32.1* | ||
32.2* | ||
101* | The following materials from the Designer Brands Inc. Annual Report on Form 10-K for the year ended February 1, 2020, formatted in iXBRL (Inline eXtensible Business Reporting Language): (i) Consolidated Statements of Operations; (ii) Consolidated Statements of Comprehensive Income (Loss); (iii) Consolidated Balance Sheets; (iv) Consolidated Statements of Shareholders’ Equity; (v) Consolidated Statements of Cash Flows; and (vi) Notes to Consolidated Financial Statements. | |
104* | Cover Page Interactive Data File, formatted in iXBRL and contained in Exhibit 101. | |
* | Filed herewith. |
# | Management contract or compensatory plan or arrangement. |
(c) Additional Financial Statement Schedules:
None.
ITEM 16. | FORM 10-K SUMMARY |
None.
37
SIGNATURES
Pursuant to the requirements of Section 13 or 15(d) of the Securities Exchange Act of 1934, the Registrant has duly caused this report to be signed on its behalf by the undersigned, thereunto duly authorized.
DESIGNER BRANDS INC. | ||
May 1, 2020 | By: | /s/ Jared Poff |
Jared Poff, Executive Vice President and Chief Financial Officer | ||
Pursuant to the requirements of the Securities Exchange Act of 1934, this report has been signed by the following persons in the capacities and on the dates indicated.
Signature | Title | Date | ||
/s/ Roger Rawlins | Chief Executive Officer and Director | May 1, 2020 | ||
Roger Rawlins | (Principal Executive Officer) | |||
/s/ Jared Poff | Executive Vice President and Chief Financial Officer | May 1, 2020 | ||
Jared Poff | (Principal Financial Officer) | |||
/s/ Mark Haley | Senior Vice President and Controller | May 1, 2020 | ||
Mark Haley | (Principal Accounting Officer) | |||
* | Executive Chairman of the Board and Director | May 1, 2020 | ||
Jay L. Schottenstein | ||||
* | Director | May 1, 2020 | ||
Peter Cobb | ||||
* | Director | May 1, 2020 | ||
Joanne Zaiac | ||||
* | Director | May 1, 2020 | ||
Elaine J. Eisenman | ||||
* | Director | May 1, 2020 | ||
Carolee Lee | ||||
* | Director | May 1, 2020 | ||
Joanna T. Lau | ||||
* | Director | May 1, 2020 | ||
Joseph A. Schottenstein | ||||
* | Director | May 1, 2020 | ||
Harvey L. Sonnenberg | ||||
* | Director | May 1, 2020 | ||
Allan J. Tanenbaum | ||||
* | Director | May 1, 2020 | ||
Ekta Singh-Bushell | ||||
*By: | /s/ Jared Poff |
Jared Poff (Attorney-in-fact) | |
38
REPORT OF INDEPENDENT REGISTERED PUBLIC ACCOUNTING FIRM
To the shareholders and the Board of Directors of Designer Brands Inc.
Opinions on the Financial Statements and Internal Control over Financial Reporting
We have audited the accompanying consolidated balance sheets of Designer Brands Inc. and subsidiaries (the "Company") as of February 1, 2020 and February 2, 2019, the related consolidated statements of operations, comprehensive income (loss), shareholders' equity, and cash flows, for each of the three years in the period ended February 1, 2020, and the related notes (collectively referred to as the "financial statements"). We also have audited the Company’s internal control over financial reporting as of February 1, 2020, based on criteria established in Internal Control - Integrated Framework (2013) issued by the Committee of Sponsoring Organizations of the Treadway Commission (COSO).
In our opinion, the financial statements present fairly, in all material respects, the financial position of the Company as of February 1, 2020 and February 2, 2019, and the results of its operations and its cash flows for each of the three years in the period ended February 1, 2020, in conformity with accounting principles generally accepted in the United States of America. Also, in our opinion, the Company maintained, in all material respects, effective internal control over financial reporting as of February 1, 2020, based on criteria established in Internal Control - Integrated Framework (2013) issued by COSO.
Change in Accounting Principle
As discussed in Note 1 to the financial statements, the Company has changed its method of accounting for leases, effective February 3, 2019, due to adoption of Accounting Standards Update 2016-02, Leases, using the modified retrospective approach.
Basis for Opinions
The Company’s management is responsible for these financial statements, for maintaining effective internal control over financial reporting, and for its assessment of the effectiveness of internal control over financial reporting, included in the accompanying Management’s Report on Internal Control over Financial Reporting. Our responsibility is to express an opinion on these financial statements and an opinion on the Company’s internal control over financial reporting based on our audits. We are a public accounting firm registered with the Public Company Accounting Oversight Board (United States) (PCAOB) and are required to be independent with respect to the Company in accordance with the U.S. federal securities laws and the applicable rules and regulations of the Securities and Exchange Commission and the PCAOB.
We conducted our audits in accordance with the standards of the PCAOB. Those standards require that we plan and perform the audits to obtain reasonable assurance about whether the financial statements are free of material misstatement, whether due to error or fraud, and whether effective internal control over financial reporting was maintained in all material respects.
Our audits of the financial statements included performing procedures to assess the risks of material misstatement of the financial statements, whether due to error or fraud, and performing procedures to respond to those risks. Such procedures included examining, on a test basis, evidence regarding the amounts and disclosures in the financial statements. Our audits also included evaluating the accounting principles used and significant estimates made by management, as well as evaluating the overall presentation of the financial statements. Our audit of internal control over financial reporting included obtaining an understanding of internal control over financial reporting, assessing the risk that a material weakness exists, and testing and evaluating the design and operating effectiveness of internal control based on the assessed risk. Our audits also included performing such other procedures as we considered necessary in the circumstances. We believe that our audits provide a reasonable basis for our opinions.
Definition and Limitations of Internal Control over Financial Reporting
A company’s internal control over financial reporting is a process designed to provide reasonable assurance regarding the reliability of financial reporting and the preparation of financial statements for external purposes in accordance with generally accepted accounting principles. A company’s internal control over financial reporting includes those policies and procedures that (1) pertain to the maintenance of records that, in reasonable detail, accurately and fairly reflect the transactions and dispositions of the assets of the company; (2) provide reasonable assurance that transactions are recorded as necessary to permit preparation of financial statements in accordance with generally accepted accounting principles, and that receipts and expenditures of the company are being made only in accordance with authorizations of management and directors of the company; and (3) provide reasonable assurance regarding prevention or timely detection of unauthorized acquisition, use, or disposition of the company’s assets that could have a material effect on the financial statements.
F-1
Because of its inherent limitations, internal control over financial reporting may not prevent or detect misstatements. Also, projections of any evaluation of effectiveness to future periods are subject to the risk that controls may become inadequate because of changes in conditions, or that the degree of compliance with the policies or procedures may deteriorate.
Critical Audit Matter
The critical audit matter communicated below is a matter arising from the current-period audit of the financial statements that was communicated or required to be communicated to the audit committee and that (1) relates to accounts or disclosures that are material to the financial statements and (2) involved our especially challenging, subjective, or complex judgments. The communication of critical audit matters does not alter in any way our opinion on the financial statements, taken as a whole, and we are not, by communicating the critical audit matter below, providing a separate opinion on the critical audit matter or on the accounts or disclosures to which it relates.
Valuation of Inventories - Refer to Note 1 to the financial statements
Critical Audit Matter Description
The U.S. Retail segment, which includes stores operated in the U.S. under the DSW Designer Shoe Warehouse banner and its related e-commerce site, accounts for inventory using the retail inventory method and is stated at the lower of cost or market. Under the retail inventory method, the valuation of inventories at cost and the resulting gross profits are determined by applying a calculated cost-to-retail ratio to the retail value of inventories. The cost basis of inventories reflected on the balance sheet is decreased by charges to cost of sales at the time the retail value of the inventory is lowered by markdowns.
Inherent in the valuation of inventory are certain significant judgments and estimates, including estimating inventory markdowns, which can significantly impact the ending inventory valuation and the resulting gross profit. Earnings are negatively impacted as the merchandise is marked down prior to sale.
Given the significant estimates and assumptions management utilizes to measure inventory markdowns at period end, a high degree of auditor judgment and an increased extent of effort is required when performing audit procedures to evaluate the reasonableness of estimates and assumptions. Such estimates are based on the timing and completeness of recorded markdowns.
How the Critical Audit Matter Was Addressed in the Audit
Our audit procedures related to the completeness of estimated inventory markdowns included the following, among others:
• | We tested the effectiveness of controls over the timing and completeness of estimated inventory markdowns, including those over the determination of estimated inventory markdowns and those over the lowering of the retail value of inventory through markdowns. |
• | We evaluated management’s ability to accurately estimate inventory markdowns by comparing estimated inventory markdowns as of February 1, 2020 to subsequent sales of clearance inventory. |
• | We tested the amount of estimated inventory markdowns recorded by developing an expectation for the amount based on the historical amounts recorded as a percentage of sales and compared our expectation to the amount recorded by management. |
• | We observed physical inventory counts throughout the fiscal year, including merchandise designated for clearance. We assessed inventory aging and sell through as of March 2020. |
/s/ DELOITTE & TOUCHE LLP
Columbus, Ohio
May 1, 2020
We have served as the Company's auditor since 1997.
F-2
DESIGNER BRANDS INC.
CONSOLIDATED STATEMENTS OF OPERATIONS
(in thousands, except per share amounts)
Fiscal | |||||||||||
2019 | 2018 | 2017 | |||||||||
Net sales | $ | $ | $ | ||||||||
Cost of sales | ( | ) | ( | ) | ( | ) | |||||
Operating expenses | ( | ) | ( | ) | ( | ) | |||||
Income from equity investment in ABG-Camuto | |||||||||||
Impairment charges | ( | ) | ( | ) | ( | ) | |||||
Change in fair value of contingent consideration liability | |||||||||||
Operating profit | |||||||||||
Interest expense | ( | ) | ( | ) | ( | ) | |||||
Interest income | |||||||||||
Interest income (expense), net | ( | ) | |||||||||
Non-operating expenses, net | ( | ) | ( | ) | ( | ) | |||||
Income before income taxes and income (loss) from equity investment in TSL | |||||||||||
Income tax provision | ( | ) | ( | ) | ( | ) | |||||
Income (loss) from equity investment in TSL | ( | ) | |||||||||
Net income (loss) | $ | $ | ( | ) | $ | ||||||
Basic and diluted earnings (loss) per share: | |||||||||||
Basic earnings (loss) per share | $ | $ | ( | ) | $ | ||||||
Diluted earnings (loss) per share | $ | $ | ( | ) | $ | ||||||
Weighted average shares used in per share calculations: | |||||||||||
Basic shares | |||||||||||
Diluted shares | |||||||||||
The accompanying Notes are an integral part of the Consolidated Financial Statements.
F-3
DESIGNER BRANDS INC.
CONSOLIDATED STATEMENTS OF COMPREHENSIVE INCOME (LOSS)
(in thousands)
Fiscal | |||||||||||
2019 | 2018 | 2017 | |||||||||
Net income (loss) | $ | $ | ( | ) | $ | ||||||
Other comprehensive income, net of income taxes: | |||||||||||
Foreign currency translation gain (loss) | ( | ) | ( | ) | |||||||
Unrealized net gain (loss) on debt securities | ( | ) | |||||||||
Reclassification adjustment for net losses (gains) realized in net income (loss) | ( | ) | |||||||||
Total other comprehensive income, net of income taxes | |||||||||||
Total comprehensive income (loss) | $ | $ | ( | ) | $ | ||||||
The accompanying Notes are an integral part of the Consolidated Financial Statements.
F-4
DESIGNER BRANDS INC.
CONSOLIDATED BALANCE SHEETS
(in thousands)
February 1, 2020 | February 2, 2019 | ||||||
ASSETS | |||||||
Cash and cash equivalents | $ | $ | |||||
Investments | |||||||
Accounts receivable, net | |||||||
Inventories | |||||||
Prepaid expenses and other current assets | |||||||
Total current assets | |||||||
Property and equipment, net | |||||||
Operating lease assets | |||||||
Goodwill | |||||||
Intangible assets | |||||||
Deferred tax assets | |||||||
Equity investment in ABG-Camuto | |||||||
Other assets | |||||||
Total assets | $ | $ | |||||
LIABILITIES AND SHAREHOLDERS' EQUITY | |||||||
Accounts payable | $ | $ | |||||
Accrued expenses | |||||||
Current operating lease liabilities | |||||||
Total current liabilities | |||||||
Debt | |||||||
Non-current operating lease liabilities | |||||||
Other non-current liabilities | |||||||
Total liabilities | |||||||
Commitments and contingencies | |||||||
Shareholders' equity: | |||||||
Common shares paid in-capital, no par value | |||||||
Treasury shares, at cost | ( | ) | ( | ) | |||
Retained earnings | |||||||
Accumulated other comprehensive loss | ( | ) | ( | ) | |||
Total shareholders' equity | |||||||
Total liabilities and shareholders' equity | $ | $ | |||||
The accompanying Notes are an integral part of the Consolidated Financial Statements.
F-5
DESIGNER BRANDS INC.
CONSOLIDATED STATEMENTS OF SHAREHOLDERS' EQUITY
(in thousands, except per share data)
Number of Shares | Amounts | |||||||||||||||||||||||||||
Class A common shares | Class B common shares | Treasury shares | Common shares paid in capital | Treasury shares | Retained earnings | Accumulated other comprehensive loss | Total | |||||||||||||||||||||
Balance, January 28, 2017 | $ | $ | ( | ) | $ | $ | ( | ) | $ | |||||||||||||||||||
Net income | — | — | — | — | — | — | ||||||||||||||||||||||
Stock-based compensation activity | — | — | — | — | — | |||||||||||||||||||||||
Repurchase of Class A common shares | ( | ) | — | — | ( | ) | — | — | ( | ) | ||||||||||||||||||
Dividends paid ($0.80 per share) | — | — | — | — | — | ( | ) | — | ( | ) | ||||||||||||||||||
Other comprehensive income | — | — | — | — | — | — | ||||||||||||||||||||||
Balance, February 3, 2018 | ( | ) | ( | ) | ||||||||||||||||||||||||
Net loss | — | — | — | — | — | ( | ) | — | ( | ) | ||||||||||||||||||
Stock-based compensation activity | — | — | — | — | — | |||||||||||||||||||||||
Repurchase of Class A common shares | ( | ) | — | — | ( | ) | — | — | ( | ) | ||||||||||||||||||
Dividends paid ($1.00 per share) | — | — | — | — | — | ( | ) | — | ( | ) | ||||||||||||||||||
Other comprehensive income | — | — | — | — | — | — | ||||||||||||||||||||||
Balance, February 2, 2019 | ( | ) | ( | ) | ||||||||||||||||||||||||
Cumulative effect of accounting change | — | — | — | — | — | ( | ) | — | ( | ) | ||||||||||||||||||
Net income | — | — | — | — | — | — | ||||||||||||||||||||||
Stock-based compensation activity | — | — | — | — | — | |||||||||||||||||||||||
Repurchase of Class A common shares | ( | ) | — | — | ( | ) | — | — | ( | ) | ||||||||||||||||||
Dividends paid ($1.00 per share) | — | — | — | — | — | ( | ) | — | ( | ) | ||||||||||||||||||
Other comprehensive income | — | — | — | — | — | — | ||||||||||||||||||||||
Balance, February 1, 2020 | $ | $ | ( | ) | $ | $ | ( | ) | $ | |||||||||||||||||||
The accompanying Notes are an integral part of the Consolidated Financial Statements.
F-6
DESIGNER BRANDS INC.
CONSOLIDATED STATEMENTS OF CASH FLOWS
(in thousands)
Fiscal | |||||||||||
2019 | 2018 | 2017 | |||||||||
Cash flows from operating activities: | |||||||||||
Net income (loss) | $ | $ | ( | ) | $ | ||||||
Adjustments to reconcile net income (loss) to net cash provided by operating activities: | |||||||||||
Depreciation and amortization | |||||||||||
Stock-based compensation expense | |||||||||||
Deferred income taxes | ( | ) | ( | ) | ( | ) | |||||
Loss (income) from equity investments | ( | ) | ( | ) | |||||||
Distributions received from equity investment | |||||||||||
Loss on previously held equity investment in TSL and notes receivable from TSL | |||||||||||
Impairment charges | |||||||||||
Change in fair value of contingent consideration liability | ( | ) | |||||||||
Loss on foreign currency reclassified from accumulated other comprehensive loss | |||||||||||
Other | |||||||||||
Change in operating assets and liabilities: | |||||||||||
Accounts receivable | ( | ) | |||||||||
Inventories | ( | ) | ( | ) | |||||||
Prepaid expenses and other current assets | ( | ) | ( | ) | ( | ) | |||||
Accounts payable | ( | ) | ( | ) | |||||||
Accrued expenses | ( | ) | |||||||||
Operating lease assets and liabilities, net | ( | ) | — | — | |||||||
Net cash provided by operating activities | |||||||||||
Cash flows from investing activities: | |||||||||||
Cash paid for property and equipment | ( | ) | ( | ) | ( | ) | |||||
Purchases of available-for-sale investments | ( | ) | ( | ) | ( | ) | |||||
Sales of available-for-sale investments | |||||||||||
Additional borrowings by TSL | ( | ) | ( | ) | |||||||
Repayments of borrowings by TSL | |||||||||||
Equity investment in ABG-Camuto | ( | ) | |||||||||
Working capital proceeds received (cash paid) for business acquisitions, net of cash acquired | ( | ) | |||||||||
Net cash used in investing activities | ( | ) | ( | ) | ( | ) | |||||
Cash flows from financing activities: | |||||||||||
Borrowing on revolving line of credit | |||||||||||
Payments on revolving line of credit | ( | ) | |||||||||
Cash paid for treasury shares | ( | ) | ( | ) | ( | ) | |||||
Dividends paid | ( | ) | ( | ) | ( | ) | |||||
Other | ( | ) | |||||||||
Net cash provided by (used in) financing activities | ( | ) | ( | ) | |||||||
Effect of exchange rate changes on cash balances | |||||||||||
Net increase (decrease) in cash, cash equivalents, and restricted cash | ( | ) | ( | ) | |||||||
Cash, cash equivalents, and restricted cash, beginning of period | |||||||||||
Cash, cash equivalents, and restricted cash, end of period | $ | $ | $ | ||||||||
Supplemental disclosures of cash flow information: | |||||||||||
Cash paid for income taxes | $ | $ | $ | ||||||||
Cash paid for interest on debt | $ | $ | $ | ||||||||
Cash paid for operating lease liabilities | $ | $ | $ | ||||||||
Non-cash investing and financing activities: | |||||||||||
Property and equipment purchases not yet paid | $ | $ | $ | ||||||||
Operating lease liabilities arising from lease asset additions (excluding ASU 2016-02 transition adjustments) | $ | $ | $ | ||||||||
Adjustment to operating lease assets and lease liabilities for modifications | $ | $ | $ | ||||||||
The accompanying Notes are an integral part of the Consolidated Financial Statements.
F-7
1. SIGNIFICANT ACCOUNTING POLICIES
Business Operations- Designer Brands Inc. is a leading North American footwear and accessories designer, producer and retailer.
On May 10, 2018, we acquired the remaining interest in Town Shoes Limited ("TSL") that we did not previously own. Beginning with our second quarter of fiscal 2018, TSL ceased being accounted for under the equity method of accounting and was accounted for as a consolidated wholly owned subsidiary. As a result of this acquisition, we operate a Canadian business that is a retailer of branded footwear under The Shoe Company, Shoe Warehouse, and DSW Designer Shoe Warehouse banners, as well as related e-commerce sites. Subsequent to the acquisition, and as a result of our strategic review, we exited the Town Shoes banner in Canada during fiscal 2018.
On November 5, 2018, we completed the acquisition of Camuto LLC, doing business as Camuto Group ("Camuto Group"), a footwear design and brand development organization, from Camuto Group LLC (the "Sellers"). The Camuto Group acquisition provides us a global production, sourcing and design infrastructure, including operations in Brazil and China, a new state-of-the-art distribution center in New Jersey, footwear licenses of brands, including Jessica Simpson and Lucky Brand, and branded e-commerce sites. Camuto Group earns revenue from the sale of wholesale products to retailers, commissions for serving retailers as the design and buying agent for products under private labels ("First Cost"), and the sale of branded products on direct-to-consumer e-commerce sites. Also on November 5, 2018, in partnership with Authentic Brands Group LLC, a global brand management and marketing company, we formed ABG-Camuto LLC ("ABG-Camuto"), a joint venture in which we have a 40 % interest. This joint venture acquired several intellectual property rights from the Sellers, including Vince Camuto, Louise et Cie, Sole Society, CC Corso Como, and others, and will focus on licensing and developing new category extensions to support the global growth of these brands. We have entered into a licensing agreement with ABG-Camuto whereby we pay royalties on our net sales from the brands owned by ABG-Camuto.
On March 4, 2016, we acquired Ebuys, an off-price footwear and accessories retailer operating in digital marketplaces. Due to recurring operating losses incurred by Ebuys since its acquisition, as well as increased competitive pressures in the digital marketplace, we decided to exit the business and ended all operations in fiscal 2018.
We present three reportable segments: the U.S. Retail segment, the Canada Retail segment, and the Brand Portfolio segment. The U.S. Retail segment includes stores operated in the U.S. under the DSW Designer Shoe Warehouse banner and its related e-commerce site. The Canada Retail segment, which is the result of the TSL acquisition, includes stores operated in Canada under The Shoe Company, Shoe Warehouse, DSW Designer Shoe Warehouse banners and related e-commerce sites. The Brand Portfolio segment, which is the result of the Camuto Group acquisition, includes sales from wholesale, First Cost, and direct-to-consumer branded e-commerce sites. Our other operating segments, including our Affiliated Business Group ("ABG"), are below the quantitative and qualitative thresholds for reportable segments and are aggregated into Other for segment reporting purposes.
Fiscal Year- Our fiscal year ends on the Saturday nearest to January 31. References to a fiscal year refer to the calendar year in which the fiscal year begins. This reporting schedule is followed by many national retail companies and typically results in a 52-week fiscal year, but occasionally will contain an additional week resulting in a 53-week fiscal year. The periods presented in these financial statements and selected financial data each consisted of 52 weeks, except for fiscal 2017, which consisted of 53 weeks.
Variable Interest Entities- We had three joint ventures as a result of the Camuto Group acquisition where each joint venture licensed brands and contracted with Camuto Group to provide design, buying and sourcing services. Under these joint ventures, Camuto Group was responsible for managing all aspects of the brands and the joint ventures paid royalties, commissions, or consulting fees to the other parties. We were responsible for providing all funding to support the joint ventures' working capital needs. As a result, we were considered the primary beneficiary of the joint ventures and they were consolidated within our financial statements. Assets and liabilities of the joint ventures in the aggregate were immaterial. During fiscal 2019, we terminated the three joint ventures along with related licensing and design, buying and sourcing arrangements.
During the fourth quarter of fiscal 2019, we formed a joint venture with an entity affiliated with performing artist and celebrity Jennifer Lopez. This partnership was formed in order to design, source and sell the JLO JENNIFER LOPEZ collection, a line of footwear and handbags. Our Camuto Group business will be responsible for design and sourcing and DSW will be the initial exclusive retailer of the products. Jennifer Lopez and her team will lead the creative for marketing and product design, with technical expertise and guidance from our operating units. Jennifer Lopez also has the opportunity to earn the Company's Class A common shares beginning in fiscal 2021 based on the expansion of our VIP rewards programs from her fan base. Based on
F-8
certain terms within the joint venture operating agreement, we have determined that we have overall control of the joint venture. In addition, we provide a revolving line of credit to the joint venture and a guarantee for funding in excess of the joint venture's equity. As a result, we are considered the primary beneficiary of the joint venture and it is consolidated within our financial statements. Assets and liabilities of the joint venture are immaterial. We will recognize all of the losses of the joint venture up to the amounts guaranteed and share any profits between the partners under the terms of the joint venture operating agreement.
Integration and Restructuring Costs- During fiscal 2019, we incurred integration and restructuring costs related to our prior year acquisition activity, which consisted primarily of $3.9 million in severance, $7.2 million in fees for terminating joint ventures, and $6.6 million of professional fees and other integration costs. During fiscal 2018, we incurred restructuring costs of $5.6 million in severance, primarily related to changes to our store staffing model. These costs are included in operating expenses in the consolidated statements of operations. As of February 1, 2020 and February 2, 2019, we had $1.7 million and $2.8 million, respectively, of severance liability included in accrued expenses on the consolidated balance sheets.
Principles of Consolidation- The consolidated financial statements include the accounts of Designer Brands Inc. and its subsidiaries, including the joint ventures. All intercompany accounts and transactions have been eliminated in consolidation. All amounts are in United States dollars ("USD"), unless otherwise noted.
Use of Estimates- The preparation of financial statements in conformity with GAAP requires management to make estimates and assumptions that affect the reported amounts of assets and liabilities and disclosure of contingent assets and liabilities at the date of the financial statements and reported amounts of net sales and expenses during the reporting period. Significant estimates are required as a part of sales returns allowances, customer allowances and discounts, gift card breakage income, deferred revenue associated with loyalty programs, valuation of inventories, depreciation and amortization, impairments of long-lived assets, intangibles and goodwill, lease accounting, legal reserves, foreign tax contingent liabilities, income taxes, and self-insurance reserves. Although these estimates are based on management's knowledge of current events and actions it may undertake in the future, actual results could differ from these estimates.
Revenue Recognition- Sales from the U.S. Retail and Canada Retail segments are recognized upon customer receipt of merchandise, net of estimated returns and exclude sales tax. Customers can purchase products from one of our stores, online or from our mobile application. For products shipped directly to our customers, we recognize the sale upon the estimated customer receipt date based on historical delivery transit times. Revenue from shipping and handling is recorded in net sales while the related costs are included in cost of sales. For products shipped directly to our customers from our suppliers (referred to as "drop ship"), we record gross sales upon delivery based on the price paid by the customers as we have determined that we are the principal party responsible for the sale transaction.
Sales from the Brand Portfolio segment are recognized upon transfer of control. Generally, our wholesale customers arrange their own transportation of merchandise and control is transferred at the time of shipment. Sales are recorded at the transaction price, excluding sales tax, net of estimated reserves for customer returns, allowances and discounts. Direct-to-consumer sales are also recognized upon shipment of merchandise, net of estimated returns and exclude sales tax. Commission income for serving retailers as the design and buying agent for products under private labels (referred to as "First Cost") is recognized at the point in time when the customer's freight forwarder takes control of the related merchandise.
ABG supplies footwear to other retailers under supply arrangements. We maintain ownership of the merchandise we supply under these arrangements, including risk of loss, returns, shrink up to a certain percentage and loss of inventory value, until customer receipt. Furthermore, we are responsible for the footwear assortment, inventory fulfillment, and pricing at all locations and online. As a result, sales are recognized upon receipt by the end customer, net of estimated returns and exclude sales tax. The affiliated retailers provide the sales associates and retail space. In return, we pay a percentage of net sales to the affiliated retailers, which is included in cost of sales.
Gift Cards- Amounts received from the sale of gift cards are recorded as a liability and are recognized as sales when the cards are redeemed for merchandise. Based on historical information, the likelihood of a gift card remaining unredeemed (referred to as "breakage") can be reasonably estimated at the time of gift card issuance. Breakage income is recognized over the estimated average redemption period of redeemed gift cards.
Loyalty Programs- We offer loyalty programs to our customers in the U.S. and Canada. Members under the programs earn points based on their level of spending, as well as for various other activities. Upon reaching a specified point threshold, members receive reward certificates that may be redeemed for purchases made within the stated expiration date. We record a reduction of net sales when points are awarded based on an allocation of the initial customer purchase and the stand-alone value
F-9
of the points earned. We maintain a deferred liability for the outstanding points and certificates based on historical conversion and redemption rates. The deferred liability is reduced and sales are recognized when certificates are redeemed or when points and certificates expire.
Cost of Sales- Cost of sales from the U.S. Retail and Canada Retail segments is recognized net of estimated returns. In addition to the cost of merchandise sold, which includes freight and the impact of markdowns, shrinkage and other inventory valuation adjustments, we include in cost of sales expenses associated with distribution and fulfillment and store occupancy. Distribution and fulfillment expenses are comprised of labor costs, rent, depreciation, insurance, utilities, maintenance and other operating costs associated with the operations of the distribution and fulfillment centers. Store occupancy expenses include rent, utilities, repairs, maintenance, insurance, janitorial costs, and occupancy-related taxes, but excludes depreciation.
Operating Expenses- Operating expenses include expenses related to store management and store payroll costs, advertising, store depreciation, new store costs, design, sourcing and distribution costs associated with the Brand Portfolio segment, and corporate expenses. Corporate expenses include expenses related to buying, information technology, depreciation and amortization expense for corporate assets, marketing, legal, finance, outside professional services, customer service center expenses, and payroll-related costs for associates.
Stock-Based Compensation- We recognize compensation expense for awards of stock options, restricted stock units ("RSUs"), and director stock units, based on the fair value on the grant date and on a straight-line basis over the requisite service period for the awards that vest. Stock-based compensation is included in operating expenses in the consolidated statements of operations.
Non-Operating Expenses, Net- Non-operating expenses, net, includes gains and losses from foreign currency revaluation, realized gains and losses related to our investment portfolio, and fair value adjustments of pre-existing assets as a result of the acquisition of the remaining interest in TSL.
Income Taxes- We account for income taxes under the asset and liability method. We determine the aggregate amount of income tax expense to accrue and the amount which will be currently payable based upon tax statutes of each jurisdiction in which we do business. Deferred tax assets and liabilities are recognized for the future tax consequences attributable to temporary differences between the financial statement carrying amounts of existing assets and liabilities and respective tax bases and operating loss and tax credit carryforwards, as measured using enacted tax rates expected to be in effect in the periods where temporary differences are expected to be realized or settled. The effect on deferred tax assets and liabilities of a change in tax rates is recognized in income in the period that includes the enactment date. A valuation allowance is provided when it is more likely than not that some portion or all of a deferred tax asset will not be realized. The ultimate realization of deferred tax assets is dependent upon the generation of future taxable income during the periods in which those temporary differences become realizable.
We review and update our tax positions as necessary to add any new uncertain tax positions taken, or to remove previously
identified uncertain positions that have been adequately resolved. Additionally, uncertain positions may be remeasured as
warranted by changes in facts or law. Accounting for uncertain tax positions requires estimating the amount, timing and
likelihood of ultimate settlement. Although we believe that these estimates are reasonable, actual results could differ from
these estimates.
Cash, Cash Equivalents, and Restricted Cash- Cash and cash equivalents represent cash, money market funds and credit card receivables that generally settle within three days. Restricted cash represented cash that is restricted as to withdrawal or usage and consisted of a mandatory cash deposit for certain outstanding letters of credit.
F-10
The following table provides a reconciliation of cash and cash equivalents and restricted cash reported within the consolidated balance sheets that sum to the total of the same such amounts shown in the consolidated statements of cash flows:
(in thousands) | February 1, 2020 | February 2, 2019 | February 3, 2018 | ||||||||
Cash and cash equivalents | $ | $ | $ | ||||||||
Restricted cash, included in prepaid expenses and other current assets | |||||||||||
Total cash, cash equivalents, and restricted cash shown in the consolidated statements of cash flows | $ | $ | $ | ||||||||
Investments- We determine the balance sheet classification of investments at the time of purchase and evaluate the classification at each balance sheet date. All income generated from these investments is recorded as interest income. We hold investment securities in bonds and term notes that are classified as available-for-sale, which is based on our intention of the use of the investments. The unrealized holding gains or losses for the available-for-sale securities are reported in other comprehensive income (loss). We account for our purchases and sales of investments on the trade date of the investment. We account for investments using the equity method of accounting when we exercise significant influence over the investment. If we do not exercise significant influence, we account for the investment using the cost method of accounting. Cost method investments are included in other assets on the consolidated balance sheets. We evaluate our investments for impairment and whether impairment is other-than-temporary at each balance sheet date.
Accounts Receivable- Accounts receivable are classified as current assets because the average collection period is generally shorter than one year. We monitor our exposure for credit losses based upon specific accounts receivable balances and record related allowances for doubtful accounts where a risk of default has been identified. We utilize an unrelated third-party provider for credit and collection services for receivables from the sale of wholesale products to certain retailers. This third-party provider guarantees payment for the majority of the serviced receivables.
Inventories- All of our inventory is made up of finished goods. The U.S. Retail segment inventory is accounted for using the retail inventory method and is stated at the lower of cost or market. Under the retail inventory method, the valuation of inventories at cost and the resulting gross profits are determined by applying a calculated cost-to-retail ratio to the retail value of inventories. The cost basis of inventories reflected on the balance sheet is decreased by charges to cost of sales at the time the retail value of the inventory is lowered by markdowns. As a result, earnings are negatively impacted as the merchandise is marked down prior to sale. The Canada Retail segment and the Brand Portfolio segment inventory is accounted for using the weighted average cost method and is stated at the lower of cost or net realizable value. We monitor aged inventory for obsolete and slow-moving inventory that may need to be liquidated in the future at amounts below cost. Reductions to inventory values establish a new cost basis. Favorable changes in facts or circumstances do not result in an increase in the newly established cost basis.
We perform physical inventory counts or cycle counts on all inventory on hand throughout the year and adjust the recorded balance to reflect the results. We record estimated shrinkage between physical inventory counts based on historical experience and recent results.
Inherent in the calculation of inventories are certain significant judgments and estimates, including setting the original merchandise retail value, markdowns, shrinkage, and liquidation values. The ultimate amount realized from the sale of inventory and write offs from counts could differ from management estimates.
Concentration of Risks- We are subject to risk due to concentration of merchandise coming from China. All of the products we manufacture in the Brand Portfolio segment come from third-party facilities outside of the U.S., with 83 % of units sourced from China, whereas our U.S. Retail and Canada Retail merchandise is purchased from both domestic and foreign vendors. Many of our domestic vendors import a large portion of their merchandise from abroad, with the majority manufactured in China.
We are also subject to concentration of vendor risk within the U.S. Retail and Canada Retail segments. During fiscal 2019, three key third-party vendors together supplied approximately 21 % of our retail merchandise.
F-11
Financial instruments, which principally subject us to concentration of credit risk, consist of cash and cash equivalents and investments. We invest excess cash when available through financial institutions in money market accounts and investment securities. At times, such amounts invested through banks may be in excess of Federal Deposit Insurance Corporation insurance limits, and we mitigate the risk by utilizing multiple banks.
• | Level 1 - Quoted prices in active markets for identical assets or liabilities. |
• | Level 2 - Quoted prices for similar assets or liabilities in active markets or inputs that are observable. |
• | Level 3 - Unobservable inputs in which little or no market activity exists. |
We measure available-for-sale investments at fair value on a recurring basis. These investments are measured using a market-based approach using inputs such as prices of similar assets in active markets (categorized as Level 2). The carrying value of cash and cash equivalents, accounts receivables and accounts payables approximated their fair values due to their short-term nature. The carrying value of borrowing under our senior unsecured revolving credit agreement (the "Credit Facility") approximates its fair value based on its term and variable interest rate.
Property and Equipment- Property and equipment are stated at cost less accumulated depreciation determined by the straight-line method over the expected useful life of assets. The net book value of property or equipment sold or retired is removed from the asset and related accumulated depreciation accounts with any resulting net gain or loss included in results of operations. The estimated useful lives by class of asset are as follows:
Useful Lives | |
Buildings | 39 years |
Building and leasehold improvements | 3 to 20 years or the lease term if shorter |
Furniture, fixtures and equipment | 3 to 10 years |
Software | 5 to 10 years |
Internal Use Software Costs- Costs related to software developed or obtained for internal use are expensed as incurred until the application development stage has been reached. Once the application development stage has been reached, certain qualifying costs are capitalized until the software is ready for its intended use. If a cloud computing arrangement includes a software license, the software license element of the arrangement is accounted for in a manner consistent with the acquisition of other software licenses. If the arrangement does not include a software license, the arrangement is accounted for as a service contract.
Impairment of Long-Lived Assets- We periodically evaluate the carrying amount of our long-lived assets, primarily operating lease assets, property and equipment and definite-lived intangible assets, when events and circumstances warrant such a review to ascertain if any assets have been impaired. The carrying amount of a long-lived asset or asset group is considered impaired when the carrying value of the asset or asset group exceeds the expected future cash flows from the asset or asset group (categorized as Level 3 under the fair value hierarchy). The reviews are conducted at the lowest identifiable level. The impairment loss recognized is the excess of the carrying value of the asset or asset group over its fair value.
During fiscal 2019, we recorded impairment charges of $7.8 million, including $4.8 million for operating lease assets and other property and equipment in the Brand Portfolio segment related to the planned consolidation of certain locations as part of our integration efforts and $3.0 million primarily for operating lease assets related to under-performing stores ($2.3 million and $0.7 million for the U.S. Retail and Canada Retail segments, respectively). During fiscal 2018, we recorded impairment charges of $19.0 million, including $13.9 million for an abandoned corporate internal-use software that was under development and $5.1 million primarily for leasehold improvements related to under-performing stores ($1.5 million and $3.6 million for the U.S. Retail and Canada Retail segments, respectively). As a result of recurring operating losses incurred by Ebuys since its acquisition, which led to our decision to exit the business, during fiscal 2017, we recorded impairment charges of $31.9 million for intangible assets and $3.8 million for property and equipment, which resulted in writing off all of Ebuys' long-lived assets.
Goodwill and Other Indefinite Lived Intangible Assets- We evaluate goodwill and other indefinite lived intangible assets for impairment annually during our fourth quarter, or more frequently if an event occurs or circumstances change that would indicate that impairment may exist. When evaluating for impairment, we may first perform a qualitative assessment to determine whether it is more likely than not that there is an impairment. If we do not perform a qualitative assessment, or if we
F-12
determine that it is more likely than not that the carrying value exceeds its fair value, we will calculate the estimated fair value. Fair value is typically calculated using a discounted cash flow analysis. Where deemed appropriate, we may also utilize a market approach for estimating fair value. Impairment charges are calculated as the amount by which the carrying amount exceeds its fair value, but not to exceed the carrying value for goodwill.
During fiscal 2018, we determined that the value of the acquired net assets of TSL exceeded its fair value based on the fair value of TSL using a discounted cash flow model (categorized as Level 3 under the fair value hierarchy). As a result, we recorded a goodwill impairment charge of $41.8 million that resulted in impairing all of Canada Retail segment’s goodwill. During fiscal 2017, due to recurring operating losses incurred by Ebuys since its acquisition, which led to our decision to exit the business, we recorded a goodwill impairment charge of $53.8 million, which resulted in writing off all of Ebuys' goodwill.
Self-Insurance Reserves- We record estimates for certain health and welfare, workers' compensation and casualty insurance costs that are self-insured programs. Self-insurance reserves include actuarial estimates of both claims filed, carried at their expected ultimate settlement value, and claims incurred but not yet reported. The liability represents an estimate of the ultimate cost of claims incurred as of the balance sheet date. Estimates for self-insurance reserves are calculated utilizing claims development estimates based on historical experience and other factors. We have purchased stop loss insurance to limit our exposure on a per person basis for health and welfare and on a per claim basis for workers' compensation and general liability, as well as on an aggregate annual basis.
Foreign Currency Translation and Transactions- Prior to our acquisition of the remaining interest in TSL, our equity investment in TSL and notes receivable from TSL, along with certain investments, were denominated in Canadian dollar ("CAD") and translated into USD at exchange rates in effect at the balance sheet date. Each quarter, the income or loss from TSL was recorded in USD at the average exchange rate for the period. The cumulative translation adjustments resulting from changes in exchange rates are included in the consolidated balance sheets as a component of accumulated other comprehensive loss. During fiscal 2018, as a result of the acquisition of TSL, we reclassified a net loss of $12.2 million of foreign currency translation related to the previously held balances from accumulated other comprehensive loss to non-operating expenses, net.
During fiscal 2018, TSL became a wholly owned subsidiary with CAD as their functional currency. Assets and liabilities of the Canadian business are translated into USD at exchange rates in effect at the balance sheet date or historical rates as appropriate. Each quarter, amounts included in our consolidated statements of operations from the Canadian business are translated at the average exchange rate for the period. The cumulative translation adjustments resulting from changes in exchange rates are included in the consolidated balance sheets as a component of accumulated other comprehensive loss. Transaction gains and losses are included in the consolidated statements of operations.
Prior Period Reclassifications- Certain prior period reclassifications were made to conform to the current period presentation. For fiscal 2018, commission income of $3.5 million previously presented in commission, franchise and other revenue was reclassified to net sales. For fiscal 2018 and 2017, other revenue, which primarily included operating sublease income, of $5.8 million and $5.2 million, respectively, also previously presented in commission, franchise and other revenue was reclassified to operating expenses. In addition, we reclassified $25.0 million of previously presented basis difference related to acquisition of commonly controlled entity to common shares paid in-capital within shareholders' equity for all periods presented. The basis difference related to acquisition of commonly controlled entity related to a legal entity acquisition in fiscal 2012 from certain Schottenstein Affiliates. The legal entity owned property that was previously leased by us. As this was a transaction between entities under common control, the difference between the historical cost carrying amounts and the consideration transferred is reflected as an equity transaction within common shares paid in-capital.
Adoption of ASU 2016-02, Leases- During the first quarter of fiscal 2019, we adopted the new accounting standard for leases, Accounting Standards Update ("ASU") 2016-02 and the related amendments. We elected to initially apply ASU 2016-02 as of February 3, 2019, with the recognition of $1.0 billion of lease assets and $1.1 billion of lease liabilities and a cumulative-effect adjustment that decreased retained earnings by $9.6 million for transition impairments related to previously impaired leased locations. Periods prior to February 3, 2019 were not restated. Upon transition to ASU 2016-02, we recognized lease liabilities based on the present value of the remaining future fixed lease commitments, net of outstanding tenant allowance receivables, with corresponding lease assets. Amounts for prepaid expenses, deferred rent, deferred construction and tenant allowances, the
F-13
accrual for lease obligations, and favorable and unfavorable leasehold interests were netted against the lease assets. At transition, we elected the package of practical expedients, which allows us to carry forward the historical lease classification and not reassess whether any expired or existing contracts are leases or contain leases. We did not elect the use of hindsight to determine the term of our leases at transition.
A lease liability for new leases is recorded based on the present value of future fixed lease commitments with a corresponding lease asset. For leases classified as operating leases, we recognize a single lease cost on a straight-line basis based on the combined amortization of the lease liability and the lease asset. Other leases will be accounted for as finance arrangements. For real estate leases, we are generally required to pay base rent, real estate taxes, and insurance, which are considered lease components, and maintenance, which is a non-lease component. As provided for under ASU 2016-02, we have elected to not separate non-lease payment components from the associated lease component for all new real estate leases. We determine the discount rate for each lease by estimating the rate that we would be required to pay on a secured borrowing for an amount equal to the lease payments over the lease term.
Prior to the adoption of ASU 2016-02, we recognized rent expense on a straight-line basis over the noncancelable terms of the lease. For leases with fixed increases of the minimum rentals during the noncancelable term, we recorded the difference between the amounts charged to expense and the rent paid as deferred rent and amortized such deferred rent upon the delivery of the lease location by the lessor. In addition, cash allowances received from landlords were deferred and amortized on a straight-line basis over the noncancelable terms of the lease as a reduction of rent expense. Deferred rent and construction and tenant allowances are included in other non-current liabilities on the consolidated balance sheets for periods prior to February 3, 2019. Also, we recorded reserves for leased spaces that were abandoned due to closure. Using a credit-adjusted risk-free rate to calculate the present value of the liability, we estimated future lease obligations based on remaining fixed lease payments, estimated or actual sublease income, and any other relevant factors.
Adoption of ASU 2018-15, Intangibles - Goodwill and Other - Internal-Use Software- Also during the first quarter of fiscal 2019, we early adopted ASU 2018-15 on a prospective basis, which aligned the requirements for capitalizing implementation costs incurred in a cloud computing arrangement that is a service contract with the requirements for capitalizing implementation costs incurred to develop or acquire internal-use software. The adoption of ASU 2018-15 did not have a material impact on our consolidated financial statements.
2. ACQUISITIONS AND EQUITY METHOD INVESTMENT
Step Acquisition of TSL- On May 10, 2018, we acquired the remaining interest in TSL for $36.2 million CAD ($28.2 million USD), net of acquired cash of $8.5 million CAD ($6.6 million USD), by exercising our call option. This was accounted for as a step acquisition whereby we remeasured to fair value our previously held assets, which included our equity investment in TSL and notes and accounts receivable from TSL, and included these assets in the determination of the purchase price. During fiscal 2018, as a result of the remeasurement, we recorded a loss of $34.0 million to non-operating expenses, net, in the consolidated statements of operations. Also during fiscal 2018, we reclassified a net loss of $12.2 million of foreign currency translation adjustments related to the previously held balances from accumulated other comprehensive loss to non-operating expenses, net.
F-14
The purchase price and the allocation of the total consideration to the fair values of the assets and liabilities acquired was finalized as of February 2, 2019 and consisted of the following (in USD):
(in thousands) | Final Purchase Price and Allocation | ||
Purchase price: | |||
Cash consideration, net of cash acquired | $ | ||
Replacement stock-based awards attributable to pre-acquisition services | |||
Fair value of pre-existing assets | |||
$ | |||
Fair value of assets and liabilities acquired: | |||
Inventories | $ | ||
Other current assets | |||
Property and equipment | |||
Goodwill | |||
Intangible assets | |||
Accounts payable and other liabilities | ( | ) | |
Non-current liabilities | ( | ) | |
$ | |||
The fair value of previously held assets was determined immediately before the business combination, primarily by considering the income valuation approach (discounted cash flow) and the market valuation approach (precedent comparable transactions). Additionally, other information such as current market, industry and macroeconomic conditions were utilized to assist in developing these fair value measurements. The fair value of intangible assets included $15.7 million for tradenames, $3.6 million for favorable leasehold interests, and $1.4 million for customer relationships associated with the Canada loyalty program. The fair value of unfavorable leasehold interests, included in other non-current liabilities, was $7.6 million. The fair value for tradenames was determined using the relief from royalty method of the income approach, the fair value for leasehold interests was determined based on the market valuation approach, and the fair value for customer relationships related to the loyalty program was determined using the replacement cost method. The fair value for property and equipment was determined using the cost and market approaches. The fair value of inventories, which is made up of finished goods, was determined based on market assumptions for realizing a reasonable profit after selling costs.
The goodwill represents the excess of the purchase price over the fair value of the net assets acquired. With this being a step acquisition, the purchase price included the fair value of our previously held assets, which considered the valuation of the TSL enterprise. This valuation identified that the resulting goodwill was not supportable as the value of the acquired net assets exceeded the enterprise fair value. As a result, during fiscal 2018, we recorded a goodwill impairment charge, net of adjustments as a result of recording adjustments to the preliminary purchase allocations, which resulted in impairing all of the Canada Retail segment’s goodwill. A portion of the goodwill is not expected to be deductible for income tax purposes.
During fiscal 2018, our consolidated statements of operations included net sales and net losses for TSL of $220.3 million and $48.9 million, respectively, which included the pre-tax losses from the wind down of operations for the Town Shoes banner, the goodwill impairment charge of $41.8 million, long-lived asset impairment charges of $3.6 million and lease exit charges of $15.5 million. Primarily in fiscal 2018, we incurred $3.1 million of acquisition-related costs as a result of the step acquisition (not included in the TSL net loss disclosed in the previous sentence), which were included in operating expenses in the consolidated statements of operations.
Acquisition of Camuto Group- On November 5, 2018, we completed the acquisition of all of the outstanding securities of Camuto Group for $166.3 million, net of acquired cash of $9.7 million and a working capital settlement of $5.0 million received during fiscal 2019. The purchase price of the acquisition, along with the acquired equity investment in ABG-Camuto (discussed below), was funded with available cash and borrowings on the revolving line of credit of $160.0 million.
F-15
The purchase price and the allocation of the total consideration to the fair values of the assets and liabilities acquired was finalized as of November 2, 2019 and consisted of the following:
(in thousands) | Preliminary Purchase Price and Allocation as of November 5, 2018 | Measurement Period Adjustments | Final Purchase Price and Allocation as of November 2, 2019 | ||||||||
Purchase price - | |||||||||||
Cash consideration, net of cash acquired | $ | $ | ( | ) | $ | ||||||
Fair value of assets and liabilities acquired: | |||||||||||
Accounts receivable | $ | $ | $ | ||||||||
Inventories | ( | ) | |||||||||
Other current assets | |||||||||||
Property and equipment | ( | ) | |||||||||
Goodwill | |||||||||||
Intangible asset | ( | ) | |||||||||
Other assets | |||||||||||
Accounts payable and other liabilities | ( | ) | ( | ) | ( | ) | |||||
Non-current liabilities | ( | ) | ( | ) | ( | ) | |||||
$ | $ | ( | ) | $ | |||||||
The fair value of the intangible asset relates to customer relationships and was based on the excess earnings method under the income approach. The fair value measurement is based on significant unobservable inputs, including the future cash flows and discount and customer attrition rates. The fair values for property and equipment were determined using the cost and market approaches. The fair value of inventories, which consist of finished goods, was determined based on market assumptions for realizing a reasonable profit after selling costs. The inventory valuation step-up was recognized to cost of goods sold during fiscal 2018 based on assumed inventory turns.
The goodwill represents the excess of the purchase price over the fair value of the net assets acquired, and was primarily attributable to acquiring an established design and sourcing process, which provides us the opportunity to expand our exclusive brand products offering at lower cost of goods in our retail segments and an assembled workforce. We determined that goodwill should be allocated to reporting units within the U.S. Retail and Brand Portfolio segments based on each reporting unit’s estimated benefit from the expected synergies from the Camuto Group acquisition. We allocated $67.8 million of the goodwill to the U.S. Retail segment based primarily on a discounted cash flow of the sourcing benefit. The remaining $20.0 million of goodwill was allocated to the First Cost reporting unit within the Brand Portfolio segment based on the fair value of the reporting unit over the fair value of the net assets allocated to the reporting unit. Goodwill is expected to be deductible for income tax purposes.
Other non-current liabilities included $12.7 million of estimated unpaid foreign payroll and other taxes. We recorded an offsetting indemnification asset to other assets, which we expect to collect under the terms of the securities purchase agreement with the Sellers. See Note 16, Commitments and Contingencies, for additional information.
Measurement period adjustments were the result of refining cash flow assumptions relating to certain synergy assumptions, adjusting accruals and related indemnification receivables based on additional information, and other immaterial adjustments identified as we performed additional analysis of the assets and liabilities acquired. Adjustments to the purchase price were based on a working capital settlement with the Sellers as provided by the purchase agreement. Measurement period adjustments are recognized on a prospective basis in the period of change.
During fiscal 2018, our consolidated statements of operations included net sales from external customers and net losses for Camuto Group of $89.6 million and $16.2 million, respectively. We incurred $22.2 million of acquisition-related costs as a result of the acquisition (not included in the Camuto Group net loss disclosed in the previous sentence), which were included in operating expenses in the consolidated statements of operations.
F-16
Equity Investment in ABG-Camuto- On November 5, 2018, we acquired a 40 % interest in the newly formed ABG-Camuto joint venture for $56.8 million in partnership with Authentic Brands Group LLC. Also on November 5, 2018, ABG-Camuto acquired several intellectual property rights from the Sellers and entered into a licensing agreement with us, through which ABG-Camuto earns royalties from the net sales of Camuto Group under the brands acquired.
Activity related to our equity investment in ABG-Camuto was as follows:
Fiscal | |||||||
(in thousands) | 2019 | 2018 | |||||
Balance at beginning of period | $ | $ | |||||
Initial investment in ABG-Camuto | |||||||
Share of net earnings | |||||||
Distributions received | ( | ) | |||||
Balance at end of period | $ | $ | |||||
Combined Results- The following table provides the supplemental unaudited pro forma net sales and net income of the combined entity had the acquisition dates of TSL and Camuto Group and the investment in ABG-Camuto been the first day of our fiscal 2017:
Fiscal | |||||||
(in thousands) | 2018 | 2017 | |||||
Net sales | $ | $ | |||||
Net income | $ | $ | |||||
The amounts in the supplemental pro forma results apply our accounting policies, eliminate intercompany transactions, assume the acquisition-related transaction costs were incurred in fiscal 2017, and reflect adjustments for additional expenses that would have been charged assuming borrowings on the revolving line of credit of $160.0 million and the same fair value adjustments to inventory, property and equipment, and acquired intangibles had been applied on the first day of our fiscal 2017. Related to the TSL acquisition, the supplemental pro forma results also exclude the loss related to the remeasurement of previously held assets, the net loss of foreign currency translation related to the previously held balances from accumulated other comprehensive loss, and the goodwill impairment charge. Because the ABG-Camuto investment was integral to the Camuto Group acquisition, the supplemental pro forma results include royalty expenses that would be due to ABG-Camuto using the guaranteed minimum royalties per the license agreement and the related earnings from our equity investment in ABG-Camuto had the transactions occurred on the first day of our fiscal 2017. Accordingly, these supplemental pro forma results have been prepared for comparative purposes only and are not intended to be indicative of results of operations that would have occurred had the acquisitions actually occurred in the prior year period or indicative of the results of operations for any future period.
F-17
3. REVENUE
Disaggregation of Net Sales- The following table presents net sales disaggregated by product and service category for each segment:
Fiscal | |||||||||||
(in thousands) | 2019 | 2018 | 2017 | ||||||||
Net sales: | |||||||||||
U.S. Retail segment: | |||||||||||
Women's footwear | $ | $ | $ | ||||||||
Men's footwear | |||||||||||
Kids' footwear | |||||||||||
Accessories and other | |||||||||||
Canada Retail segment: | |||||||||||
Women's footwear | |||||||||||
Men's footwear | |||||||||||
Kids' footwear | |||||||||||
Accessories and other | |||||||||||
Brand Portfolio segment: | |||||||||||
Wholesale | |||||||||||
Commission income | |||||||||||
Direct-to-consumer | |||||||||||
Other | |||||||||||
Total segment net sales | |||||||||||
Elimination of intersegment sales | ( | ) | ( | ) | |||||||
Total net sales | $ | $ | $ | ||||||||
Fiscal | |||||||||||
(in thousands) | 2019 | 2018 | 2017 | ||||||||
Gift cards: | |||||||||||
Beginning of period | $ | $ | $ | ||||||||
Gift cards redeemed and breakage recognized to net sales | ( | ) | ( | ) | ( | ) | |||||
Gift cards issued | |||||||||||
End of period | $ | $ | $ | ||||||||
Loyalty programs: | |||||||||||
Beginning of period | $ | $ | $ | ||||||||
Loyalty certificates redeemed, expired, and other adjustments recognized to net sales | ( | ) | ( | ) | ( | ) | |||||
Deferred revenue for loyalty points issued | |||||||||||
End of period | $ | $ | $ | ||||||||
F-18
Customer Allowances- We reduce sales by the amount of actual and remaining expected customer allowances, discounts and returns, and cost of sales by the amount of merchandise we expect to recover. Customer allowances are provided to our wholesale customers for margin assistance, co-op advertising support, and various other deductions. We estimate the reserves needed for margin assistance by reviewing inventory levels held by retailers, expected markdowns, gross margins realized, and other performance indicators. Product returns and other customer deductions are estimated based on anticipated future returns using historical experience and trends. Co-op advertising allowances are estimated based on arrangements with customers. Customer allowance reserves are included in accrued expenses on the consolidated balance sheets.
Fiscal | |||||||||||
(in thousands) | 2019 | 2018 | 2017 | ||||||||
Sales returns reserve: | |||||||||||
Beginning of period | $ | $ | $ | ||||||||
Net sales reduced for estimated returns | |||||||||||
Actual returns during the period | ( | ) | ( | ) | ( | ) | |||||
End of period | $ | $ | $ | ||||||||
Customer allowances and discounts reserve: | |||||||||||
Beginning of period | $ | $ | $ | ||||||||
Assumed liability in acquisitions and measurement period adjustments | ( | ) | |||||||||
Net sales reduced for estimated allowances and discounts | |||||||||||
Actual allowances and discounts during the period | ( | ) | ( | ) | |||||||
End of period | $ | $ | $ | ||||||||
As of February 1, 2020 and February 2, 2019, the asset for recovery of merchandise returns was $11.9 million and $10.1 million, respectively, and is included in prepaid expenses and other current assets on the consolidated balance sheets.
4. RELATED PARTY TRANSACTIONS
Schottenstein Affiliates
As of February 1, 2020, the Schottenstein Affiliates, entities owned or controlled by Jay L. Schottenstein, the executive chairman of our Board of Directors, and members of his family, beneficially owned approximately 16 % of the Company's outstanding common shares, representing approximately 52 % of the combined voting power. As of February 1, 2020, the Schottenstein Affiliates beneficially owned 3.6 million Class A common shares and 7.7 million Class B common shares. We had the following related party transactions with Schottenstein Affiliates:
Leases- We lease our fulfillment center and certain store locations owned by Schottenstein Affiliates. See Note 15, Leases, for rent expense and future minimum lease payment requirements associated with the Schottenstein Affiliates.
Other Purchases and Services- During fiscal 2019, 2018 and 2017, we had other purchases and services from Schottenstein Affiliates of $6.0 million, $6.5 million and $4.6 million, respectively.
Due to Related Parties- As of February 1, 2020 and February 2, 2019, we had amounts due to related parties of $0.9 million and $1.0 million, respectively, included in accounts payable on the consolidated balance sheets.
ABG-Camuto
Beginning in the fourth quarter of fiscal 2018, we have a 40 % interest in ABG-Camuto. ABG-Camuto entered into a licensing agreement with us whereby we pay royalties on the net sales of the brands owned by ABG-Camuto. During fiscal 2019 and 2018, we recorded $18.2 million and $2.4 million of royalty expense payable to ABG-Camuto, respectively. As of February 1, 2020 and February 2, 2019, we had $0.3 million and $2.4 million payable to ABG-Camuto, respectively, included in accrued expenses on the consolidated balance sheets. See Note 16, Commitments and Contingencies - Contractual Obligations, for future guaranteed minimum royalty payment requirements to ABG-Camuto.
F-19
5. EARNINGS (LOSS) PER SHARE
Basic earnings (loss) per share is based on net income (loss) and the weighted average of Class A and Class B common shares outstanding. Diluted earnings (loss) per share reflects the potential dilution of common shares adjusted for outstanding stock options and RSUs calculated using the treasury stock method.
The following is a reconciliation of the number of shares used in the calculation of earnings (loss) per share:
Fiscal | ||||||||
(in thousands) | 2019 | 2018 | 2017 | |||||
Weighted average basic shares outstanding | ||||||||
Dilutive effect of stock-based compensation awards | ||||||||
Weighted average diluted shares outstanding | ||||||||
6. | STOCK-BASED COMPENSATION |
The DSW Inc. 2014 Long-Term Incentive Plan (the "Plan") provides for the issuance of stock-based compensation awards for eligible recipients. The Plan replaced the DSW Inc. 2005 Equity Incentive Plan but did not affect awards granted under that plan, some of which remain outstanding. Eligible recipients include key employees as well as directors. The maximum number of shares of Class A common shares underlying awards which may be issued over the term of the Plan cannot exceed 8.5 million shares. As of February 1, 2020, 2.9 million shares of Class A common shares remain available for future stock-based compensation grants under the Plan.
Stock-based compensation expense consisted of the following:
Fiscal | |||||||||||
(in thousands) | 2019 | 2018 | 2017 | ||||||||
Stock options | $ | $ | $ | ||||||||
Restricted and director stock units | |||||||||||
$ | $ | $ | |||||||||
Stock Options- Stock options were granted with an exercise price per share equal to the fair market value of our common stock on the grant date. Stock options generally vest 20 % per year on a cumulative basis and remain exercisable for a period of 10 years from the date of grant.
Stock-based compensation expense is recognized only for those awards that are expected to vest, with forfeitures estimated based on our historical experience and future expectations. As of February 1, 2020, the total compensation cost related to unvested options not yet recognized was approximately $2.0 million, with a weighted average expense recognition period remaining of 1.8 years.
F-20
The following table summarizes the stock-based compensation award activity for outstanding stock options for fiscal 2019:
(in thousands, except per share amounts and years) | Shares Subject to Options | Weighted Average Exercise Price per Share | Weighted Average Remaining Contractual Life | Aggregate Intrinsic Value | ||||||||
Outstanding - beginning of period | $ | |||||||||||
Exercised | ( | ) | $ | |||||||||
Forfeited | ( | ) | $ | |||||||||
Outstanding - end of period | $ | $ | ||||||||||
Vested and expected to vest - end of period | $ | $ | ||||||||||
Exercisable - end of period | $ | $ | ||||||||||
The aggregate intrinsic value is calculated as the amount by which the fair value of the underlying common shares exceeds the option exercise price. The total intrinsic value of options exercised during fiscal 2019, 2018 and 2017 was $1.2 million, $2.1 million and $2.0 million, respectively. The total fair value of options that vested during fiscal 2019, 2018 and 2017 was $1.1 million, $0.8 million and $0.6 million, respectively.
Restricted Stock Units- Grants of time-based RSUs generally cliff vest over three years and performance-based RSUs generally cliff vest over three years based upon the achievement of pre-established goals as of the end of the first year of the term. RSUs receive dividend equivalents in the form of additional restricted stock units, which are subject to the same restrictions and forfeiture provisions as the original award. The grant date fair value of RSUs is based on the closing market price of the Class A common shares on the date of the grant.
The following table summarizes the stock-based compensation award activity for unvested stock units for fiscal 2019:
Time-Based RSUs | Performance-Based RSUs | ||||||||||||
(shares in thousands) | Number of Shares | Weighted Average Grant Date Fair Value | Number of Shares | Weighted Average Grant Date Fair Value | |||||||||
Outstanding - beginning of period | $ | $ | |||||||||||
Granted | $ | $ | |||||||||||
Vested | ( | ) | $ | ( | ) | $ | |||||||
Forfeited | ( | ) | $ | ( | ) | $ | |||||||
Outstanding - end of period | $ | $ | |||||||||||
The total fair value of time-based RSUs that vested during fiscal 2019, 2018 and 2017 was $3.8 million, $1.7 million and $2.9 million, respectively. As of February 1, 2020, the total compensation cost related to unvested time-based RSUs not yet recognized was $15.3 million, with a weighted average expense recognition period remaining of 1.9 years.
The total fair value of performance-based RSUs that vested during fiscal 2019, 2018 and 2017 was $3.9 million, $3.2 million and $1.8 million, respectively. As of February 1, 2020, the total compensation cost related to unvested performance-based RSUs not yet recognized was approximately $4.4 million, with a weighted average expense recognition period remaining of 1.7 years.
Director Stock Units- We issue stock units to directors who are not employees. Stock units are automatically granted to each director on the date of each annual meeting of shareholders based on the closing market price of the Class A common shares. In addition, each director eligible to receive compensation for board service may elect to have the cash portion of such compensation paid in the form of stock units. Stock units granted to directors vest immediately and directors are given the option to settle their units 30 days after the grant date, at a specified date more than 30 days following the grant date, or upon completion of service. Stock units granted to directors not yet settled, which are not subject to forfeiture, are considered to be outstanding for the purposes of computing basic earnings (loss) per share. As of February 1, 2020, we had 0.5 million director stock units not yet settled.
F-21
7. SHAREHOLDERS' EQUITY
The following table provides additional information for our common shares:
February 1, 2020 | February 2, 2019 | ||||||||||
(in thousands) | Class A | Class B | Class A | Class B | |||||||
Authorized shares | |||||||||||
Issued shares | |||||||||||
Outstanding shares | |||||||||||
Treasury shares | — | — | |||||||||
We have authorized 100.0 million shares of no -par value preferred shares with no shares issued for any of the periods presented.
Share Repurchases- On August 17, 2017, the Board of Directors authorized the repurchase of an additional $500 million of Class A common shares under our share repurchase program, which was added to the $33.5 million remaining from the previous authorization. During fiscal 2019, we repurchased 7.1 million Class A common shares at a cost of $141.6 million, with $334.9 million of Class A common shares that remain authorized under the program as of February 1, 2020. During fiscal 2018, we repurchased 2.0 million Class A common shares at a cost of $47.5 million, with $476.6 million of Class A common shares that remain authorized under the program as of February 2, 2019. The share repurchase program may be suspended, modified or discontinued at any time, and we have no obligation to repurchase any amount of our common shares under the program. Shares will be repurchased in the open market at times and in amounts considered appropriate based on price and market conditions.
Accumulated Other Comprehensive Loss- Changes for the balances of each component of accumulated other comprehensive loss were as follows (all amounts are net of tax):
(in thousands) | Foreign Currency Translation | Available-for-Sale Securities | Total | ||||||||
Balance, January 28, 2017 | $ | ( | ) | $ | ( | ) | $ | ( | ) | ||
Other comprehensive income (loss) before reclassifications | ( | ) | |||||||||
Amounts reclassified to non-operating expenses, net | |||||||||||
Other comprehensive income (loss) | ( | ) | |||||||||
Balance, February 3, 2018 | ( | ) | ( | ) | ( | ) | |||||
Other comprehensive income (loss) before reclassifications | ( | ) | ( | ) | |||||||
Amounts reclassified to non-operating expenses, net | |||||||||||
Other comprehensive income | |||||||||||
Balance, February 2, 2019 | ( | ) | ( | ) | ( | ) | |||||
Other comprehensive income (loss) before reclassifications | ( | ) | |||||||||
Amounts reclassified to non-operating expenses, net | ( | ) | ( | ) | |||||||
Other comprehensive income (loss) | ( | ) | |||||||||
Balance, February 1, 2020 | $ | ( | ) | $ | $ | ( | ) | ||||
F-22
8. ACCOUNTS RECEIVABLE
Accounts receivable, net, consisted of the following:
(in thousands) | February 1, 2020 | February 2, 2019 | |||||
Customer accounts receivables: | |||||||
Serviced by third-party provider with guaranteed payment | $ | $ | |||||
Serviced by third-party provider without guaranteed payment | |||||||
Serviced in-house | |||||||
Construction and tenant allowance receivables due from landlords(1) | |||||||
Other receivables | |||||||
Accounts receivable | |||||||
Allowance for doubtful accounts | ( | ) | ( | ) | |||
Accounts receivable, net | $ | $ | |||||
(1) | Upon transition to ASU 2016-02 at the beginning of fiscal 2019, amounts for construction and tenant allowance receivables due from landlords were netted against the operating lease liabilities. |
The following presents the activity in our balance in the allowance for doubtful accounts:
Fiscal | |||||||
(in thousands) | 2019 | 2018 | |||||
Allowance for doubtful accounts - beginning of period | $ | ( | ) | $ | |||
Provision for bad debts | ( | ) | ( | ) | |||
Recoveries and other adjustments | |||||||
Allowance for doubtful accounts - end of period | $ | ( | ) | $ | ( | ) | |
9. INVESTMENTS
Investments in available-for-sale securities consisted of the following:
(in thousands) | February 1, 2020 | February 2, 2019 | |||||
Carrying value of investments | $ | $ | |||||
Unrealized gains included in accumulated other comprehensive loss | |||||||
Unrealized losses included in accumulated other comprehensive loss | ( | ) | |||||
Fair value | $ | $ | |||||
10. | PROPERTY AND EQUIPMENT |
Property and equipment, net, consisted of the following:
(in thousands) | February 1, 2020 | February 2, 2019 | |||||
Land | $ | $ | |||||
Buildings | |||||||
Building and leasehold improvements | |||||||
Furniture, fixtures and equipment | |||||||
Software | |||||||
Construction in progress | |||||||
Total property and equipment | |||||||
Accumulated depreciation and amortization | ( | ) | ( | ) | |||
Property and equipment, net | $ | $ | |||||
F-23
11. | GOODWILL AND INTANGIBLE ASSETS |
Goodwill- Activity related to our goodwill was as follows:
February 1, 2020 | February 2, 2019 | ||||||||||||||||||||||
(in thousands) | Goodwill | Accumulated Impairments | Net | Goodwill | Accumulated Impairments | Net | |||||||||||||||||
Beginning of period by segment: | |||||||||||||||||||||||
U.S. Retail | $ | $ | $ | $ | $ | $ | |||||||||||||||||
Canada Retail | ( | ) | |||||||||||||||||||||
Brand Portfolio | |||||||||||||||||||||||
Other | ( | ) | |||||||||||||||||||||
( | ) | ( | ) | ||||||||||||||||||||
Activity by segment: | |||||||||||||||||||||||
U.S. Retail - | |||||||||||||||||||||||
Allocation of goodwill from Brand Portfolio | — | — | — | — | |||||||||||||||||||
Canada Retail: | |||||||||||||||||||||||
Acquired TSL goodwill | — | — | — | — | |||||||||||||||||||
Impairment charges | — | — | — | — | ( | ) | ( | ) | |||||||||||||||
Currency translation adjustment | ( | ) | ( | ) | ( | ) | ( | ) | |||||||||||||||
Brand Portfolio: | |||||||||||||||||||||||
Acquired Camuto Group goodwill | — | — | — | — | |||||||||||||||||||
Purchase price and allocation adjustments | — | — | — | ||||||||||||||||||||
Allocation of goodwill to U.S. Retail | ( | ) | — | ( | ) | — | — | — | |||||||||||||||
Other - Eliminated goodwill from Ebuys exit | — | — | — | ( | ) | — | |||||||||||||||||
End of period by segment: | |||||||||||||||||||||||
U.S. Retail | |||||||||||||||||||||||
Canada Retail | ( | ) | ( | ) | |||||||||||||||||||
Brand Portfolio | |||||||||||||||||||||||
$ | $ | ( | ) | $ | $ | $ | ( | ) | $ | ||||||||||||||
Intangible Assets- Intangible assets consisted of the following:
February 1, 2020 | February 2, 2019 | ||||||||||||||||||||||
(in thousands) | Cost | Accumulated Amortization | Net | Cost | Accumulated Amortization | Net | |||||||||||||||||
Definite-lived: | |||||||||||||||||||||||
Customer relationships | $ | $ | ( | ) | $ | $ | $ | ( | ) | $ | |||||||||||||
Favorable leasehold interests | — | — | — | ( | ) | ||||||||||||||||||
Indefinite-lived trademarks and tradenames | |||||||||||||||||||||||
$ | $ | ( | ) | $ | $ | $ | ( | ) | $ | ||||||||||||||
F-24
The customer relationships are amortized by the straight-line method over three years associated with the Canada loyalty program and eight years for Brand Portfolio customer relationships. Upon transition to ASU 2016-02 at the beginning of fiscal 2019, amounts for favorable leasehold interests were netted against the operating lease assets.
12. | ACCRUED EXPENSES |
Accrued expenses consisted of the following:
(in thousands) | February 1, 2020 | February 2, 2019 | |||||
Gift cards and merchandise credits | $ | $ | |||||
Accrued compensation and related expenses | |||||||
Accrued taxes | |||||||
Loyalty programs deferred revenue | |||||||
Sales returns | |||||||
Customer allowances and discounts | |||||||
Other | |||||||
$ | $ | ||||||
13. OTHER NON-CURRENT LIABILITIES
Other non-current liabilities consisted of the following:
(in thousands) | February 1, 2020 | February 2, 2019 | |||||
Foreign tax contingent liabilities | $ | $ | |||||
Deferred tax liabilities | |||||||
Construction and tenant allowances(1) | |||||||
Deferred rent(1) | |||||||
Accrual for lease obligations(1) | |||||||
Unfavorable leasehold interests(1) | |||||||
Other | |||||||
$ | $ | ||||||
(1) | Upon transition to ASU 2016-02 at the beginning of fiscal 2019, amounts for construction and tenant allowances, deferred rent, the accrual for lease obligations, and unfavorable leasehold interests were netted against the operating lease assets. |
The following table presents the changes and total balances for the accrual for lease obligations:
Fiscal | |||||||
(in thousands) | 2019 | 2018 | |||||
Beginning of period | $ | $ | |||||
Netted against lease assets upon transition to ASU 2016-02 | ( | ) | |||||
Assumed liability in acquisitions | |||||||
Additions | |||||||
Lease obligation payments, net of sublease income | ( | ) | |||||
Adjustments | |||||||
End of period | $ | $ | |||||
F-25
14. | DEBT |
Credit Facility- Our Credit Facility, with a maturity date of August 25, 2022 , provides a revolving line of credit up to $400 million, with sub-limits for the issuance of up to $50 million in letters of credit, swing loan advances of up to $15 million, and the issuance of up to $75 million in foreign currency revolving loans and letters of credit. The Credit Facility may be used to provide funds for working capital, capital expenditures, share repurchases, other expenditures, and permitted acquisitions as defined by the Credit Facility. Our Credit Facility allows the payments of dividends by us or our subsidiaries, provided that immediately before and after a dividend payment there is no event of default, as defined in our Credit Facility.
Loans issued under the revolving line of credit bear interest, at our option, at a base rate or an alternate base rate as defined in the Credit Facility plus a margin based on our leverage ratio, with an interest rate of 3.4 % as of February 1, 2020. Any loans issued in CAD bear interest at the alternate base rate plus a margin based on our leverage ratio. Interest on letters of credit issued under the Credit Facility is variable based on our leverage ratio and the type of letters of credit, with an interest rate of 1.8 % as of February 1, 2020. Commitment fees are based on the average unused portion of the Credit Facility at a variable rate based on our leverage ratio. As of February 1, 2020 and February 2, 2019, we had $190.0 million and $160.0 million, respectively, outstanding under the Credit Facility. As of February 1, 2020, with the amount outstanding under the Credit Facility and $3.0 million in letters of credit issued, we had $207.0 million available for borrowings. Interest expense related to the Credit Facility includes interest on borrowings and letters of credit, commitment fees and the amortization of debt issuance costs.
15. | LEASES |
We lease our stores, fulfillment center and other facilities under operating lease arrangements with unrelated parties and related parties owned by Schottenstein Affiliates. The majority of our real estate leases provide for renewal options, which are typically not included in the lease term used for measuring the lease assets and lease liabilities as it is not reasonably certain we will exercise options. We pay variable amounts for certain lease and non-lease components as well as for contingent rentals based on sales for certain leases where the sales are in excess of specified levels and for leases that have certain contingent triggering events that are in effect. We also lease equipment under operating leases.
We receive operating sublease income from unrelated third parties for leasing portions or all of certain properties. Operating sublease income and operating expenses for these properties are included in operating expenses in our consolidated statements of operations.
F-26
Lease income and lease expense consisted of the following for fiscal 2019 (after the adoption of ASU 2016-02) and fiscal 2018 and 2017 (prior to the adoption of ASU 2016-02):
Fiscal | |||||||||||
(in thousands) | 2019 | 2018 | 2017 | ||||||||
Operating lease income | $ | $ | $ | ||||||||
Operating lease expense: | |||||||||||
Lease expense to unrelated parties | $ | $ | $ | ||||||||
Lease expense to related parties | |||||||||||
Variable lease expense to unrelated parties | |||||||||||
Variable lease expense to related parties | |||||||||||
$ | $ | $ | |||||||||
Fiscal 2019 | ||
Other operating lease information: | ||
Weighted-average remaining lease term | ||
Weighted-average discount rate | % | |
As of February 1, 2020, our future fixed minimum lease payments are as follows:
(in thousands) | Unrelated Parties | Related Parties | Total | ||||||||
Fiscal 2020 | $ | $ | $ | ||||||||
Fiscal 2021 | |||||||||||
Fiscal 2022 | |||||||||||
Fiscal 2023 | |||||||||||
Fiscal 2024 | |||||||||||
Future fiscal years thereafter | |||||||||||
Less discounting impact on operating leases | ( | ) | ( | ) | ( | ) | |||||
Total operating lease liabilities | |||||||||||
Less current operating lease liabilities | ( | ) | ( | ) | ( | ) | |||||
Non-current operating lease liabilities | $ | $ | $ | ||||||||
As of February 1, 2020, we have entered into lease commitments for eleven new store locations and one store relocation where the leases have not yet commenced, and therefore the lease liabilities have not yet been recorded. We expect the lease commencement to begin in the next fiscal quarter for these locations and we will record additional operating lease liabilities of approximately $20.1 million.
F-27
As of February 2, 2019, future minimum lease payment requirements, excluding contingent rental payments, maintenance, insurance, real estate taxes, and the amortization of deferred rent and construction and tenant allowances, consisted of the following, as determined prior to the adoption of ASU 2016-02:
(in thousands) | Unrelated Parties | Related Parties | Total | ||||||||
Fiscal 2019 | $ | $ | $ | ||||||||
Fiscal 2020 | |||||||||||
Fiscal 2021 | |||||||||||
Fiscal 2022 | |||||||||||
Fiscal 2023 | |||||||||||
Future fiscal years thereafter | |||||||||||
$ | $ | $ | |||||||||
16. | COMMITMENTS AND CONTINGENCIES |
Legal Proceedings- We are involved in various legal proceedings that are incidental to the conduct of our business. Although it is not possible to predict with certainty the eventual outcome of any litigation, we believe the amount of any potential liability with respect to current legal proceedings will not be material to the results of operations or financial condition. As additional information becomes available, we will assess any potential liability related to pending litigation and revise the estimates as needed.
Foreign Tax Contingencies- During the due diligence procedures performed related to the acquisition of Camuto Group, we identified probable contingent liabilities associated with unpaid foreign payroll and other taxes that could also result in assessed penalties and interest. We developed an initial estimate of the range of outcomes related to these obligations and have since refined our estimates with additional analysis. Our current estimate of the range of outcomes is $28.1 million to $40.0 million for obligations we are aware of at this time. We expect to resolve certain obligations with tax authorities over the next twelve months. As of February 1, 2020, we recorded a contingent liability of $28.1 million, with $22.1 million included in accrued expenses and $6.0 million included in other non-current liabilities on the consolidated balance sheets, representing the low end of the range and an indemnification asset of $24.5 million, with $19.6 million included in accounts receivable and $4.9 million included in other assets on the consolidated balance sheets, representing the estimated amount we expect to collect under the terms of the securities purchase agreement with the Sellers. We are continuing to assess the exposure, which may result in material changes to these estimates, and we may identify additional contingent liabilities. We believe that the Sellers are obligated to indemnify us for any payments to foreign taxing authorities for the periods up to the acquisition date. Although a portion of the purchase price is held in escrow and another portion is held in a restricted bank account, there can be no assurance that we will successfully collect all amounts that we may be obligated to settle with the foreign taxing authorities.
Guarantee- As a result of a previous merger, we provided a guarantee for a lease commitment that is scheduled to expire in fiscal 2023 for a location that has been leased to a third party. If the third party does not pay the rent or vacates the premise, we may be required to make full rent payments to the landlord. As of February 1, 2020, the total future minimum lease payment requirements for this guarantee was approximately $13.4 million.
Contractual Obligations- As of February 1, 2020, we have entered into various noncancelable purchase and service agreements, including construction commitments for capital items to be purchased for projects that were under construction or for which a lease has been signed. In addition, we have license agreements that allow us to use third-party owned brands, including a license agreement with ABG-Camuto (a related party), that have guaranteed minimum royalty payments.
F-28
As of February 1, 2020, our noncancelable purchase obligations and future guaranteed minimum royalty payments are as follows:
Guaranteed Minimum Royalties | |||||||||||||||
(in thousands) | Noncancelable Purchase Obligations | Unrelated Parties | Related Party | Total | |||||||||||
Fiscal 2020 | $ | $ | $ | $ | |||||||||||
Fiscal 2021 | |||||||||||||||
Fiscal 2022 | |||||||||||||||
Fiscal 2023 | |||||||||||||||
Fiscal 2024 | |||||||||||||||
Future fiscal years thereafter | |||||||||||||||
$ | $ | $ | $ | ||||||||||||
17. INCOME TAXES
Income, including income (loss) from equity investment in TSL, before income taxes consisted of the following:
Fiscal | |||||||||||
(in thousands) | 2019 | 2018 | 2017 | ||||||||
Domestic income | $ | $ | $ | ||||||||
Foreign income (loss), including income (loss) from equity investment in TSL | ( | ) | ( | ) | |||||||
Income, including income (loss) from equity investment in TSL, before income taxes | $ | $ | $ | ||||||||
Income tax provision consisted of the following:
Fiscal | |||||||||||
(in thousands) | 2019 | 2018 | 2017 | ||||||||
Current: | |||||||||||
Federal | $ | $ | $ | ||||||||
Foreign | |||||||||||
State and local | |||||||||||
Total current tax expense | |||||||||||
Deferred: | |||||||||||
Federal | ( | ) | ( | ) | ( | ) | |||||
Foreign | ( | ) | ( | ) | |||||||
State and local | ( | ) | ( | ) | ( | ) | |||||
Total deferred tax expense | ( | ) | ( | ) | ( | ) | |||||
Income tax provision | $ | $ | $ | ||||||||
F-29
The following presents a reconciliation of the income tax provision based on the U.S. federal statutory tax rate to the total tax provision (the U.S. federal statutory tax rate used below for fiscal 2017 excludes the impact of the revised rate due to the U.S. Tax Reform as that change is reflected in the net impact of implementing the U.S. Tax Reform):
Fiscal | |||||||||||
(in thousands) | 2019 | 2018 | 2017 | ||||||||
Income tax provision at federal statutory rate | $ | $ | $ | ||||||||
State and local taxes, net of federal benefit | |||||||||||
Foreign tax rate differential | ( | ) | |||||||||
Foreign impairment charges | |||||||||||
Change in valuation allowance | ( | ) | |||||||||
Non-deductible compensation | |||||||||||
Change in uncertain tax positions | ( | ) | |||||||||
Net impact of implementing the U.S. Tax Reform | |||||||||||
Other | ( | ) | ( | ) | ( | ) | |||||
Income tax provision | $ | $ | $ | ||||||||
On December 22, 2017, the U.S. Tax Reform was enacted in the U.S., which significantly changed how the U.S. taxes corporations. The U.S. Tax Reform reduced the federal statutory tax rate from 35 % to 21 % and requires complex computations to be performed that were not previously required in U.S. tax law. The U.S. Treasury Department, the U.S. Internal Revenue Service, and other standard-setting bodies could interpret or issue guidance on how provisions of the U.S. Tax Reform will be applied or otherwise administered that is different from our interpretation. During fiscal 2017, we recognized $10.1 million of additional net tax expense based on our initial assessment of implementing the U.S. Tax Reform. During fiscal 2018, we completed our determination of the accounting implications of the U.S. Tax Reform and recognized $2.1 million of additional net tax expense as a result of implementing the U.S. Tax Reform.
For fiscal 2019, the impact of taxation of the foreign operations on our total effective income tax rate was primarily related to valuation allowances taken.
F-30
The tax effects of temporary differences that give rise to significant portions of the deferred tax assets and liabilities are as follows:
(in thousands) | February 1, 2020 | February 2, 2019 | |||||
Deferred tax assets: | |||||||
State bonus depreciation | $ | $ | |||||
Inventory | |||||||
Construction and tenant allowances | |||||||
Stock-based compensation | |||||||
Gift cards | |||||||
Accrued expenses | |||||||
Accrued rewards | |||||||
Accrued rent | |||||||
Lease liability | — | ||||||
Foreign net operating losses | |||||||
Acquisition-related transaction costs | |||||||
Other | |||||||
Less: valuation allowance | ( | ) | ( | ) | |||
Total deferred tax assets, net of valuation allowance | |||||||
Deferred tax liabilities: | |||||||
Right of use asset | ( | ) | — | ||||
Property and equipment | ( | ) | ( | ) | |||
Intangible assets | ( | ) | ( | ) | |||
Prepaid expenses and other | ( | ) | ( | ) | |||
( | ) | ( | ) | ||||
Net deferred tax assets | $ | $ | |||||
Deferred income taxes are reported within the consolidated balance sheets as follows:
(in thousands) | February 1, 2020 | February 2, 2019 | |||||
Deferred tax assets | $ | $ | |||||
Deferred tax liabilities included in other non-current liabilities | ( | ) | ( | ) | |||
Net deferred tax assets as shown above | $ | $ | |||||
We establish valuation allowances for deferred tax assets when the amount of expected future taxable income is not likely to support the use of the deduction or credit. As of February 1, 2020, the valuation allowance is primarily related to foreign net operating losses, which, if not utilized, a portion of the carryovers will begin to expire in fiscal 2034. The following presents the changes in valuation allowance:
Fiscal | |||||||||||
(in thousands) | 2019 | 2018 | 2017 | ||||||||
Valuation allowance - beginning of period | $ | $ | $ | ||||||||
Additions charged to income tax provision | |||||||||||
Additions related to acquisitions | |||||||||||
Allowances taken or written off | ( | ) | ( | ) | ( | ) | |||||
Other adjustments | ( | ) | |||||||||
Valuation allowance - end of period | $ | $ | $ | ||||||||
The U.S. Tax Reform included a mandatory one-time tax on accumulated earnings of foreign subsidiaries, and as a result, all previously unremitted earnings for which no U.S. deferred tax liability had been previously accrued have now been subject to
F-31
U.S. tax. Notwithstanding the U.S. taxation of these amounts, we intend to continue to invest all of these earnings, as well as our capital in these subsidiaries, indefinitely outside of the U.S. and we do not expect to incur any significant, additional taxes related to such amounts.
Changes in gross unrecognized tax benefits were as follows:
Fiscal | |||||||||||
(in thousands) | 2019 | 2018 | 2017 | ||||||||
Unrecognized tax benefits - beginning of period | $ | $ | $ | ||||||||
Additions for tax positions taken in the current year | |||||||||||
Reductions for tax positions taken in prior years: | |||||||||||
Changes in estimates | ( | ) | |||||||||
Lapses of applicable statutes of limitations | ( | ) | |||||||||
Settlements | ( | ) | ( | ) | ( | ) | |||||
Unrecognized tax benefits - end of period | $ | $ | $ | ||||||||
Of the $10.8 million, $11.6 million and $7.9 million of total unrecognized tax benefits at February 1, 2020, February 2, 2019 and February 3, 2018, respectively, approximately $9.2 million, $10.2 million and $6.7 million, respectively, represent the amount of unrecognized tax benefits that, if recognized, would affect the effective tax rate in future periods. While it is expected that the amount of unrecognized tax benefits will change in the next 12 months, any changes are not expected to have a material impact on our financial position, results of operations or cash flows. We recognize interest and penalties related to unrecognized tax benefits as a component of the income tax provision. As of February 1, 2020, February 2, 2019 and February 3, 2018, interest and penalties were $2.3 million, $1.8 million and $0.9 million, respectively.
18. | SEGMENT REPORTING |
Our three reportable segments, which are also operating segments, are the U.S. Retail segment, the Canada Retail segment, and the Brand Portfolio segment. We have determined that the Chief Operating Decision Maker ("CODM") is our Chief Executive Officer and we have identified such segments based on internal management reporting and responsibilities. The performance of each segment is based primarily on net sales and gross profit. As a result, we do not allocate operating expenses to the segments. We changed our presentation of net sales and gross profit for all periods presented to include commission income. Total assets by segment are not presented in the table below as the CODM does not evaluate, manage or measure performance of segments using total assets.
F-32
The following provides certain financial data by segment reconciled to the consolidated financial statements:
(in thousands) | U.S. Retail | Canada Retail | Brand Portfolio | Other | Corporate / Eliminations | Total | |||||||||||||||||
Fiscal 2019 | |||||||||||||||||||||||
Net sales: | |||||||||||||||||||||||
External customer sales | $ | $ | $ | $ | $ | $ | |||||||||||||||||
Intersegment sales | — | — | — | ( | ) | — | |||||||||||||||||
Total net sales | $ | $ | $ | $ | $ | ( | ) | $ | |||||||||||||||
Gross profit | $ | $ | $ | $ | $ | ( | ) | $ | |||||||||||||||
Income from Equity investment in ABG-Camuto | $ | $ | $ | $ | $ | $ | |||||||||||||||||
Cash paid for property and equipment | $ | $ | $ | $ | $ | $ | |||||||||||||||||
Depreciation and amortization | $ | $ | $ | $ | $ | $ | |||||||||||||||||
Fiscal 2018 | |||||||||||||||||||||||
Net sales: | |||||||||||||||||||||||
External customer sales | $ | $ | $ | $ | $ | $ | |||||||||||||||||
Intersegment sales | — | — | — | ( | ) | — | |||||||||||||||||
Total net sales | $ | $ | $ | $ | $ | ( | ) | $ | |||||||||||||||
Gross profit | $ | $ | $ | $ | $ | ( | ) | $ | |||||||||||||||
Income from Equity investment in ABG-Camuto | $ | $ | $ | $ | $ | $ | |||||||||||||||||
Cash paid for property and equipment | $ | $ | $ | $ | $ | $ | |||||||||||||||||
Depreciation and amortization | $ | $ | $ | $ | $ | $ | |||||||||||||||||
Fiscal 2017 | |||||||||||||||||||||||
Total net sales | $ | $ | $ | $ | $ | $ | |||||||||||||||||
Gross profit | $ | $ | $ | $ | $ | $ | |||||||||||||||||
Cash paid for property and equipment | $ | $ | $ | $ | $ | $ | |||||||||||||||||
Depreciation and amortization | $ | $ | $ | $ | $ | $ | |||||||||||||||||
The U.S. Retail and Brand Portfolio segments and Other net sales recognized are primarily based on sales to customers in the U.S., and Canada Retail segment net sales recognized are based on sales to customers in Canada. Net sales realized from geographic markets outside of the U.S. and Canada have collectively been immaterial.
As of February 1, 2020 and February 2, 2019, long-lived assets, consisting of property and equipment and operating lease assets, included $1.2 billion and $374.1 million, respectively, in the U.S. and $114.5 million and $35.2 million, respectively, in Canada with only an immaterial amount in other countries. No single customer accounts for ten percent or more of consolidated total net sales. However, the Brand Portfolio segment has four customers that make up approximately 60 % of its total net sales, excluding intersegment net sales, and the loss of any or all of these customers could have a material adverse effect on the Brand Portfolio segment.
F-33
19. | QUARTERLY FINANCIAL DATA (UNAUDITED) |
The following tables contain selected quarterly consolidated financial data for fiscal 2019 and 2018 that have been prepared on the same basis as the accompanying audited consolidated financial statements and include all adjustments necessary for a fair presentation, in all material respects, of the information set forth therein on a consistent basis:
Fiscal 2019 Quarters Ended(1) | |||||||||||||||
(in thousands, except per share data) | May 4, 2019 | August 3, 2019 | November 2, 2019 | February 1, 2020 | |||||||||||
Net sales | $ | $ | $ | $ | |||||||||||
Gross profit | $ | $ | $ | $ | |||||||||||
Operating profit (loss) | $ | $ | $ | $ | ( | ) | |||||||||
Net income (loss) | $ | $ | $ | $ | ( | ) | |||||||||
Diluted earnings (loss) per share(4) | $ | $ | $ | $ | ( | ) | |||||||||
Fiscal 2018 Quarters Ended(2) | |||||||||||||||
(in thousands, except per share data) | May 5, 2018 | August 4, 2018 | November 3, 2018 | February 2, 2019 | |||||||||||
Net sales | $ | $ | $ | $ | |||||||||||
Gross profit | $ | $ | $ | $ | |||||||||||
Operating profit (loss) | $ | $ | $ | $ | ( | ) | |||||||||
Net income (loss)(3) | $ | $ | ( | ) | $ | $ | ( | ) | |||||||
Diluted earnings (loss) per share(4) | $ | $ | ( | ) | $ | $ | ( | ) | |||||||
(1) | During fiscal 2019, operating results were impacted by the following pre-tax items for the quarters presented: |
Fiscal 2019 Quarters Ended | |||||||||||||||
(in thousands) | May 4, 2019 | August 3, 2019 | November 2, 2019 | February 1, 2020 | |||||||||||
Integration and restructuring expenses | $ | $ | $ | $ | |||||||||||
Impairment charges | $ | $ | $ | $ | |||||||||||
(2) During fiscal 2018, operating results were impacted by the following pre-tax items for the quarters presented:
Fiscal 2018 Quarters Ended | |||||||||||||||
(in thousands) | May 5, 2018 | August 4, 2018 | November 3, 2018 | February 2, 2019 | |||||||||||
Lease exit and other termination costs | $ | $ | $ | $ | |||||||||||
Acquisition-related costs and target acquisition costs | $ | $ | $ | $ | |||||||||||
Impairment charges (adjustments) | $ | $ | $ | ( | ) | $ | |||||||||
Fair value adjustments to TSL's previously held assets | $ | $ | $ | $ | |||||||||||
Camuto Group inventory step-up | $ | $ | $ | $ | |||||||||||
Restructuring expenses | $ | $ | $ | $ | |||||||||||
Foreign currency transactions losses (gains) | $ | $ | $ | $ | ( | ) | |||||||||
(3) | During the fourth quarter of fiscal 2018, we recognized $ |
(4) | The sum of the quarterly diluted earnings (loss) per share amounts may not equal the fiscal year amount due to rounding and the use of weighted average shares outstanding for each period. |
F-34
20. | SUBSEQUENT EVENTS |
Coronavirus- In March 2020, the World Health Organization declared the coronavirus ("COVID-19") outbreak a pandemic, which continues to spread throughout North America and worldwide. The health and safety of our customers and employees remain our top priority as we continue to make decisions during this rapidly evolving situation. We have taken decisive actions across our businesses to help protect employees, customers and others in the communities we serve. As a measure to limit the spread of the virus, effective March 18, 2020, we temporarily closed all of our stores in the U.S. and Canada. Our e-commerce business will continue to be available to customers and our stores will be used in the fulfillment of online orders to be shipped to customers or available for curbside pickup. During this unprecedented period of uncertainty, we have in place business continuity plans involving adjustments to operational plans, inventory disciplines, liquidity management, and reductions to our expense and capital expenditure plans. Such measures include implementing temporary leaves of absence for over 80% of our workforce without direct pay and pay reductions for nearly all employees not placed on temporary leave. The COVID-19 outbreak and the temporary closure of all of our stores has had a material adverse impact on our business, liquidity, financial condition, and results of operations.
While we cannot foresee whether the outbreak of COVID-19 will be effectively contained, nor can we predict the severity and duration of its impact, based on our current understanding of governmental mandates and maintaining the health and safety of our customers and employees, we believe our stores will primarily begin re-opening in the second quarter of fiscal 2020 with a gradual return of store traffic through the remainder of fiscal 2020. As such, the impacts of COVID-19 to our businesses are highly uncertain and we will continue to assess the financial impacts. The disruption to the global economy and to our business, along with a sustained decline in our stock price, may lead to triggering events that may indicate that the carrying value of certain assets, including inventories, accounts receivables, long-lived assets, intangibles, and goodwill, may not be recoverable.
Dividends- On March 17, 2020 , the Board of Directors declared a quarterly cash dividend payment of $0.10 per share for both Class A and Class B common shares. The dividend was paid on April 10, 2020 to shareholders of record at the close of business on March 30, 2020 .
Credit Facility- Subsequent to February 1, 2020, we borrowed $205.0 million from the Credit Facility as a precautionary measure to increase our cash position and preserve financial flexibility considering uncertainty in the U.S. and global markets resulting from COVID-19, resulting in $2.0 million of available for borrowing.
On April 30, 2020, the Credit Facility was amended, which resulted in various changes including:
• | Provides for a lien on all of the Company's assets; |
• | Reduces the borrowing availability to $ |
• | Redefines the components for calculating the leverage ratio and fixed charge coverage ratio to adjust for certain temporary impacts due to COVID-19; |
• | Changes the maximum leverage ratio covenant to |
• | Changes the minimum fixed charge coverage ratio to |
• | Restricts the Company from paying dividends, making share repurchases, and making certain acquisitions. |
F-35