As filed with the Securities and Exchange Commission on July 19, 2013
File Nos. 333-120338
811-21668
SECURITIES AND EXCHANGE COMMISSION
WASHINGTON, D.C. 20549
FORM N-1A
REGISTRATION STATEMENT
UNDER
THE SECURITIES ACT OF 1933 | x | |
PRE-EFFECTIVE AMENDMENT NO. | ¨ | |
POST-EFFECTIVE AMENDMENT NO. 14 | x |
And
REGISTRATION STATEMENT
UNDER
THE INVESTMENT COMPANY ACT OF 1940 | x | |
AMENDMENT NO. 16 | x |
COHEN & STEERS
DIVIDEND VALUE FUND, INC.
(Exact Name Of Registrant As Specified In Charter)
280 Park Avenue, New York, NY 10017
(Address Of Principal Executive Office)
Registrants Telephone Number, including Area Code: (212) 832-3232
Tina M. Payne
Cohen & Steers Capital Management, Inc.
280 Park Avenue
New York, New York 10017
(Name And Address Of Agent Of Service Of Process)
With copies to:
Michael G. Doherty, Esq.
Ropes & Gray LLP
1211 Avenue of the Americas
New York, New York 10036
Approximate Date of Proposed Public Offering : As soon as practicable after the effective date of this registration statement.
It is proposed that this filing will become effective (check appropriate box):
x | immediately upon filing pursuant to paragraph (b) |
¨ | on April 30, 2013 pursuant to paragraph (b) |
¨ | 60 days after filing pursuant to paragraph (a)(1) |
¨ | on (date) pursuant to paragraph (a)(1) |
¨ | 75 days after filing pursuant to paragraph (a)(2) |
¨ | on (date) pursuant to paragraph (a)(2) of rule 485 |
If appropriate, check the following box:
¨ | this post-effective amendment designates a new effective date for a previously filed post-effective amendment. |
SIGNATURES
Pursuant to the requirements of the Securities Act and the 1940 Act, the Registrant certifies that it meets all the requirements for effectiveness of this Registration Statement under Rule 485(b) under the Securities Act and has duly caused this Registration Statement to be signed on its behalf by the undersigned, thereunto duly authorized, in the City of New York and State of New York, on the 19th day of July, 2013.
COHEN & STEERS DIVIDEND VALUE FUND, INC. | ||
By: | /s/ ADAM M. DERECHIN | |
Adam M. Derechin | ||
President and CEO |
Pursuant to the requirements of the Securities Act, this Registration Statement has been signed below by the following persons in the capacities and on the date indicated.
SIGNATURE |
TITLE |
DATE | ||||||||
By: |
/s/ ADAM M. DERECHIN (ADAM M. DERECHIN) |
President and Chief Executive Officer (Principal Executive Officer) | July 19, 2013 | |||||||
By: |
/s/ JAMES GIALLANZA (JAMES GIALLANZA) |
Treasurer (Principal Financial and Accounting Officer) | July 19, 2013 | |||||||
* (MARTIN COHEN) |
Co-Chairman and Director | July 19, 2013 | ||||||||
* (ROBERT H. STEERS) |
Co-Chairman and Director | July 19, 2013 | ||||||||
* (MICHAEL G. CLARK) |
Director | July 19, 2013 | ||||||||
* (BONNIE COHEN) |
Director | July 19, 2013 | ||||||||
* (GEORGE GROSSMAN) |
Director | July 19, 2013 | ||||||||
* (RICHARD E. KROON) |
Director | July 19, 2013 | ||||||||
* (RICHARD J. NORMAN) |
Director | July 19, 2013 | ||||||||
* (FRANK K. ROSS) |
Director | July 19, 2013 | ||||||||
* (C. EDWARD WARD, JR.) |
Director | July 19, 2013 | ||||||||
*By: |
/s/ TINA M. PAYNE Tina M. Payne ATTORNEY-IN-FACT |
July 19, 2013 |
EXHIBIT INDEX
Index No. |
Description of Exhibit | |
EX-101.INS | XBRL Instance Document | |
EX-101.SCH | XBRL Taxonomy Extension Schema Document | |
EX-101.CAL | XBRL Taxonomy Extension Calculation Linkbase | |
EX-101.DEF | XBRL Taxonomy Extension Definition Linkbase | |
EX-101.LAB | XBRL Taxonomy Extension Labels Linkbase | |
EX-101.PRE | XBRL Taxonomy Extension Presentation Linkbase |
Label | Element | Value |
---|---|---|
Risk/Return: | rr_RiskReturnAbstract | |
Registrant Name | dei_EntityRegistrantName | Cohen & Steers Dividend Value Fund, Inc. |
Prospectus Date | rr_ProspectusDate | Jul. 01, 2013 |
Document Creation Date | dei_DocumentCreationDate | Jun. 28, 2013 |
Class I | Cohen & Steers Dividend Value Fund, Inc. | ||||||||||||||||||||||||||||||||||||||
COHEN & STEERS DIVIDEND VALUE FUND, INC. | ||||||||||||||||||||||||||||||||||||||
INVESTMENT OBJECTIVES | ||||||||||||||||||||||||||||||||||||||
The investment objectives of Cohen & Steers Dividend Value Fund, Inc. (the Fund) are to provide long-term growth of income and capital appreciation. | ||||||||||||||||||||||||||||||||||||||
FUND FEES AND EXPENSES | ||||||||||||||||||||||||||||||||||||||
This table describes the fees and expenses that you could pay if you buy and hold shares of the Fund. | ||||||||||||||||||||||||||||||||||||||
Shareholder Fees (fees paid directly from your investment): | ||||||||||||||||||||||||||||||||||||||
|
||||||||||||||||||||||||||||||||||||||
Annual Fund Operating Expenses (expenses that you pay each year as a percentage of the value of your investment): | ||||||||||||||||||||||||||||||||||||||
|
||||||||||||||||||||||||||||||||||||||
EXAMPLE | ||||||||||||||||||||||||||||||||||||||
This example is intended to help you compare the cost of investing in the Fund with the cost of investing in other mutual funds. The example assumes that you invest $10,000 in the Fund for the time periods indicated and then redeem your shares at the end of those periods. The example also assumes that your investment has a 5% return each year and that the Fund’s operating expenses remain the same, and that the Advisor did not waive its fee and/or reimburse expenses after June 30, 2014 (through June 30, 2014, expenses are based on the net amount pursuant to the fee waiver/expense reimbursement agreement). Although your actual costs may be higher or lower, based on these assumptions your costs would be: | ||||||||||||||||||||||||||||||||||||||
|
||||||||||||||||||||||||||||||||||||||
PORTFOLIO TURNOVER | ||||||||||||||||||||||||||||||||||||||
The Fund pays transaction costs, such as commissions, when it buys and sells securities (or “turns over” its portfolio). A higher portfolio turnover rate may indicate higher transaction costs and may result in higher taxes when Fund shares are held in a taxable account. These costs, which are not reflected in annual fund operating expenses or in the example, affect the Fund’s performance. During the most recent fiscal year, the Fund’s portfolio turnover rate was 37% of the average value of its portfolio. | ||||||||||||||||||||||||||||||||||||||
PRINCIPAL INVESTMENT STRATEGIES | ||||||||||||||||||||||||||||||||||||||
Under normal market conditions, the Fund invests at least 80% of its net assets in a portfolio of dividend-paying common stocks and preferred stocks that have the potential to offer long-term growth of income and capital appreciation. The Fund invests primarily in companies with large market capitalizations similar to those of companies included in the Russell 1000 Value Index, typically using a “value approach.” A value approach seeks to identify companies that appear to be undervalued by various measures and may be temporarily out of favor but have good prospects for capital appreciation and dividend growth. The Fund may invest up to 20% of its net assets in securities issued by real estate investment trusts (REITs). REITs are companies that own interests in real estate or in real estate related loans or other interests and their revenue primarily consists of rent derived from owned, income producing real estate properties and capital gains from the sale of such properties. A REIT in the U.S. is generally not taxed on income distributed to shareholders so long as it meets certain tax-related requirements, including the requirement that it distribute substantially all of its taxable income to such shareholders. The Fund may write (sell) covered call options on securities the Fund holds in its portfolio. The Fund may also invest up to 20% of its net assets in bonds and other fixed-income securities of any maturity. The Fund may also invest up to 25% of its net assets in securities of foreign issuers (including emerging market issuers) which meet the same criteria for investment as domestic companies including investments in such companies in the form of American Depositary Receipts (ADRs), Global Depositary Receipts (GDRs) and European Depositary Receipts (EDRs). The Fund may engage in foreign currency transactions, including foreign currency forward contracts, futures contracts, options, swaps and other similar strategic transactions in connection with its investments in securities of non-U.S. companies. The Fund may invest up to 20% of its net assets in securities that at the time of investment are rated below investment grade by a nationally recognized statistical rating organization (NRSRO), or that are unrated but judged to be below investment grade by the Advisor. Such securities are commonly known as “high-yield” or “junk” securities. |
||||||||||||||||||||||||||||||||||||||
PRINCIPAL RISKS | ||||||||||||||||||||||||||||||||||||||
Investment Risk. An investment in the Fund is subject to investment risk, including the possible loss of the entire principal amount that you invest. Market Risk. Your investment in Fund shares represents an indirect investment in the securities owned by the Fund. The value of these securities, like other investments, may move up or down, sometimes rapidly and unpredictably. Your Fund shares at any point in time may be worth less than what you invested, even after taking into account the reinvestment of Fund dividends and distributions. Common Stock Risk. While common stock has historically generated higher average returns than fixed income securities, common stock has also experienced significantly more volatility in those returns. An adverse event, such as an unfavorable earnings report, may depress the value of common stock held by the Fund. Also, the price of common stock is sensitive to general movements in the stock market. A drop in the stock market may depress the price of common stock held by the Fund. Preferred Securities Risk. There are various risks associated with investing in preferred securities, including credit risk, interest rate risk, deferral and omission of distributions, subordination to bonds and other debt securities in a company’s capital structure, call, reinvestment and income risk, limited liquidity, limited voting rights and special redemption rights. REIT Risk. REITs are dependent upon management skills and generally may not be diversified. REITs are also subject to heavy cash flow dependency, defaults by borrowers and self-liquidation. In addition, REITs could possibly fail to qualify for pass-through of income under applicable tax laws. Various other factors may also adversely affect a borrower’s or a lessee’s ability to meet its obligations to the REIT. In the event of a default by a borrower or lessee, the REIT may experience delays in enforcing its rights as a mortgagee or lessor and may incur substantial costs associated with protecting its investments. Real Estate Market Risk. Property values may fall due to increasing vacancies or declining rents resulting from unanticipated economic, legal, cultural or technological developments. Real estate company prices also may drop because of the failure of borrowers to pay their loans and poor management, and residential developers, in particular, could be negatively impacted by falling home prices, slower mortgage origination and rising construction costs. Covered Call Options Risk. The Fund may write (sell) covered call options on securities the Fund holds in its portfolio. This strategy is designed to generate additional income from the Fund’s portfolio holdings, but also results in certain risks. With respect to portfolio holdings on which the Fund has written a covered call option, the Fund will forgo the opportunity to benefit from potential increases in the value of that security, but will continue to bear the risk of declines in the value of the security. Fixed-Income Securities Risk. Fixed-income securities generally present various types of risk, including interest rate risk, which is the risk that bond prices will decline because of rising interest rates, and credit risk, which is the chance that the issuer of a fixed-income security will fail to timely pay interest and principal or that a fixed-income security’s price declines because of negative perceptions of an issuer’s ability to pay interest and principal. Foreign (Non-U.S.) Securities Risk. Risks of investing in foreign securities, which can be expected to be greater for investments in emerging markets, include currency risks, future political and economic developments and possible imposition of foreign withholding taxes on income payable on the securities. In addition, there may be less publicly available information about a foreign issuer than about a domestic issuer, and foreign issuers may not be subject to the same accounting, auditing and financial recordkeeping standards and requirements as domestic issuers. Foreign Currency and Currency Hedging Risk. Although the Fund will report its net asset value (NAV) and pay dividends in U.S. dollars, foreign securities often are purchased with and make any dividend and interest payments in foreign currencies. Therefore, the Fund’s investments in foreign securities will be subject to foreign currency risk, which means that the Fund’s NAV could decline solely as a result of changes in the exchange rates between foreign currencies and the U.S. dollar. Certain foreign countries may impose restrictions on the ability of issuers of foreign securities to make payment of principal, dividends and interest to investors located outside the country, due to blockage of foreign currency exchanges or otherwise. The Fund may, but is not required to, engage in various investments that are designed to hedge the Fund’s foreign currency risks, including foreign currency forward contracts, foreign currency futures contracts, put and call options on foreign currencies, foreign currency swaps and other similar strategic transactions. Such transactions may reduce returns or increase volatility, perhaps substantially. Credit and Below Investment Grade Securities Risk. Credit risk is the risk that a security in the Fund’s portfolio will decline in price or the issuer will fail to make dividend, interest or principal payments when due because the issuer of the security experiences a decline in its financial status. Lower-rated securities, or equivalent unrated securities, which are commonly known as “high-yield bonds” or “junk bonds,” generally involve greater volatility of price and risk of loss of income and principal, and may be more susceptible to real or perceived adverse economic and competitive industry conditions than higher grade securities. It is reasonable to expect that any adverse economic conditions could disrupt the market for lower-rated securities, have an adverse impact on the value of those securities and adversely affect the ability of the issuers of those securities to repay principal and interest on those securities. Your investment in the Fund is not a deposit of any bank and is not insured or guaranteed by the Federal Deposit Insurance Corporation or any other government agency. |
||||||||||||||||||||||||||||||||||||||
FUND PERFORMANCE | ||||||||||||||||||||||||||||||||||||||
The following bar chart and table provide some indication of the risks of investing in the Fund. The bar chart shows changes in the Fund’s performance from year to year for the Class I shares. The table shows how the Fund’s average annual returns compare with the performance of selected broad market indexes over various time periods. Past performance (both before and after taxes) is not, however, an indication as to how the Fund may perform in the future. Updated performance is available at www.cohenandsteers.com or by calling (800) 330-7348. | ||||||||||||||||||||||||||||||||||||||
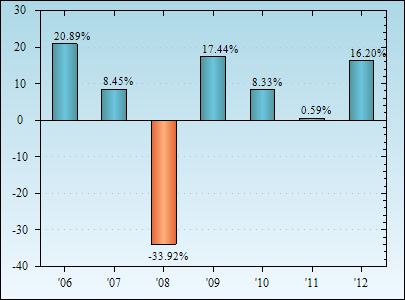
Class I Shares Annual Total Returns | ||||||||||||||||||||||||||||||||||||||
|
||||||||||||||||||||||||||||||||||||||
Highest quarterly return during this period: 14.57% (quarter ended June 30, 2009) Lowest quarterly return during this period: –21.29% (quarter ended December 31, 2008) |
||||||||||||||||||||||||||||||||||||||
Average Annual Total Returns (for the periods ended December 31, 2012) |
||||||||||||||||||||||||||||||||||||||
|
||||||||||||||||||||||||||||||||||||||
After-tax returns are calculated using the historical highest individual federal marginal income tax rates, and do not reflect the impact of state and local taxes. Actual after-tax returns depend on the investor’s tax situation and may differ from those shown, and the after-tax returns shown are not relevant to investors who hold their shares through tax-deferred arrangements such as 401(k) plans or individual retirement accounts. |
Label | Element | Value | ||||||||||
---|---|---|---|---|---|---|---|---|---|---|---|---|
Risk/Return: | rr_RiskReturnAbstract | |||||||||||
Registrant Name | dei_EntityRegistrantName | Cohen & Steers Dividend Value Fund, Inc. | ||||||||||
Prospectus Date | rr_ProspectusDate | Jul. 01, 2013 | ||||||||||
Class A & C | Cohen & Steers Dividend Value Fund, Inc.
|
||||||||||||
Risk/Return: | rr_RiskReturnAbstract | |||||||||||
Risk/Return [Heading] | rr_RiskReturnHeading | COHEN & STEERS DIVIDEND VALUE FUND, INC. | ||||||||||
Objective [Heading] | rr_ObjectiveHeading | INVESTMENT OBJECTIVES | ||||||||||
Objective, Primary [Text Block] | rr_ObjectivePrimaryTextBlock | The investment objectives of Cohen & Steers Dividend Value Fund, Inc. (the Fund) are to provide long-term growth of income and capital appreciation. | ||||||||||
Expense [Heading] | rr_ExpenseHeading | FUND FEES AND EXPENSES | ||||||||||
Expense Narrative [Text Block] | rr_ExpenseNarrativeTextBlock | This table describes the fees and expenses that you could pay if you buy and hold shares of the Fund. You may qualify for sales charge discounts on Class A shares if you and your family invest, or agree to invest in the future, at least $100,000 in Cohen & Steers funds. More information about these and other discounts is available from your financial intermediary and in “How to Purchase, Exchange and Sell Fund Shares—Purchasing the Class of Fund Shares that is Best for You” in the Fund’s prospectus (the Prospectus) and “Reducing the Initial Sales Load on Class A Shares” in the Fund’s Statement of Additional Information (the SAI). | ||||||||||
Shareholder Fees Caption [Text] | rr_ShareholderFeesCaption | Shareholder Fees (fees paid directly from your investment): | ||||||||||
Operating Expenses Caption [Text] | rr_OperatingExpensesCaption | Annual Fund Operating Expenses (expenses that you pay each year as a percentage of the value of your investment): | ||||||||||
Fee Waiver or Reimbursement over Assets, Date of Termination | rr_FeeWaiverOrReimbursementOverAssetsDateOfTermination | June 30, 2014 | ||||||||||
Portfolio Turnover [Heading] | rr_PortfolioTurnoverHeading | PORTFOLIO TURNOVER | ||||||||||
Portfolio Turnover [Text Block] | rr_PortfolioTurnoverTextBlock | The Fund pays transaction costs, such as commissions, when it buys and sells securities (or “turns over” its portfolio). A higher portfolio turnover rate may indicate higher transaction costs and may result in higher taxes when Fund shares are held in a taxable account. These costs, which are not reflected in annual fund operating expenses or in the example, affect the Fund’s performance. During the most recent fiscal year, the Fund’s portfolio turnover rate was 37% of the average value of its portfolio. | ||||||||||
Portfolio Turnover, Rate | rr_PortfolioTurnoverRate | 37.00% | ||||||||||
Expense Breakpoint Discounts [Text] | rr_ExpenseBreakpointDiscounts | You may qualify for sales charge discounts on Class A shares if you and your family invest, or agree to invest in the future, at least $100,000 in Cohen & Steers funds. | ||||||||||
Expense Breakpoint, Minimum Investment Required [Amount] | rr_ExpenseBreakpointMinimumInvestmentRequiredAmount | $ 100,000 | ||||||||||
Expense Example [Heading] | rr_ExpenseExampleHeading | EXAMPLE | ||||||||||
Expense Example Narrative [Text Block] | rr_ExpenseExampleNarrativeTextBlock | This example is intended to help you compare the cost of investing in the Fund with the cost of investing in other mutual funds. The example assumes that you invest $10,000 in the Fund for the time periods indicated and then either redeem or do not redeem your shares at the end of those periods. The example also assumes that your investment has a 5% return each year and that the Fund’s operating expenses remain the same, and that the Advisor did not waive its fee and/or reimburse expenses after June 30, 2014 (through June 30, 2014, expenses are based on the net amount pursuant to the fee waiver/reimbursement agreement). Although your actual costs may be higher or lower, based on these assumptions your costs would be: | ||||||||||
Strategy [Heading] | rr_StrategyHeading | PRINCIPAL INVESTMENT STRATEGIES | ||||||||||
Strategy Narrative [Text Block] | rr_StrategyNarrativeTextBlock | Under normal market conditions, the Fund invests at least 80% of its net assets in a portfolio of dividend-paying common stocks and preferred stocks that have the potential to offer long-term growth of income and capital appreciation. The Fund invests primarily in companies with large market capitalizations similar to those of companies included in the Russell 1000 Value Index, typically using a “value approach.” A value approach seeks to identify companies that appear to be undervalued by various measures and may be temporarily out of favor but have good prospects for capital appreciation and dividend growth. The Fund may invest up to 20% of its net assets in securities issued by real estate investment trusts (REITs). REITs are companies that own interests in real estate or in real estate related loans or other interests and their revenue primarily consists of rent derived from owned, income producing real estate properties and capital gains from the sale of such properties. A REIT in the U.S. is generally not taxed on income distributed to shareholders so long as it meets certain tax-related requirements, including the requirement that it distribute substantially all of its taxable income to such shareholders. The Fund may write (sell) covered call options on securities the Fund holds in its portfolio. The Fund may also invest up to 20% of its net assets in bonds and other fixed-income securities of any maturity. The Fund may invest up to 25% of its net assets in securities of foreign issuers (including emerging market issuers) which meet the same criteria for investment as domestic companies, including investments in such companies in the form of American Depositary Receipts (ADRs), Global Depositary Receipts (GDRs) and European Depositary Receipts (EDRs). The Fund may engage in foreign currency transactions, including foreign currency forward contracts, futures contracts, options, swaps and other similar strategic transactions in connection with its investments in securities of non-U.S. companies. The Fund may also invest up to 20% of its net assets in securities that at the time of investment are rated below investment grade by a nationally recognized statistical rating organization (NRSRO), or that are unrated but judged to be below investment grade by the Advisor. Such securities are commonly known as “high-yield” or “junk” securities. |
||||||||||
Strategy Portfolio Concentration [Text] | rr_StrategyPortfolioConcentration | The Fund may invest up to 20% of its net assets in securities issued by real estate investment trusts (REITs). | ||||||||||
Risk [Heading] | rr_RiskHeading | PRINCIPAL RISKS | ||||||||||
Risk Narrative [Text Block] | rr_RiskNarrativeTextBlock | Investment Risk. An investment in the Fund is subject to investment risk, including the possible loss of the entire principal amount that you invest. Market Risk. Your investment in Fund shares represents an indirect investment in the securities owned by the Fund. The value of these securities, like other investments, may move up or down, sometimes rapidly and unpredictably. Your Fund shares at any point in time may be worth less than what you invested, even after taking into account the reinvestment of Fund dividends and distributions. Common Stock Risk. While common stock has historically generated higher average returns than fixed income securities, common stock has also experienced significantly more volatility in those returns. An adverse event, such as an unfavorable earnings report, may depress the value of common stock held by the Fund. Also, the price of common stock is sensitive to general movements in the stock market. A drop in the stock market may depress the price of common stock held by the Fund. Preferred Securities Risk. There are various risks associated with investing in preferred securities, including credit risk, interest rate risk, deferral and omission of distributions, subordination to bonds and other debt securities in a company’s capital structure, call, reinvestment and income risk, limited liquidity, limited voting rights and special redemption rights. REIT Risk. REITs are dependent upon management skills and generally may not be diversified. REITs are also subject to heavy cash flow dependency, defaults by borrowers and self-liquidation. In addition, REITs could possibly fail to qualify for pass-through of income under applicable tax laws. Various other factors may also adversely affect a borrower’s or a lessee’s ability to meet its obligations to the REIT. In the event of a default by a borrower or lessee, the REIT may experience delays in enforcing its rights as a mortgagee or lessor and may incur substantial costs associated with protecting its investments. Real Estate Market Risk. Property values may fall due to increasing vacancies or declining rents resulting from unanticipated economic, legal, cultural or technological developments. Real estate company prices also may drop because of the failure of borrowers to pay their loans and poor management, and residential developers, in particular, could be negatively impacted by falling home prices, slower mortgage origination and rising construction costs. Covered Call Options Risk. The Fund may write (sell) covered call options on securities the Fund holds in its portfolio. This strategy is designed to generate additional income from the Fund’s portfolio holdings, but also results in certain risks. With respect to portfolio holdings on which the Fund has written a covered call option, the Fund will forgo the opportunity to benefit from potential increases in the value of that security, but will continue to bear the risk of declines in the value of the security. Fixed-Income Securities Risk. Fixed-income securities generally present various types of risk, including interest rate risk, which is the risk that bond prices will decline because of rising interest rates, and credit risk, which is the chance that the issuer of a fixed-income security will fail to timely pay interest and principal or that a fixed-income security’s price declines because of negative perceptions of an issuer’s ability to pay interest and principal. Foreign (Non-U.S.) Securities Risk. Risks of investing in foreign securities, which can be expected to be greater for investments in emerging markets, include currency risks, future political and economic developments and possible imposition of foreign withholding taxes on income payable on the securities. In addition, there may be less publicly available information about a foreign issuer than about a domestic issuer, and foreign issuers may not be subject to the same accounting, auditing and financial recordkeeping standards and requirements as domestic issuers. Foreign Currency and Currency Hedging Risk. Although the Fund will report its net asset value (NAV) and pay dividends in U.S. dollars, foreign securities often are purchased with and make any dividend and interest payments in foreign currencies. Therefore, the Fund’s investments in foreign securities will be subject to foreign currency risk, which means that the Fund’s NAV could decline solely as a result of changes in the exchange rates between foreign currencies and the U.S. dollar. Certain foreign countries may impose restrictions on the ability of issuers of foreign securities to make payment of principal, dividends and interest to investors located outside the country, due to blockage of foreign currency exchanges or otherwise. The Fund may, but is not required to, engage in various investments that are designed to hedge the Fund’s foreign currency risks, including foreign currency forward contracts, foreign currency futures contracts, put and call options on foreign currencies, foreign currency swaps and other similar strategic transactions. Such transactions may reduce returns or increase volatility, perhaps substantially. Credit and Below Investment Grade Securities Risk. Credit risk is the risk that a security in the Fund’s portfolio will decline in price or the issuer will fail to make dividend, interest or principal payments when due because the issuer of the security experiences a decline in its financial status. Lower-rated securities, or equivalent unrated securities, which are commonly known as “high-yield bonds” or “junk bonds,” generally involve greater volatility of price and risk of loss of income and principal, and may be more susceptible to real or perceived adverse economic and competitive industry conditions than higher grade securities. It is reasonable to expect that any adverse economic conditions could disrupt the market for lower-rated securities, have an adverse impact on the value of those securities and adversely affect the ability of the issuers of those securities to repay principal and interest on those securities. Your investment in the Fund is not a deposit of any bank and is not insured or guaranteed by the Federal Deposit Insurance Corporation or any other government agency. |
||||||||||
Risk Lose Money [Text] | rr_RiskLoseMoney | An investment in the Fund is subject to investment risk, including the possible loss of the entire principal amount that you invest. | ||||||||||
Risk Not Insured Depository Institution [Text] | rr_RiskNotInsuredDepositoryInstitution | Your investment in the Fund is not a deposit of any bank and is not insured or guaranteed by the Federal Deposit Insurance Corporation or any other government agency. | ||||||||||
Bar Chart and Performance Table [Heading] | rr_BarChartAndPerformanceTableHeading | FUND PERFORMANCE | ||||||||||
Performance Narrative [Text Block] | rr_PerformanceNarrativeTextBlock | The following bar chart and table provide some indication of the risks of investing in the Fund. The bar chart shows changes in the Fund’s performance from year to year for the Class A shares. The table shows how the Fund’s average annual returns compare with the performance of selected broad market indexes over various time periods. Past performance (both before and after taxes) is not, however, an indication as to how the Fund may perform in the future. Updated performance is available at www.cohenandsteers.com or by calling (800) 330-7348. The bar chart does not reflect the deduction of sales charges imposed on Class A shares; if these amounts were reflected, returns would be less than those shown. |
||||||||||
Performance Information Illustrates Variability of Returns [Text] | rr_PerformanceInformationIllustratesVariabilityOfReturns | The bar chart shows changes in the Fund’s performance from year to year for the Class A shares. The table shows how the Fund’s average annual returns compare with the performance of selected broad market indexes over various time periods. | ||||||||||
Performance Availability Phone [Text] | rr_PerformanceAvailabilityPhone | (800) 330-7348 | ||||||||||
Performance Availability Website Address [Text] | rr_PerformanceAvailabilityWebSiteAddress | www.cohenandsteers.com | ||||||||||
Performance Past Does Not Indicate Future [Text] | rr_PerformancePastDoesNotIndicateFuture | Past performance (both before and after taxes) is not, however, an indication as to how the Fund may perform in the future. | ||||||||||
Bar Chart [Heading] | rr_BarChartHeading | Class A Shares Annual Total Returns |
||||||||||
Bar Chart Does Not Reflect Sales Loads [Text] | rr_BarChartDoesNotReflectSalesLoads | The bar chart does not reflect the deduction of sales charges imposed on Class A shares; if these amounts were reflected, returns would be less than those shown. | ||||||||||
Bar Chart Closing [Text Block] | rr_BarChartClosingTextBlock | Highest quarterly return during this period: 14.49% (quarter ended June 30, 2009) Lowest quarterly return during this period: –21.36% (quarter ended December 31, 2008) |
||||||||||
Performance Table Heading | rr_PerformanceTableHeading | Average Annual Total Returns (for the periods ended December 31, 2012) |
||||||||||
Performance Table Uses Highest Federal Rate | rr_PerformanceTableUsesHighestFederalRate | After-tax returns are calculated using the historical highest individual federal marginal income tax rates, and do not reflect the impact of state and local taxes. | ||||||||||
Performance Table Not Relevant to Tax Deferred | rr_PerformanceTableNotRelevantToTaxDeferred | Actual after-tax returns depend on the investor’s tax situation and may differ from those shown, and the after-tax returns shown are not relevant to investors who hold their shares through tax-deferred arrangements such as 401(k) plans or individual retirement accounts. | ||||||||||
Performance Table One Class of after Tax Shown [Text] | rr_PerformanceTableOneClassOfAfterTaxShown | After-tax returns are shown for Class A shares only. After-tax returns for Class C shares will vary. | ||||||||||
Performance Table Narrative | rr_PerformanceTableNarrativeTextBlock | After-tax returns are shown for Class A shares only. After-tax returns for Class C shares will vary. After-tax returns are calculated using the historical highest individual federal marginal income tax rates, and do not reflect the impact of state and local taxes. Actual after-tax returns depend on the investor’s tax situation and may differ from those shown, and the after-tax returns shown are not relevant to investors who hold their shares through tax-deferred arrangements such as 401(k) plans or individual retirement accounts. | ||||||||||
Class A & C | Cohen & Steers Dividend Value Fund, Inc. | Class A
|
||||||||||||
Risk/Return: | rr_RiskReturnAbstract | |||||||||||
Maximum sales charge (load) imposed on purchases (as a percentage of offering price) | rr_MaximumSalesChargeImposedOnPurchasesOverOfferingPrice | 4.50% | ||||||||||
Maximum deferred sales charge (load) (as a percentage of the lesser of original purchase price or redemption proceeds) | rr_MaximumDeferredSalesChargeOverOther | none | ||||||||||
Management Fee | rr_ManagementFeesOverAssets | 0.80% | ||||||||||
Distribution (12b-1) Fees | rr_DistributionAndService12b1FeesOverAssets | 0.25% | ||||||||||
Service Fee | rr_DistributionOrSimilarNon12b1FeesOverAssets | 0.10% | ||||||||||
Other Expenses | rr_OtherExpensesOverAssets | 0.23% | ||||||||||
Total Annual Fund Operating Expenses | rr_ExpensesOverAssets | 1.38% | ||||||||||
Fee Waiver/Expense Reimbursement | rr_FeeWaiverOrReimbursementOverAssets | (0.38%) | [1] | |||||||||
Total Annual Fund Operating Expenses (after fee waiver/expense reimbursement) | rr_NetExpensesOverAssets | 1.00% | [1] | |||||||||
1 Year | rr_ExpenseExampleYear01 | 547 | ||||||||||
3 Years | rr_ExpenseExampleYear03 | 832 | ||||||||||
5 Years | rr_ExpenseExampleYear05 | 1,137 | ||||||||||
10 Years | rr_ExpenseExampleYear10 | 2,001 | ||||||||||
2006 | rr_AnnualReturn2006 | 20.45% | [2],[3] | |||||||||
2007 | rr_AnnualReturn2007 | 8.03% | [2],[3] | |||||||||
2008 | rr_AnnualReturn2008 | (34.12%) | [2],[3] | |||||||||
2009 | rr_AnnualReturn2009 | 17.04% | [2],[3] | |||||||||
2010 | rr_AnnualReturn2010 | 7.93% | [2],[3] | |||||||||
2011 | rr_AnnualReturn2011 | 0.21% | [2],[3] | |||||||||
2012 | rr_AnnualReturn2012 | 15.73% | [2],[3] | |||||||||
Year to Date Return, Label | rr_YearToDateReturnLabel | year-to-date return | ||||||||||
Bar Chart, Year to Date Return, Date | rr_BarChartYearToDateReturnDate | Mar. 31, 2013 | ||||||||||
Bar Chart, Year to Date Return | rr_BarChartYearToDateReturn | 9.63% | ||||||||||
Highest Quarterly Return, Label | rr_HighestQuarterlyReturnLabel | Highest quarterly return | ||||||||||
Highest Quarterly Return, Date | rr_BarChartHighestQuarterlyReturnDate | Jun. 30, 2009 | ||||||||||
Highest Quarterly Return | rr_BarChartHighestQuarterlyReturn | 14.49% | ||||||||||
Lowest Quarterly Return, Label | rr_LowestQuarterlyReturnLabel | Lowest quarterly return | ||||||||||
Lowest Quarterly Return, Date | rr_BarChartLowestQuarterlyReturnDate | Dec. 31, 2008 | ||||||||||
Lowest Quarterly Return | rr_BarChartLowestQuarterlyReturn | (21.36%) | ||||||||||
1 Year | rr_AverageAnnualReturnYear01 | 10.52% | ||||||||||
5 Years | rr_AverageAnnualReturnYear05 | (1.62%) | ||||||||||
Since Inception | rr_AverageAnnualReturnSinceInception | 3.04% | ||||||||||
Inception Date | rr_AverageAnnualReturnInceptionDate | Aug. 31, 2005 | ||||||||||
Class A & C | Cohen & Steers Dividend Value Fund, Inc. | Class C
|
||||||||||||
Risk/Return: | rr_RiskReturnAbstract | |||||||||||
Maximum sales charge (load) imposed on purchases (as a percentage of offering price) | rr_MaximumSalesChargeImposedOnPurchasesOverOfferingPrice | none | ||||||||||
Maximum deferred sales charge (load) (as a percentage of the lesser of original purchase price or redemption proceeds) | rr_MaximumDeferredSalesChargeOverOther | 1.00% | [4] | |||||||||
Management Fee | rr_ManagementFeesOverAssets | 0.80% | ||||||||||
Distribution (12b-1) Fees | rr_DistributionAndService12b1FeesOverAssets | 0.75% | ||||||||||
Service Fee | rr_DistributionOrSimilarNon12b1FeesOverAssets | 0.25% | ||||||||||
Other Expenses | rr_OtherExpensesOverAssets | 0.23% | ||||||||||
Total Annual Fund Operating Expenses | rr_ExpensesOverAssets | 2.03% | ||||||||||
Fee Waiver/Expense Reimbursement | rr_FeeWaiverOrReimbursementOverAssets | (0.38%) | [1] | |||||||||
Total Annual Fund Operating Expenses (after fee waiver/expense reimbursement) | rr_NetExpensesOverAssets | 1.65% | [1] | |||||||||
Expenses Deferred Charges [Text Block] | rr_ExpensesDeferredChargesTextBlock | For Class C shares, the maximum deferred sales charge does not apply after one year. | ||||||||||
1 Year | rr_ExpenseExampleYear01 | 268 | ||||||||||
3 Years | rr_ExpenseExampleYear03 | 600 | ||||||||||
5 Years | rr_ExpenseExampleYear05 | 1,058 | ||||||||||
10 Years | rr_ExpenseExampleYear10 | 2,328 | ||||||||||
1 Year | rr_ExpenseExampleNoRedemptionYear01 | 168 | ||||||||||
3 Years | rr_ExpenseExampleNoRedemptionYear03 | 600 | ||||||||||
5 Years | rr_ExpenseExampleNoRedemptionYear05 | 1,058 | ||||||||||
10 Years | rr_ExpenseExampleNoRedemptionYear10 | $ 2,328 | ||||||||||
1 Year | rr_AverageAnnualReturnYear01 | 14.05% | ||||||||||
5 Years | rr_AverageAnnualReturnYear05 | (1.35%) | ||||||||||
Since Inception | rr_AverageAnnualReturnSinceInception | 3.03% | ||||||||||
Inception Date | rr_AverageAnnualReturnInceptionDate | Aug. 31, 2005 | ||||||||||
Class A & C | Cohen & Steers Dividend Value Fund, Inc. | Return After Taxes on Distributions | Class A
|
||||||||||||
Risk/Return: | rr_RiskReturnAbstract | |||||||||||
1 Year | rr_AverageAnnualReturnYear01 | 10.32% | ||||||||||
5 Years | rr_AverageAnnualReturnYear05 | (1.83%) | ||||||||||
Since Inception | rr_AverageAnnualReturnSinceInception | 2.70% | ||||||||||
Inception Date | rr_AverageAnnualReturnInceptionDate | Aug. 31, 2005 | ||||||||||
Class A & C | Cohen & Steers Dividend Value Fund, Inc. | Return After Taxes on Distributions and Sale of Fund Shares | Class A
|
||||||||||||
Risk/Return: | rr_RiskReturnAbstract | |||||||||||
1 Year | rr_AverageAnnualReturnYear01 | 7.10% | ||||||||||
5 Years | rr_AverageAnnualReturnYear05 | (1.40%) | ||||||||||
Since Inception | rr_AverageAnnualReturnSinceInception | 2.53% | ||||||||||
Inception Date | rr_AverageAnnualReturnInceptionDate | Aug. 31, 2005 | ||||||||||
Class A & C | Cohen & Steers Dividend Value Fund, Inc. | Russell 1000 Value Index (reflects no deduction for fees, expenses or taxes)
|
||||||||||||
Risk/Return: | rr_RiskReturnAbstract | |||||||||||
1 Year | rr_AverageAnnualReturnYear01 | 17.51% | ||||||||||
5 Years | rr_AverageAnnualReturnYear05 | 0.59% | ||||||||||
Since Inception | rr_AverageAnnualReturnSinceInception | 3.54% | ||||||||||
Class A & C | Cohen & Steers Dividend Value Fund, Inc. | S&P 500® Index (reflects no deduction for fees, expenses or taxes)
|
||||||||||||
Risk/Return: | rr_RiskReturnAbstract | |||||||||||
1 Year | rr_AverageAnnualReturnYear01 | 16.00% | [5] | |||||||||
5 Years | rr_AverageAnnualReturnYear05 | 1.66% | [5] | |||||||||
Since Inception | rr_AverageAnnualReturnSinceInception | 4.34% | [5] | |||||||||
|