| Label |
Element |
Value |
| Risk Return [Abstract] |
rr_RiskReturnAbstract |
|
|
| ProspectusDate |
rr_ProspectusDate |
Oct. 26,
2012 |
|
|
Munder Bond Fund (Prospectus Summary) | Munder Bond Fund
|
|
|
|
| Risk Return [Abstract] |
rr_RiskReturnAbstract |
|
|
| Risk/Return [Heading] |
rr_RiskReturnHeading |
Munder Bond Fund |
|
| Objective [Heading] |
rr_ObjectiveHeading |
INVESTMENT OBJECTIVE |
|
| Objective, Primary [Text Block] |
rr_ObjectivePrimaryTextBlock |
The Fund's primary investment objective is to provide a high level of current
income. |
|
| Objective, Secondary [Text Block] |
rr_ObjectiveSecondaryTextBlock |
Its secondary objective is capital appreciation. |
|
| Expense [Heading] |
rr_ExpenseHeading |
FEES & EXPENSES OF THE FUND |
|
| Expense Narrative [Text Block] |
rr_ExpenseNarrativeTextBlock |
The table below describes the fees and expenses that you may pay if you buy and
hold shares of the Fund. You may qualify for sales charge discounts if you and
your family invest, or agree to invest in the future, at least $25,000 in the
Munder Funds. More information about these and other discounts is available
from your financial professional and in the section entitled "Applicable Sales
Charges" on page 10 of the Fund's Prospectus and the section entitled "Additional
Purchase, Redemption, Exchange and Conversion Information" on page 58 of the
Statement of Additional Information. |
|
| Shareholder Fees Caption [Text] |
rr_ShareholderFeesCaption |
SHAREHOLDER FEES (fees paid directly from your investment) |
|
| Operating Expenses Caption [Text] |
rr_OperatingExpensesCaption |
ANNUAL FUND OPERATING EXPENSES (expenses that you pay each year as a percentage of the value of your investment) |
|
| Portfolio Turnover [Heading] |
rr_PortfolioTurnoverHeading |
PORTFOLIO TURNOVER |
|
| Portfolio Turnover [Text Block] |
rr_PortfolioTurnoverTextBlock |
The Fund pays transaction costs, such as commissions, when it buys and sells
securities (or "turns over" its portfolio). A higher portfolio turnover rate
may indicate higher transaction costs and may result in higher taxes when Fund
shares are held in a taxable account. These costs, which are not reflected in
annual fund operating expenses or in the example, affect the Fund's performance.
During the most recent fiscal year, the Fund's portfolio turnover rate was 362%
of the average value of its portfolio. |
|
| Portfolio Turnover, Rate |
rr_PortfolioTurnoverRate |
362.00% |
|
| Expense Breakpoint Discounts [Text] |
rr_ExpenseBreakpointDiscounts |
You may qualify for sales charge discounts if you and your family invest,
or agree to invest in the future, at least $25,000 in the Munder Funds. |
|
| Expense Breakpoint, Minimum Investment Required [Amount] |
rr_ExpenseBreakpointMinimumInvestmentRequiredAmount |
25,000 |
|
| Expense Example [Heading] |
rr_ExpenseExampleHeading |
EXPENSE EXAMPLE |
|
| Expense Example Narrative [Text Block] |
rr_ExpenseExampleNarrativeTextBlock |
The example is intended to help you compare the cost of investing in the Fund to
the cost of investing in other mutual funds. The example assumes that you invest
$10,000 in the Fund for the time periods indicated and then redeem all of your
shares at the end of those periods. The example also assumes that your investment
has a 5% return each year and that the Fund's operating expenses remain the same.
Although your actual costs may be higher or lower, based on these assumptions
your costs would be: |
|
| Expense Example, No Redemption, By Year, Caption [Text] |
rr_ExpenseExampleNoRedemptionByYearCaption |
You would pay the following expenses if you did not redeem your shares: |
|
| Expense Example Closing [Text Block] |
rr_ExpenseExampleClosingTextBlock |
The example does not reflect sales charges (loads) on reinvested dividends and
other distributions because sales charges (loads) are not imposed by the Fund on
reinvested dividends and other distributions. |
|
| Strategy [Heading] |
rr_StrategyHeading |
PRINCIPAL INVESTMENT STRATEGIES |
|
| Strategy Narrative [Text Block] |
rr_StrategyNarrativeTextBlock |
The advisor pursues the Fund's investment objectives by investing, under normal
circumstances, at least 80% of the Fund's assets in a broad range of bonds. This
investment strategy may not be changed without 60 days' prior notice to shareholders.
For purposes of this investment strategy, assets of the Fund means net assets plus
the amount of any borrowings for investment purposes.
The advisor selects securities based on an analysis of current versus historical
interest rate relationships and the relative value of the bond market sectors.
Bonds, also known as fixed income securities, in which the Fund may invest
include without limitation: U.S. government securities, including securities
issued by agencies or instrumentalities of the U.S. government; long- and
short-term corporate debt obligations; mortgage-backed securities, including
collateralized mortgage obligations ("CMOs") and commercial mortgage-backed
securities ("CMBS"); asset-backed securities, including collateralized debt
obligations ("CDOs"); and U.S. dollar-denominated obligations of foreign
governments, corporations and banks (i.e., yankee bonds).
The bonds in which the Fund will invest will generally be rated investment grade
or better, or if unrated, of comparable quality. However, the Fund may invest up
to 20% of its total assets in debt securities that are rated below investment
grade or in comparable unrated securities.
The Fund may purchase or sell securities on a when-issued, to-be-announced
(TBA), delayed delivery or forward commitment basis and may engage in short-term
trading of portfolio securities. The Fund may also utilize dollar roll
transactions, which are series of purchase and sale transactions, to obtain
market exposure to certain types of securities, particularly mortgage-backed
securities. The advisor may enter into futures and/or credit default swap
contracts and the advisor may use exchange-traded funds (ETFs) to manage cash.
Although the Fund will primarily be invested in domestic securities, up to 25%
of the Fund's assets may be invested in foreign securities. |
|
| Risk [Heading] |
rr_RiskHeading |
PRINCIPAL INVESTMENT RISKS |
|
| Risk Narrative [Text Block] |
rr_RiskNarrativeTextBlock |
You may lose money if you invest in the Fund. An investment in the Fund is not
a bank deposit and is not insured or guaranteed by the Federal Deposit Insurance
Corporation or any other government agency. The principal risks associated with
investment in the Fund are as follows:
Credit (or Default) Risk
The Fund may lose money if an issuer of a fixed income security is unable or
unwilling to make timely principal and/or interest payments or to otherwise
honor its payment obligations. Further, when an issuer suffers adverse changes
in its financial condition or credit rating, the price of its debt obligations
may decline and/or experience greater volatility. A change in financial
condition or credit rating of a fixed income security can also affect its
liquidity and make it more difficult for the Fund to sell.
Interest Rate Risk
The value of a bond may decline due to an increase in the absolute level of
interest rates, or changes in the spread between two rates, the shape of the
yield curve or any other interest rate relationship. Longer-term bonds are
generally more sensitive to interest rate changes than shorter-term bonds.
Generally, the longer the average maturity of the bonds held by the Fund, the
more the Fund's share price will fluctuate in response to interest rate changes.
Prepayment Risk
A substantial portion of the Fund may be invested in asset-backed and
mortgage-backed securities. Accordingly, the Fund may be subject to higher
prepayment risk than a Fund with a higher concentration in other types of fixed
income securities. The Fund may experience losses when an issuer exercises its
right to pay principal on an obligation held by the Fund earlier than expected.
This may happen during a period of declining interest rates. Under these
circumstances, the Fund may be unable to recoup all of its initial investment
and will suffer from having to reinvest in lower yielding securities. The loss
of higher yielding securities and the reinvestment at lower interest rates can
reduce the Fund's income, total return and share price. Rates of prepayment,
faster or slower than expected, could reduce the Fund's yield, increase the
volatility of the Fund and/or cause a decline in net asset value.
When-Issued Securities, To-Be-Announced, Delayed Delivery and Forward Commitment
Risk
A purchase of "when-issued" securities refers to a transaction made
conditionally because the securities, although authorized, have not yet been
issued. In a to-be-announced (TBA) transaction, a seller agrees to deliver a
security at a future date; however, the seller does not specify the particular
securities to be delivered. Instead, the purchaser agrees to accept any security
that meets specified terms. A delayed delivery or forward commitment transaction
involves a contract to purchase or sell securities for a fixed price at a future
date beyond the customary settlement period. Purchasing or selling securities on
a when-issued, TBA, delayed delivery or forward commitment basis involves the
risk that the value of the securities may change by the time they are actually
issued or delivered. Purchasing securities in a TBA transaction also involves
the risk that the security that the Fund is required to buy in the transaction
may be worth less than an identical security. Each of these transactions also
involves the risk that the counterparty may fail to deliver the security or cash
on the settlement date. In some cases, the Fund may sell a security on a delayed
delivery basis that it does not own, which may subject the Fund to additional
risks generally associated with short sales. Among other things, the market
price of the security may increase after the Fund enters into the delayed
delivery transaction, and the Fund will suffer a loss when it purchases the
security at a higher price in order to make delivery. In addition, the Fund
may not always be able to purchase the security it is obligated to deliver at
a particular time or at an acceptable price.
Dollar Roll Transaction Risk
A dollar roll involves potential risks of loss that are different from those
related to securities underlying the transactions. The Fund may be required to
purchase securities at a higher price than may otherwise be available on the
open market. Since the counterparty in the transaction is required to deliver
a similar, but not identical, security to the Fund, the security that the Fund
is required to buy under the dollar roll may be worth less than an identical
security. There is no assurance that the Fund's use of cash that it receives
from a dollar roll will provide a return that exceeds borrowing costs.
Below Investment Grade Securities Risk
Below investment grade fixed income securities, also known as "junk bonds," may
be subject to greater risks than other fixed income securities, including
greater levels of interest rate risk, credit risk (including a greater risk of
default) and liquidity risk. The ability of the issuer to make principal and
interest payments is predominantly speculative for below investment grade fixed
income securities.
Short-Term Trading Risk
The Fund may buy and sell the same security within a short period of time. The
frequency of trading within the Fund impacts portfolio turnover rates. A high
rate of portfolio turnover (100% or more) could produce higher trading costs
and taxable distributions, which would detract from the Fund's performance.
Foreign Securities Risk
Foreign securities tend to be more volatile and less liquid than U.S. securities.
Further, foreign securities may be subject to additional risks not associated
with investment in U.S. securities due to differences in the economic and
political environment, the amount of available public information, the degree
of market regulation, and financial reporting, accounting and auditing standards,
and, in the case of foreign currency-denominated securities, fluctuations in
currency exchange rates. In addition, during periods of social, political or
economic instability in a country or region, the value of a foreign security
could be affected by, among other things, increasing price volatility,
illiquidity or the closure of the primary market on which the security is
traded. In addition to foreign securities, the Fund may be exposed to foreign
markets as a result of the Fund's investments in U.S. companies that have
international exposure.
Derivatives Risk
Derivatives, such as futures or credit default swap contracts, are subject to
the risk that small price movements can result in substantial gains or losses.
Derivatives also entail exposure to the credit risk of the derivative's
counterparty, the risk of mispricing or improper valuation, and the risk that
changes in value of the derivative may not correlate perfectly with the relevant
securities, assets, rates or indices. The Fund "covers" its exposure to certain
derivative contracts by segregating or designating liquid assets on its records
sufficient to satisfy current payment obligations, which may expose the Fund to
the market through both the underlying assets subject to the contract and the
assets used as cover. The use of derivatives may cause the Fund to incur losses
greater than those that would have occurred had derivatives not been used. There
can be no assurance that the Fund will use derivatives to hedge any particular
position or risk, nor can there be any assurance that a derivative hedge, if
employed, will be successful.
ETF Risk
ETFs are investment companies that are bought and sold on a securities exchange.
The risks of owning an ETF are generally comparable to the risks of owning the
underlying securities held by the ETF. However, when the Fund invests in an ETF,
it will bear additional expenses based on its pro rata share of the ETF's
operating expenses. In addition, because of these expenses, compared to owning
the underlying securities directly, it may be more costly to own an ETF. Lack of
liquidity in an ETF could result in an ETF being more volatile than the
underlying portfolio of securities. |
|
| Risk Lose Money [Text] |
rr_RiskLoseMoney |
You may lose money if you invest in the Fund. |
|
| Risk Not Insured Depository Institution [Text] |
rr_RiskNotInsuredDepositoryInstitution |
An investment in the Fund is not a bank deposit and is not insured or
guaranteed by the Federal Deposit Insurance Corporation or any other
government agency. |
|
| Bar Chart and Performance Table [Heading] |
rr_BarChartAndPerformanceTableHeading |
PERFORMANCE |
|
| Performance Narrative [Text Block] |
rr_PerformanceNarrativeTextBlock |
The bar chart and table below provide some indication of the risk of an
investment in the Fund by showing the changes in the Fund's performance from
year to year over the past ten years and by showing the Fund's average annual
total returns for different calendar periods over the life of the Fund compared
to those of a broad-based securities market index. When you consider this
information, please remember the Fund's performance in past years (before and
after taxes) is not necessarily an indication of how the Fund will perform in
the future. You can obtain updated performance information on our website,
www.munder.com, or by calling (800) 468-6337.
The annual returns in the bar chart are for the Fund's least expensive class
of shares, Class Y shares. Due to differing sales charges and expenses, the
performance of classes not shown in the bar chart will be lower. |
|
| Performance Information Illustrates Variability of Returns [Text] |
rr_PerformanceInformationIllustratesVariabilityOfReturns |
The bar chart and table below provide some indication of the risk of an
investment in the Fund by showing the changes in the Fund's performance
from year to year over the past ten years and by showing the Fund's average
annual total returns for different calendar periods over the life of the Fund
compared to those of a broad-based securities market index. |
|
| Performance Availability Phone [Text] |
rr_PerformanceAvailabilityPhone |
(800) 468-6337 |
|
| Performance Availability Website Address [Text] |
rr_PerformanceAvailabilityWebSiteAddress |
www.munder.com |
|
| Performance Past Does Not Indicate Future [Text] |
rr_PerformancePastDoesNotIndicateFuture |
When you consider this information, please remember the Fund's performance
in past years (before and after taxes) is not necessarily an indication of
how the Fund will perform in the future. |
|
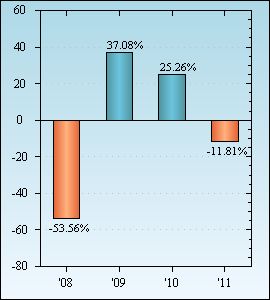
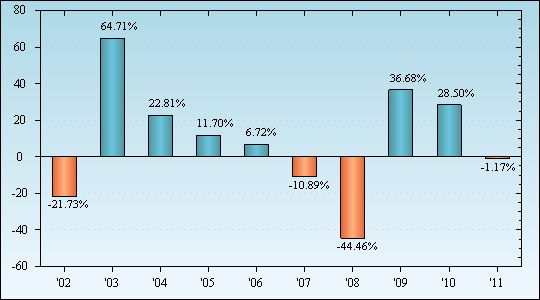
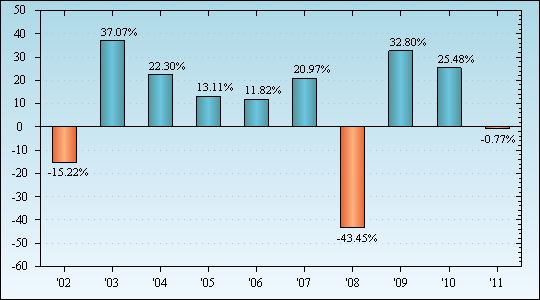
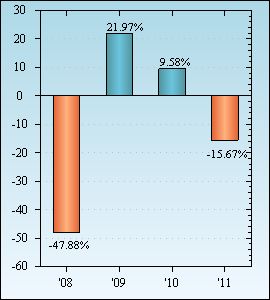
| Bar Chart [Heading] |
rr_BarChartHeading |
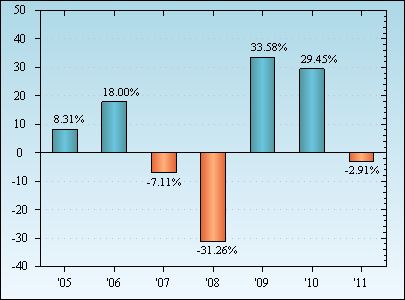
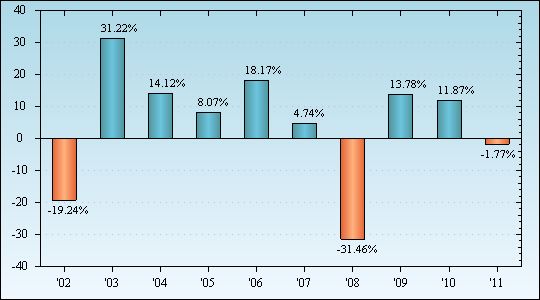
TOTAL RETURN (%) per calendar year |
|
| Bar Chart Does Not Reflect Sales Loads [Text] |
rr_BarChartDoesNotReflectSalesLoads |
Due to differing sales charges and expenses, the performance of classes not shown in the bar chart will be lower. |
|
| Bar Chart Closing [Text Block] |
rr_BarChartClosingTextBlock |
YTD through 9/30/12: 6.77%
Best Quarter: 6.22% (quarter ended 9/30/09)
Worst Quarter: -3.05% (quarter ended 6/30/04) |
|
| Index No Deduction for Fees, Expenses, Taxes [Text] |
rr_IndexNoDeductionForFeesExpensesTaxes |
reflects no deductions for fees, expenses or taxes |
|
| Performance Table Uses Highest Federal Rate |
rr_PerformanceTableUsesHighestFederalRate |
After-tax returns are calculated using the historical highest individual
federal marginal income tax rates and do not reflect the impact of state
and local taxes. |
|
| Performance Table Not Relevant to Tax Deferred |
rr_PerformanceTableNotRelevantToTaxDeferred |
After-tax returns shown are not relevant to investors who hold their
Fund shares through tax-deferred arrangements such as 401(k) plans or
individual retirement accounts. |
|
| Performance Table One Class of after Tax Shown [Text] |
rr_PerformanceTableOneClassOfAfterTaxShown |
After tax-returns are shown only for the Class Y shares. The after-tax
returns of the Class A, B, C and K shares will vary from those shown for
the Class Y shares because, as noted above, each class of shares has
different sales charges, distribution fees and/or service fees, and expenses. |
|
| Performance Table Closing [Text Block] |
rr_PerformanceTableClosingTextBlock |
The index returns from inception for Class Y, A, B, C and K shares are as of
12/1/91, 12/1/92, 3/1/96, 4/1/96 and 12/1/92, respectively. After-tax returns
are calculated using the historical highest individual federal marginal income
tax rates and do not reflect the impact of state and local taxes. Actual
after-tax returns depend on an investor's tax situation and may differ from
those shown. After-tax returns shown are not relevant to investors who hold
their Fund shares through tax-deferred arrangements such as 401(k) plans or
individual retirement accounts. After tax-returns are shown only for the Class Y
shares. The after-tax returns of the Class A, B, C and K shares will vary from
those shown for the Class Y shares because, as noted above, each class of shares
has different sales charges, distribution fees and/or service fees, and
expenses. |
|
| Caption |
rr_AverageAnnualReturnCaption |
AVERAGE ANNUAL TOTAL RETURNS for periods ended December 31, 2011 (including maximum sales charges) |
|
|
Munder Bond Fund (Prospectus Summary) | Munder Bond Fund | Barclays U.S. Aggregate Bond Index
|
|
|
|
| Risk Return [Abstract] |
rr_RiskReturnAbstract |
|
|
| Label |
rr_AverageAnnualReturnLabel |
Barclays U.S. Aggregate Bond Index (reflects no deductions for fees, expenses or taxes) |
|
| 1 Year |
rr_AverageAnnualReturnYear01 |
7.84% |
|
| 5 Years |
rr_AverageAnnualReturnYear05 |
6.50% |
|
| 10 Years |
rr_AverageAnnualReturnYear10 |
5.78% |
|
| Since Inception |
rr_AverageAnnualReturnSinceInception |
6.63% |
|
| Average Annual Returns, Since Inception Secondary |
ck0001214511_AverageAnnualReturnSinceInceptionSecondary |
6.51% |
|
| Average Annual Returns, Since Inception Tertiary |
ck0001214511_AverageAnnualReturnSinceInceptionTertiary |
6.29% |
|
| Average Annual Returns, Since Inception Quaternary |
ck0001214511_AverageAnnualReturnSinceInceptionQuaternary |
6.38% |
|
|
Munder Bond Fund (Prospectus Summary) | Munder Bond Fund | Class A Shares
|
|
|
|
| Risk Return [Abstract] |
rr_RiskReturnAbstract |
|
|
| Maximum Sales Charge (Load) Imposed on Purchases (as a percentage of offering price) |
rr_MaximumSalesChargeImposedOnPurchasesOverOfferingPrice |
4.00% |
[1] |
| Maximum Deferred Sales Charge (Load) (as a percentage of the lesser of original purchase price or redemption proceeds) |
rr_MaximumDeferredSalesChargeOverOfferingPrice |
none
|
[2] |
| Management Fees |
rr_ManagementFeesOverAssets |
0.40% |
|
| Distribution and/or Service (12b-1) Fees |
rr_DistributionAndService12b1FeesOverAssets |
0.25% |
|
| Other Expenses |
rr_OtherExpensesOverAssets |
0.54% |
|
| Acquired Fund Fees and Expenses |
rr_AcquiredFundFeesAndExpensesOverAssets |
0.02% |
|
| Total Annual Fund Operating Expenses Before Fee Waivers and/or Expense Reimbursements |
rr_ExpensesOverAssets |
1.21% |
[3] |
| Fee Waivers and/or Expense Reimbursements |
rr_FeeWaiverOrReimbursementOverAssets |
(0.34%) |
[4] |
| Total Net Annual Fund Operating Expenses After Fee Waivers and/or Expense Reimbursements |
rr_NetExpensesOverAssets |
0.87% |
[3],[4] |
| Fee Waiver or Reimbursement over Assets, Date of Termination |
rr_FeeWaiverOrReimbursementOverAssetsDateOfTermination |
2013-1-31 |
|
| Expense Example, with Redemption, 1 Year |
rr_ExpenseExampleYear01 |
485 |
|
| Expense Example, with Redemption, 3 Years |
rr_ExpenseExampleYear03 |
736 |
|
| Expense Example, with Redemption, 5 Years |
rr_ExpenseExampleYear05 |
1,007 |
|
| Expense Example, with Redemption, 10 Years |
rr_ExpenseExampleYear10 |
1,778 |
|
| Expense Example, No Redemption, 1 Year |
rr_ExpenseExampleNoRedemptionYear01 |
485 |
|
| Expense Example, No Redemption, 3 Years |
rr_ExpenseExampleNoRedemptionYear03 |
736 |
|
| Expense Example, No Redemption, 5 Years |
rr_ExpenseExampleNoRedemptionYear05 |
1,007 |
|
| Expense Example, No Redemption, 10 Years |
rr_ExpenseExampleNoRedemptionYear10 |
1,778 |
|
| Label |
rr_AverageAnnualReturnLabel |
CLASS A Return Before Taxes |
|
| 1 Year |
rr_AverageAnnualReturnYear01 |
2.11% |
|
| 5 Years |
rr_AverageAnnualReturnYear05 |
4.55% |
|
| 10 Years |
rr_AverageAnnualReturnYear10 |
4.47% |
|
| Since Inception |
rr_AverageAnnualReturnSinceInception |
5.27% |
|
| Inception Date |
rr_AverageAnnualReturnInceptionDate |
Dec.
09,
1992 |
|
|
Munder Bond Fund (Prospectus Summary) | Munder Bond Fund | Class B Shares
|
|
|
|
| Risk Return [Abstract] |
rr_RiskReturnAbstract |
|
|
| Maximum Sales Charge (Load) Imposed on Purchases (as a percentage of offering price) |
rr_MaximumSalesChargeImposedOnPurchasesOverOfferingPrice |
none
|
|
| Maximum Deferred Sales Charge (Load) (as a percentage of the lesser of original purchase price or redemption proceeds) |
rr_MaximumDeferredSalesChargeOverOfferingPrice |
5.00% |
[5] |
| Management Fees |
rr_ManagementFeesOverAssets |
0.40% |
|
| Distribution and/or Service (12b-1) Fees |
rr_DistributionAndService12b1FeesOverAssets |
1.00% |
|
| Other Expenses |
rr_OtherExpensesOverAssets |
0.54% |
|
| Acquired Fund Fees and Expenses |
rr_AcquiredFundFeesAndExpensesOverAssets |
0.02% |
|
| Total Annual Fund Operating Expenses Before Fee Waivers and/or Expense Reimbursements |
rr_ExpensesOverAssets |
1.96% |
[3] |
| Fee Waivers and/or Expense Reimbursements |
rr_FeeWaiverOrReimbursementOverAssets |
(0.34%) |
[4] |
| Total Net Annual Fund Operating Expenses After Fee Waivers and/or Expense Reimbursements |
rr_NetExpensesOverAssets |
1.62% |
[3],[4] |
| Fee Waiver or Reimbursement over Assets, Date of Termination |
rr_FeeWaiverOrReimbursementOverAssetsDateOfTermination |
2013-1-31 |
|
| Expense Example, with Redemption, 1 Year |
rr_ExpenseExampleYear01 |
665 |
|
| Expense Example, with Redemption, 3 Years |
rr_ExpenseExampleYear03 |
882 |
|
| Expense Example, with Redemption, 5 Years |
rr_ExpenseExampleYear05 |
1,226 |
|
| Expense Example, with Redemption, 10 Years |
rr_ExpenseExampleYear10 |
2,063 |
|
| Expense Example, No Redemption, 1 Year |
rr_ExpenseExampleNoRedemptionYear01 |
165 |
|
| Expense Example, No Redemption, 3 Years |
rr_ExpenseExampleNoRedemptionYear03 |
582 |
|
| Expense Example, No Redemption, 5 Years |
rr_ExpenseExampleNoRedemptionYear05 |
1,026 |
|
| Expense Example, No Redemption, 10 Years |
rr_ExpenseExampleNoRedemptionYear10 |
2,063 |
|
| Label |
rr_AverageAnnualReturnLabel |
CLASS B Return Before Taxes |
|
| 1 Year |
rr_AverageAnnualReturnYear01 |
0.61% |
|
| 5 Years |
rr_AverageAnnualReturnYear05 |
4.29% |
|
| 10 Years |
rr_AverageAnnualReturnYear10 |
4.28% |
|
| Since Inception |
rr_AverageAnnualReturnSinceInception |
4.88% |
|
| Inception Date |
rr_AverageAnnualReturnInceptionDate |
Mar. 13,
1996 |
|
|
Munder Bond Fund (Prospectus Summary) | Munder Bond Fund | Class C Shares
|
|
|
|
| Risk Return [Abstract] |
rr_RiskReturnAbstract |
|
|
| Maximum Sales Charge (Load) Imposed on Purchases (as a percentage of offering price) |
rr_MaximumSalesChargeImposedOnPurchasesOverOfferingPrice |
none
|
|
| Maximum Deferred Sales Charge (Load) (as a percentage of the lesser of original purchase price or redemption proceeds) |
rr_MaximumDeferredSalesChargeOverOfferingPrice |
1.00% |
[6] |
| Management Fees |
rr_ManagementFeesOverAssets |
0.40% |
|
| Distribution and/or Service (12b-1) Fees |
rr_DistributionAndService12b1FeesOverAssets |
1.00% |
|
| Other Expenses |
rr_OtherExpensesOverAssets |
0.54% |
|
| Acquired Fund Fees and Expenses |
rr_AcquiredFundFeesAndExpensesOverAssets |
0.02% |
|
| Total Annual Fund Operating Expenses Before Fee Waivers and/or Expense Reimbursements |
rr_ExpensesOverAssets |
1.96% |
[3] |
| Fee Waivers and/or Expense Reimbursements |
rr_FeeWaiverOrReimbursementOverAssets |
(0.34%) |
[4] |
| Total Net Annual Fund Operating Expenses After Fee Waivers and/or Expense Reimbursements |
rr_NetExpensesOverAssets |
1.62% |
[3],[4] |
| Fee Waiver or Reimbursement over Assets, Date of Termination |
rr_FeeWaiverOrReimbursementOverAssetsDateOfTermination |
2013-1-31 |
|
| Expense Example, with Redemption, 1 Year |
rr_ExpenseExampleYear01 |
265 |
|
| Expense Example, with Redemption, 3 Years |
rr_ExpenseExampleYear03 |
582 |
|
| Expense Example, with Redemption, 5 Years |
rr_ExpenseExampleYear05 |
1,026 |
|
| Expense Example, with Redemption, 10 Years |
rr_ExpenseExampleYear10 |
2,258 |
|
| Expense Example, No Redemption, 1 Year |
rr_ExpenseExampleNoRedemptionYear01 |
165 |
|
| Expense Example, No Redemption, 3 Years |
rr_ExpenseExampleNoRedemptionYear03 |
582 |
|
| Expense Example, No Redemption, 5 Years |
rr_ExpenseExampleNoRedemptionYear05 |
1,026 |
|
| Expense Example, No Redemption, 10 Years |
rr_ExpenseExampleNoRedemptionYear10 |
2,258 |
|
| Label |
rr_AverageAnnualReturnLabel |
CLASS C Return Before Taxes |
|
| 1 Year |
rr_AverageAnnualReturnYear01 |
4.58% |
|
| 5 Years |
rr_AverageAnnualReturnYear05 |
4.62% |
|
| 10 Years |
rr_AverageAnnualReturnYear10 |
4.12% |
|
| Since Inception |
rr_AverageAnnualReturnSinceInception |
4.47% |
|
| Inception Date |
rr_AverageAnnualReturnInceptionDate |
Mar. 25,
1996 |
|
|
Munder Bond Fund (Prospectus Summary) | Munder Bond Fund | Class K Shares
|
|
|
|
| Risk Return [Abstract] |
rr_RiskReturnAbstract |
|
|
| Maximum Sales Charge (Load) Imposed on Purchases (as a percentage of offering price) |
rr_MaximumSalesChargeImposedOnPurchasesOverOfferingPrice |
none
|
|
| Maximum Deferred Sales Charge (Load) (as a percentage of the lesser of original purchase price or redemption proceeds) |
rr_MaximumDeferredSalesChargeOverOfferingPrice |
none
|
|
| Management Fees |
rr_ManagementFeesOverAssets |
0.40% |
|
| Distribution and/or Service (12b-1) Fees |
rr_DistributionAndService12b1FeesOverAssets |
none
|
|
| Other Expenses |
rr_OtherExpensesOverAssets |
0.77% |
|
| Acquired Fund Fees and Expenses |
rr_AcquiredFundFeesAndExpensesOverAssets |
0.02% |
|
| Total Annual Fund Operating Expenses Before Fee Waivers and/or Expense Reimbursements |
rr_ExpensesOverAssets |
1.19% |
[3] |
| Fee Waivers and/or Expense Reimbursements |
rr_FeeWaiverOrReimbursementOverAssets |
(0.32%) |
[4] |
| Total Net Annual Fund Operating Expenses After Fee Waivers and/or Expense Reimbursements |
rr_NetExpensesOverAssets |
0.87% |
[3],[4] |
| Fee Waiver or Reimbursement over Assets, Date of Termination |
rr_FeeWaiverOrReimbursementOverAssetsDateOfTermination |
2013-1-31 |
|
| Expense Example, with Redemption, 1 Year |
rr_ExpenseExampleYear01 |
89 |
|
| Expense Example, with Redemption, 3 Years |
rr_ExpenseExampleYear03 |
346 |
|
| Expense Example, with Redemption, 5 Years |
rr_ExpenseExampleYear05 |
624 |
|
| Expense Example, with Redemption, 10 Years |
rr_ExpenseExampleYear10 |
1,415 |
|
| Expense Example, No Redemption, 1 Year |
rr_ExpenseExampleNoRedemptionYear01 |
89 |
|
| Expense Example, No Redemption, 3 Years |
rr_ExpenseExampleNoRedemptionYear03 |
346 |
|
| Expense Example, No Redemption, 5 Years |
rr_ExpenseExampleNoRedemptionYear05 |
624 |
|
| Expense Example, No Redemption, 10 Years |
rr_ExpenseExampleNoRedemptionYear10 |
1,415 |
|
| Label |
rr_AverageAnnualReturnLabel |
CLASS K Return Before Taxes |
|
| 1 Year |
rr_AverageAnnualReturnYear01 |
6.40% |
|
| 5 Years |
rr_AverageAnnualReturnYear05 |
5.40% |
|
| 10 Years |
rr_AverageAnnualReturnYear10 |
4.90% |
|
| Since Inception |
rr_AverageAnnualReturnSinceInception |
5.49% |
|
| Inception Date |
rr_AverageAnnualReturnInceptionDate |
Nov. 23,
1992 |
|
|
Munder Bond Fund (Prospectus Summary) | Munder Bond Fund | Class Y Shares
|
|
|
|
| Risk Return [Abstract] |
rr_RiskReturnAbstract |
|
|
| Maximum Sales Charge (Load) Imposed on Purchases (as a percentage of offering price) |
rr_MaximumSalesChargeImposedOnPurchasesOverOfferingPrice |
none
|
|
| Maximum Deferred Sales Charge (Load) (as a percentage of the lesser of original purchase price or redemption proceeds) |
rr_MaximumDeferredSalesChargeOverOfferingPrice |
none
|
|
| Management Fees |
rr_ManagementFeesOverAssets |
0.40% |
|
| Distribution and/or Service (12b-1) Fees |
rr_DistributionAndService12b1FeesOverAssets |
none
|
|
| Other Expenses |
rr_OtherExpensesOverAssets |
0.54% |
|
| Acquired Fund Fees and Expenses |
rr_AcquiredFundFeesAndExpensesOverAssets |
0.02% |
|
| Total Annual Fund Operating Expenses Before Fee Waivers and/or Expense Reimbursements |
rr_ExpensesOverAssets |
0.96% |
[3] |
| Fee Waivers and/or Expense Reimbursements |
rr_FeeWaiverOrReimbursementOverAssets |
(0.34%) |
[4] |
| Total Net Annual Fund Operating Expenses After Fee Waivers and/or Expense Reimbursements |
rr_NetExpensesOverAssets |
0.62% |
[3],[4] |
| Fee Waiver or Reimbursement over Assets, Date of Termination |
rr_FeeWaiverOrReimbursementOverAssetsDateOfTermination |
2013-1-31 |
|
| Expense Example, with Redemption, 1 Year |
rr_ExpenseExampleYear01 |
63 |
|
| Expense Example, with Redemption, 3 Years |
rr_ExpenseExampleYear03 |
272 |
|
| Expense Example, with Redemption, 5 Years |
rr_ExpenseExampleYear05 |
498 |
|
| Expense Example, with Redemption, 10 Years |
rr_ExpenseExampleYear10 |
1,147 |
|
| Expense Example, No Redemption, 1 Year |
rr_ExpenseExampleNoRedemptionYear01 |
63 |
|
| Expense Example, No Redemption, 3 Years |
rr_ExpenseExampleNoRedemptionYear03 |
272 |
|
| Expense Example, No Redemption, 5 Years |
rr_ExpenseExampleNoRedemptionYear05 |
498 |
|
| Expense Example, No Redemption, 10 Years |
rr_ExpenseExampleNoRedemptionYear10 |
1,147 |
|
| Annual Return 2002 |
rr_AnnualReturn2002 |
7.37% |
|
| Annual Return 2003 |
rr_AnnualReturn2003 |
5.56% |
|
| Annual Return 2004 |
rr_AnnualReturn2004 |
3.94% |
|
| Annual Return 2005 |
rr_AnnualReturn2005 |
1.85% |
|
| Annual Return 2006 |
rr_AnnualReturn2006 |
4.63% |
|
| Annual Return 2007 |
rr_AnnualReturn2007 |
4.63% |
|
| Annual Return 2008 |
rr_AnnualReturn2008 |
0.64% |
|
| Annual Return 2009 |
rr_AnnualReturn2009 |
9.16% |
|
| Annual Return 2010 |
rr_AnnualReturn2010 |
7.53% |
|
| Annual Return 2011 |
rr_AnnualReturn2011 |
6.55% |
|
| Year to Date Return, Label |
rr_YearToDateReturnLabel |
YTD through |
|
| Bar Chart, Year to Date Return, Date |
rr_BarChartYearToDateReturnDate |
Sep. 30,
2012 |
|
| Bar Chart, Year to Date Return |
rr_BarChartYearToDateReturn |
6.77% |
|
| Highest Quarterly Return, Label |
rr_HighestQuarterlyReturnLabel |
Best Quarter: |
|
| Highest Quarterly Return, Date |
rr_BarChartHighestQuarterlyReturnDate |
Sep. 30,
2009 |
|
| Highest Quarterly Return |
rr_BarChartHighestQuarterlyReturn |
6.22% |
|
| Lowest Quarterly Return, Label |
rr_LowestQuarterlyReturnLabel |
Worst Quarter: |
|
| Lowest Quarterly Return, Date |
rr_BarChartLowestQuarterlyReturnDate |
Jun. 30,
2004 |
|
| Lowest Quarterly Return |
rr_BarChartLowestQuarterlyReturn |
(3.05%) |
|
| Label |
rr_AverageAnnualReturnLabel |
CLASS Y Return Before Taxes |
|
| 1 Year |
rr_AverageAnnualReturnYear01 |
6.55% |
|
| 5 Years |
rr_AverageAnnualReturnYear05 |
5.66% |
|
| 10 Years |
rr_AverageAnnualReturnYear10 |
5.16% |
|
| Since Inception |
rr_AverageAnnualReturnSinceInception |
5.66% |
|
| Inception Date |
rr_AverageAnnualReturnInceptionDate |
Dec.
01,
1991 |
|
|
Munder Bond Fund (Prospectus Summary) | Munder Bond Fund | Class Y Shares | After Taxes on Distributions
|
|
|
|
| Risk Return [Abstract] |
rr_RiskReturnAbstract |
|
|
| Label |
rr_AverageAnnualReturnLabel |
CLASS Y Return After Taxes on Distributions |
|
| 1 Year |
rr_AverageAnnualReturnYear01 |
5.12% |
|
| 5 Years |
rr_AverageAnnualReturnYear05 |
3.94% |
|
| 10 Years |
rr_AverageAnnualReturnYear10 |
3.41% |
|
| Since Inception |
rr_AverageAnnualReturnSinceInception |
3.48% |
|
| Inception Date |
rr_AverageAnnualReturnInceptionDate |
Dec.
01,
1991 |
|
|
Munder Bond Fund (Prospectus Summary) | Munder Bond Fund | Class Y Shares | After Taxes on Distributions and Sales
|
|
|
|
| Risk Return [Abstract] |
rr_RiskReturnAbstract |
|
|
| Label |
rr_AverageAnnualReturnLabel |
CLASS Y Return After Taxes on Distributions and Sale of Fund Shares |
|
| 1 Year |
rr_AverageAnnualReturnYear01 |
4.23% |
|
| 5 Years |
rr_AverageAnnualReturnYear05 |
3.81% |
|
| 10 Years |
rr_AverageAnnualReturnYear10 |
3.36% |
|
| Since Inception |
rr_AverageAnnualReturnSinceInception |
3.48% |
|
| Inception Date |
rr_AverageAnnualReturnInceptionDate |
Dec.
01,
1991 |
|
|
|
|