EX-99.3
Exhibit 99.3
Chunghwa Telecom Co., Ltd. and Subsidiaries
Consolidated Financial Statements for the
Nine Months
Ended September 30, 2013 and 2012 and
Independent Accountants’ Review Report
1
INDEPENDENT ACCOUNTANTS’ REVIEW REPORT
The Board of Directors and Stockholders
Chunghwa Telecom Co.,
Ltd.
We have reviewed the accompanying consolidated balance sheets of Chunghwa Telecom Co., Ltd. and subsidiaries (“the Company”) as of
September 30, 2013, December 31, 2012, September 30, 2012 and January 1, 2012, the related consolidated statements of comprehensive income for the three months ended September 30, 2013 and 2012 and nine months
ended September 30, 2013 and 2012, change in stockholders’ equity and cash flows for the nine months ended September 30, 2013 and 2012. These consolidated financial statements are the responsibility of the Company’s management.
Our responsibility is to issue a report on these consolidated financial statements based on our reviews.
We conducted our reviews in accordance with the
Statement of Auditing Standards No. 36, “Review of Financial Statements”, issued by the Auditing Standards Committee of the Accounting Research and Development Foundation of the Republic of China. A review consists principally of
applying analytical procedures to financial data and making inquiries of persons responsible for financial and accounting matters. It is substantially less in scope than an audit conducted in accordance with auditing standards generally accepted in
the Republic of China, the objective of which is the expression of an opinion regarding the consolidated financial statements taken as a whole. Accordingly, we do not express such an opinion.
Based on our reviews, we are not aware of any material modifications that should be made to the financial statements referred to above for them to be in
conformity with the Guidelines Governing the Preparation of Financial Reports by Securities Issuers issued by the Financial Supervisory Commission of the Republic of China, and International Financial Reporting Standard 1, “First-time adoption
of International Financial Reporting Standards” and International Accounting Standard 34, “Interim Financial Reporting” endorsed by the Financial Supervisory Commission of the Republic of China.
/s/ DELOITTE & TOUCHE
Deloitte & Touche
Taipei, Taiwan
The Republic of China
October 31, 2013
Notice to Readers
The accompanying consolidated financial statements are intended only to present the consolidated financial position, financial performance and
cash flows in accordance with accounting principles and practices generally accepted in the Republic of China and not those of any other jurisdictions. The standards, procedures and practices to review such consolidated financial statements are
those generally accepted and applied in the Republic of China.
For the convenience of readers, the accountants’ review report and the
accompanying consolidated financial statements have been translated into English from the original Chinese version prepared and used in the Republic of China. If there is any conflict between the English version and the original Chinese version or
any difference in the interpretation of the two versions, the Chinese-language accountants’ review report and consolidated financial statements shall prevail.
2
CHUNGHWA TELECOM CO., LTD. AND SUBSIDIARIES
CONSOLIDATED BALANCE SHEETS
(In Thousands of New
Taiwan Dollars)
(Reviewed, Not Audited)
|
|
|
|
|
|
|
|
|
|
|
|
|
|
|
|
|
|
|
|
|
|
|
|
|
|
|
|
|
|
|
|
|
| |
|
September 30, 2013 |
|
|
December 31, 2012 |
|
|
September 30, 2012 |
|
|
January 1, 2012 |
|
| ASSETS |
|
Amount |
|
|
% |
|
|
Amount |
|
|
% |
|
|
Amount |
|
|
% |
|
|
Amount |
|
|
% |
|
|
|
|
|
|
|
|
|
|
| CURRENT ASSETS |
|
|
|
|
|
|
|
|
|
|
|
|
|
|
|
|
|
|
|
|
|
|
|
|
|
|
|
|
|
|
|
|
| Cash and cash equivalents (Notes 3 and 6) |
|
$ |
34,749,913 |
|
|
|
8 |
|
|
$ |
30,938,472 |
|
|
|
7 |
|
|
$ |
31,488,277 |
|
|
|
7 |
|
|
$ |
26,407,196 |
|
|
|
6 |
|
| Financial assets at fair value through profit or loss (Notes 3 and 7) |
|
|
363 |
|
|
|
— |
|
|
|
2,994 |
|
|
|
— |
|
|
|
32,678 |
|
|
|
— |
|
|
|
45,750 |
|
|
|
— |
|
| Available-for-sale financial assets (Notes 3 and 8) |
|
|
16,880 |
|
|
|
— |
|
|
|
2,250,260 |
|
|
|
— |
|
|
|
2,390,784 |
|
|
|
1 |
|
|
|
2,498,712 |
|
|
|
1 |
|
| Held-to-maturity financial assets (Notes 3 and 9) |
|
|
4,689,694 |
|
|
|
1 |
|
|
|
4,250,146 |
|
|
|
1 |
|
|
|
2,981,338 |
|
|
|
1 |
|
|
|
1,201,301 |
|
|
|
— |
|
| Trade notes and accounts receivable, net (Notes 3, 4 and 10) |
|
|
24,344,606 |
|
|
|
6 |
|
|
|
24,354,817 |
|
|
|
6 |
|
|
|
24,400,896 |
|
|
|
6 |
|
|
|
22,396,071 |
|
|
|
5 |
|
| Accounts receivable from related parties (Note 37) |
|
|
48,365 |
|
|
|
— |
|
|
|
43,937 |
|
|
|
— |
|
|
|
28,215 |
|
|
|
— |
|
|
|
34,064 |
|
|
|
— |
|
| Inventories (Notes 3, 4, 11 and 38) |
|
|
8,087,099 |
|
|
|
2 |
|
|
|
7,196,101 |
|
|
|
2 |
|
|
|
4,059,109 |
|
|
|
1 |
|
|
|
4,822,154 |
|
|
|
1 |
|
| Prepayments (Notes 12 and 37) |
|
|
5,071,640 |
|
|
|
1 |
|
|
|
1,985,706 |
|
|
|
— |
|
|
|
4,942,974 |
|
|
|
1 |
|
|
|
1,888,643 |
|
|
|
— |
|
| Other current monetary assets (Note 13) |
|
|
4,775,749 |
|
|
|
1 |
|
|
|
24,449,195 |
|
|
|
6 |
|
|
|
9,103,345 |
|
|
|
2 |
|
|
|
43,050,748 |
|
|
|
10 |
|
| Other current assets (Notes 7 and 19) |
|
|
3,987,212 |
|
|
|
1 |
|
|
|
4,474,595 |
|
|
|
1 |
|
|
|
4,641,999 |
|
|
|
1 |
|
|
|
3,039,836 |
|
|
|
1 |
|
|
|
|
|
|
|
|
|
|
|
|
|
|
|
|
|
|
|
|
|
|
|
|
|
|
|
|
|
|
|
|
|
|
|
|
|
|
|
|
|
|
|
| Total current assets |
|
|
85,771,521 |
|
|
|
20 |
|
|
|
99,946,223 |
|
|
|
23 |
|
|
|
84,069,615 |
|
|
|
20 |
|
|
|
105,384,475 |
|
|
|
24 |
|
|
|
|
|
|
|
|
|
|
|
|
|
|
|
|
|
|
|
|
|
|
|
|
|
|
|
|
|
|
|
|
|
|
|
|
|
|
|
|
|
|
| NONCURRENT ASSETS |
|
|
|
|
|
|
|
|
|
|
|
|
|
|
|
|
|
|
|
|
|
|
|
|
|
|
|
|
| Available-for-sale financial assets (Notes 3 and 8) |
|
|
3,042,355 |
|
|
|
1 |
|
|
|
3,278,315 |
|
|
|
1 |
|
|
|
3,352,337 |
|
|
|
1 |
|
|
|
242,934 |
|
|
|
— |
|
| Financial assets carried at cost (Notes 3 and 14) |
|
|
2,454,954 |
|
|
|
1 |
|
|
|
2,467,861 |
|
|
|
1 |
|
|
|
2,525,618 |
|
|
|
1 |
|
|
|
2,575,030 |
|
|
|
1 |
|
| Held-to-maturity financial assets (Notes 3 and 9) |
|
|
8,923,153 |
|
|
|
2 |
|
|
|
11,796,144 |
|
|
|
3 |
|
|
|
14,005,461 |
|
|
|
3 |
|
|
|
13,494,891 |
|
|
|
3 |
|
| Investments accounted for using equity method (Notes 3 and 15) |
|
|
2,367,447 |
|
|
|
1 |
|
|
|
2,240,292 |
|
|
|
— |
|
|
|
2,678,337 |
|
|
|
1 |
|
|
|
2,556,017 |
|
|
|
— |
|
| Property, plant and equipment (Notes 3, 4, 16, 37 and 38) |
|
|
296,810,800 |
|
|
|
70 |
|
|
|
297,342,349 |
|
|
|
67 |
|
|
|
293,482,780 |
|
|
|
69 |
|
|
|
295,031,831 |
|
|
|
67 |
|
| Investment properties (Notes 3, 4 and 17) |
|
|
7,776,464 |
|
|
|
2 |
|
|
|
7,788,898 |
|
|
|
2 |
|
|
|
7,812,704 |
|
|
|
2 |
|
|
|
9,060,081 |
|
|
|
2 |
|
| Intangible assets (Notes 3, 4 and 18) |
|
|
5,361,802 |
|
|
|
1 |
|
|
|
5,781,803 |
|
|
|
1 |
|
|
|
5,844,043 |
|
|
|
1 |
|
|
|
6,278,175 |
|
|
|
1 |
|
| Deferred income tax assets (Notes 3 and 30) |
|
|
1,385,251 |
|
|
|
— |
|
|
|
1,319,878 |
|
|
|
— |
|
|
|
1,013,748 |
|
|
|
— |
|
|
|
1,071,574 |
|
|
|
— |
|
| Prepayments (Notes 12 and 37) |
|
|
3,555,222 |
|
|
|
1 |
|
|
|
3,554,235 |
|
|
|
1 |
|
|
|
3,517,822 |
|
|
|
1 |
|
|
|
3,546,976 |
|
|
|
1 |
|
| Other noncurrent assets (Notes 19, 26 and 38) |
|
|
5,505,429 |
|
|
|
1 |
|
|
|
4,596,529 |
|
|
|
1 |
|
|
|
3,996,637 |
|
|
|
1 |
|
|
|
3,858,165 |
|
|
|
1 |
|
|
|
|
|
|
|
|
|
|
|
|
|
|
|
|
|
|
|
|
|
|
|
|
|
|
|
|
|
|
|
|
|
|
|
|
|
|
|
|
|
|
|
| Total noncurrent assets |
|
|
337,182,877 |
|
|
|
80 |
|
|
|
340,166,304 |
|
|
|
77 |
|
|
|
338,229,487 |
|
|
|
80 |
|
|
|
337,715,674 |
|
|
|
76 |
|
|
|
|
|
|
|
|
|
|
|
|
|
|
|
|
|
|
|
|
|
|
|
|
|
|
|
|
|
|
|
|
|
|
|
|
|
|
|
|
|
|
|
| TOTAL |
|
$ |
422,954,398 |
|
|
|
100 |
|
|
$ |
440,112,527 |
|
|
|
100 |
|
|
$ |
422,299,102 |
|
|
|
100 |
|
|
$ |
443,100,149 |
|
|
|
100 |
|
|
|
|
|
|
|
|
|
|
|
|
|
|
|
|
|
|
|
|
|
|
|
|
|
|
|
|
|
|
|
|
|
|
3
|
|
|
|
|
|
|
|
|
|
|
|
|
|
|
|
|
|
|
|
|
|
|
|
|
|
|
|
|
|
|
|
|
| |
|
September 30, 2013 |
|
|
December 31, 2012 |
|
|
September 30, 2012 |
|
|
January 1, 2012 |
|
| LIABILITIES AND STOCKHOLDERS’ EQUITY |
|
Amount |
|
|
% |
|
|
Amount |
|
|
% |
|
|
Amount |
|
|
% |
|
|
Amount |
|
|
% |
|
|
|
|
|
|
|
| CURRENT LIABILITIES |
|
|
|
|
|
|
|
|
|
|
|
|
|
|
|
|
|
|
|
|
| Short-term loans (Note 20) |
|
$ |
1,075,222 |
|
|
|
— |
|
|
$ |
111,473 |
|
|
|
— |
|
|
$ |
130,000 |
|
|
|
— |
|
|
$ |
75,000 |
|
|
|
— |
|
| Financial liabilities at fair value through profit or loss (Notes 3 and 7) |
|
|
671 |
|
|
|
— |
|
|
|
1,959 |
|
|
|
— |
|
|
|
222 |
|
|
|
— |
|
|
|
3,987 |
|
|
|
— |
|
| Trade notes and accounts payable (Note 22) |
|
|
12,376,159 |
|
|
|
3 |
|
|
|
13,513,437 |
|
|
|
3 |
|
|
|
12,346,431 |
|
|
|
3 |
|
|
|
14,264,769 |
|
|
|
3 |
|
| Payables to related parties (Note 37) |
|
|
466,268 |
|
|
|
— |
|
|
|
837,330 |
|
|
|
— |
|
|
|
477,043 |
|
|
|
— |
|
|
|
788,147 |
|
|
|
— |
|
| Current tax liabilities (Notes 3 and 30) |
|
|
2,194,950 |
|
|
|
1 |
|
|
|
3,320,329 |
|
|
|
1 |
|
|
|
1,474,128 |
|
|
|
— |
|
|
|
3,538,742 |
|
|
|
1 |
|
| Other payables (Note 23) |
|
|
22,664,934 |
|
|
|
5 |
|
|
|
26,101,780 |
|
|
|
6 |
|
|
|
21,977,541 |
|
|
|
5 |
|
|
|
26,302,261 |
|
|
|
6 |
|
| Provisions (Notes 3 and 24) |
|
|
114,242 |
|
|
|
— |
|
|
|
221,245 |
|
|
|
— |
|
|
|
128,800 |
|
|
|
— |
|
|
|
148,050 |
|
|
|
— |
|
| Advance receipts (Note 25) |
|
|
9,748,057 |
|
|
|
2 |
|
|
|
10,193,988 |
|
|
|
2 |
|
|
|
10,030,294 |
|
|
|
3 |
|
|
|
11,501,721 |
|
|
|
3 |
|
| Current portion of long-term loans (Note 21) |
|
|
— |
|
|
|
— |
|
|
|
8,372 |
|
|
|
— |
|
|
|
33,489 |
|
|
|
— |
|
|
|
701,887 |
|
|
|
— |
|
| Other current liabilities |
|
|
1,577,680 |
|
|
|
1 |
|
|
|
1,597,476 |
|
|
|
1 |
|
|
|
1,799,254 |
|
|
|
1 |
|
|
|
1,954,963 |
|
|
|
1 |
|
|
|
|
|
|
|
|
|
|
|
|
|
|
|
|
|
|
|
|
|
|
|
|
|
|
|
|
|
|
|
|
|
|
|
|
|
|
|
|
|
|
|
| Total current liabilities |
|
|
50,218,183 |
|
|
|
12 |
|
|
|
55,907,389 |
|
|
|
13 |
|
|
|
48,397,202 |
|
|
|
12 |
|
|
|
59,279,527 |
|
|
|
14 |
|
|
|
|
|
|
|
|
|
|
|
|
|
|
|
|
|
|
|
|
|
|
|
|
|
|
|
|
|
|
|
|
|
|
|
|
|
|
|
|
|
|
|
| NONCURRENT LIABILITIES |
|
|
|
|
|
|
|
|
|
|
|
|
|
|
|
|
|
|
|
|
|
|
|
|
|
|
|
|
|
|
|
|
| Long-term loans (Note 21) |
|
|
1,700,000 |
|
|
|
1 |
|
|
|
2,050,000 |
|
|
|
1 |
|
|
|
1,650,000 |
|
|
|
— |
|
|
|
1,058,372 |
|
|
|
— |
|
| Deferred income taxes liabilities (Notes 3 and 30) |
|
|
99,069 |
|
|
|
— |
|
|
|
102,396 |
|
|
|
— |
|
|
|
134,413 |
|
|
|
— |
|
|
|
115,068 |
|
|
|
— |
|
| Provisions (Notes 3 and 24) |
|
|
135,301 |
|
|
|
— |
|
|
|
44,909 |
|
|
|
— |
|
|
|
39,810 |
|
|
|
— |
|
|
|
34,002 |
|
|
|
— |
|
| Customers’ deposits (Note 37) |
|
|
4,831,012 |
|
|
|
1 |
|
|
|
4,911,010 |
|
|
|
1 |
|
|
|
4,870,073 |
|
|
|
1 |
|
|
|
5,013,981 |
|
|
|
1 |
|
| Accrued pension liabilities (Notes 3 and 26) |
|
|
4,830,259 |
|
|
|
1 |
|
|
|
4,616,803 |
|
|
|
1 |
|
|
|
3,078,114 |
|
|
|
1 |
|
|
|
2,994,079 |
|
|
|
1 |
|
| Deferred revenue |
|
|
3,767,384 |
|
|
|
1 |
|
|
|
3,838,854 |
|
|
|
1 |
|
|
|
3,538,846 |
|
|
|
1 |
|
|
|
3,887,813 |
|
|
|
1 |
|
| Other noncurrent liabilities |
|
|
1,315,382 |
|
|
|
— |
|
|
|
1,312,630 |
|
|
|
— |
|
|
|
1,257,487 |
|
|
|
— |
|
|
|
865,644 |
|
|
|
— |
|
|
|
|
|
|
|
|
|
|
|
|
|
|
|
|
|
|
|
|
|
|
|
|
|
|
|
|
|
|
|
|
|
|
|
|
|
|
|
|
|
|
|
| Total noncurrent liabilities |
|
|
16,678,407 |
|
|
|
4 |
|
|
|
16,876,602 |
|
|
|
4 |
|
|
|
14,568,743 |
|
|
|
3 |
|
|
|
13,968,959 |
|
|
|
3 |
|
|
|
|
|
|
|
|
|
|
|
|
|
|
|
|
|
|
|
|
|
|
|
|
|
|
|
|
|
|
|
|
|
|
|
|
|
|
|
|
|
|
|
| Total liabilities |
|
|
66,896,590 |
|
|
|
16 |
|
|
|
72,783,991 |
|
|
|
17 |
|
|
|
62,965,945 |
|
|
|
15 |
|
|
|
73,248,486 |
|
|
|
17 |
|
|
|
|
|
|
|
|
|
|
|
|
|
|
|
|
|
|
|
|
|
|
|
|
|
|
|
|
|
|
|
|
|
|
|
|
|
|
|
|
|
|
|
| EQUITY ATTRIBUTABLE TO STOCKHOLDERS OF THE PARENT (Note 27) |
|
|
|
|
|
|
|
|
|
|
|
|
|
|
|
|
|
|
|
|
|
|
|
|
|
|
|
|
|
|
|
|
| Common stock |
|
|
77,574,465 |
|
|
|
18 |
|
|
|
77,574,465 |
|
|
|
18 |
|
|
|
77,574,465 |
|
|
|
18 |
|
|
|
77,574,465 |
|
|
|
17 |
|
|
|
|
|
|
|
|
|
|
|
|
|
|
|
|
|
|
|
|
|
|
|
|
|
|
|
|
|
|
|
|
|
|
| Additional paid-in capital |
|
|
184,579,878 |
|
|
|
44 |
|
|
|
190,162,430 |
|
|
|
43 |
|
|
|
190,161,168 |
|
|
|
45 |
|
|
|
190,157,537 |
|
|
|
43 |
|
|
|
|
|
|
|
|
|
|
|
|
|
|
|
|
|
|
|
|
|
|
|
|
|
|
|
|
|
|
|
|
|
|
| Retained earnings |
|
|
|
|
|
|
|
|
|
|
|
|
|
|
|
|
|
|
|
|
|
|
|
|
|
|
|
|
|
|
|
|
| Legal reserve |
|
|
74,819,380 |
|
|
|
18 |
|
|
|
70,828,983 |
|
|
|
16 |
|
|
|
70,828,983 |
|
|
|
17 |
|
|
|
66,122,145 |
|
|
|
15 |
|
| Special reserve |
|
|
2,675,894 |
|
|
|
— |
|
|
|
2,675,894 |
|
|
|
— |
|
|
|
2,675,894 |
|
|
|
1 |
|
|
|
2,675,894 |
|
|
|
1 |
|
| Unappropriated earnings |
|
|
12,025,094 |
|
|
|
3 |
|
|
|
21,483,854 |
|
|
|
5 |
|
|
|
13,679,696 |
|
|
|
3 |
|
|
|
29,016,482 |
|
|
|
6 |
|
|
|
|
|
|
|
|
|
|
|
|
|
|
|
|
|
|
|
|
|
|
|
|
|
|
|
|
|
|
|
|
|
|
| Total retained earnings |
|
|
89,520,368 |
|
|
|
21 |
|
|
|
94,988,731 |
|
|
|
21 |
|
|
|
87,184,573 |
|
|
|
21 |
|
|
|
97,814,521 |
|
|
|
22 |
|
|
|
|
|
|
|
|
|
|
|
|
|
|
|
|
|
|
|
|
|
|
|
|
|
|
|
|
|
|
|
|
|
|
| Other adjustments |
|
|
(245,168 |
) |
|
|
— |
|
|
|
161,061 |
|
|
|
— |
|
|
|
239,707 |
|
|
|
— |
|
|
|
28,756 |
|
|
|
— |
|
|
|
|
|
|
|
|
|
|
|
|
|
|
|
|
|
|
|
|
|
|
|
|
|
|
|
|
|
|
|
|
|
|
|
|
|
|
|
|
|
|
|
| Total equity attributable to stockholders of the parent |
|
|
351,429,543 |
|
|
|
83 |
|
|
|
362,886,687 |
|
|
|
82 |
|
|
|
355,159,913 |
|
|
|
84 |
|
|
|
365,575,279 |
|
|
|
82 |
|
|
|
|
|
|
|
|
|
|
|
|
|
|
|
|
|
|
|
|
|
|
|
|
|
|
|
|
|
|
|
|
|
|
|
|
|
|
|
|
|
|
|
| NONCONTROLLING INTERESTS |
|
|
4,628,265 |
|
|
|
1 |
|
|
|
4,441,849 |
|
|
|
1 |
|
|
|
4,173,244 |
|
|
|
1 |
|
|
|
4,276,384 |
|
|
|
1 |
|
|
|
|
|
|
|
|
|
|
|
|
|
|
|
|
|
|
|
|
|
|
|
|
|
|
|
|
|
|
|
|
|
|
|
|
|
|
|
|
|
|
|
| Total stockholders’ equity |
|
|
356,057,808 |
|
|
|
84 |
|
|
|
367,328,536 |
|
|
|
83 |
|
|
|
359,333,157 |
|
|
|
85 |
|
|
|
369,851,663 |
|
|
|
83 |
|
|
|
|
|
|
|
|
|
|
|
|
|
|
|
|
|
|
|
|
|
|
|
|
|
|
|
|
|
|
|
|
|
|
|
|
|
|
|
|
|
|
|
| TOTAL |
|
$ |
422,954,398 |
|
|
|
100 |
|
|
$ |
440,112,527 |
|
|
|
100 |
|
|
$ |
422,299,102 |
|
|
|
100 |
|
|
$ |
443,100,149 |
|
|
|
100 |
|
|
|
|
|
|
|
|
|
|
|
|
|
|
|
|
|
|
|
|
|
|
|
|
|
|
|
|
|
|
|
|
|
|
The accompanying notes are an integral part of the consolidated financial statements.
4
CHUNGHWA TELECOM CO., LTD. AND SUBSIDIARIES
CONSOLIDATED STATEMENTS OF COMPREHENSIVE INCOME
(In
Thousands of New Taiwan Dollars, Except Earnings Per Share)
(Reviewed, Not Audited)
|
|
|
|
|
|
|
|
|
|
|
|
|
|
|
|
|
|
|
|
|
|
|
|
|
|
|
|
|
|
|
|
|
| |
|
Three Months Ended September 30 |
|
|
Nine Months Ended September 30 |
|
| |
|
2013 |
|
|
2012 |
|
|
2013 |
|
|
2012 |
|
| |
|
Amount |
|
|
% |
|
|
Amount |
|
|
% |
|
|
Amount |
|
|
% |
|
|
Amount |
|
|
% |
|
|
|
|
|
|
|
|
|
|
| REVENUES (Notes 28 and 37) |
|
$ |
56,723,304 |
|
|
|
100 |
|
|
$ |
55,284,607 |
|
|
|
100 |
|
|
$ |
169,178,253 |
|
|
|
100 |
|
|
$ |
165,168,978 |
|
|
|
100 |
|
|
|
|
|
|
|
|
|
|
| OPERATING COSTS (Notes 11 and 37) |
|
|
35,789,479 |
|
|
|
63 |
|
|
|
34,607,909 |
|
|
|
63 |
|
|
|
108,519,223 |
|
|
|
64 |
|
|
|
104,702,702 |
|
|
|
63 |
|
|
|
|
|
|
|
|
|
|
|
|
|
|
|
|
|
|
|
|
|
|
|
|
|
|
|
|
|
|
|
|
|
|
|
|
|
|
|
|
|
|
|
| GROSS PROFIT |
|
|
20,933,825 |
|
|
|
37 |
|
|
|
20,676,698 |
|
|
|
37 |
|
|
|
60,659,030 |
|
|
|
36 |
|
|
|
60,466,276 |
|
|
|
37 |
|
|
|
|
|
|
|
|
|
|
|
|
|
|
|
|
|
|
|
|
|
|
|
|
|
|
|
|
|
|
|
|
|
|
|
|
|
|
|
|
|
|
|
| OPERATING EXPENSES (Note 37) |
|
|
|
|
|
|
|
|
|
|
|
|
|
|
|
|
|
|
|
|
|
|
|
|
|
|
|
|
|
|
|
|
| Marketing |
|
|
6,373,601 |
|
|
|
11 |
|
|
|
6,129,760 |
|
|
|
11 |
|
|
|
18,323,572 |
|
|
|
11 |
|
|
|
15,975,919 |
|
|
|
10 |
|
| General and administrative |
|
|
1,039,520 |
|
|
|
2 |
|
|
|
945,695 |
|
|
|
1 |
|
|
|
3,099,503 |
|
|
|
2 |
|
|
|
2,969,952 |
|
|
|
2 |
|
| Research and development |
|
|
922,176 |
|
|
|
2 |
|
|
|
957,458 |
|
|
|
2 |
|
|
|
2,724,972 |
|
|
|
2 |
|
|
|
2,743,066 |
|
|
|
1 |
|
|
|
|
|
|
|
|
|
|
|
|
|
|
|
|
|
|
|
|
|
|
|
|
|
|
|
|
|
|
|
|
|
|
|
|
|
|
|
|
|
|
|
| Total operating expenses |
|
|
8,335,297 |
|
|
|
15 |
|
|
|
8,032,913 |
|
|
|
14 |
|
|
|
24,148,047 |
|
|
|
15 |
|
|
|
21,688,937 |
|
|
|
13 |
|
|
|
|
|
|
|
|
|
|
|
|
|
|
|
|
|
|
|
|
|
|
|
|
|
|
|
|
|
|
|
|
|
|
|
|
|
|
|
|
|
|
|
| OTHER INCOME AND EXPENSE (Note 29) |
|
|
(12,005 |
) |
|
|
— |
|
|
|
(9,457 |
) |
|
|
— |
|
|
|
(24,176 |
) |
|
|
— |
|
|
|
(1,266,280 |
) |
|
|
(1 |
) |
|
|
|
|
|
|
|
|
|
|
|
|
|
|
|
|
|
|
|
|
|
|
|
|
|
|
|
|
|
|
|
|
|
|
|
|
|
|
|
|
|
|
| INCOME FROM OPERATIONS |
|
|
12,586,523 |
|
|
|
22 |
|
|
|
12,634,328 |
|
|
|
23 |
|
|
|
36,486,807 |
|
|
|
21 |
|
|
|
37,511,059 |
|
|
|
23 |
|
|
|
|
|
|
|
|
|
|
|
|
|
|
|
|
|
|
|
|
|
|
|
|
|
|
|
|
|
|
|
|
|
|
|
|
|
|
|
|
|
|
|
| NON-OPERATING INCOME AND EXPENSES |
|
|
|
|
|
|
|
|
|
|
|
|
|
|
|
|
|
|
|
|
|
|
|
|
|
|
|
|
|
|
|
|
| Interest income |
|
|
146,630 |
|
|
|
— |
|
|
|
183,333 |
|
|
|
1 |
|
|
|
471,040 |
|
|
|
— |
|
|
|
586,191 |
|
|
|
1 |
|
| Other income (Notes 29 and 37) |
|
|
127,762 |
|
|
|
— |
|
|
|
108,662 |
|
|
|
— |
|
|
|
266,637 |
|
|
|
— |
|
|
|
281,351 |
|
|
|
— |
|
| Other gains and losses (Notes 29 and 37) |
|
|
(3,497 |
) |
|
|
— |
|
|
|
(42,038 |
) |
|
|
— |
|
|
|
(52,208 |
) |
|
|
— |
|
|
|
(38,048 |
) |
|
|
— |
|
| Finance costs (Note 29) |
|
|
(9,573 |
) |
|
|
— |
|
|
|
(5,204 |
) |
|
|
— |
|
|
|
(23,920 |
) |
|
|
— |
|
|
|
(16,030 |
) |
|
|
— |
|
| Share of the profit of associates and jointly controlled entities accounted for using equity method (Note 15) |
|
|
222,821 |
|
|
|
1 |
|
|
|
178,656 |
|
|
|
— |
|
|
|
525,180 |
|
|
|
1 |
|
|
|
461,938 |
|
|
|
— |
|
|
|
|
|
|
|
|
|
|
|
|
|
|
|
|
|
|
|
|
|
|
|
|
|
|
|
|
|
|
|
|
|
|
|
|
|
|
|
|
|
|
|
| Total non-operating income and expenses |
|
|
484,143 |
|
|
|
1 |
|
|
|
423,409 |
|
|
|
1 |
|
|
|
1,186,729 |
|
|
|
1 |
|
|
|
1,275,402 |
|
|
|
1 |
|
|
|
|
|
|
|
|
|
|
|
|
|
|
|
|
|
|
|
|
|
|
|
|
|
|
|
|
|
|
|
|
|
|
|
|
|
|
|
|
|
|
|
| INCOME BEFORE INCOME TAX |
|
|
13,070,666 |
|
|
|
23 |
|
|
|
13,057,737 |
|
|
|
24 |
|
|
|
37,673,536 |
|
|
|
22 |
|
|
|
38,786,461 |
|
|
|
24 |
|
|
|
|
|
|
|
|
|
|
| INCOME TAX EXPENSE (Notes 3 and 30) |
|
|
2,177,679 |
|
|
|
4 |
|
|
|
2,085,532 |
|
|
|
4 |
|
|
|
6,279,920 |
|
|
|
4 |
|
|
|
6,192,723 |
|
|
|
4 |
|
|
|
|
|
|
|
|
|
|
|
|
|
|
|
|
|
|
|
|
|
|
|
|
|
|
|
|
|
|
|
|
|
|
|
|
|
|
|
|
|
|
|
| NET INCOME |
|
|
10,892,987 |
|
|
|
19 |
|
|
|
10,972,205 |
|
|
|
20 |
|
|
|
31,393,616 |
|
|
|
18 |
|
|
|
32,593,738 |
|
|
|
20 |
|
|
|
|
|
|
|
|
|
|
|
|
|
|
|
|
|
|
|
|
|
|
|
|
|
|
|
|
|
|
|
|
|
|
|
|
|
|
|
|
|
|
|
| OTHER COMPREHENSIVE INCOME (LOSS), NET |
|
|
|
|
|
|
|
|
|
|
|
|
|
|
|
|
|
|
|
|
|
|
|
|
|
|
|
|
|
|
|
|
| Exchange differences arising from the translation of the foreign operations |
|
|
(72,259 |
) |
|
|
— |
|
|
|
(21,253 |
) |
|
|
— |
|
|
|
17,553 |
|
|
|
— |
|
|
|
(41,282 |
) |
|
|
— |
|
(Continued)
5
CHUNGHWA TELECOM CO., LTD. AND SUBSIDIARIES
CONSOLIDATED STATEMENTS OF COMPREHENSIVE INCOME
(In
Thousands of New Taiwan Dollars, Except Earnings Per Share)
(Reviewed, Not Audited)
|
|
|
|
|
|
|
|
|
|
|
|
|
|
|
|
|
|
|
|
|
|
|
|
|
|
|
|
|
|
|
|
|
| |
|
Three Months Ended September 30 |
|
|
Nine Months Ended September 30 |
|
| |
|
2013 |
|
|
2012 |
|
|
2013 |
|
|
2012 |
|
| |
|
Amount |
|
|
% |
|
|
Amount |
|
|
% |
|
|
Amount |
|
|
% |
|
|
Amount |
|
|
% |
|
|
|
|
|
|
|
|
|
|
| Unrealized gain (loss) on available-for-sale financial assets |
|
|
(70,853 |
) |
|
|
— |
|
|
|
(306,033 |
) |
|
|
(1 |
) |
|
|
(404,170 |
) |
|
|
— |
|
|
|
246,505 |
|
|
|
— |
|
| Share of other comprehensive income of associates accounted for using equity method |
|
|
(305 |
) |
|
|
— |
|
|
|
(1,886 |
) |
|
|
— |
|
|
|
(36,605 |
) |
|
|
— |
|
|
|
13 |
|
|
|
— |
|
| Income tax relating to each component of other comprehensive income (Note 30) |
|
|
(3,493 |
) |
|
|
— |
|
|
|
— |
|
|
|
— |
|
|
|
(3,382 |
) |
|
|
— |
|
|
|
— |
|
|
|
— |
|
|
|
|
|
|
|
|
|
|
|
|
|
|
|
|
|
|
|
|
|
|
|
|
|
|
|
|
|
|
|
|
|
|
|
|
|
|
|
|
|
|
|
| Total other comprehensive income (loss), net of income tax |
|
|
(146,910 |
) |
|
|
— |
|
|
|
(329,172 |
) |
|
|
(1 |
) |
|
|
(426,604 |
) |
|
|
— |
|
|
|
205,236 |
|
|
|
— |
|
|
|
|
|
|
|
|
|
|
|
|
|
|
|
|
|
|
|
|
|
|
|
|
|
|
|
|
|
|
|
|
|
|
|
|
|
|
|
|
|
|
|
| TOTAL COMPREHENSIVE INCOME |
|
$ |
10,746,077 |
|
|
|
19 |
|
|
$ |
10,643,033 |
|
|
|
19 |
|
|
$ |
30,967,012 |
|
|
|
18 |
|
|
$ |
32,798,974 |
|
|
|
20 |
|
|
|
|
|
|
|
|
|
|
|
|
|
|
|
|
|
|
|
|
|
|
|
|
|
|
|
|
|
|
|
|
|
|
|
|
|
|
|
|
|
|
|
| NET INCOME ATTRIBUTABLE TO |
|
|
|
|
|
|
|
|
|
|
|
|
|
|
|
|
|
|
|
|
|
|
|
|
|
|
|
|
|
|
|
|
| Stockholders of the parent |
|
$ |
10,648,268 |
|
|
|
19 |
|
|
$ |
10,698,297 |
|
|
|
19 |
|
|
$ |
30,484,334 |
|
|
|
18 |
|
|
$ |
31,731,916 |
|
|
|
19 |
|
| Noncontrolling interests |
|
|
244,719 |
|
|
|
— |
|
|
|
273,908 |
|
|
|
1 |
|
|
|
909,282 |
|
|
|
1 |
|
|
|
861,822 |
|
|
|
1 |
|
|
|
|
|
|
|
|
|
|
|
|
|
|
|
|
|
|
|
|
|
|
|
|
|
|
|
|
|
|
|
|
|
|
|
|
|
|
|
|
|
|
|
|
|
$ |
10,892,987 |
|
|
|
19 |
|
|
$ |
10,972,205 |
|
|
|
20 |
|
|
$ |
31,393,616 |
|
|
|
19 |
|
|
$ |
32,593,738 |
|
|
|
20 |
|
|
|
|
|
|
|
|
|
|
|
|
|
|
|
|
|
|
|
|
|
|
|
|
|
|
|
|
|
|
|
|
|
|
|
|
|
|
|
|
|
|
|
| COMPREHENSIVE INCOME ATTRIBUTABLE TO |
|
|
|
|
|
|
|
|
|
|
|
|
|
|
|
|
|
|
|
|
|
|
|
|
|
|
|
|
|
|
|
|
| Stockholders of the parent |
|
$ |
10,506,098 |
|
|
|
19 |
|
|
$ |
10,376,114 |
|
|
|
19 |
|
|
$ |
30,038,507 |
|
|
|
18 |
|
|
$ |
31,942,867 |
|
|
|
19 |
|
| Noncontrolling interests |
|
|
239,979 |
|
|
|
— |
|
|
|
266,919 |
|
|
|
— |
|
|
|
928,505 |
|
|
|
— |
|
|
|
856,107 |
|
|
|
1 |
|
|
|
|
|
|
|
|
|
|
|
|
|
|
|
|
|
|
|
|
|
|
|
|
|
|
|
|
|
|
|
|
|
|
|
|
|
|
|
|
|
|
|
|
|
$ |
10,746,077 |
|
|
|
19 |
|
|
$ |
10,643,033 |
|
|
|
19 |
|
|
$ |
30,967,012 |
|
|
|
18 |
|
|
$ |
32,798,974 |
|
|
|
20 |
|
|
|
|
|
|
|
|
|
|
|
|
|
|
|
|
|
|
|
|
|
|
|
|
|
|
|
|
|
|
|
|
|
|
|
|
|
|
|
|
|
|
|
| EARNINGS PER SHARE (Note 31) |
|
|
|
|
|
|
|
|
|
|
|
|
|
|
|
|
|
|
|
|
|
|
|
|
|
|
|
|
|
|
|
|
| Basic |
|
$ |
1.37 |
|
|
|
|
|
|
$ |
1.38 |
|
|
|
|
|
|
$ |
3.93 |
|
|
|
|
|
|
$ |
4.09 |
|
|
|
|
|
|
|
|
|
|
|
|
|
|
|
|
|
|
|
|
|
|
|
|
|
|
|
|
|
|
|
|
|
|
|
|
|
|
| Diluted |
|
$ |
1.37 |
|
|
|
|
|
|
$ |
1.38 |
|
|
|
|
|
|
$ |
3.92 |
|
|
|
|
|
|
$ |
4.08 |
|
|
|
|
|
|
|
|
|
|
|
|
|
|
|
|
|
|
|
|
|
|
|
|
|
|
|
|
|
|
|
|
|
|
|
|
|
|
| The accompanying notes are an integral part of the consolidated financial statements. |
(Concluded) |
6
CHUNGHWA TELECOM CO., LTD. AND SUBSIDIARIES
CONSOLIDATED STATEMENTS OF CHANGES IN STOCKHOLDERS’ EQUITY
(In Thousands of New Taiwan Dollars)
(Reviewed, Not
Audited)
|
|
|
|
|
|
|
|
|
|
|
|
|
|
|
|
|
|
|
|
|
|
|
|
|
|
|
|
|
|
|
|
|
|
|
|
|
|
|
|
|
| |
|
Equity Attributable to Stockholders of the Parent |
|
|
|
|
|
|
|
| |
|
|
|
|
|
|
|
|
|
|
|
|
|
|
|
|
Other Adjustments |
|
|
|
|
|
|
|
|
|
|
| |
|
|
|
|
|
|
|
|
|
|
|
|
|
|
|
|
Exchange
Differences
Arising
from the
Translation of the
Foreign
Operations |
|
|
Unrealized
Gain (Loss) on Available-for-sale
Financial Assets |
|
|
Total Equity
Attributable to
Stockholders
of the
Parent |
|
|
|
|
|
|
|
| |
|
|
|
|
|
|
|
Retained Earnings |
|
|
|
|
|
|
|
|
|
|
| |
|
Common
Stock |
|
|
Additional
Paid-in
Capital |
|
|
Legal
Reserve |
|
|
Special
Reserve |
|
|
Unappropriated
Earnings |
|
|
|
|
|
Noncontrolling
Interests |
|
|
Total
Stockholders’
Equity |
|
|
|
|
|
|
|
|
|
|
|
|
| BALANCE, JANUARY 1, 2012 |
|
$ |
77,574,465 |
|
|
$ |
190,157,537 |
|
|
$ |
66,122,145 |
|
|
$ |
2,675,894 |
|
|
$ |
29,016,482 |
|
|
$ |
(38,918 |
) |
|
$ |
67,674 |
|
|
$ |
365,575,279 |
|
|
$ |
4,276,384 |
|
|
$ |
369,851,663 |
|
|
|
|
|
|
|
|
|
|
|
|
| Appropriation of 2011 earnings |
|
|
|
|
|
|
|
|
|
|
|
|
|
|
|
|
|
|
|
|
|
|
|
|
|
|
|
|
|
|
|
|
|
|
|
|
|
|
|
|
| Legal reserve |
|
|
— |
|
|
|
— |
|
|
|
4,706,838 |
|
|
|
— |
|
|
|
(4,706,838 |
) |
|
|
— |
|
|
|
— |
|
|
|
— |
|
|
|
— |
|
|
|
— |
|
| Cash dividends paid by Chunghwa |
|
|
— |
|
|
|
— |
|
|
|
— |
|
|
|
— |
|
|
|
(42,361,864 |
) |
|
|
— |
|
|
|
— |
|
|
|
(42,361,864 |
) |
|
|
— |
|
|
|
(42,361,864 |
) |
|
|
|
|
|
|
|
|
|
|
|
| Cash dividends paid by subsidiaries to noncontrolling interests |
|
|
— |
|
|
|
— |
|
|
|
— |
|
|
|
— |
|
|
|
— |
|
|
|
— |
|
|
|
— |
|
|
|
— |
|
|
|
(887,457 |
) |
|
|
(887,457 |
) |
|
|
|
|
|
|
|
|
|
|
|
|
|
|
|
|
|
|
|
|
|
|
|
|
|
|
|
|
|
|
|
|
|
|
|
|
|
|
|
|
|
|
|
|
|
|
|
|
|
|
|
|
| Net income for the nine months ended September 30, 2012 |
|
|
— |
|
|
|
— |
|
|
|
— |
|
|
|
— |
|
|
|
31,731,916 |
|
|
|
— |
|
|
|
— |
|
|
|
31,731,916 |
|
|
|
861,822 |
|
|
|
32,593,738 |
|
|
|
|
|
|
|
|
|
|
|
|
| Other comprehensive income for the nine months ended September 30, 2012 |
|
|
— |
|
|
|
— |
|
|
|
— |
|
|
|
— |
|
|
|
— |
|
|
|
(33,254 |
) |
|
|
244,205 |
|
|
|
210,951 |
|
|
|
(5,715 |
) |
|
|
205,236 |
|
|
|
|
|
|
|
|
|
|
|
|
|
|
|
|
|
|
|
|
|
|
|
|
|
|
|
|
|
|
|
|
|
|
|
|
|
|
|
|
|
|
|
|
|
|
|
|
|
|
|
|
|
| Total comprehensive income for the nine months ended September 30, 2012 |
|
|
— |
|
|
|
— |
|
|
|
— |
|
|
|
— |
|
|
|
31,731,916 |
|
|
|
(33,254 |
) |
|
|
244,205 |
|
|
|
31,942,867 |
|
|
|
856,107 |
|
|
|
32,798,974 |
|
|
|
|
|
|
|
|
|
|
|
|
|
|
|
|
|
|
|
|
|
|
|
|
|
|
|
|
|
|
|
|
|
|
|
|
|
|
|
|
|
|
|
|
|
|
|
|
|
|
|
|
|
| Exercise of employee stock option of subsidiaries |
|
|
— |
|
|
|
3,631 |
|
|
|
— |
|
|
|
— |
|
|
|
— |
|
|
|
— |
|
|
|
— |
|
|
|
3,631 |
|
|
|
35,481 |
|
|
|
39,112 |
|
|
|
|
|
|
|
|
|
|
|
|
| Decrease in noncontrolling interests |
|
|
— |
|
|
|
— |
|
|
|
— |
|
|
|
— |
|
|
|
— |
|
|
|
— |
|
|
|
— |
|
|
|
— |
|
|
|
(107,271 |
) |
|
|
(107,271 |
) |
|
|
|
|
|
|
|
|
|
|
|
|
|
|
|
|
|
|
|
|
|
|
|
|
|
|
|
|
|
|
|
|
|
|
|
|
|
|
|
|
|
|
|
|
|
|
|
|
|
|
|
|
| BALANCE, SEPTEMBER 30, 2012 |
|
$ |
77,574,465 |
|
|
$ |
190,161,168 |
|
|
$ |
70,828,983 |
|
|
$ |
2,675,894 |
|
|
$ |
13,679,696 |
|
|
$ |
(72,172 |
) |
|
$ |
311,879 |
|
|
$ |
355,159,913 |
|
|
$ |
4,173,244 |
|
|
$ |
359,333,157 |
|
|
|
|
|
|
|
|
|
|
|
|
|
|
|
|
|
|
|
|
|
|
|
|
|
|
|
|
|
|
|
|
|
|
|
|
|
|
|
|
|
|
7
|
|
|
|
|
|
|
|
|
|
|
|
|
|
|
|
|
|
|
|
|
|
|
|
|
|
|
|
|
|
|
|
|
|
|
|
|
|
|
|
|
| |
|
Equity Attributable to Stockholders of the Parent |
|
|
|
|
|
|
|
| |
|
|
|
|
|
|
|
|
|
|
|
|
|
|
|
|
Other Adjustments |
|
|
|
|
|
|
|
|
|
|
| |
|
|
|
|
|
|
|
|
|
|
|
|
|
|
|
|
Exchange
Differences
Arising
from the
Translation of the
Foreign
Operations |
|
|
Unrealized
Gain (Loss) on Available-for-sale
Financial Assets |
|
|
Total Equity
Attributable to
Stockholders
of the
Parent |
|
|
|
|
|
|
|
| |
|
|
|
|
|
|
|
Retained Earnings |
|
|
|
|
|
|
|
|
|
|
| |
|
Common
Stock |
|
|
Additional
Paid-in
Capital |
|
|
Legal
Reserve |
|
|
Special
Reserve |
|
|
Unappropriated
Earnings |
|
|
|
|
|
Noncontrolling
Interests |
|
|
Total
Stockholders’
Equity |
|
|
|
|
|
|
|
|
|
|
|
|
| BALANCE, JANUARY 1, 2013 |
|
$ |
77,574,465 |
|
|
$ |
190,162,430 |
|
|
$ |
70,828,983 |
|
|
$ |
2,675,894 |
|
|
$ |
21,483,854 |
|
|
$ |
(96,930 |
) |
|
$ |
257,991 |
|
|
$ |
362,886,687 |
|
|
$ |
4,441,849 |
|
|
$ |
367,328,536 |
|
|
|
|
|
|
|
|
|
|
|
|
| Appropriation of 2012 earnings |
|
|
|
|
|
|
|
|
|
|
|
|
|
|
|
|
|
|
|
|
|
|
|
|
|
|
|
|
|
|
|
|
|
|
|
|
|
|
|
|
| Legal reserve |
|
|
— |
|
|
|
— |
|
|
|
3,990,397 |
|
|
|
— |
|
|
|
(3,990,397 |
) |
|
|
— |
|
|
|
— |
|
|
|
— |
|
|
|
— |
|
|
|
— |
|
| Cash dividends paid by Chunghwa |
|
|
— |
|
|
|
— |
|
|
|
— |
|
|
|
— |
|
|
|
(35,913,099 |
) |
|
|
— |
|
|
|
— |
|
|
|
(35,913,099 |
) |
|
|
— |
|
|
|
(35,913,099 |
) |
|
|
|
|
|
|
|
|
|
|
|
| Cash dividends paid by subsidiaries to noncontrolling interests |
|
|
— |
|
|
|
— |
|
|
|
— |
|
|
|
— |
|
|
|
— |
|
|
|
— |
|
|
|
— |
|
|
|
— |
|
|
|
(811,296 |
) |
|
|
(811,296 |
) |
|
|
|
|
|
|
|
|
|
|
|
|
|
|
|
|
|
|
|
|
|
|
|
|
|
|
|
|
|
|
|
|
|
|
|
|
|
|
|
|
|
|
|
|
|
|
|
|
|
|
|
|
| Other changes in capital surplus |
|
|
|
|
|
|
|
|
|
|
|
|
|
|
|
|
|
|
|
|
|
|
|
|
|
|
|
|
|
|
|
|
|
|
|
|
|
|
|
|
| Cash distributed from capital surplus |
|
|
— |
|
|
|
(5,589,240 |
) |
|
|
— |
|
|
|
— |
|
|
|
— |
|
|
|
— |
|
|
|
— |
|
|
|
(5,589,240 |
) |
|
|
— |
|
|
|
(5,589,240 |
) |
| Change in capital surplus from investments in associates accounted for using equity method |
|
|
— |
|
|
|
3,049 |
|
|
|
— |
|
|
|
— |
|
|
|
— |
|
|
|
— |
|
|
|
— |
|
|
|
3,049 |
|
|
|
3,794 |
|
|
|
6,843 |
|
|
|
|
|
|
|
|
|
|
|
|
| Net income for the nine months ended September 30, 2013 |
|
|
— |
|
|
|
— |
|
|
|
— |
|
|
|
— |
|
|
|
30,484,334 |
|
|
|
— |
|
|
|
— |
|
|
|
30,484,334 |
|
|
|
909,282 |
|
|
|
31,393,616 |
|
|
|
|
|
|
|
|
|
|
|
|
| Other comprehensive income for the nine months ended September 30, 2013 |
|
|
— |
|
|
|
— |
|
|
|
— |
|
|
|
— |
|
|
|
(39,598 |
) |
|
|
3,305 |
|
|
|
(409,534 |
) |
|
|
(445,827 |
) |
|
|
19,223 |
|
|
|
(426,604 |
) |
|
|
|
|
|
|
|
|
|
|
|
|
|
|
|
|
|
|
|
|
|
|
|
|
|
|
|
|
|
|
|
|
|
|
|
|
|
|
|
|
|
|
|
|
|
|
|
|
|
|
|
|
| Total comprehensive income for the nine months ended September 30, 2013 |
|
|
— |
|
|
|
— |
|
|
|
— |
|
|
|
— |
|
|
|
30,444,736 |
|
|
|
3,305 |
|
|
|
(409,534 |
) |
|
|
30,038,507 |
|
|
|
928,505 |
|
|
|
30,967,012 |
|
|
|
|
|
|
|
|
|
|
|
|
|
|
|
|
|
|
|
|
|
|
|
|
|
|
|
|
|
|
|
|
|
|
|
|
|
|
|
|
|
|
|
|
|
|
|
|
|
|
|
|
|
| Exercise of employee stock option of subsidiaries |
|
|
— |
|
|
|
3,658 |
|
|
|
— |
|
|
|
— |
|
|
|
— |
|
|
|
— |
|
|
|
— |
|
|
|
3,658 |
|
|
|
32,878 |
|
|
|
36,536 |
|
|
|
|
|
|
|
|
|
|
|
|
| Compensation cost of employee stock options of a subsidiary |
|
|
— |
|
|
|
— |
|
|
|
— |
|
|
|
— |
|
|
|
— |
|
|
|
— |
|
|
|
— |
|
|
|
— |
|
|
|
45,303 |
|
|
|
45,303 |
|
|
|
|
|
|
|
|
|
|
|
|
|
|
|
|
|
|
|
|
|
|
|
|
|
|
|
|
|
|
|
|
|
|
|
|
|
|
|
|
|
|
|
|
|
|
|
|
|
|
|
|
|
| Employee stock bonus issued by a subsidiary |
|
|
— |
|
|
|
(19 |
) |
|
|
— |
|
|
|
— |
|
|
|
— |
|
|
|
— |
|
|
|
— |
|
|
|
(19 |
) |
|
|
2,468 |
|
|
|
2,449 |
|
|
|
|
|
|
|
|
|
|
|
|
| Decrease in noncontrolling interests |
|
|
— |
|
|
|
— |
|
|
|
— |
|
|
|
— |
|
|
|
— |
|
|
|
— |
|
|
|
— |
|
|
|
— |
|
|
|
(15,236 |
) |
|
|
(15,236 |
) |
|
|
|
|
|
|
|
|
|
|
|
|
|
|
|
|
|
|
|
|
|
|
|
|
|
|
|
|
|
|
|
|
|
|
|
|
|
|
|
|
|
|
|
|
|
|
|
|
|
|
|
|
| BALANCE, SEPTEMBER 30, 2013 |
|
$ |
77,574,465 |
|
|
$ |
184,579,878 |
|
|
$ |
74,819,380 |
|
|
$ |
2,675,894 |
|
|
$ |
12,025,094 |
|
|
$ |
(93,625 |
) |
|
$ |
(151,543 |
) |
|
$ |
351,429,543 |
|
|
$ |
4,628,265 |
|
|
$ |
356,057,808 |
|
|
|
|
|
|
|
|
|
|
|
|
|
|
|
|
|
|
|
|
|
|
|
|
|
|
|
|
|
|
|
|
|
|
|
|
|
|
|
|
|
|
The accompanying notes are an integral part of the consolidated financial statements.
8
CHUNGHWA TELECOM CO., LTD. AND SUBSIDIARIES
CONSOLIDATED STATEMENTS OF CASH FLOWS
(In Thousands of
New Taiwan Dollars)
(Reviewed, Not Audited)
|
|
|
|
|
|
|
|
|
| |
|
Nine Months Ended September 30 |
|
| |
|
2013 |
|
|
2012 |
|
|
|
|
| CASH FLOWS FROM OPERATING ACTIVITIES |
|
|
|
|
|
|
|
|
| Income before income tax |
|
$ |
37,673,536 |
|
|
$ |
38,786,461 |
|
| Adjustments to reconcile income before income tax to net cash provided by operating activities: |
|
|
|
|
|
|
|
|
| Depreciation |
|
|
23,110,206 |
|
|
|
23,338,746 |
|
| Amortization |
|
|
914,917 |
|
|
|
833,504 |
|
| Provision for (reversal of) doubtful accounts |
|
|
173,374 |
|
|
|
(1,450,406 |
) |
| Interest expenses |
|
|
23,920 |
|
|
|
16,030 |
|
| Interest income |
|
|
(471,040 |
) |
|
|
(586,191 |
) |
| Dividend income |
|
|
(43,989 |
) |
|
|
(18,883 |
) |
| Compensation cost of employee stock options |
|
|
45,303 |
|
|
|
— |
|
| Share of the profit of associates and jointly controlled entities accounted for using equity method |
|
|
(525,180 |
) |
|
|
(461,938 |
) |
| Impairment loss on available-for-sale financial assets |
|
|
— |
|
|
|
26,779 |
|
| Impairment loss on financial assets carried at cost |
|
|
28,692 |
|
|
|
111,614 |
|
| Impairment loss on goodwill |
|
|
18,055 |
|
|
|
— |
|
| Provision for inventory and obsolescence |
|
|
133,054 |
|
|
|
14,455 |
|
| Impairment loss on property, plant and equipment |
|
|
2,262 |
|
|
|
— |
|
| Impairment loss on investment properties |
|
|
— |
|
|
|
1,261,365 |
|
| Gain on disposal of financial instruments |
|
|
(76,291 |
) |
|
|
(65,343 |
) |
| Loss on disposal or abandonment of property, plant and equipment |
|
|
21,914 |
|
|
|
4,915 |
|
| Valuation loss (gain) on financial assets and liabilities at fair value through profit or loss, net |
|
|
1,075 |
|
|
|
(31,282 |
) |
| Gain on foreign exchange |
|
|
(7,881 |
) |
|
|
(18,491 |
) |
| Changes in operating assets and liabilities: |
|
|
|
|
|
|
|
|
| Decrease (increase) in: |
|
|
|
|
|
|
|
|
| Financial assets held for trading |
|
|
9,361 |
|
|
|
27,689 |
|
| Trade notes and accounts receivable |
|
|
(155,459 |
) |
|
|
(540,259 |
) |
| Receivables from related parties |
|
|
(4,428 |
) |
|
|
5,849 |
|
| Inventories |
|
|
(1,024,052 |
) |
|
|
748,590 |
|
| Other current monetary assets |
|
|
(216,867 |
) |
|
|
299,217 |
|
| Prepayment |
|
|
(3,086,921 |
) |
|
|
(3,025,177 |
) |
| Other current assets |
|
|
517,357 |
|
|
|
(1,588,255 |
) |
| Increase (decrease) in: |
|
|
|
|
|
|
|
|
| Trade notes and accounts payable |
|
|
(1,137,278 |
) |
|
|
(1,837,280 |
) |
| Payables to related parties |
|
|
(371,062 |
) |
|
|
(311,104 |
) |
| Other payables |
|
|
(2,750,149 |
) |
|
|
(4,332,435 |
) |
| Provisions |
|
|
(16,611 |
) |
|
|
(73,498 |
) |
| Advance receipts |
|
|
(366,646 |
) |
|
|
(1,097,699 |
) |
| Other current liabilities |
|
|
(29,394 |
) |
|
|
(89,872 |
) |
| Deferred revenue |
|
|
(71,470 |
) |
|
|
(348,967 |
) |
| Accrued pension liabilities |
|
|
213,456 |
|
|
|
84,035 |
|
|
|
|
|
|
|
|
|
|
| Cash generated from operations |
|
|
52,531,764 |
|
|
|
49,682,169 |
|
(Continued)
9
CHUNGHWA TELECOM CO., LTD. AND SUBSIDIARIES
CONSOLIDATED STATEMENTS OF CASH FLOWS
(In Thousands of
New Taiwan Dollars)
(Reviewed, Not Audited)
|
|
|
|
|
|
|
|
|
| |
|
Nine Months Ended September 30 |
|
| |
|
2013 |
|
|
2012 |
|
|
|
|
| Interest paid |
|
|
(24,004 |
) |
|
|
(22,988 |
) |
| Income tax paid |
|
|
(7,503,973 |
) |
|
|
(8,170,675 |
) |
|
|
|
|
|
|
|
|
|
|
|
|
| Net cash provided by operating activities |
|
|
45,003,787 |
|
|
|
41,488,506 |
|
|
|
|
|
|
|
|
|
|
|
|
|
| CASH FLOWS FROM INVESTING ACTIVITIES |
|
|
|
|
|
|
|
|
| Acquisition of designated financial assets at fair value through profit or loss |
|
|
— |
|
|
|
(29,548 |
) |
| Proceeds from disposal of designated financial assets at fair value through profit or loss |
|
|
— |
|
|
|
81,997 |
|
| Acquisition of available-for-sale financial assets |
|
|
(1,762,132 |
) |
|
|
(4,452,278 |
) |
| Proceeds from disposal of available-for-sale financial assets |
|
|
3,984,458 |
|
|
|
1,577,095 |
|
| Acquisition of time deposits and negotiable certificate of deposit with maturities of more than three months |
|
|
(17,845,775 |
) |
|
|
(13,890,427 |
) |
| Proceeds from disposal of time deposits and negotiable certificate of deposit with maturities of more than three months |
|
|
37,724,255 |
|
|
|
47,537,609 |
|
| Acquisition of held-to-maturity financial assets |
|
|
— |
|
|
|
(3,865,172 |
) |
| Proceeds from disposal of held-to-maturity financial assets |
|
|
2,396,950 |
|
|
|
1,525,895 |
|
| Acquisition of financial assets carried at cost |
|
|
(35,785 |
) |
|
|
(35,972 |
) |
| Proceeds from disposal of financial assets carried at cost |
|
|
4,985 |
|
|
|
69,553 |
|
| Capital reduction of financial assets carried at cost |
|
|
18,000 |
|
|
|
20,000 |
|
| Proceeds from disposal of hedging derivative assets |
|
|
15,288 |
|
|
|
— |
|
| Derecognition of hedging derivative liabilities |
|
|
(108,433 |
) |
|
|
— |
|
| Acquisition of investments accounted for using equity method |
|
|
(60,000 |
) |
|
|
(25,912 |
) |
| Capital reduction of associates |
|
|
16,387 |
|
|
|
— |
|
| Acquisition of property, plant and equipment |
|
|
(23,307,270 |
) |
|
|
(22,556,002 |
) |
| Proceeds from disposal of property, plant and equipment |
|
|
35,847 |
|
|
|
33,025 |
|
| Acquisition of intangible assets |
|
|
(511,871 |
) |
|
|
(399,376 |
) |
| Decrease (increase) in noncurrent assets |
|
|
(910,676 |
) |
|
|
241,724 |
|
| Interest received |
|
|
539,364 |
|
|
|
618,459 |
|
| Cash dividends received |
|
|
424,437 |
|
|
|
313,741 |
|
|
|
|
|
|
|
|
|
|
|
|
|
| Net cash provided by investing activities |
|
|
618,029 |
|
|
|
6,764,411 |
|
|
|
|
|
|
|
|
|
|
|
|
|
| CASH FLOWS FROM FINANCING ACTIVITIES |
|
|
|
|
|
|
|
|
| Proceeds from short-term loans |
|
|
1,238,522 |
|
|
|
615,000 |
|
| Repayment of short-term loans |
|
|
(274,773 |
) |
|
|
(560,000 |
) |
| Repayment of long-term loans |
|
|
(358,372 |
) |
|
|
(76,770 |
) |
| Customers’ deposits refunded |
|
|
(70,400 |
) |
|
|
(82,888 |
) |
| Increase (decrease) in other liabilities |
|
|
(76,533 |
) |
|
|
70,516 |
|
| Cash dividends and cash distributed from additional paid-in capital |
|
|
(41,502,339 |
) |
|
|
(42,361,864 |
) |
| Proceeds from exercise of employee stock option granted by subsidiary |
|
|
36,536 |
|
|
|
39,112 |
|
| Cash dividends paid by subsidiaries to noncontrolling interests |
|
|
(811,296 |
) |
|
|
(887,457 |
) |
(Continued)
10
CHUNGHWA TELECOM CO., LTD. AND SUBSIDIARIES
CONSOLIDATED STATEMENTS OF CASH FLOWS
(In Thousands of
New Taiwan Dollars)
(Reviewed, Not Audited)
|
|
|
|
|
|
|
|
|
| |
|
Nine Months Ended September 30 |
|
| |
|
2013 |
|
|
2012 |
|
|
|
|
| Change in other noncontrolling interests |
|
|
(14,850 |
) |
|
|
— |
|
|
|
|
|
|
|
|
|
|
|
|
|
| Net cash used in financing activities |
|
|
(41,833,505 |
) |
|
|
(43,244,351 |
) |
|
|
|
|
|
|
|
|
|
|
|
|
| EFFECT OF EXCHANGE RATE CHANGES ON CASH AND CASH EQUIVALENTS |
|
|
23,130 |
|
|
|
72,515 |
|
|
|
|
|
|
|
|
|
|
|
|
|
| NET INCREASE IN CASH AND CASH EQUIVALENTS |
|
|
3,811,441 |
|
|
|
5,081,081 |
|
|
|
|
| CASH AND CASH EQUIVALENTS, BEGINNING OF PERIOD |
|
|
30,938,472 |
|
|
|
26,407,196 |
|
|
|
|
|
|
|
|
|
|
|
|
|
| CASH AND CASH EQUIVALENTS, END OF PERIOD |
|
$ |
34,749,913 |
|
|
$ |
31,488,277 |
|
|
|
|
|
|
|
|
|
|
| The accompanying notes are an integral part of the consolidated financial statements. |
(Concluded) |
11
CHUNGHWA TELECOM CO., LTD. AND SUBSIDIARIES
NOTES TO CONSOLIDATED FINANCIAL STATEMENTS
NINE MONTHS
ENDED SEPTEMBER 30, 2013 AND 2012
(In Thousands of New Taiwan Dollars, Unless Stated Otherwise)
(Reviewed, Not Audited)
Chunghwa Telecom Co., Ltd. (“Chunghwa”) was incorporated on
July 1, 1996 in the Republic of China (“ROC”) pursuant to the Article 30 of the Telecommunications Act. Chunghwa is a company limited by shares and, prior to August 2000, was wholly owned by the Ministry of Transportation and
Communications (“MOTC”). Prior to July 1, 1996, the current operations of Chunghwa were carried out under the Directorate General of Telecommunications (“DGT”). The DGT was established by the MOTC in June 1943 to take
primary responsibility in the development of telecommunications infrastructure and to formulate policies related to telecommunications. On July 1, 1996, the telecom operations of the DGT were spun-off to as Chunghwa which continues to carry out
the business and the DGT continues to be the industry regulator.
As the dominate telecommunications service provider of domestic and
international fixed-line, Global System for Mobile Communications (“GSM”), and Third Generation (“3G”) in the ROC, Chunghwa is subject to additional regulations imposed by ROC.
Effective August 12, 2005, the MOTC had completed the process of privatizing Chunghwa by reducing the government ownership to below 50% in
various stages. In July 2000, Chunghwa received approval from the Securities and Futures Commission (the “SFC”) for a domestic initial public offering and its common shares were listed and traded on the Taiwan Stock Exchange (the
“TWSE”) on October 27, 2000. Certain of Chunghwa’s common shares had been sold, in connection with the foregoing privatization plan, in domestic public offerings at various dates from August 2000 to July 2003. Certain of
Chunghwa’s common shares had also been sold in an international offering of securities in the form of American Depository Shares (“ADS”) on July 17, 2003 and were listed and traded on the New York Stock Exchange (the
“NYSE”). The MOTC sold common shares of Chunghwa by auction in the ROC on August 9, 2005 and completed the second international offering on August 10, 2005. Upon completion of the share transfers associated with these offerings
on August 12, 2005, the MOTC owned less than 50% of the outstanding shares of Chunghwa and completed the privatization plan.
Chunghwa
together with its subsidiaries are hereinafter referred to collectively as “the Company”.
The Company use New Taiwan dollars as
the functional currency. Since the Company is listed in Taiwan, the consolidated financial statements are presented in New Taiwan dollars in order to increase the comparability and consistency.
| 2. |
APPROVAL OF FINANCIAL STATEMENTS |
The consolidated financial statements were approved
and authorized for issue by the Board of Directors on October 31, 2013.
12
| 3. |
SUMMARY OF SIGNIFICANT ACCOUNTING POLICIES |
On May 14, 2009, the Financial
Supervisory Commission (FSC) announced the “Framework for Adoption of International Financial Reporting Standards by Companies in the ROC.” In this framework, starting 2013, companies with shares listed on the TWSE or traded on the Taiwan
GreTai Securities Market or Emerging Stock Market should prepare their financial statements in accordance with the Guidelines Governing the Preparation of Financial Reports by Securities Issuers and the International Financial Reporting Standards
(IFRS), International Accounting Standards (IAS), the International Financial Reporting Interpretations Committee (IFRIC) and Interpretations Committee (SIC) Interpretations as well as related guidance translated by Accounting Research and
Development Foundation (ARDF) endorsed by the FSC (collectively, “Taiwan-IFRSs”).
The Company’s date of transition to
Taiwan-IFRSs is January 1, 2012, and the effect of the transition to Taiwan-IFRSs is disclosed in Note 43.
Statement of
Compliance
The accompany consolidated financial statements have been prepared in conformity with the Guidelines Governing the
Preparation of Financial Reports by Securities Issuers, related laws and regulations, and IFRS 1, “First-time adoption of International Financial Reporting Standards,” (IFRS 1) and IAS 34, “Interim Financial Reporting,” endorsed
by the FSC. The consolidated financial statements do not present full disclosures required for a complete set of Taiwan-IFRSs annual consolidated financial statements.
Basis of Preparation
The
consolidated financial statements have been prepared on the historical cost basis except for certain financial instruments that are measured at revalued amounts or fair values, as explained in the accounting policies below. Historical cost is
generally based on the fair value of the consideration given in exchange for assets.
The opening balance sheet at the date of transition
is prepared with the recognition and measurement required by IFRS 1. According to IFRS 1, the Company is required to apply each effective IFRS retrospectively in its opening balance sheet at the date of transition to Taiwan-IFRSs; except for
optional exemptions and mandatory exceptions to such retrospective application provided under IFRS 1. The main optional exemptions the Company adopted are described in Note 43.
Current and Noncurrent Assets and Liabilities
Current assets include cash and cash equivalents, and those assets held primarily for trading purposes or to be realized, sold or consumed
within one year from the balance sheet date. All other assets are classified as noncurrent. Current liabilities are obligations incurred for trading purposes or to be settled within one year from the balance sheet date. All other liabilities are
classified as noncurrent.
Light Era Development Co., Ltd. (LED) engages mainly in development of property for rent and sale. The assets
and liabilities of LED related to property development within its operating cycle, which is over one year, are classified as current items.
Basis of Consolidation
| |
a. |
The basis for the consolidated financial statements |
The consolidated financial statements
incorporate the financial statements of Chunghwa and entities controlled by the Company (its subsidiaries). Control is achieved where the Company has the power to govern the financial and operating policies of an entity so as to obtain benefits from
its activities.
When necessary, adjustments are made to the financial statements of subsidiaries to bring their accounting policies in
line with those used by the Company.
13
All intra-group transactions, balances, income and expenses are eliminated in full upon
consolidation.
The noncontrolling interests in the subsidiaries and the equity attributable to stockholders are presented separately.
Allocation of comprehensive income to the noncontrolling interests
Total comprehensive income of subsidiaries is attributed to the owners of the Company and to the noncontrolling interests even if it results in
the noncontrolling interests having a deficit balance.
Changes in the Company’s ownership interests in subsidiaries
Changes in the Company’s ownership interests in subsidiaries that do not result in the Company losing control over the subsidiaries are
accounted for as equity transactions. The carrying amounts of the Company’s interests and the noncontrolling interests are adjusted to reflect the changes in their relative interests in the subsidiaries. Any difference between the amount by
which the noncontrolling interests are adjusted and the fair value of the consideration paid or received is recognized directly in equity and attributed to owners of the Company.
| |
b. |
The subsidiaries in the consolidated financial statements |
The detail information of the
subsidiaries at the end of reporting period was as follows:
|
|
|
|
|
|
|
|
|
|
|
|
|
|
|
|
|
|
|
|
|
|
|
|
|
| |
|
|
|
|
|
Percentage of Ownership |
|
|
|
|
| Name of Investor |
|
Name of Investee |
|
Main Businesses and Products |
|
September 30,
2013 |
|
|
December 31,
2012 |
|
|
September 30,
2012 |
|
|
January 1,
2012 |
|
|
Note |
|
|
|
|
|
|
|
|
|
| Chunghwa Telecom Co., Ltd. |
|
Senao International Co., Ltd. (“SENAO”) |
|
Selling and maintaining mobile phones and its peripheral products |
|
|
28 |
|
|
|
28 |
|
|
|
28 |
|
|
|
28 |
|
|
|
1 |
) |
|
|
Light Era Development Co., Ltd. (“LED”) |
|
Housing, office building development, rent and sale services |
|
|
100 |
|
|
|
100 |
|
|
|
100 |
|
|
|
100 |
|
|
|
|
|
|
|
Donghwa Telecom Co., Ltd. (“DHT”) |
|
International telecommunications IP fictitious internet and internet transfer services |
|
|
100 |
|
|
|
100 |
|
|
|
100 |
|
|
|
100 |
|
|
|
|
|
|
|
Chunghwa Telecom Singapore Pte., Ltd. (“CHTS”) |
|
Telecommunication wholesale, internet transfer services international data and long distance call wholesales to carriers |
|
|
100 |
|
|
|
100 |
|
|
|
100 |
|
|
|
100 |
|
|
|
|
|
|
|
Chunghwa System Integration Co., Ltd. (“CHSI”) |
|
Providing communication and information aggregative services |
|
|
100 |
|
|
|
100 |
|
|
|
100 |
|
|
|
100 |
|
|
|
|
|
|
|
Chunghwa Investment Co., Ltd. (“CHI”) |
|
Investment |
|
|
89 |
|
|
|
89 |
|
|
|
89 |
|
|
|
89 |
|
|
|
|
|
|
|
CHIEF Telecom Inc. (“CHIEF”) |
|
Internet communication and internet data center (“IDC”) service |
|
|
69 |
|
|
|
69 |
|
|
|
69 |
|
|
|
69 |
|
|
|
|
|
|
|
Chunghwa International Yellow Pages Co., Ltd. (“CHYP”) |
|
Yellow pages sales and advertisement services |
|
|
100 |
|
|
|
100 |
|
|
|
100 |
|
|
|
100 |
|
|
|
|
|
|
|
Prime Asia Investments Group Ltd. (B.V.I.) (“Prime Asia”) |
|
Investment |
|
|
100 |
|
|
|
100 |
|
|
|
100 |
|
|
|
100 |
|
|
|
|
|
|
|
Spring House Entertainment Tech. Inc. (“SHE”) |
|
Network services, producing digital entertainment contents and broadband visual sound terrace development |
|
|
56 |
|
|
|
56 |
|
|
|
56 |
|
|
|
56 |
|
|
|
|
|
|
|
Chunghwa Telecom Global, Inc. (“CHTG”) |
|
International data and internet services and long distance call wholesales to carriers |
|
|
100 |
|
|
|
100 |
|
|
|
100 |
|
|
|
100 |
|
|
|
|
|
|
|
Chunghwa Telecom Vietnam Co., Ltd. (“CHTV”) |
|
Information and communications technology, international circuit, and intelligent energy network service |
|
|
100 |
|
|
|
100 |
|
|
|
100 |
|
|
|
100 |
|
|
|
|
|
(Continued)
14
|
|
|
|
|
|
|
|
|
|
|
|
|
|
|
|
|
|
|
|
|
|
|
|
|
| |
|
|
|
|
|
Percentage of Ownership |
|
|
|
|
| Name of Investor |
|
Name of Investee |
|
Main Businesses and Products |
|
September 30,
2013 |
|
|
December 31,
2012 |
|
|
September 30,
2012 |
|
|
January 1,
2012 |
|
|
Note |
|
|
|
Smartfun Digital Co., Ltd. (“SFD”) |
|
Software retail |
|
|
65 |
|
|
|
65 |
|
|
|
65 |
|
|
|
65 |
|
|
|
|
|
|
|
Chunghwa Telecom Japan Co., Ltd. (“CHTJ”) |
|
Telecom business, information process and information provide service, development and sale of software and consulting services in
telecommunication |
|
|
100 |
|
|
|
100 |
|
|
|
100 |
|
|
|
100 |
|
|
|
|
|
|
|
Chunghwa Sochamp Technology Inc. (“CHST”) |
|
License plate recognition system |
|
|
51 |
|
|
|
51 |
|
|
|
51 |
|
|
|
51 |
|
|
|
|
|
|
|
Honghwa Human Resources Co., Ltd. (“HHR”) |
|
Human resources service |
|
|
100 |
|
|
|
— |
|
|
|
— |
|
|
|
— |
|
|
|
2 |
) |
|
|
New Prospect Investments Holdings Ltd. (B.V.I.) (“New Prospect”) |
|
Investment |
|
|
100 |
|
|
|
100 |
|
|
|
100 |
|
|
|
100 |
|
|
|
|
|
|
|
|
|
|
|
|
|
| Senao International Co., Ltd. |
|
Senao International (Samoa) Holding Ltd. (“SIS”) |
|
International investment |
|
|
100 |
|
|
|
100 |
|
|
|
100 |
|
|
|
100 |
|
|
|
|
|
|
|
|
|
|
|
|
|
| CHIEF Telecom Inc. |
|
Unigate Telecom Inc. (“Unigate”) |
|
Telecommunication and internet service |
|
|
100 |
|
|
|
100 |
|
|
|
100 |
|
|
|
100 |
|
|
|
|
|
|
|
Chief International Corp. (“CIC”) |
|
Internet communication and internet data center (“IDC”) service |
|
|
100 |
|
|
|
100 |
|
|
|
100 |
|
|
|
100 |
|
|
|
|
|
|
|
|
|
|
|
|
|
| Chunghwa System Integrated Co., Ltd. |
|
Concord Technology Co., Ltd. (“Concord”) |
|
Investment |
|
|
100 |
|
|
|
100 |
|
|
|
100 |
|
|
|
100 |
|
|
|
|
|
|
|
|
|
|
|
|
|
| Spring House Entertainment Tech. Inc. |
|
Ceylon Innovation Ltd. (“CEI”) |
|
International trading, general advertisement and book publishment service |
|
|
100 |
|
|
|
100 |
|
|
|
100 |
|
|
|
100 |
|
|
|
|
|
|
|
|
|
|
|
|
|
| Light Era Development Co., Ltd. |
|
Yao Yong Real Property Co., Ltd. (“YYRP”) |
|
Real estate management and leasing business |
|
|
100 |
|
|
|
100 |
|
|
|
100 |
|
|
|
100 |
|
|
|
|
|
|
|
|
|
|
|
|
|
| Chunghwa Investment Co., Ltd. |
|
Chunghwa Precision Test Tech Co., Ltd. (“CHPT”) |
|
Semiconductor testing components and printed circuit board industry production and marketing of electronic products |
|
|
51 |
|
|
|
53 |
|
|
|
53 |
|
|
|
53 |
|
|
|
3 |
) |
|
|
Chunghwa Investment Holding Co., Ltd. (“CIHC”) |
|
Investment |
|
|
100 |
|
|
|
100 |
|
|
|
100 |
|
|
|
100 |
|
|
|
|
|
|
|
|
|
|
|
|
|
| Concord Technology Co., Ltd. |
|
Glory Network System Service (Shanghai) Co., Ltd. (“GNSS (Shanghai)”) |
|
Planning and design of software and hardware system services and integration of information system |
|
|
100 |
|
|
|
100 |
|
|
|
100 |
|
|
|
100 |
|
|
|
|
|
|
|
|
|
|
|
|
|
| Chunghwa Precision Test Tech. Co., Ltd. |
|
Chunghwa Precision Test Tech. USA Corporation (“CHPT (US)”) |
|
Semiconductor testing components and printed circuit board industry production and marketing of electronic products |
|
|
100 |
|
|
|
100 |
|
|
|
100 |
|
|
|
100 |
|
|
|
|
|
|
|
CHPT Japan Co., Ltd. (“CHPT (JP)”) |
|
Sale and maintenance of electronic parts and machinery processed products, and design of printed circuit board |
|
|
100 |
|
|
|
— |
|
|
|
— |
|
|
|
— |
|
|
|
4 |
) |
|
|
Chunghwa Precision Test Tech. International, Ltd. (“CHPT (International)”) |
|
Wholesale electronic materials, electronic materials and general retail investment industry |
|
|
100 |
|
|
|
— |
|
|
|
— |
|
|
|
— |
|
|
|
5 |
) |
|
|
|
|
|
|
|
|
| Senao International (Samoa) Holding Ltd. |
|
Senao International HK Limited (“SIHK”) |
|
International investment |
|
|
100 |
|
|
|
100 |
|
|
|
100 |
|
|
|
100 |
|
|
|
|
|
(Continued)
15
|
|
|
|
|
|
|
|
|
|
|
|
|
|
|
|
|
|
|
|
|
|
|
|
|
| |
|
|
|
|
|
Percentage of Ownership |
|
|
|
|
| Name of Investor |
|
Name of Investee |
|
Main Businesses and Products |
|
September 30,
2013 |
|
|
December 31,
2012 |
|
|
September 30,
2012 |
|
|
January 1,
2012 |
|
|
Note |
|
|
|
|
|
|
|
|
|
| Chunghwa Investment Holding Co., Ltd. |
|
CHI One Investment Co., Limited (“COI”) |
|
Investment |
|
|
100 |
|
|
|
100 |
|
|
|
100 |
|
|
|
100 |
|
|
|
|
|
|
|
|
|
|
|
|
|
| Senao International HK Limited |
|
Senao Trading (Fujian) Co., Ltd. (“STF”) |
|
Information technology services and sale of communication products |
|
|
100 |
|
|
|
100 |
|
|
|
100 |
|
|
|
100 |
|
|
|
|
|
|
|
Senao International Trading (Shanghai) Co., Ltd. (“SITS”) |
|
Information technology services and sale of communication products |
|
|
100 |
|
|
|
100 |
|
|
|
100 |
|
|
|
100 |
|
|
|
|
|
|
|
Senao International Trading (Shanghai) Co., Ltd. (“SEITS”) |
|
Information technology services and maintenance of communication products |
|
|
100 |
|
|
|
100 |
|
|
|
100 |
|
|
|
100 |
|
|
|
|
|
|
|
Senao International Trading (Jiangsu) Co., Ltd. (“SITJ”) |
|
Information technology services and sale of communication products |
|
|
100 |
|
|
|
100 |
|
|
|
100 |
|
|
|
100 |
|
|
|
|
|
|
|
|
|
|
|
|
|
| Prime Asia Investments Group, Ltd. (B.V.I.) |
|
Chunghwa Hsingta Co., Ltd. (“CHC”) |
|
Investment |
|
|
100 |
|
|
|
100 |
|
|
|
100 |
|
|
|
100 |
|
|
|
|
|
|
|
|
|
|
|
|
|
| Chunghwa Hsingta Company Ltd. |
|
Chunghwa Telecom (China) Co., Ltd. (“CTC”) |
|
Planning and design of energy conservation and software and hardware system services, and integration of information system |
|
|
100 |
|
|
|
100 |
|
|
|
100 |
|
|
|
100 |
|
|
|
|
|
|
|
Jiangsu Zhenhua Information Technology Company, LLC. (“JZIT”) |
|
Intelligent energy conserving and intelligent building services |
|
|
75 |
|
|
|
75 |
|
|
|
75 |
|
|
|
— |
|
|
|
6 |
) |
|
|
Hua-Xiong Information Technology Co., Ltd. (“HXIT”) |
|
Intelligent system and energy saving system services in buildings |
|
|
51 |
|
|
|
51 |
|
|
|
— |
|
|
|
— |
|
|
|
7 |
) |
(Concluded)
| 1) |
The Company’s equity ownership of SENAO decreased from 28.44% as of January 1, 2012 to 28.30%, 28.30% and 28.22% as of September 30, 2012, December 31, 2012 and September 30, 2013,
respectively, due to the exercise of options by employees that were granted before 2007. |
| 2) |
Chunghwa established 100% owned subsidiary of HHR in January 2013. |
| 3) |
The Company’s equity ownership of CHPT decreased to 50.62% as of September 30, 2013 due to the exercise of options by employees that were granted in 2008 and issue employee stock bonus. |
16
| 4) |
CHPT established 100% owned subsidiary of CHPT (JP) in January 2013. |
| 5) |
CHPT established 100% owned subsidiary of CHPT (International) in July 2013. |
| 6) |
JZIT was established in January 2012 and CHC owns 75% ownership of JZIT. |
| 7) |
HXIT was established in November 2012 and CHC owns 51% ownership of HXIT. |
The following
diagram presents information regarding the relationship and ownership percentages between Chunghwa and its subsidiaries as of September 30, 2013:
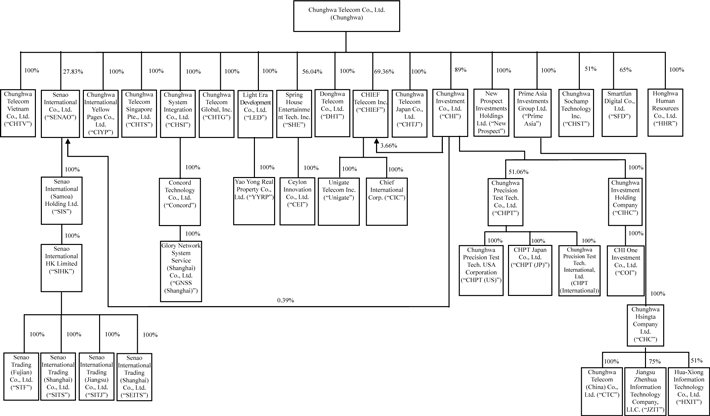
Business Combination
Acquisitions of businesses are accounted for using the acquisition method. The consideration transferred in a business combination is measured
at fair value, which is calculated as the sum of the acquisition-date fair values of the assets transferred by the Company, liabilities incurred by the Company to the former owners of the acquiree and the equity interests issued by the Company in
exchange for control of the acquiree. Acquisition-related costs are generally recognized in profit or loss as incurred.
Foreign
Currencies
In preparing the financial statements of each individual entity, transactions in currencies other than the entity’s
functional currency (foreign currencies) are recognized at the rates of exchange prevailing at the dates of the transactions. At the end of each balance sheet date, monetary items denominated in foreign currencies are retranslated at the rates
prevailing at that date. Non-monetary items carried at fair value that are denominated in foreign currencies are retranslated at the rates prevailing at the date when the fair value was determined. Non-monetary items that are measured in terms of
historical cost in a foreign currency are not retranslated.
17
Exchange differences on monetary items denominated in foreign currencies are recognized in profit
or loss when the transactions occur.
Foreign-currency nonmonetary assets or liabilities (such as equity instruments) that are carried at
fair value are revalued using prevailing exchange rates at the balance sheet date and related exchange differences are recognized in profit or loss. Conversely, when the fair value changes were recognized in other comprehensive income, related
exchange difference shall be recognized in other comprehensive income.
For the purposes of presenting consolidated financial statements,
the assets and liabilities of the Company’s foreign operations are translated into New Taiwan dollars using exchange rates prevailing at the end of each reporting period. Income and expense items are translated at the average exchange rates for
the period. Exchange differences arising, if any, are recognized in other comprehensive income and accumulated in equity attributed to noncontrolling interests as appropriate.
Cash Equivalents
Cash
equivalents are short term investment with maturities of less than three months, including treasury bills, commercial paper, time deposits and negotiable certificate of deposit. The carrying amount approximates fair value.
Inventories
Inventories
are stated at the lower of cost (weighted-average cost) or net realizable value item by item, except for those that may be appropriate to group items of similar or related inventories. Net realizable value is the estimated selling price of
inventories less all estimated costs of completion and costs necessary to make the sale. The calculation of the cost of inventory is derived using the weighted-average method.
Buildings and Lands Consigned to Constructing Firm
Inventories of LED are stated at the lower of cost or net realizable value item by item, except for those that may be appropriate to group as
similar items or related inventories. Land acquired before construction is classified as land held for development, and then reclassified as land held under development after LED begins its construction project. Prepayments for licensing and other
miscellaneous costs have been capitalized as part of inventory.
When using the completed-contract method for its construction projects,
LED recognizes the proceeds from customers as advances from customers for land and building before the construction project is completed. After completion of the construction project and ownership is transferred to the customers, LED recognizes the
relevant revenues.
Investments in Associates
An associate is an entity over which the Company has significant influence and that is neither a subsidiary nor an interest in a joint venture.
Significant influence is the power to participate in the financial and operating policy decisions of the investee but is not control or joint control over those policies.
The operating results and assets and liabilities of associates are incorporated in these consolidated financial statements using the equity
method of accounting. Under the equity method, an investment in an associate is initially recognized in the consolidated balance sheet at cost and adjusted thereafter to recognize the Company’s share of the profit or loss and other
comprehensive income of the associate. The Company also recognizes the changes in the Company’s share of equity of associates attributable to the Company.
18
When the Company subscribes for additional associate’s new shares at a percentage different
from its existing ownership percentage, the resulting carrying amount of the investment differs from the amount of the Company’s proportionate interest in the associate. The Company records such a difference as an adjustment to investments with
the corresponding amount charged or credited to capital surplus, with the balance charged to retained earnings.
Any excess of the cost of
acquisition over the Company’s share of the net fair value of the identifiable assets, liabilities and contingent liabilities of an associate recognized at the date of acquisition is recognized as goodwill, which is included in the carrying
amount of the investment and shall not be amortized.
When an indication of impairment is assessed with objective evidence, the impairment
is recognized in profit or loss as incurred.
When a consolidated entity transacts with its associate, unrealized profits and losses
resulting from the transactions with the associate are deferred in proportion to Chunghwa’s ownership percentage in the associates until they are realized through transactions with third parties.
Jointly Controlled Entities
A jointly controlled entity is a contractual arrangement to set up another entity whereby the Company and other parties undertake an economic
activity that is subject to joint control.
The operating results and assets and liabilities of jointly controlled entities are
incorporated in these consolidated financial statements using the equity method of accounting. Under the equity method, an investment in a jointly controlled entity is initially recognized in the consolidated balance sheet at cost and adjusted
thereafter to recognize the Company’s share of the profit or loss and other comprehensive income of the jointly controlled entity. The Company also recognized the changes in the share of equity of jointly controlled entity.
Property, Plant and Equipment
When future economic benefits are expected to inflow to the Company and costs can be evaluated reliably, property, plant and equipment that are
held for use in the production or supply of goods or services, or for administrative purposes for over one year are measured at costs. Subsequent to initial recognition, property, plant and equipment are measured at cost less accumulated
depreciation and accumulated impairment.
Depreciation is recognized so as to write off the cost of the assets less their residual values
over their useful lives, and it is computed using the straight-line method. The estimated useful lives, residual values and depreciation method are reviewed at least at the end of each year, with the effect of any changes in estimates accounted for
on a prospective basis.
Upon sale or disposal of property, plant and equipment, the related cost, accumulated depreciation and accumulated
impairment losses are deducted from the corresponding accounts, and any gain or loss is recognized in profit or loss as incurred.
Investment Properties
Investment properties are properties held to earn rentals and/or for capital appreciation (including property under construction for such
purposes). Investment properties also include land held for a currently undetermined future use as such land is regarded as held for capital appreciation.
Investment properties are measured initially at cost, including transaction costs. Subsequent to initial recognition, investment properties are
measured at cost less accumulated depreciation and accumulated impairment.
19
The Company uses the straight line method to depreciate the assets, that is, to evenly allocate
the cost less residual value over the expected useful lives of the investment properties.
Upon disposal of investment properties, the
related cost, accumulated depreciation and accumulated impairment losses are deducted from the corresponding accounts, and any gain or loss is recognized in profit or loss as incurred.
Goodwill
Goodwill
arising on a business combination is initially carried at cost at the acquisition date. Subsequent to initial recognition, goodwill arising on a business combination is measured at cost less accumulated amortization and accumulated impairment
losses.
For the purpose of impairment testing, goodwill is allocated to each of the Company’s cash-generating units or groups of
cash-generating units that are expected to benefit from the synergies of the business combination.
A cash-generating unit to which
goodwill has been allocated is tested for impairment annually, or more frequently when there is an indication that the unit may be impaired. If goodwill that allocated to each of the Company’s cash-generating units or groups of cash-generating
units is acquired from the synergies of business combination, impairment test on those units or groups of units should be performed before the end of the same year. If the recoverable amount of the cash-generating unit is less than its carrying
amount, the impairment loss is allocated first to reduce the carrying amount of any goodwill allocated to the unit and then to the other assets of the unit pro rata based on the carrying amount of each asset in the unit. Any impairment loss for
goodwill is recognized directly in profit or loss. An impairment loss recognized for goodwill is not reversed in subsequent periods.
When
the Company disposes of an operation within a cash-generating unit (group of units) to which goodwill has been allocated, the goodwill associated with that operation should be included in the carrying amount of the operation when determining the
gain or loss on disposal; and measured on the basis of the relative values of the operation disposed of and the portion of the cash-generating unit (group of units) retained.
Intangible Assets Other Than Goodwill
Intangible assets with finite useful lives that are acquired separately are carried at cost less accumulated amortization and accumulated
impairment losses. Amortization is recognized on a straight-line basis over their estimated useful lives. The estimated useful life and amortization method are reviewed at least at the end of year, with the effect of any changes in estimate being
accounted for on a prospective basis. Except for the intangible assets to be disposed by the Company before the end of the useful lives, the residual values of intangible assets with finite useful lives are expected to be zero.
Upon disposal of intangible assets, the related cost, accumulated amortization and accumulated impairment losses are deducted from the
corresponding accounts, and any gain or loss is recognized in profit or loss as incurred.
Impairment of Tangible and Intangible Assets
Other Than Goodwill
When an indication of impairment is identified for tangible and intangible assets other than goodwill, any excess
of the carrying amount of an asset over its recoverable amount is recognized as a loss. If the recoverable amount increases in a subsequent period, the amount previously recognized as impairment would be reversed and recognized as a gain. However,
the adjusted amount may not exceed the carrying amount that would have been determined, as if no impairment loss had been recognized.
20
Financial Instruments
Financial assets and financial liabilities are recognized when a consolidated entity becomes a party to the contractual provisions of the
instruments.
Financial assets and financial liabilities are initially measured at fair value. Transaction costs that are directly
attributable to the acquisition or issue of financial assets and financial liabilities (other than financial assets and financial liabilities at fair value through profit or loss) are added to or deducted from the fair value of the financial assets
or financial liabilities, as appropriate, on initial recognition. Transaction costs directly attributable to the acquisition of financial assets or financial liabilities at fair value through profit or loss are recognized immediately in profit or
loss.
Regular way purchases or sales of financial assets are accounted for using
trade date accounting. The regular way of transaction means the purchase or sale of financial assets delivered within the time frame established by regulation or convention in the marketplace.
| |
a) |
Financial assets at fair value through profit and loss (FVTPL) |
Financial assets are
classified as at FVTPL when the financial asset is either held for trading or it is designated as at FVTPL.
Financial assets at FVTPL are
stated at fair value, with any gains or losses arising on measurement recognized in profit or loss. The net gain or loss recognized in profit or loss does not incorporate any dividend or interest earned on the financial asset.
| |
b) |
Held-to-maturity financial assets |
Held-to-maturity financial assets are non-derivative
financial assets with fixed or determinable payments and fixed maturity date that the Company has the positive intention and ability to hold to maturity other than those that are designated as at fair value through profit or loss or as
available-for-sale and those that meet the definition of loans and receivables and on initial recognition. When the counterparties of the Company’s investments have good credit quality, all with certain credit rating or above and the Company
has the positive intention and ability to hold to maturity, the investments are classified as held-to-maturity financial assets.
Subsequent to initial recognition, held-to-maturity financial assets are measured at amortized cost using the effective interest method less
any impairment.
Effective interest method is a method of calculating the amortized cost of a debt instrument and of allocating interest
income over the relevant period. The effective interest rate is the rate that exactly discounts estimated future cash receipts (including all fees and points paid or received that form an integral part of the effective interest rate, transaction
costs and other premiums or discounts) through the expected life of the debt instrument, or, where appropriate, a shorter period, to the net carrying amount on initial recognition.
| |
c) |
Available-for-sale financial assets (AFS financial assets) |
AFS financial assets are
non-derivatives that are either designated as AFS or are not classified as loans and receivables, held-to-maturity financial assets or financial assets at fair value through profit or loss.
21
Listed stocks, emerging market stocks, open-end mutual funds, unlisted stocks and corporate
bonds held by the Company and classified as AFS in an active market are measured at fair value at the end of each reporting period. AFS equity investments that do not have a quoted market price in an active market and whose fair value cannot be
reliably measured are measured at cost less any identified impairment losses at the end of each reporting period.
Changes in the carrying
amount of AFS monetary financial assets relating to changes in foreign currency rates, interest income calculated using the effective interest method and dividends on AFS equity investments are recognized in profit or loss. Other changes in the
carrying amount of available-for-sale financial assets are recognized in other comprehensive income. When the investment is disposed of or is determined to be impaired, the cumulative gain or loss previously is recognized in other comprehensive
income reclassified to profit or loss.
Dividends on AFS equity instruments are recognized in profit or loss when the Company’s right
to receive the dividends is established.
Loans and receivables are non-derivative financial assets with fixed or
determinable payments that are not quoted in an active market. Loans and receivables including cash and cash equivalents, trade notes and accounts receivable, accounts receivable from related parties, other receivables, and debt investments without
active market are measured at amortized cost using the effective interest method, less any impairment. Interest income is recognized by applying the effective interest rate, except for short-term receivables when the recognition of interest would be
immaterial.
| |
2) |
Impairment of financial assets |
Financial assets, other than those at FVTPL, are assessed for
indicators of impairment at the end of each reporting period. Financial assets are considered to be impaired when there is objective evidence that, as a result of one or more events that occurred after the initial recognition of the financial asset,
the estimated future cash flows of the investment have been affected.
For financial assets carried at amortized cost, such as
held-to-maturity investments and accounts receivable, assets that are assessed not to be impaired individually are, in addition, assessed for impairment on a collective basis.
For financial assets carried at amortized cost, the amount of the impairment loss recognized is the difference between the asset’s
carrying amount and the present value of estimated future cash flows, discounted at the financial asset’s original effective interest rate. However, since the discounted effect of short-term receivables is immaterial, the impairment loss is
recognized on the difference between carrying amount and estimated future cash flow.
For financial assets measured at amortized cost, if,
in a subsequent period, the amount of the impairment loss decreases, the previously recognized impairment loss is reversed through profit or loss to the extent that the carrying amount of the investment at the date the impairment is reversed does
not exceed what the amortized cost would have been had the impairment not been recognized.
When an AFS financial asset is considered to
be impaired, cumulative gains or losses previously recognized in other comprehensive income are reclassified to profit or loss in the period.
In respect of AFS equity securities, impairment losses previously recognized in profit or loss are not reversed through profit or loss. Any
increase in fair value subsequent to an impairment loss is recognized in other comprehensive income.
22
For financial assets carried at cost, the amount of the impairment loss is measured as the
difference between the asset’s carrying amount and the present value of the estimated future cash flows discounted at the current market rate of return for a similar financial asset. Such impairment loss will not be reversed in subsequent
periods.
The carrying amount of the financial asset is reduced by the impairment loss directly for all financial assets with the
exception of trade receivables and other receivables, where the carrying amount is reduced through the use of an allowance account. When a trade receivable and other receivables is considered uncollectible, it is written off against the allowance
account. Subsequent recoveries of amounts previously written off are credited against the allowance account. Changes in the carrying amount of the allowance account are recognized in profit or loss.
| |
3) |
Derecognition of financial assets |
The Company derecognizes a financial asset only when the
contractual rights to the cash flows from the asset expire, or when it transfers the financial asset and substantially all the risks and rewards of ownership of the asset to another entity.
On derecognition of a financial asset in its entirety, the difference between the asset’s carrying amount and the sum of the
consideration received and receivable and the cumulative gain or loss that had been recognized in other comprehensive income and accumulated in equity is recognized in profit or loss.
| |
1) |
Subsequent measurement |
Expect for financial liabilities at FVTPL, other financial liabilities
are subsequently measured at amortized cost using the effective interest method.
| |
2) |
Derecognition of financial liabilities |
The Company derecognizes financial liabilities when,
and only when, the Company’s obligations are discharged, cancelled or they expire. The difference between the carrying amount of the financial liability derecognized and the consideration paid and payable (includes the transfer of non-cash
assets or assumption of liabilities) is recognized in profit or loss.
| |
d. |
Derivative financial instruments |
The Company enters into a variety of derivative financial
instruments to manage its exposure to risk of foreign exchange rate and the fluctuation on stock price, including foreign exchange forward contracts, cross currency swap contracts and index future contracts.
Derivatives are initially recognized at fair value at the date the derivative contracts are entered into and are subsequently remeasured to
their fair value at the end of each reporting period. The resulting gain or loss is recognized in profit or loss immediately unless the derivative is designated and effective as a hedging instrument, in which event the timing of the recognition in
profit or loss depends on the nature of the hedge relationship. When the fair value of the derivative is positive, it is recognized as a financial asset; otherwise, it is recognized as a financial liability.
Hedge Accounting
The
Company designates certain derivative instruments as fair value hedges.
23
At the inception of the hedge relationship, the Company documents the relationship between the
hedging instrument and the hedged item, along with its risk management objectives and its strategy for undertaking various hedge transactions. Furthermore, at the inception of the hedge and on an ongoing basis, the Company documents whether the
hedging instrument is highly effective in offsetting changes in fair values or cash flows of the hedged item attributable to the hedged risk.
Changes in the fair value of derivatives that are designated and qualify as fair value hedges are recognized in profit or loss immediately,
together with any changes in the fair value of the hedged asset or liability that are attributable to the hedged risk. The change in the fair value of the hedging instrument and the change in the hedged item attributable to the hedged risk are
recognized in the line of the consolidated statement of comprehensive income relating to the hedged item.
Hedge accounting is discontinued
when the Company revokes the hedging relationship, when the hedging instrument expires or is sold, terminated, or exercised, or when it no longer qualifies for hedge accounting.
Provisions
Provisions
for the expected cost of warranty obligations under sale of goods are recognized at the date of sale of the relevant products, at the management’s best estimate of the expenditure required to settle the Company’s obligation.
Revenue Recognition
Revenues are recognized when they are realized or realizable and earned. Revenues are realized or realizable and earned when the Company has
persuasive evidence of an arrangement, the goods have been delivered or the services have been rendered to the customer, the sales price is fixed or determinable and collectability is reasonably assured.
Revenue is measured at the fair value of the consideration received or receivable and represents amounts for goods sold in the normal course of
business, net of sales discounts and volume rebates. For trade receivables due within one year from the balance sheet date, as the nominal value of the consideration to be received approximates its fair value and transactions are frequent, fair
value of the consideration is not determined by discounting all future receipts using an imputed rate of interest.
Usage revenues from
fixed-line services (including local, domestic long distance and international long distance), cellular services, Internet and data services, and interconnection and call transfer fees from other telecommunications companies and carriers are billed
in arrears and are recognized based upon seconds or minutes of traffic processed or usage when the services are provided in accordance with contract terms.
Other revenues are recognized as follows: (a) one-time subscriber connection fees (on fixed-line services) are deferred and recognized
over the average expected customer service periods, (b) monthly fees (on fixed-line services, mobile, Internet and data services) are accrued every month, and (c) prepaid services (fixed-line, mobile, Internet and data services) are
recognized as income based upon actual usage by customers or when the right to use those services expires.
Where the Company enters into
transactions which involve both the provision of air time bundled with products such as 3G data card and handset, total consideration received from handsets in these arrangements are allocated and measured using units of accounting within the
arrangement based on relative fair values limited to the amount that is not contingent upon the delivery of other items or services.
Services revenue is recognized when service provided.
Revenue from a contract to provide services is recognized by reference to the stage of completion of the contract.
24
Dividend income from investments is recognized when the shareholder’s right to receive
payment has been established.
Interest income from a financial asset is recognized when it is probable that the economic benefits will
flow to the Company and the amount of income can be measured reliably. Interest income is accrued on a time basis, by reference to the principal outstanding and at the effective interest rate applicable.
Leasing
Rental income from operating leases is recognized on a straight-line
basis over the term of the relevant lease.
Operating lease payments are recognized as an expense on a straight-line
basis over the lease term. Contingent rentals arising under operating leases are recognized as an expense in the period in which they are incurred.
Borrowing Costs
Borrowing costs directly attributable to the acquisition, construction or production of qualifying assets, which are assets that necessarily
take a substantial period of time to get ready for their intended use or sale, are added to the cost of those assets, until such time as the assets are substantially ready for their intended use or sale.
All other borrowing costs are recognized in profit or loss in the period in which they are incurred.
Retirement Benefit Costs
Payments to defined contribution retirement benefit plans are recognized as an expense when employees have rendered entitling them to the
contributions.
For defined benefit retirement benefit plans, the cost of providing benefits is determined using the Projected Unit Credit
Method with actuarial valuations. Actuarial gain and loss arising from defined benefit retirement benefit plans is recognized in the other comprehensive income as incurred. Past service cost is recognized immediately to the extent that the benefits
are already vested, and otherwise is amortized on a straight-line basis over the average period until the benefits become vested.
The
retirement benefit obligation recognized in the consolidated balance sheet represents the present value of the defined benefit obligation as adjusted for unrecognized past service cost, and as reduced by the fair value of plan assets.
The cost of providing benefit at the interim period is determined using the pension cost rate derived from the actuarial valuation at the end
of prior year, and determined the adjustment of significant market fluctuation, curtailment, settlement or other one-time events.
Share-based Payments
Equity-settled share-based payments to employees and others providing similar services are measured at the fair value of the equity instruments
at the grant date.
25
The value of the stock options granted, which is equal to the best available estimate of the
number of stock options expected to vest multiplied by the grant-date fair value, is expensed on a straight-line basis over the vesting period, with a corresponding adjustment to additional paid-in capital - employee stock options. Expenses are
recognized at the grant date in profit or loss if vested immediately.
At the balance sheet date, the Company revises its estimate of the
number of equity instruments expected to vest. The impact of the revision of the original estimates, if any, is recognized in profit or loss such that the cumulative expense reflects the revised estimate, with a corresponding adjustment to
additional paid-in capital - employee stock options.
Income Tax
Income tax expense represents the sum of the tax currently payable and deferred tax.
Current and deferred taxes are recognized in profit or loss, except for those relate to items recognized in other comprehensive income or
directly in equity; in which cases, the relevant tax effects (current and deferred taxes) are also recognized in other comprehensive income or directly in equity, respectively.
The tax currently payable is based on taxable profit for currently taxable profit.
Taxable profit differs from profit as reported in the consolidated statement of comprehensive income because of items of income or expense that are taxable or deductible in other years and items that are never taxable or deductible. The
Company’s liability for current tax is calculated using tax rates that have been enacted or substantively enacted by the end of the reporting period.
Interim period income taxes are assessed on an annual basis. Interim period income tax expense is calculated by applying to an interim
period’s pre-tax income and the tax rate that would be applicable to total annual earnings.
Income taxes (10%) on undistributed
earnings are recorded in the year of stockholders approval, which is the year subsequent to the year the earnings are generated.
Adjustments of prior years’ tax liabilities are added to or deducted from the current year’s tax provision.
Deferred tax is recognized on temporary differences between the carrying amounts
of assets and liabilities in the consolidated financial statements and the corresponding tax bases used in the computation of taxable profit. Deferred tax liabilities are generally recognized for all taxable temporary differences. Deferred tax
assets are generally recognized for all deductible temporary differences to the extent that it is probable that taxable profits will be available against which those deductible temporary differences, loss carryforwards, unused tax credits from
purchases of machinery, equipment and technology, research and development expenditures, and personnel training expenditures can be utilized.
Deferred tax liabilities are recognized for taxable temporary differences associated with investments in subsidiaries and associates, and
interests in joint ventures, except where the Company is able to control the reversal of the temporary difference and it is probable that the temporary difference will not reverse in the foreseeable future. Deferred tax assets arising from
deductible temporary differences associated with such investments and interests are only recognized to the extent that it is probable that there will be sufficient taxable profits against which to utilize the benefits of the temporary differences
and they are expected to reverse in the foreseeable future.
26
The carrying amount of deferred tax assets is reviewed at the balance sheet date, and reduced to
the extent that it is no longer probable that sufficient taxable profits will be allowed for deduction. Unrecognized deferred tax is reviewed at the balance sheet date and raised to the extent that it is probable that sufficient taxable profits will
be available to allow all or part of the asset to be recovered.
Deferred tax assets and liabilities are measured at the tax rates that are
expected to apply in the period in which the liability is settled or the asset realized.
| 4. |
CRITICAL ACCOUNTING JUDGEMENTS, KEY SOURCES OF ESTIMATION AND ASSUMPTION UNCERTAINTY |
In
the application of the Company’s accounting policies, the managements are required to make judgments, estimates and assumptions which are based on historical experience and other factors that are not readily apparent from other sources. Actual
results may differ from these estimates.
The estimates and underlying assumptions are reviewed on an ongoing basis. Revisions to
accounting estimates are recognized in the period in which the estimate is revised if the revision affects only that period, or in the period of the revision and future periods if the revision affects both current and future periods.
The following are the key assumptions concerning the future, and other key sources of estimation uncertainty at the end of the reporting
period. Actual results may differ from these estimates.
| |
a. |
Impairment of accounts receivable |
When there is objective evidence showed indications of
impairment, the Company will consider the estimation of future cash flows. The amount of impairment will be measured on the difference between the carrying amount and the present value of estimated future cash flows discounted by the original
effective interest rates of the financial assets. However, given the impact from the discount of short-term receivables is not material, the impairment of short-term receivables is measured at the difference between the carrying amount and the
estimated future cash flows. Where the actual future cash flows are less than expected, a material impairment loss may arise.
| |
b. |
Provision for inventory valuation and obsolescence |
Inventories are stated at the lower of cost
or net realizable value. Net realizable value is the selling unit price of inventories less all estimated selling and marketing expenses. Inventory write-downs are determined on an item by item basis, except for those similar items which could be
categorized into the same groups. The Company uses the inventory holding period and turnover as the evaluation basis for inventory obsolescence losses.
| |
c. |
Impairment of tangible and intangible assets |
When an indication of impairment is assessed with
objective evidence, the impairment is recognized in profit or loss as incurred. The estimate of recoverable amount would impact on the timing and the amount of impairment loss recognition.
| |
d. |
Useful lives of property, plant and equipment |
As discussed in Note 3, “Summary of
Significant Accounting Policies” “Property, Plant and Equipment”, the Company reviews estimated useful lives of property, plant and equipment at the end of each year.
27
| 5. |
APPLICATION OF NEW AND REVISED STANDARDS AND INTERPRETATIONS |
The Company has not
adopted the following new, revised or amended IFRSs, IASs, IFRICs, SICs and related guidance issued by the International Accounting Standards Board (IASB).
Up to date, the effective dates of the following new and amended of IFRSs have not been published by FSC.
|
|
|
|
|
| New, Revised or Amended Standards and Interpretations |
|
Effective Date Issued by IASB (Note) |
|
|
|
| Endorsed by the FSC |
|
|
|
|
|
|
|
| Amendments to IFRSs |
|
Improvement to IFRSs 2009 - amendment to IAS 39 |
|
January 1, 2009 or January 1, 2010 |
| IFRS 9 (2009) |
|
Financial Instruments |
|
January 1, 2015 |
| Amendment to IAS 39 |
|
Embedded Derivative |
|
Effective in fiscal year beginning on or after June 30, 2009 |
|
|
|
| Not yet endorsed by the FSC |
|
|
|
|
|
|
|
| Amendment to IFRSs |
|
Improvements to IFRSs 2010 - amendment to IAS 39 |
|
July 1, 2010 or January 1, 2011 |
| Amendment to IFRSs |
|
Annual Improvements (to IFRSs 2009-2011 Cycle) |
|
January 1, 2013 |
| Amendment to IFRS 1 |
|
Limited Exemption from Comparative IFRS 7 Disclosures of First-time Adopters |
|
July 1, 2010 |
| Amendment to IFRS 1 |
|
Government Loans |
|
January 1, 2013 |
| Amendment to IFRS 1 |
|
Severe Hyperinflation and Removal of Fixed Dates for First-time Adopters |
|
July 1, 2011 |
| Amendment to IFRS 7 |
|
Disclosures - Offsetting Financial Assets and Financial Liabilities |
|
January 1, 2013 |
| Amendments to IFRS 9 and 7 |
|
Mandatory Effective Date and Transition Disclosures |
|
January 1, 2015 |
| Amendment to IFRS 7 |
|
Disclosures - Transfers of Financial Assets |
|
July 1, 2011 |
| Amendment to IFRS 9 (2010) |
|
Financial Instruments |
|
January 1, 2015 |
| Amendment to IFRS 10 |
|
Consolidated Financial Statements |
|
January 1, 2013 |
| Amendment to IFRS 11 |
|
Joint Arrangements |
|
January 1, 2013 |
| Amendment to IFRS 12 |
|
Disclosure of Interests in Other Entities Published |
|
January 1, 2013 |
| Amendments to IFRS 10, 11 and 12 |
|
Consolidated Financial Statements, Joint Arrangements and Disclosure of Interests in Other Entities: Transition Guidance |
|
January 1, 2013 |
| Amendments to IFRS 10, IFRS 12 and IAS 27 |
|
Investment Entities |
|
January 1, 2014 |
| Amendment to IFRS 13 |
|
Fair Value Measurement |
|
January 1, 2013 |
| Amendment to IAS 1 |
|
Presentation of Items of Other Comprehensive Income |
|
July 1, 2012 |
(Continued)
28
|
|
|
|
|
| New, Revised or Amended Standards and Interpretations |
|
Effective Date Issued by IASB (Note) |
|
|
|
| Amendment to IAS 12 |
|
Deferred tax: Recovery of Underlying Assets |
|
January 1, 2012 |
| Amendment to IAS 19 |
|
Employee Benefits |
|
January 1, 2013 |
| Amendment to IAS 27 |
|
Separate Financial Statements |
|
January 1, 2013 |
| Amendment to IAS 28 |
|
Investments in Associates and Joint Ventures |
|
January 1, 2013 |
| Amendment to IAS 32 |
|
Offsetting of Financial Assets and Financial Liabilities |
|
January 1, 2014 |
| Amendment to IAS 36 |
|
Recoverable Amount Disclosures for Non-financial Assets |
|
January 1, 2014 |
| Amendment to IAS 39 |
|
Novation of Derivatives and Continuation of Hedge Accounting |
|
January 1, 2014 |
| Amendment to IFRIC 20 |
|
Stripping Costs in the production Phase of A Surface Mine |
|
January 1, 2013 |
| Amendment to IFRIC 21 |
|
Levies |
|
January 1, 2014 |
(Concluded)
| Note: |
The aforementioned new, revised or amended standards or interpretations are effective after fiscal year beginning on or after the effective dates, unless specified otherwise. |
Except for the following, the Company does not anticipate the adoption of the above new, amended and revised standards and interpretations will
have material impact on the Company’s accounting policies.
| |
a. |
IFRS 9 “Financial Instruments” |
With regards to financial assets, all recognized
financial assets that are within the scope of IAS 39 “Financial Instruments: Recognition and Measurement” are to be subsequently measured at amortized cost or fair value. Specifically, financial assets that are held within a business model
whose objective is to collect the contractual cash flows, and that have contractual cash flows that are solely payments of principal and interest on the principal outstanding are generally measured at amortized cost at the end of subsequent
accounting periods. All other financial assets are measured at their fair values at the balance sheet date. However, the Company may make an irrevocable election to present subsequent changes in the fair value of an equity investment (that is not
held for trading) in other comprehensive income, with only dividend income generally recognized in profit or loss.
| |
b. |
New and revised standards on consolidation, joint arrangement, and associates and related disclosure |
| |
1) |
IFRS 10 “Consolidated Financial Statements” |
IFRS 10 replaces IAS 27
“Consolidated and Separate Financial Statements” and SIC 12 “Consolidation - Special Purpose Entities”. The Company considers its ability of control over other entities for consolidation. The Company has control over an investee
if and only if it has all the following a) power over the investee; b) exposure, or rights, to variable returns from its involvement with the investee; and c) the ability to use its power over the investee to affect the amount of its returns.
| |
2) |
IFRS 12 “Disclosure of Interests in Other Entities” |
IFRS 12 is a new disclosure
standard and is applicable to entities that have interests in subsidiaries, joint arrangements, associates and/or unconsolidated structured entities. In general, the disclosure requirements in IFRS 12 are more extensive than those in the current
standards.
29
| |
3) |
Revision to IAS 28 “Investments in Associates and Joint Ventures” |
Revised IAS 28
requires when a portion of an investment in associates meets the criteria to be classified as held for sale, that portion is classified as held for sale. Any retained portion of its investment in associates that has not been classified as held for
sale is accounted for using the equity method. Previously, when a portion of an investment in associates meets the criteria to be classified as held for sale, the entire investment is classified as held for sale and ceases to apply the equity
method.
| |
c. |
IFRS 13 “Fair Value Measurement” |
IFRS 13 establishes a single source of guidance for
fair value measurements. It defines fair value, establishes a framework for measuring fair value, and requires disclosures about fair value measurements. The disclosure requirements in IFRS 13 are more extensive than those required in the current
standards. For example, quantitative and qualitative disclosures based on the three-level fair value hierarchy currently required for financial instruments only will be extended by IFRS 13 to cover all assets and liabilities within its scope.
| |
d. |
Amendments to IAS 1 “Presentation of Items of Other Comprehensive Income” |
The
amendments to IAS 1 require items of other comprehensive income to be grouped into those that (1) will not be reclassified subsequently to profit or loss; and (2) will be reclassified subsequently to profit or loss when specific conditions
are met. Income taxes on related items of other comprehensive income are grouped on the same basis. Previously, there were no such requirements.
| |
e. |
Amendments to IAS 19 “Employee Benefits” |
The amendments to IAS 19 change the
accounting for defined benefit plans, which require the Company to recognize changes in defined benefit obligations or assets, to disclose the components of the defined benefit costs, to eliminate the corridor approach and to accelerate the
recognition of past service cost. According to the amendments, all actuarial gains and losses will be recognized immediately through other comprehensive income; the past service cost, on the other hand, will be expensed immediately when it incurs
and no longer be amortized over the average period before vested on a straight-line basis. In addition, the amendment also requires a broader disclosure in defined benefit plans.
| |
f. |
Amendments to IAS 36 “Recoverable Amount Disclosures for Non-financial Assets” |
In
issuing IFRS 13 “Fair Value Measurement”, the IASB made some consequential amendments to the disclosure requirements in IAS 36 “Impairment of Assets”, introducing a requirement to disclose in every reporting period the
recoverable amount of an asset or each cash-generating unit. The amendment clarifies that the disclosure of such recoverable amount is required during the period when an impairment loss has been recognized or reversed. Furthermore, the Company is
required to disclose the discount rate used in current and previous measurements of the recoverable amount based on fair value less costs of disposal measured using a present value technique.
The Company continuously evaluates the potential impact on the consolidated financial statements and will disclose the results after the
evaluation is completed.
30
| 6. |
CASH AND CASH EQUIVALENTS |
|
|
|
|
|
|
|
|
|
|
|
|
|
|
|
|
|
| |
|
September 30,
2013 |
|
|
December 31,
2012 |
|
|
September 30,
2012 |
|
|
January 1,
2012 |
|
|
|
|
|
|
| Cash |
|
|
|
|
|
|
|
|
|
|
|
|
|
|
|
|
| Cash on hand |
|
$ |
223,031 |
|
|
$ |
447,399 |
|
|
$ |
228,679 |
|
|
$ |
238,850 |
|
| Bank deposits |
|
|
6,309,740 |
|
|
|
5,730,478 |
|
|
|
5,116,827 |
|
|
|
5,115,371 |
|
|
|
|
|
|
|
|
|
|
|
|
|
|
|
|
|
|
|
|
|
6,532,771 |
|
|
|
6,177,877 |
|
|
|
5,345,506 |
|
|
|
5,354,221 |
|
| Cash equivalents |
|
|
|
|
|
|
|
|
|
|
|
|
|
|
|
|
| Commercial paper |
|
|
10,005,050 |
|
|
|
18,957,163 |
|
|
|
780,553 |
|
|
|
18,966,431 |
|
| Negotiable certificate of deposit |
|
|
16,800,000 |
|
|
|
4,590,000 |
|
|
|
23,600,000 |
|
|
|
1,177,037 |
|
| Time deposits with maturities of less than three months |
|
|
1,412,092 |
|
|
|
1,213,432 |
|
|
|
1,762,218 |
|
|
|
610,028 |
|
| Treasury bills |
|
|
— |
|
|
|
— |
|
|
|
— |
|
|
|
299,479 |
|
|
|
|
|
|
|
|
|
|
|
|
|
|
|
|
|
|
|
|
|
28,217,142 |
|
|
|
24,760,595 |
|
|
|
26,142,771 |
|
|
|
21,052,975 |
|
|
|
|
|
|
|
|
|
|
|
|
|
|
|
|
|
|
|
|
|
|
|
|
|
$ |
34,749,913 |
|
|
$ |
30,938,472 |
|
|
$ |
31,488,277 |
|
|
$ |
26,407,196 |
|
|
|
|
|
|
|
|
|
|
|
|
|
|
|
|
|
|
The annual yield rates of bank deposits, negotiable certificate of deposit and time deposits with maturities of
less than three months and commercial paper were as follows:
|
|
|
|
|
|
|
|
|
| |
|
September 30,
2013 |
|
December 31,
2012 |
|
September 30,
2012 |
|
January 1,
2012 |
|
|
|
|
|
| Bank deposits |
|
0.00%-0.76% |
|
0.00%-0.75% |
|
0.00%-0.76% |
|
0.00%-0.75% |
| Commercial paper |
|
0.64%-0.68% |
|
0.71%-0.74% |
|
0.71%-0.80% |
|
0.45%-0.80% |
| Negotiable certificate of deposit |
|
0.77%-0.85% |
|
0.83%-0.96% |
|
0.70%-0.91% |
|
0.63%-0.72% |
| Time deposits with maturities of less than three months |
|
0.30%-5.10% |
|
0.88%-4.70% |
|
0.25%-5.50% |
|
0.40%-5.50% |
| Treasury bills |
|
— |
|
— |
|
— |
|
0.70% |
Cash equivalents are short term investments with maturities of less than three months or with high liquidities
which can be readily convertible to cash, for the purpose of meeting short-term cash demand, including commercial paper, negotiable certificate of deposit, time deposits, and treasury bills.
| 7. |
FINANCIAL INSTRUMENTS AT FAIR VALUE THROUGH PROFIT OR LOSS |
|
|
|
|
|
|
|
|
|
|
|
|
|
|
|
|
|
| |
|
September 30,
2013 |
|
|
December 31,
2012 |
|
|
September 30,
2012 |
|
|
January 1,
2012 |
|
|
|
|
|
|
| Financial assets held for trading |
|
|
|
|
|
|
|
|
|
|
|
|
|
|
|
|
| Derivatives (not designated for hedge) |
|
|
|
|
|
|
|
|
|
|
|
|
|
|
|
|
| Forward exchange contracts |
|
$ |
363 |
|
|
$ |
292 |
|
|
$ |
285 |
|
|
$ |
— |
|
| Currency swap contracts |
|
|
— |
|
|
|
2,702 |
|
|
|
32,393 |
|
|
|
6,094 |
|
|
|
|
|
|
|
|
|
|
|
|
|
|
|
|
|
|
|
|
|
363 |
|
|
|
2,994 |
|
|
|
32,678 |
|
|
|
6,094 |
|
| Financial assets designated as at fair value through profit or loss |
|
|
|
|
|
|
|
|
|
|
|
|
|
|
|
|
| Convertible bonds |
|
|
— |
|
|
|
— |
|
|
|
— |
|
|
|
39,656 |
|
|
|
|
|
|
|
|
|
|
|
|
|
|
|
|
|
|
|
|
|
|
|
|
|
$ |
363 |
|
|
$ |
2,994 |
|
|
$ |
32,678 |
|
|
$ |
45,750 |
|
|
|
|
|
|
|
|
|
|
|
|
|
|
|
|
|
|
(Continued)
31
|
|
|
|
|
|
|
|
|
|
|
|
|
|
|
|
|
| |
|
September 30,
2013 |
|
|
December 31,
2012 |
|
|
September 30,
2012 |
|
|
January 1,
2012 |
|
|
|
|
|
|
| Financial liabilities held for trading |
|
|
|
|
|
|
|
|
|
|
|
|
|
|
|
|
| Derivatives (not designated for hedge) |
|
|
|
|
|
|
|
|
|
|
|
|
|
|
|
|
| Forward exchange contracts |
|
$ |
671 |
|
|
$ |
24 |
|
|
$ |
222 |
|
|
$ |
73 |
|
| Currency swap contracts |
|
|
— |
|
|
|
1,935 |
|
|
|
— |
|
|
|
3,665 |
|
| Index future contracts |
|
|
— |
|
|
|
— |
|
|
|
— |
|
|
|
249 |
|
|
|
|
|
|
|
|
|
|
|
|
|
|
|
|
|
|
|
|
|
|
|
|
|
$ |
671 |
|
|
$ |
1,959 |
|
|
$ |
222 |
|
|
$ |
3,987 |
|
|
|
|
|
|
|
|
|
|
|
|
|
|
|
|
|
|
(Concluded)
The Company did not apply hedge accounting on the aforementioned contracts at the balance sheet date.
Outstanding currency swap contracts and forward exchange contracts as of balance sheet dates were as follows:
|
|
|
|
|
|
|
| |
|
Currency |
|
Maturity Period |
|
Contract Amount
(In Thousands) |
|
|
|
|
| September 30, 2013 |
|
|
|
|
|
|
|
|
|
|
| Forward exchange contracts - buy |
|
NT$/US$ |
|
2013.10 |
|
NT$509,869/US$17,200 |
|
|
|
|
| December 31, 2012 |
|
|
|
|
|
|
|
|
|
|
| Currency swap contracts |
|
US$/NT$ |
|
2013.01-2013.03 |
|
US$34,000/NT$991,188 |
|
|
US$/NT$ |
|
2013.01-2013.03 |
|
US$32,000/NT$929,280 |
| Forward exchange contracts - buy |
|
NT$/US$ |
|
2013.01 |
|
NT$154,304/US$5,310 |
|
|
|
|
| September 30, 2012 |
|
|
|
|
|
|
|
|
|
|
| Currency swap contracts |
|
US$/NT$ |
|
2012.10-2012.11 |
|
US$66,000/NT$1,967,249 |
| Forward exchange contracts - buy |
|
NT$/US$ |
|
2012.10 |
|
NT$211,711/US$7,220 |
|
|
|
|
| January 1, 2012 |
|
|
|
|
|
|
|
|
|
|
| Currency swap contracts |
|
US$/NT$ |
|
2012.01-2012.03 |
|
US$43,000/NT$1,306,834 |
|
|
US$/NT$ |
|
2012.01-2012.02 |
|
US$19,000/NT$571,280 |
| Forward exchange contracts - buy |
|
NT$/US$ |
|
2012.01 |
|
NT$59,638/US$1,967 |
The Company did not have any outstanding index future contracts as of September 30,
2013, December 31, 2012 and September 30, 2012.
32
Outstanding index future contracts of subsidiaries on January 1, 2012 were as follows:
|
|
|
|
|
|
|
|
|
|
|
|
|
| |
|
Maturity Period |
|
|
Units |
|
|
Contract
Amount
(In Thousands) |
|
|
|
|
|
| January 1, 2012 |
|
|
|
|
|
|
|
|
|
|
|
|
|
|
|
|
| TAIFEX futures |
|
|
|
|
|
|
|
|
|
|
|
|
| TX |
|
|
2012.01 |
|
|
|
2 |
|
|
NT$ |
2,952 |
|
| TX |
|
|
2012.02 |
|
|
|
4 |
|
|
NT$ |
5,558 |
|
| TX |
|
|
2012.03 |
|
|
|
37 |
|
|
NT$ |
51,614 |
|
| TE |
|
|
2012.03 |
|
|
|
19 |
|
|
NT$ |
11,370 |
|
| TF |
|
|
2012.01 |
|
|
|
8 |
|
|
NT$ |
6,401 |
|
| TF |
|
|
2012.02 |
|
|
|
5 |
|
|
NT$ |
3,877 |
|
| TF |
|
|
2012.03 |
|
|
|
15 |
|
|
NT$ |
11,658 |
|
The deposits paid for outstanding index future contracts of subsidiaries (included in other current assets)
were $5,408 thousand as of January 1, 2012.
The Company entered into above currency swap contracts, forward exchange contracts and
index future contracts to manage its exposure to foreign currency risk and impacts in operating results due to fluctuations in exchange rates and stock prices. However, the aforementioned derivatives did not meet the criteria for hedge accounting
and were classified as financial assets or financial liabilities held for trading.
The convertible bonds owned by subsidiaries were hybrid
financial instruments that were financial assets designated as at fair value through profit or loss.
| 8. |
AVAILABLE-FOR-SALE FINANCIAL ASSETS |
|
|
|
|
|
|
|
|
|
|
|
|
|
|
|
|
|
| |
|
September 30,
2013 |
|
|
December 31,
2012 |
|
|
September 30,
2012 |
|
|
January 1,
2012 |
|
|
|
|
|
|
| Equity securities |
|
|
|
|
|
|
|
|
|
|
|
|
|
|
|
|
| Domestic listed stocks and emerging stocks |
|
$ |
3,042,355 |
|
|
$ |
3,278,315 |
|
|
$ |
3,352,337 |
|
|
$ |
528,236 |
|
| Domestic and foreign open-end mutual funds |
|
|
— |
|
|
|
2,190,392 |
|
|
|
2,328,326 |
|
|
|
2,137,201 |
|
| Foreign listed stocks |
|
|
16,880 |
|
|
|
9,661 |
|
|
|
11,703 |
|
|
|
— |
|
|
|
|
|
|
|
|
|
|
|
|
|
|
|
|
|
|
|
|
|
3,059,235 |
|
|
|
5,478,368 |
|
|
|
5,692,366 |
|
|
|
2,665,437 |
|
|
|
|
|
|
|
|
|
|
|
|
|
|
|
|
|
|
| Debt securities |
|
|
|
|
|
|
|
|
|
|
|
|
|
|
|
|
| Corporate bonds |
|
|
— |
|
|
|
50,207 |
|
|
|
50,755 |
|
|
|
76,209 |
|
|
|
|
|
|
|
|
|
|
|
|
|
|
|
|
|
|
|
|
|
|
|
|
|
$ |
3,059,235 |
|
|
$ |
5,528,575 |
|
|
$ |
5,743,121 |
|
|
$ |
2,741,646 |
|
|
|
|
|
|
|
|
|
|
|
|
|
|
|
|
|
|
|
|
|
|
|
| Current |
|
$ |
16,880 |
|
|
$ |
2,250,260 |
|
|
$ |
2,390,784 |
|
|
$ |
2,498,712 |
|
| Non-current |
|
|
3,042,355 |
|
|
|
3,278,315 |
|
|
|
3,352,337 |
|
|
|
242,934 |
|
|
|
|
|
|
|
|
|
|
|
|
|
|
|
|
|
|
|
|
|
|
|
|
|
$ |
3,059,235 |
|
|
$ |
5,528,575 |
|
|
$ |
5,743,121 |
|
|
$ |
2,741,646 |
|
|
|
|
|
|
|
|
|
|
|
|
|
|
|
|
|
|
CHI evaluated and concluded its available-for-sale financial assets were partially impaired, and recorded an
impairment loss of $26,779 thousand for the nine months ended September 30, 2012.
33
| 9. |
HELD-TO-MATURITY FINANCIAL ASSETS |
|
|
|
|
|
|
|
|
|
|
|
|
|
|
|
|
|
| |
|
September 30,
2013 |
|
|
December 31,
2012 |
|
|
September 30,
2012 |
|
|
January 1,
2012 |
|
|
|
|
|
|
| Corporate bonds |
|
$ |
12,359,341 |
|
|
$ |
14,791,151 |
|
|
$ |
15,731,115 |
|
|
$ |
13,790,447 |
|
| Bank debentures |
|
|
1,253,506 |
|
|
|
1,255,139 |
|
|
|
1,255,684 |
|
|
|
905,745 |
|
|
|
|
|
|
|
|
|
|
|
|
|
|
|
|
|
|
|
|
|
|
|
|
|
$ |
13,612,847 |
|
|
$ |
16,046,290 |
|
|
$ |
16,986,799 |
|
|
$ |
14,696,192 |
|
|
|
|
|
|
|
|
|
|
|
|
|
|
|
|
|
|
|
|
|
|
|
| Current |
|
$ |
4,689,694 |
|
|
$ |
4,250,146 |
|
|
$ |
2,981,338 |
|
|
$ |
1,201,301 |
|
| Non-current |
|
|
8,923,153 |
|
|
|
11,796,144 |
|
|
|
14,005,461 |
|
|
|
13,494,891 |
|
|
|
|
|
|
|
|
|
|
|
|
|
|
|
|
|
|
|
|
|
|
|
|
|
$ |
13,612,847 |
|
|
$ |
16,046,290 |
|
|
$ |
16,986,799 |
|
|
$ |
14,696,192 |
|
|
|
|
|
|
|
|
|
|
|
|
|
|
|
|
|
|
The related information of corporate bonds and bank debentures as of balance sheet dates were as follows:
|
|
|
|
|
|
|
|
|
| |
|
September 30,
2013 |
|
December 31,
2012 |
|
September 30,
2012 |
|
January 1,
2012 |
|
|
|
|
|
| Corporate bonds |
|
|
|
|
|
|
|
|
|
|
|
|
|
| Par value |
|
$12,310,000 |
|
$15,955,000 |
|
$15,955,000 |
|
$13,865,000 |
|
|
|
|
|
|
|
|
|
| Nominal interest rate |
|
1.15%-2.90% |
|
1.15%-2.90% |
|
1.15%-2.90% |
|
1.20%-2.98% |
| Effective interest rate |
|
1.00%-2.89% |
|
1.00%-2.89% |
|
1.00%-2.89% |
|
0.83%-2.89% |
| Average expiry date |
|
4 years |
|
4 years |
|
4 years |
|
4 years |
|
|
|
|
|
| Bank debentures |
|
|
|
|
|
|
|
|
|
|
|
|
|
| Par value |
|
$1,250,000 |
|
$1,250,000 |
|
$1,250,000 |
|
$900,000 |
|
|
|
|
|
|
|
|
|
| Nominal interest rate |
|
1.25%-1.60% |
|
1.25%-1.60% |
|
1.25%-1.60% |
|
1.37%-1.60% |
| Effective interest rate |
|
1.15%-1.40% |
|
1.15%-1.40% |
|
1.15%-1.40% |
|
1.25%-1.40% |
| Average expiry date |
|
4 years |
|
4 years |
|
4 years |
|
4 years |
| 10. |
TRADE NOTES AND ACCOUNTS RECEIVABLE |
|
|
|
|
|
|
|
|
|
|
|
|
|
|
|
|
|
| |
|
September 30,
2013 |
|
|
December 31,
2012 |
|
|
September 30,
2012 |
|
|
January 1,
2012 |
|
|
|
|
|
|
| Trade notes and accounts receivable |
|
$ |
25,225,266 |
|
|
$ |
25,165,616 |
|
|
$ |
25,250,852 |
|
|
$ |
24,819,083 |
|
| Less: Allowance doubtful debts |
|
|
(880,660 |
) |
|
|
(810,799 |
) |
|
|
(849,956 |
) |
|
|
(2,423,012 |
) |
|
|
|
|
|
|
|
|
|
|
|
|
|
|
|
|
|
|
|
|
|
|
|
|
$ |
24,344,606 |
|
|
$ |
24,354,817 |
|
|
$ |
24,400,896 |
|
|
$ |
22,396,071 |
|
|
|
|
|
|
|
|
|
|
|
|
|
|
|
|
|
|
The average credit terms range from 30 to 90 days. When determining the collectability of notes and accounts
receivable, the Company considered if there is any change in the credit quality at the balance sheet date. In general, with few exceptional cases, it is unlikely for the notes and accounts receivable due longer than 180 days to be collected, the
Company recognized 100% allowance of notes and accounts receivable longer than 180 days. For the notes and accounts receivable less than 180 days, the allowance for doubtful accounts was estimated based on historical recovery experience.
The Company serves a large consumer base; therefore, the concentration of credit risk is limited.
34
The aging of estimated recoverable amount of receivables that were past due but not impaired as
of September 30, 2013, December 31, 2012, September 30, 2012 and January 1, 2012 was as follows:
|
|
|
|
|
|
|
|
|
|
|
|
|
|
|
|
|
| |
|
September 30,
2013 |
|
|
December 31,
2012 |
|
|
September 30,
2012 |
|
|
January 1,
2012 |
|
|
|
|
|
|
| Less than 30 days |
|
$ |
510,273 |
|
|
$ |
504,545 |
|
|
$ |
358,150 |
|
|
$ |
882,410 |
|
| 31-60 days |
|
|
171,320 |
|
|
|
137,574 |
|
|
|
641,104 |
|
|
|
169,191 |
|
| 61-90 days |
|
|
77,054 |
|
|
|
49,962 |
|
|
|
488,034 |
|
|
|
581,760 |
|
| 91-120 days |
|
|
77,593 |
|
|
|
11,332 |
|
|
|
265,833 |
|
|
|
13,329 |
|
| 121-180 days |
|
|
58,620 |
|
|
|
4,119 |
|
|
|
21,239 |
|
|
|
10,229 |
|
| More than 181 days |
|
|
18,089 |
|
|
|
8,782 |
|
|
|
7,796 |
|
|
|
11,015 |
|
|
|
|
|
|
|
|
|
|
|
|
|
|
|
|
|
|
|
|
|
|
|
|
|
$ |
912,949 |
|
|
$ |
716,314 |
|
|
$ |
1,782,156 |
|
|
$ |
1,667,934 |
|
|
|
|
|
|
|
|
|
|
|
|
|
|
|
|
|
|
The above aging analysis was based on days overdue.
Movements of the allowance for doubtful accounts were as follows:
|
|
|
|
|
|
|
|
|
| |
|
Nine Months Ended September 30 |
|
| |
|
2013 |
|
|
2012 |
|
|
|
|
| Balance, beginning of period |
|
$ |
810,799 |
|
|
$ |
2,423,012 |
|
| Add: Provision for (reversal of) doubtful accounts |
|
|
166,823 |
|
|
|
(1,462,798 |
) |
| Deduct: Amounts written off |
|
|
(96,962 |
) |
|
|
(110,258 |
) |
|
|
|
|
|
|
|
|
|
|
|
|
| Balance, end of period |
|
$ |
880,660 |
|
|
$ |
849,956 |
|
|
|
|
|
|
|
|
|
|
The amount of allowance for bad debts assessed individually included the impairment loss of accounts receivable
from certain companies in liquidation process or in significant financial difficulties, which were $207,048 thousand, $163,779 thousand, $139,886 thousand and $7,303 thousand as of September 30, 2013, December 31,
2012, September 30, 2012 and January 1, 2012, respectively.
Chunghwa evaluated the results of procedures implemented in
prior years to enhance the collection of accounts receivable as well as the experience of decreases in uncollected receivables, and decided to refine the estimates used in the allowance calculation which led to the reversal of allowance for doubtful
accounts for the six months ended June 30, 2012.
|
|
|
|
|
|
|
|
|
|
|
|
|
|
|
|
|
| |
|
September 30,
2013 |
|
|
December 31,
2012 |
|
|
September 30,
2012 |
|
|
January 1,
2012 |
|
|
|
|
|
|
| Merchandise |
|
$ |
4,930,729 |
|
|
$ |
4,242,860 |
|
|
$ |
3,038,523 |
|
|
$ |
2,998,617 |
|
| Project in process |
|
|
1,054,735 |
|
|
|
795,260 |
|
|
|
684,281 |
|
|
|
769,764 |
|
| Work in process |
|
|
14,071 |
|
|
|
17,713 |
|
|
|
6,226 |
|
|
|
12,474 |
|
| Raw materials |
|
|
32,815 |
|
|
|
36,069 |
|
|
|
33,165 |
|
|
|
24,584 |
|
|
|
|
|
|
|
|
|
|
|
|
|
|
|
|
|
|
|
|
|
6,032,350 |
|
|
|
5,091,902 |
|
|
|
3,762,195 |
|
|
|
3,805,439 |
|
| Land held for sale |
|
|
— |
|
|
|
14,766 |
|
|
|
218,150 |
|
|
|
579,226 |
|
| Land and building held for sale |
|
|
42,183 |
|
|
|
54,884 |
|
|
|
42,948 |
|
|
|
— |
|
| Construction in progress |
|
|
9,917 |
|
|
|
— |
|
|
|
— |
|
|
|
290,137 |
|
| Land held under development |
|
|
— |
|
|
|
— |
|
|
|
— |
|
|
|
111,536 |
|
| Land held for development |
|
|
2,002,649 |
|
|
|
2,034,549 |
|
|
|
35,816 |
|
|
|
35,816 |
|
|
|
|
|
|
|
|
|
|
|
|
|
|
|
|
|
|
|
|
|
|
|
|
|
$ |
8,087,099 |
|
|
$ |
7,196,101 |
|
|
$ |
4,059,109 |
|
|
$ |
4,822,154 |
|
|
|
|
|
|
|
|
|
|
|
|
|
|
|
|
|
|
35
The operating costs related to inventories were $11,898,357 thousand (including the valuation
loss on inventories of $18,497 thousand) and $9,417,405 thousand (including the valuation loss on inventories of $3,216 thousand) for the three months ended September 30, 2013 and 2012, respectively. The operating costs related to inventories
were $37,349,749 thousand (including the valuation loss on inventories of $133,054 thousand) and $30,744,697 thousand (including the valuation loss on inventories of $14,455 thousand) for the nine months ended September 30, 2013 and 2012,
respectively
As of September 30, 2013, December 31, 2012, September 30, 2012 and January 1, 2012,
inventories of $2,016,208 thousand, $2,041,797 thousand, $43,428 thousand and $1,023,414 thousand, respectively, were expected to be recovered after more than twelve months. The aforementioned amount of inventories is mainly related to property
development owned by LED.
Land held for sale on December 31, 2012 was for Wan-Xi and Li-Shui (A) projects. Land held for sale on
September 30, 2012 and January 1, 2012 was for Wan-Xi, Li-Shui (A) and Covent projects.
Land and building held for sale on
September 30, 2013, September 30 and December 31, 2012 was for Guang-Diang project.
Construction in process on
September 30, 2013 was for Qingshan Sec., Dayuan Township, Taoyuan County project. Land held under development and construction in progress on January 1, 2012 was for Guang-Diang and Li-Shui (A) projects.
Land held for development on September 30, 2013 and December 31, 2012 was for Yucheng Sec., Nangang Dist., Taipei City and Qingshan
Sec., Dayuan Township, Taoyuan County. Land held for development on September 30, 2012 and January 1, 2012 was for Subsection 2 Gongyuan Sec., Zhongzheng Dist., Taipei City and Yucheng Sec., Nangang Dist., Taipei City.
|
|
|
|
|
|
|
|
|
|
|
|
|
|
|
|
|
| |
|
September 30,
2013 |
|
|
December 31,
2012 |
|
|
September 30,
2012 |
|
|
January 1,
2012 |
|
|
|
|
|
|
| Prepaid rents |
|
$ |
3,451,223 |
|
|
$ |
3,565,310 |
|
|
$ |
3,708,323 |
|
|
$ |
3,851,568 |
|
| Prepaid salary and bonus |
|
|
2,693,295 |
|
|
|
345 |
|
|
|
2,660,108 |
|
|
|
311 |
|
| Others |
|
|
2,482,344 |
|
|
|
1,974,286 |
|
|
|
2,092,365 |
|
|
|
1,583,740 |
|
|
|
|
|
|
|
|
|
|
|
|
|
|
|
|
|
|
|
|
|
|
|
|
|
$ |
8,626,862 |
|
|
$ |
5,539,941 |
|
|
$ |
8,460,796 |
|
|
$ |
5,435,619 |
|
|
|
|
|
|
|
|
|
|
|
|
|
|
|
|
|
|
|
|
|
|
|
| Current |
|
|
|
|
|
|
|
|
|
|
|
|
|
|
|
|
| Prepaid salary and bonus |
|
$ |
2,693,295 |
|
|
$ |
345 |
|
|
$ |
2,660,108 |
|
|
$ |
311 |
|
| Prepaid rents |
|
|
963,047 |
|
|
|
917,975 |
|
|
|
1,007,069 |
|
|
|
993,848 |
|
| Others |
|
|
1,415,298 |
|
|
|
1,067,386 |
|
|
|
1,275,797 |
|
|
|
894,484 |
|
|
|
|
|
|
|
|
|
|
|
|
|
|
|
|
|
|
|
|
|
|
|
|
|
$ |
5,071,640 |
|
|
$ |
1,985,706 |
|
|
$ |
4,942,974 |
|
|
$ |
1,888,643 |
|
|
|
|
|
|
|
|
|
|
|
|
|
|
|
|
|
|
|
|
|
|
|
| Non-current |
|
|
|
|
|
|
|
|
|
|
|
|
|
|
|
|
| Prepaid rents |
|
$ |
2,488,176 |
|
|
$ |
2,647,335 |
|
|
$ |
2,701,254 |
|
|
$ |
2,857,720 |
|
| Others |
|
|
1,067,046 |
|
|
|
906,900 |
|
|
|
816,568 |
|
|
|
689,256 |
|
|
|
|
|
|
|
|
|
|
|
|
|
|
|
|
|
|
|
|
|
|
|
|
|
$ |
3,555,222 |
|
|
$ |
3,554,235 |
|
|
$ |
3,517,822 |
|
|
$ |
3,546,976 |
|
|
|
|
|
|
|
|
|
|
|
|
|
|
|
|
|
|
36
| 13. |
OTHER CURRENT MONETARY ASSETS |
|
|
|
|
|
|
|
|
|
|
|
|
|
|
|
|
|
| |
|
September 30,
2013 |
|
|
December 31,
2012 |
|
|
September 30,
2012 |
|
|
January 1,
2012 |
|
|
|
|
|
|
| Time deposits and negotiable certificate of deposit with maturities of more than three months |
|
$ |
2,385,360 |
|
|
$ |
22,263,840 |
|
|
$ |
7,335,178 |
|
|
$ |
40,982,360 |
|
| Receivables from the Fund for Privatization of Government - owned Enterprises under the Executive Yuan |
|
|
1,333,114 |
|
|
|
869,032 |
|
|
|
880,073 |
|
|
|
1,283,829 |
|
| Others |
|
|
1,057,275 |
|
|
|
1,316,323 |
|
|
|
888,094 |
|
|
|
784,559 |
|
|
|
|
|
|
|
|
|
|
|
|
|
|
|
|
|
|
|
|
|
|
|
|
|
$ |
4,775,749 |
|
|
$ |
24,449,195 |
|
|
$ |
9,103,345 |
|
|
$ |
43,050,748 |
|
|
|
|
|
|
|
|
|
|
|
|
|
|
|
|
|
|
The annual yield rates of time deposits and negotiable certificate of deposit with maturities of more than
three months at each period end were as follows:
|
|
|
|
|
|
|
|
|
| |
|
September 30,
2013 |
|
December 31,
2012 |
|
September 30,
2012 |
|
January 1,
2012 |
|
|
|
|
|
| Time deposits and negotiable certificate of deposit with maturities of more than three months |
|
0.11%-3.30% |
|
0.25%-3.30% |
|
0.25%-4.40% |
|
0.25%-3.30% |
| 14. |
FINANCIAL ASSETS CARRIED AT COST |
|
|
|
|
|
|
|
|
|
|
|
|
|
|
|
|
|
| |
|
September 30,
2013 |
|
|
December 31,
2012 |
|
|
September 30,
2012 |
|
|
January 1,
2012 |
|
|
|
|
|
|
| Non-listed stocks |
|
|
|
|
|
|
|
|
|
|
|
|
|
|
|
|
| Domestic |
|
$ |
2,279,302 |
|
|
$ |
2,327,994 |
|
|
$ |
2,385,751 |
|
|
$ |
2,470,485 |
|
| Foreign |
|
|
175,652 |
|
|
|
139,867 |
|
|
|
139,867 |
|
|
|
104,545 |
|
|
|
|
|
|
|
|
|
|
|
|
|
|
|
|
|
|
|
|
|
|
|
|
|
$ |
2,454,954 |
|
|
$ |
2,467,861 |
|
|
$ |
2,525,618 |
|
|
$ |
2,575,030 |
|
|
|
|
|
|
|
|
|
|
|
|
|
|
|
|
|
|
The above non-listed stocks are classified as available-for-sale financial assets based on financial assets
categories (see Note 36). Since the range of fair values measurement is significant and difficult to reasonably evaluate the possibilities of the estimations, the fair values of the investments cannot be reliably measured, thus the above non-listed
stocks investment owned by the Company were carried at costs less any impairment losses at the balance sheet date.
CHI evaluated and
concluded its financial assets carried at cost were partially impaired, and recorded an impairment loss of $1,920 thousand and $34,045 thousand for the three months ended September 30, 2013 and 2012, and $28,692 thousand and $111,614 thousand
for the nine months ended September 30, 2013 and 2012, respectively.
37
| 15. |
INVESTMENTS ACCOUNTED FOR USING EQUITY METHOD |
|
|
|
|
|
|
|
|
|
|
|
|
|
|
|
|
|
| |
|
September 30,
2013 |
|
|
December 31,
2012 |
|
|
September 30,
2012 |
|
|
January 1,
2012 |
|
|
|
|
|
|
| Investments in associates |
|
$ |
2,135,104 |
|
|
$ |
1,998,983 |
|
|
$ |
2,433,123 |
|
|
$ |
2,305,328 |
|
| Jointly controlled entity |
|
|
232,343 |
|
|
|
241,309 |
|
|
|
245,214 |
|
|
|
250,689 |
|
|
|
|
|
|
|
|
|
|
|
|
|
|
|
|
|
|
|
|
|
|
|
|
|
$ |
2,367,447 |
|
|
$ |
2,240,292 |
|
|
$ |
2,678,337 |
|
|
$ |
2,556,017 |
|
|
|
|
|
|
|
|
|
|
|
|
|
|
|
|
|
|
| |
a. |
Investments in associates |
Investments in associates were as follows:
|
|
|
|
|
|
|
|
|
|
|
|
|
|
|
|
|
| |
|
Carrying Amount |
|
| |
|
September 30,
2013 |
|
|
December 31,
2012 |
|
|
September 30,
2012 |
|
|
January 1,
2012 |
|
|
|
|
|
|
| Non-listed |
|
|
|
|
|
|
|
|
|
|
|
|
|
|
|
|
|
|
|
|
|
| ST-2 Satellite Ventures Pte., Ltd. (“STS”) |
|
$ |
663,852 |
|
|
$ |
541,672 |
|
|
$ |
548,243 |
|
|
$ |
462,161 |
|
| Senao Networks, Inc. (“SNI”) |
|
|
468,379 |
|
|
|
403,154 |
|
|
|
382,979 |
|
|
|
337,886 |
|
| International Integrated System, Inc. (“IISI”) |
|
|
273,914 |
|
|
|
277,592 |
|
|
|
268,414 |
|
|
|
257,371 |
|
| Viettle-CHT Co., Ltd. |
|
|
271,259 |
|
|
|
265,052 |
|
|
|
262,852 |
|
|
|
255,121 |
|
| Skysoft Co., Ltd. (“SKYSOFT”) |
|
|
143,383 |
|
|
|
127,686 |
|
|
|
122,988 |
|
|
|
113,304 |
|
| Taiwan International Standard Electronics Co., Ltd. (“TISE”) |
|
|
122,481 |
|
|
|
223,949 |
|
|
|
592,545 |
|
|
|
638,120 |
|
| So-net Entertainment Taiwan Limited (“So-net”) |
|
|
89,318 |
|
|
|
31,152 |
|
|
|
32,198 |
|
|
|
34,545 |
|
| Kingwaytek Technology Co., Ltd. (“KWT”) |
|
|
68,201 |
|
|
|
77,449 |
|
|
|
72,253 |
|
|
|
75,369 |
|
| HopeTech Technologies Limited (“HopeTech”) |
|
|
24,669 |
|
|
|
21,741 |
|
|
|
20,961 |
|
|
|
20,970 |
|
| Xiamen Sertec Business Technology Co., Ltd. (“Sertec”) |
|
|
6,774 |
|
|
|
8,634 |
|
|
|
9,191 |
|
|
|
698 |
|
| Dian Zuan Intergrating Marketing Co., Ltd. (“DZIM”) |
|
|
2,874 |
|
|
|
20,902 |
|
|
|
120,499 |
|
|
|
109,783 |
|
| Panda Monium Company Ltd. |
|
|
— |
|
|
|
— |
|
|
|
— |
|
|
|
— |
|
|
|
|
|
|
|
|
|
|
|
|
|
|
|
|
|
|
|
|
|
|
|
|
|
$ |
2,135,104 |
|
|
$ |
1,998,983 |
|
|
$ |
2,433,123 |
|
|
$ |
2,305,328 |
|
|
|
|
|
|
|
|
|
|
|
|
|
|
|
|
|
|
38
At the end of reporting period, the proportion of ownership in associates held by the Company
were as follows:
|
|
|
|
|
|
|
|
|
|
|
|
|
|
|
|
|
| |
|
September 30,
2013 |
|
|
December 31,
2012 |
|
|
September 30,
2012 |
|
|
January 1,
2012 |
|
|
|
|
|
|
| Non-listed |
|
|
|
|
|
|
|
|
|
|
|
|
|
|
|
|
|
|
|
|
|
| ST-2 Satellite Ventures Pte., Ltd. (“STS”) |
|
|
38 |
% |
|
|
38 |
% |
|
|
38 |
% |
|
|
38 |
% |
| Senao Networks, Inc. (“SNI”) |
|
|
40 |
% |
|
|
40 |
% |
|
|
41 |
% |
|
|
41 |
% |
| International Integrated System, Inc. (“IISI”) |
|
|
33 |
% |
|
|
33 |
% |
|
|
33 |
% |
|
|
33 |
% |
| Viettle-CHT Co., Ltd. |
|
|
30 |
% |
|
|
30 |
% |
|
|
30 |
% |
|
|
30 |
% |
| Skysoft Co., Ltd. (“SKYSOFT”) |
|
|
30 |
% |
|
|
30 |
% |
|
|
30 |
% |
|
|
30 |
% |
| Taiwan International Standard Electronics Co., Ltd. (“TISE”) |
|
|
40 |
% |
|
|
40 |
% |
|
|
40 |
% |
|
|
40 |
% |
| So-net Entertainment Taiwan Limited (“So-net”) |
|
|
30 |
% |
|
|
30 |
% |
|
|
30 |
% |
|
|
30 |
% |
| Kingwaytek Technology Co., Ltd. (“KWT”) |
|
|
33 |
% |
|
|
33 |
% |
|
|
33 |
% |
|
|
33 |
% |
| HopeTech Technologies Limited (“HopeTech”) |
|
|
45 |
% |
|
|
45 |
% |
|
|
45 |
% |
|
|
45 |
% |
| Xiamen Sertec Business Technology Co., Ltd. (“Sertec”) |
|
|
49 |
% |
|
|
49 |
% |
|
|
49 |
% |
|
|
49 |
% |
| Dian Zuan Intergrating Marketing Co., Ltd. (“DZIM”) |
|
|
13 |
% |
|
|
33 |
% |
|
|
40 |
% |
|
|
40 |
% |
| Panda Monium Company Ltd. |
|
|
43 |
% |
|
|
43 |
% |
|
|
43 |
% |
|
|
43 |
% |
Summarized financial information of associates were as follows:
|
|
|
|
|
|
|
|
|
|
|
|
|
|
|
|
|
| |
|
September 30,
2013 |
|
|
December 31,
2012 |
|
|
September 30,
2012 |
|
|
January 1,
2012 |
|
|
|
|
|
|
| Total assets |
|
$ |
20,512,732 |
|
|
$ |
20,013,969 |
|
|
$ |
21,438,321 |
|
|
$ |
20,020,401 |
|
|
|
|
|
|
|
|
|
|
|
|
|
|
|
|
|
|
| Total liabilities |
|
$ |
13,966,416 |
|
|
$ |
13,952,740 |
|
|
$ |
14,431,632 |
|
|
$ |
13,425,684 |
|
|
|
|
|
|
|
|
|
|
|
|
|
|
|
|
|
|
|
|
|
|
|
|
|
|
|
|
|
|
|
|
|
|
|
| |
|
Three Months Ended
September 30 |
|
|
Nine Months Ended
September 30 |
|
| |
|
2013 |
|
|
2012 |
|
|
2013 |
|
|
2012 |
|
|
|
|
|
|
| Net revenues |
|
$ |
3,141,696 |
|
|
$ |
5,389,325 |
|
|
$ |
9,539,239 |
|
|
$ |
11,171,295 |
|
|
|
|
|
|
|
|
|
|
|
|
|
|
|
|
|
|
| Net income |
|
$ |
460,779 |
|
|
$ |
475,737 |
|
|
$ |
1,330,490 |
|
|
$ |
1,200,071 |
|
|
|
|
|
|
|
|
|
|
|
|
|
|
|
|
|
|
| Other comprehensive income |
|
$ |
(39,324 |
) |
|
$ |
149,402 |
|
|
$ |
(21,558 |
) |
|
$ |
(11,163 |
) |
|
|
|
|
|
|
|
|
|
|
|
|
|
|
|
|
|
| The Company’s share of the profit or loss of associates accounted for using equity method |
|
$ |
225,696 |
|
|
$ |
181,502 |
|
|
$ |
534,146 |
|
|
$ |
467,413 |
|
|
|
|
|
|
|
|
|
|
|
|
|
|
|
|
|
|
Chunghwa participated in the capital increase of So-net by investing $60,000 thousand in March 2013. The
ownership interest remains 30% after the capital increase.
39
Chunghwa, President Chain Store Corporation and EasyCard Corporation established an associate,
DZIM, in May 2011. Chunghwa invested $114,640 thousand cash and held 40% ownership of DZIM in May 2011. Chunghwa participated in the capital increase of DZIM by investing $14,360 thousand in May 2012 but did not subscribe the shares at its
corresponding proportion. Thus, the ownership interest decreased from 40% to 33% after the capital increase of DZIM. DZIM reduced its capital by $193,490 thousand in December 2012; Chunghwa received $64,500 thousand capital distribution and the
ownership interest remains at 33%. DZIM reduced its capital to offset the deficits amounted to $130,787 thousand and made capital reduction of $49,158 thousand during its stockholders’ meeting held in March 31, 2013. Chunghwa received
$16,387 thousand from capital reduction. Chunghwa did not participate in the capital increase of DZIM in July 2013 and the ownership interest decreased from 33% to 13% after the capital increase of DZIM. The Company still has 2 members among 7
members to the board of directors; therefore it remains an investor with significant influence over DZIM. DZIM engages mainly in information technology service and general advertisement service.
COI participated in the capital increase of Sertec by investing $11,552 thousand in February 2012. COI retained 49% ownership of Sertec after
the capital increase.
The Company’s share of profit (loss) and other comprehensive income (loss) of investees was recorded based on
the reviewed financial statements for the three months and nine months ended September 30, 2013 and 2012.
| |
b. |
Investments in jointly controlled entity |
Investments in jointly controlled entity were as
follows:
|
|
|
|
|
|
|
|
|
|
|
|
|
|
|
|
|
|
|
|
|
|
|
|
|
|
|
|
|
|
|
|
|
| |
|
Carrying Amount |
|
|
% of Ownership and Voting Rights |
|
| |
|
September 30,
2013 |
|
|
December 31,
2012 |
|
|
September 30,
2012 |
|
|
January 1,
2012 |
|
|
September 30,
2013 |
|
|
December 31,
2012 |
|
|
September 30,
2012 |
|
|
January 1,
2012 |
|
|
|
|
|
|
|
|
|
|
| Non-listed |
|
|
|
|
|
|
|
|
|
|
|
|
|
|
|
|
|
|
|
|
|
|
|
|
|
|
|
|
|
|
|
|
|
|
|
|
|
|
|
|
|
| Huada Digital Corporation (“HDD”) |
|
$ |
232,343 |
|
|
$ |
241,309 |
|
|
$ |
245,214 |
|
|
$ |
250,689 |
|
|
|
50 |
% |
|
|
50 |
% |
|
|
50 |
% |
|
|
50 |
% |
|
|
|
|
|
|
|
|
|
|
|
|
|
|
|
|
|
|
|
|
|
|
|
|
|
|
|
|
|
|
|
|
|
Chunghwa invested in HDD in September 2011 at $250,000 thousand cash to acquire 50% of its shares and the rest
of 50% ownership interest was held by HTC Corporation (“HTC”). After the stockholders’ meeting of HDD held on March 2, 2012, Chunghwa and HTC each obtained half of director seats. Thus, neither Chunghwa nor HTC obtained control
over HDD. HDD engages mainly in providing software service.
Summarized financial information of jointly controlled entity was as follows:
|
|
|
|
|
|
|
|
|
|
|
|
|
|
|
|
|
| |
|
September 30,
2013 |
|
|
December 31,
2012 |
|
|
September 30,
2012 |
|
|
January 1,
2012 |
|
|
|
|
|
|
| Current assets |
|
$ |
228,732 |
|
|
$ |
238,663 |
|
|
$ |
242,456 |
|
|
$ |
250,774 |
|
|
|
|
|
|
|
|
|
|
|
|
|
|
|
|
|
|
| Non-current assets |
|
$ |
5,815 |
|
|
$ |
5,909 |
|
|
$ |
4,711 |
|
|
$ |
— |
|
|
|
|
|
|
|
|
|
|
|
|
|
|
|
|
|
|
| Current liabilities |
|
$ |
2,204 |
|
|
$ |
3,263 |
|
|
$ |
1,953 |
|
|
$ |
85 |
|
|
|
|
|
|
|
|
|
|
|
|
|
|
|
|
|
|
| Non-current liabilities |
|
$ |
— |
|
|
$ |
— |
|
|
$ |
— |
|
|
$ |
— |
|
|
|
|
|
|
|
|
|
|
|
|
|
|
|
|
|
|
|
|
|
|
|
|
|
|
|
|
|
|
|
|
|
|
|
| |
|
Three Months Ended
September 30 |
|
|
Nine Months Ended
September 30 |
|
| |
|
2013 |
|
|
2012 |
|
|
2013 |
|
|
2012 |
|
|
|
|
|
|
| Profit or loss |
|
|
|
|
|
|
|
|
|
|
|
|
|
|
|
|
| Revenues and income |
|
$ |
2,141 |
|
|
$ |
1,545 |
|
|
$ |
5,882 |
|
|
$ |
2,537 |
|
|
|
|
|
|
|
|
|
|
|
|
|
|
|
|
|
|
| Expenses and losses |
|
$ |
(5,016 |
) |
|
$ |
(4,391 |
) |
|
$ |
(14,848 |
) |
|
$ |
(8,012 |
) |
|
|
|
|
|
|
|
|
|
|
|
|
|
|
|
|
|
| The Company’s share of profits of the jointly controlled entity accounted for using equity method |
|
$ |
(2,875 |
) |
|
$ |
(2,846 |
) |
|
$ |
(8,966 |
) |
|
$ |
(5,475 |
) |
|
|
|
|
|
|
|
|
|
|
|
|
|
|
|
|
|
The Company’s investments accounted for using entity method share of profits of the jointly controlled
entity was recorded based on the reviewed financial statements for the three months and nine months ended September 30, 2013 and 2012.
40
| 16. |
PROPERTY, PLANT AND EQUIPMENT |
|
|
|
|
|
|
|
|
|
|
|
|
|
|
|
|
|
|
|
|
|
|
|
|
|
|
|
|
|
|
|
|
|
|
|
|
|
| |
|
Land |
|
|
Land
Improvements |
|
|
Buildings |
|
|
Computer
Equipment |
|
|
Telecommunications
Equipment |
|
|
Transportation
Equipment |
|
|
Miscellaneous
Equipment |
|
|
Construction in
Progress and
Advances Related
to Acquisition of
Equipment |
|
|
Total |
|
|
|
|
|
|
|
|
|
|
|
| Cost |
|
|
|
|
|
|
|
|
|
|
|
|
|
|
|
|
|
|
|
|
|
|
|
|
|
|
|
|
|
|
|
|
|
|
|
|
|
|
|
|
|
|
|
|
|
|
| Balance on January 1, 2012 |
|
$ |
102,122,004 |
|
|
$ |
1,521,126 |
|
|
$ |
67,288,565 |
|
|
$ |
14,808,361 |
|
|
$ |
655,542,989 |
|
|
$ |
2,526,674 |
|
|
$ |
7,220,343 |
|
|
$ |
13,688,548 |
|
|
$ |
864,718,610 |
|
| Additions |
|
|
— |
|
|
|
— |
|
|
|
— |
|
|
|
34,111 |
|
|
|
32,657 |
|
|
|
631 |
|
|
|
180,181 |
|
|
|
21,723,588 |
|
|
|
21,971,168 |
|
| Disposal |
|
|
(14,140 |
) |
|
|
— |
|
|
|
(25,626 |
) |
|
|
(740,725 |
) |
|
|
(8,298,092 |
) |
|
|
(355,644 |
) |
|
|
(329,334 |
) |
|
|
— |
|
|
|
(9,763,561 |
) |
| Effect of foreign exchange differences |
|
|
— |
|
|
|
— |
|
|
|
— |
|
|
|
(1,088 |
) |
|
|
545 |
|
|
|
(4 |
) |
|
|
(2,481 |
) |
|
|
(13,502 |
) |
|
|
(16,530 |
) |
| Other |
|
|
59,193 |
|
|
|
23,964 |
|
|
|
57,444 |
|
|
|
744,377 |
|
|
|
15,989,353 |
|
|
|
856,363 |
|
|
|
353,014 |
|
|
|
(18,199,800 |
) |
|
|
(116,092 |
) |
|
|
|
|
|
|
|
|
|
|
|
|
|
|
|
|
|
|
|
|
|
|
|
|
|
|
|
|
|
|
|
|
|
|
|
|
|
|
|
|
|
|
|
|
|
|
|
| Balance on September 30, 2012 |
|
$ |
102,167,057 |
|
|
$ |
1,545,090 |
|
|
$ |
67,320,383 |
|
|
$ |
14,845,036 |
|
|
$ |
663,267,452 |
|
|
$ |
3,028,020 |
|
|
$ |
7,421,723 |
|
|
$ |
17,198,834 |
|
|
$ |
876,793,595 |
|
|
|
|
|
|
|
|
|
|
|
|
|
|
|
|
|
|
|
|
|
|
|
|
|
|
|
|
|
|
|
|
|
|
|
|
|
|
|
|
|
|
|
|
|
|
|
|
| Accumulated depreciation and impairment |
|
|
|
|
|
|
|
|
|
|
|
|
|
|
|
|
|
|
|
|
|
|
|
|
|
|
|
|
|
|
|
|
|
|
|
|
|
|
|
|
|
|
|
|
|
|
| Balance on January 1, 2012 |
|
$ |
— |
|
|
$ |
(1,016,500 |
) |
|
$ |
(19,670,023 |
) |
|
$ |
(10,919,241 |
) |
|
$ |
(531,242,952 |
) |
|
$ |
(1,254,273 |
) |
|
$ |
(5,583,790 |
) |
|
$ |
— |
|
|
$ |
(569,686,779 |
) |
| Depreciation Expenses |
|
|
— |
|
|
|
(42,194 |
) |
|
|
(913,974 |
) |
|
|
(1,007,293 |
) |
|
|
(20,686,294 |
) |
|
|
(287,996 |
) |
|
|
(388,735 |
) |
|
|
— |
|
|
|
(23,326,486 |
) |
| Disposal |
|
|
— |
|
|
|
— |
|
|
|
25,626 |
|
|
|
732,628 |
|
|
|
8,284,794 |
|
|
|
355,644 |
|
|
|
319,871 |
|
|
|
— |
|
|
|
9,718,563 |
|
| Effect of foreign exchange differences |
|
|
— |
|
|
|
— |
|
|
|
— |
|
|
|
178 |
|
|
|
828 |
|
|
|
— |
|
|
|
573 |
|
|
|
— |
|
|
|
1,579 |
|
| Other |
|
|
— |
|
|
|
442 |
|
|
|
(6,815 |
) |
|
|
(4,222 |
) |
|
|
40,411 |
|
|
|
(4,605 |
) |
|
|
(42,903 |
) |
|
|
— |
|
|
|
(17,692 |
) |
|
|
|
|
|
|
|
|
|
|
|
|
|
|
|
|
|
|
|
|
|
|
|
|
|
|
|
|
|
|
|
|
|
|
|
|
|
|
|
|
|
|
|
|
|
|
|
| Balance on September 30, 2012 |
|
$ |
— |
|
|
$ |
(1,058,252 |
) |
|
$ |
(20,565,186 |
) |
|
$ |
(11,197,950 |
) |
|
$ |
(543,603,213 |
) |
|
$ |
(1,191,230 |
) |
|
$ |
(5,694,984 |
) |
|
$ |
— |
|
|
$ |
(583,310,815 |
) |
|
|
|
|
|
|
|
|
|
|
|
|
|
|
|
|
|
|
|
|
|
|
|
|
|
|
|
|
|
|
|
|
|
|
|
|
|
|
|
|
|
|
|
|
|
|
|
| Balance on January 1, 2012, net |
|
$ |
102,122,004 |
|
|
$ |
504,626 |
|
|
$ |
47,618,542 |
|
|
$ |
3,889,120 |
|
|
$ |
124,300,037 |
|
|
$ |
1,272,401 |
|
|
$ |
1,636,553 |
|
|
$ |
13,688,548 |
|
|
$ |
295,031,831 |
|
|
|
|
|
|
|
|
|
|
|
|
|
|
|
|
|
|
|
|
|
|
|
|
|
|
|
|
|
|
|
|
|
|
|
|
|
|
| Balance on September 30, 2012, net |
|
$ |
102,167,057 |
|
|
$ |
486,838 |
|
|
$ |
46,755,197 |
|
|
$ |
3,647,086 |
|
|
$ |
119,664,239 |
|
|
$ |
1,836,790 |
|
|
$ |
1,726,739 |
|
|
$ |
17,198,834 |
|
|
$ |
293,482,780 |
|
|
|
|
|
|
|
|
|
|
|
|
|
|
|
|
|
|
|
|
|
|
|
|
|
|
|
|
|
|
|
|
|
|
|
|
|
|
|
|
|
|
|
|
|
|
|
|
| Cost |
|
|
|
|
|
|
|
|
|
|
|
|
|
|
|
|
|
|
|
|
|
|
|
|
|
|
|
|
|
|
|
|
|
|
|
|
|
|
|
|
|
|
|
|
|
|
| Balance on January 1, 2013 |
|
$ |
102,196,615 |
|
|
$ |
1,548,184 |
|
|
$ |
67,428,504 |
|
|
$ |
15,233,816 |
|
|
$ |
669,375,712 |
|
|
$ |
3,315,452 |
|
|
$ |
7,588,449 |
|
|
$ |
18,683,121 |
|
|
$ |
885,369,853 |
|
| Additions |
|
|
— |
|
|
|
— |
|
|
|
4,058 |
|
|
|
48,118 |
|
|
|
34,842 |
|
|
|
1,145 |
|
|
|
221,083 |
|
|
|
22,271,534 |
|
|
|
22,580,780 |
|
| Disposal |
|
|
— |
|
|
|
(8,971 |
) |
|
|
(4,298 |
) |
|
|
(623,384 |
) |
|
|
(9,142,904 |
) |
|
|
(131,015 |
) |
|
|
(315,214 |
) |
|
|
— |
|
|
|
(10,225,786 |
) |
| Effect of foreign exchange differences |
|
|
— |
|
|
|
— |
|
|
|
— |
|
|
|
1,542 |
|
|
|
(25,939 |
) |
|
|
23 |
|
|
|
3,211 |
|
|
|
21,029 |
|
|
|
(134 |
) |
| Other |
|
|
24,772 |
|
|
|
9,870 |
|
|
|
(62,255 |
) |
|
|
932,106 |
|
|
|
17,956,375 |
|
|
|
491,080 |
|
|
|
551,173 |
|
|
|
(19,772,413 |
) |
|
|
130,708 |
|
|
|
|
|
|
|
|
|
|
|
|
|
|
|
|
|
|
|
|
|
|
|
|
|
|
|
|
|
|
|
|
|
|
|
|
|
|
|
|
|
|
|
|
|
|
|
|
| Balance on September 30, 2013 |
|
$ |
102,221,387 |
|
|
$ |
1,549,083 |
|
|
$ |
67,366,009 |
|
|
$ |
15,592,198 |
|
|
$ |
678,198,086 |
|
|
$ |
3,676,685 |
|
|
$ |
8,048,702 |
|
|
$ |
21,203,271 |
|
|
$ |
897,855,421 |
|
|
|
|
|
|
|
|
|
|
|
|
|
|
|
|
|
|
|
|
|
|
|
|
|
|
|
|
|
|
|
|
|
|
|
|
|
|
|
|
|
|
|
|
|
|
|
|
| Accumulated depreciation and impairment |
|
|
|
|
|
|
|
|
|
|
|
|
|
|
|
|
|
|
|
|
|
|
|
|
|
|
|
|
|
|
|
|
|
|
|
|
|
|
|
|
|
|
|
|
|
|
| Balance on January 1, 2013 |
|
$ |
— |
|
|
$ |
(1,067,498 |
) |
|
$ |
(20,824,621 |
) |
|
$ |
(11,348,414 |
) |
|
$ |
(547,845,695 |
) |
|
$ |
(1,270,172 |
) |
|
$ |
(5,671,104 |
) |
|
$ |
— |
|
|
$ |
(588,027,504 |
) |
| Depreciation Expenses |
|
|
— |
|
|
|
(40,812 |
) |
|
|
(930,227 |
) |
|
|
(1,018,811 |
) |
|
|
(20,163,388 |
) |
|
|
(403,868 |
) |
|
|
(540,666 |
) |
|
|
— |
|
|
|
(23,097,772 |
) |
| Disposal |
|
|
— |
|
|
|
8,971 |
|
|
|
4,299 |
|
|
|
621,064 |
|
|
|
9,126,391 |
|
|
|
131,015 |
|
|
|
305,987 |
|
|
|
— |
|
|
|
10,197,727 |
|
| Impairment losses |
|
|
— |
|
|
|
— |
|
|
|
— |
|
|
|
— |
|
|
|
(2,262 |
) |
|
|
— |
|
|
|
— |
|
|
|
— |
|
|
|
(2,262 |
) |
| Effect of foreign exchange differences |
|
|
— |
|
|
|
— |
|
|
|
— |
|
|
|
(453 |
) |
|
|
2,119 |
|
|
|
(8 |
) |
|
|
(1,852 |
) |
|
|
— |
|
|
|
(194 |
) |
| Other |
|
|
— |
|
|
|
321 |
|
|
|
59,624 |
|
|
|
(518 |
) |
|
|
(1,333 |
) |
|
|
(6,565 |
) |
|
|
(166,145 |
) |
|
|
— |
|
|
|
(114,616 |
) |
|
|
|
|
|
|
|
|
|
|
|
|
|
|
|
|
|
|
|
|
|
|
|
|
|
|
|
|
|
|
|
|
|
|
|
|
|
|
|
|
|
|
|
|
|
|
|
| Balance on September 30, 2013 |
|
$ |
— |
|
|
$ |
(1,099,018 |
) |
|
$ |
(21,690,925 |
) |
|
$ |
(11,747,132 |
) |
|
$ |
(558,884,168 |
) |
|
$ |
(1,549,598 |
) |
|
$ |
(6,073,780 |
) |
|
$ |
— |
|
|
$ |
(601,044,621 |
) |
|
|
|
|
|
|
|
|
|
|
|
|
|
|
|
|
|
|
|
|
|
|
|
|
|
|
|
|
|
|
|
|
|
|
|
|
|
|
|
|
|
|
|
|
|
|
|
| Balance on January 1, 2013, net |
|
$ |
102,196,615 |
|
|
$ |
480,686 |
|
|
$ |
46,603,883 |
|
|
$ |
3,885,402 |
|
|
$ |
121,530,017 |
|
|
$ |
2,045,280 |
|
|
$ |
1,917,345 |
|
|
$ |
18,683,121 |
|
|
$ |
297,342,349 |
|
|
|
|
|
|
|
|
|
|
|
|
|
|
|
|
|
|
|
|
|
|
|
|
|
|
|
|
|
|
|
|
|
|
|
|
|
|
| Balance on September 30, 2013, net |
|
$ |
102,221,387 |
|
|
$ |
450,065 |
|
|
$ |
45,675,084 |
|
|
$ |
3,845,066 |
|
|
$ |
119,313,918 |
|
|
$ |
2,127,087 |
|
|
$ |
1,974,922 |
|
|
$ |
21,203,271 |
|
|
$ |
296,810,800 |
|
|
|
|
|
|
|
|
|
|
|
|
|
|
|
|
|
|
|
|
|
|
|
|
|
|
|
|
|
|
|
|
|
|
|
|
|
|
41
At March 31, 2013, impairment indications for property, plant and equipment were noted, the
Company performed the impairment assessment of telecommunications equipment and recorded an impairment loss of $2,262 thousands for the three months ended March 31, 2013. No impairment loss was recorded for the three month period ended September 30,
2013.
Depreciation expense is computed using the straight-line method over the following estimated service lives:
|
|
|
|
|
| Land improvement |
|
|
8-30 years |
|
| Buildings |
|
|
|
|
| Main building |
|
|
35-60 years |
|
| Other building facilities |
|
|
3-10 years |
|
| Computer equipment |
|
|
3-8 years |
|
| Telecommunications equipment |
|
|
|
|
| Telecommunication circuits |
|
|
9-15 years |
|
| Telecommunication machinery and antennas equipment |
|
|
5-10 years |
|
| Transportation equipment |
|
|
3-10 years |
|
| Miscellaneous equipment |
|
|
|
|
| Leasehold improvements |
|
|
2-6 years |
|
| Mechanical and air conditioner equipment |
|
|
8-16 years |
|
| Others |
|
|
3-10 years |
|
| 17. |
INVESTMENT PROPERTIES |
|
|
|
|
|
| |
|
Investment
Properties |
|
|
|
| Cost |
|
|
|
|
|
|
| Balance on January 1, 2012 |
|
$ |
9,248,604 |
|
| Reclassification |
|
|
26,295 |
|
|
|
|
|
|
|
|
| Balance on September 30, 2012 |
|
$ |
9,274,899 |
|
|
|
|
|
|
|
|
| Accumulated depreciation and impairment |
|
|
|
|
|
|
| Balance on January 1, 2012 |
|
$ |
(188,523 |
) |
| Depreciation expense |
|
|
(12,260 |
) |
| Recognized impairment loss |
|
|
(1,261,365 |
) |
| Reclassification |
|
|
(47 |
) |
|
|
|
|
|
|
|
| Balance on September 30, 2012 |
|
$ |
(1,462,195 |
) |
|
|
|
|
|
|
|
| Balance on January 1, 2012, net |
|
$ |
9,060,081 |
|
|
|
|
|
|
| Balance on September 30, 2012, net |
|
$ |
7,812,704 |
|
|
|
|
|
|
|
|
| Cost |
|
|
|
|
|
|
| Balance on January 1, 2013 and September 30, 2013 |
|
$ |
9,260,015 |
|
|
|
|
|
|
(Continued)
42
|
|
|
|
|
| |
|
Investment
Properties |
|
|
|
| Accumulated depreciation and impairment |
|
|
|
|
|
|
| Balance on January 1, 2013 |
|
$ |
(1,471,117 |
) |
| Depreciation expense |
|
|
(12,434 |
) |
|
|
|
|
|
|
|
| Balance on September 30, 2013 |
|
$ |
(1,483,551 |
) |
|
|
|
|
|
|
|
| Balance on January 1, 2013, net |
|
$ |
7,788,898 |
|
|
|
|
|
|
| Balance on September 30, 2013, net |
|
$ |
7,776,464 |
|
|
|
|
|
|
(Concluded)
There is no impairment indications noted for investment properties and the Company did not perform impairment assessment of investment
properties for the three months ended September 30, 2013 and nine months ended September 30, 2013.
After evaluating the
investment properties, the Company determined that some investments were impaired and recognized an impairment loss of $1,261,365 thousand for the three months ended June 30, 2012 and nine months ended September 30, 2012.
Depreciation expense is computed using the straight-line method over the following estimated service lives:
|
|
|
|
|
| Land improvements |
|
|
8-30 years |
|
| Buildings |
|
|
|
|
| Main buildings |
|
|
35-60 years |
|
| Other building facilities |
|
|
3-10 years |
|
The fair value of the Company’s investment properties as of January 1, 2012 and December 31,
2012 was determined on the appraisal reports conducted by independent appraisers. The Company used the abovementioned appraisal reports as the basis to calculate fair value as of September 30, 2013 and 2012 because there was no material change
in the economic environment and the market trading price. Those appraisal reports are based on the comparison approach, income approach or cost approach. Key assumptions and the fair values were as follows:
|
|
|
|
|
|
|
|
|
| |
|
September 30,
2013 |
|
December 31,
2012 |
|
September 30,
2012 |
|
January 1,
2012 |
|
|
|
|
|
| Fair value |
|
$15,510,857 |
|
$15,510,857 |
|
$15,058,328 |
|
$15,058,328 |
|
|
|
|
|
|
|
|
|
| Capitalized interest rate |
|
1.46% |
|
1.46% |
|
1.46% |
|
1.46% |
| Profit margin ratio |
|
12%-15% |
|
12%-15% |
|
12%-15% |
|
12%-15% |
| Discount rate |
|
1.36% |
|
1.36% |
|
1.36% |
|
1.36% |
| Capitalization rate |
|
1.5%-2.05% |
|
1.5%-2.05% |
|
1.5%-2.05% |
|
1.5%-2.05% |
All of the Company’s investment properties are held under freehold interest.
43
|
|
|
|
|
|
|
|
|
|
|
|
|
|
|
|
|
|
|
|
|
| |
|
3G Concession |
|
|
Computer
Software |
|
|
Goodwill |
|
|
Others |
|
|
Total |
|
|
|
|
|
|
|
| Cost |
|
|
|
|
|
|
|
|
|
|
|
|
|
|
|
|
|
|
|
|
|
|
|
|
|
|
| Balance on January 1, 2012 |
|
$ |
10,179,000 |
|
|
$ |
1,732,720 |
|
|
$ |
180,631 |
|
|
$ |
139,005 |
|
|
$ |
12,231,356 |
|
| Additions-acquired separately |
|
|
— |
|
|
|
398,308 |
|
|
|
— |
|
|
|
1,068 |
|
|
|
399,376 |
|
| Disposal |
|
|
— |
|
|
|
(19,354 |
) |
|
|
— |
|
|
|
— |
|
|
|
(19,354 |
) |
| Abandonment |
|
|
— |
|
|
|
(153,168 |
) |
|
|
— |
|
|
|
— |
|
|
|
(153,168 |
) |
| Effect of foreign exchange difference |
|
|
— |
|
|
|
(6 |
) |
|
|
— |
|
|
|
— |
|
|
|
(6 |
) |
|
|
|
|
|
|
|
|
|
|
|
|
|
|
|
|
|
|
|
|
|
|
|
|
|
|
|
| Balance on September 30, 2012 |
|
$ |
10,179,000 |
|
|
$ |
1,958,500 |
|
|
$ |
180,631 |
|
|
$ |
140,073 |
|
|
$ |
12,458,204 |
|
|
|
|
|
|
|
|
|
|
|
|
|
|
|
|
|
|
|
|
|
|
|
|
|
|
|
|
| Accumulated amortization and impairment |
|
|
|
|
|
|
|
|
|
|
|
|
|
|
|
|
|
|
|
|
|
|
|
|
|
|
| Balance on January 1, 2012 |
|
$ |
(4,938,738 |
) |
|
$ |
(981,580 |
) |
|
$ |
— |
|
|
$ |
(32,863 |
) |
|
$ |
(5,953,181 |
) |
| Amortization expenses |
|
|
(561,457 |
) |
|
|
(265,224 |
) |
|
|
— |
|
|
|
(6,823 |
) |
|
|
(833,504 |
) |
| Disposal |
|
|
— |
|
|
|
19,354 |
|
|
|
— |
|
|
|
— |
|
|
|
19,354 |
|
| Abandonment |
|
|
— |
|
|
|
153,168 |
|
|
|
— |
|
|
|
— |
|
|
|
153,168 |
|
| Effect of foreign exchange difference |
|
|
— |
|
|
|
2 |
|
|
|
— |
|
|
|
— |
|
|
|
2 |
|
|
|
|
|
|
|
|
|
|
|
|
|
|
|
|
|
|
|
|
|
|
|
|
|
|
|
|
| Balance on September 30, 2012 |
|
$ |
(5,500,195 |
) |
|
$ |
(1,074,280 |
) |
|
$ |
— |
|
|
$ |
(39,686 |
) |
|
$ |
(6,614,161 |
) |
|
|
|
|
|
|
|
|
|
|
|
|
|
|
|
|
|
|
|
|
|
|
|
|
|
|
|
| Balance on January 1, 2012, net |
|
$ |
5,240,262 |
|
|
$ |
751,140 |
|
|
$ |
180,631 |
|
|
$ |
106,142 |
|
|
$ |
6,278,175 |
|
|
|
|
|
|
|
|
|
|
|
|
|
|
|
|
|
|
|
|
|
|
| Balance on September 30, 2012, net |
|
$ |
4,678,805 |
|
|
$ |
884,220 |
|
|
$ |
180,631 |
|
|
$ |
100,387 |
|
|
$ |
5,844,043 |
|
|
|
|
|
|
|
|
|
|
|
|
|
|
|
|
|
|
|
|
|
|
|
|
|
|
|
|
| Cost |
|
|
|
|
|
|
|
|
|
|
|
|
|
|
|
|
|
|
|
|
|
|
|
|
|
|
| Balance on January 1, 2013 |
|
$ |
10,179,000 |
|
|
$ |
2,065,542 |
|
|
$ |
180,631 |
|
|
$ |
116,650 |
|
|
$ |
12,541,823 |
|
| Additions-acquired separately |
|
|
— |
|
|
|
511,195 |
|
|
|
— |
|
|
|
676 |
|
|
|
511,871 |
|
| Disposal |
|
|
— |
|
|
|
(739 |
) |
|
|
— |
|
|
|
— |
|
|
|
(739 |
) |
| Abandonment |
|
|
— |
|
|
|
(168,892 |
) |
|
|
— |
|
|
|
— |
|
|
|
(168,892 |
) |
| Effect of foreign exchange difference |
|
|
— |
|
|
|
880 |
|
|
|
— |
|
|
|
279 |
|
|
|
1,159 |
|
|
|
|
|
|
|
|
|
|
|
|
|
|
|
|
|
|
|
|
|
|
|
|
|
|
|
|
| Balance on September 30, 2013 |
|
$ |
10,179,000 |
|
|
$ |
2,407,986 |
|
|
$ |
180,631 |
|
|
$ |
117,605 |
|
|
$ |
12,885,222 |
|
|
|
|
|
|
|
|
|
|
|
|
|
|
|
|
|
|
|
|
|
|
|
|
|
|
|
|
| Accumulated amortization and impairment |
|
|
|
|
|
|
|
|
|
|
|
|
|
|
|
|
|
|
|
|
|
|
|
|
|
|
| Balance on January 1, 2013 |
|
$ |
(5,687,347 |
) |
|
$ |
(1,049,664 |
) |
|
$ |
— |
|
|
$ |
(23,009 |
) |
|
$ |
(6,760,020 |
) |
| Amortization expenses |
|
|
(561,457 |
) |
|
|
(347,629 |
) |
|
|
— |
|
|
|
(5,831 |
) |
|
|
(914,917 |
) |
| Disposal |
|
|
— |
|
|
|
739 |
|
|
|
— |
|
|
|
— |
|
|
|
739 |
|
| Abandonment |
|
|
— |
|
|
|
168,892 |
|
|
|
— |
|
|
|
— |
|
|
|
168,892 |
|
| Impairment loss |
|
|
— |
|
|
|
— |
|
|
|
(18,055 |
) |
|
|
— |
|
|
|
(18,055 |
) |
| Effect of foreign exchange difference |
|
|
— |
|
|
|
(59 |
) |
|
|
— |
|
|
|
— |
|
|
|
(59 |
) |
|
|
|
|
|
|
|
|
|
|
|
|
|
|
|
|
|
|
|
|
|
|
|
|
|
|
|
| Balance on September 30, 2013 |
|
$ |
(6,248,804 |
) |
|
$ |
(1,227,721 |
) |
|
$ |
(18,055 |
) |
|
$ |
(28,840 |
) |
|
$ |
(7,523,420 |
) |
|
|
|
|
|
|
|
|
|
|
|
|
|
|
|
|
|
|
|
|
|
|
|
|
|
|
|
| Balance on January 1, 2013, net |
|
$ |
4,491,653 |
|
|
$ |
1,015,878 |
|
|
$ |
180,631 |
|
|
$ |
93,641 |
|
|
$ |
5,781,803 |
|
|
|
|
|
|
|
|
|
|
|
|
|
|
|
|
|
|
|
|
|
|
| Balance on September 30, 2013, net |
|
$ |
3,930,196 |
|
|
$ |
1,180,265 |
|
|
$ |
162,576 |
|
|
$ |
88,765 |
|
|
$ |
5,361,802 |
|
|
|
|
|
|
|
|
|
|
|
|
|
|
|
|
|
|
|
|
|
|
Except for goodwill, the amortization expense is computed using the straight-line method over the following
estimated service lives:
The computer software is amortized using the straight-line method over the estimated useful lives of 2 to 10
years.
The 3G Concession fee is amortized on a straight-line basis from the date operations commence through the date the license expires.
Other intangible assets are amortized using the straight-line method over the estimated useful lives of 3 to 20 years. Goodwill is not
subject to amortization.
44
The Company recognized an impairment loss of $18,055 thousand on the goodwill arising from the
business combination of a subsidiary, CHI, due to CHI underwent organization downsizing for the three months ended March 31, 2013 and the nine months ended September 30, 2013.
The Company did not recognize any impairment loss on goodwill for the three months ended September 30, 2012 and 2013, and the nine months
ended September 30, 2012.
|
|
|
|
|
|
|
|
|
|
|
|
|
|
|
|
|
| |
|
September 30,
2013 |
|
|
December 31,
2012 |
|
|
September 30,
2012 |
|
|
January 1,
2012 |
|
|
|
|
|
|
| Spare parts |
|
$ |
3,182,763 |
|
|
$ |
4,046,050 |
|
|
$ |
4,171,910 |
|
|
$ |
2,305,655 |
|
| Refundable deposits |
|
|
2,039,264 |
|
|
|
2,087,034 |
|
|
|
1,901,688 |
|
|
|
1,760,149 |
|
| Other financial assets |
|
|
1,000,000 |
|
|
|
1,000,000 |
|
|
|
1,000,000 |
|
|
|
1,000,000 |
|
| Telecom license bid bond |
|
|
1,000,000 |
|
|
|
— |
|
|
|
— |
|
|
|
— |
|
| Others |
|
|
2,270,614 |
|
|
|
1,938,040 |
|
|
|
1,565,038 |
|
|
|
1,832,197 |
|
|
|
|
|
|
|
|
|
|
|
|
|
|
|
|
|
|
|
|
|
|
|
|
|
$ |
9,492,641 |
|
|
$ |
9,071,124 |
|
|
$ |
8,638,636 |
|
|
$ |
6,898,001 |
|
|
|
|
|
|
|
|
|
|
|
|
|
|
|
|
|
|
|
|
|
|
|
| Current |
|
|
|
|
|
|
|
|
|
|
|
|
|
|
|
|
| Spare parts |
|
$ |
3,182,763 |
|
|
$ |
4,046,050 |
|
|
$ |
4,171,910 |
|
|
$ |
2,305,655 |
|
| Others |
|
|
804,449 |
|
|
|
428,545 |
|
|
|
470,089 |
|
|
|
734,181 |
|
|
|
|
|
|
|
|
|
|
|
|
|
|
|
|
|
|
|
|
|
|
|
|
|
$ |
3,987,212 |
|
|
$ |
4,474,595 |
|
|
$ |
4,641,999 |
|
|
$ |
3,039,836 |
|
|
|
|
|
|
|
|
|
|
|
|
|
|
|
|
|
|
|
|
|
|
|
| Non-current |
|
|
|
|
|
|
|
|
|
|
|
|
|
|
|
|
| Refundable deposits |
|
$ |
2,039,264 |
|
|
$ |
2,087,034 |
|
|
$ |
1,901,688 |
|
|
$ |
1,760,149 |
|
| Other financial assets |
|
|
1,000,000 |
|
|
|
1,000,000 |
|
|
|
1,000,000 |
|
|
|
1,000,000 |
|
| Telecom license bid bond |
|
|
1,000,000 |
|
|
|
— |
|
|
|
— |
|
|
|
— |
|
| Others |
|
|
1,466,165 |
|
|
|
1,509,495 |
|
|
|
1,094,949 |
|
|
|
1,098,016 |
|
|
|
|
|
|
|
|
|
|
|
|
|
|
|
|
|
|
|
|
|
|
|
|
|
$ |
5,505,429 |
|
|
$ |
4,596,529 |
|
|
$ |
3,996,637 |
|
|
$ |
3,858,165 |
|
|
|
|
|
|
|
|
|
|
|
|
|
|
|
|
|
|
Other financial assets - noncurrent was Piping Fund. As part of the government’s effort to upgrade the
existing telecommunications infrastructure, Chunghwa and other public utility companies were required by the ROC government to contribute to a Piping Fund administered by the Taipei City Government. This fund was used to finance various
telecommunications infrastructure projects. Net assets of this fund would be returned proportionately after the project was completed.
For
long-term business development, Chunghwa has submitted an application to National Communications Commission (“NCC”) for mobile broadband license (4G license) and has deposited $1,000,000 thousand as bid bond in June 2013.
|
|
|
|
|
|
|
|
|
| |
|
September 30,
2013 |
|
December 31,
2012 |
|
September 30,
2012 |
|
January 1,
2012 |
|
|
|
|
|
| Unsecured loans |
|
$1,075,222 |
|
$111,473 |
|
$130,000 |
|
$75,000 |
|
|
|
|
|
|
|
|
|
| Annual interest rate |
|
1.18%-2.40% |
|
1.25%-2.40% |
|
1.25%-2.50% |
|
1.25%-1.53% |
45
| 21. |
LONG-TERM LOANS (INCLUDING LONG-TERM LOANS - CURRENT PORTION) |
|
|
|
|
|
|
|
|
|
|
|
|
|
|
|
|
|
| |
|
September 30,
2013 |
|
|
December 31,
2012 |
|
|
September 30,
2012 |
|
|
January 1,
2012 |
|
|
|
|
|
|
| Secured loans |
|
$ |
1,700,000 |
|
|
$ |
2,050,000 |
|
|
$ |
1,650,000 |
|
|
$ |
1,651,419 |
|
| Unsecured loans |
|
|
— |
|
|
|
8,372 |
|
|
|
33,489 |
|
|
|
108,840 |
|
|
|
|
|
|
|
|
|
|
|
|
|
|
|
|
|
|
|
|
|
1,700,000 |
|
|
|
2,058,372 |
|
|
|
1,683,489 |
|
|
|
1,760,259 |
|
| Less: Current portion of long-term loans |
|
|
— |
|
|
|
8,372 |
|
|
|
33,489 |
|
|
|
701,887 |
|
|
|
|
|
|
|
|
|
|
|
|
|
|
|
|
|
|
|
|
|
|
|
|
|
$ |
1,700,000 |
|
|
$ |
2,050,000 |
|
|
$ |
1,650,000 |
|
|
$ |
1,058,372 |
|
|
|
|
|
|
|
|
|
|
|
|
|
|
|
|
|
|
The annual interest rates of loans were as follows:
|
|
|
|
|
|
|
|
|
| |
|
September 30,
2013 |
|
December 31,
2012 |
|
September 30,
2012 |
|
January 1,
2012 |
|
|
|
|
|
| Secured loans |
|
1.15%-2.10% |
|
1.13%-2.10% |
|
1.13% |
|
1.10%-1.83% |
| Unsecured loans |
|
— |
|
2.01% |
|
2.01% |
|
2.01%-2.04% |
LED obtained a secured loan from Chang Hwa Bank in September 2010. Interest is paid monthly. $300,000 thousand
and $1,350,000 thousand will become due in December 2014 and September 2015, respectively. LED obtained another secured loan from Chang Hwa Bank in December 2012 at $400,000 thousand which will be due in December 2017; LED repaid $300,000 thousand
and $50,000 thousand in February and May 2013, respectively.
CHIEF obtained an unsecured loan from Bank of Taiwan in January 2009.
Interest and principal amount are paid monthly from January 2009 and all were repaid in January 2013.
CHPT obtained a secured loan from
the E.SUN Commercial Bank in February 2009. Interest and the principal were paid monthly from March 2009 and all were repaid in February 2012.
| 22. |
TRADE NOTES AND ACCOUNTS PAYABLE |
|
|
|
|
|
|
|
|
|
|
|
|
|
|
|
|
|
| |
|
September 30,
2013 |
|
|
December 31,
2012 |
|
|
September 30,
2012 |
|
|
January 1,
2012 |
|
|
|
|
|
|
| Trade notes and accounts payable |
|
$ |
12,376,159 |
|
|
$ |
13,513,437 |
|
|
$ |
12,346,431 |
|
|
$ |
14,264,769 |
|
|
|
|
|
|
|
|
|
|
|
|
|
|
|
|
|
|
Trade notes and accounts payable were attributable to operating activities and the trading conditions were
agreed separately.
46
|
|
|
|
|
|
|
|
|
|
|
|
|
|
|
|
|
| |
|
September 30,
2013 |
|
|
December 31,
2012 |
|
|
September 30,
2012 |
|
|
January 1,
2012 |
|
|
|
|
|
|
| Other payables |
|
|
|
|
|
|
|
|
|
|
|
|
|
|
|
|
|
|
|
|
|
| Accrued salary and compensation |
|
$ |
7,752,420 |
|
|
$ |
9,838,182 |
|
|
$ |
7,514,546 |
|
|
$ |
10,505,866 |
|
| Accrual amounts for bonuses to employees and remuneration to directors and supervisors |
|
|
706,714 |
|
|
|
1,784,767 |
|
|
|
1,797,872 |
|
|
|
2,343,593 |
|
| Payables to equipment suppliers |
|
|
1,910,113 |
|
|
|
1,884,038 |
|
|
|
1,879,036 |
|
|
|
1,870,486 |
|
| Payables to contrators |
|
|
1,627,268 |
|
|
|
2,379,833 |
|
|
|
1,270,578 |
|
|
|
1,834,254 |
|
| Amounts collected for others |
|
|
1,313,612 |
|
|
|
1,326,777 |
|
|
|
1,367,982 |
|
|
|
1,200,618 |
|
| Accrued franchise fees |
|
|
1,583,694 |
|
|
|
2,164,220 |
|
|
|
1,679,264 |
|
|
|
2,246,265 |
|
| Accrued maintenance costs |
|
|
1,093,666 |
|
|
|
988,240 |
|
|
|
1,054,083 |
|
|
|
898,016 |
|
| Others |
|
|
6,677,447 |
|
|
|
5,735,723 |
|
|
|
5,414,180 |
|
|
|
5,403,163 |
|
|
|
|
|
|
|
|
|
|
|
|
|
|
|
|
|
|
|
|
|
|
|
|
|
$ |
22,664,934 |
|
|
$ |
26,101,780 |
|
|
$ |
21,977,541 |
|
|
$ |
26,302,261 |
|
|
|
|
|
|
|
|
|
|
|
|
|
|
|
|
|
|
|
|
|
|
|
|
|
|
|
|
|
|
|
|
|
|
|
| |
|
September 30,
2013 |
|
|
December 31,
2012 |
|
|
September 30,
2012 |
|
|
January 1,
2012 |
|
|
|
|
|
|
| Warranties |
|
$ |
199,160 |
|
|
$ |
221,245 |
|
|
$ |
128,800 |
|
|
$ |
148,050 |
|
| Employee benefits |
|
|
47,353 |
|
|
|
41,949 |
|
|
|
37,650 |
|
|
|
32,822 |
|
| Others |
|
|
3,030 |
|
|
|
2,960 |
|
|
|
2,160 |
|
|
|
1,180 |
|
|
|
|
|
|
|
|
|
|
|
|
|
|
|
|
|
|
|
|
|
|
|
|
|
$ |
249,543 |
|
|
$ |
266,154 |
|
|
$ |
168,610 |
|
|
$ |
182,052 |
|
|
|
|
|
|
|
|
|
|
|
|
|
|
|
|
|
|
|
|
|
|
|
| Current |
|
$ |
114,242 |
|
|
$ |
221,245 |
|
|
$ |
128,800 |
|
|
$ |
148,050 |
|
| Noncurrent |
|
|
135,301 |
|
|
|
44,909 |
|
|
|
39,810 |
|
|
|
34,002 |
|
|
|
|
|
|
|
|
|
|
|
|
|
|
|
|
|
|
|
|
|
|
|
|
|
$ |
249,543 |
|
|
$ |
266,154 |
|
|
$ |
168,610 |
|
|
$ |
182,052 |
|
|
|
|
|
|
|
|
|
|
|
|
|
|
|
|
|
|
|
|
|
|
|
|
|
|
|
|
|
|
|
|
|
|
|
| |
|
Warranties |
|
|
Employee
Benefits |
|
|
Others |
|
|
Total |
|
|
|
|
|
|
| Balance on January 1, 2012 |
|
$ |
148,050 |
|
|
$ |
32,822 |
|
|
$ |
1,180 |
|
|
$ |
182,052 |
|
| Additional provisions recognized |
|
|
40,767 |
|
|
|
4,828 |
|
|
|
980 |
|
|
|
46,575 |
|
| Reductions |
|
|
(60,017 |
) |
|
|
— |
|
|
|
— |
|
|
|
(60,017 |
) |
|
|
|
|
|
|
|
|
|
|
|
|
|
|
|
|
|
|
|
|
|
|
| Balance on September 30, 2012 |
|
$ |
128,800 |
|
|
$ |
37,650 |
|
|
$ |
2,160 |
|
|
$ |
168,610 |
|
|
|
|
|
|
|
|
|
|
|
|
|
|
|
|
|
|
|
|
|
|
|
| Balance on January 1, 2013 |
|
$ |
221,245 |
|
|
$ |
41,949 |
|
|
$ |
2,960 |
|
|
$ |
266,154 |
|
| Additional provisions recognized |
|
|
80,445 |
|
|
|
5,404 |
|
|
|
170 |
|
|
|
86,019 |
|
| Reductions |
|
|
(102,530 |
) |
|
|
— |
|
|
|
(100 |
) |
|
|
(102,630 |
) |
|
|
|
|
|
|
|
|
|
|
|
|
|
|
|
|
|
|
|
|
|
|
| Balance on September 30, 2013 |
|
$ |
199,160 |
|
|
$ |
47,353 |
|
|
$ |
3,030 |
|
|
$ |
249,543 |
|
|
|
|
|
|
|
|
|
|
|
|
|
|
|
|
|
|
| |
a. |
The provision for warranty claims represents the present values of the management’s best estimate of the future outflow of economic benefits that will be required under the Company’s obligation for warranties
in sales agreements. The estimate has been made based on the historical warranty experience. |
| |
b. |
The provision for employee benefits represents annual leave and vested long-term service leave entitlements accrued. |
47
Advance receipts are mainly from advance telecommunication charges. In
accordance with NCC’s regulation named “Mandatory and Prohibitory Provisions To Be Included In Standard Contracts for Telecommunication Goods (Services) Coupons”, the Company entered into a contract with Bank of Taiwan to provide a
performance guarantee for advance receipts from selling prepaid cards, as of September 30, 2013 amounting to $938,440 thousand.
| 26. |
RETIREMENT BENEFIT PLANS |
| |
a. |
Defined contribution plans |
The pension plan under the Labor Pension Act of ROC (the
“LPA”) is considered as a defined contribution plan. Based on the LPA, Chunghwa and its domestic subsidiaries make monthly contributions to employees’ individual pension accounts at 6% of monthly salaries and wages. Its foreign
subsidiaries would make monthly contributions based on the local pension requirements.
Chunghwa completed privatization plans on August 12, 2005. Chunghwa
is required to pay all accrued pension obligations including service clearance payment, lump sum payment under civil service plan, additional separation payments, etc. upon the completion of the privatization in accordance with the Statute Governing
Privatization of Stated-owned Enterprises. After paying all pension obligations for privatization, the plan assets of Chunghwa should be transferred to the Fund for Privatization of Government-owned Enterprises (the “Privatization Fund”)
under the Executive Yuan. On August 7, 2006, Chunghwa transferred the remaining balance of fund to the Privatization Fund. However, according to the instructions of MOTC, Chunghwa was requested to administer the distributions to employees for
pension obligations including service clearance payment, lump sum payment under civil service plan, additional separation payments, etc. upon the completion of the privatization and recognized in other current monetary assets.
The Company’s pension plan is considered as a defined benefit plan under the Labor Standards Law that provide benefits based on an
employee’s length of service and average six-month salary prior to retirement. Chunghwa and its subsidiaries contribute an amount no more than 15% of salaries paid each month to their respective pension funds (the Funds), which are administered
by the Labor Pension Fund Supervisory Committee (the Committee) and deposited in the names of the Committees in the Bank of Taiwan.
The
most recent actuarial valuation of plan assets and the present value of the defined benefit obligation were carried out at December 31, 2012 by the independent actuary. The present value of the defined benefit obligation, and the related
current service cost and past service cost, were measured using the Projected Unit Credit Method. The recognized pension expenses for the nine months ended September 30, 2013 and 2012 were determined by the pension cost rates of actuarial
valuation of December 31 and January 1, 2012.
48
The principal assumptions used for the purpose of the actuarial valuations were as follows:
|
|
|
|
|
| |
|
Measurement Date |
| |
|
December 31,
2012 |
|
January 1,
2012 |
|
|
|
| Discount rates |
|
1.60% |
|
1.75% |
| Expected return on plan assets |
|
1.60% |
|
1.50% |
| Expected rates of salary increase |
|
1.00%-2.75% |
|
1.00%-3.00% |
Relevant pension costs for the three months ended and nine months ended September 30, 2013 and 2012 were
as follows:
|
|
|
|
|
|
|
|
|
|
|
|
|
|
|
|
|
| |
|
Three Months Ended
September 30 |
|
|
Nine Months Ended
September 30 |
|
| |
|
2013 |
|
|
2012 |
|
|
2013 |
|
|
2012 |
|
|
|
|
|
|
| Operating costs |
|
$ |
440,748 |
|
|
$ |
430,013 |
|
|
$ |
1,321,680 |
|
|
$ |
1,288,377 |
|
|
|
|
|
|
|
|
|
|
|
|
|
|
|
|
|
|
| Marketing expenses |
|
$ |
213,348 |
|
|
$ |
210,258 |
|
|
$ |
641,129 |
|
|
$ |
631,661 |
|
|
|
|
|
|
|
|
|
|
|
|
|
|
|
|
|
|
| General and administrative expenses |
|
$ |
40,950 |
|
|
$ |
39,279 |
|
|
$ |
122,109 |
|
|
$ |
118,268 |
|
|
|
|
|
|
|
|
|
|
|
|
|
|
|
|
|
|
| Research and development expenses |
|
$ |
25,106 |
|
|
$ |
26,163 |
|
|
$ |
75,418 |
|
|
$ |
78,571 |
|
|
|
|
|
|
|
|
|
|
|
|
|
|
|
|
|
|
The amount included in the consolidated balance sheets arising from the Company’s obligation in respect of
its defined benefit plans is as follows:
|
|
|
|
|
|
|
|
|
| |
|
December 31,
2012 |
|
|
January 1,
2012 |
|
|
|
|
| Present value of funded defined benefit obligation |
|
$ |
22,100,285 |
|
|
$ |
18,697,051 |
|
| Fair value of plan assets |
|
|
(17,528,601 |
) |
|
|
(15,750,859 |
) |
|
|
|
|
|
|
|
|
|
| Deficit |
|
|
4,571,684 |
|
|
|
2,946,192 |
|
| Past service cost not yet recognised |
|
|
40,233 |
|
|
|
44,569 |
|
|
|
|
|
|
|
|
|
|
|
|
|
| Net liability arising from defined benefit obligation |
|
$ |
4,611,917 |
|
|
$ |
2,990,761 |
|
|
|
|
|
|
|
|
|
|
|
|
|
| Accrued pension liabilities |
|
$ |
4,616,803 |
|
|
$ |
2,994,079 |
|
| Prepaid pension cost (included in other noncurrent assets - others) |
|
|
(4,886 |
) |
|
|
(3,318 |
) |
|
|
|
|
|
|
|
|
|
|
|
|
|
|
$ |
4,611,917 |
|
|
$ |
2,990,761 |
|
|
|
|
|
|
|
|
|
|
The major categories of plan assets and the fair value of plan assets at the end of the reporting period for
each category, were as follows:
|
|
|
|
|
|
|
|
|
| |
|
Fair Value of Plan Assets (%) |
|
| |
|
December 31,
2012 |
|
|
January 1,
2012 |
|
|
|
|
| Stock and beneficiary certificates |
|
|
38.09 |
|
|
|
40.75 |
|
| Fixed income investments |
|
|
36.61 |
|
|
|
35.25 |
|
| Cash |
|
|
24.51 |
|
|
|
23.87 |
|
| Others |
|
|
0.79 |
|
|
|
0.13 |
|
|
|
|
|
|
|
|
|
|
|
|
|
|
|
|
100.00 |
|
|
|
100.00 |
|
|
|
|
|
|
|
|
|
|
49
The overall expected rate of return is based on historical return trends and analysts’
prediction of the market for the asset over the life of related obligation refer to the Labor Pension Fund Supervisory Committee about the usage of pension funds, and consideration for the effect that the minimum return shall not be less than the
average interest rate on a two-year time deposit published by local banks.
The Company elected to disclose the historical information of
experience adjustments from the date of the adoption of Taiwan-IFRSs.
|
|
|
|
|
|
|
|
|
| |
|
December 31,
2012 |
|
|
January 1,
2012 |
|
|
|
|
| Present value of defined benefit obligation |
|
$ |
(22,100,285 |
) |
|
$ |
(18,697,051 |
) |
|
|
|
|
|
|
|
|
|
| Fair value of plan assets |
|
$ |
17,528,601 |
|
|
$ |
15,750,859 |
|
|
|
|
|
|
|
|
|
|
| Deficit |
|
$ |
(4,571,684 |
) |
|
$ |
(2,946,192 |
) |
|
|
|
|
|
|
|
|
|
| Experience adjustments on plan liabilities |
|
$ |
545,960 |
|
|
$ |
— |
|
|
|
|
|
|
|
|
|
|
| Experience adjustments on plan assets |
|
$ |
(89,792 |
) |
|
$ |
— |
|
|
|
|
|
|
|
|
|
|
|
|
|
|
|
|
|
|
|
|
|
|
|
|
|
|
|
| |
|
September 30,
2013 |
|
|
December 31,
2012 |
|
|
September 30,
2012 |
|
|
January 1,
2012 |
|
|
|
|
|
|
| Number of authorized shares (thousand) |
|
|
12,000,000 |
|
|
|
12,000,000 |
|
|
|
12,000,000 |
|
|
|
12,000,000 |
|
|
|
|
|
|
|
|
|
|
|
|
|
|
|
|
|
|
| Authorized shares |
|
$ |
120,000,000 |
|
|
$ |
120,000,000 |
|
|
$ |
120,000,000 |
|
|
$ |
120,000,000 |
|
|
|
|
|
|
|
|
|
|
|
|
|
|
|
|
|
|
| Number of shares issued and collected proceeds |
|
|
7,757,447 |
|
|
|
7,757,447 |
|
|
|
7,757,447 |
|
|
|
7,757,447 |
|
|
|
|
|
|
|
|
|
|
|
|
|
|
|
|
|
|
| Issued shares |
|
$ |
77,574,465 |
|
|
$ |
77,574,465 |
|
|
$ |
77,574,465 |
|
|
$ |
77,574,465 |
|
|
|
|
|
|
|
|
|
|
|
|
|
|
|
|
|
|
The issued common stock has a par value of $10 per share and entitles the holder the right to vote and receive
dividends.
| |
2) |
Global depositary receipts |
For the purpose of privatizing Chunghwa, the MOTC sold
1,109,750 thousand common shares of Chunghwa in an international offering of securities in the form of American Depositary Shares (“ADS”) amounting to 110,975 thousand units (one ADS represents ten common shares) on the New York
Stock Exchange on July 17, 2003. Afterwards, the MOTC sold 1,350,682 thousand common shares in the form of ADS amounting to 135,068 thousand units on August 10, 2005. Subsequently, the MOTC and Taiwan Mobile Co., Ltd. sold
505,389 thousand and 58,959 thousand common shares of Chunghwa, respectively, in the form of ADS totally amounting to 56,435 thousand units on September 29, 2006. The MOTC and Taiwan Mobile Co., Ltd. have sold
3,024,780 thousand common shares in the form of ADS amounting to 302,478 thousand units. As of September 30, 2013, the outstanding ADSs were 308,321 thousand common shares, which equaled 30,832 thousand units and represented
3.97% of Chunghwa’s total outstanding common shares.
50
The ADS holders generally have the same rights and obligations as other common stockholders,
subject to the provision of relevant laws. The exercise of such rights and obligations shall comply with the related regulations and deposit agreement, which stipulate, among other things, that ADS holders can, through deposit agents:
| |
a) |
Exercise their voting rights, |
| |
c) |
Receive dividends declared and subscribe to the issuance of new shares. |
| |
b. |
Addition paid-in capital |
The adjustment of capital surplus for the nine months ended
September 30, 2013 and 2012 were as follows:
|
|
|
|
|
|
|
|
|
|
|
|
|
|
|
|
|
|
|
|
|
|
|
|
|
| |
|
Share Premium |
|
|
Movements of
Paid-in Capital
for Associates
Accounted for
Using Equity
Method |
|
|
Share-based
Payment
Transactions |
|
|
Donated Capital |
|
|
Stockholders’
Contribution
Due to
Privatization |
|
|
Total |
|
|
|
|
|
|
|
|
| Balance on January 1, 2012 |
|
$ |
169,496,289 |
|
|
$ |
— |
|
|
$ |
— |
|
|
$ |
13,170 |
|
|
$ |
20,648,078 |
|
|
$ |
190,157,537 |
|
| Exercise of employee stock option of subsidiaries |
|
|
— |
|
|
|
— |
|
|
|
3,631 |
|
|
|
— |
|
|
|
— |
|
|
|
3,631 |
|
|
|
|
|
|
|
|
|
|
|
|
|
|
|
|
|
|
|
|
|
|
|
|
|
|
|
|
|
|
|
|
|
| Balance on September 30, 2012 |
|
$ |
169,496,289 |
|
|
$ |
— |
|
|
$ |
3,631 |
|
|
$ |
13,170 |
|
|
$ |
20,648,078 |
|
|
$ |
190,161,168 |
|
|
|
|
|
|
|
|
|
|
|
|
|
|
|
|
|
|
|
|
|
|
|
|
|
|
|
|
|
|
|
|
|
| Balance on January 1, 2013 |
|
$ |
169,496,289 |
|
|
$ |
— |
|
|
$ |
4,893 |
|
|
$ |
13,170 |
|
|
$ |
20,648,078 |
|
|
$ |
190,162,430 |
|
| Cash distributed from capital surplus |
|
|
(5,589,240 |
) |
|
|
— |
|
|
|
— |
|
|
|
— |
|
|
|
— |
|
|
|
(5,589,240 |
) |
| Change in capital surplus from investments in associates accounted for by using equity method |
|
|
— |
|
|
|
3,049 |
|
|
|
— |
|
|
|
— |
|
|
|
— |
|
|
|
3,049 |
|
| Exercise of employee stock option of subsidiaries |
|
|
— |
|
|
|
— |
|
|
|
3,658 |
|
|
|
— |
|
|
|
— |
|
|
|
3,658 |
|
| Employee stock bonus issued by a subsidiary |
|
|
— |
|
|
|
— |
|
|
|
(19 |
) |
|
|
— |
|
|
|
— |
|
|
|
(19 |
) |
|
|
|
|
|
|
|
|
|
|
|
|
|
|
|
|
|
|
|
|
|
|
|
|
|
|
|
|
|
|
|
|
| Balance on September 30, 2013 |
|
$ |
163,907,049 |
|
|
$ |
3,049 |
|
|
$ |
8,532 |
|
|
$ |
13,170 |
|
|
$ |
20,648,078 |
|
|
$ |
184,579,878 |
|
|
|
|
|
|
|
|
|
|
|
|
|
|
|
|
|
|
|
|
|
|
|
|
|
|
Additional paid-in capital may only be utilized to offset deficits. However, the additional paid-in capital
from shares issued in excess of par and donations may be distributed in cash or capitalized when a company has no deficit, which however is limited to a certain percentage of Chunghwa’s paid-in capital.
Additional paid-in capital from investments accounted for using equity method may not be used for any purpose.
The additional paid-in capital - privatization is the retrospective adjustment at the date of transition to Taiwan-IFRSs. Please refer to Note
43 to the consolidated financial statement for further details.
| |
c. |
Retained earnings and dividends policy |
Before distributing a dividend or making any other
distribution to stockholders, Chunghwa must pay all outstanding taxes, offset deficits in prior years and set aside a legal reserve equal to 10% of its net income, and depending on its business needs or requirements, may also set aside or reverse
special reserves. In accordance with Chunghwa’s Articles of Incorporation, no less than 50% of the remaining earnings comprising remaining balance of net income, if any, plus cumulative undistributed earnings shall be distributed in the
following order: (a) from 2% to 5% of distributable earnings shall be distributed to employees as employee bonus; (b) no more than 0.2% of distributable earnings shall be distributed to board of directors and supervisors as remuneration;
and (c) cash dividends to be distributed shall not be less than 50% of the total amount of dividends to be distributed. If cash dividend to be distributed is less than $0.10 per share, such cash dividend shall be distributed in the form of
common shares.
For the nine months ended September 30, 2013 and 2012, the accrual amounts for bonuses to employees and remuneration
to directors and supervisors were accrued based on past experiences and the probable amount to be paid in accordance with Chunghwa’s Articles of Incorporation and Implementation Guidance for the Employee’s Bonus Distribution of Chunghwa
Telecom Co., Ltd.
51
If the initial accrual amounts of the aforementioned bonus are significantly different from the
amounts proposed by the board of directors, the difference is charged to the earnings of the year making the initial estimate. Otherwise, the difference between initial accrual amount and the amount resolved in the shareholders’ meeting is
charged to the earnings of the following year as a result of change in accounting estimate. If the shareholders’ meeting approved to distribute the employee bonus as stocks, the share number of the stock bonus were determined by the amount of
bonus divided by the fair value of the stocks which was the closing market prices one day before shareholders’ meeting after taking into account the effects of ex-rights and ex-dividends.
When the Company appropriate the earnings generated before 2012, Rule 89 No. 100116 issued by the ministry of Finance, R.O.C. and Rule
No. 0950000507 issued by the FSC were followed and the special reserve was appropriated from reserve of the accounts with debit balances under stockholder’s equity. If there were any decrease of the aforementioned accounts of
shareholders’ equity, the decreased amount could be reversed from the special reserve to retained earnings.
The appropriation for
legal reserve shall be made until the accumulated reserve equals the aggregate par value of the outstanding capital stock of Chunghwa. This reserve can only be used to offset a deficit, or, when the legal reserve has exceeded 25% of the
Company’s paid-in capital, the excess may be transferred to capital or distributed in cash.
Except for non-ROC resident shareholders,
all shareholders receiving the dividends are entitled a tax credit equal to their proportionate share of the income tax paid by the Company.
The appropriations and distributions of the 2012 and 2011 earnings of Chunghwa have been approved by the stockholders on June 25, 2013 and
June 22, 2012 as follows:
|
|
|
|
|
|
|
|
|
|
|
|
|
|
|
|
|
| |
|
Appropriation of Earnings |
|
|
Dividends Per Share |
|
| |
|
For Fiscal
Year 2012 |
|
|
For Fiscal
Year 2011 |
|
|
For Fiscal
Year 2012 |
|
|
For Fiscal
Year 2011 |
|
|
|
|
|
|
| Legal reserve |
|
$ |
3,990,397 |
|
|
$ |
4,706,838 |
|
|
|
|
|
|
|
|
|
| Cash dividends |
|
|
35,913,099 |
|
|
|
42,361,864 |
|
|
$ |
4.63 |
|
|
$ |
5.46 |
|
The stockholders of Chunghwa resolved to distribute cash $0.72 per share and the total amount of $5,589,240
thousand from additional paid-in capital on June 25, 2013. Such amount was subsequently paid in August 2013.
The bonuses to the
employees and remuneration to the directors and supervisors of the 2012 and 2011 approved by the board of directors and the stockholders on June 25, 2013 and June 22, 2012 were as follows:
|
|
|
|
|
|
|
|
|
| |
|
2012 |
|
|
2011 |
|
| |
|
Cash Bonus |
|
|
Cash Bonus |
|
|
|
|
| Bonus distributed to the employees |
|
$ |
1,533,082 |
|
|
$ |
2,040,090 |
|
| Remuneration paid to the directors and supervisors |
|
|
37,484 |
|
|
|
44,446 |
|
There was no difference between the initial accrual amounts and the amounts resolved in shareholders’
meeting of the aforementioned bonuses to employees and the remuneration to directors and supervisors.
The Company’s distributable
earnings, bonus distributed to the employees and remuneration paid to the directors and supervisors as of the end of the period were based on the accompanying consolidated financial statements of 2012 prepared in conformity with the pre-revised
Guidelines Governing the Preparation of Financial Reports by Securities Issuers and accounting principles generally accepted in the ROC (“ROC GAAP”).
52
The appropriations of earnings for 2012 were proposed according to the Chunghwa’s financial
statements for the years ended December 31, 2012, which were prepared in accordance with the Guidelines Governing the Preparation of Financial Reports by Securities Issuers and International Financial Reporting Standards.
Information of the appropriation of Chunghwa’s earnings, employees bonuses and remuneration to directors and supervisors resolved by the
board of directors and approved by the stockholders is available on the Market Observation Post System website.
| |
d. |
Special reserves to be recognized for the first-time adoption of IFRS |
Under Rule
No. 1010012865 issued by the FSC on April 6, 2012 and the directive titled “Questions and Answers for Special Reserves Appropriated Following Adoption of IFRSs”, on the first-time adoption of IFRSs, a company should appropriate a
special reserve of an amount the same as that of unrealized revaluation increment and cumulative translation differences (gain) transferred to retained earnings as a result of the Company’s use of exemptions under IFRS 1. However, at the date
of transitions to IFRSs, if the increase in retained earnings that resulted from all IFRSs adjustments is not enough for this appropriation, only the increase in retained earnings that resulted from all IFRSs adjustments will be appropriated to
special reserve. No appropriation of earnings shall be made until any shortage of the aforementioned special reserve is appropriated in subsequent years if the Company has earnings and the original need to appropriate a special reserve is not
eliminated.
The adjustments of IFRSs adoption resulted in the decrease of retained earnings of the Company; therefore, the Company is not
required to appropriate any amount to the special reserve.
| |
1) |
Exchange differences arising from the translation of the foreign operations |
The exchange
differences arising from the translation of the foreign operations from their functional currency to New Taiwan dollars were recognized as exchange differences arising from the translation of the foreign operations in other comprehensive income.
| |
2) |
Unrealized gain (loss) on of available-for-sale financial assets |
|
|
|
|
|
|
|
|
|
| |
|
Nine Months Ended September 30 |
|
| |
|
2013 |
|
|
2012 |
|
|
|
|
| Beginning balance |
|
$ |
257,991 |
|
|
$ |
67,674 |
|
| Unrealized gain (loss) on available-for-sale financial assets |
|
|
(249,166 |
) |
|
|
306,830 |
|
| Income tax relating to unrealized gain (loss) on available-for-sale financial assets |
|
|
(3,010 |
) |
|
|
— |
|
| Amount reclassified from equity to profit or loss on disposal |
|
|
(157,358 |
) |
|
|
(62,625 |
) |
|
|
|
|
|
|
|
|
|
|
|
|
| Ending balance |
|
$ |
(151,543 |
) |
|
$ |
311,879 |
|
|
|
|
|
|
|
|
|
|
Unrealized gain (loss) on available-for-sale financial assets were accumulated gains and losses on the
available-for-sale financial assets measured at fair value, which were recognized in other comprehensive income and were included in the calculation of the related disposal gain and loss or impairment loss of such financial assets upon reclassified
to profits or losses.
53
| |
f. |
Noncontrolling interests |
|
|
|
|
|
|
|
|
|
| |
|
Nine Months Ended September 30 |
|
| |
|
2013 |
|
|
2012 |
|
|
|
|
| Beginning balance |
|
$ |
4,441,849 |
|
|
$ |
4,276,384 |
|
| Shares attributed to noncontrolling interests |
|
|
|
|
|
|
|
|
| Cash dividends paid by subsidiaries to noncontrolling interests |
|
|
(811,296 |
) |
|
|
(887,457 |
) |
| Net income of current period |
|
|
909,282 |
|
|
|
861,822 |
|
| Exchange differences arising from the translation of the net investment in foreign operations |
|
|
17,241 |
|
|
|
(8,015 |
) |
| Unrealized gain on available-for-sale financial assets |
|
|
2,354 |
|
|
|
2,300 |
|
| Income tax relating to unrealized loss on available-for-sale financial assets |
|
|
(372 |
) |
|
|
— |
|
| Changes in capital surplus from investments in associates accounted for using equity method |
|
|
3,794 |
|
|
|
— |
|
| Exercise of employee stock option of subsidiaries |
|
|
32,878 |
|
|
|
35,481 |
|
| Compensation cost of employee stock options of a subsidiary |
|
|
45,303 |
|
|
|
— |
|
| Employee stock bonus issued by a subsidiary |
|
|
2,468 |
|
|
|
— |
|
| Decrease in noncontrolling interests |
|
|
(15,236 |
) |
|
|
(107,271 |
) |
|
|
|
|
|
|
|
|
|
|
|
|
| Ending balance |
|
$ |
4,628,265 |
|
|
$ |
4,173,244 |
|
|
|
|
|
|
|
|
|
|
The main source of revenue of the Company includes various telecommunications
services in many different streams, and the related information is discussed in Note 42.
| |
a. |
Other income and expenses |
|
|
|
|
|
|
|
|
|
|
|
|
|
|
|
|
|
| |
|
Three Months Ended
September 30 |
|
|
Nine Months Ended
September 30 |
|
| |
|
2013 |
|
|
2012 |
|
|
2013 |
|
|
2012 |
|
|
|
|
|
|
| Loss on disposal or abandoment of property, plant and equipment |
|
$ |
(12,005 |
) |
|
$ |
(9,457 |
) |
|
$ |
(21,914 |
) |
|
$ |
(4,915 |
) |
| Impairment loss on property, plant and equipment |
|
|
— |
|
|
|
— |
|
|
|
(2,262 |
) |
|
|
— |
|
| Impairment loss on investment properties |
|
|
— |
|
|
|
— |
|
|
|
— |
|
|
|
(1,261,365 |
) |
|
|
|
|
|
|
|
|
|
|
|
|
|
|
|
|
|
|
|
|
|
|
|
|
$ |
(12,005 |
) |
|
$ |
(9,457 |
) |
|
$ |
(24,176 |
) |
|
$ |
(1,266,280 |
) |
|
|
|
|
|
|
|
|
|
|
|
|
|
|
|
|
|
54
|
|
|
|
|
|
|
|
|
|
|
|
|
|
|
|
|
| |
|
Three Months Ended
September 30 |
|
|
Nine Months Ended
September 30 |
|
| |
|
2013 |
|
|
2012 |
|
|
2013 |
|
|
2012 |
|
|
|
|
|
|
| Dividends income |
|
$ |
9,538 |
|
|
$ |
13,509 |
|
|
$ |
43,989 |
|
|
$ |
18,883 |
|
| Rental income |
|
|
9,796 |
|
|
|
11,859 |
|
|
|
31,849 |
|
|
|
32,299 |
|
| Others |
|
|
108,428 |
|
|
|
83,294 |
|
|
|
190,799 |
|
|
|
230,169 |
|
|
|
|
|
|
|
|
|
|
|
|
|
|
|
|
|
|
|
|
|
|
|
|
|
$ |
127,762 |
|
|
$ |
108,662 |
|
|
$ |
266,637 |
|
|
$ |
281,351 |
|
|
|
|
|
|
|
|
|
|
|
|
|
|
|
|
|
|
| |
c. |
Other gains and losses |
|
|
|
|
|
|
|
|
|
|
|
|
|
|
|
|
|
| |
|
Three Months Ended
September 30 |
|
|
Nine Months Ended
September 30 |
|
| |
|
2013 |
|
|
2012 |
|
|
2013 |
|
|
2012 |
|
|
|
|
|
|
| Net foreign currency exchange gains (losses) |
|
$ |
(34,714 |
) |
|
$ |
(47,679 |
) |
|
$ |
(45,628 |
) |
|
$ |
48,094 |
|
| Gain (loss) on disposal of financial instruments, net |
|
|
83,242 |
|
|
|
(2,649 |
) |
|
|
76,291 |
|
|
|
65,343 |
|
| Valuation gain (loss) on financial assets and liabilities at fair value through profit or loss, net |
|
|
(35,831 |
) |
|
|
49,133 |
|
|
|
(1,075 |
) |
|
|
31,282 |
|
| Loss arising from derivatives as designated hedging instruments in fair value hedges, net |
|
|
(29,579 |
) |
|
|
— |
|
|
|
(93,145 |
) |
|
|
— |
|
| Gain arising from adjustments for hedged item attributable to the hedged risk in a designated fair value hedge accounting
relationship |
|
|
29,579 |
|
|
|
— |
|
|
|
93,145 |
|
|
|
— |
|
| Impairment losses on financial assets carried at cost |
|
|
(1,920 |
) |
|
|
(34,045 |
) |
|
|
(28,692 |
) |
|
|
(111,614 |
) |
| Impairment losses on available-for-sale financial assets |
|
|
— |
|
|
|
— |
|
|
|
— |
|
|
|
(26,779 |
) |
| Impairment losses on goodwill |
|
|
— |
|
|
|
— |
|
|
|
(18,055 |
) |
|
|
— |
|
| Others |
|
|
(14,274 |
) |
|
|
(6,798 |
) |
|
|
(35,049 |
) |
|
|
(44,374 |
) |
|
|
|
|
|
|
|
|
|
|
|
|
|
|
|
|
|
|
|
|
|
|
|
|
$ |
(3,497 |
) |
|
$ |
(42,038 |
) |
|
$ |
(52,208 |
) |
|
$ |
(38,048 |
) |
|
|
|
|
|
|
|
|
|
|
|
|
|
|
|
|
|
|
|
|
|
|
|
|
|
|
|
|
|
|
|
|
|
|
| |
|
Three Months Ended
September 30 |
|
|
Nine Months Ended
September 30 |
|
| |
|
2013 |
|
|
2012 |
|
|
2013 |
|
|
2012 |
|
|
|
|
|
|
| Interest on bank borrowings |
|
$ |
9,269 |
|
|
$ |
5,139 |
|
|
$ |
21,659 |
|
|
$ |
15,659 |
|
| Other interest expenses |
|
|
304 |
|
|
|
65 |
|
|
|
2,261 |
|
|
|
371 |
|
|
|
|
|
|
|
|
|
|
|
|
|
|
|
|
|
|
|
|
|
|
|
|
|
$ |
9,573 |
|
|
$ |
5,204 |
|
|
$ |
23,920 |
|
|
$ |
16,030 |
|
|
|
|
|
|
|
|
|
|
|
|
|
|
|
|
|
|
55
| |
e. |
Impairment loss (reversal gain) on financial instruments |
|
|
|
|
|
|
|
|
|
|
|
|
|
|
|
|
|
| |
|
Three Months Ended
September 30 |
|
|
Nine Months Ended
September 30 |
|
| |
|
2013 |
|
|
2012 |
|
|
2013 |
|
|
2012 |
|
|
|
|
|
|
| Notes and accounts receivable |
|
$ |
34,692 |
|
|
$ |
37,461 |
|
|
$ |
166,823 |
|
|
$ |
(1,462,798 |
) |
|
|
|
|
|
|
|
|
|
|
|
|
|
|
|
|
|
| Other receivables |
|
$ |
420 |
|
|
$ |
5,984 |
|
|
$ |
6,551 |
|
|
$ |
12,392 |
|
|
|
|
|
|
|
|
|
|
|
|
|
|
|
|
|
|
| Financial assets carried at cost |
|
$ |
1,920 |
|
|
$ |
34,045 |
|
|
$ |
28,692 |
|
|
$ |
111,614 |
|
|
|
|
|
|
|
|
|
|
|
|
|
|
|
|
|
|
| Available-for-sale financial assets |
|
$ |
— |
|
|
$ |
— |
|
|
$ |
— |
|
|
$ |
26,779 |
|
|
|
|
|
|
|
|
|
|
|
|
|
|
|
|
|
|
| |
f. |
Impairment loss of non-finacial assets |
|
|
|
|
|
|
|
|
|
|
|
|
|
|
|
|
|
| |
|
Three Months Ended
September 30 |
|
|
Nine Months Ended
September 30 |
|
| |
|
2013 |
|
|
2012 |
|
|
2013 |
|
|
2012 |
|
|
|
|
|
|
| Inventories |
|
$ |
18,497 |
|
|
$ |
3,216 |
|
|
$ |
133,054 |
|
|
$ |
14,455 |
|
|
|
|
|
|
|
|
|
|
|
|
|
|
|
|
|
|
| Goodwill |
|
$ |
— |
|
|
$ |
— |
|
|
$ |
18,055 |
|
|
$ |
— |
|
|
|
|
|
|
|
|
|
|
|
|
|
|
|
|
|
|
| Property, plant and equipment |
|
$ |
— |
|
|
$ |
— |
|
|
$ |
2,262 |
|
|
$ |
— |
|
|
|
|
|
|
|
|
|
|
|
|
|
|
|
|
|
|
| Investment properties |
|
$ |
— |
|
|
$ |
— |
|
|
$ |
— |
|
|
$ |
1,261,365 |
|
|
|
|
|
|
|
|
|
|
|
|
|
|
|
|
|
|
| |
g. |
Depreciation and amortization expenses |
|
|
|
|
|
|
|
|
|
|
|
|
|
|
|
|
|
| |
|
Three Months Ended
September 30 |
|
|
Nine Months Ended
September 30 |
|
| |
|
2013 |
|
|
2012 |
|
|
2013 |
|
|
2012 |
|
|
|
|
|
|
| Property, plant and equipment |
|
$ |
7,745,206 |
|
|
$ |
7,808,653 |
|
|
$ |
23,097,772 |
|
|
$ |
23,326,486 |
|
| Investment properties |
|
|
4,144 |
|
|
|
4,070 |
|
|
|
12,434 |
|
|
|
12,260 |
|
| Intangible assets |
|
|
312,950 |
|
|
|
285,233 |
|
|
|
914,917 |
|
|
|
833,504 |
|
|
|
|
|
|
|
|
|
|
|
|
|
|
|
|
|
|
|
|
|
|
|
| Total depreciation and amortization expenses |
|
$ |
8,062,300 |
|
|
$ |
8,097,956 |
|
|
$ |
24,025,123 |
|
|
$ |
24,172,250 |
|
|
|
|
|
|
|
|
|
|
|
|
|
|
|
|
|
|
|
|
|
|
|
| Depreciation expenses summarized by functions |
|
|
|
|
|
|
|
|
|
|
|
|
|
|
|
|
| Operating costs |
|
$ |
7,210,497 |
|
|
$ |
7,284,053 |
|
|
$ |
21,514,401 |
|
|
$ |
21,811,693 |
|
| Operating expenses |
|
|
538,853 |
|
|
|
528,670 |
|
|
|
1,595,805 |
|
|
|
1,527,053 |
|
|
|
|
|
|
|
|
|
|
|
|
|
|
|
|
|
|
|
|
|
|
|
|
|
$ |
7,749,350 |
|
|
$ |
7,812,723 |
|
|
$ |
23,110,206 |
|
|
$ |
23,338,746 |
|
|
|
|
|
|
|
|
|
|
|
|
|
|
|
|
|
|
|
|
|
|
|
| Amortization expenses summarized by functions |
|
|
|
|
|
|
|
|
|
|
|
|
|
|
|
|
| Operating costs |
|
$ |
247,295 |
|
|
$ |
239,706 |
|
|
$ |
735,606 |
|
|
$ |
707,987 |
|
| Operating expenses |
|
|
65,655 |
|
|
|
45,527 |
|
|
|
179,311 |
|
|
|
125,517 |
|
|
|
|
|
|
|
|
|
|
|
|
|
|
|
|
|
|
|
|
|
|
|
|
|
$ |
312,950 |
|
|
$ |
285,233 |
|
|
$ |
914,917 |
|
|
$ |
833,504 |
|
|
|
|
|
|
|
|
|
|
|
|
|
|
|
|
|
|
56
| |
h. |
Employee benefit expenses |
|
|
|
|
|
|
|
|
|
|
|
|
|
|
|
|
|
| |
|
Three Months Ended
September 30 |
|
|
Nine Months Ended
September 30 |
|
| |
|
2013 |
|
|
2012 |
|
|
2013 |
|
|
2012 |
|
|
|
|
|
|
| Post-employment benefit |
|
|
|
|
|
|
|
|
|
|
|
|
|
|
|
|
| Defined contribution plans |
|
$ |
94,739 |
|
|
$ |
85,573 |
|
|
$ |
269,698 |
|
|
$ |
232,994 |
|
| Defined benefit plans |
|
|
720,152 |
|
|
|
705,713 |
|
|
|
2,160,336 |
|
|
|
2,116,877 |
|
|
|
|
|
|
|
|
|
|
|
|
|
|
|
|
|
|
|
|
|
814,891 |
|
|
|
791,286 |
|
|
|
2,430,034 |
|
|
|
2,349,871 |
|
|
|
|
|
|
|
|
|
|
|
|
|
|
|
|
|
|
| Share-based payment |
|
|
|
|
|
|
|
|
|
|
|
|
|
|
|
|
| Equity-settled share-based payment |
|
|
28,353 |
|
|
|
— |
|
|
|
45,303 |
|
|
|
— |
|
|
|
|
|
|
|
|
|
|
|
|
|
|
|
|
|
|
| Other employee benefit |
|
|
|
|
|
|
|
|
|
|
|
|
|
|
|
|
| Salaries |
|
|
6,227,757 |
|
|
|
6,142,161 |
|
|
|
18,622,104 |
|
|
|
18,478,683 |
|
| Insurance |
|
|
610,686 |
|
|
|
535,350 |
|
|
|
1,821,650 |
|
|
|
1,584,276 |
|
| Others |
|
|
3,826,037 |
|
|
|
4,009,676 |
|
|
|
10,620,000 |
|
|
|
11,077,081 |
|
|
|
|
|
|
|
|
|
|
|
|
|
|
|
|
|
|
|
|
|
10,664,480 |
|
|
|
10,687,187 |
|
|
|
31,063,754 |
|
|
|
31,140,040 |
|
|
|
|
|
|
|
|
|
|
|
|
|
|
|
|
|
|
|
|
|
|
|
| Total employee benefit expenses |
|
$ |
11,507,724 |
|
|
$ |
11,478,473 |
|
|
$ |
33,539,091 |
|
|
$ |
33,489,911 |
|
|
|
|
|
|
|
|
|
|
|
|
|
|
|
|
|
|
|
|
|
|
|
| Summary by functions |
|
|
|
|
|
|
|
|
|
|
|
|
|
|
|
|
| Operating costs |
|
$ |
6,345,017 |
|
|
$ |
6,445,051 |
|
|
$ |
18,542,067 |
|
|
$ |
18,641,754 |
|
| Operating expenses |
|
|
5,162,707 |
|
|
|
5,033,422 |
|
|
|
14,997,024 |
|
|
|
14,848,157 |
|
|
|
|
|
|
|
|
|
|
|
|
|
|
|
|
|
|
|
|
|
|
|
|
|
$ |
11,507,724 |
|
|
$ |
11,478,473 |
|
|
$ |
33,539,091 |
|
|
$ |
33,489,911 |
|
|
|
|
|
|
|
|
|
|
|
|
|
|
|
|
|
|
| |
a. |
Income tax recognized in profit or loss |
The major components of income tax expense are as
follows:
|
|
|
|
|
|
|
|
|
|
|
|
|
|
|
|
|
| |
|
Three Months Ended
September 30 |
|
|
Nine Months Ended
September 30 |
|
| |
|
2013 |
|
|
2012 |
|
|
2013 |
|
|
2012 |
|
|
|
|
|
|
| Current tax |
|
|
|
|
|
|
|
|
|
|
|
|
|
|
|
|
| Current tax expenses recognized for the current period |
|
$ |
2,184,269 |
|
|
$ |
2,055,048 |
|
|
$ |
6,290,985 |
|
|
$ |
6,082,030 |
|
| Income tax expenses of unappropriated earnings |
|
|
— |
|
|
|
— |
|
|
|
27,413 |
|
|
|
9,384 |
|
| Income tax adjustments on prior years |
|
|
27,878 |
|
|
|
(19,696 |
) |
|
|
17,303 |
|
|
|
5,840 |
|
| Others |
|
|
12,561 |
|
|
|
(10,024 |
) |
|
|
15,119 |
|
|
|
14,975 |
|
|
|
|
|
|
|
|
|
|
|
|
|
|
|
|
|
|
|
|
|
2,224,708 |
|
|
|
2,025,328 |
|
|
|
6,350,820 |
|
|
|
6,112,229 |
|
| Deferred tax |
|
|
|
|
|
|
|
|
|
|
|
|
|
|
|
|
| Deferred tax expenses recognized for the current period |
|
|
(47,029 |
) |
|
|
60,204 |
|
|
|
(70,900 |
) |
|
|
80,494 |
|
|
|
|
|
|
|
|
|
|
|
|
|
|
|
|
|
|
|
|
|
|
|
| Income tax recognized in profit or loss |
|
$ |
2,177,679 |
|
|
$ |
2,085,532 |
|
|
$ |
6,279,920 |
|
|
$ |
6,192,723 |
|
|
|
|
|
|
|
|
|
|
|
|
|
|
|
|
|
|
57
Reconciliation between financial income and taxable income is as follows:
|
|
|
|
|
|
|
|
|
| |
|
Nine Months Ended September 30 |
|
| |
|
2013 |
|
|
2012 |
|
|
|
|
| Profit before tax from continuing operations |
|
$ |
37,673,536 |
|
|
$ |
38,786,461 |
|
|
|
|
|
|
|
|
|
|
| Income tax expense calculated at the statutory rate (17%) |
|
|
6,404,501 |
|
|
|
6,593,698 |
|
| Nondeductible expenses in determining taxable income |
|
|
8,068 |
|
|
|
241,000 |
|
| Imputed income on tax |
|
|
1,469 |
|
|
|
1,474 |
|
| Temporary difference |
|
|
68,118 |
|
|
|
(110,713 |
) |
| Tax-exempt income |
|
|
(80,107 |
) |
|
|
(298,504 |
) |
| Additional income tax under the Alternative Minimum Tax Act |
|
|
— |
|
|
|
443 |
|
| Additional income tax on unappropriated earnings |
|
|
27,413 |
|
|
|
9,384 |
|
| Investment credits |
|
|
(175,650 |
) |
|
|
(278,016 |
) |
| Effect of different tax rates of group entities operating in other jurisdictions |
|
|
(7,244 |
) |
|
|
(12,513 |
) |
| Adjustments of tax expense on previous years |
|
|
17,303 |
|
|
|
5,840 |
|
| Others |
|
|
16,049 |
|
|
|
40,630 |
|
|
|
|
|
|
|
|
|
|
|
|
|
| Income tax expense recognized in profit or loss |
|
$ |
6,279,920 |
|
|
$ |
6,192,723 |
|
|
|
|
|
|
|
|
|
|
The applicable tax rate used above is the corporate tax rate of 17% payable by the Company in R.O.C., while the
applicable tax rate used by subsidiaries in China is 25%. Tax rates used by other group entities operating in other jurisdictions are based on the tax laws in those jurisdictions.
| |
b. |
Income tax recognized in other comprehensive income |
|
|
|
|
|
|
|
|
|
|
|
|
|
|
|
|
|
| |
|
Three Months Ended
September 30 |
|
|
Nine Months Ended
September 30 |
|
| |
|
2013 |
|
|
2012 |
|
|
2013 |
|
|
2012 |
|
|
|
|
|
|
| Deferred tax |
|
|
|
|
|
|
|
|
|
|
|
|
|
|
|
|
| Unrealized gain on available-for-sale financial assets |
|
$ |
3,493 |
|
|
$ |
— |
|
|
$ |
3,382 |
|
|
$ |
— |
|
|
|
|
|
|
|
|
|
|
|
|
|
|
|
|
|
|
| |
c. |
The related information under the Integrated Income Tax System is as follows: |
Chunghwa’s
cumulative undistributed earnings for as of September 30, 2013, December 31, 2012, September 30, 2012 and January 1, 2012 were arising from integrated Income Tax.
Imputation credit account
|
|
|
|
|
|
|
|
|
|
|
|
|
|
|
|
|
| |
|
September 30,
2013 |
|
|
December 31,
2012 |
|
|
September 30,
2012 |
|
|
January 1,
2012 |
|
|
|
|
|
|
| Balance of Imputation Credit Account (“ICA”) |
|
$ |
2,134,441 |
|
|
$ |
4,459,457 |
|
|
$ |
2,426,516 |
|
|
$ |
4,899,036 |
|
|
|
|
|
|
|
|
|
|
|
|
|
|
|
|
|
|
The actual creditable ratios for distribution of Chunghwa’s 2012 and 2011 earnings were 19.23% and 17.63%,
respectively.
When the Company appropriated the earnings generated in and after 1998, the imputation credit allocated to local
shareholders’ was based on the creditable rate as of the date of the dividends distribution date.
58
| |
d. |
Income tax examination |
Chunghwa’s income tax returns have been examined by tax
authorities through 2011 except for 2008 and 2010. SENAO’s income tax returns have been examined by authorities through 2010. The following subsidiaries income tax returns have been examined by authorities through 2011: CHPT, CHSI, CHIEF, CHI,
SHE, LED, CHIYP, YYRP, Unigate and CHST.
Net income and weighted average number of common stock used in the
calculation of earnings per share were as follows:
Net income
|
|
|
|
|
|
|
|
|
|
|
|
|
|
|
|
|
| |
|
Three Months Ended
September 30 |
|
|
Nine Months Ended
September 30 |
|
| |
|
2013 |
|
|
2012 |
|
|
2013 |
|
|
2012 |
|
|
|
|
|
|
| Net income used to compute the basic earnings per share |
|
|
|
|
|
|
|
|
|
|
|
|
|
|
|
|
| Net income attributable to the parent |
|
$ |
10,648,268 |
|
|
$ |
10,698,297 |
|
|
$ |
30,484,334 |
|
|
$ |
31,731,916 |
|
| Assumed conversion of all dilutive potential common stock |
|
|
|
|
|
|
|
|
|
|
|
|
|
|
|
|
| Employee stock options of subsidiaries |
|
|
(227 |
) |
|
|
(411 |
) |
|
|
(2,521 |
) |
|
|
(3,321 |
) |
|
|
|
|
|
|
|
|
|
|
|
|
|
|
|
|
|
|
|
|
|
|
| Net income used to compute the diluted earnings per share |
|
$ |
10,648,041 |
|
|
$ |
10,697,886 |
|
|
$ |
30,481,813 |
|
|
$ |
31,728,595 |
|
|
|
|
|
|
|
|
|
|
|
|
|
|
|
|
|
|
Weighted average number of common stock
(Thousand Shares)
|
|
|
|
|
|
|
|
|
|
|
|
|
|
|
|
|
| |
|
Three Months Ended
September 30 |
|
|
Nine Months Ended
September 30 |
|
| |
|
2013 |
|
|
2012 |
|
|
2013 |
|
|
2012 |
|
|
|
|
|
|
| Weighted average number of common stock used to compute the basic earnings per share |
|
|
7,757,447 |
|
|
|
7,757,447 |
|
|
|
7,757,447 |
|
|
|
7,757,447 |
|
| Assumed conversion of all dilutive potential common stock |
|
|
|
|
|
|
|
|
|
|
|
|
|
|
|
|
| Employee stock bonus |
|
|
1,015 |
|
|
|
2,148 |
|
|
|
13,713 |
|
|
|
21,557 |
|
|
|
|
|
|
|
|
|
|
|
|
|
|
|
|
|
|
|
|
|
|
|
| Weighted average number of common stock used to compute the diluted earnings per share |
|
|
7,758,462 |
|
|
|
7,759,595 |
|
|
|
7,771,160 |
|
|
|
7,779,004 |
|
|
|
|
|
|
|
|
|
|
|
|
|
|
|
|
|
|
According to the Interpretation 97-169 issued by ARDF in May 2008, Chunghwa presumed that the employees bonuses
to be paid will be settled in shares and takes those shares into consideration when calculating the weighted average number of outstanding shares used in the calculation of diluted EPS if the shares have a dilutive effect. The dilutive effect of the
shares needs to be considered until the stockholders resolve the number of shares to be distributed to employees in their meeting in the following year.
59
| 32. |
SHARE-BASED PAYMENT ARRANGEMENT |
| |
a. |
SENAO share-based compensation plans |
SENAO share-based compensation plans (“SENAO
Plans”) described as follows:
|
|
|
|
|
|
|
|
|
|
|
|
|
| Effective Date |
|
Grant Date |
|
|
Stock Options Units
(Thousand) |
|
|
Exercise Price
(NT$) |
|
|
|
|
|
| 2005.09.30 |
|
|
2006.05.05 |
|
|
|
10,000 |
|
|
$
(Original price $ |
12.10
16.90 |
) |
| 2007.10.16 |
|
|
2007.10.31 |
|
|
|
6,181 |
|
|
$
(Original price $ |
42.60
44.20 |
) |
| 2012.05.28 |
|
|
2013.04.29 |
|
|
|
10,000 |
|
|
$ |
93.00 |
|
Each option is eligible to subscribe for one common share when exercisable. Under the terms of the Plans, the
options are granted at an exercise price equal to the closing price of the SENAO’s common shares listed on the TSE on the higher of closing price or par value. The SENAO Plans have exercise price adjustment formula upon the issuance of new
common shares, capitalization of retained earnings and/or capital reserves, stock split as well as distribution of cash dividends (except for 2007 Plan), except (i) in the case of issuance of new shares in connection with mergers and in the
case of cancellation of outstanding shares in connection with capital reduction (2007 Plan is out of this exception), and (ii) except if the exercise price after adjustment exceeds the exercise price before adjustment. The options of all the
Plans are valid for six years and the graded vesting schedule for which 50% of option granted will vest two years after the grant date and another two tranches of 25%, each will vest three and four years after the grant date respectively.
SENAO elected not to apply IFRS 2 retrospectively for the share-based payment transactions which were granted and vested before the transition
date.
Stock options granted on May 7, 2013 applied IFRS 2. The recognized compensation cost was $45,303 thousand for the period from
May 7 to September 30, 2013.
Information about SENAO’s outstanding stock options for the nine months ended
September 30, 2013 and 2012 were as follows:
|
|
|
|
|
|
|
|
|
|
|
|
|
|
|
|
|
| |
|
Nine Months Ended September 30, 2013 |
|
| |
|
Granted on May 7, 2013 |
|
|
Granted on October 31, 2007 |
|
| |
|
Number of
Options
(Thousand) |
|
|
Weighted-
average
Exercise
Price
(NT$) |
|
|
Number of
Options
(Thousand) |
|
|
Weighted-
average
Exercise
Price
(NT$) |
|
| Employee stock options |
|
|
|
|
|
|
|
|
|
|
|
|
|
|
|
|
|
|
|
|
|
| Options outstanding at beginning of the period |
|
|
— |
|
|
$ |
— |
|
|
|
1,051 |
|
|
$ |
42.60 |
|
| Options granted |
|
|
10,000 |
|
|
|
93.00 |
|
|
|
— |
|
|
|
— |
|
| Options exercised |
|
|
— |
|
|
|
— |
|
|
|
(666 |
) |
|
|
42.60 |
|
| Options expired |
|
|
— |
|
|
|
— |
|
|
|
— |
|
|
|
— |
|
|
|
|
|
|
|
|
|
|
|
|
|
|
|
|
|
|
|
|
|
|
|
| Options outstanding at end of the period |
|
|
10,000 |
|
|
|
93.00 |
|
|
|
385 |
|
|
|
42.60 |
|
|
|
|
|
|
|
|
|
|
|
|
|
|
|
|
|
|
|
|
|
|
|
| Options exercisable at end of the period |
|
|
— |
|
|
|
— |
|
|
|
385 |
|
|
|
42.60 |
|
|
|
|
|
|
|
|
|
|
|
|
|
|
|
|
|
|
60
|
|
|
|
|
|
|
|
|
|
|
|
|
|
|
|
|
| |
|
Nine Months Ended September 30, 2012 |
|
| |
|
Granted on October 31, 2007 |
|
|
Granted on May 5, 2006 |
|
| |
|
Number of
Options
(Thousand) |
|
|
Weighted-
average
Exercise
Price
(NT$) |
|
|
Number of
Options
(Thousand) |
|
|
Weighted-
average
Exercise
Price
(NT$) |
|
| Employee stock options |
|
|
|
|
|
|
|
|
|
|
|
|
|
|
|
|
|
|
|
|
|
| Options outstanding at beginning of the period |
|
|
1,998 |
|
|
$ |
42.60 |
|
|
|
280 |
|
|
$ |
12.10 |
|
| Options exercised |
|
|
(840 |
) |
|
|
42.60 |
|
|
|
(275 |
) |
|
|
12.10 |
|
| Options expired |
|
|
— |
|
|
|
— |
|
|
|
(5 |
) |
|
|
12.10 |
|
|
|
|
|
|
|
|
|
|
|
|
|
|
|
|
|
|
|
|
|
|
|
| Options outstanding at end of the period |
|
|
1,158 |
|
|
|
42.60 |
|
|
|
— |
|
|
|
— |
|
|
|
|
|
|
|
|
|
|
|
|
|
|
|
|
|
|
|
|
|
|
|
| Options exercisable at end of the period |
|
|
1,158 |
|
|
|
42.60 |
|
|
|
— |
|
|
|
— |
|
|
|
|
|
|
|
|
|
|
|
|
|
|
|
|
|
|
As of September 30, 2013, information about employee stock options outstanding are as follows:
|
|
|
|
|
|
|
|
|
|
|
|
|
|
|
|
|
|
|
|
|
| Options Outstanding |
|
|
Options Exercisable |
|
| Range of Exercise
Price (NT$) |
|
Number of Options
(Thousand) |
|
|
Weighted-average
Remaining Contractual
Life (Years) |
|
|
Weighted Average
Exercise Price (NT$) |
|
|
Number of Options
(Thousand) |
|
|
Weighted Average
Exercise Price (NT$) |
|
|
|
|
|
|
|
| $42.60 |
|
|
385 |
|
|
|
0.17 |
|
|
$ |
42.60 |
|
|
|
385 |
|
|
$ |
42.60 |
|
| 93.00 |
|
|
10,000 |
|
|
|
5.58 |
|
|
|
93.00 |
|
|
|
— |
|
|
|
93.00 |
|
As of September 30, 2012, information about employee stock options outstanding are as follows:
|
|
|
|
|
|
|
|
|
|
|
|
|
|
|
|
|
|
|
|
|
| Options Outstanding |
|
|
Options Exercisable |
|
| Range of Exercise
Price (NT$) |
|
Number of Options
(Thousand) |
|
|
Weighted-average
Remaining Contractual
Life (Years) |
|
|
Weighted Average
Exercise Price (NT$) |
|
|
Number of Options
(Thousand) |
|
|
Weighted Average
Exercise Price (NT$) |
|
|
|
|
|
|
|
| $42.60 |
|
|
1,158 |
|
|
|
1.17 |
|
|
$ |
42.60 |
|
|
|
1,158 |
|
|
$ |
42.60 |
|
Had SENAO used the fair value to evaluate the options using the Black-Scholes model, the assumptions of SENAO
would have been as follows:
|
|
|
|
|
|
|
|
|
|
|
|
|
| |
|
Stock Options
Granted as of
May 7, 2013 |
|
|
Stock Options
Granted as of
October 31,
2007 |
|
|
Stock Options
Granted as of
May 5, 2006 |
|
|
|
|
|
| Dividends yield |
|
|
— |
|
|
|
1.49 |
% |
|
|
— |
|
| Risk-free interest rate |
|
|
0.91 |
% |
|
|
2.00 |
% |
|
|
1.75 |
% |
| Expected life |
|
|
4.375 years |
|
|
|
4.375 years |
|
|
|
4.375 years |
|
| Expected volatility |
|
|
36.22 |
% |
|
|
39.82 |
% |
|
|
39.63 |
% |
| Weighted-average fair value of grants (NT$) |
|
$ |
28.72 |
|
|
$ |
13.69 |
|
|
$ |
5.88 |
|
61
| |
b. |
CHPT share-based compensation plan |
CHPT granted 1,000 options to some of its employees in
December 2008. Under the terms of CHPT Plan, each option entitles the holder to subscribe for one thousand common shares at $12.6 per share when exercisable. The options are valid for 5 years and based on the graded vesting schedule, two tranches of
30% of option will vest two and three years after the grant date, respectively, and the rest of 40% will vest four years after the grant date. There is exercise price adjustment formula upon the issuance of new common shares, capitalization of
retained earnings and/or capital reserves, stock split, issuance of new shares in connection with mergers, issuance of global depositary receipts as well as distribution of cash dividends, except if the exercise price after adjustment exceeds the
exercise price before adjustment.
For the nine months ended September 30, 2013 and 2012 information about CHPT’s outstanding
stock options were as follows:
|
|
|
|
|
|
|
|
|
|
|
|
|
|
|
|
|
| |
|
Nine Months Ended September 30 |
|
| |
|
2013 |
|
|
2012 |
|
| |
|
Number of
Options |
|
|
Weighted-
average
Exercise
Price
(NT$) |
|
|
Number of
Options |
|
|
Weighted-
average
Exercise
Price
(NT$) |
|
|
|
|
|
|
| Employee stock options |
|
|
|
|
|
|
|
|
|
|
|
|
|
|
|
|
|
|
|
|
|
| Options outstanding at beginning of the period |
|
|
920 |
|
|
$ |
10.00 |
|
|
|
920 |
|
|
$ |
10.10 |
|
| Options exercised |
|
|
(810 |
) |
|
|
10.00 |
|
|
|
— |
|
|
|
— |
|
|
|
|
|
|
|
|
|
|
|
|
|
|
|
|
|
|
|
|
|
|
|
| Options outstanding at end of the period |
|
|
110 |
|
|
|
10.00 |
|
|
|
920 |
|
|
|
10.10 |
|
|
|
|
|
|
|
|
|
|
|
|
|
|
|
|
|
|
|
|
|
|
|
| Options exercisable at end of the period |
|
|
110 |
|
|
|
10.00 |
|
|
|
552 |
|
|
|
10.10 |
|
|
|
|
|
|
|
|
|
|
|
|
|
|
|
|
|
|
As of September 30, 2013, information about outstanding employee stock options is as follows:
|
|
|
|
|
|
|
|
|
|
|
|
|
|
|
|
|
|
|
|
|
| Options Outstanding |
|
|
Options Exercisable |
|
| Range of Exercise
Price (NT$) |
|
Number of Options |
|
|
Weighted-average
Remaining Contractual
Life (Years) |
|
|
Weighted Average
Exercise Price (NT$) |
|
|
Number of Options |
|
|
Weighted Average
Exercise Price (NT$) |
|
|
|
|
|
|
|
| $10.00 |
|
|
110 |
|
|
|
0.25 |
|
|
$ |
10.00 |
|
|
|
110 |
|
|
$ |
10.00 |
|
As of September 30, 2012, information about outstanding employee stock options is as follows:
|
|
|
|
|
|
|
|
|
|
|
|
|
|
|
|
|
|
|
|
|
| Options Outstanding |
|
|
Options Exercisable |
|
| Range of Exercise
Price (NT$) |
|
Number of Options |
|
|
Weighted-average
Remaining Contractual
Life (Years) |
|
|
Weighted Average
Exercise Price (NT$) |
|
|
Number of Options |
|
|
Weighted Average
Exercise Price (NT$) |
|
|
|
|
|
|
|
| $10.10 |
|
|
920 |
|
|
|
1.25 |
|
|
$ |
10.10 |
|
|
|
552 |
|
|
$ |
10.10 |
|
62
Had CHPT used the fair value to evaluate the options using the Black-Scholes model, the
assumptions of CHPT would have been as follows:
|
|
|
|
|
| |
|
Stock Options
Granted as of
December 31,
2008 |
|
|
|
| Dividends yield |
|
|
— |
|
| Risk-free interest rate |
|
|
2.00 |
% |
| Expected life |
|
|
3.1 years |
|
| Expected volatility |
|
|
20 |
% |
| Weighted-average fair value of grants |
|
$ |
3.80 |
|
| 33. |
NON-CASH TRANSACTIONS |
For the nine months ended September 30, 2013 and 2012, the
Company entered into the following non-cash investing activities:
|
|
|
|
|
|
|
|
|
| |
|
Nine Months Ended September 30 |
|
| |
|
2013 |
|
|
2012 |
|
|
|
|
| Acquisitions in property, plant and equipment |
|
$ |
22,580,780 |
|
|
$ |
21,971,168 |
|
| Other payables |
|
|
726,490 |
|
|
|
584,834 |
|
|
|
|
|
|
|
|
|
|
|
|
|
|
|
$ |
23,307,270 |
|
|
$ |
22,556,002 |
|
|
|
|
|
|
|
|
|
|
| 34. |
OPERATING LEASE ARRANGEMENTS |
The future aggregate minimum lease payments under non-cancellable
operating leases are as follows:
|
|
|
|
|
|
|
|
|
|
|
|
|
|
|
|
|
| |
|
September 30,
2013 |
|
|
December 31,
2012 |
|
|
September 30,
2012 |
|
|
January 1,
2012 |
|
|
|
|
|
|
| Within one year |
|
$ |
2,740,263 |
|
|
$ |
2,837,367 |
|
|
$ |
2,341,151 |
|
|
$ |
2,401,085 |
|
| Longer than one year but within five years |
|
|
6,365,531 |
|
|
|
5,842,087 |
|
|
|
6,386,332 |
|
|
|
5,749,923 |
|
| Longer than five years |
|
|
1,844,273 |
|
|
|
2,046,776 |
|
|
|
2,108,116 |
|
|
|
2,036,699 |
|
|
|
|
|
|
|
|
|
|
|
|
|
|
|
|
|
|
|
|
|
|
|
|
|
$ |
10,950,067 |
|
|
$ |
10,726,230 |
|
|
$ |
10,835,599 |
|
|
$ |
10,187,707 |
|
|
|
|
|
|
|
|
|
|
|
|
|
|
|
|
|
|
63
The future aggregate minimum lease collection under non-cancellable
operating leases are as follows:
|
|
|
|
|
|
|
|
|
|
|
|
|
|
|
|
|
| |
|
September 30,
2013 |
|
|
December 31,
2012 |
|
|
September 30,
2012 |
|
|
January 1,
2012 |
|
|
|
|
|
|
| Within one year |
|
$ |
365,690 |
|
|
$ |
429,893 |
|
|
$ |
422,448 |
|
|
$ |
453,561 |
|
| Longer than one year but within five years |
|
|
675,466 |
|
|
|
684,301 |
|
|
|
759,873 |
|
|
|
961,897 |
|
| Longer than five years |
|
|
171,055 |
|
|
|
99,635 |
|
|
|
91,173 |
|
|
|
117,543 |
|
|
|
|
|
|
|
|
|
|
|
|
|
|
|
|
|
|
|
|
|
|
|
|
|
$ |
1,212,211 |
|
|
$ |
1,213,829 |
|
|
$ |
1,273,494 |
|
|
$ |
1,533,001 |
|
|
|
|
|
|
|
|
|
|
|
|
|
|
|
|
|
|
The Company manages its capital to ensure that entities in the
Company will be able to continue as going concerns while maximising the return to stakeholders through the optimisation of the debt and equity balance.
The capital structure of the Company consists of debt of the Company and the equity attributable to the parent.
The Company is required to maintain minimum paid-in capital amounts as prescribed by the applicable laws.
The management reviews the capital structure of the Company as needed. As part of this review, the management considers the cost of capital and
the risks associated with each class of capital.
According to the management’s suggestion, the Company maintains a balanced capital
structure through paying cash dividends, increasing its share capital, purchasing treasury stock, proceeds from new debt or repayment of debt.
| 36. |
FINANCIAL INSTRUMENTS |
Categories of Financial Instruments
|
|
|
|
|
|
|
|
|
|
|
|
|
|
|
|
|
| |
|
September 30,
2013 |
|
|
December 31,
2012 |
|
|
September 30,
2012 |
|
|
January 1,
2012 |
|
|
|
|
|
|
| Financial assets |
|
|
|
|
|
|
|
|
|
|
|
|
|
|
|
|
|
|
|
|
|
| Measured at FVTPL |
|
|
|
|
|
|
|
|
|
|
|
|
|
|
|
|
| Held for trading |
|
$ |
363 |
|
|
$ |
2,994 |
|
|
$ |
32,678 |
|
|
$ |
6,094 |
|
| Designated as at FVTPL |
|
|
— |
|
|
|
— |
|
|
|
— |
|
|
|
39,656 |
|
| Held-to-maturity financial assets |
|
|
13,612,847 |
|
|
|
16,046,290 |
|
|
|
16,986,799 |
|
|
|
14,696,192 |
|
| Loans and receivables (Note a) |
|
|
64,918,633 |
|
|
|
79,786,421 |
|
|
|
65,020,733 |
|
|
|
91,888,079 |
|
| Available-for-sale financial assets (Note b) |
|
|
5,514,189 |
|
|
|
7,996,436 |
|
|
|
8,268,739 |
|
|
|
5,316,676 |
|
| Other financial assets - noncurrent |
|
|
1,000,000 |
|
|
|
1,000,000 |
|
|
|
1,000,000 |
|
|
|
1,000,000 |
|
(Continued)
64
|
|
|
|
|
|
|
|
|
|
|
|
|
|
|
|
|
| |
|
September 30,
2013 |
|
|
December 31,
2012 |
|
|
September 30,
2012 |
|
|
January 1,
2012 |
|
|
|
|
|
|
| Financial liabilities |
|
|
|
|
|
|
|
|
|
|
|
|
|
|
|
|
|
|
|
|
|
| Measured at FVTPL |
|
|
|
|
|
|
|
|
|
|
|
|
|
|
|
|
| Held for trading |
|
$ |
671 |
|
|
$ |
1,959 |
|
|
$ |
222 |
|
|
$ |
3,987 |
|
| Measured at amortized cost (Note c) |
|
|
29,823,449 |
|
|
|
30,999,443 |
|
|
|
27,302,086 |
|
|
|
30,340,977 |
|
(Concluded)
| Note a: |
The balances included cash and cash equivalents, trade notes and accounts receivable, accounts receivable from related parties, other receivables (classified as other current monetary assets) and telecom license bid
bond which were measured at amortised cost of loans and receivables. |
| Note b: |
The balances included financial assets carried at cost which were classified as available-for-sale financial assets. |
| Note c: |
The balances included short-term loans, trade notes and accounts payable, payables to related parties, partial other payables and long-term loans which were financial liabilities carried at amortized cost.
|
Fair Value Information
| |
a. |
Financial instruments that are not measured at fair value |
Except for the following table, the
management considered that the carrying amounts of financial instruments approximate fair values or fair values of those instruments cannot be reliably measured.
|
|
|
|
|
|
|
|
|
|
|
|
|
|
|
|
|
|
|
|
|
|
|
|
|
|
|
|
|
|
|
|
|
| |
|
September 30, 2013 |
|
|
December 31, 2012 |
|
|
September 30, 2012 |
|
|
January 1, 2012 |
|
| |
|
Carrying
Amount |
|
|
Fair
Value |
|
|
Carrying
Amount |
|
|
Fair
Value |
|
|
Carrying
Amount |
|
|
Fair
Value |
|
|
Carrying
Amount |
|
|
Fair
Value |
|
|
|
|
|
|
|
|
|
|
| Financial assets |
|
|
|
|
|
|
|
|
|
|
|
|
|
|
|
|
|
|
|
|
|
|
|
|
|
|
|
|
|
|
|
|
| Held-to-maturity investments |
|
$ |
13,612,847 |
|
|
$ |
13,657,268 |
|
|
$ |
16,046,290 |
|
|
$ |
17,388,425 |
|
|
$ |
16,986,799 |
|
|
$ |
17,388,801 |
|
|
$ |
14,696,192 |
|
|
$ |
14,948,770 |
|
| Other financial assets - noncurrent |
|
|
1,000,000 |
|
|
|
1,693,820 |
|
|
|
1,000,000 |
|
|
|
1,687,473 |
|
|
|
1,000,000 |
|
|
|
1,689,298 |
|
|
|
1,000,000 |
|
|
|
1,712,009 |
|
| |
b. |
Financial instruments measured at fair value |
The following table provides an analysis of
financial instruments that are measured subsequent to initial recognition at fair value, grouped into Levels 1 to 3 based on the degree to which the fair value is observable.
| |
1) |
Level 1 fair value measurements are those derived from quoted prices (unadjusted) in active markets for identical assets or liabilities. |
| |
2) |
Level 2 fair value measurements are those derived from inputs other than quoted prices included within Level 1 that are observable for the asset or liability, either directly (i.e. as prices) or indirectly (i.e. derived
from prices). |
| |
3) |
Level 3 fair value measurements are those derived from valuation techniques that include inputs for the asset or liability that are not based on observable market data (unobservable inputs). |
65
September 30, 2013
|
|
|
|
|
|
|
|
|
|
|
|
|
|
|
|
|
| |
|
Level 1 |
|
|
Level 2 |
|
|
Level 3 |
|
|
Total |
|
|
|
|
|
|
| Financial assets at FVTPL |
|
|
|
|
|
|
|
|
|
|
|
|
|
|
|
|
| Derivative financial assets |
|
$ |
— |
|
|
$ |
363 |
|
|
$ |
— |
|
|
$ |
363 |
|
|
|
|
|
|
|
|
|
|
|
|
|
|
|
|
|
|
|
|
|
|
|
| Available-for-sale financial assets |
|
|
|
|
|
|
|
|
|
|
|
|
|
|
|
|
| Domestic listed securities and emerging market shares |
|
|
|
|
|
|
|
|
|
|
|
|
|
|
|
|
| Equity investments |
|
$ |
3,042,355 |
|
|
$ |
— |
|
|
$ |
— |
|
|
$ |
3,042,355 |
|
| Foreign listed stocks |
|
|
|
|
|
|
|
|
|
|
|
|
|
|
|
|
| Equity investments |
|
|
16,880 |
|
|
|
— |
|
|
|
— |
|
|
|
16,880 |
|
|
|
|
|
|
|
|
|
|
|
|
|
|
|
|
|
|
|
|
|
|
|
|
|
$ |
3,059,235 |
|
|
$ |
— |
|
|
$ |
— |
|
|
$ |
3,059,235 |
|
|
|
|
|
|
|
|
|
|
|
|
|
|
|
|
|
|
|
|
|
|
|
| Financial liabilities at FVTPL |
|
|
|
|
|
|
|
|
|
|
|
|
|
|
|
|
| Derivative financial assets |
|
$ |
— |
|
|
$ |
671 |
|
|
$ |
— |
|
|
$ |
671 |
|
|
|
|
|
|
|
|
|
|
|
|
|
|
|
|
|
|
December 31, 2012
|
|
|
|
|
|
|
|
|
|
|
|
|
|
|
|
|
| |
|
Level 1 |
|
|
Level 2 |
|
|
Level 3 |
|
|
Total |
|
|
|
|
|
|
| Financial assets at FVTPL |
|
|
|
|
|
|
|
|
|
|
|
|
|
|
|
|
| Derivative financial assets |
|
$ |
— |
|
|
$ |
2,994 |
|
|
$ |
— |
|
|
$ |
2,994 |
|
|
|
|
|
|
|
|
|
|
|
|
|
|
|
|
|
|
|
|
|
|
|
| Available-for-sale financial assets |
|
|
|
|
|
|
|
|
|
|
|
|
|
|
|
|
| Domestic listed securities and emerging market shares |
|
|
|
|
|
|
|
|
|
|
|
|
|
|
|
|
| Equity investments |
|
$ |
3,278,315 |
|
|
$ |
— |
|
|
$ |
— |
|
|
$ |
3,278,315 |
|
| Bond investments |
|
|
— |
|
|
|
50,207 |
|
|
|
— |
|
|
|
50,207 |
|
| Foreign listed stocks |
|
|
|
|
|
|
|
|
|
|
|
|
|
|
|
|
| Equity investments |
|
|
9,661 |
|
|
|
— |
|
|
|
— |
|
|
|
9,661 |
|
| Open-end mutual funds |
|
|
2,190,392 |
|
|
|
— |
|
|
|
— |
|
|
|
2,190,392 |
|
|
|
|
|
|
|
|
|
|
|
|
|
|
|
|
|
|
|
|
|
|
|
|
|
$ |
5,478,368 |
|
|
$ |
50,207 |
|
|
$ |
— |
|
|
$ |
5,528,575 |
|
|
|
|
|
|
|
|
|
|
|
|
|
|
|
|
|
|
|
|
|
|
|
| Financial liabilities at FVTPL |
|
|
|
|
|
|
|
|
|
|
|
|
|
|
|
|
| Derivative financial liabilities |
|
$ |
— |
|
|
$ |
1,959 |
|
|
$ |
— |
|
|
$ |
1,959 |
|
|
|
|
|
|
|
|
|
|
|
|
|
|
|
|
|
|
September 30, 2012
|
|
|
|
|
|
|
|
|
|
|
|
|
|
|
|
|
| |
|
Level 1 |
|
|
Level 2 |
|
|
Level 3 |
|
|
Total |
|
|
|
|
|
|
| Financial assets at FVTPL |
|
|
|
|
|
|
|
|
|
|
|
|
|
|
|
|
| Derivative financial assets |
|
$ |
— |
|
|
$ |
32,678 |
|
|
$ |
— |
|
|
$ |
32,678 |
|
|
|
|
|
|
|
|
|
|
|
|
|
|
|
|
|
|
(Continued)
66
|
|
|
|
|
|
|
|
|
|
|
|
|
|
|
|
|
| |
|
Level 1 |
|
|
Level 2 |
|
|
Level 3 |
|
|
Total |
|
|
|
|
|
|
| Available-for-sale financial assets |
|
|
|
|
|
|
|
|
|
|
|
|
|
|
|
|
| Domestic listed securities |
|
|
|
|
|
|
|
|
|
|
|
|
|
|
|
|
| Equity investments |
|
$ |
3,352,337 |
|
|
$ |
— |
|
|
$ |
— |
|
|
$ |
3,352,337 |
|
| Bond investment |
|
|
— |
|
|
|
50,755 |
|
|
|
— |
|
|
|
50,755 |
|
| Foreign listed stocks |
|
|
|
|
|
|
|
|
|
|
|
|
|
|
|
|
| Equity investments |
|
|
11,703 |
|
|
|
— |
|
|
|
— |
|
|
|
11,703 |
|
| Open-end mutual funds |
|
|
2,328,326 |
|
|
|
— |
|
|
|
— |
|
|
|
2,328,326 |
|
|
|
|
|
|
|
|
|
|
|
|
|
|
|
|
|
|
|
|
|
|
|
|
|
$ |
5,692,366 |
|
|
$ |
50,755 |
|
|
$ |
— |
|
|
$ |
5,743,121 |
|
|
|
|
|
|
|
|
|
|
|
|
|
|
|
|
|
|
|
|
|
|
|
| Financial liabilities at FVTPL |
|
|
|
|
|
|
|
|
|
|
|
|
|
|
|
|
| Derivative financial liabilities |
|
$ |
— |
|
|
$ |
222 |
|
|
$ |
— |
|
|
$ |
222 |
|
|
|
|
|
|
|
|
|
|
|
|
|
|
|
|
|
|
(Concluded)
January 1, 2012
|
|
|
|
|
|
|
|
|
|
|
|
|
|
|
|
|
| |
|
Level 1 |
|
|
Level 2 |
|
|
Level 3 |
|
|
Total |
|
|
|
|
|
|
| Financial assets at FVTPL |
|
|
|
|
|
|
|
|
|
|
|
|
|
|
|
|
| Derivative financial assets |
|
$ |
— |
|
|
$ |
6,094 |
|
|
$ |
— |
|
|
$ |
6,094 |
|
| Convertible bonds |
|
|
— |
|
|
|
39,656 |
|
|
|
— |
|
|
|
39,656 |
|
|
|
|
|
|
|
|
|
|
|
|
|
|
|
|
|
|
|
|
|
|
|
|
|
$ |
— |
|
|
$ |
45,750 |
|
|
$ |
— |
|
|
$ |
45,750 |
|
|
|
|
|
|
|
|
|
|
|
|
|
|
|
|
|
|
|
|
|
|
|
| Available-for-sale financial assets |
|
|
|
|
|
|
|
|
|
|
|
|
|
|
|
|
| Domestic listed securities |
|
|
|
|
|
|
|
|
|
|
|
|
|
|
|
|
| Equity investments |
|
$ |
528,236 |
|
|
$ |
— |
|
|
$ |
— |
|
|
$ |
528,236 |
|
| Bond investment |
|
|
— |
|
|
|
76,209 |
|
|
|
— |
|
|
|
76,209 |
|
| Open-end mutual funds |
|
|
2,137,201 |
|
|
|
— |
|
|
|
— |
|
|
|
2,137,201 |
|
|
|
|
|
|
|
|
|
|
|
|
|
|
|
|
|
|
|
|
|
|
|
|
|
$ |
2,665,437 |
|
|
$ |
76,209 |
|
|
$ |
— |
|
|
$ |
2,741,646 |
|
|
|
|
|
|
|
|
|
|
|
|
|
|
|
|
|
|
|
|
|
|
|
| Financial liabilities at FVTPL |
|
|
|
|
|
|
|
|
|
|
|
|
|
|
|
|
| Derivative financial liabilities |
|
$ |
— |
|
|
$ |
3,987 |
|
|
$ |
— |
|
|
$ |
3,987 |
|
|
|
|
|
|
|
|
|
|
|
|
|
|
|
|
|
|
There were no transfers between Level 1 and 2 for the nine months ended September 30, 2013 and 2012.
| |
c. |
Valuation techniques and assumptions applied for the purposes of measuring fair value. |
The
fair values of financial assets and financial liabilities are determined as follows:
| |
1) |
The fair values of financial assets and financial liabilities with standard terms and conditions and traded on active liquid markets are determined with reference to quoted market prices (includes listed stocks,
emercing market stocks, convertible bonds, and open-end mutual funds). If such prices are not available, valuation techniques are adopted. Estimates and assumptions used in valuation techniques are consistent with the information used by market
participants in determining the prices of financial instruments. |
67
| |
2) |
The fair values of derivative instruments are calculated using quoted prices. Where such prices are not available, the value of the forward exchange and swap contracts were calculated based on the forward exchange rate
on the maturity date quoted by the financial institutions separately. Estimates and assumptions used in valuation techniques are consistent with the information used by market participants in determining the prices of financial instruments.
|
| |
3) |
Other financial assets - noncurrent is a Piping Fund administered by the Taipei City Government. The fair values of the Piping fund are calculated using the proportion of the net assets held by the Company.
|
Financial Risk Management Objectives
The main financial instruments of the Company include equity and debt investments, accounts receivable, accounts payables and loans. The
Company’s Finance Department provides services to its business units, co-ordinates access to domestic and international capital markets, monitors and manages the financial risks relating to the operations of the Company through internal risk
reports which analyze exposures by degree and magnitude of risks. These risks include market risk (including currency risk, interest rate risk and other price risk), credit risk, and liquidity risk.
The Company seeks to minimize the effects of these risks by using derivative financial instruments to hedge risk exposures. The use of
financial derivatives is governed by the Company’s policies approved by the board of directors. Those derivatives are used to hedge the risks of exchange rate and interest rate fluctuation arising from operating or investment activities.
Compliance with policies and risk exposure limits is reviewed by the Company’s Finance Department on a continuous basis. The Company does not enter into or trade financial instruments, including derivative financial instruments, for speculative
purposes.
The Company needs to report the significant risk exposures and related action plans for the risk regularly to the audit
committee and the board of directors if needed.
The Company is exposed to market risks of changes in foreign currency exchange
rates and interest rates. The Company uses currency swap and forward exchange contracts to hedge the exchange rate risk arising from assets and liabilities denominated in foreign currencies.
There were no changes to the Company’s exposure to market risks or the manner in which these risks are managed and measured.
| |
1) |
Foreign currency risk management |
The carrying amounts of the Company’s foreign currency
denominated monetary assets and monetary liabilities at the end of the reporting period are as follows:
|
|
|
|
|
|
|
|
|
|
|
|
|
|
|
|
|
| |
|
September 30,
2013 |
|
|
December 31,
2012 |
|
|
September 30,
2012 |
|
|
January 1,
2012 |
|
| Assets |
|
|
|
|
|
|
|
|
|
|
|
|
|
|
|
|
| USD |
|
$ |
4,800,889 |
|
|
$ |
4,250,798 |
|
|
$ |
5,602,103 |
|
|
$ |
5,323,930 |
|
| EUR |
|
|
7,857 |
|
|
|
19,206 |
|
|
|
9,341 |
|
|
|
6,566 |
|
| JPY |
|
|
3,487 |
|
|
|
5,986 |
|
|
|
5,548 |
|
|
|
1,448 |
|
| SGD |
|
|
23,007 |
|
|
|
5,821 |
|
|
|
5,168 |
|
|
|
4,365 |
|
| Liabilities |
|
|
|
|
|
|
|
|
|
|
|
|
|
|
|
|
| USD |
|
|
4,935,275 |
|
|
|
3,560,547 |
|
|
|
4,645,265 |
|
|
|
4,051,055 |
|
| EUR |
|
|
1,358,384 |
|
|
|
1,310,892 |
|
|
|
1,350,376 |
|
|
|
1,098,504 |
|
| JPY |
|
|
8,224 |
|
|
|
4,838 |
|
|
|
5,148 |
|
|
|
5,156 |
|
| SGD |
|
|
1,908 |
|
|
|
21,055 |
|
|
|
238,825 |
|
|
|
83,416 |
|
68
The carrying amount of the Company’s derivatives with exchange rate risk exposures at the
end of the reporting period are as follows:
|
|
|
|
|
|
|
|
|
|
|
|
|
|
|
|
|
| |
|
September 30,
2013 |
|
|
December 31,
2012 |
|
|
September 30,
2012 |
|
|
January 1,
2012 |
|
| Assets |
|
|
|
|
|
|
|
|
|
|
|
|
|
|
|
|
| USD |
|
$ |
363 |
|
|
$ |
2,994 |
|
|
$ |
32,678 |
|
|
$ |
6,094 |
|
| Liabilities |
|
|
|
|
|
|
|
|
|
|
|
|
|
|
|
|
| USD |
|
|
671 |
|
|
|
1,959 |
|
|
|
222 |
|
|
|
3,987 |
|
Foreign currency sensitivity analysis
The Company is mainly exposed to the fluctuations of the currencies listed above.
The following table details the Company’s sensitivity to a 5% increase and decrease in the functional currency against the relevant
foreign currencies. 5% is the sensitivity rate used when reporting foreign currency risk internally to key management personnel and represents management’s assessment of the reasonably possible change in foreign exchange rates. The sensitivity
analysis includes only outstanding foreign currency denominated monetary items, currency swaps and forward foreign exchange contracts, and adjusts their translation at the period end for a 5% change in foreign currency rates. A positive/negative
number below indicates an increase/decrease in profit where the functional currency weakens 5% against the relevant currency.
|
|
|
|
|
|
|
|
|
| |
|
Nine Months Ended September 30 |
|
| |
|
2013 |
|
|
2012 |
|
| Profit or loss |
|
|
|
|
|
|
|
|
| Monetary assets and liabilities (a) |
|
|
|
|
|
|
|
|
| USD |
|
$ |
(6,719 |
) |
|
$ |
47,842 |
|
| EUR |
|
|
(67,526 |
) |
|
|
(67,052 |
) |
| JPY |
|
|
(237 |
) |
|
|
20 |
|
| SGD |
|
|
1,055 |
|
|
|
(11,683 |
) |
| Derivatives (b) |
|
|
|
|
|
|
|
|
| USD |
|
|
25,430 |
|
|
|
107,249 |
|
| a) |
This is mainly attributable to the exposure outstanding on foreign currency denominated receivables and payables in the Company at the end of the reporting period. |
| b) |
This is mainly attributable to the swaps and forward foreign exchange contracts. |
For a 5%
strengthening of the functional currency against the relevant currencies, there would be a comparable impact on the profit, and the balances above would be negative.
The carrying amount of the Company’s exposures to interest rates on
financial assets and financial liabilities are as follows:
|
|
|
|
|
|
|
|
|
|
|
|
|
|
|
|
|
| |
|
September 30,
2013 |
|
|
December 31,
2012 |
|
|
September 30,
2012 |
|
|
January 1,
2012 |
|
| Fair value interest rate risk |
|
|
|
|
|
|
|
|
|
|
|
|
|
|
|
|
| Financial assets |
|
$ |
29,889,542 |
|
|
$ |
47,127,489 |
|
|
$ |
33,782,501 |
|
|
$ |
62,467,987 |
|
| Financial liabilities |
|
|
1,055,222 |
|
|
|
115,845 |
|
|
|
153,489 |
|
|
|
178,840 |
|
| Cash flow interest rate risk |
|
|
|
|
|
|
|
|
|
|
|
|
|
|
|
|
| Financial assets |
|
|
6,038,978 |
|
|
|
5,445,262 |
|
|
|
4,708,405 |
|
|
|
4,403,225 |
|
| Financial liabilities |
|
|
1,720,000 |
|
|
|
2,054,000 |
|
|
|
1,660,000 |
|
|
|
1,656,419 |
|
69
Interest rate sensitivity analysis
The sensitivity analyses below have been determined based on the exposure to interest rates for non-derivative instruments at the end of the
reporting period. A 25 basis point increase or decrease is used when reporting interest rate risk internally to key management personnel and represents management’s assessment of the reasonably possible change in interest rates.
If interest rates had been 25 basis points higher/lower and all other variables were held constant, the Company’s profit for the nine
months ended September 30, 2013 would increase/decrease by $10,797 thousand. This is mainly attributable to the Company’s exposure to floating rates on its financial instruments and short-term and long-term loans.
If interest rates had been 25 basis points higher/lower and all other variables were held constant, the Company’s profit for the nine
months ended September 30, 2012 would increase/decrease by $7,621 thousand. This is mainly attributable to the Company’s exposure to floating rates on its financial assets and short-term and long-term borrowings; and other comprehensive
income for the nine months ended September 30, 2012 would decrease/increase by $92 thousand, mainly as a result of the changes in the fair value of available-for-sale fixed rate instruments.
The Company is exposed to equity price risks arising from equity
investments. Equity investments are held for strategic rather than trading purposes. The management managed the risk through holding various risk portfolios. Further, the Company assigned finance and investment departments to monitor the price risk.
Equity price sensitivity analysis
The sensitivity analyses below have been determined based on the exposure to equity price risks of listed equity securities at the end of the
reporting period.
If equity prices of listed equity securities had been 5% higher/lower:
Other comprehensive income before tax would increase/decrease by $152,152 thousand as a result of the changes in fair value of
available-for-sale assets for the nine months ended September 30, 2013.
Other comprehensive income before tax would
increase/decrease by $280,372 thousand as a result of the changes in fair value of available-for-sale assets for the nine months ended September 30, 2012.
| |
b. |
Credit risk management |
Credit risk refers to the risk that a counterparty would default on its
contractual obligations resulting in financial loss to the Company. The maximum credit exposure of the aforementioned financial instruments is equal to their carrying amounts recognized in consolidated balance sheet as of the balance sheet date.
The Company serves a large consumer base, and the concentration of credit risk was limited.
| |
c. |
Liquidity risk management |
The Company manages and contains sufficient cash and cash equivalent
position to support the operations and reduce the impact on fluctuation of cash flow.
70
| |
1) |
Liquidity and interest risk tables |
The following tables detailed the Company’s remaining
contractual maturity for its non-derivative financial liabilities with agreed repayment periods. The tables have been drawn up based on the undiscounted cash flows of financial liabilities based on the earliest date on which the Company is required
to pay.
|
|
|
|
|
|
|
|
|
|
|
|
|
|
|
|
|
|
|
|
|
|
|
|
|
| |
|
Weighted
Average Effective
Interest |
|
|
Less Than 1
Month |
|
|
1-3 Months |
|
|
3 Months to
1 Year |
|
|
1-5 Years |
|
|
Total |
|
|
|
|
|
|
|
|
| September 30, 2013 |
|
|
|
|
|
|
|
|
|
|
|
|
|
|
|
|
|
|
|
|
|
|
|
|
|
|
|
|
|
|
|
| Non-derivative financial liabilities |
|
|
|
|
|
|
|
|
|
|
|
|
|
|
|
|
|
|
|
|
|
|
|
|
| Non-interest bearing |
|
|
— |
|
|
$ |
35,507,361 |
|
|
$ |
— |
|
|
$ |
— |
|
|
$ |
— |
|
|
$ |
35,507,361 |
|
| Floating interest rate instruments |
|
|
1.18 |
% |
|
|
— |
|
|
|
10,000 |
|
|
|
10,000 |
|
|
|
1,700,000 |
|
|
|
1,720,000 |
|
| Fixed interest rate instruments |
|
|
1.35 |
% |
|
|
170,000 |
|
|
|
882,682 |
|
|
|
5,100 |
|
|
|
— |
|
|
|
1,057,782 |
|
|
|
|
|
|
|
|
|
|
|
|
|
|
|
|
|
|
|
|
|
|
|
|
|
|
|
|
|
|
|
|
|
|
|
|
|
|
|
$ |
35,677,361 |
|
|
$ |
892,682 |
|
|
$ |
15,100 |
|
|
$ |
1,700,000 |
|
|
$ |
38,285,143 |
|
|
|
|
|
|
|
|
|
|
|
|
|
|
|
|
|
|
|
|
|
|
|
|
|
|
|
|
|
|
|
|
|
| December 31, 2012 |
|
|
|
|
|
|
|
|
|
|
|
|
|
|
|
|
|
|
|
|
|
|
|
|
|
|
|
|
|
|
|
| Non-derivative financial liabilities |
|
|
|
|
|
|
|
|
|
|
|
|
|
|
|
|
|
|
|
|
|
|
|
|
| Non-interest bearing |
|
|
— |
|
|
$ |
40,444,663 |
|
|
$ |
— |
|
|
$ |
7,884 |
|
|
$ |
— |
|
|
$ |
40,452,547 |
|
| Floating interest rate instruments |
|
|
1.32 |
% |
|
|
4,000 |
|
|
|
— |
|
|
|
— |
|
|
|
2,050,000 |
|
|
|
2,054,000 |
|
| Fixed interest rate instruments |
|
|
1.75 |
% |
|
|
48,372 |
|
|
|
— |
|
|
|
67,473 |
|
|
|
— |
|
|
|
115,845 |
|
|
|
|
|
|
|
|
|
|
|
|
|
|
|
|
|
|
|
|
|
|
|
|
|
|
|
|
|
|
|
|
|
|
|
|
|
|
|
$ |
40,497,035 |
|
|
$ |
— |
|
|
$ |
75,357 |
|
|
$ |
2,050,000 |
|
|
$ |
42,622,392 |
|
|
|
|
|
|
|
|
|
|
|
|
|
|
|
|
|
|
|
|
|
|
|
|
|
|
|
|
|
|
|
|
|
| September 30, 2012 |
|
|
|
|
|
|
|
|
|
|
|
|
|
|
|
|
|
|
|
|
|
|
|
|
|
|
|
|
|
|
|
| Non-derivative financial liabilities |
|
|
|
|
|
|
|
|
|
|
|
|
|
|
|
|
|
|
|
|
|
|
|
|
| Non-interest bearing |
|
|
— |
|
|
$ |
34,801,015 |
|
|
$ |
— |
|
|
$ |
— |
|
|
$ |
— |
|
|
$ |
34,801,015 |
|
| Floating interest rate instruments |
|
|
1.13 |
% |
|
|
— |
|
|
|
— |
|
|
|
10,000 |
|
|
|
1,650,000 |
|
|
|
1,660,000 |
|
| Fixed interest rate instruments |
|
|
1.48 |
% |
|
|
115,000 |
|
|
|
5,000 |
|
|
|
33,489 |
|
|
|
— |
|
|
|
153,489 |
|
|
|
|
|
|
|
|
|
|
|
|
|
|
|
|
|
|
|
|
|
|
|
|
|
|
|
|
|
|
|
|
|
|
|
|
|
|
|
$ |
34,916,015 |
|
|
$ |
5,000 |
|
|
$ |
43,489 |
|
|
$ |
1,650,000 |
|
|
$ |
36,614,504 |
|
|
|
|
|
|
|
|
|
|
|
|
|
|
|
|
|
|
|
|
|
|
|
|
|
|
|
|
|
|
|
|
|
| January 1, 2012 |
|
|
|
|
|
|
|
|
|
|
|
|
|
|
|
|
|
|
|
|
|
|
|
|
|
|
|
|
|
|
|
| Non-derivative financial liabilities |
|
|
|
|
|
|
|
|
|
|
|
|
|
|
|
|
|
|
|
|
|
|
|
|
| Non-interest bearing |
|
|
— |
|
|
$ |
41,352,592 |
|
|
$ |
— |
|
|
$ |
2,585 |
|
|
$ |
— |
|
|
$ |
41,355,177 |
|
| Floating interest rate instruments |
|
|
1.10 |
% |
|
|
5,000 |
|
|
|
1,419 |
|
|
|
600,000 |
|
|
|
1,050,000 |
|
|
|
1,656,419 |
|
| Fixed interest rate instruments |
|
|
1.72 |
% |
|
|
90,840 |
|
|
|
79,628 |
|
|
|
— |
|
|
|
8,372 |
|
|
|
178,840 |
|
|
|
|
|
|
|
|
|
|
|
|
|
|
|
|
|
|
|
|
|
|
|
|
|
|
|
|
|
|
|
|
|
|
|
|
|
|
|
$ |
41,448,432 |
|
|
$ |
81,047 |
|
|
$ |
602,585 |
|
|
$ |
1,058,372 |
|
|
$ |
43,190,436 |
|
|
|
|
|
|
|
|
|
|
|
|
|
|
|
|
|
|
|
|
|
|
|
|
|
|
The following table detailed the Company’s liquidity analysis for its derivative financial instruments.
The table has been drawn up based on the undiscounted contractual net cash inflows and outflows on derivative instruments that settle on a net basis and the undiscounted gross inflows and outflows on those derivatives that require gross settlement.
71
|
|
|
|
|
|
|
|
|
|
|
|
|
|
|
|
|
|
|
|
|
| |
|
Less Than 1
Month |
|
|
1-3 Months |
|
|
3 Months to
1 Year |
|
|
1-5 Years |
|
|
Total |
|
|
|
|
|
|
|
| September 30, 2013 |
|
|
|
|
|
|
|
|
|
|
|
|
|
|
|
|
|
|
|
|
|
|
|
|
|
|
| Gross settled |
|
|
|
|
|
|
|
|
|
|
|
|
|
|
|
|
|
|
|
|
|
|
|
|
|
|
| Forward exchange contracts |
|
|
|
|
|
|
|
|
|
|
|
|
|
|
|
|
|
|
|
|
| Inflow |
|
$ |
509,561 |
|
|
$ |
— |
|
|
$ |
— |
|
|
$ |
— |
|
|
$ |
509,561 |
|
| Outflow |
|
|
509,869 |
|
|
|
— |
|
|
|
— |
|
|
|
— |
|
|
|
509,869 |
|
|
|
|
|
|
|
|
|
|
|
|
|
|
|
|
|
|
|
|
|
|
|
|
|
|
|
|
|
|
$ |
(308 |
) |
|
$ |
— |
|
|
$ |
— |
|
|
$ |
— |
|
|
$ |
(308 |
) |
|
|
|
|
|
|
|
|
|
|
|
|
|
|
|
|
|
|
|
|
|
|
|
|
|
|
|
| December 31, 2012 |
|
|
|
|
|
|
|
|
|
|
|
|
|
|
|
|
|
|
|
|
|
|
|
|
|
|
| Gross settled |
|
|
|
|
|
|
|
|
|
|
|
|
|
|
|
|
|
|
|
|
|
|
|
|
|
|
| Currency swap contracts |
|
|
|
|
|
|
|
|
|
|
|
|
|
|
|
|
|
|
|
|
| Inflow |
|
$ |
726,370 |
|
|
$ |
1,194,098 |
|
|
$ |
— |
|
|
$ |
— |
|
|
$ |
1,920,468 |
|
| Outflow |
|
|
727,214 |
|
|
|
1,192,487 |
|
|
|
— |
|
|
|
— |
|
|
|
1,919,701 |
|
|
|
|
|
|
|
|
|
|
|
|
|
|
|
|
|
|
|
|
|
|
|
|
|
|
|
|
|
|
$ |
(844 |
) |
|
$ |
1,611 |
|
|
$ |
— |
|
|
$ |
— |
|
|
$ |
767 |
|
|
|
|
|
|
|
|
|
|
|
|
|
|
|
|
|
|
|
|
|
|
|
|
|
|
|
|
| Forward exchange contracts |
|
|
|
|
|
|
|
|
|
|
|
|
|
|
|
|
|
|
|
|
| Inflow |
|
$ |
154,572 |
|
|
$ |
— |
|
|
$ |
— |
|
|
$ |
— |
|
|
$ |
154,572 |
|
| Outflow |
|
|
154,304 |
|
|
|
— |
|
|
|
— |
|
|
|
— |
|
|
|
154,304 |
|
|
|
|
|
|
|
|
|
|
|
|
|
|
|
|
|
|
|
|
|
|
|
|
|
|
|
|
|
|
$ |
268 |
|
|
$ |
— |
|
|
$ |
— |
|
|
$ |
— |
|
|
$ |
268 |
|
|
|
|
|
|
|
|
|
|
|
|
|
|
|
|
|
|
|
|
|
|
|
|
|
|
|
|
| September 30, 2012 |
|
|
|
|
|
|
|
|
|
|
|
|
|
|
|
|
|
|
|
|
|
|
|
|
|
|
| Gross settled |
|
|
|
|
|
|
|
|
|
|
|
|
|
|
|
|
|
|
|
|
|
|
|
|
|
|
| Currency swap contracts |
|
|
|
|
|
|
|
|
|
|
|
|
|
|
|
|
|
|
|
|
| Inflow |
|
$ |
1,308,313 |
|
|
$ |
658,936 |
|
|
$ |
— |
|
|
$ |
— |
|
|
$ |
1,967,249 |
|
| Outflow |
|
|
1,289,913 |
|
|
|
644,943 |
|
|
|
— |
|
|
|
— |
|
|
|
1,934,856 |
|
|
|
|
|
|
|
|
|
|
|
|
|
|
|
|
|
|
|
|
|
|
|
|
|
|
|
|
|
|
$ |
18,400 |
|
|
$ |
13,993 |
|
|
$ |
— |
|
|
$ |
— |
|
|
$ |
32,393 |
|
|
|
|
|
|
|
|
|
|
|
|
|
|
|
|
|
|
|
|
|
|
|
|
|
|
|
|
| Forward exchange contracts |
|
|
|
|
|
|
|
|
|
|
|
|
|
|
|
|
|
|
|
|
| Inflow |
|
$ |
211,774 |
|
|
$ |
— |
|
|
$ |
— |
|
|
$ |
— |
|
|
$ |
211,774 |
|
| Outflow |
|
|
211,711 |
|
|
|
— |
|
|
|
— |
|
|
|
— |
|
|
|
211,711 |
|
|
|
|
|
|
|
|
|
|
|
|
|
|
|
|
|
|
|
|
|
|
|
|
|
|
|
|
|
|
$ |
63 |
|
|
$ |
— |
|
|
$ |
— |
|
|
$ |
— |
|
|
$ |
63 |
|
|
|
|
|
|
|
|
|
|
|
|
|
|
|
|
|
|
|
|
|
|
|
|
|
|
|
|
| January 1, 2012 |
|
|
|
|
|
|
|
|
|
|
|
|
|
|
|
|
|
|
|
|
|
|
|
|
|
|
| Net settled |
|
|
|
|
|
|
|
|
|
|
|
|
|
|
|
|
|
|
|
|
|
|
|
|
|
|
| Index future contracts |
|
$ |
277 |
|
|
$ |
(526 |
) |
|
$ |
— |
|
|
$ |
— |
|
|
$ |
(249 |
) |
|
|
|
|
|
|
|
|
|
|
|
|
|
|
|
|
|
|
|
|
|
|
|
|
|
|
|
| Gross settled |
|
|
|
|
|
|
|
|
|
|
|
|
|
|
|
|
|
|
|
|
|
|
|
|
|
|
| Currency swap contracts |
|
|
|
|
|
|
|
|
|
|
|
|
|
|
|
|
|
|
|
|
| Inflow |
|
$ |
940,676 |
|
|
$ |
937,438 |
|
|
$ |
— |
|
|
$ |
— |
|
|
$ |
1,878,114 |
|
| Outflow |
|
|
938,492 |
|
|
|
937,193 |
|
|
|
— |
|
|
|
— |
|
|
|
1,875,685 |
|
|
|
|
|
|
|
|
|
|
|
|
|
|
|
|
|
|
|
|
|
|
|
|
|
|
|
|
|
|
$ |
2,184 |
|
|
$ |
245 |
|
|
$ |
— |
|
|
$ |
— |
|
|
$ |
2,429 |
|
|
|
|
|
|
|
|
|
|
|
|
|
|
|
|
|
|
|
|
|
|
|
|
|
|
|
|
| Forward exchange contracts |
|
|
|
|
|
|
|
|
|
|
|
|
|
|
|
|
|
|
|
|
| Inflow |
|
$ |
59,565 |
|
|
$ |
— |
|
|
$ |
— |
|
|
$ |
— |
|
|
$ |
59,565 |
|
| Outflow |
|
|
59,638 |
|
|
|
— |
|
|
|
— |
|
|
|
— |
|
|
|
59,638 |
|
|
|
|
|
|
|
|
|
|
|
|
|
|
|
|
|
|
|
|
|
|
|
|
|
|
|
|
|
|
$ |
(73 |
) |
|
$ |
— |
|
|
$ |
— |
|
|
$ |
— |
|
|
$ |
(73 |
) |
|
|
|
|
|
|
|
|
|
|
|
|
|
|
|
|
|
|
|
|
|
72
|
|
|
|
|
|
|
|
|
|
|
|
|
|
|
|
|
| |
|
September 30,
2013 |
|
|
December 31,
2012 |
|
|
September 30,
2012 |
|
|
January 1,
2012 |
|
|
|
|
|
|
| Unsecured bank loan facility |
|
|
|
|
|
|
|
|
|
|
|
|
|
|
|
|
| Amount used |
|
$ |
1,045,000 |
|
|
$ |
511,473 |
|
|
$ |
530,000 |
|
|
$ |
475,000 |
|
| Amount unused |
|
|
7,284,280 |
|
|
|
8,638,527 |
|
|
|
8,270,000 |
|
|
|
8,525,000 |
|
|
|
|
|
|
|
|
|
|
|
|
|
|
|
|
|
|
|
|
|
|
|
|
|
$ |
8,329,280 |
|
|
$ |
9,150,000 |
|
|
$ |
8,800,000 |
|
|
$ |
9,000,000 |
|
|
|
|
|
|
|
|
|
|
|
|
|
|
|
|
|
|
|
|
|
|
|
| Secured bank loan facility |
|
|
|
|
|
|
|
|
|
|
|
|
|
|
|
|
| Amount used |
|
$ |
1,730,222 |
|
|
$ |
2,050,000 |
|
|
$ |
1,650,000 |
|
|
$ |
1,651,419 |
|
| Amount unused |
|
|
669,778 |
|
|
|
600,000 |
|
|
|
— |
|
|
|
— |
|
|
|
|
|
|
|
|
|
|
|
|
|
|
|
|
|
|
|
|
|
|
|
|
|
$ |
2,400,000 |
|
|
$ |
2,650,000 |
|
|
$ |
1,650,000 |
|
|
$ |
1,651,419 |
|
|
|
|
|
|
|
|
|
|
|
|
|
|
|
|
|
|
| 37. |
RELATED PARTIES TRANSACTIONS |
The ROC Government, one of Chunghwa’s customers held
significant equity interest in Chunghwa. Chunghwa provides fixed-line services, wireless services, Internet and data and other services to the various departments and institutions of the ROC Government and other state-owned enterprises in the normal
course of business and at arm’s-length prices. The information on service revenues from government bodies and related organizations have not been provided because details of the type of transactions were not collected by Chunghwa. Chunghwa
believes that all costs of doing business are reflected in the consolidated financial statements:
| |
a. |
The Company engages in business transactions with the following related parties: |
|
|
|
| Company |
|
Relationship |
|
|
| Taiwan International Standard Electronics Co., Ltd. (“TISE”) |
|
Associate |
| So-net Entertainment Taiwan Co., Ltd. (“So-net”) |
|
Associate |
| Skysoft Co., Ltd. (“SKYSOFT”) |
|
Associate |
| KingWaytek Technology Co., Ltd. (“KWT”) |
|
Associate |
| Dian Zuan Integrating Marketing Co., Ltd. (“DZIM”) |
|
Associate |
| Viettel-CHT Co., Ltd. (“Viettel”) |
|
Associate |
| Huada Digital Corporation (“HDD”) |
|
Jointly controlled entity |
| International Integrated System, Inc. (“IISI”) |
|
Associate |
| Senao Networks, Inc. (“SNI”) |
|
Associate of SENAO |
| HopeTech Technologies Limited (“HopeTech”) |
|
Associate of SIS |
| ST-2 Satellite Ventures Pte., Ltd. (“STS”) |
|
Associate |
| Other related parties |
|
|
| Chunghwa Telecom Foundation (“CTF”) |
|
A nonprofit organization of which the funds donated by Chunghwa exceeds one third of its total funds |
| Senao Technical and Cultural Foundation (“STCF”) |
|
A nonprofit organization of which the funds donated by SENAO exceeds one third of its total funds |
| Sochamp Technology Co., Ltd. (“Sochamp”) |
|
Investor of significant influence over CHST |
| United Daily News Co., Ltd. (“UDN) |
|
Investor of significant influence over SFD |
(Continued)
73
|
|
|
| Company |
|
Relationship |
|
|
| E-Life Mall Co., Ltd. |
|
One of the directors of E-Life Mall and a director of SENAO are members of an immediate family |
| Cheng Fong Investment Co., Ltd. |
|
The chairman of the board of directors of Cheng Fong is the general manager of SENAO. |
(Concluded)
| |
b. |
Terms of the foregoing transactions with related parties were not significantly different from transactions with non-related parties. When no similar transactions with non-related parties can be referenced, terms were
determined in accordance with mutual agreements. |
| |
1) |
Operating transactions |
|
|
|
|
|
|
|
|
|
|
|
|
|
|
|
|
|
| |
|
Sales |
|
| |
|
Three Months Ended
September 30 |
|
|
Nine Months Ended
September 30 |
|
| |
|
2013 |
|
|
2012 |
|
|
2012 |
|
|
2012 |
|
|
|
|
|
|
| Associates |
|
$ |
73,439 |
|
|
$ |
55,381 |
|
|
$ |
266,863 |
|
|
$ |
299,409 |
|
|
|
|
|
|
|
|
|
|
|
|
|
|
|
|
|
|
| Jointly controlled entities |
|
$ |
995 |
|
|
$ |
993 |
|
|
$ |
2,987 |
|
|
$ |
2,305 |
|
|
|
|
|
|
|
|
|
|
|
|
|
|
|
|
|
|
| Others |
|
$ |
29,285 |
|
|
$ |
1,741 |
|
|
$ |
40,389 |
|
|
$ |
2,436 |
|
|
|
|
|
|
|
|
|
|
|
|
|
|
|
|
|
|
|
|
|
|
|
|
|
|
|
|
|
|
|
|
|
|
|
| |
|
Purchases |
|
| |
|
Three Months Ended
September 30 |
|
|
Nine Months Ended
September 30 |
|
| |
|
2013 |
|
|
2012 |
|
|
2012 |
|
|
2012 |
|
|
|
|
|
|
| Associates |
|
$ |
350,958 |
|
|
$ |
274,850 |
|
|
$ |
1,022,966 |
|
|
$ |
897,452 |
|
|
|
|
|
|
|
|
|
|
|
|
|
|
|
|
|
|
| Jointly controlled entities |
|
$ |
— |
|
|
$ |
— |
|
|
$ |
571 |
|
|
$ |
— |
|
|
|
|
|
|
|
|
|
|
|
|
|
|
|
|
|
|
| Others |
|
$ |
8,374 |
|
|
$ |
48,981 |
|
|
$ |
60,957 |
|
|
$ |
57,603 |
|
|
|
|
|
|
|
|
|
|
|
|
|
|
|
|
|
|
| |
2) |
Non-operating transactions |
|
|
|
|
|
|
|
|
|
|
|
|
|
|
|
|
|
| |
|
Three Months Ended
September 30 |
|
|
Nine Months Ended
September 30 |
|
| |
|
2013 |
|
|
2012 |
|
|
2012 |
|
|
2012 |
|
|
|
|
|
|
| Associates |
|
$ |
7,916 |
|
|
$ |
6,347 |
|
|
$ |
24,046 |
|
|
$ |
24,108 |
|
|
|
|
|
|
|
|
|
|
|
|
|
|
|
|
|
|
| Others |
|
$ |
(19 |
) |
|
$ |
— |
|
|
$ |
86 |
|
|
$ |
— |
|
|
|
|
|
|
|
|
|
|
|
|
|
|
|
|
|
|
|
|
|
|
|
|
|
|
|
|
|
|
|
|
|
|
|
| |
|
September 30,
2013 |
|
|
December 31,
2012 |
|
|
September 30,
2012 |
|
|
January 1,
2012 |
|
|
|
|
|
|
| Associates |
|
$ |
48,081 |
|
|
$ |
43,822 |
|
|
$ |
27,726 |
|
|
$ |
34,064 |
|
| Jointly controlled entities |
|
|
1 |
|
|
|
19 |
|
|
|
23 |
|
|
|
— |
|
| Others |
|
|
283 |
|
|
|
96 |
|
|
|
466 |
|
|
|
— |
|
|
|
|
|
|
|
|
|
|
|
|
|
|
|
|
|
|
|
|
|
|
|
|
|
$ |
48,365 |
|
|
$ |
43,937 |
|
|
$ |
28,215 |
|
|
$ |
34,064 |
|
|
|
|
|
|
|
|
|
|
|
|
|
|
|
|
|
|
74
|
|
|
|
|
|
|
|
|
|
|
|
|
|
|
|
|
| |
|
September 30,
2013 |
|
|
December 31,
2012 |
|
|
September 30,
2012 |
|
|
January 1,
2012 |
|
|
|
|
|
|
| Associates |
|
$ |
460,588 |
|
|
$ |
832,957 |
|
|
$ |
471,623 |
|
|
$ |
783,688 |
|
| Jointly controlled entities |
|
|
— |
|
|
|
— |
|
|
|
— |
|
|
|
— |
|
| Others |
|
|
5,680 |
|
|
|
4,373 |
|
|
|
5,420 |
|
|
|
4,459 |
|
|
|
|
|
|
|
|
|
|
|
|
|
|
|
|
|
|
|
|
|
|
|
|
|
$ |
466,268 |
|
|
$ |
837,330 |
|
|
$ |
477,043 |
|
|
$ |
788,147 |
|
|
|
|
|
|
|
|
|
|
|
|
|
|
|
|
|
|
|
|
|
|
|
|
|
|
|
|
|
|
|
|
|
|
|
| |
|
September 30,
2013 |
|
|
December 31,
2012 |
|
|
September 30,
2012 |
|
|
January 1,
2012 |
|
|
|
|
|
|
| Associates |
|
$ |
1,863 |
|
|
$ |
2,695 |
|
|
$ |
2,448 |
|
|
$ |
2,005 |
|
|
|
|
|
|
|
|
|
|
|
|
|
|
|
|
|
|
| |
6) |
Acquisition of property, plant and equipment |
|
|
|
|
|
|
|
|
|
|
|
|
|
|
|
|
|
| |
|
Three Months Ended
September 30 |
|
|
Nine Months Ended
September 30 |
|
| |
|
2013 |
|
|
2012 |
|
|
2013 |
|
|
2012 |
|
|
|
|
|
|
| Associates |
|
$ |
181,706 |
|
|
$ |
61,724 |
|
|
$ |
951,550 |
|
|
$ |
442,754 |
|
|
|
|
|
|
|
|
|
|
|
|
|
|
|
|
|
|
The above amount is mainly attributable to telecommunications equipment bought from TISE.
Chunghwa entered into a contract with ST-2 Satellite Ventures Pte., Ltd. on March 12, 2010 to lease capacity on the ST-2 satellite. This
lease term is for 15 years which should start from the official operation of ST-2 satellite and the total contract value is approximately $6,000,000 thousand (SG$260,723 thousand), including a prepayment of $3,067,711 thousand, and the rest of
amount should be paid annually when ST-2 satellite starts its official operation. ST-2 satellite was launched in May 2011, and began its official operation in August 2011. The total rental expense for the three months ended September 30, 2013
was $100,379 thousand, which consisted of an offsetting credit of the prepayment of $51,099 thousand and an additional accrual of $49,280 thousand. The total rental expense for the nine months ended September 30, 2013 was $306,871 thousand,
which consisted of an offsetting credit of the prepayment of $154,872 thousand and an additional accrual of $151,999 thousand. The prepayment was $2,623,111 thousand (classified as prepaid rents-current $204,398 thousand, and prepaid rents -
noncurrent $2,418,713 thousand) as of September 30, 2013.
| |
c. |
Compensation of key management personnel |
The remuneration of directors and members of key
management personnel for the nine months and three months ended September 30, 2013 were as follows:
|
|
|
|
|
|
|
|
|
|
|
|
|
|
|
|
|
| |
|
Three Months Ended
September 30 |
|
|
Nine Months Ended
September 30 |
|
| |
|
2013 |
|
|
2012 |
|
|
2013 |
|
|
2012 |
|
|
|
|
|
|
| Short-term benefits |
|
$ |
59,768 |
|
|
$ |
60,296 |
|
|
$ |
199,216 |
|
|
$ |
185,915 |
|
| Post-employment benefits |
|
|
1,724 |
|
|
|
837 |
|
|
|
2,870 |
|
|
|
2,711 |
|
| Share-based payment |
|
|
3,624 |
|
|
|
— |
|
|
|
4,980 |
|
|
|
— |
|
|
|
|
|
|
|
|
|
|
|
|
|
|
|
|
|
|
|
|
|
|
|
|
|
$ |
65,116 |
|
|
$ |
61,133 |
|
|
$ |
207,066 |
|
|
$ |
188,626 |
|
|
|
|
|
|
|
|
|
|
|
|
|
|
|
|
|
|
75
The remuneration of directors and key executives is determined by the compensation committee
having regard to the performance of individual and market trends.
The following assets are pledged as collaterals for long-term bank loans
and contract deposits.
|
|
|
|
|
|
|
|
|
|
|
|
|
|
|
|
|
| |
|
September 30,
2013 |
|
|
December 31,
2012 |
|
|
September 30,
2012 |
|
|
January 1,
2012 |
|
|
|
|
|
|
| Property, plant and equipment, net |
|
$ |
2,675,787 |
|
|
$ |
2,693,863 |
|
|
$ |
2,705,302 |
|
|
$ |
2,736,212 |
|
| Land held for development |
|
|
1,998,733 |
|
|
|
1,998,733 |
|
|
|
— |
|
|
|
— |
|
| Restricted assets |
|
|
10,000 |
|
|
|
10,000 |
|
|
|
19,906 |
|
|
|
9,033 |
|
|
|
|
|
|
|
|
|
|
|
|
|
|
|
|
|
|
|
|
|
|
|
|
|
$ |
4,684,520 |
|
|
$ |
4,702,596 |
|
|
$ |
2,725,208 |
|
|
$ |
2,745,245 |
|
|
|
|
|
|
|
|
|
|
|
|
|
|
|
|
|
|
| 39. |
SIGNIFICANT CONTINGENT LIABILITIES AND UNRECOGNIZED COMMITMENTS |
At the balance sheet
date, the Company’s remaining commitments under non-cancelable contracts with various parties, excluding those disclosed in other notes, were as follows:
| |
a. |
Acquisitions of land and buildings of $4,069,411 thousand as of September 30, 2013. |
| |
b. |
Acquisitions of telecommunications equipment of $22,411,874 thousand as of September 30, 2013. |
| |
c. |
Unused letters of credit of $221,770 thousand as of September 30, 2013. |
| |
d. |
Contract to print billing, envelopes and marketing gifts of $45,360 thousand as of September 30, 2013. |
| |
e. |
A commitment to contribute $2,000,000 thousand to a Piping Fund administered by the Taipei City Government, of which $1,000,000 thousand was contributed by Chunghwa on August 15, 1996 (classified as other monetary
assets - noncurrent). If the fund is not sufficient, Chunghwa will contribute the remaining $1,000,000 thousand upon notification from the Taipei City Government. |
| 40. |
EXCHANGE RATE INFORMATION OF FOREIGN FINANCIAL ASSETS AND LIABILITIES |
The significant
information of foreign-currency financial assets and liabilities as below:
|
|
|
|
|
|
|
|
|
|
|
|
|
|
|
|
|
|
|
|
|
|
|
|
|
| |
|
September 30, 2013 |
|
|
September 30, 2012 |
|
| |
|
Foreign
Currencies
(Thousands) |
|
|
Exchange
Rate |
|
|
New Taiwan
Dollars
(Thousands) |
|
|
Foreign
Currencies
(Thousands) |
|
|
Exchange
Rate |
|
|
New Taiwan
Dollars
(Thousands) |
|
| Financial assets |
|
|
|
|
|
|
|
|
|
|
|
|
|
|
|
|
|
|
|
|
|
|
|
|
|
|
|
|
|
|
|
| Monetary items |
|
|
|
|
|
|
|
|
|
|
|
|
|
|
|
|
|
|
|
|
|
|
|
|
| Cash |
|
|
|
|
|
|
|
|
|
|
|
|
|
|
|
|
|
|
|
|
|
|
|
|
| USD |
|
$ |
16,388 |
|
|
|
29.57 |
|
|
$ |
484,588 |
|
|
$ |
16,751 |
|
|
|
29.30 |
|
|
$ |
490,719 |
|
| EUR |
|
|
93 |
|
|
|
39.92 |
|
|
|
3,707 |
|
|
|
117 |
|
|
|
37.89 |
|
|
|
4,443 |
|
| JPY |
|
|
8,235 |
|
|
|
0.30 |
|
|
|
2,487 |
|
|
|
14,677 |
|
|
|
0.38 |
|
|
|
5,548 |
|
| SGD |
|
|
874 |
|
|
|
23.54 |
|
|
|
20,580 |
|
|
|
213 |
|
|
|
23.92 |
|
|
|
5,089 |
|
| Accounts receivable |
|
|
|
|
|
|
|
|
|
|
|
|
|
|
|
|
|
|
|
|
|
|
|
|
| USD |
|
|
145,969 |
|
|
|
29.57 |
|
|
|
4,316,301 |
|
|
|
174,480 |
|
|
|
29.30 |
|
|
|
5,111,384 |
|
| EUR |
|
|
106 |
|
|
|
39.92 |
|
|
|
4,150 |
|
|
|
129 |
|
|
|
37.89 |
|
|
|
4,898 |
|
| JPY |
|
|
3,310 |
|
|
|
0.30 |
|
|
|
1,000 |
|
|
|
— |
|
|
|
0.38 |
|
|
|
— |
|
| SGD |
|
|
103 |
|
|
|
23.54 |
|
|
|
2,427 |
|
|
|
3 |
|
|
|
23.92 |
|
|
|
79 |
|
(Continued)
76
|
|
|
|
|
|
|
|
|
|
|
|
|
|
|
|
|
|
|
|
|
|
|
|
|
| |
|
September 30, 2013 |
|
|
September 30, 2012 |
|
| |
|
Foreign
Currencies
(Thousands) |
|
|
Exchange
Rate |
|
|
New Taiwan
Dollars
(Thousands) |
|
|
Foreign
Currencies
(Thousands) |
|
|
Exchange
Rate |
|
|
New Taiwan
Dollars
(Thousands) |
|
|
|
|
|
|
|
|
| Non-monetary items |
|
|
|
|
|
|
|
|
|
|
|
|
|
|
|
|
|
|
|
|
|
|
|
|
| Available-for-sale financial assets |
|
|
|
|
|
|
|
|
|
|
|
|
|
|
|
|
|
|
|
|
|
|
|
|
| USD |
|
$ |
20,000 |
|
|
|
29.57 |
|
|
$ |
591,400 |
|
|
$ |
74,847 |
|
|
|
29.30 |
|
|
$ |
2,193,024 |
|
| Investments accounted for using equity method |
|
|
|
|
|
|
|
|
|
|
|
|
|
|
|
|
|
|
|
|
|
|
|
|
| USD |
|
|
607 |
|
|
|
29.57 |
|
|
|
17,943 |
|
|
|
1,029 |
|
|
|
29.30 |
|
|
|
30,152 |
|
| SGD |
|
|
28,201 |
|
|
|
23.54 |
|
|
|
663,852 |
|
|
|
22,920 |
|
|
|
23.92 |
|
|
|
548,243 |
|
|
|
|
|
|
|
|
| Financial liabilities |
|
|
|
|
|
|
|
|
|
|
|
|
|
|
|
|
|
|
|
|
|
|
|
|
|
|
|
|
|
|
|
| Monetary items |
|
|
|
|
|
|
|
|
|
|
|
|
|
|
|
|
|
|
|
|
|
|
|
|
| Payable to suppliers |
|
|
|
|
|
|
|
|
|
|
|
|
|
|
|
|
|
|
|
|
|
|
|
|
| USD |
|
|
166,901 |
|
|
|
29.57 |
|
|
|
4,935,275 |
|
|
|
158,568 |
|
|
|
29.30 |
|
|
|
4,645,265 |
|
| EUR |
|
|
34,028 |
|
|
|
39.92 |
|
|
|
1,358,384 |
|
|
|
35,639 |
|
|
|
37.89 |
|
|
|
1,350,376 |
|
| JPY |
|
|
27,233 |
|
|
|
0.30 |
|
|
|
8,224 |
|
|
|
13,620 |
|
|
|
0.38 |
|
|
|
5,148 |
|
| SGD |
|
|
81 |
|
|
|
23.54 |
|
|
|
1,908 |
|
|
|
9,984 |
|
|
|
23.92 |
|
|
|
238,825 |
|
|
|
|
|
|
|
|
|
|
|
|
|
|
|
|
|
|
|
|
|
|
|
|
|
|
(Concluded)
|
|
|
|
|
|
|
|
|
|
|
|
|
|
|
|
|
|
|
|
|
|
|
|
|
| |
|
December 31, 2012 |
|
|
January 1, 2012 |
|
| |
|
Foreign
Currencies |
|
|
Exchange
Rate |
|
|
New Taiwan
Dollars |
|
|
Foreign
Currencies |
|
|
Exchange
Rate |
|
|
New Taiwan
Dollars |
|
|
|
|
|
|
|
|
| Financial assets |
|
|
|
|
|
|
|
|
|
|
|
|
|
|
|
|
|
|
|
|
|
|
|
|
|
|
|
|
|
|
|
| Monetary items |
|
|
|
|
|
|
|
|
|
|
|
|
|
|
|
|
|
|
|
|
|
|
|
|
| Cash |
|
|
|
|
|
|
|
|
|
|
|
|
|
|
|
|
|
|
|
|
|
|
|
|
| USD |
|
$ |
9,675 |
|
|
|
29.04 |
|
|
$ |
280,968 |
|
|
$ |
12,156 |
|
|
|
30.28 |
|
|
$ |
368,034 |
|
| EUR |
|
|
366 |
|
|
|
38.49 |
|
|
|
14,073 |
|
|
|
78 |
|
|
|
39.18 |
|
|
|
3,075 |
|
| JPY |
|
|
15,647 |
|
|
|
0.34 |
|
|
|
5,257 |
|
|
|
188 |
|
|
|
0.39 |
|
|
|
73 |
|
| SGD |
|
|
233 |
|
|
|
23.76 |
|
|
|
5,539 |
|
|
|
183 |
|
|
|
23.31 |
|
|
|
4,261 |
|
| Accounts receivable |
|
|
|
|
|
|
|
|
|
|
|
|
|
|
|
|
|
|
|
|
|
|
|
|
| USD |
|
|
136,702 |
|
|
|
29.04 |
|
|
|
3,969,830 |
|
|
|
163,696 |
|
|
|
30.28 |
|
|
|
4,955,896 |
|
| EUR |
|
|
133 |
|
|
|
38.49 |
|
|
|
5,133 |
|
|
|
89 |
|
|
|
39.18 |
|
|
|
3,491 |
|
| JPY |
|
|
2,170 |
|
|
|
0.34 |
|
|
|
729 |
|
|
|
3,518 |
|
|
|
0.39 |
|
|
|
1,375 |
|
| SGD |
|
|
12 |
|
|
|
23.76 |
|
|
|
282 |
|
|
|
4 |
|
|
|
23.31 |
|
|
|
104 |
|
| Non-monetary items |
|
|
|
|
|
|
|
|
|
|
|
|
|
|
|
|
|
|
|
|
|
|
|
|
| Available-for-sale financial assets |
|
|
|
|
|
|
|
|
|
|
|
|
|
|
|
|
|
|
|
|
|
|
|
|
| USD |
|
|
75,517 |
|
|
|
29.04 |
|
|
|
2,193,024 |
|
|
|
68,243 |
|
|
|
30.28 |
|
|
|
2,066,398 |
|
| Investments accounted for using equity method |
|
|
|
|
|
|
|
|
|
|
|
|
|
|
|
|
|
|
|
|
|
|
|
|
| USD |
|
|
1,046 |
|
|
|
29.04 |
|
|
|
30,376 |
|
|
|
710 |
|
|
|
30.28 |
|
|
|
21,668 |
|
| SGD |
|
|
22,798 |
|
|
|
23.76 |
|
|
|
541,672 |
|
|
|
19,827 |
|
|
|
23.31 |
|
|
|
462,161 |
|
|
|
|
|
|
|
|
| Financial liabilities |
|
|
|
|
|
|
|
|
|
|
|
|
|
|
|
|
|
|
|
|
|
|
|
|
|
|
|
|
|
|
|
| Monetary items |
|
|
|
|
|
|
|
|
|
|
|
|
|
|
|
|
|
|
|
|
|
|
|
|
| Accounts payable |
|
|
|
|
|
|
|
|
|
|
|
|
|
|
|
|
|
|
|
|
|
|
|
|
| USD |
|
|
122,608 |
|
|
|
29.04 |
|
|
|
3,560,547 |
|
|
|
133,808 |
|
|
|
30.28 |
|
|
|
4,051,055 |
|
| EUR |
|
|
34,058 |
|
|
|
38.49 |
|
|
|
1,310,892 |
|
|
|
28,037 |
|
|
|
39.18 |
|
|
|
1,098,504 |
|
| JPY |
|
|
14,399 |
|
|
|
0.34 |
|
|
|
4,838 |
|
|
|
13,186 |
|
|
|
0.39 |
|
|
|
5,156 |
|
| SGD |
|
|
886 |
|
|
|
23.76 |
|
|
|
21,055 |
|
|
|
3,579 |
|
|
|
23.31 |
|
|
|
83,416 |
|
77
| 41. |
ADDITIONAL DISCLOSURES |
Following are the additional disclosures required by the SFC for
the Company:
| |
a. |
Financing provided: None. |
| |
b. |
Endorsement/guarantee provided: Please see Table 1. |
| |
c. |
Marketable securities held: Please see Table 2. |
| |
d. |
Marketable securities acquired and disposed of at costs or prices at least $100 million or 20% of the paid-in capital: Please see Table 3. |
| |
e. |
Acquisition of individual real estate at costs of at least $100 million or 20% of the paid-in capital: None. |
| |
f. |
Disposal of individual real estate at prices of at least $100 million or 20% of the paid-in capital: None. |
| |
g. |
Total purchases from or sales to related parties amounting to at least $100 million or 20% of the paid-in capital: Please see Table 4. |
| |
h. |
Receivables from related parties amounting to $100 million or 20% of the paid-in capital: Please see Table 5. |
| |
i. |
Names, locations, and other information of investees on which the Company exercises significant influence: Please see Table 6. |
| |
j. |
Financial transactions: Please see Notes 7 and 36. |
| |
k. |
Investment in Mainland China: Please see Table 7. |
| |
l. |
Intercompany relationships and significant intercompany transaction: Please see Table 8. |
The Company has five reportable segments that provide different
products or services. Segment information is provided to the board of directors and CEO who allocate resources and assess segment performance. The Company’s reportable segments are as follows:
| |
a. |
Domestic fixed communications business - the provision of local telephone services, domestic long distance telephone services, broadband access, and related services; |
| |
b. |
Mobile communications business - the provision of mobile services, sales of mobile handsets and data cards, and related services; |
| |
c. |
Internet business - the provision of HiNet services and related services; |
| |
d. |
International fixed communications business - the provision of international long distance telephone services and related services; |
| |
e. |
Others - the provision of non-Telecom services, and the corporate related items not allocated to reportable segments. |
78
Segment Revenue and Operating Results
Analysis by reportable segment of revenue and operating results of continuing operations are as follows:
|
|
|
|
|
|
|
|
|
|
|
|
|
|
|
|
|
|
|
|
|
|
|
|
|
| |
|
Domestic Fixed
Communi-
cations
Business |
|
|
Mobile
Communi-
cations
Business |
|
|
Internet
Business |
|
|
International
Fixed
Communi-
cations
Business |
|
|
Others |
|
|
Total |
|
|
|
|
|
|
|
|
| Three months ended September 30, 2013 |
|
|
|
|
|
|
|
|
|
|
|
|
|
|
|
|
|
|
|
|
|
|
|
|
|
|
|
|
|
|
|
| Revenue |
|
|
|
|
|
|
|
|
|
|
|
|
|
|
|
|
|
|
|
|
|
|
|
|
| From external customers |
|
$ |
17,971,391 |
|
|
$ |
27,527,387 |
|
|
$ |
6,728,941 |
|
|
$ |
3,965,089 |
|
|
$ |
530,496 |
|
|
$ |
56,723,304 |
|
| Intersegment revenues |
|
|
4,412,930 |
|
|
|
1,406,005 |
|
|
|
1,112,389 |
|
|
|
537,384 |
|
|
|
321,884 |
|
|
|
7,790,592 |
|
|
|
|
|
|
|
|
|
|
|
|
|
|
|
|
|
|
|
|
|
|
|
|
|
|
| Segment revenues |
|
$ |
22,384,321 |
|
|
$ |
28,933,392 |
|
|
$ |
7,841,330 |
|
|
$ |
4,502,473 |
|
|
$ |
852,380 |
|
|
|
64,513,896 |
|
|
|
|
|
|
|
|
|
|
|
|
|
|
|
|
|
|
|
|
|
|
|
|
|
|
| Intersegment elimination |
|
|
|
|
|
|
|
|
|
|
|
|
|
|
|
|
|
|
|
|
|
|
(7,790,592 |
) |
|
|
|
|
|
|
|
|
|
|
|
|
|
|
|
|
|
|
|
|
|
|
|
|
|
|
|
|
|
|
|
|
| Consolidated revenues |
|
|
|
|
|
|
|
|
|
|
|
|
|
|
|
|
|
|
|
|
|
$ |
56,723,304 |
|
|
|
|
|
|
|
|
|
|
|
|
|
|
|
|
|
|
|
|
|
|
|
|
|
|
|
|
|
|
|
|
|
| Segment income before income tax |
|
$ |
3,817,814 |
|
|
$ |
6,895,038 |
|
|
$ |
2,472,604 |
|
|
$ |
313,976 |
|
|
$ |
(428,766 |
) |
|
$ |
13,070,666 |
|
|
|
|
|
|
|
|
|
|
|
|
|
|
|
|
|
|
|
|
|
|
|
|
|
|
|
|
|
|
|
|
|
| Nine months ended September 30, 2013 |
|
|
|
|
|
|
|
|
|
|
|
|
|
|
|
|
|
|
|
|
|
|
|
|
|
|
|
|
|
|
|
| Revenue |
|
|
|
|
|
|
|
|
|
|
|
|
|
|
|
|
|
|
|
|
|
|
|
|
| From external customers |
|
$ |
54,205,670 |
|
|
$ |
82,299,153 |
|
|
$ |
18,938,311 |
|
|
$ |
11,806,430 |
|
|
$ |
1,928,689 |
|
|
$ |
169,178,253 |
|
| Intersegment revenues |
|
|
13,705,395 |
|
|
|
4,203,446 |
|
|
|
3,060,157 |
|
|
|
1,520,651 |
|
|
|
715,243 |
|
|
|
23,204,892 |
|
|
|
|
|
|
|
|
|
|
|
|
|
|
|
|
|
|
|
|
|
|
|
|
|
|
| Segment revenues |
|
$ |
67,911,065 |
|
|
$ |
86,502,599 |
|
|
$ |
21,998,468 |
|
|
$ |
13,327,081 |
|
|
$ |
2,643,932 |
|
|
|
192,383,145 |
|
|
|
|
|
|
|
|
|
|
|
|
|
|
|
|
|
|
|
|
|
|
|
|
|
|
| Intersegment elimination |
|
|
|
|
|
|
|
|
|
|
|
|
|
|
|
|
|
|
|
|
|
|
(23,204,892 |
) |
|
|
|
|
|
|
|
|
|
|
|
|
|
|
|
|
|
|
|
|
|
|
|
|
|
|
|
|
|
|
|
|
| Consolidated revenues |
|
|
|
|
|
|
|
|
|
|
|
|
|
|
|
|
|
|
|
|
|
$ |
169,178,253 |
|
|
|
|
|
|
|
|
|
|
|
|
|
|
|
|
|
|
|
|
|
|
|
|
|
|
|
|
|
|
|
|
|
| Segment income before income tax |
|
$ |
13,137,625 |
|
|
$ |
18,218,308 |
|
|
$ |
7,077,564 |
|
|
$ |
823,005 |
|
|
$ |
(1,582,966 |
) |
|
$ |
37,673,536 |
|
|
|
|
|
|
|
|
|
|
|
|
|
|
|
|
|
|
|
|
|
|
|
|
|
|
|
|
|
|
|
|
|
| Three months ended September 30, 2012 |
|
|
|
|
|
|
|
|
|
|
|
|
|
|
|
|
|
|
|
|
|
|
|
|
|
|
|
|
|
|
|
| Revenue |
|
|
|
|
|
|
|
|
|
|
|
|
|
|
|
|
|
|
|
|
|
|
|
|
| From external customers |
|
$ |
19,060,240 |
|
|
$ |
24,878,807 |
|
|
$ |
6,050,957 |
|
|
$ |
3,857,108 |
|
|
$ |
1,437,495 |
|
|
$ |
55,284,607 |
|
| Intersegment revenues |
|
|
4,168,800 |
|
|
|
1,697,420 |
|
|
|
704,766 |
|
|
|
541,203 |
|
|
|
346,798 |
|
|
|
7,458,987 |
|
|
|
|
|
|
|
|
|
|
|
|
|
|
|
|
|
|
|
|
|
|
|
|
|
|
| Segment revenues |
|
$ |
23,229,040 |
|
|
$ |
26,576,227 |
|
|
$ |
6,755,723 |
|
|
$ |
4,398,311 |
|
|
$ |
1,784,293 |
|
|
|
62,743,594 |
|
|
|
|
|
|
|
|
|
|
|
|
|
|
|
|
|
|
|
|
|
|
|
|
|
|
| Intersegment elimination |
|
|
|
|
|
|
|
|
|
|
|
|
|
|
|
|
|
|
|
|
|
|
(7,458,987 |
) |
|
|
|
|
|
|
|
|
|
|
|
|
|
|
|
|
|
|
|
|
|
|
|
|
|
|
|
|
|
|
|
|
| Consolidated revenues |
|
|
|
|
|
|
|
|
|
|
|
|
|
|
|
|
|
|
|
|
|
$ |
55,284,607 |
|
|
|
|
|
|
|
|
|
|
|
|
|
|
|
|
|
|
|
|
|
|
|
|
|
|
|
|
|
|
|
|
|
| Segment income before income tax |
|
$ |
3,661,759 |
|
|
$ |
7,018,696 |
|
|
$ |
2,069,987 |
|
|
$ |
341,683 |
|
|
$ |
(34,388 |
) |
|
$ |
13,057,737 |
|
|
|
|
|
|
|
|
|
|
|
|
|
|
|
|
|
|
|
|
|
|
|
|
|
|
|
|
|
|
|
|
|
| Nine months ended September 30, 2012 |
|
|
|
|
|
|
|
|
|
|
|
|
|
|
|
|
|
|
|
|
|
|
|
|
|
|
|
|
|
|
|
| Revenue |
|
|
|
|
|
|
|
|
|
|
|
|
|
|
|
|
|
|
|
|
|
|
|
|
| From external customers |
|
$ |
56,842,336 |
|
|
$ |
75,195,324 |
|
|
$ |
18,237,420 |
|
|
$ |
11,369,508 |
|
|
$ |
3,524,390 |
|
|
$ |
165,168,978 |
|
| Intersegment revenues |
|
|
12,343,819 |
|
|
|
4,943,328 |
|
|
|
2,137,568 |
|
|
|
1,690,932 |
|
|
|
818,008 |
|
|
|
21,933,655 |
|
|
|
|
|
|
|
|
|
|
|
|
|
|
|
|
|
|
|
|
|
|
|
|
|
|
| Segment revenues |
|
$ |
69,186,155 |
|
|
$ |
80,138,652 |
|
|
$ |
20,374,988 |
|
|
$ |
13,060,440 |
|
|
$ |
4,342,398 |
|
|
|
187,102,633 |
|
|
|
|
|
|
|
|
|
|
|
|
|
|
|
|
|
|
|
|
|
|
|
|
|
|
| Intersegment elimination |
|
|
|
|
|
|
|
|
|
|
|
|
|
|
|
|
|
|
|
|
|
|
(21,933,655 |
) |
|
|
|
|
|
|
|
|
|
|
|
|
|
|
|
|
|
|
|
|
|
|
|
|
|
|
|
|
|
|
|
|
| Consolidated revenues |
|
|
|
|
|
|
|
|
|
|
|
|
|
|
|
|
|
|
|
|
|
$ |
165,168,978 |
|
|
|
|
|
|
|
|
|
|
|
|
|
|
|
|
|
|
|
|
|
|
|
|
|
|
|
|
|
|
|
|
|
| Segment income before income tax |
|
$ |
11,478,606 |
|
|
$ |
20,279,911 |
|
|
$ |
6,645,615 |
|
|
$ |
986,783 |
|
|
$ |
(604,454 |
) |
|
$ |
38,786,461 |
|
|
|
|
|
|
|
|
|
|
|
|
|
|
|
|
|
|
|
|
|
|
|
|
|
|
| 43. |
DISCLOSURE FOR FIRST-TIME ADOPTION OF INTERNATIONAL FINANCIAL REPORTING STANDARDS |
| |
a. |
Basis of the preparation of financial information under Taiwan-IFRSs |
As the basis of the
preparation, the Company complied with IFRS 1 “First-time adoption of International Financial Reporting Standards” in addition to the significant accounting policies stated in Note 3 to prepare the consolidated financial statements as of
and for the nine months ended September 30, 2013.
79
| |
b. |
Based on IFRS 1 “First-time adoption of International Financial Reporting Standards”, when the Company first adopts Taiwan-IFRSs, the Company should apply the Taiwan-IFRSs to establish its accounting policies,
to prepare its financial statements and make required adjustments retroactively to the transition date (January 1, 2012). IFRS 1 provided several optional exemptions. The main exemptions adopted by the Company were discussed as follows:
|
The Company elected not to apply IFRS 3 retrospectively to business
combinations which occurred on or before December 31, 2011.
| |
2) |
Share-based payment transactions |
The Company elected not to apply IFRS 2 retrospectively to
the share-based payment transactions which were granted and vested on or before December 31, 2011.
The Company elected to measure its revalued land at the date of transition to
Taiwan-IFRSs at its revalued amount determined under ROC GAAP as its deemed cost. The other property, plant and equipment, investment properties and intangible assets were measured under a cost model under Taiwan-IFRSs.
The Company elected to recognize all unrecognized cumulative actuarial
gains and losses as retained earnings as of January 1, 2012.
The impacts of the aforementioned optional exemptions were included in
the following part d of “explanation for the adjustments of Taiwan-IFRSs transition”.
| |
c. |
Impacts after transition to Taiwan-IFRSs |
Except for the following tables, please refer to Note
43 to the consolidated financial statement as of and for the three months ended March 31, 2013 for impacts on the consolidated financial statements after transition to Taiwan-IFRSs.
The impacts on the consolidated balance sheet and the consolidated statements of comprehensive income after transition to Taiwan-IFRSs are as
follows:
| |
1) |
Reconciliation of consolidated balance sheet as of September 30, 2012 |
|
|
|
|
|
|
|
|
|
|
|
|
|
|
|
|
|
|
|
|
|
| |
|
|
Adjustments |
|
|
|
| ROC GAAP |
|
|
Differences in
Recognitions and
Measurements |
|
|
Differences in
Presentations |
|
|
IFRSs |
|
|
| Items |
|
Amount |
|
|
|
|
Amount |
|
|
Items |
|
Notes |
|
|
|
|
|
|
|
| Current assets |
|
$ |
84,992,991 |
|
|
$ |
— |
|
|
$ |
(923,376 |
) |
|
$ |
84,069,615 |
|
|
Current assets |
|
4), 13) |
| Investments accounted for using equity method |
|
|
2,687,936 |
|
|
|
(9,599 |
) |
|
|
— |
|
|
|
2,678,337 |
|
|
Investments accounted for using equity method |
|
10), 12) |
| Financial assets carried at cost |
|
|
2,616,087 |
|
|
|
— |
|
|
|
(90,469 |
) |
|
|
2,525,618 |
|
|
Financial assets carried at cost |
|
13) |
| Available-for-sale financial assets |
|
|
3,261,868 |
|
|
|
— |
|
|
|
90,469 |
|
|
|
3,352,337 |
|
|
Available-for-sale financial assets |
|
13) |
| Held-to-maturity financial assets |
|
|
14,005,461 |
|
|
|
— |
|
|
|
— |
|
|
|
14,005,461 |
|
|
Held-to-maturity financial assets |
|
|
| Other monetary assets |
|
|
1,000,000 |
|
|
|
— |
|
|
|
(1,000,000 |
) |
|
|
— |
|
|
|
|
13) |
| Property, plant and equipment |
|
|
299,809,041 |
|
|
|
— |
|
|
|
(6,326,261 |
) |
|
|
293,482,780 |
|
|
Property, plant and equipment |
|
1), 2), 13) |
|
|
|
— |
|
|
|
— |
|
|
|
7,812,704 |
|
|
|
7,812,704 |
|
|
Investment properties |
|
1), 2) |
| Intangible assets |
|
|
5,872,131 |
|
|
|
(64,553 |
) |
|
|
36,465 |
|
|
|
5,844,043 |
|
|
Intangible assets |
|
13) |
| Other assets |
|
|
7,605,886 |
|
|
|
482,392 |
|
|
|
439,929 |
|
|
|
8,528,207 |
|
|
Other noncurrent assets |
|
1), 2), 4), 5), 6), 13) |
|
|
|
|
|
|
|
|
|
|
|
|
|
|
|
|
|
|
|
|
|
|
|
|
|
|
|
|
| Total |
|
$ |
421,851,401 |
|
|
$ |
408,240 |
|
|
$ |
39,461 |
|
|
$ |
422,299,102 |
|
|
Total |
|
|
|
|
|
|
|
|
|
|
|
|
|
|
|
|
|
|
|
|
|
|
|
(Continued)
80
|
|
|
|
|
|
|
|
|
|
|
|
|
|
|
|
|
|
|
|
|
| |
|
|
Adjustments |
|
|
|
| ROC GAAP |
|
|
Differences in
Recognitions and
Measurements |
|
|
Differences in
Presentations |
|
|
IFRSs |
|
|
| Items |
|
Amount |
|
|
|
|
Amount |
|
|
Items |
|
Notes |
|
|
|
|
|
|
|
| Current liabilities |
|
$ |
48,936,714 |
|
|
$ |
402,904 |
|
|
$ |
(942,416 |
) |
|
$ |
48,397,202 |
|
|
Current liabilities |
|
7), 8) |
| Noncurrent liabilities |
|
|
11,068,608 |
|
|
|
2,423,272 |
|
|
|
1,076,863 |
|
|
|
14,568,743 |
|
|
Noncurrent liabilities |
|
4), 5), 6), 7), 8) |
| Reserve for land value incremental tax |
|
|
94,986 |
|
|
|
— |
|
|
|
(94,986 |
) |
|
|
— |
|
|
|
|
4) |
|
|
|
|
|
|
|
|
|
|
|
|
|
|
|
|
|
|
|
|
|
| Total liabilities |
|
|
60,100,308 |
|
|
|
2,826,176 |
|
|
|
39,461 |
|
|
|
62,965,945 |
|
|
Total liabilities |
|
|
|
|
|
|
|
|
|
|
|
|
|
|
|
|
|
|
|
|
|
|
|
| Common stock |
|
|
77,574,465 |
|
|
|
— |
|
|
|
— |
|
|
|
77,574,465 |
|
|
Common stock |
|
|
| Additional paid-in capital |
|
|
169,542,532 |
|
|
|
20,618,636 |
|
|
|
— |
|
|
|
190,161,168 |
|
|
Additional paid-in capital |
|
6), 11), 12) |
| Retained earnings |
|
|
104,462,712 |
|
|
|
(17,278,139 |
) |
|
|
— |
|
|
|
87,184,573 |
|
|
Retained earnings |
|
3), 5), 6), 7), 8), 10), 11), 12) |
| Other adjustments |
|
|
5,964,503 |
|
|
|
(5,724,796 |
) |
|
|
— |
|
|
|
239,707 |
|
|
Other adjustments |
|
3), 6), 10) |
|
|
|
|
|
|
|
|
|
|
|
|
|
|
|
|
|
|
|
|
|
| Total equity attributable to stockholders of the parent |
|
|
357,544,212 |
|
|
|
(2,384,299 |
) |
|
|
— |
|
|
|
355,159,913 |
|
|
Total equity attributable to shareholders of the parent |
|
|
| Minority interests in subsidiaries |
|
|
4,206,881 |
|
|
|
(33,637 |
) |
|
|
— |
|
|
|
4,173,244 |
|
|
Noncontrolling interests |
|
5), 6), 10), 11) |
|
|
|
|
|
|
|
|
|
|
|
|
|
|
|
|
|
|
|
|
|
| Total stockholders’ equity |
|
|
361,751,093 |
|
|
|
(2,417,936 |
) |
|
|
— |
|
|
|
359,333,157 |
|
|
Total shareholders’ equity |
|
|
|
|
|
|
|
|
|
|
|
|
|
|
|
|
|
|
|
|
|
|
|
|
|
|
|
|
|
|
| Total |
|
$ |
421,851,401 |
|
|
$ |
408,240 |
|
|
$ |
39,461 |
|
|
$ |
422,299,102 |
|
|
Total |
|
|
|
|
|
|
|
|
|
|
|
|
|
|
|
|
|
|
|
|
|
|
|
(Concluded)
| |
2) |
Reconciliation of consolidated statement of comprehensive income for the nine months ended September 30, 2012 |
|
|
|
|
|
|
|
|
|
|
|
|
|
|
|
|
|
|
|
|
|
| |
|
|
Adjustments |
|
|
|
| ROC GAAP |
|
|
Differences in
Recognitions and
Measurements |
|
|
Differences in
Presentations |
|
|
IFRSs |
|
|
| Items |
|
Amount |
|
|
|
|
Amount |
|
|
Items |
|
Notes |
|
|
|
|
|
|
|
| Net revenues |
|
$ |
164,008,760 |
|
|
$ |
1,160,218 |
|
|
$ |
— |
|
|
$ |
165,168,978 |
|
|
Revenues |
|
7), 8), 9) |
| Operating costs |
|
|
(104,375,603 |
) |
|
|
(326,247 |
) |
|
|
(852 |
) |
|
|
(104,702,702 |
) |
|
Operating costs |
|
6), 7), 9), 14) |
|
|
|
|
|
|
|
|
|
|
|
|
|
|
|
|
|
|
|
|
|
| Gross profits |
|
|
59,633,157 |
|
|
|
833,971 |
|
|
|
(852 |
) |
|
|
60,466,276 |
|
|
Gross profit |
|
|
| Operating expenses |
|
|
(21,759,339 |
) |
|
|
41,630 |
|
|
|
28,772 |
|
|
|
(21,688,937 |
) |
|
Operating expenses |
|
6), 7), 9), 11), 14) |
|
|
|
— |
|
|
|
— |
|
|
|
(1,266,280 |
) |
|
|
(1,266,280 |
) |
|
Other income and expense |
|
14) |
|
|
|
|
|
|
|
|
|
|
|
|
|
|
|
|
|
|
|
|
|
| Income from operations |
|
|
37,873,818 |
|
|
|
875,601 |
|
|
|
(1,238,360 |
) |
|
|
37,511,059 |
|
|
Income from operations |
|
|
| Non-operating income and losses |
|
|
9,421 |
|
|
|
(450 |
) |
|
|
1,266,431 |
|
|
|
1,275,402 |
|
|
Non-operating income and expenses |
|
3), 10), 12), 14) |
|
|
|
|
|
|
|
|
|
|
|
|
|
|
|
|
|
|
|
|
|
| Income before income tax |
|
|
37,883,239 |
|
|
|
875,151 |
|
|
|
28,071 |
|
|
|
38,786,461 |
|
|
Income before income tax |
|
|
| Income tax expense |
|
|
(6,066,681 |
) |
|
|
(97,971 |
) |
|
|
(28,071 |
) |
|
|
(6,192,723 |
) |
|
Income tax expenses |
|
5), 14) |
|
|
|
|
|
|
|
|
|
|
|
|
|
|
|
|
|
|
|
|
|
| Consolidated net income |
|
$ |
31,816,558 |
|
|
$ |
777,180 |
|
|
$ |
— |
|
|
|
32,593,738 |
|
|
Net income |
|
|
|
|
|
|
|
|
|
|
|
|
|
|
|
|
|
|
|
|
|
|
|
|
|
|
|
|
|
|
|
|
|
|
|
|
|
|
(41,282 |
) |
|
Exchange differences arising from the translation of the foreign operations |
|
|
|
|
|
|
|
|
|
|
|
|
|
|
|
|
|
246,505 |
|
|
Unrealized gain on available-for-sale financial assets |
|
|
|
|
|
|
|
|
|
|
|
|
|
|
|
|
|
13 |
|
|
Share of other comprehensive income of associates and jointly controlled entities accounted for using equity method |
|
|
|
|
|
|
|
|
|
|
|
|
|
|
|
|
|
|
|
|
|
|
|
|
|
|
|
|
|
|
|
|
|
|
|
|
|
|
205,236 |
|
|
Total other comprehensive income |
|
|
|
|
|
|
|
|
|
|
|
|
|
|
|
|
|
|
|
|
|
|
|
|
|
|
|
|
|
|
|
|
|
|
|
|
|
|
|
|
|
|
|
|
$ |
32,798,974 |
|
|
Total comprehensive income |
|
|
|
|
|
|
|
|
|
|
|
|
|
|
|
|
|
|
|
|
|
|
|
| |
3) |
Reconciliation of consolidated statement of comprehensive income for three months ended September 30, 2012 |
|
|
|
|
|
|
|
|
|
|
|
|
|
|
|
|
|
|
|
|
|
| |
|
|
Adjustments |
|
|
|
| ROC GAAP |
|
|
Differences in
Recognitions and
Measurements |
|
|
Differences in
Presentations |
|
|
IFRSs |
|
|
| Items |
|
Amount |
|
|
|
|
Amount |
|
|
Items |
|
Notes |
|
|
|
|
|
|
|
| Net revenues |
|
$ |
54,402,889 |
|
|
$ |
881,718 |
|
|
$ |
— |
|
|
$ |
55,284,607 |
|
|
Revenues |
|
7), 8), 9) |
| Operating costs |
|
|
(34,280,725 |
) |
|
|
(326,889 |
) |
|
|
(295 |
) |
|
|
(34,607,909 |
) |
|
Operating costs |
|
6), 7), 9), 14) |
|
|
|
|
|
|
|
|
|
|
|
|
|
|
|
|
|
|
|
|
|
| Gross profits |
|
|
20,122,164 |
|
|
|
554,829 |
|
|
|
(295 |
) |
|
|
20,676,698 |
|
|
Gross profit |
|
|
| Operating expenses |
|
|
(8,023,223 |
) |
|
|
(18,253 |
) |
|
|
8,563 |
|
|
|
(8,032,913 |
) |
|
Operating expenses |
|
6), 7), 9), 11) 14) |
|
|
|
— |
|
|
|
|
|
|
|
(9,457 |
) |
|
|
(9,457 |
) |
|
Other income and expense |
|
14) |
|
|
|
|
|
|
|
|
|
|
|
|
|
|
|
|
|
|
|
|
|
| Income from operations |
|
|
12,098,941 |
|
|
|
536,576 |
|
|
|
(1,189 |
) |
|
|
12,634,328 |
|
|
Income from operations |
|
|
| Non-operating income and losses |
|
|
412,720 |
|
|
|
1,232 |
|
|
|
9,457 |
|
|
|
423,409 |
|
|
Non-operating income and expenses |
|
3), 10), 12), 14) |
|
|
|
|
|
|
|
|
|
|
|
|
|
|
|
|
|
|
|
|
|
| Income before income tax |
|
|
12,511,661 |
|
|
|
537,808 |
|
|
|
8,268 |
|
|
|
13,057,737 |
|
|
Income before income tax |
|
|
| Income tax expense |
|
|
(2,042,946 |
) |
|
|
(34,318 |
) |
|
|
(8,268 |
) |
|
|
(2,085,532 |
) |
|
Income tax expenses |
|
5), 14) |
|
|
|
|
|
|
|
|
|
|
|
|
|
|
|
|
|
|
|
|
|
| Consolidated net income |
|
$ |
10,468,715 |
|
|
$ |
503,490 |
|
|
$ |
— |
|
|
|
10,972,205 |
|
|
Net income |
|
|
|
|
|
|
|
|
|
|
|
|
|
|
|
|
|
|
|
|
|
|
|
(Continued)
81
|
|
|
|
|
|
|
|
|
|
|
|
|
|
|
| |
|
Adjustments |
|
|
| ROC GAAP |
|
Differences in
Recognitions and
Measurements |
|
Differences in
Presentations |
|
IFRSs |
|
|
| Items |
|
Amount |
|
|
|
Amount |
|
|
Items |
|
Notes |
|
|
|
|
|
|
|
|
|
|
|
|
|
|
|
$ |
(21,253 |
) |
|
Exchange differences arising from the translation of the foreign operations |
|
|
|
|
|
|
|
|
|
|
|
(306,033 |
) |
|
Unrealized gain on available-for-sale financial assets |
|
|
|
|
|
|
|
|
|
|
|
(1,886 |
) |
|
Share of other comprehensive income of associates and jointly controlled entities accounted for using equity method |
|
|
|
|
|
|
|
|
|
|
|
|
|
|
|
|
|
|
|
|
|
|
|
|
|
|
(329,172 |
) |
|
Total other comprehensive income |
|
|
|
|
|
|
|
|
|
|
|
|
|
|
|
|
|
|
|
|
|
|
|
|
|
|
|
|
|
|
|
|
$ |
10,643,033 |
|
|
Total comprehensive income |
|
|
|
|
|
|
|
|
|
|
|
|
|
|
|
|
|
(Concluded)
| |
d. |
Explanation for the adjustments of Taiwan-IFRSs transition: |
| |
1) |
Classification of investment properties |
Under ROC GAAP, properties for lease were classified
as property, plant and equipment and other assets; after transitions to Taiwan-IFRSs, owned-property for either rental revenue or capital appreciation should be classified as investment properties.
On September 30, 2012, the assets that met definitions of investment properties under IAS 40 “Investment Property” were
reclassified from property, plant and equipment of $7,353,602 thousand, and other assets - idle assets of $459,102 thousand, to investment properties. The total amount of reclassification was $7,812,704 thousand.
| |
2) |
Classification of leased assets and idle assets |
Under ROC GAAP, leased and idle assets were
classified as other assets; after the transition to Taiwan-IFRSs, leased and idle assets were reclassified to property, plant and equipment or investment properties based on the nature of these assets.
The Company reclassified leased assets to property, plant and equipment and the amounts were $392,253 thousand as of September 30, 2012.
Except for the abovementioned Item 1) which discussed the reclassification from idle assets to investment properties, the Company reclassified the remaining idle assets to property, plant and equipment amounting to $422,168 thousand as of
September 30, 2012.
| |
3) |
Deemed costs of property, plant and equipment |
The Company elected to apply the optional
exemption in IFRS 1. The management measured land (classified as property, plant and equipment and investment properties under Taiwan-IFRSs) at its revalued amount, which was the carrying value under ROC GAAP, as deemed costs. As such, on
January 1, 2012, the Company reclassified the unrealized revaluation increment (classified as stockholders’ equity) to retained earnings at the amount of $5,762,753 thousand. This reclassification did not affect total equity amount. The
unrealized revaluation increment costs reclassified to retained earnings decreased by nil and $117 thousand, due to the partial disposal on revalued land; and decreased by nil and $2,054 thousand due to impairment loss, for the three months and nine
months ended September 30, 2012, respectively. As a result, the carrying value of property, plant and equipment was $5,760,582 thousand as of September 30, 2012. Gain on disposal decreased by nil and $117 thousand, and impairment loss
increased by nil and $2,054 thousand, for the three months and nine months ended September 30, 2012, respectively.
82
| |
4) |
Classification of deferred income tax asset and liability, and valuation allowance |
Under ROC
GAAP, a deferred income tax asset and liability should be classified as current and noncurrent in accordance with the classification of its related asset or liability. When a deferred income tax asset and liability does not relate to an asset or
liability, then it is classified as either current or noncurrent based on the expected length of time before it is realized or settled. However, under Taiwan-IFRSs, a deferred income tax asset and liability should be classified as noncurrent, and
could not be offset. Deferred income tax assets and liabilities are offset on the balance sheet when the entity has the legally enforceable right to offset current tax assets against current tax liabilities and they are levied by the same taxation
authority on the same entity.
Under ROC GAAP, if it is more likely than not that deferred income tax assets will not be realized, the
valuation allowances are provided to the extent. However, under Taiwan-IFRSs, deferred income tax assets are only recognized when it is more likely than not to be realized, and the valuation allowance is not used under Taiwan-IFRSs.
Based on the Guidelines Governing the Preparation of Financial Reports by Securities Issuers, the reserve for land value incremental tax
caused by revaluation of land is classified as long-term liabilities. Under Taiwan-IFRSs, if the Company elects to apply the IFRS 1 exemption and measure the revalued land using the carrying amount determined under ROC GAAP as its deemed cost, the
related reserve for land value incremental tax should be classified as deferred income tax liabilities.
The Company reclassified its
deferred income tax assets - current to noncurrent assets and the amounts was $106,808 thousand as of September 30, 2012. Further, deferred income tax liabilities, which were netted with deferred income tax assets under ROC GAAP, were reversed.
As a result of such reversal, deferred income tax liabilities - noncurrent and deferred income tax assets - noncurrent increased by $39,461 thousand and reserve for land value incremental tax of $94,986 thousand was also reclassified as deferred
income tax liabilities - noncurrent under Taiwan-IFRSs.
Based on IAS 12 “Income Taxes”, the income tax adjustments as a result
of the transition to Taiwan-IFRSs are as follows: Deferred income tax assets increased by $498,266 thousand as of September 30, 2012; retained earnings increased by $489,685 thousand as of September 30, 2012; noncontrolling interests
increased by $8,615 thousand as of September 30, 2012. Deferred income tax liabilities decreased by $34 thousand as of September 30, 2012. For the three months ended September 30, 2012, due to the adjustment of deferred income tax
assets and deferred income tax liabilities (decreased by $34,523 thousand in deferred tax assets and decreased by $205 thousand in deferred income tax liabilities), income tax expense increased by $34,318 thousand. For the nine months ended
September 30, 2012, due to the adjustment of deferred income tax assets and deferred income tax liabilities (decreased by $98,005 thousand in deferred tax assets and decreased by $34 thousand in deferred income tax liabilities), income tax
expense increased by $97,971 thousand.
Under ROC GAAP, net transaction obligation that was resulted from the first
time adoption of SFAS No. 18, “Pension” should be amortized on a straight-line basis over the average remaining service life of active plan participants and recognized as net periodic pension cost. After the transition to
Taiwan-IFRSs, transitional rules in IAS 19, “Employee Benefits” was not applicable, thus the related amounts of net transaction obligation should be recognized at once and adjusted in retain earnings.
83
Under ROC GAAP, actuarial gains (losses) are recognized based on the corridor approach and the
amounts are amortized over the average remaining service life of active plan participants. However, under Taiwan-IFRSs, the Company elected to recognize pension gains arising from defined benefit plans as other comprehensive income immediately and
subsequent reclassification to earnings is not permitted.
As a result of the aforementioned adjustments, other liabilities increased by
$1,545,852 thousand as of September 30, 2012; other noncurrent assets decreased by $15,874 thousand as of September 30, 2012; retained earnings decreased by $1,511,436 thousand as of September 30, 2012; unrecognized net losses of
pension decreased by $215 thousand as of September 30, 2012; noncontrolling interests decreased by $50,505 thousand as of September 30, 2012. For the three months ended September 30, 2012, pension cost was decreased by $668 thousand
which increased $42 thousand in operating costs and decreased $710 thousand in operating expenses. For the nine months ended September 30, 2012, pension cost was decreased by $2,003 thousand which increased $127 thousand in operating costs and
decreased $2,130 thousand in operating expenses.
In addition, prior to Chunghwa’s privatization in 2005, the pension contributions
were made according to the relevant regulations. After privatization, the pension obligations of retained employees that were civil employees and retired employees entitled to receive future monthly pension payments prior to privatization based on
the “Labor Pension Act”, “Act of Privatization of Government-Owned Enterprises”, and “Enforcement Rules of Statute of Privatization of Government-Owned Enterprises” were borne by the government. The settlement impact
upon privatization of $20,648,078 thousand derived according to the actuarial report under IAS 19 shall be retroactively adjusted from retained earnings to additional paid-in capital - privatization at the date of transition to Taiwan-IFRSs.
| |
7) |
Award credits (often known as “points”) |
Under ROC GAAP, there’s no relevant
guidance regarding award credits. After the transition to Taiwan-IFRSs, Chunghwa applied IFRIC 13, “Customer Royalty Program” retroactively. The award credit should be measured at its fair value and defer the recognition of revenue. When
the customers redeem the points, the related revenues and costs shall be recognized. Such guidance replaced Chunghwa’s accounting policy that Chunghwa used to accrue expenses when the award credits were granted.
Accrued award credits liabilities (classified as other current liabilities) decreased by $130,340 thousand as of September 30, 2012;
deferred award credits revenue (classified as noncurrent liabilities - deferred revenue) increased by $67,471 thousand as of September 30, 2012; retained earnings increased by $62,869 thousand as of September 30, 2012. The revenue
decreased by $14,514 thousand, the marketing expenses decreased by $27,647 thousand and the operating cost increased by $7,372 thousand for the three months ended September 30, 2012. The revenue decreased by $43,229 thousand, the marketing
expenses decreased by $81,415 thousand and the operating cost increased by $21,111 thousand for the nine months ended September 30, 2012.
| |
8) |
Recognition of revenue from providing fixed line connection service |
Prior to privatization,
the Company was subject to the laws and regulations applicable to state-owned enterprises in Taiwan which differed from ROC GAAP as applicable to commercial companies. As such, the Company recorded revenue from providing fixed line connection
service upon the receipt of connection fees. Under Taiwan-IFRSs, following the revenue recognition guidance, the above service revenue should be treated as deferred income and recognized over the time when the service is continuously provided.
84
Chunghwa retrospectively adjusted the deferred income of $1,419,419 thousand as of September 30,
2012, by decreasing retained earnings and increasing the deferred revenue from providing fixed line connection service ($533,244 thousand was classified as other current liabilities; $886,175 thousand was classified as noncurrent liabilities -
deferred revenue as of September 30, 2012). For the three months ended September 30, 2012, revenue from providing fixed line connection service increased by $133,311 thousand. For the nine months ended September 30, 2012, revenue from providing
fixed line connection service increased by $506,397 thousand.
| |
9) |
Recognition of construction contract revenue |
The construction contracts did not meet the
criteria in IFRIC 15 “Agreements for the construction of Real Estate”; therefore IAS 11 “Construction Contracts” does not apply. The Company could only recognize the revenues when the projects are completed and sold out based on
IAS 18, “Revenue”. Due to the reasons mentioned above, the Company reversed the revenue that was recognized based on percentage completion method, and recognize the related revenue, cost and expense when the project is completed in 2012.
The construction revenue increased by $762,921 thousand, the construction cost increased by $319,475 thousand and the marketing expenses
increased by $48,153 thousand for the three months ended September 30, 2012. The construction revenue increased by $697,050 thousand, the construction cost increased by $305,009 thousand and the marketing expenses increased by $44,516 thousand
for the nine months ended September 30, 2012.
| |
10) |
Equity method investments |
Associates and jointly controlled entities are accounted for using
equity method upon the Company’s transition to Taiwan-IFRSs, the main adjustment includes employee benefit and share-based payments, etc. As a result, long-term investments decreased by $9,330 thousand as of September 30, 2012; retained
earnings decreased by $39,858 thousand as of September 30, 2012; unrecognized net loss of pension decreased by $35,571 thousand as of September 30, 2012; noncontrolling interests decreased by $5,043 thousand as of September 30, 2012.
Investment income from associates and jointly controlled entities that accounted for using equity method increased by $1,232 thousand for the three months ended September 30, 2012 and increased by $609 thousand for the nine months ended
September 30, 2012, respectively.
| |
11) |
Share-based payment transactions |
Part of the employee stock options granted by a subsidiary
was not vested on the transition date. Therefore, the subsidiary should apply IFRS 2, “Share-based Payment” retroactively. Under Taiwan-IFRSs, paid-in capital - employee stock option recognized by subsidiary does not belong to the equity
attributable to parent company, instead it should be accounted as noncontrolling interests. As of September 30, 2012, retained earnings decreased by $426 thousand, additional paid-in capital reported by equity-method investees decreased by
$1,231 thousand and noncontrolling interests increased by $1,657 thousand. For the three months and nine months ended September 30, 2012, the compensation cost under general and administrative expense both decreased by $1,543 thousand and
$2,601 thousand.
| |
12) |
Subscription of associates/subsidiaries new shares and adjustments of paid-in capital reported related to equity-method investees |
When an investee issues new shares and existing shareholders do not subscribe to the new shares at their respective proportion in share
holdings, this would result in changes in the investor’s shareholdings of the equity method investee. According to SFAS No. 5 “Long-term Investments under Equity Method” under ROC GAAP, as there are changes in the net assets
value of the equity method investee attributable to the investor, the investor shall reflect such changes by adjusting additional paid-in capital and long-term investments. However, under Taiwan-IFRSs, if the changes do not cause the investor to
lose significant influence over associates, the change shall be treated as a deemed disposal with the related gain or loss recognized in earnings. If the changes do not cause the investor to lose control over subsidiaries, the change shall be
treated as equity transactions. In addition, the Company complied with the Taiwan-IFRSs FAQs published by the Taiwan Stock Exchange, and reclassified the paid-in capital which did not meet the definitions under Taiwan-IFRSs or the Company Act and
Regulations of Ministry of Economic Affairs to retained earnings. The Company reclassified such paid-in capital of $28,211 thousand to retained earnings, retained earnings increased by $27,942 thousand and long-term investment decreased by $269
thousand as of September 30, 2012. Gain on disposal of financial instruments increased by nil and $1,112 thousand for the three months and nine months ended September 30, 2012.
85
| |
13) |
Presentation of consolidated balance sheets |
As part of the government’s effort to upgrade the existing
telecommunications infrastructure project, Chunghwa and other public utility companies were required by the ROC government to contribute a total of $1,000,000 thousand to a Piping Fund administered by the Taipei City Government. Based on the terms
of Construction Funding Agreement, if the Piping Fund project is considered to be no longer necessary by the ROC government, Chunghwa will receive back its proportionate share of the net equity of the Piping Fund upon its dissolution. In order to
conform to the presentation of the financial statements under Taiwan-IFRSs, the fund was reclassified as other noncurrent assets.
| |
b) |
Time deposits with maturities of more than three months |
Under ROC GAAP, cash and cash
equivalents includes time deposits that are cancellable but without any loss of principal. Under Taiwan-IFRSs, cash equivalents are short-term, highly liquid investments that are readily convertible to known amounts of cash and which are subject to
an insignificant risk of changes in value. Therefore, an investment normally qualifies as a cash equivalent only when it has a short maturity of three months or less from the date of acquisition.
Time deposits and negotiable certificate of deposits with maturities of more than three months held by the Company were $7,314,945 thousand as
of September 30, 2012. In order to conform to the presentation of the financial statements under Taiwan-IFRSs, such amounts were reclassified from cash to other monetary assets - current.
The deferred expense, which was classified as other assets under ROC GAAP,
was reclassified based on its nature under Taiwan-IFRSs. Deferred expenses relating to decoration construction projects and advertisement signboard, etc. were reclassified as property, plant and equipment of $185,340 thousand as of
September 30, 2012. Deferred expenses relating to computer software were reclassified as intangible assets of $36,465 thousand as of September 30, 2012.
| |
d) |
Assets held of disposal |
The property, plant and equipment classified as assets expected for
disposal (included in other assets - others) under ROC GAAP, was reclassified based on its nature under Taiwan-IFRSs. Assets held for disposal were reclassified as property, plant and equipment of $27,580 thousand as of September 30, 2012.
86
| |
e) |
Reclassification of financial assets carried at cost |
Based on the Guidelines Governing the
Preparation of Financial Reports by Securities Issuers, stocks held by the Company which were not listed in Taiwan Stock Exchange or were not trading in the GreTai Securities Market and the Company did not have significant influence over these
investees were classified as financial assets carried at cost. After transition to Taiwan-IFRSs, part of financial assets carried at cost were designated as available-for-sale financial assets. Financial assets carried at cost were reclassified as
available-for-sale financial assets of $90,469 thousand as of September 30, 2012.
| |
14) |
Presentation of consolidated statements of comprehensive income |
After the transition to
Taiwan-IFRSs, the consolidated statement of comprehensive income includes net income and other comprehensive income. Further, certain accounts were reclassified to conform to the presentation of the financial statements under Taiwan-IFRSs.
| |
15) |
Summary of material adjustments of cash flow statements |
Under ROC GAAP, collection and
payment of interest and collection of dividends were classified as operating activity; payment of dividends was classified as financing activity. Further, for cash flow statement prepared using the indirect method, cash payment of interest
expense is required for supplemental disclosure. Based on IAS 7 “Cash Flow Statement”, collection and payment of interest and dividends were disclosed separately with consistency for each period and classified as operating activity,
investing activity or financing activity.
| 44. |
SIGNIFICANT SUBSEQUENT EVENTS |
Chunghwa participated in 4G license bidding process in
accordance with “Regulations for Administration of Mobile Broadband Business” announced by NCC. The bidding was completed on October 30, 2013. Chunghwa obtained certain spectrums and the total bid prices were amounting to $39,075,000
thousand.
87
TABLE 1
CHUNGHWA TELECOM CO., LTD. AND SUBSIDIARIES
ENDORSEMENTS/GUARANTEES PROVIDED
NINE MONTHS ENDED
SEPTEMBER 30, 2013
(In Thousands of New Taiwan Dollars, Unless Specified Otherwise)
|
|
|
|
|
|
|
|
|
|
|
|
|
|
|
|
|
|
|
|
|
|
|
|
|
|
|
|
|
|
|
| No. |
|
Endorsement/
Guarantee
Provider |
|
Guaranteed Party |
|
Limits on
Endorsement/
Guarantee Amount
Provided to Each
Guaranteed Party |
|
|
Maximum Balance
for the Period |
|
|
Ending Balance |
|
|
Amount of
Endorsement/
Guarantee
Collateralized by
Properties |
|
|
Ratio of Accumulated
Endorsement/
Guarantee to Net
Equity Per Latest
Financial Statements |
|
Maximum
Endorsement/
Guarantee Amount
Allowable |
|
|
Notes |
| |
|
Name |
|
Nature of
Relationship
(Note 2) |
|
|
|
|
|
|
|
|
|
|
|
|
|
|
|
|
|
|
| 0 |
|
Chunghwa Telecom Co., Ltd. |
|
Donghwa Telecom Co., Ltd. |
|
b |
|
$ |
3,514,295 |
|
|
$ |
324,214 |
|
|
$ |
42,250 |
|
|
$ |
42,250 |
|
|
0.01 |
|
$ |
14,057,182 |
|
|
Notes 3
and 4 |
|
|
|
|
|
|
|
|
|
|
|
| 25 |
|
Yao Yong Real Property Co., Ltd. |
|
Light Era Development Co., Ltd. |
|
d |
|
|
3,665,887 |
|
|
|
1,650,000 |
|
|
|
1,650,000 |
|
|
|
1,650,000 |
|
|
0.48 |
|
|
3,665,887 |
|
|
Note 5 |
| Note 1: |
Significant transactions between the Company and its subsidiaries or among subsidiaries are numbered as follows: |
| |
b. |
Subsidiaries are numbered from “1”. |
| Note 2: |
Relationships between the endorsement/guarantee provider and the guaranteed party: |
| |
b. |
Majority owned subsidiary. |
| |
c. |
The Company and subsidiary owns over 50% ownership of the investee company. |
| |
d. |
A subsidiary jointly owned by the Company and the Company’s directly-owned subsidiary. |
| |
e. |
Guaranteed by the Company according to the construction contract. |
| |
f. |
An investee company. The guarantees were provided based on the Company’s proportionate share in the investee company. |
| Note 3: |
The maximum amount of endorsement or guarantee is up to 1% of the total stockholders’ equity of the latest financial statements of the Company. |
| Note 4: |
The maximum amount of endorsement or guarantee is up to 4% of the total stockholders’ equity of the latest financial statements of the Company. |
| Note 5: |
The maximum amount of endorsement or guarantee is up to 200% of the asset value of the latest financial statements of Yao Yong Real Property Co., Ltd. |
88
TABLE 2
CHUNGHWA TELECOM CO., LTD. AND SUBSIDIARIES
MARKETABLE SECURITIES HELD
SEPTEMBER 30, 2013
(Amounts in Thousands of New Taiwan Dollars, Unless Otherwise Specified)
|
|
|
|
|
|
|
|
|
|
|
|
|
|
|
|
|
|
|
|
|
|
|
|
|
|
|
| No. |
|
Held Company Name |
|
Marketable Securities Type and
Name |
|
Relationship
with the
Company |
|
Financial Statement Account |
|
September 30, 2013 |
|
|
Note |
| |
|
|
|
|
Shares
(Thousands/
Thousand
Units) |
|
|
Carrying
Value
(Note 5) |
|
|
Percentage
of
Ownership |
|
|
Market
Value or
Net Asset
Value |
|
|
|
|
|
|
|
|
|
|
|
|
| 0 |
|
Chunghwa Telecom Co., Ltd. |
|
Stocks |
|
|
|
|
|
|
|
|
|
|
|
|
|
|
|
|
|
|
|
|
|
|
|
|
|
|
Senao International Co., Ltd. |
|
Subsidiary |
|
Investments accounted for using equity method |
|
|
71,773 |
|
|
$
|
1,653,149
(Note 9 |
) |
|
|
28 |
|
|
$ |
6,746,677 |
|
|
Note 4 |
|
|
|
|
Light Era Development Co., Ltd. |
|
Subsidiary |
|
Investments accounted for using equity method |
|
|
300,000 |
|
|
|
3,797,339
(Note 9 |
) |
|
|
100 |
|
|
|
3,802,912 |
|
|
Note 1 |
|
|
|
|
Donghwa Telecom Co., Ltd. |
|
Subsidiary |
|
Investments accounted for using equity method |
|
|
374,510 |
|
|
|
1,441,438
(Note 9 |
) |
|
|
100 |
|
|
|
1,441,438 |
|
|
Note 1 |
|
|
|
|
Chunghwa Telecom Singapore Pte., Ltd. |
|
Subsidiary |
|
Investments accounted for using equity method |
|
|
26,383 |
|
|
|
856,109
(Note 9 |
) |
|
|
100 |
|
|
|
856,109 |
|
|
Note 1 |
|
|
|
|
Chunghwa System Integration Co., Ltd. |
|
Subsidiary |
|
Investments accounted for using equity method |
|
|
60,000 |
|
|
|
702,189
(Note 9 |
) |
|
|
100 |
|
|
|
676,464 |
|
|
Note 1 |
|
|
|
|
Chunghwa Investment Co., Ltd. |
|
Subsidiary |
|
Investments accounted for using equity method |
|
|
68,085 |
|
|
|
475,238
(Note 9 |
) |
|
|
89 |
|
|
|
551,700 |
|
|
Note 1 |
|
|
|
|
CHIEF Telecom Inc. |
|
Subsidiary |
|
Investments accounted for using equity method |
|
|
37,942 |
|
|
|
579,203
(Note 9 |
) |
|
|
69 |
|
|
|
519,630 |
|
|
Note 1 |
|
|
|
|
International Integrated System, Inc. |
|
Associate |
|
Investments accounted for using equity method |
|
|
22,498 |
|
|
|
273,914 |
|
|
|
33 |
|
|
|
248,311 |
|
|
Note 1 |
|
|
|
|
Viettel-CHT Co., Ltd. |
|
Associate |
|
Investments accounted for using equity method |
|
|
— |
|
|
|
271,259 |
|
|
|
30 |
|
|
|
271,259 |
|
|
Note 1 |
|
|
|
|
Huada Digital Corporation |
|
Jointly controlled entity |
|
Investments accounted for using equity method |
|
|
25,000 |
|
|
|
232,343 |
|
|
|
50 |
|
|
|
232,343 |
|
|
Note 1 |
|
|
|
|
Taiwan International Standard Electronics Co., Ltd. |
|
Associate |
|
Investments accounted for using equity method |
|
|
1,760 |
|
|
|
122,482 |
|
|
|
40 |
|
|
|
473,909 |
|
|
Note 1 |
|
|
|
|
Chunghwa International Yellow Pages Co., Ltd. |
|
Subsidiary |
|
Investments accounted for using equity method |
|
|
15,000 |
|
|
|
174,706
(Note 9 |
) |
|
|
100 |
|
|
|
174,406 |
|
|
Note 1 |
|
|
|
|
Honghwa Human Resources Co., Ltd. |
|
Subsidiary |
|
Investments accounted for using equity method |
|
|
18,000 |
|
|
|
193,085
(Note 9 |
) |
|
|
100 |
|
|
|
193,085 |
|
|
Note 1 |
|
|
|
|
Prime Asia Investments Group Ltd. (B.V.I.) |
|
Subsidiary |
|
Investments accounted for using equity method |
|
|
1 |
|
|
|
128,729
(Note 9 |
) |
|
|
100 |
|
|
|
128,802 |
|
|
Note 1 |
|
|
|
|
Skysoft Co., Ltd. |
|
Associate |
|
Investments accounted for using equity method |
|
|
4,438 |
|
|
|
143,383 |
|
|
|
30 |
|
|
|
105,794 |
|
|
Note 1 |
|
|
|
|
Spring House Entertainment Tech. Inc. |
|
Subsidiary |
|
Investments accounted for using equity method |
|
|
7,015 |
|
|
|
132,062
(Note 9 |
) |
|
|
56 |
|
|
|
117,726 |
|
|
Note 1 |
|
|
|
|
Chunghwa Telecom Global, Inc. |
|
Subsidiary |
|
Investments accounted for using equity method |
|
|
6,000 |
|
|
|
115,421
(Note 9 |
) |
|
|
100 |
|
|
|
126,758 |
|
|
Note 1 |
|
|
|
|
Kingwaytek Technology Co., Ltd. |
|
Associate |
|
Investments accounted for using equity method |
|
|
2,879 |
|
|
|
68,201 |
|
|
|
33 |
|
|
|
34,483 |
|
|
Note 1 |
|
|
|
|
Chunghwa Telecom Vietnam Co., Ltd. |
|
Subsidiary |
|
Investments accounted for using equity method |
|
|
— |
|
|
|
78,701
(Note 9 |
) |
|
|
100 |
|
|
|
78,701 |
|
|
Note 1 |
|
|
|
|
Smartfun Digital Co., Ltd. |
|
Subsidiary |
|
Investments accounted for using equity method |
|
|
6,500 |
|
|
|
44,079
(Note 9 |
) |
|
|
65 |
|
|
|
44,137 |
|
|
Note 1 |
|
|
|
|
So-net Entertainment Taiwan Co., Ltd. |
|
Associate |
|
Investments accounted for using equity method |
|
|
9,429 |
|
|
|
89,318 |
|
|
|
30 |
|
|
|
71,811 |
|
|
Note 1 |
(Continued)
89
|
|
|
|
|
|
|
|
|
|
|
|
|
|
|
|
|
|
|
|
|
|
|
|
|
|
|
| No. |
|
Held Company Name |
|
Marketable Securities Type
and Name |
|
Relationship
with the
Company |
|
Financial Statement Account |
|
September 30, 2013 |
|
|
Note |
| |
|
|
|
|
Shares
(Thousands/
Thousand
Units) |
|
|
Carrying
Value
(Note 5) |
|
|
Percentage
of
Ownership |
|
|
Market Value
or Net Asset
Value |
|
|
|
|
|
|
|
|
|
|
|
|
|
|
|
|
Chunghwa Telecom Japan Co., Ltd. |
|
Subsidiary |
|
Investments accounted for using equity method |
|
|
1 |
|
|
$
|
26,111
(Note 9 |
) |
|
|
100 |
|
|
$ |
26,111 |
|
|
Note 1 |
|
|
|
|
Dian Zuan Integrating Marketing Co., Ltd. |
|
Associate |
|
Investments accounted for using equity method |
|
|
452 |
|
|
|
2,874 |
|
|
|
13 |
|
|
|
2,874 |
|
|
Note 1 |
|
|
|
|
Chunghwa Sochamp Technology Inc. |
|
Subsidiary |
|
Investments accounted for using equity method |
|
|
2,040 |
|
|
|
13,497
(Note 9 |
) |
|
|
51 |
|
|
|
15,310 |
|
|
Note 1 |
|
|
|
|
New Prospect Investments Holdings Ltd. (B.V.I.) |
|
Subsidiary |
|
Investments accounted for using equity method |
|
|
— |
|
|
(US$ |
—
1 dollar
(Note 9 |
) ) |
|
|
100 |
|
|
(US$ |
—
1 dollar |
) |
|
Note 8 |
|
|
|
|
Taipei Financial Center Corp. |
|
— |
|
Financial assets carried at cost - noncurrent |
|
|
172,927 |
|
|
|
1,789,530 |
|
|
|
12 |
|
|
|
1,763,871 |
|
|
Note 2 |
|
|
|
|
Industrial Bank of Taiwan II Venture Capital Co., Ltd. (IBT II) |
|
— |
|
Financial assets carried at cost - noncurrent |
|
|
18,000 |
|
|
|
162,000 |
|
|
|
17 |
|
|
|
146,094 |
|
|
Note 2 |
|
|
|
|
Innovation Works Development Fund, L.P. |
|
— |
|
Financial assets carried at cost - noncurrent |
|
|
— |
|
|
|
144,262 |
|
|
|
4 |
|
|
|
139,723 |
|
|
Note 2 |
|
|
|
|
Global Mobile Corp. |
|
— |
|
Financial assets carried at cost - noncurrent |
|
|
7,617 |
|
|
|
77,018 |
|
|
|
3 |
|
|
|
29,901 |
|
|
Note 2 |
|
|
|
|
iD Branding Ventures |
|
— |
|
Financial assets carried at cost - noncurrent |
|
|
5,625 |
|
|
|
56,250 |
|
|
|
8 |
|
|
|
50,496 |
|
|
Note 2 |
|
|
|
|
Innovation Works Limited |
|
— |
|
Financial assets carried at cost - noncurrent |
|
|
1,000 |
|
|
|
31,390 |
|
|
|
2 |
|
|
|
16,242 |
|
|
Note 2 |
|
|
|
|
CQi Energy Infocom Inc. |
|
— |
|
Financial assets carried at cost - noncurrent |
|
|
2,000 |
|
|
|
— |
|
|
|
18 |
|
|
|
— |
|
|
Note 2 |
|
|
|
|
RPTI Intergroup International Ltd. |
|
— |
|
Financial assets carried at cost - noncurrent |
|
|
4,765 |
|
|
|
— |
|
|
|
10 |
|
|
|
— |
|
|
Note 2 |
|
|
|
|
Essence Technology Solution, Inc. |
|
— |
|
Financial assets carried at cost - noncurrent |
|
|
200 |
|
|
|
— |
|
|
|
7 |
|
|
|
— |
|
|
Note 2 |
|
|
|
|
Stocks |
|
|
|
|
|
|
|
|
|
|
|
|
|
|
|
|
|
|
|
|
|
|
|
|
|
|
China Airlines Ltd. |
|
— |
|
Available-for-sale financial assets - noncurrent |
|
|
263,622 |
|
|
|
3,092,287 |
|
|
|
5 |
|
|
|
2,926,205 |
|
|
Note 4 |
|
|
|
|
Bond |
|
|
|
|
|
|
|
|
|
|
|
|
|
|
|
|
|
|
|
|
|
|
|
|
|
|
NAN YA Company 2nd Unsecured Corporate Bonds Issue in 2008 |
|
— |
|
Held-to-maturity financial assets |
|
|
— |
|
|
|
200,126 |
|
|
|
— |
|
|
|
200,126 |
|
|
Note 6 |
|
|
|
|
NAN YA Company 3rd Unsecured Corporate Bonds Issue in 2008 |
|
— |
|
Held-to-maturity financial assets |
|
|
— |
|
|
|
100,145 |
|
|
|
— |
|
|
|
100,145 |
|
|
Note 6 |
|
|
|
|
NAN YA Company 1st Unsecured Corporate Bonds Issue in 2009 |
|
— |
|
Held-to-maturity financial assets |
|
|
— |
|
|
|
49,992 |
|
|
|
— |
|
|
|
49,992 |
|
|
Note 6 |
|
|
|
|
NAN YA Company 1st Unsecured Corporate Bonds Issue in 2009 |
|
— |
|
Held-to-maturity financial assets |
|
|
— |
|
|
|
150,440 |
|
|
|
— |
|
|
|
150,440 |
|
|
Note 6 |
|
|
|
|
NAN YA Company 1st Unsecured Corporate Bond-s Issue in 2009 |
|
— |
|
Held-to-maturity financial assets |
|
|
— |
|
|
|
100,313 |
|
|
|
— |
|
|
|
100,313 |
|
|
Note 6 |
|
|
|
|
NAN YA Company 3rd Unsecured Corporate Bond-A Issue in 2009 |
|
— |
|
Held-to-maturity financial assets |
|
|
— |
|
|
|
100,111 |
|
|
|
— |
|
|
|
100,111 |
|
|
Note 6 |
|
|
|
|
NAN YA Company 3rd Unsecured Corporate Bond-A Issue in 2009 |
|
— |
|
Held-to-maturity financial assets |
|
|
— |
|
|
|
25,063 |
|
|
|
— |
|
|
|
25,063 |
|
|
Note 6 |
|
|
|
|
NAN YA Company 4th Unsecured Corporate Bond-A Issue in 2009 |
|
— |
|
Held-to-maturity financial assets |
|
|
— |
|
|
|
199,925 |
|
|
|
— |
|
|
|
199,925 |
|
|
Note 6 |
|
|
|
|
NAN YA Company 4th Unsecured Corporate Bond-A Issue in 2009 |
|
— |
|
Held-to-maturity financial assets |
|
|
— |
|
|
|
300,689 |
|
|
|
— |
|
|
|
300,689 |
|
|
Note 6 |
|
|
|
|
NAN YA Company 2nd Unsecured Corporate Bonds Issue in 2010 |
|
— |
|
Held-to-maturity financial assets |
|
|
— |
|
|
|
50,215 |
|
|
|
— |
|
|
|
50,215 |
|
|
Note 6 |
|
|
|
|
Formosa Petrochemical Corporation 1st Unsecured Corporate Bonds Issue in 2010 |
|
— |
|
Held-to-maturity financial assets |
|
|
— |
|
|
|
100,178 |
|
|
|
— |
|
|
|
100,178 |
|
|
Note 6 |
|
|
|
|
Formosa Petrochemical Corporation 1st Unsecured Corporate Bonds Issue in 2010 |
|
— |
|
Held-to-maturity financial assets |
|
|
— |
|
|
|
301,061 |
|
|
|
— |
|
|
|
301,061 |
|
|
Note 6 |
(Continued)
90
|
|
|
|
|
|
|
|
|
|
|
|
|
|
|
|
|
|
|
|
|
|
|
|
|
|
|
| No. |
|
Held Company Name |
|
Marketable Securities Type and
Name |
|
Relationship
with the
Company |
|
Financial Statement Account |
|
September 30, 2013 |
|
|
Note |
| |
|
|
|
|
Shares
(Thousands/
Thousand
Units) |
|
|
Carrying
Value
(Note 5) |
|
|
Percentage
of
Ownership |
|
|
Market
Value or
Net
Asset
Value |
|
|
|
|
|
|
|
|
|
|
|
|
|
|
|
|
TSMC 1st Unsecured Corporate Bond-A Issue in 2011 |
|
— |
|
Held-to-maturity financial assets |
|
|
— |
|
|
$ |
299,825 |
|
|
|
— |
|
|
$ |
299,825 |
|
|
Note 6 |
|
|
|
|
TSMC 1st Unsecured Corporate Bond-A Issue in 2011 |
|
— |
|
Held-to-maturity financial assets |
|
|
— |
|
|
|
100,585 |
|
|
|
— |
|
|
|
100,585 |
|
|
Note 6 |
|
|
|
|
TSMC 1st Unsecured Corporate Bond-A Issue in 2012 |
|
— |
|
Held-to-maturity financial assets |
|
|
— |
|
|
|
99,934 |
|
|
|
— |
|
|
|
99,934 |
|
|
Note 6 |
|
|
|
|
TSMC 1st Unsecured Corporate Bond-A Issue in 2012 |
|
— |
|
Held-to-maturity financial assets |
|
|
— |
|
|
|
200,252 |
|
|
|
— |
|
|
|
200,252 |
|
|
Note 6 |
|
|
|
|
TSMC 1st Unsecured Corporate Bond-A Issue in 2012 |
|
— |
|
Held-to-maturity financial assets |
|
|
— |
|
|
|
199,869 |
|
|
|
— |
|
|
|
199,869 |
|
|
Note 6 |
|
|
|
|
TSMC 2nd Unsecured Corporate Bond-A Issue in 2012 |
|
— |
|
Held-to-maturity financial assets |
|
|
— |
|
|
|
199,849 |
|
|
|
— |
|
|
|
199,849 |
|
|
Note 6 |
|
|
|
|
TSMC 3rd Unsecured Corporate Bond-A Issue in 2012 |
|
— |
|
Held-to-maturity financial assets |
|
|
— |
|
|
|
199,845 |
|
|
|
— |
|
|
|
199,845 |
|
|
Note 6 |
|
|
|
|
Hon Hai Precision Industry Co., Ltd. First Debenture Issuing of 2009 |
|
— |
|
Held-to-maturity financial assets |
|
|
— |
|
|
|
100,224 |
|
|
|
— |
|
|
|
100,224 |
|
|
Note 6 |
|
|
|
|
Hon Hai Precision Industry Co., Ltd. First Debenture Issuing of 2009 |
|
— |
|
Held-to-maturity financial assets |
|
|
— |
|
|
|
175,374 |
|
|
|
— |
|
|
|
175,374 |
|
|
Note 6 |
|
|
|
|
Hon Hai Precision Industry Co., Ltd. First Debenture Issuing of 2009 |
|
— |
|
Held-to-maturity financial assets |
|
|
— |
|
|
|
100,188 |
|
|
|
— |
|
|
|
100,188 |
|
|
Note 6 |
|
|
|
|
FCFC 1st Unsecured Corporate Bonds Issue in 2009 |
|
— |
|
Held-to-maturity financial assets |
|
|
— |
|
|
|
125,313 |
|
|
|
— |
|
|
|
125,313 |
|
|
Note 6 |
|
|
|
|
FCFC 2nd Unsecured Corporate Bonds Issue in 2010 |
|
— |
|
Held-to-maturity financial assets |
|
|
— |
|
|
|
200,441 |
|
|
|
— |
|
|
|
200,441 |
|
|
Note 6 |
|
|
|
|
FCFC 2nd Unsecured Corporate Bonds Issue in 2010 |
|
— |
|
Held-to-maturity financial assets |
|
|
— |
|
|
|
100,155 |
|
|
|
— |
|
|
|
100,155 |
|
|
Note 6 |
|
|
|
|
FCFC 1st Unsecured Corporate Bonds Issue in 2011 |
|
— |
|
Held-to-maturity financial assets |
|
|
— |
|
|
|
299,672 |
|
|
|
— |
|
|
|
299,672 |
|
|
Note 6 |
|
|
|
|
Formosa Petrochemical Corporation 3rd Unsecured Corporate Bonds Issue in 2008 |
|
— |
|
Held-to-maturity financial assets |
|
|
— |
|
|
|
25,000 |
|
|
|
— |
|
|
|
25,000 |
|
|
Note 6 |
|
|
|
|
Formosa Petrochemical Corporation 3rd Unsecured Corporate Bonds Issue in 2008 |
|
— |
|
Held-to-maturity financial assets |
|
|
— |
|
|
|
100,031 |
|
|
|
— |
|
|
|
100,031 |
|
|
Note 6 |
|
|
|
|
Formosa Petrochemical Corporation 1st Unsecured Corporate Bonds Issue in 2009 |
|
— |
|
Held-to-maturity financial assets |
|
|
— |
|
|
|
100,049 |
|
|
|
— |
|
|
|
100,049 |
|
|
Note 6 |
|
|
|
|
Formosa Petrochemical Corporation 1st Unsecured Corporate Bonds Issue in 2009 |
|
— |
|
Held-to-maturity financial assets |
|
|
— |
|
|
|
100,184 |
|
|
|
— |
|
|
|
100,184 |
|
|
Note 6 |
|
|
|
|
Formosa Petrochemical Corporation 1st Unsecured Corporate Bonds Issue in 2009 |
|
— |
|
Held-to-maturity financial assets |
|
|
— |
|
|
|
150,381 |
|
|
|
— |
|
|
|
150,381 |
|
|
Note 6 |
|
|
|
|
Formosa Petrochemical Corporation 3rd Unsecured Corporate Bonds Issue in 2010 |
|
— |
|
Held-to-maturity financial assets |
|
|
— |
|
|
|
299,842 |
|
|
|
— |
|
|
|
299,842 |
|
|
Note 6 |
|
|
|
|
Formosa Petrochemical Corporation 1st Unsecured Corporate Bonds Issue in 2011 |
|
— |
|
Held-to-maturity financial assets |
|
|
— |
|
|
|
149,846 |
|
|
|
— |
|
|
|
149,846 |
|
|
Note 6 |
|
|
|
|
Formosa Petrochemical Corporation 3rd Unsecured Corporate Bonds Issue in 2011 |
|
— |
|
Held-to-maturity financial assets |
|
|
— |
|
|
|
199,770 |
|
|
|
— |
|
|
|
199,770 |
|
|
Note 6 |
|
|
|
|
Chinese Petroleum Corporation 1st Unsecured Corporate Bonds-B Issue in 2006 |
|
— |
|
Held-to-maturity financial assets |
|
|
— |
|
|
|
200,344 |
|
|
|
— |
|
|
|
200,344 |
|
|
Note 6 |
(Continued)
91
|
|
|
|
|
|
|
|
|
|
|
|
|
|
|
|
|
|
|
|
|
|
|
|
|
|
|
| No. |
|
Held Company Name |
|
Marketable Securities Type and
Name |
|
Relationship
with the
Company |
|
Financial Statement Account |
|
September 30, 2013 |
|
|
Note |
| |
|
|
|
|
Shares
(Thousands/
Thousand
Units) |
|
|
Carrying
Value
(Note 5) |
|
|
Percentage
of
Ownership |
|
|
Market
Value or
Net
Asset
Value |
|
|
|
|
|
|
|
|
|
|
|
|
|
|
|
|
Chinese Petroleum Corporation 1st Unsecured Corporate Bonds-B Issue in 2006 |
|
— |
|
Held-to-maturity financial assets |
|
|
— |
|
|
$ |
150,258 |
|
|
|
— |
|
|
$ |
150,258 |
|
|
Note 6 |
|
|
|
|
Chinese Petroleum Corporation 1st Unsecured Corporate Bonds-C Issue in 2006 |
|
— |
|
Held-to-maturity financial assets |
|
|
— |
|
|
|
102,679 |
|
|
|
— |
|
|
|
102,679 |
|
|
Note 6 |
|
|
|
|
Chinese Petroleum Corporation 1st Unsecured Corporate Bonds-C Issue in 2006 |
|
— |
|
Held-to-maturity financial assets |
|
|
— |
|
|
|
205,465 |
|
|
|
— |
|
|
|
205,465 |
|
|
Note 6 |
|
|
|
|
Chinese Petroleum Corporation 1st Unsecured Corporate Bonds-A Issue in 2008 |
|
— |
|
Held-to-maturity financial assets |
|
|
— |
|
|
|
100,200 |
|
|
|
— |
|
|
|
100,200 |
|
|
Note 6 |
|
|
|
|
Chinese Petroleum Corporation 1st Unsecured Corporate Bonds-A Issue in 2009 |
|
— |
|
Held-to-maturity financial assets |
|
|
— |
|
|
|
200,253 |
|
|
|
— |
|
|
|
200,253 |
|
|
Note 6 |
|
|
|
|
Chinese Petroleum Corporation 2nd Unsecured Corporate Bonds-A Issue in 2012 |
|
— |
|
Held-to-maturity financial assets |
|
|
— |
|
|
|
199,845 |
|
|
|
— |
|
|
|
199,845 |
|
|
Note 6 |
|
|
|
|
China Steel Corporation 1st Unsecured Corporate Bonds Issue in 2008 |
|
— |
|
Held-to-maturity financial assets |
|
|
— |
|
|
|
50,098 |
|
|
|
— |
|
|
|
50,098 |
|
|
Note 6 |
|
|
|
|
China Steel Corporation 2nd Unsecured Corporate Bonds-A Issue in 2008 |
|
— |
|
Held-to-maturity financial assets |
|
|
— |
|
|
|
49,999 |
|
|
|
— |
|
|
|
49,999 |
|
|
Note 6 |
|
|
|
|
China Steel Corporation 2nd Unsecured Corporate Bonds-A Issue in 2008 |
|
— |
|
Held-to-maturity financial assets |
|
|
— |
|
|
|
50,124 |
|
|
|
— |
|
|
|
50,124 |
|
|
Note 6 |
|
|
|
|
China Steel Corporation 2nd Unsecured Corporate Bonds-B Issue in 2008 |
|
— |
|
Held-to-maturity financial assets |
|
|
— |
|
|
|
305,422 |
|
|
|
— |
|
|
|
305,422 |
|
|
Note 6 |
|
|
|
|
China Steel Corporation 2nd Unsecured Corporate Bonds-B Issue in 2008 |
|
— |
|
Held-to-maturity financial assets |
|
|
— |
|
|
|
203,075 |
|
|
|
— |
|
|
|
203,075 |
|
|
Note 6 |
|
|
|
|
China Steel Corporation 1st Unsecured Corporate Bonds-A Issue in 2011 |
|
— |
|
Held-to-maturity financial assets |
|
|
— |
|
|
|
100,274 |
|
|
|
— |
|
|
|
100,274 |
|
|
Note 6 |
|
|
|
|
China Steel Corporation 1st Unsecured Corporate Bonds-A Issue in 2011 |
|
— |
|
Held-to-maturity financial assets |
|
|
— |
|
|
|
301,573 |
|
|
|
— |
|
|
|
301,573 |
|
|
Note 6 |
|
|
|
|
Taiwan Power Co. 2nd Unsecured Bond-EB Issue in 2005 |
|
— |
|
Held-to-maturity financial assets |
|
|
— |
|
|
|
303,625 |
|
|
|
— |
|
|
|
303,625 |
|
|
Note 6 |
|
|
|
|
Taiwan Power Co. 2nd Unsecured Bond-EB Issue in 2005 |
|
— |
|
Held-to-maturity financial assets |
|
|
— |
|
|
|
202,208 |
|
|
|
— |
|
|
|
202,208 |
|
|
Note 6 |
|
|
|
|
Taiwan Power Co. 2nd Unsecured Corporate Bond-C Issue in 2006 |
|
— |
|
Held-to-maturity financial assets |
|
|
— |
|
|
|
206,496 |
|
|
|
— |
|
|
|
206,496 |
|
|
Note 6 |
|
|
|
|
Taiwan Power Co. 3rd Unsecured Corporate Bond-C Issue in 2006 |
|
— |
|
Held-to-maturity financial assets |
|
|
— |
|
|
|
207,369 |
|
|
|
— |
|
|
|
207,369 |
|
|
Note 6 |
|
|
|
|
Taiwan Power Co. 7th Unsecured Corporate Bond-A Issue in 2008 |
|
— |
|
Held-to-maturity financial assets |
|
|
— |
|
|
|
150,407 |
|
|
|
— |
|
|
|
150,407 |
|
|
Note 6 |
|
|
|
|
Taiwan Power Co. 1st Secured Corporate Bond-A Issue in 2009 |
|
— |
|
Held-to-maturity financial assets |
|
|
— |
|
|
|
20,069 |
|
|
|
— |
|
|
|
20,069 |
|
|
Note 6 |
|
|
|
|
Taiwan Power Co. 1st Secured Corporate Bond-A Issue in 2009 |
|
— |
|
Held-to-maturity financial assets |
|
|
— |
|
|
|
100,151 |
|
|
|
— |
|
|
|
100,151 |
|
|
Note 6 |
|
|
|
|
Taiwan Power Co. 2nd Secured Corporate Bond-B Issue in 2009 |
|
— |
|
Held-to-maturity financial assets |
|
|
— |
|
|
|
50,068 |
|
|
|
— |
|
|
|
50,068 |
|
|
Note 6 |
|
|
|
|
Taiwan Power Company 4th Secured Corporate Bond-B Issue in 2009 |
|
— |
|
Held-to-maturity financial assets |
|
|
— |
|
|
|
349,753 |
|
|
|
— |
|
|
|
349,753 |
|
|
Note 6 |
|
|
|
|
Taiwan Power Company 5th Secured Corporate Bond-B Issue in 2009 |
|
— |
|
Held-to-maturity financial assets |
|
|
— |
|
|
|
100,161 |
|
|
|
— |
|
|
|
100,161 |
|
|
Note 6 |
(Continued)
92
|
|
|
|
|
|
|
|
|
|
|
|
|
|
|
|
|
|
|
|
|
|
|
|
|
|
|
| No. |
|
Held Company Name |
|
Marketable Securities Type and
Name |
|
Relationship
with the
Company |
|
Financial Statement Account |
|
September 30, 2013 |
|
|
Note |
| |
|
|
|
|
Shares
(Thousands/
Thousand
Units) |
|
|
Carrying
Value
(Note 5) |
|
|
Percentage
of
Ownership |
|
|
Market
Value or
Net
Asset
Value |
|
|
|
|
|
|
|
|
|
|
|
|
|
|
|
|
Taiwan Power Company 2nd Secured Corporate Bond-A Issue in 2010 |
|
— |
|
Held-to-maturity financial assets |
|
|
— |
|
|
$ |
100,090 |
|
|
|
— |
|
|
$ |
100,090 |
|
|
Note 6 |
|
|
|
|
Taiwan Power Co 3rd Secured Corporate Bond-A Issue in 2010 |
|
— |
|
Held-to-maturity financial assets |
|
|
— |
|
|
|
200,615 |
|
|
|
— |
|
|
|
200,615 |
|
|
Note 6 |
|
|
|
|
Taiwan Power Co. 4th Secured Corporate Bond-A Issue in 2010 |
|
— |
|
Held-to-maturity financial assets |
|
|
— |
|
|
|
300,284 |
|
|
|
— |
|
|
|
300,284 |
|
|
Note 6 |
|
|
|
|
Taiwan Power Co. 4th Secured Corporate Bond-A Issue in 2010 |
|
— |
|
Held-to-maturity financial assets |
|
|
— |
|
|
|
199,944 |
|
|
|
— |
|
|
|
199,944 |
|
|
Note 6 |
|
|
|
|
Taiwan Power Co. 4th Secured Corporate Bond-A Issue in 2010 |
|
— |
|
Held-to-maturity financial assets |
|
|
— |
|
|
|
99,972 |
|
|
|
— |
|
|
|
99,972 |
|
|
Note 6 |
|
|
|
|
Taiwan Power Co. 1st Unsecured Corporate Bond-A Issue in 2012 |
|
— |
|
Held-to-maturity financial assets |
|
|
— |
|
|
|
39,972 |
|
|
|
— |
|
|
|
39,972 |
|
|
Note 6 |
|
|
|
|
Taiwan Power Co. 1st Unsecured Corporate Bond-A Issue in 2012 |
|
— |
|
Held-to-maturity financial assets |
|
|
— |
|
|
|
99,929 |
|
|
|
— |
|
|
|
99,929 |
|
|
Note 6 |
|
|
|
|
Taiwan Power Co. 1st Unsecured Corporate Bond-2A Issue in 2012 |
|
— |
|
Held-to-maturity financial assets |
|
|
— |
|
|
|
99,926 |
|
|
|
— |
|
|
|
99,926 |
|
|
Note 6 |
|
|
|
|
KGI Securities Co., Ltd. 1st Unsecured Corporate Bonds in 2012 |
|
— |
|
Held-to-maturity financial assets |
|
|
— |
|
|
|
300,000 |
|
|
|
— |
|
|
|
300,000 |
|
|
Note 6 |
|
|
|
|
MLPC 1st Unsecured Corporate Bonds Issue in 2009 |
|
— |
|
Held-to-maturity financial assets |
|
|
— |
|
|
|
150,612 |
|
|
|
— |
|
|
|
150,612 |
|
|
Note 6 |
|
|
|
|
MLPC 1st Unsecured Corporate Bonds Issue in 2009 |
|
— |
|
Held-to-maturity financial assets |
|
|
— |
|
|
|
49,987 |
|
|
|
— |
|
|
|
49,987 |
|
|
Note 6 |
|
|
|
|
MLPC 1st Unsecured Corporate Bond Issue in 2009 |
|
— |
|
Held-to-maturity financial assets |
|
|
— |
|
|
|
49,987 |
|
|
|
— |
|
|
|
49,987 |
|
|
Note 6 |
|
|
|
|
China Development Holding Corporation 1st Unsecured Corporate Bond-A Issue in 2010 |
|
— |
|
Held-to-maturity financial assets |
|
|
— |
|
|
|
201,248 |
|
|
|
— |
|
|
|
201,248 |
|
|
Note 6 |
|
|
|
|
China Development Holding Corporation 1st Unsecured Corporate Bond-A Issue in 2012 |
|
— |
|
Held-to-maturity financial assets |
|
|
— |
|
|
|
150,047 |
|
|
|
— |
|
|
|
150,047 |
|
|
Note 6 |
|
|
|
|
China Development Holding Corporation 1st Unsecured Corporate Bond-A Issue in 2012 |
|
— |
|
Held-to-maturity financial assets |
|
|
— |
|
|
|
100,065 |
|
|
|
— |
|
|
|
100,065 |
|
|
Note 6 |
|
|
|
|
China Development Holding Corporation 1st Unsecured Corporate Bond-A Issue in 2012 |
|
— |
|
Held-to-maturity financial assets |
|
|
— |
|
|
|
100,065 |
|
|
|
— |
|
|
|
100,065 |
|
|
Note 6 |
|
|
|
|
Yuanta FHC 1st Unsecured Corporate Bonds-A Issue in 2011 |
|
— |
|
Held-to-maturity financial assets |
|
|
— |
|
|
|
300,000 |
|
|
|
— |
|
|
|
300,000 |
|
|
Note 6 |
|
|
|
|
Fubon Financial Holding Co., Ltd. 1st Unsecured Corporate Bond issued in 2011 |
|
— |
|
Held-to-maturity financial assets |
|
|
— |
|
|
|
100,426 |
|
|
|
— |
|
|
|
100,426 |
|
|
Note 6 |
|
|
|
|
Fubon Financial Holding Co., Ltd. 1st Unsecured Corporate Bond issued in 2011 |
|
— |
|
Held-to-maturity financial assets |
|
|
— |
|
|
|
301,368 |
|
|
|
— |
|
|
|
301,368 |
|
|
Note 6 |
|
|
|
|
Fubon Financial Holding Co., Ltd. 1st Unsecured Corporate Bond-A Issue in 2012 |
|
— |
|
Held-to-maturity financial assets |
|
|
— |
|
|
|
300,000 |
|
|
|
— |
|
|
|
300,000 |
|
|
Note 6 |
|
|
|
|
TaipeiFubon Bank 5th Financial Debentures-A Issue in 2010 |
|
— |
|
Held-to-maturity financial assets |
|
|
— |
|
|
|
301,683 |
|
|
|
— |
|
|
|
301,683 |
|
|
Note 6 |
|
|
|
|
TaipeiFubon Bank 5th Financial Debentures-A Issue in 2010 |
|
— |
|
Held-to-maturity financial assets |
|
|
— |
|
|
|
200,799 |
|
|
|
— |
|
|
|
200,799 |
|
|
Note 6 |
|
|
|
|
TaipeiFubon Bank 5th Financial Debentures-A Issue in 2010 |
|
— |
|
Held-to-maturity financial assets |
|
|
— |
|
|
|
100,319 |
|
|
|
— |
|
|
|
100,319 |
|
|
Note 6 |
(Continued)
93
|
|
|
|
|
|
|
|
|
|
|
|
|
|
|
|
|
|
|
|
|
|
|
|
|
|
|
| No. |
|
Held Company Name |
|
Marketable Securities Type and
Name |
|
Relationship
with the
Company |
|
Financial Statement Account |
|
September 30, 2013 |
|
|
Note |
| |
|
|
|
|
Shares
(Thousands/
Thousand
Units) |
|
|
Carrying
Value
(Note 5) |
|
|
Percentage
of
Ownership |
|
|
Market
Value or
Net
Asset
Value |
|
|
|
|
|
|
|
|
|
|
|
|
|
|
|
|
HSBC Bank (Taiwan) Limited 1st Financial Debenture-C Issue in 2011 |
|
— |
|
Held-to-maturity financial assets |
|
|
— |
|
|
$ |
200,707 |
|
|
|
— |
|
|
$ |
200,707 |
|
|
Note 6 |
|
|
|
|
HSBC Bank (Taiwan) Limited 1st Financial Debenture-D Issue in 2011 |
|
— |
|
Held-to-maturity financial assets |
|
|
— |
|
|
|
300,000 |
|
|
|
— |
|
|
|
300,000 |
|
|
Note 6 |
|
|
|
|
Eximbank 19-2nd Unsecured Financial Debentures |
|
— |
|
Held-to-maturity financial assets |
|
|
— |
|
|
|
150,000 |
|
|
|
— |
|
|
|
150,000 |
|
|
Note 6 |
| 1 |
|
Senao International Co., Ltd. |
|
Stocks |
|
|
|
|
|
|
|
|
|
|
|
|
|
|
|
|
|
|
|
|
|
|
|
|
|
Senao Networks, Inc. |
|
Associate |
|
Investments accounted for using equity method |
|
|
16,824 |
|
|
|
468,379 |
|
|
|
40 |
|
|
|
468,379 |
|
|
Note 1 |
|
|
|
|
Senao International (Samoa) Holding Ltd. |
|
Subsidiary |
|
Investments accounted for using equity method |
|
|
54,975 |
|
|
(US$ |
852,433
28,730
(Note 9 |
) ) |
|
|
100 |
|
|
(US$ |
854,749
28,809 |
) |
|
Note 1 |
|
|
|
|
N.T.U. Innovation Incubation Corporation |
|
— |
|
Financial assets carried at cost - noncurrent |
|
|
1,200 |
|
|
|
12,000 |
|
|
|
9 |
|
|
|
12,675 |
|
|
Note 2 |
| 2 |
|
CHIEF Telecom Inc. |
|
Stocks |
|
|
|
|
|
|
|
|
|
|
|
|
|
|
|
|
|
|
|
|
|
|
|
|
|
Unigate Telecom Inc. |
|
Subsidiary |
|
Investments accounted for using equity method |
|
|
200 |
|
|
|
1,570
(Note 9 |
) |
|
|
100 |
|
|
|
1,570 |
|
|
Note 1 |
|
|
|
|
Chief International Corp. |
|
Subsidiary |
|
Investments accounted for using equity method |
|
|
200 |
|
|
(US$ |
17,943
607
(Note 9 |
) ) |
|
|
100 |
|
|
(US$ |
17,943
607 |
) |
|
Note 1 |
|
|
|
|
3 Link Information Service Co., Ltd. |
|
— |
|
Financial assets carried at cost - noncurrent |
|
|
374 |
|
|
|
3,450 |
|
|
|
10 |
|
|
|
6,174 |
|
|
Note 2 |
|
|
|
|
21 Vianet Group. Inc. |
|
— |
|
Available-for-sale financial assets |
|
|
208 |
|
|
(US$ |
16,880
571 |
) |
|
|
— |
|
|
(US$ |
16,880
571 |
) |
|
Note 4 |
| 3 |
|
Chunghwa System Integration Co., Ltd. |
|
Stocks |
|
|
|
|
|
|
|
|
|
|
|
|
|
|
|
|
|
|
|
|
|
|
|
|
|
Concord Technology Co., Ltd. |
|
Subsidiary |
|
Investments accounted for using equity method |
|
|
1,500 |
|
|
(RMB |
19,391
4,033
(Note 9 |
) ) |
|
|
100 |
|
|
(RMB |
19,391
4,033 |
) |
|
Note 1 |
| 7 |
|
Spring House Entertainment Tech. Inc. |
|
Stocks |
|
|
|
|
|
|
|
|
|
|
|
|
|
|
|
|
|
|
|
|
|
|
|
|
|
Ceylon Innovation Co., Ltd. |
|
Subsidiary |
|
Investments accounted for using equity method |
|
|
— |
|
|
|
9,624
(Note 9 |
) |
|
|
100 |
|
|
|
9,624 |
|
|
Note 1 |
| 8 |
|
Light Era Development Co., Ltd. |
|
Stocks |
|
|
|
|
|
|
|
|
|
|
|
|
|
|
|
|
|
|
|
|
|
|
|
|
|
Yao Yong Real Property Co., Ltd. |
|
Subsidiary |
|
Investments accounted for using equity method |
|
|
83,290 |
|
|
|
2,699,017
(Note 9 |
) |
|
|
100 |
|
|
|
1,817,801 |
|
|
Note 1 |
| 9 |
|
Chunghwa Telecom Singapore Pte., Ltd. |
|
Stocks |
|
|
|
|
|
|
|
|
|
|
|
|
|
|
|
|
|
|
|
|
|
|
|
|
|
ST-2 Satellite Ventures Pte., Ltd. |
|
Associate |
|
Investments accounted for using equity method |
|
|
18,102 |
|
|
(US$ |
663,852
22,450 |
) |
|
|
38 |
|
|
(US$ |
663,852
22,450 |
) |
|
Note 1 |
| 14 |
|
Chunghwa Investment Co., Ltd. |
|
Stocks |
|
|
|
|
|
|
|
|
|
|
|
|
|
|
|
|
|
|
|
|
|
|
|
|
|
Chunghwa Precision Test Tech. Co., Ltd. |
|
Subsidiary |
|
Investments accounted for using equity method |
|
|
10,936 |
|
|
|
146,140
(Note 9 |
) |
|
|
51 |
|
|
|
146,140 |
|
|
Note 1 |
|
|
|
|
Chunghwa Investment Holding Co., Ltd. (CIHC) |
|
Subsidiary |
|
Investments accounted for using equity method |
|
|
1,432 |
|
|
(US$ |
17,137
580
(Note 9 |
) ) |
|
|
100 |
|
|
(US$ |
17,137
580 |
) |
|
Note 1 |
(Continued)
94
|
|
|
|
|
|
|
|
|
|
|
|
|
|
|
|
|
|
|
|
|
|
|
|
|
|
|
| No. |
|
Held Company Name |
|
Marketable Securities Type and
Name |
|
Relationship
with the
Company |
|
Financial Statement Account |
|
September 30, 2013 |
|
|
Note |
| |
|
|
|
|
Shares
(Thousands/
Thousand
Units) |
|
|
Carrying
Value
(Note 5) |
|
|
Percentage
of
Ownership |
|
|
Market
Value or
Net
Asset
Value |
|
|
|
|
|
|
|
|
|
|
|
|
|
|
|
|
PandaMonium Company Ltd. |
|
Associate |
|
Investments accounted for using equity method |
|
|
602 |
|
|
$ |
— |
|
|
|
43 |
|
|
$ |
— |
|
|
Note 1 |
|
|
|
|
CHIEF Telecom Inc. |
|
Associate |
|
Investments accounted for using equity method |
|
|
2,000 |
|
|
|
27,559
(Note 9 |
) |
|
|
4 |
|
|
|
27,559 |
|
|
Note 1 |
|
|
|
|
Senao International Co., Ltd. |
|
Associate |
|
Investments accounted for using equity method |
|
|
1,001 |
|
|
|
46,407
(Note 9 |
) |
|
|
— |
|
|
|
94,094 |
|
|
Note 4 |
|
|
|
|
Tatung Technology Inc. |
|
— |
|
Financial assets carried at cost - noncurrent |
|
|
4,571 |
|
|
|
73,964 |
|
|
|
11 |
|
|
|
81,635 |
|
|
Note 2 |
|
|
|
|
Digimax Inc. |
|
— |
|
Financial assets carried at cost - noncurrent |
|
|
1,203 |
|
|
|
10,928 |
|
|
|
3 |
|
|
|
9,332 |
|
|
Note 2 |
|
|
|
|
iD Branding Ventures |
|
— |
|
Financial assets carried at cost - noncurrent |
|
|
1,875 |
|
|
|
18,750 |
|
|
|
3 |
|
|
|
16,388 |
|
|
Note 2 |
|
|
|
|
Uni Display Inc. |
|
— |
|
Financial assets carried at cost - noncurrent |
|
|
2,445 |
|
|
|
16,578 |
|
|
|
1 |
|
|
|
14,915 |
|
|
Note 2 |
|
|
|
|
A2 peak Power Co., Ltd. |
|
— |
|
Financial assets carried at cost - noncurrent |
|
|
990 |
|
|
|
— |
|
|
|
3 |
|
|
|
— |
|
|
Note 2 |
|
|
|
|
VisEra Technologies Company Ltd. |
|
— |
|
Financial assets carried at cost - noncurrent |
|
|
649 |
|
|
|
29,371 |
|
|
|
— |
|
|
|
14,175 |
|
|
Note 2 |
|
|
|
|
Ultra Fine Optical Technology Co., Ltd. |
|
— |
|
Financial assets carried at cost - noncurrent |
|
|
1,800 |
|
|
|
13,776 |
|
|
|
8 |
|
|
|
13,374 |
|
|
Note 2 |
|
|
|
|
Alder Optomechanical Corp. |
|
— |
|
Financial assets carried at cost - noncurrent |
|
|
666 |
|
|
|
7,326 |
|
|
|
1 |
|
|
|
6,660 |
|
|
Note 2 |
|
|
|
|
Aide Energy (Cayman) Holding Co., Ltd. |
|
— |
|
Financial assets carried at cost - noncurrent |
|
|
800 |
|
|
|
630 |
|
|
|
1 |
|
|
|
1,568 |
|
|
Note 2 |
|
|
|
|
Mediapro Technology Ltd. |
|
— |
|
Financial assets carried at cost - noncurrent |
|
|
55 |
|
|
|
8,177 |
|
|
|
— |
|
|
|
2,873 |
|
|
Note 2 |
|
|
|
|
PChome Store Inc. |
|
— |
|
Available-for-sale financial assets - noncurrent |
|
|
405 |
|
|
|
14,073 |
|
|
|
2 |
|
|
|
66,782 |
|
|
Note 4 |
|
|
|
|
Procrystal Technology Co., Ltd. |
|
— |
|
Available-for-sale financial assets - noncurrent |
|
|
1,350 |
|
|
|
16,200 |
|
|
|
2 |
|
|
|
16,200 |
|
|
Note 7 |
|
|
|
|
Tons Lightology Inc. |
|
— |
|
Available-for-sale financial assets - noncurrent |
|
|
1,242 |
|
|
|
66,150 |
|
|
|
3 |
|
|
|
33,168 |
|
|
Note 4 |
| 18 |
|
Concord Technology Co., Ltd. |
|
Stocks |
|
|
|
|
|
|
|
|
|
|
|
|
|
|
|
|
|
|
|
|
|
|
|
|
|
Glory Network System Service (Shanghai) Co., Ltd. |
|
Subsidiary |
|
Investments accounted for using equity method |
|
|
— |
|
|
(RMB |
19,391
4,033
(Note 9 |
) ) |
|
|
100 |
|
|
(RMB |
19,391
4,033 |
) |
|
Note 1 |
| 20 |
|
Chunghwa Precision Test Tech. Co., Ltd. |
|
Stocks |
|
|
|
|
|
|
|
|
|
|
|
|
|
|
|
|
|
|
|
|
|
|
|
|
|
Chunghwa Precision Test Tech. USA Corporation |
|
Subsidiary |
|
Investments accounted for using equity method |
|
|
400 |
|
|
(US$ |
10,512
356
(Note 9 |
) ) |
|
|
100 |
|
|
(US$ |
10,512
356 |
) |
|
Note 1 |
|
|
|
|
CHPT Japan Co., Ltd. |
|
Subsidiary |
|
Investments accounted for using equity method |
|
|
600 |
|
|
(JPY |
1,880
6,436
(Note 9 |
) ) |
|
|
100 |
|
|
(JPY |
1,880
6,436 |
) |
|
Note 1 |
|
|
|
|
Chunghwa Precision Test Tech International, Ltd. |
|
Subsidiary |
|
Investments accounted for using equity method |
|
|
100 |
|
|
(US$ |
2,957
100
(Note 9 |
) ) |
|
|
100 |
|
|
(US$ |
2,957
100 |
) |
|
Note 1 |
| 22 |
|
Senao International (Samoa) Holding Ltd. |
|
Stocks |
|
|
|
|
|
|
|
|
|
|
|
|
|
|
|
|
|
|
|
|
|
|
|
|
|
Senao International HK Limited |
|
Subsidiary |
|
Investments accounted for using equity method |
|
|
54,260 |
|
|
(US$ |
826,744
27,865
(Note 9 |
) ) |
|
|
100 |
|
|
(US$ |
826,744
27,865 |
) |
|
Note 1 |
|
|
|
|
HopeTech Technologies Limited |
|
Associate |
|
Investments accounted for using equity method |
|
|
5,240 |
|
|
(US$ |
26,985
909 |
) |
|
|
45 |
|
|
(US$ |
26,985
909 |
) |
|
Note 1 |
| 23 |
|
Senao International HK Limited |
|
Stocks |
|
|
|
|
|
|
|
|
|
|
|
|
|
|
|
|
|
|
|
|
|
|
|
|
|
Senao Trading (Fujian) Co., Ltd. |
|
Subsidiary |
|
Investments accounted for using equity method |
|
|
— |
|
|
(US$ |
400,679
13,505
(Note 9 |
) ) |
|
|
100 |
|
|
(US$ |
400,679
13,505 |
) |
|
Note 1 |
(Continued)
95
|
|
|
|
|
|
|
|
|
|
|
|
|
|
|
|
|
|
|
|
|
|
|
|
|
|
|
| No. |
|
Held Company Name |
|
Marketable Securities Type and
Name |
|
Relationship
with the
Company |
|
Financial Statement Account |
|
September 30, 2013 |
|
|
Note |
| |
|
|
|
|
Shares
(Thousands/
Thousand
Units) |
|
|
Carrying
Value
(Note 5) |
|
|
Percentage
of
Ownership |
|
|
Market
Value or
Net
Asset
Value |
|
|
|
|
|
|
|
|
|
|
|
|
|
|
|
|
Senao International Trading (Shanghai) Co., Ltd. |
|
Subsidiary |
|
Investments accounted for using equity method |
|
|
— |
|
|
$
(US$ |
228,710
7,708
(Note 9 |
) ) |
|
|
100 |
|
|
$
(US$ |
228,710
7,708 |
) |
|
Notes 1
and 10 |
|
|
|
|
Senao International Trading (Shanghai) Co., Ltd. |
|
Subsidiary |
|
Investments accounted for using equity method |
|
|
— |
|
|
(US$ |
80,568
2,715
(Note 9 |
) ) |
|
|
100 |
|
|
(US$ |
80,568
2,715 |
) |
|
Notes 1
and 10 |
|
|
|
|
Senao International Trading (Jiangsu) Co., Ltd. |
|
Subsidiary |
|
Investments accounted for using equity method |
|
|
— |
|
|
(US$ |
116,171
3,915
(Note 9 |
) ) |
|
|
100 |
|
|
(US$ |
116,171
3,915 |
) |
|
Note 1 |
| 24 |
|
Chunghwa Investment Holding Co., Ltd. |
|
Stocks |
|
|
|
|
|
|
|
|
|
|
|
|
|
|
|
|
|
|
|
|
|
|
|
|
|
CHI One Investment Co., Limited |
|
Subsidiary |
|
Investments accounted for using equity method |
|
|
6,520 |
|
|
(HK$ |
10,159
1,902
(Note 9 |
) ) |
|
|
100 |
|
|
(HK$ |
10,159
1,902 |
) |
|
Note 1 |
| 26 |
|
CHI One Investment Co., Limited |
|
Stocks |
|
|
|
|
|
|
|
|
|
|
|
|
|
|
|
|
|
|
|
|
|
|
|
|
|
Xiamen Sertec Business Technology Co., Ltd. |
|
Associate |
|
Investments accounted for using equity method |
|
|
— |
|
|
(RMB |
6,774
1,402 |
) |
|
|
49 |
|
|
(RMB |
6,774
1,402 |
) |
|
Note 1 |
| 27 |
|
Prime Asia Investments Group, Ltd. (B.V.I.) |
|
Stocks |
|
|
|
|
|
|
|
|
|
|
|
|
|
|
|
|
|
|
|
|
|
|
|
|
|
Chunghwa Hsingta Company Ltd. |
|
Subsidiary |
|
Investments accounted for using equity method |
|
|
1 |
|
|
(RMB |
128,799
26,783
(Note 9 |
) ) |
|
|
100 |
|
|
(RMB |
128,799
26,783 |
) |
|
Note 1 |
| 29 |
|
Chunghwa Hsingta Company Ltd. |
|
Stocks |
|
|
|
|
|
|
|
|
|
|
|
|
|
|
|
|
|
|
|
|
|
|
|
|
|
Chunghwa Telecom (China) Co., Ltd. |
|
Subsidiary |
|
Investments accounted for using equity method |
|
|
— |
|
|
(RMB |
102,172
21,246
(Note 9 |
) ) |
|
|
100 |
|
|
(RMB |
102,172
21,246 |
) |
|
Note 1 |
|
|
|
|
Jiangsu Zhenhua Information Technology Company, LLC |
|
Subsidiary |
|
Investments accounted for using equity method |
|
|
— |
|
|
(RMB |
19,861
4,130
(Note 9 |
) ) |
|
|
75 |
|
|
(RMB |
19,861
4,130 |
) |
|
Note 1 |
|
|
|
|
Hua-Xiong Information Technology Co., Ltd. |
|
Subsidiary |
|
Investments accounted for using equity method |
|
|
— |
|
|
(RMB |
6,766
1,407
(Note 9 |
) ) |
|
|
51 |
|
|
(RMB |
6,766
1,407 |
) |
|
Note 1 |
| Note 1: |
The net asset values of investees were based on reviewed financial statements. |
| Note 2: |
The net asset values of investees were based on unreviewed financial statements. |
| Note 3: |
The net asset values of beneficiary certificates (mutual fund) were based on the net asset values on September 30, 2013. |
| Note 4: |
Market value was based on the closing price of September 30, 2013. |
| Note 5: |
Showing at their original carrying amounts without adjustments for fair values, except for held-to-maturity financial assets. |
(Continued)
96
| Note 6: |
The net asset values of investees were based on amortized cost. |
| Note 7: |
Market value of emerging stock was based on the average trading price on September 30, 2013. |
| Note 8: |
New Prospect Investments Holdings Ltd. (B.V.I.) was incorporated in March 2006, but not yet begun operation as of September 30, 2013. |
| Note 9: |
The amount was eliminated upon consolidation. |
| Note 10: |
The English name is the same as the above entity; however, the Chinese names included in the respective Articles of Incorporations are different. |
(Concluded)
97
TABLE 3
CHUNGHWA TELECOM CO., LTD. AND SUBSIDIARIES
MARKETABLE SECURITIES ACQUIRED AND DISPOSED OF AT COSTS OR PRICES OF AT LEAST NT$100 MILLION OR 20% OF THE PAID-IN CAPITAL
NINE MONTHS ENDED SEPTEMBER 30, 2013
(Amounts in
Thousands of New Taiwan Dollars)
|
|
|
|
|
|
|
|
|
|
|
|
|
|
|
|
|
|
|
|
|
|
|
|
|
|
|
|
|
|
|
|
|
|
|
|
|
|
|
|
|
|
|
|
|
|
|
|
|
|
|
|
|
|
|
| No. |
|
Company
Name |
|
Marketable
Securities
Type and
Name |
|
Financial
Statement
Account |
|
Counter-
party |
|
|
Nature of
Relation-
ship |
|
|
Beginning
Balance |
|
|
Acquisition |
|
|
Disposal |
|
|
Ending
Balance |
|
| |
|
|
|
|
|
Shares
(Thou-
sands/
Thou-
sand
Units) |
|
|
Amount
(Note 1) |
|
|
Shares
(Thou-
sands/
Thou-
sand
Units) |
|
|
Amount |
|
|
Shares
(Thou-
sands/
Thou-
sand
Units) |
|
|
Amount |
|
|
Carrying
Value
(Note 1) |
|
|
Gain
(Loss)
on
Disposal |
|
|
Shares
(Thou-
sands/
Thou-
sand
Units) |
|
|
Amount
(Note 1) |
|
|
|
|
|
|
|
|
|
|
|
|
|
|
|
|
|
| 0 |
|
Chunghwa Telecom Co., Ltd. |
|
Stocks |
|
|
|
|
|
|
|
|
|
|
|
|
|
|
|
|
|
|
|
|
|
|
|
|
|
|
|
|
|
|
|
|
|
|
|
|
|
|
|
|
|
|
|
|
|
|
|
|
|
|
|
|
|
|
Honghwa Human Resources Co., Ltd. |
|
Investments accounted for using equity method |
|
|
— |
|
|
|
Subsidiary |
|
|
|
— |
|
|
$ |
— |
|
|
|
18,000 |
|
|
$ |
180,000 |
|
|
|
— |
|
|
$ |
— |
|
|
$ |
— |
|
|
$ |
— |
|
|
|
18,000 |
|
|
$
|
193,085
(Notes 3 and 5) |
|
|
|
|
|
Donghwa Telecom Co, Ltd |
|
Investments accounted for using equity method |
|
|
— |
|
|
|
Subsidiary |
|
|
|
305,090 |
|
|
|
1,168,032
(Note 3) |
|
|
|
69,420 |
|
|
|
256,843 |
|
|
|
— |
|
|
|
— |
|
|
|
— |
|
|
|
— |
|
|
|
374,510 |
|
|
|
1,441,438
(Notes 3 and 5) |
|
|
|
|
|
Chunghwa Investment Co., Ltd. |
|
Investments accounted for using equity method |
|
|
— |
|
|
|
Subsidiary |
|
|
|
80,100 |
|
|
|
612,738
(Note 3) |
|
|
|
— |
|
|
|
— |
|
|
|
12,015 |
|
|
|
12,150 |
|
|
|
12,150
(Note 4) |
|
|
|
— |
|
|
|
68,085 |
|
|
|
475,238
(Notes 3 and 5) |
|
|
|
|
|
|
|
|
|
|
|
|
|
|
|
|
|
|
|
|
|
Beneficiary certificates (mutual fund) |
|
|
|
|
|
|
|
|
|
|
|
|
|
|
|
|
|
|
|
|
|
|
|
|
|
|
|
|
|
|
|
|
|
|
|
|
|
|
|
|
|
|
|
|
|
|
|
|
|
|
|
|
|
|
Fidelity Funds - US High Yield Fund (Y-ACC-USD) |
|
Available-for-sale financial assets |
|
|
— |
|
|
|
— |
|
|
|
— |
|
|
|
— |
|
|
|
307 |
|
|
|
147,955 |
|
|
|
307 |
|
|
|
142,569 |
|
|
|
147,955 |
|
|
|
(5,386 |
) |
|
|
— |
|
|
|
— |
|
|
|
|
|
PIMCO GIS plc Global Investment Grade Credit Fund Class H Institutional (Acc) |
|
Available-for-sale financial assets |
|
|
— |
|
|
|
— |
|
|
|
1,071 |
|
|
|
456,118 |
|
|
|
597 |
|
|
|
295,890 |
|
|
|
1,668 |
|
|
|
797,099 |
|
|
|
752,008 |
|
|
|
45,091 |
|
|
|
— |
|
|
|
— |
|
|
|
|
|
PIMCO GIS plc Total Return Bond Class H Institutional (Acc) |
|
Available-for-sale financial assets |
|
|
— |
|
|
|
— |
|
|
|
770 |
|
|
|
534,453 |
|
|
|
— |
|
|
|
— |
|
|
|
770 |
|
|
|
579,586 |
|
|
|
534,453 |
|
|
|
45,133 |
|
|
|
— |
|
|
|
— |
|
|
|
|
|
Janus Flexible Income Bond Fund |
|
Available-for-sale financial assets |
|
|
— |
|
|
|
— |
|
|
|
671 |
|
|
|
230,472 |
|
|
|
318 |
|
|
|
116,280 |
|
|
|
989 |
|
|
|
372,472 |
|
|
|
346,752 |
|
|
|
25,720 |
|
|
|
— |
|
|
|
— |
|
(Continued)
98
|
|
|
|
|
|
|
|
|
|
|
|
|
|
|
|
|
|
|
|
|
|
|
|
|
|
|
|
|
|
|
|
|
|
|
|
|
|
|
|
|
|
|
|
|
|
|
|
|
|
|
|
|
|
|
| No. |
|
Company
Name |
|
Marketable
Securities
Type and
Name |
|
Financial
Statement
Account |
|
Counter-
party |
|
|
Nature of
Relation-
ship |
|
|
Beginning
Balance |
|
|
Acquisition |
|
|
Disposal |
|
|
Ending
Balance |
|
| |
|
|
|
|
|
Shares
(Thou-
sands/
Thou-
sand
Units) |
|
|
Amount
(Note 1) |
|
|
Shares
(Thou-
sands/
Thou-
sand
Units) |
|
|
Amount |
|
|
Shares
(Thou-
sands/
Thou-
sand
Units) |
|
|
Amount |
|
|
Carrying
Value
(Note 1) |
|
|
Gain
(Loss)
on
Disposal |
|
|
Shares
(Thou-
sands/
Thou-
sand
Units) |
|
|
Amount
(Note 1) |
|
|
|
|
|
|
|
|
|
|
|
|
|
|
|
|
|
|
|
|
|
PIMCO GIS Diversified Income Fund Class H Institutional (Acc) |
|
Available-for-sale financial assets |
|
|
— |
|
|
|
— |
|
|
|
984 |
|
|
|
347,452 |
|
|
|
1,443 |
|
|
|
618,189 |
|
|
|
2,427 |
|
|
|
984,598 |
|
|
|
965,641 |
|
|
|
18,957 |
|
|
|
— |
|
|
|
— |
|
|
|
|
|
Legg Mason Western Asset Global Multi Strategy Fund Class F USD Distributing (D) |
|
Available-for-sale financial assets |
|
|
— |
|
|
|
— |
|
|
|
— |
|
|
|
— |
|
|
|
47 |
|
|
|
148,080 |
|
|
|
47 |
|
|
|
138,696 |
|
|
|
148,080 |
|
|
|
(9,384 |
) |
|
|
— |
|
|
|
— |
|
|
|
|
|
Fidelity Funds - US Dollar Bond Fund (Y-ACC-USD) |
|
Available-for-sale financial assets |
|
|
— |
|
|
|
— |
|
|
|
778 |
|
|
|
297,283 |
|
|
|
— |
|
|
|
— |
|
|
|
778 |
|
|
|
314,074 |
|
|
|
297,283 |
|
|
|
16,791 |
|
|
|
— |
|
|
|
— |
|
|
|
|
|
Eastpring Investments - US Corporation Bond Fund |
|
Available-for-sale financial assets |
|
|
— |
|
|
|
— |
|
|
|
433 |
|
|
|
149,190 |
|
|
|
426 |
|
|
|
145,298 |
|
|
|
859 |
|
|
|
303,961 |
|
|
|
294,488 |
|
|
|
9,473 |
|
|
|
— |
|
|
|
— |
|
|
|
|
|
Schroder International Selection Fund - Global Corporate Bond |
|
Available-for-sale financial assets |
|
|
— |
|
|
|
— |
|
|
|
— |
|
|
|
— |
|
|
|
769 |
|
|
|
145,220 |
|
|
|
769 |
|
|
|
149,501 |
|
|
|
145,220 |
|
|
|
4,281 |
|
|
|
— |
|
|
|
— |
|
|
|
|
|
JP Morgan Funds - Global Corporate Bond Fund |
|
Available-for-sale financial assets |
|
|
— |
|
|
|
— |
|
|
|
— |
|
|
|
— |
|
|
|
44 |
|
|
|
145,220 |
|
|
|
44 |
|
|
|
151,902 |
|
|
|
145,220 |
|
|
|
6,682 |
|
|
|
— |
|
|
|
— |
|
|
|
|
|
|
|
|
|
|
|
|
|
|
|
|
|
|
|
|
|
Bonds |
|
|
|
|
|
|
|
|
|
|
|
|
|
|
|
|
|
|
|
|
|
|
|
|
|
|
|
|
|
|
|
|
|
|
|
|
|
|
|
|
|
|
|
|
|
|
|
|
|
|
|
|
|
|
NAN YA Company 1st Unsecured Corporate Bond-A Issue in 2009 |
|
Held-to-maturity financial assets |
|
|
— |
|
|
|
— |
|
|
|
— |
|
|
|
600,000
(Note 2) |
|
|
|
— |
|
|
|
— |
|
|
|
— |
|
|
|
300,000
(Note 2) |
|
|
|
300,000
(Note 2) |
|
|
|
— |
|
|
|
— |
|
|
|
300,000
(Note 2) |
|
|
|
|
|
NAN YA Company 3rd Unsecured Corporate Bond-A Issue in 2009 |
|
Held-to-maturity financial assets |
|
|
— |
|
|
|
— |
|
|
|
— |
|
|
|
250,000
(Note 2) |
|
|
|
— |
|
|
|
— |
|
|
|
— |
|
|
|
125,000
(Note 2) |
|
|
|
125,000
(Note 2) |
|
|
|
— |
|
|
|
— |
|
|
|
125,000
(Note 2) |
|
|
|
|
|
FCFC 2nd Unsecured Corporate Bonds Issue in 2009 |
|
Held-to-maturity financial assets |
|
|
— |
|
|
|
— |
|
|
|
— |
|
|
|
250,000
(Note 2) |
|
|
|
— |
|
|
|
— |
|
|
|
— |
|
|
|
125,000
(Note 2) |
|
|
|
125,000
(Note 2) |
|
|
|
— |
|
|
|
— |
|
|
|
125,000
(Note 2) |
|
|
|
|
|
Formosa Petrochemical Corporation 2nd Unsecured Corporate Bonds Issue in 2008 |
|
Held-to-maturity financial assets |
|
|
— |
|
|
|
— |
|
|
|
— |
|
|
|
250,000
(Note 2) |
|
|
|
— |
|
|
|
— |
|
|
|
— |
|
|
|
250,000
(Note 2) |
|
|
|
250,000
(Note 2) |
|
|
|
— |
|
|
|
— |
|
|
|
— |
|
|
|
|
|
Formosa Petrochemical Corporation 1st Unsecured Corporate Bonds Issue in 2009 |
|
Held-to-maturity financial assets |
|
|
— |
|
|
|
— |
|
|
|
— |
|
|
|
700,000
(Note 2) |
|
|
|
— |
|
|
|
— |
|
|
|
— |
|
|
|
350,000
(Note 2) |
|
|
|
350,000
(Note 2) |
|
|
|
— |
|
|
|
— |
|
|
|
350,000
(Note 2) |
|
(Continued)
99
|
|
|
|
|
|
|
|
|
|
|
|
|
|
|
|
|
|
|
|
|
|
|
|
|
|
|
|
|
|
|
|
|
|
|
|
|
|
|
|
|
|
|
|
|
|
|
|
|
|
|
|
|
|
|
| No. |
|
Company
Name |
|
Marketable
Securities
Type and
Name |
|
Financial
Statement
Account |
|
Counter-
party |
|
|
Nature of
Relation-
ship |
|
|
Beginning
Balance |
|
|
Acquisition |
|
|
Disposal |
|
|
Ending
Balance |
|
| |
|
|
|
|
|
Shares
(Thou-
sands/
Thou-
sand
Units) |
|
|
Amount
(Note 1) |
|
|
Shares
(Thou-
sands/
Thou-
sand
Units) |
|
|
Amount |
|
|
Shares
(Thou-
sands/
Thou-
sand
Units) |
|
|
Amount |
|
|
Carrying
Value
(Note 1) |
|
|
Gain
(Loss)
on
Disposal |
|
|
Shares
(Thou-
sands/
Thou-
sand
Units) |
|
|
Amount
(Note 1) |
|
|
|
|
|
|
|
|
|
|
|
|
|
|
|
|
|
|
|
|
|
Taiwan Power Co. 2nd Secures Bond-B Issue in 2008 |
|
Held-to-maturity financial assets |
|
|
— |
|
|
|
— |
|
|
|
— |
|
|
|
150,000
(Note 2) |
|
|
|
— |
|
|
|
— |
|
|
|
— |
|
|
|
150,000
(Note 2) |
|
|
|
150,000
(Note 2) |
|
|
|
— |
|
|
|
— |
|
|
|
— |
|
|
|
|
|
Taiwan Power Co. 4th Secures Bond-B Issue in 2008 |
|
Held-to-maturity financial assets |
|
|
— |
|
|
|
— |
|
|
|
— |
|
|
|
200,000
(Note 2) |
|
|
|
— |
|
|
|
— |
|
|
|
— |
|
|
|
200,000
(Note 2) |
|
|
|
200,000
(Note 2) |
|
|
|
— |
|
|
|
— |
|
|
|
— |
|
|
|
|
|
Taiwan Power Co. 1st Secured Corporate Bond-A issue in 2009 |
|
Held-to-maturity financial assets |
|
|
— |
|
|
|
— |
|
|
|
— |
|
|
|
240,000
(Note 2) |
|
|
|
— |
|
|
|
— |
|
|
|
— |
|
|
|
120,000
(Note 2) |
|
|
|
120,000
(Note 2) |
|
|
|
— |
|
|
|
— |
|
|
|
120,000
(Note 2) |
|
|
|
|
|
MLPC 1st Unsecured Corporate Bonds Issue in 2009 |
|
Held-to-maturity financial assets |
|
|
— |
|
|
|
— |
|
|
|
— |
|
|
|
500,000
(Note 2) |
|
|
|
— |
|
|
|
— |
|
|
|
— |
|
|
|
250,000
(Note 2) |
|
|
|
250,000
(Note 2) |
|
|
|
— |
|
|
|
— |
|
|
|
250,000
(Note 2) |
|
|
|
|
|
China Development Holding Corporation 1st Unsecured Corporate Bonds-A Issue in 2008 |
|
Held-to-maturity financial assets |
|
|
— |
|
|
|
— |
|
|
|
— |
|
|
|
100,000
(Note 2) |
|
|
|
— |
|
|
|
— |
|
|
|
— |
|
|
|
100,000
(Note 2) |
|
|
|
100,000
(Note 2) |
|
|
|
— |
|
|
|
— |
|
|
|
— |
|
|
|
|
|
Mega Securities Co., Ltd. 1st Unsecured Corporate Bond Issue in 2010 |
|
Held-to-maturity financial assets |
|
|
— |
|
|
|
— |
|
|
|
— |
|
|
|
300,000
(Note 2) |
|
|
|
— |
|
|
|
— |
|
|
|
— |
|
|
|
300,000
(Note 2) |
|
|
|
300,000
(Note 2) |
|
|
|
— |
|
|
|
— |
|
|
|
— |
|
| 1 |
|
Senao International Co., Ltd. |
|
Stocks |
|
|
|
|
|
|
|
|
|
|
|
|
|
|
|
|
|
|
|
|
|
|
|
|
|
|
|
|
|
|
|
|
|
|
|
|
|
|
|
|
|
|
|
|
|
|
|
|
|
|
|
|
|
|
Senao International (Samoa) Holding Ltd. |
|
Investments accounted for using equity method |
|
|
— |
|
|
|
Subsidiary |
|
|
|
33,475 |
|
|
$
(US$ |
988,597
33,475 |
) |
|
|
21,500 |
|
|
$
(US$ |
638,148
21,500 |
) |
|
|
— |
|
|
$ |
— |
|
|
$ |
— |
|
|
$ |
— |
|
|
|
54,975 |
|
|
$
(US$ |
1,626,745
54,975
(Note 5) |
)
|
| 22 |
|
Senao International (Samoa) Holding Ltd. |
|
Stocks |
|
|
|
|
|
|
|
|
|
|
|
|
|
|
|
|
|
|
|
|
|
|
|
|
|
|
|
|
|
|
|
|
|
|
|
|
|
|
|
|
|
|
|
|
|
|
|
|
|
|
|
|
|
|
Senao International HK Limited |
|
Investments accounted for using equity method |
|
|
— |
|
|
|
Subsidiary |
|
|
|
32,760 |
|
|
(US$ |
966,186
32,760 |
) |
|
|
21,500 |
|
|
(US$ |
638,148
21,500 |
) |
|
|
— |
|
|
|
— |
|
|
|
— |
|
|
|
— |
|
|
|
54,260 |
|
|
(US$ |
1,604,334
54,260
(Note 5) |
)
|
(Continued)
100
|
|
|
|
|
|
|
|
|
|
|
|
|
|
|
|
|
|
|
|
|
|
|
|
|
|
|
|
|
|
|
|
|
|
|
|
|
|
|
|
|
|
|
|
|
|
|
|
|
|
|
|
|
| No. |
|
Company
Name |
|
Marketable
Securities
Type and
Name |
|
Financial
Statement
Account |
|
Counter-
party |
|
|
Nature of
Relation-
ship |
|
Beginning
Balance |
|
|
Acquisition |
|
|
Disposal |
|
|
Ending
Balance |
|
| |
|
|
|
|
|
Shares
(Thou-
sands/
Thou-
sand
Units) |
|
|
Amount
(Note 1) |
|
|
Shares
(Thou-
sands/
Thou-
sand
Units) |
|
|
Amount |
|
|
Shares
(Thou-
sands/
Thou-
sand
Units) |
|
|
Amount |
|
|
Carrying
Value
(Note 1) |
|
|
Gain
(Loss)
on
Disposal |
|
|
Shares
(Thou-
sands/
Thou-
sand
Units) |
|
|
Amount
(Note 1) |
|
|
|
|
|
|
|
|
|
|
|
|
|
|
|
|
|
| 23 |
|
Senao International HK Limited |
|
Stocks |
|
|
|
|
|
|
|
|
|
|
|
|
|
|
|
|
|
|
|
|
|
|
|
|
|
|
|
|
|
|
|
|
|
|
|
|
|
|
|
|
|
|
|
|
|
|
|
|
|
|
|
|
Senao Trading (Fujian) Co., Ltd. |
|
Investments accounted for using equity method |
|
|
— |
|
|
Subsidiary |
|
|
— |
|
|
(US$ |
338,793
11,500 |
) |
|
|
— |
|
|
(US$ |
370,735
12,500 |
) |
|
|
— |
|
|
|
— |
|
|
|
— |
|
|
|
— |
|
|
|
— |
|
|
(US$ |
709,528
24,000
(Note 5) |
)
|
|
|
|
|
Senao International Trading (Shanghai) Co., Ltd. |
|
Investments accounted for using equity method |
|
|
— |
|
|
Subsidiary |
|
|
— |
|
|
(US$ |
297,726
10,000 |
) |
|
|
— |
|
|
(US$ |
237,733
8,000 |
) |
|
|
— |
|
|
|
— |
|
|
|
— |
|
|
|
— |
|
|
|
— |
|
|
(US$ |
535,459
18,000
(Note 5) |
)
|
| Note 1: |
Showing at their original carrying amounts without adjustments for fair values. |
| Note 2: |
Stated at its nominal amounts. |
| Note 3: |
The ending balance includes equity in earnings or losses of jointly controlled entities accounted for using equity method and exchange differences arising from the translation of the foreign operations adjustments
|
| Note 4: |
The decrease amount was arising from capital reduction. |
| Note 5: |
The amount was eliminated upon consolidation. |
(Concluded)
101
TABLE 4
CHUNGHWA TELECOM CO., LTD. AND SUBSIDIARIES
TOTAL
PURCHASES FROM OR SALES TO RELATED PARTIES AMOUNTING TO AT LEAST NT$100 MILLION OR 20% OF THE PAID-IN CAPITAL
NINE MONTHS ENDED SEPTEMBER 30, 2013
(Amounts in Thousands of New Taiwan Dollars)
|
|
|
|
|
|
|
|
|
|
|
|
|
|
|
|
|
|
|
|
|
|
|
|
|
|
|
|
|
|
|
|
|
|
|
| No. |
|
Company Name |
|
Related Party |
|
Nature of
Relationship |
|
Transaction Details |
|
Abnormal Transaction (Note 4) |
|
|
Notes/Accounts Payable
or Receivable |
|
| |
|
|
|
Purchase/Sale
(Note 1) |
|
Amount
(Note 2) |
|
|
% to Total |
|
|
Payment Terms |
|
Units Price |
|
|
Payment Terms |
|
|
Ending Balance
(Note 3) |
|
|
% to Total |
|
|
|
|
|
|
|
|
|
|
|
|
|
| 0 |
|
Chunghwa Telecom Co., Ltd. |
|
Senao International Co., Ltd. |
|
Subsidiary |
|
Purchase |
|
$
|
9,626,521
(Note 5) |
|
|
|
8.8 |
|
|
30-90 days |
|
$ |
— |
|
|
|
— |
|
|
$
|
(1,335,752
(Note 5) |
)
|
|
|
(10 |
) |
|
|
|
|
Chunghwa System Integration Co., Ltd. |
|
Subsidiary |
|
Purchase |
|
|
594,392
(Note 5) |
|
|
|
— |
|
|
30 days |
|
|
— |
|
|
|
— |
|
|
|
(418,691
(Note 5) |
)
|
|
|
(3 |
) |
|
|
|
|
ST-2 Satellite Ventures Pte. Ltd. |
|
Equity-method investee |
|
Purchase |
|
|
306,870 |
|
|
|
— |
|
|
30 days |
|
|
— |
|
|
|
— |
|
|
|
(49,980 |
) |
|
|
— |
|
|
|
|
|
Chunghwa Telecom Global, Inc. |
|
Subsidiary |
|
Purchase |
|
|
250,851
(Note 5) |
|
|
|
— |
|
|
90 days |
|
|
— |
|
|
|
— |
|
|
|
(92,788
(Note 5) |
)
|
|
|
— |
|
|
|
|
|
Taiwan International Standard Electronics Co., Ltd. |
|
Equity-method investee |
|
Purchase |
|
|
373,766 |
|
|
|
— |
|
|
30-90 days |
|
|
— |
|
|
|
— |
|
|
|
(247,779 |
) |
|
|
(2 |
) |
|
|
|
|
CHIEF Telecom Inc. |
|
Subsidiary |
|
Purchase |
|
|
237,660
(Note 5) |
|
|
|
— |
|
|
30 days |
|
|
— |
|
|
|
— |
|
|
|
(44,908
(Note 5) |
)
|
|
|
— |
|
| 1 |
|
Senao International Co., Ltd. |
|
Chunghwa Telecom Co., Ltd. |
|
Parent company |
|
Sales |
|
|
9,633,846
(Note 5) |
|
|
|
29.9 |
|
|
30-90 days |
|
|
— |
|
|
|
— |
|
|
|
1,348,241
(Note 5) |
|
|
|
68 |
|
|
|
|
|
|
|
|
|
Purchase |
|
|
112,606
(Note 5) |
|
|
|
0.4 |
|
|
30 days |
|
|
— |
|
|
|
— |
|
|
|
(2,782
(Note 5) |
)
|
|
|
— |
|
| 3 |
|
Chunghwa System Integration Co., Ltd. |
|
Chunghwa Telecom Co., Ltd. |
|
Parent company |
|
Sales |
|
|
1,513,737
(Note 5) |
|
|
|
77.0 |
|
|
30 days |
|
|
— |
|
|
|
— |
|
|
|
418,691
(Note 5) |
|
|
|
22 |
|
| Note 1: |
Purchase included acquisition of services cost. |
| Note 2: |
The differences were because Chunghwa Telecom Co., Ltd. and subsidiaries classified the amount as inventories, property, plant and equipment, intangible assets, and operating expenses. |
| Note 3: |
Notes and accounts receivable did not include the amount as amounts collected for others and other receivables. |
| Note 4: |
Transaction terms with the related parties were determined in accordance with mutual agreements when there were no similar transactions with third parties. Other transactions with related parties were not significantly
different from those with third parties. |
| Note 5: |
The amount was eliminated upon consolidation. |
102
TABLE 5
CHUNGHWA TELECOM CO., LTD. AND SUBSIDIARIES
RECEIVABLES FROM RELATED PARTIES AMOUNTING TO AT LEAST NT$100 MILLION OR 20% OF THE PAID-IN CAPITAL
SEPTEMBER 30, 2013
(Amounts in Thousands of New Taiwan
Dollars)
|
|
|
|
|
|
|
|
|
|
|
|
|
|
|
|
|
|
|
|
|
|
|
|
|
|
|
|
|
| No. |
|
Company Name |
|
Related Party |
|
Nature of Relationship |
|
Ending Balance |
|
|
Turnover
Rate |
|
Overdue |
|
|
Amounts Received
in Subsequent
Period |
|
|
Allowance for
Bad Debts |
|
| |
|
|
|
|
|
Amounts |
|
|
Action Taken |
|
|
|
|
|
|
|
|
|
|
|
|
|
| 0 |
|
Chunghwa Telecom Co., Ltd. |
|
Senao International Co., Ltd. |
|
Subsidiary |
|
$
|
169,318
(Note 2) |
|
|
17.56 |
|
$ |
— |
|
|
|
— |
|
|
$ |
894 |
|
|
$ |
— |
|
| 1 |
|
Senao International Co., Ltd. |
|
Chunghwa Telecom Co., Ltd. |
|
Parent company |
|
|
1,916,241
(Note 2) |
|
|
9.6 |
|
|
— |
|
|
|
— |
|
|
|
170,370 |
|
|
|
— |
|
| 3 |
|
Chunghwa System Integration Co., Ltd. |
|
Chunghwa Telecom Co., Ltd. |
|
Parent company |
|
|
418,691
(Note 2) |
|
|
5.42 |
|
|
— |
|
|
|
— |
|
|
|
290,485 |
|
|
|
— |
|
| 4 |
|
Chunghwa International Yellow Pages Co., Ltd. |
|
Chunghwa Telecom Co., Ltd. |
|
Parent company |
|
|
101,863
(Note 2) |
|
|
4.33 |
|
|
— |
|
|
|
— |
|
|
|
56,488 |
|
|
|
— |
|
| 36 |
|
Honghwa Human Resources Co., Ltd. |
|
Chunghwa Telecom Co., Ltd. |
|
Parent company |
|
|
134,629
(Note 2) |
|
|
5.44 |
|
|
— |
|
|
|
— |
|
|
|
50,453 |
|
|
|
— |
|
| Note 1: |
Payments and receipts collected in trust for others are excluded from the accounts receivable for calculating the turnover rate. |
| Note 2: |
The amount was eliminated upon consolidation. |
103
TABLE 6
CHUNGHWA TELECOM CO., LTD. AND SUBSIDIARIES
NAMES,
LOCATIONS, AND OTHER INFORMATION OF INVESTEES IN WHICH THE COMPANY EXERCISES SIGNIFICANT INFLUENCE
NINE MONTHS ENDED SEPTEMBER 30, 2013
(Amounts in Thousands of New Taiwan Dollars, Unless Otherwise Specified)
|
|
|
|
|
|
|
|
|
|
|
|
|
|
|
|
|
|
|
|
|
|
|
|
|
|
|
|
|
|
|
|
|
|
|
|
|
|
|
| No. |
|
Investor
Company |
|
Investee
Company |
|
Location |
|
Main Businesses
and Products |
|
Original Investment Amount |
|
|
Balance as of September 30, 2013 |
|
|
Net
Income
(Loss)
of the
Investee |
|
|
Recognized
Gain
(Loss)
(Notes 1
and 2) |
|
|
Note |
| |
|
|
|
|
September 30,
2013 |
|
|
December 31,
2012 |
|
|
Shares
(Thousands) |
|
|
Percentage
of
Ownership
(%) |
|
|
Carrying
Value |
|
|
|
|
|
|
|
|
|
|
|
|
|
|
|
|
|
| 0 |
|
Chunghwa Telecom Co., Ltd. |
|
Senao International Co., Ltd. |
|
Taiwan |
|
Selling and maintaining mobile phones and its peripheral products |
|
$ |
1,065,813 |
|
|
$ |
1,065,813 |
|
|
|
71,773 |
|
|
|
28 |
|
|
$ |
1,653,149 |
|
|
$ |
1,163,470 |
|
|
$ |
319,675 |
|
|
Subsidiary (Note 4) |
|
|
|
|
Light Era Development Co., Ltd. |
|
Taiwan |
|
Housing, office building development, rent and sale services |
|
|
3,000,000 |
|
|
|
3,000,000 |
|
|
|
300,000 |
|
|
|
100 |
|
|
|
3,797,339 |
|
|
|
12,085 |
|
|
|
12,029 |
|
|
Subsidiary (Note 4) |
|
|
|
|
Donghwa Telecom Co., Ltd. |
|
Hong Kong |
|
International telecommunications IP fictitious internet and internet transfer services |
|
|
1,461,361 |
|
|
|
1,195,518 |
|
|
|
374,510 |
|
|
|
100 |
|
|
|
1,441,438 |
|
|
|
(11,928 |
) |
|
|
(11,928 |
) |
|
Subsidiary (Note 4) |
|
|
|
|
Chunghwa Telecom Singapore Pte., Ltd. |
|
Singapore |
|
International telecommunications IP fictitious internet and internet transfer services |
|
|
574,112 |
|
|
|
574,112 |
|
|
|
26,383 |
|
|
|
100 |
|
|
|
856,109 |
|
|
|
137,873 |
|
|
|
137,873 |
|
|
Subsidiary (Note 4) |
|
|
|
|
Chunghwa System Integration Co., Ltd. |
|
Taiwan |
|
Providing communication and information aggregative services |
|
|
838,506 |
|
|
|
838,506 |
|
|
|
60,000 |
|
|
|
100 |
|
|
|
702,189 |
|
|
|
37,631 |
|
|
|
46,448 |
|
|
Subsidiary (Note 4) |
|
|
|
|
Chunghwa Investment Co., Ltd. |
|
Taiwan |
|
Investment |
|
|
639,559 |
|
|
|
759,709 |
|
|
|
68,085 |
|
|
|
89 |
|
|
|
475,238 |
|
|
|
2,183 |
|
|
|
(16,277 |
) |
|
Subsidiary (Note 4) |
|
|
|
|
CHIEF Telecom Inc. |
|
Taiwan |
|
Internet communication and internet data center (“IDC”) service |
|
|
482,165 |
|
|
|
482,165 |
|
|
|
37,942 |
|
|
|
69 |
|
|
|
579,203 |
|
|
|
120,367 |
|
|
|
85,411 |
|
|
Subsidiary (Note 4) |
|
|
|
|
International Integrated System, Inc. |
|
Taiwan |
|
IT solution provider, IT application consultation, system integration and package solution |
|
|
283,500 |
|
|
|
283,500 |
|
|
|
22,498 |
|
|
|
33 |
|
|
|
273,914 |
|
|
|
5,537 |
|
|
|
3,101 |
|
|
Associate |
|
|
|
|
Viettel-CHT Co., Ltd. |
|
Vietnam |
|
IDC services |
|
|
288,327 |
|
|
|
288,327 |
|
|
|
— |
|
|
|
30 |
|
|
|
271,259 |
|
|
|
34,806 |
|
|
|
10,447 |
|
|
Associate |
|
|
|
|
Huada Digital Corporation |
|
Taiwan |
|
Providing software service |
|
|
250,000 |
|
|
|
250,000 |
|
|
|
25,000 |
|
|
|
50 |
|
|
|
232,343 |
|
|
|
(17,932 |
) |
|
|
(8,966 |
) |
|
Jointly controlled entity |
(Continued)
104
|
|
|
|
|
|
|
|
|
|
|
|
|
|
|
|
|
|
|
|
|
|
|
|
|
|
|
|
|
|
|
|
|
|
|
|
|
|
|
| No. |
|
Investor
Company |
|
Investee
Company |
|
Location |
|
Main Businesses
and Products |
|
Original Investment Amount |
|
|
Balance as of September 30, 2013 |
|
|
Net
Income
(Loss)
of the
Investee |
|
|
Recognized
Gain
(Loss)
(Notes 1
and 2) |
|
|
Note |
| |
|
|
|
|
September 30,
2013 |
|
|
December 31,
2012 |
|
|
Shares
(Thousands) |
|
|
Percentage
of
Ownership
(%) |
|
|
Carrying
Value |
|
|
|
|
|
|
|
|
|
|
|
|
|
|
|
|
|
|
|
|
|
Taiwan International Standard Electronics Co., Ltd. |
|
Taiwan |
|
Manufacturing, selling, designing, and maintaining of telecommunications systems and equipment |
|
|
164,000 |
|
|
|
164,000 |
|
|
|
1,760 |
|
|
|
40 |
|
|
|
122,482 |
|
|
|
673,306 |
|
|
|
217,144 |
|
|
Associate |
|
|
|
|
Chunghwa International Yellow Pages Co., Ltd. |
|
Taiwan |
|
Yellow pages sales and advertisement services |
|
|
150,000 |
|
|
|
150,000 |
|
|
|
15,000 |
|
|
|
100 |
|
|
|
174,706 |
|
|
|
12,204 |
|
|
|
12,204 |
|
|
Subsidiary (Note 4) |
|
|
|
|
Honghwa Human Resources Co., Ltd. |
|
Taiwan |
|
Human Resources Service |
|
|
180,000 |
|
|
|
— |
|
|
|
18,000 |
|
|
|
100 |
|
|
|
193,085 |
|
|
|
13,085 |
|
|
|
13,085 |
|
|
Subsidiary (Note 4) |
|
|
|
|
Prime Asia Investments Group Ltd. (B.V.I.) |
|
British Virgin Islands |
|
Investment |
|
|
215,020 |
|
|
|
215,020 |
|
|
|
1 |
|
|
|
100 |
|
|
|
128,729 |
|
|
|
(31,677 |
) |
|
|
(31,628 |
) |
|
Subsidiary (Note 4) |
|
|
|
|
Skysoft Co., Ltd. |
|
Taiwan |
|
Providing of music on-line, software, electronic information, and advertisement services |
|
|
67,025 |
|
|
|
67,025 |
|
|
|
4,438 |
|
|
|
30 |
|
|
|
143,383 |
|
|
|
172,482 |
|
|
|
52,790 |
|
|
Associate |
|
|
|
|
Spring House Entertainment Tech. Inc. |
|
Taiwan |
|
Network services, producing digital entertainment contents and broadband visual sound terrace development |
|
|
62,209 |
|
|
|
62,209 |
|
|
|
7,015 |
|
|
|
56 |
|
|
|
132,062 |
|
|
|
74,763 |
|
|
|
42,944 |
|
|
Subsidiary (Note 4) |
|
|
|
|
Chunghwa Telecom Global, Inc. |
|
United States |
|
International data and internet services and long distance call wholesales to carriers |
|
|
70,429 |
|
|
|
70,429 |
|
|
|
6,000 |
|
|
|
100 |
|
|
|
115,421 |
|
|
|
15,201 |
|
|
|
16,892 |
|
|
Subsidiary (Note 4) |
|
|
|
|
KingWay Technology Co., Ltd. |
|
Taiwan |
|
Publishing books, data processing and software services |
|
|
71,770 |
|
|
|
71,770 |
|
|
|
2,879 |
|
|
|
33 |
|
|
|
68,201 |
|
|
|
1,935 |
|
|
|
606 |
|
|
Associate |
|
|
|
|
Chunghwa Telecom Vietnam Co., Ltd. |
|
Vietnam |
|
Information and communications technology, international circuit, and intelligent energy network service |
|
|
103,027 |
|
|
|
73,157 |
|
|
|
— |
|
|
|
100 |
|
|
|
78,701 |
|
|
|
(4,938 |
) |
|
|
(4,938 |
) |
|
Subsidiary (Note 4) |
|
|
|
|
Smartfun Digital Co., Ltd. |
|
Taiwan |
|
Software retail |
|
|
65,000 |
|
|
|
65,000 |
|
|
|
6,500 |
|
|
|
65 |
|
|
|
44,079 |
|
|
|
(799 |
) |
|
|
(470 |
) |
|
Subsidiary (Note 4) |
|
|
|
|
So-net Entertainment Taiwan |
|
Taiwan |
|
Online service and sale of computer hardware |
|
|
120,008 |
|
|
|
60,008 |
|
|
|
9,429 |
|
|
|
30 |
|
|
|
89,318 |
|
|
|
(172,482 |
) |
|
|
(52,790 |
) |
|
Associate |
(Continued)
105
|
|
|
|
|
|
|
|
|
|
|
|
|
|
|
|
|
|
|
|
|
|
|
|
|
|
|
|
|
|
|
|
|
|
|
|
|
|
|
| No. |
|
Investor
Company |
|
Investee
Company |
|
Location |
|
Main Businesses
and Products |
|
Original Investment Amount |
|
|
Balance as of September 30, 2013 |
|
|
Net
Income
(Loss)
of the
Investee |
|
|
Recognized
Gain
(Loss)
(Notes 1
and 2) |
|
|
Note |
| |
|
|
|
|
September 30,
2013 |
|
|
December 31,
2012 |
|
|
Shares
(Thousands) |
|
|
Percentage
of
Ownership
(%) |
|
|
Carrying
Value |
|
|
|
|
|
|
|
|
|
|
|
|
|
|
|
|
|
|
|
|
|
Chunghwa Telecom Japan Co., Ltd. |
|
Japan |
|
International telecom-munications IP fictitious internet and internet transfer services |
|
|
17,291 |
|
|
|
17,291 |
|
|
|
1 |
|
|
|
100 |
|
|
|
26,111 |
|
|
|
3,101 |
|
|
|
3,101 |
|
|
Subsidiary (Note 4) |
|
|
|
|
Dian Zuan Integrating Marketing Co., Ltd. |
|
Taiwan |
|
Information technology service and general advertisement service |
|
|
48,113 |
|
|
|
64,500 |
|
|
|
452 |
|
|
|
13 |
|
|
|
2,874 |
|
|
|
(12,189 |
) |
|
|
(3,256 |
) |
|
Associate |
|
|
|
|
Chunghwa Sochamp Technology Inc. |
|
Taiwan |
|
License plate recognition system |
|
|
20,400 |
|
|
|
20,400 |
|
|
|
2,040 |
|
|
|
51 |
|
|
|
13,497 |
|
|
|
(11,305 |
) |
|
|
(3,917 |
) |
|
Subsidiary (Note 4) |
|
|
|
|
New Prospect Investments Holdings Ltd. (B.V.I.) |
|
British Virgin Islands |
|
Investment |
|
$ |
— |
|
|
$ |
— |
|
|
|
— |
|
|
|
100 |
|
|
$ |
— |
|
|
$ |
— |
|
|
$ |
— |
|
|
Subsidiary (Notes 3 and 4) |
| 1 |
|
Senao International Co., Ltd. |
|
Senao Networks, Inc. |
|
Taiwan |
|
Telecommunication facilities manufactures and sales |
|
|
206,190 |
|
|
|
206,190 |
|
|
|
16,824 |
|
|
|
40 |
|
|
|
468,379 |
|
|
|
304,677 |
|
|
|
124,673 |
|
|
Associate |
|
|
|
|
Senao International (Samoa) Holding Ltd. |
|
Samoa Islands |
|
International investment. |
|
(US$ |
1,626,745
54,975 |
) |
|
(US$ |
988,597
33,475 |
) |
|
|
54,975 |
|
|
|
100 |
|
|
|
852,433 |
|
|
|
(349,150 |
) |
|
|
(350,893 |
) |
|
Subsidiary (Note 4) |
| 2 |
|
CHIEF Telecom Inc. |
|
Unigate Telecom Inc. |
|
Taiwan |
|
Telecommunication and internet service. |
|
|
2,000 |
|
|
|
2,000 |
|
|
|
200 |
|
|
|
100 |
|
|
|
1,570 |
|
|
|
(99 |
) |
|
|
(99 |
) |
|
Subsidiary (Note 4) |
|
|
|
|
|
|
|
|
|
|
|
|
|
|
|
|
|
Chief International Corp. |
|
Samoa Islands |
|
Investment |
|
(US$ |
6,068
200 |
) |
|
(US$ |
6,068
200 |
) |
|
|
200 |
|
|
|
100 |
|
|
|
17,943 |
|
|
|
3,468 |
|
|
|
3,468 |
|
|
Subsidiary (Note 4) |
| 3 |
|
Chunghwa System Integrated Co., Ltd. |
|
Concord Technology Co., Ltd. |
|
Brunei |
|
Investment |
|
(US$ |
47,321
1,500 |
) |
|
(US$ |
47,321
1,500 |
) |
|
|
1,500 |
|
|
|
100 |
|
|
|
19,931 |
|
|
|
(437 |
) |
|
|
(437 |
) |
|
Subsidiary (Note 4) |
| 7 |
|
Spring House Entertainment Tech. Inc. |
|
Ceylon Innovation Co., Ltd. |
|
Taiwan |
|
International trading, general advertisement and book publishment service |
|
|
10,000 |
|
|
|
1,000 |
|
|
|
— |
|
|
|
100 |
|
|
|
9,624 |
|
|
|
(289 |
) |
|
|
(289 |
) |
|
Subsidiary (Note 4) |
| 8 |
|
Light Era Development Co., Ltd. |
|
Yao Yong Real Property Co., Ltd. |
|
Taiwan |
|
Real estate trading and leasing business |
|
|
2,793,667 |
|
|
|
2,793,667 |
|
|
|
83,290 |
|
|
|
100 |
|
|
|
2,699,017 |
|
|
|
38,271 |
|
|
|
26,091 |
|
|
Subsidiary (Note 4) |
| 9 |
|
Chunghwa Telecom Singapore Pte., Ltd. |
|
ST-2 Satellite Ventures Pte., Ltd. |
|
Singapore |
|
Operation of ST-2 telecommunication satellite |
|
(SGD |
409,061
18,102 |
) |
|
(SGD |
409,061
18,102 |
) |
|
|
18,102 |
|
|
|
38 |
|
|
|
663,852 |
|
|
|
261,929 |
|
|
|
130,123 |
|
|
Associate |
(Continued)
106
|
|
|
|
|
|
|
|
|
|
|
|
|
|
|
|
|
|
|
|
|
|
|
|
|
|
|
|
|
|
|
|
|
|
|
|
|
|
|
| No. |
|
Investor
Company |
|
Investee
Company |
|
Location |
|
Main Businesses
and Products |
|
Original Investment Amount |
|
|
Balance as of September 30, 2013 |
|
|
Net
Income
(Loss)
of the
Investee |
|
|
Recognized
Gain
(Loss)
(Notes 1
and 2) |
|
|
Note |
| |
|
|
|
|
September 30,
2013 |
|
|
December 31,
2012 |
|
|
Shares
(Thousands) |
|
|
Percentage
of
Ownership
(%) |
|
|
Carrying
Value |
|
|
|
|
|
|
|
|
|
|
|
|
|
|
|
|
|
| 14 |
|
Chunghwa Investment Co., Ltd. |
|
Chunghwa Precision Test Tech Co., Ltd. |
|
Taiwan |
|
Semiconductor testing components and printed circuit board industry production and marketing of electronic products |
|
|
91,875 |
|
|
|
91,875 |
|
|
|
10,936 |
|
|
|
51 |
|
|
|
146,140 |
|
|
|
31,027 |
|
|
|
15,706 |
|
|
Subsidiary (Note 4) |
|
|
|
|
|
|
|
|
|
|
|
|
|
|
|
|
|
Chunghwa Investment Holding Co., Ltd. |
|
Brunei |
|
Investment |
|
(US$ |
46,035
1,432 |
) |
|
(US$ |
46,035
1,432 |
) |
|
|
1,432 |
|
|
|
100 |
|
|
|
17,137 |
|
|
|
(2,210 |
) |
|
|
(2,210 |
) |
|
Subsidiary (Note 4) |
|
|
|
|
Panda Monium Company Ltd. |
|
Cayman |
|
The production of animation |
|
(US$ |
20,000
602 |
) |
|
(US$ |
20,000
602 |
) |
|
|
602 |
|
|
|
43 |
|
|
|
— |
|
|
|
— |
|
|
|
— |
|
|
Associate |
|
|
|
|
CHIEF Telecom Inc. |
|
Taiwan |
|
Internet communication and internet data center (“IDC”) service |
|
|
20,000 |
|
|
|
20,000 |
|
|
|
2,000 |
|
|
|
4 |
|
|
|
27,559 |
|
|
|
120,367 |
|
|
|
4,405 |
|
|
Associate (Note 4) |
|
|
|
|
Senao International Co., Ltd. |
|
Taiwan |
|
Selling and maintaining mobile phones and its peripheral products |
|
|
49,731 |
|
|
|
49,731 |
|
|
|
1,001 |
|
|
|
— |
|
|
|
46,407 |
|
|
|
1,163,470 |
|
|
|
4,518 |
|
|
Associate (Note 4) |
| 18 |
|
Concord Technology Co., Ltd. |
|
Glory Network System Service (Shanghai) Co., Ltd. |
|
China |
|
Providing advanced business solutions to telecommunications |
|
(US$ |
47,321
1,500 |
) |
|
(US$ |
47,321
1,500 |
) |
|
|
— |
|
|
|
100 |
|
|
|
19,931 |
|
|
|
(437 |
) |
|
|
(437 |
) |
|
Subsidiary (Note 4) |
| 20 |
|
Chunghwa Precision Test Tech. Co., Ltd. |
|
Chunghwa Precision Test Tech. USA Corporation |
|
United States |
|
Semiconductor testing components and printed circuit board industry production and marketing of electronic products |
|
(US$ |
12,504
400 |
) |
|
(US$ |
12,504
400 |
) |
|
|
400 |
|
|
|
100 |
|
|
|
10,512 |
|
|
|
(193 |
) |
|
|
(193 |
) |
|
Subsidiary (Note 4) |
|
|
|
|
CHPT Japan Co., Ltd. |
|
Japan |
|
Sale and maintenance of electronic parts and machinery processed products, and design of printed circuit board |
|
(JPY |
2,008
6,000 |
) |
|
|
— |
|
|
|
600 |
|
|
|
100 |
|
|
|
1,880 |
|
|
|
68 |
|
|
|
68 |
|
|
Subsidiary (Note 4) |
|
|
|
|
Chunghwa Precision Test Tech. International Co., Ltd. |
|
Samoa Islands |
|
Wholesale electronic materials, electronic materials and general retail investment industry |
|
|
2,957 |
|
|
|
— |
|
|
|
100 |
|
|
|
100 |
|
|
|
2,957 |
|
|
|
— |
|
|
|
— |
|
|
Subsidiary (Note 4) |
| 22 |
|
Senao International (Samoa) Holding Ltd. |
|
Senao International HK Limited. |
|
Hong Kong |
|
International investment. |
|
(US$ |
1,604,334
54,260 |
) |
|
(US$
|
966,186
32,760 |
) |
|
|
54,280 |
|
|
|
100 |
|
|
|
826,744 |
|
|
|
(353,401 |
) |
|
|
(353,401 |
) |
|
Subsidiary (Note 4) |
|
|
|
|
HopeTech Technologies Limited |
|
Hong Kong |
|
Information technology and telecommunication products sales. |
|
(US$ |
21,177
675 |
) |
|
(US$ |
21,177
675 |
) |
|
|
5,240 |
|
|
|
45 |
|
|
|
26,985 |
|
|
|
9,510 |
|
|
|
4,279 |
|
|
Associate |
(Continued)
107
|
|
|
|
|
|
|
|
|
|
|
|
|
|
|
|
|
|
|
|
|
|
|
|
|
|
|
|
|
|
|
|
|
|
|
|
|
|
|
| No. |
|
Investor
Company |
|
Investee
Company |
|
Location |
|
Main Businesses
and Products |
|
Original Investment Amount |
|
|
Balance as of September 30, 2013 |
|
|
Net
Income
(Loss)
of the
Investee |
|
|
Recognized
Gain
(Loss)
(Notes 1
and 2) |
|
|
Note |
| |
|
|
|
|
September 30,
2013 |
|
|
December 31,
2012 |
|
|
Shares
(Thousands) |
|
|
Percentage
of
Ownership
(%) |
|
|
Carrying
Value |
|
|
|
|
|
|
|
|
|
|
|
|
|
|
|
|
|
| 24 |
|
Chunghwa Investment Holding Co., Ltd. |
|
CHI One Investment Co., Limited |
|
Hong Kong |
|
Investment |
|
(HK$ |
26,035
6,520 |
) |
|
(HK$ |
26,035
6,520 |
) |
|
|
6,520 |
|
|
|
100 |
|
|
|
10,159 |
|
|
|
(2,185 |
) |
|
|
(2,185 |
) |
|
Subsidiary (Note 4) |
| 26 |
|
CHI One Investment Co., Limited |
|
Xiamen Sertec Business Technology Co., Ltd. |
|
China |
|
Customer Services and platform rental activities |
|
$
(RMB |
25,414
5,390 |
) |
|
$
(RMB |
25,414
5,390 |
) |
|
|
— |
|
|
|
49 |
|
|
$ |
6,774 |
|
|
$ |
(4,462 |
) |
|
$ |
(2,186 |
) |
|
Associate |
| 23 |
|
Senao International HK Limited |
|
Senao Trading (Fujian) Co., Ltd. |
|
China |
|
Information technology and telecommunication products sales. |
|
(US$ |
709,528
24,000 |
) |
|
(US$ |
338,793
11,500 |
) |
|
|
— |
|
|
|
100 |
|
|
|
400,679 |
|
|
|
(162,772 |
) |
|
|
(162,772 |
) |
|
Subsidiary (Note 4) |
|
|
|
|
Senao International Trading (Shanghai) Co., Ltd. |
|
China |
|
Information technology and telecommunication products sales. |
|
(US$ |
535,459
18,000 |
) |
|
(US$ |
297,726
10,000 |
) |
|
|
— |
|
|
|
100 |
|
|
|
228,710 |
|
|
|
(141,200 |
) |
|
|
(141,200 |
) |
|
Subsidiary
(Note 4 and 5) |
|
|
|
|
Senao International Trading (Shanghai) Co., Ltd. |
|
China |
|
Information technology services and sale of communication products |
|
(US$ |
87,540
3,000 |
) |
|
(US$ |
57,860
2,000 |
) |
|
|
— |
|
|
|
100 |
|
|
|
80,568 |
|
|
|
(4,136 |
) |
|
|
(4,136 |
) |
|
Subsidiary
(Note 4 and 5) |
|
|
|
|
Senao International Trading (Jiangsu) Co., Ltd. |
|
China |
|
Information technology and telecommunication products sales. |
|
(US$ |
263,736
9,000 |
) |
|
(US$ |
263,736
9,000 |
) |
|
|
— |
|
|
|
100 |
|
|
|
116,171 |
|
|
|
(45,220 |
) |
|
|
(45,220 |
) |
|
Subsidiary (Note 4) |
| 27 |
|
Prime Asia Investments Group, Ltd. (B.V.I.) |
|
Chunghwa Hsingta Co., Ltd. |
|
China |
|
Investment |
|
(RMB |
215,019
47,373 |
) |
|
(RMB |
215,019
47,373 |
) |
|
|
1 |
|
|
|
100 |
|
|
|
128,799 |
|
|
|
(31,677 |
) |
|
|
(31,677 |
) |
|
Subsidiary (Note 4) |
| 29 |
|
Chunghwa Hsingta Company Ltd. |
|
Chunghwa Telecom (China) Co., Ltd. |
|
China |
|
Planning and design of energy conservation and software and hardware system services, and integration of information system |
|
(RMB |
177,176
39,376 |
) |
|
(RMB |
177,176
39,376 |
) |
|
|
— |
|
|
|
100 |
|
|
|
102,172 |
|
|
|
(24,399 |
) |
|
|
(24,399 |
) |
|
Subsidiary (Note 4) |
|
|
|
|
Jiangsu Zhenhua Information Technology Company, LLC |
|
China |
|
Intelligent energy conserving and intelligent building services |
|
(RMB |
28,912
6,072 |
) |
|
(RMB |
28,912
6,072 |
) |
|
|
— |
|
|
|
75 |
|
|
|
19,861 |
|
|
|
(6,849 |
) |
|
|
(5,136 |
) |
|
Subsidiary (Note 4) |
|
|
|
|
Hua-Xiong Information Technology Co., Ltd. |
|
China |
|
Intelligent system and energy saving system services in buildings |
|
(RMB |
8,931
1,925 |
) |
|
(RMB |
8,931
1,925 |
) |
|
|
— |
|
|
|
51 |
|
|
|
6,766 |
|
|
|
(4,202 |
) |
|
|
(2,142 |
) |
|
Subsidiary (Note 4) |
| Note 1: |
The equity in net income (loss) of investees was based on reviewed financial statements. |
| Note 2: |
The equity in net income (loss) of investees includes amortization of differences between the investment cost and net value and elimination of unrealized transactions. |
| Note 3: |
New Prospect Investments Holdings Ltd. (B.V.I.) was incorporated in March 2006, but have not yet begun operation as of September 30, 2013. |
| Note 4: |
The amount was eliminated upon consolidation. |
| Note 5: |
The English name is the same as the above entity; however, the Chinese names included in the respective Articles of Incorporations are different. |
(Concluded)
108
TABLE 7
CHUNGHWA TELECOM CO., LTD. AND SUBSIDIARIES
INVESTMENT IN MAINLAND CHINA
NINE MONTHS ENDED
SEPTEMBER 30, 2013
(Amounts in Thousands of New Taiwan Dollars, in Thousands of U.S. Dollars)
|
|
|
|
|
|
|
|
|
|
|
|
|
|
|
|
|
|
|
|
|
|
|
|
|
|
|
|
|
|
|
|
|
|
|
|
|
|
|
|
|
|
|
| Investee |
|
Main Businesses
and Products |
|
Total
Amount
of Paid-
in
Capital |
|
|
Investment
Type |
|
Accumulated
Outflow of
Investment
from Taiwan
as of
January 1,
2013 |
|
|
Investment
Flows |
|
|
Accumulated
Outflow of
Investment
from Taiwan
as of
September 30,
2013 |
|
|
%
Ownership
of Direct
or Indirect
Investment |
|
|
Investment
Gain
(Loss)
(Note 2) |
|
|
Carrying
Value as of
September 30,
2013 |
|
|
Accumulated
Inward
Remittance of
Earnings as of
September 30,
2013 |
|
|
Note |
| |
|
|
|
|
Outflow |
|
|
Inflow |
|
|
|
|
|
|
|
|
|
|
|
|
|
|
|
|
|
|
|
|
| Glory Network System Service (Shanghai) Co., Ltd. |
|
Providing advanced business solutions to telecommunications |
|
$ |
47,321 |
|
|
Note 2 |
|
$ |
47,321 |
|
|
$ |
— |
|
|
$ |
— |
|
|
$ |
47,321 |
|
|
|
100 |
|
|
$ |
(437 |
) |
|
$ |
19,931 |
|
|
$ |
— |
|
|
Note 7 |
|
|
|
|
|
|
|
|
|
|
|
|
|
| Xiamen Sertec Business Technology Co., Ltd. |
|
Customer services and platform rental activities |
|
|
51,552 |
|
|
Note 2 |
|
|
25,414 |
|
|
|
— |
|
|
|
— |
|
|
|
25,414 |
|
|
|
49 |
|
|
|
(2,186 |
) |
|
|
7,327 |
|
|
|
— |
|
|
Note 7 |
|
|
|
|
|
|
|
|
|
|
|
|
|
| Senao Trading (Fujian) Co., Ltd. |
|
Information technology services and sale of communication products |
|
|
709,528 |
|
|
Note 2 |
|
|
338,793 |
|
|
|
370,735 |
|
|
|
— |
|
|
|
709,528 |
|
|
|
100 |
|
|
|
(162,772 |
) |
|
|
400,679 |
|
|
|
— |
|
|
Note 7 |
|
|
|
|
|
|
|
|
|
|
|
|
|
| Senao International Trading (Shanghai) Co., Ltd. (Note 8) |
|
Information technology services and sale of communication products |
|
|
535,459 |
|
|
Note 2 |
|
|
297,726 |
|
|
|
237,733 |
|
|
|
— |
|
|
|
535,459 |
|
|
|
100 |
|
|
|
(141,200 |
) |
|
|
228,710 |
|
|
|
— |
|
|
Note 7 |
|
|
|
|
|
|
|
|
|
|
|
|
|
| Senao International Trading (Shanghai) Co., Ltd. (Note 8) |
|
Information technology services and sale of communication products |
|
|
87,540 |
|
|
Note 2 |
|
|
57,860 |
|
|
|
29,680 |
|
|
|
— |
|
|
|
87,540 |
|
|
|
100 |
|
|
|
(4,136 |
) |
|
|
80,568 |
|
|
|
— |
|
|
Note 7 |
|
|
|
|
|
|
|
|
|
|
|
|
|
| Senao International Trading (Jiangsu) Co., Ltd. |
|
Information technology services and sale of communication products |
|
|
263,736 |
|
|
Note 2 |
|
|
263,736 |
|
|
|
— |
|
|
|
— |
|
|
|
263,736 |
|
|
|
100 |
|
|
|
(45,220 |
) |
|
|
116,171 |
|
|
|
— |
|
|
Note 7 |
|
|
|
|
|
|
|
|
|
|
|
|
|
| Chunghwa Telecom (China) Co., Ltd. |
|
Energy conserving and providing installation, design and maintenance services |
|
|
177,176 |
|
|
Note 2 |
|
|
177,176 |
|
|
|
— |
|
|
|
— |
|
|
|
177,176 |
|
|
|
100 |
|
|
|
(24,399 |
) |
|
|
102,172 |
|
|
|
— |
|
|
Note 7 |
|
|
|
|
|
|
|
|
|
|
|
|
|
| Jiangsu Zhenghua Information Technology Company, LLC |
|
Intelligent energy serving and intelligent building services |
|
|
38,549 |
|
|
Note 2 |
|
|
28,912 |
|
|
|
— |
|
|
|
— |
|
|
|
28,912 |
|
|
|
75 |
|
|
|
(5,136 |
) |
|
|
19,861 |
|
|
|
— |
|
|
Note 7 |
|
|
|
|
|
|
|
|
|
|
|
|
|
| Hua-Xiong Information Technology Co., Ltd. |
|
Intelligent system and energy saving system services in buildings |
|
|
17,511 |
|
|
Note 2 |
|
|
8,931 |
|
|
|
— |
|
|
|
— |
|
|
|
8,931 |
|
|
|
51 |
|
|
|
(2,142 |
) |
|
|
6,766 |
|
|
|
— |
|
|
Note 7 |
(Continued)
109
|
|
|
|
|
|
|
|
|
|
|
|
|
| Investee |
|
Accumulated Investment in
Mainland China as of
September 30, 2013 |
|
|
Investment Amounts Authorized
by Investment Commission,
MOEA |
|
|
Upper Limit on Investment
Stipulated by Investment
Commission, MOEA |
|
|
|
|
|
| Glory Network System Service (Shanghai) Co., Ltd. (Note 3) |
|
$ |
47,321 |
|
|
$ |
47,321 |
|
|
$ |
405,879 |
|
|
|
|
|
| Xiamen Sertec Business Technology Co., Ltd. (Note 4) |
|
|
25,414 |
|
|
|
79,882 |
|
|
|
457,736 |
|
|
|
|
|
| Senao International Trading Co., Ltd. (Note 5) |
|
|
1,596,263 |
|
|
|
1,596,263 |
|
|
|
3,404,611 |
|
|
|
|
|
| Chunghwa Telecom (China) Co., Ltd. (Note 6) |
|
|
177,176 |
|
|
|
177,176 |
|
|
|
213,634,685 |
|
|
|
|
|
| Jiangsu Zhenghua Information Technology Company, LLC (Note 6) |
|
|
28,912 |
|
|
|
141,077 |
|
|
|
213,634,685 |
|
|
|
|
|
| Hua-Xiong Information Technology Co., Ltd. (Note 6) |
|
|
8,931 |
|
|
|
44,653 |
|
|
|
213,634,685 |
|
| Note 1: |
Investments were through a holding company registered in a third region. |
| Note 2: |
Recognition of investment gains (losses) was calculated based on the investee’s reviewed financial statements. |
| Note 3: |
The amount was calculated based on the net assets value of Chunghwa System Integration Co., Ltd. |
| Note 4: |
The amount was calculated based on the consolidated net assets value of Chunghwa Investment Co., Ltd. |
| Note 5: |
The amount was calculated based on the consolidated net assets value of Senao International Co., Ltd. |
| Note 6: |
The amount was calculated based on the consolidated net assets value of Chunghwa Telecom Co., Ltd. |
| Note 7: |
The amount was eliminated upon consolidation. |
| Note 8: |
The English name is the same as the above entity; however, the Chinese names included in the respective Articles of Incorporations are different. |
(Concluded)
110
TABLE 8
CHUNGHWA TELECOM CO., LTD. AND SUBSIDIARIES
INTERCOMPANY RELATIONSHIPS AND SIGNIFICANT TRANSACTIONS
NINE MONTHS ENDED SEPTEMBER 30, 2013
(Amounts in
Thousands of New Taiwan Dollars)
|
|
|
|
|
|
|
|
|
|
|
|
|
|
|
|
|
|
|
|
|
|
|
| Year |
|
No.
(Note 1) |
|
Company Name |
|
Related Party |
|
Nature of
Relationship
(Note 2) |
|
Transaction Details |
|
| |
|
|
|
|
Financial Statement Account |
|
Amount
(Note 5) |
|
|
Payment
Terms
(Note 3) |
|
|
% to
Total Sales or
Assets
(Note 4) |
|
|
|
|
|
|
|
|
|
|
| 2013 |
|
0 |
|
Chunghwa Telecom Co., Ltd. |
|
Senao International Co., Ltd. |
|
a |
|
Accounts receivable |
|
$ |
7,845 |
|
|
|
— |
|
|
|
— |
|
|
|
|
|
|
|
|
|
|
|
Accrued custodial receipts |
|
|
160,669 |
|
|
|
— |
|
|
|
— |
|
|
|
|
|
|
|
|
|
|
|
Accounts payable |
|
|
1,334,947 |
|
|
|
— |
|
|
|
— |
|
|
|
|
|
|
|
|
|
|
|
Amounts collected for others |
|
|
581,294 |
|
|
|
— |
|
|
|
— |
|
|
|
|
|
|
|
|
|
|
|
Revenues |
|
|
241,654 |
|
|
|
— |
|
|
|
— |
|
|
|
|
|
|
|
|
|
|
|
Non-operating income and gains |
|
|
981 |
|
|
|
— |
|
|
|
— |
|
|
|
|
|
|
|
|
|
|
|
Operating costs and expenses |
|
|
9,612,495 |
|
|
|
— |
|
|
|
4 |
|
|
|
|
|
|
|
|
|
|
|
Non-operating expense and losses |
|
|
9 |
|
|
|
|
|
|
|
|
|
|
|
|
|
|
|
|
|
|
|
Property, plant and equipment |
|
|
7,382 |
|
|
|
— |
|
|
|
— |
|
|
|
|
|
|
|
|
|
|
|
Customer’s deposits |
|
|
1,061 |
|
|
|
— |
|
|
|
— |
|
|
|
|
|
|
|
CHIEF Telecom Inc. |
|
a |
|
Accounts receivable |
|
|
29,038 |
|
|
|
— |
|
|
|
— |
|
|
|
|
|
|
|
|
|
|
|
Accounts payable |
|
|
44,908 |
|
|
|
— |
|
|
|
— |
|
|
|
|
|
|
|
|
|
|
|
Amounts collected for others |
|
|
3,254 |
|
|
|
— |
|
|
|
— |
|
|
|
|
|
|
|
|
|
|
|
Revenues |
|
|
186,366 |
|
|
|
— |
|
|
|
— |
|
|
|
|
|
|
|
|
|
|
|
Operating costs and expenses |
|
|
237,660 |
|
|
|
— |
|
|
|
— |
|
|
|
|
|
|
|
|
|
|
|
Customer’s deposits |
|
|
333 |
|
|
|
— |
|
|
|
— |
|
|
|
|
|
|
|
Chunghwa Precision Test Tech. Co., Ltd. |
|
a |
|
Accounts receivable |
|
|
38 |
|
|
|
— |
|
|
|
— |
|
|
|
|
|
|
|
|
|
|
|
Accounts payable |
|
|
1 |
|
|
|
— |
|
|
|
— |
|
|
|
|
|
|
|
|
|
|
|
Revenues |
|
|
1,784 |
|
|
|
— |
|
|
|
— |
|
|
|
|
|
|
|
|
|
|
|
Non-operating income and gains |
|
|
347 |
|
|
|
— |
|
|
|
— |
|
|
|
|
|
|
|
Chunghwa International Yellow Pages Co., Ltd. |
|
a |
|
Accounts receivable |
|
|
3,016 |
|
|
|
— |
|
|
|
— |
|
|
|
|
|
|
|
|
|
|
|
Accrued custodial payments |
|
|
6,642 |
|
|
|
— |
|
|
|
— |
|
|
|
|
|
|
|
|
|
|
|
Accounts payable |
|
|
12,713 |
|
|
|
— |
|
|
|
— |
|
|
|
|
|
|
|
|
|
|
|
Amounts collected for others |
|
|
92,834 |
|
|
|
— |
|
|
|
— |
|
|
|
|
|
|
|
|
|
|
|
Revenues |
|
|
20,263 |
|
|
|
— |
|
|
|
— |
|
|
|
|
|
|
|
|
|
|
|
Non-operating income and gains |
|
|
5 |
|
|
|
— |
|
|
|
— |
|
|
|
|
|
|
|
|
|
|
|
Operating costs and expenses |
|
|
37,513 |
|
|
|
— |
|
|
|
— |
|
|
|
|
|
|
|
Chunghwa System Integration Co., Ltd. |
|
a |
|
Accounts receivable |
|
|
8,585 |
|
|
|
— |
|
|
|
— |
|
|
|
|
|
|
|
|
|
|
|
Accrued custodial receipts |
|
|
2,583 |
|
|
|
— |
|
|
|
— |
|
|
|
|
|
|
|
|
|
|
|
Accounts payable |
|
|
418,691 |
|
|
|
— |
|
|
|
— |
|
|
|
|
|
|
|
|
|
|
|
Revenues |
|
|
15,595 |
|
|
|
— |
|
|
|
— |
|
|
|
|
|
|
|
|
|
|
|
Non-operating income and gains |
|
|
1,172 |
|
|
|
— |
|
|
|
— |
|
|
|
|
|
|
|
|
|
|
|
Operating costs and expenses |
|
|
594,448 |
|
|
|
— |
|
|
|
— |
|
|
|
|
|
|
|
|
|
|
|
Property, plant and equipment |
|
|
604,936 |
|
|
|
— |
|
|
|
— |
|
|
|
|
|
|
|
|
|
|
|
Office supplies |
|
|
762 |
|
|
|
— |
|
|
|
— |
|
|
|
|
|
|
|
|
|
|
|
Work in process |
|
|
91,359 |
|
|
|
— |
|
|
|
— |
|
(Continued)
111
|
|
|
|
|
|
|
|
|
|
|
|
|
|
|
|
|
|
|
|
|
|
|
| Year |
|
No.
(Note 1) |
|
Company Name |
|
Related Party |
|
Nature of
Relationship
(Note 2) |
|
Transaction Details |
|
| |
|
|
|
|
Financial Statement Account |
|
Amount
(Note 5) |
|
|
Payment
Terms
(Note 3) |
|
|
% to
Total Sales or
Assets
(Note 4) |
|
|
|
|
|
|
|
|
|
|
|
|
|
|
|
|
|
|
|
|
Spare parts |
|
$ |
19,973 |
|
|
|
— |
|
|
|
— |
|
|
|
|
|
|
|
|
|
|
|
Intangible assets |
|
|
257,545 |
|
|
|
— |
|
|
|
— |
|
|
|
|
|
|
|
|
|
|
|
Other deferred expenses |
|
|
11,795 |
|
|
|
— |
|
|
|
— |
|
|
|
|
|
|
|
|
|
|
|
Customer’s deposits |
|
|
14,508 |
|
|
|
— |
|
|
|
— |
|
|
|
|
|
|
|
Chunghwa Telecom Global Inc. |
|
a |
|
Accounts receivable |
|
|
16,060 |
|
|
|
— |
|
|
|
— |
|
|
|
|
|
|
|
|
|
|
|
Accounts payable |
|
|
92,788 |
|
|
|
— |
|
|
|
— |
|
|
|
|
|
|
|
|
|
|
|
Revenues |
|
|
34,403 |
|
|
|
— |
|
|
|
— |
|
|
|
|
|
|
|
|
|
|
|
Operating costs and expenses |
|
|
250,851 |
|
|
|
— |
|
|
|
— |
|
|
|
|
|
|
|
|
|
|
|
Customer’s deposits |
|
|
14,510 |
|
|
|
— |
|
|
|
— |
|
|
|
|
|
|
|
Donghwa Telecom Co., Ltd. |
|
a |
|
Accounts receivable |
|
|
60,259 |
|
|
|
— |
|
|
|
— |
|
|
|
|
|
|
|
|
|
|
|
Accounts payable |
|
|
81,481 |
|
|
|
— |
|
|
|
— |
|
|
|
|
|
|
|
|
|
|
|
Revenues |
|
|
105,818 |
|
|
|
— |
|
|
|
— |
|
|
|
|
|
|
|
|
|
|
|
Operating costs and expenses |
|
|
68,412 |
|
|
|
— |
|
|
|
— |
|
|
|
|
|
|
|
Spring House Entertainment Inc. |
|
a |
|
Accounts receivable |
|
|
4,382 |
|
|
|
— |
|
|
|
— |
|
|
|
|
|
|
|
|
|
|
|
Accounts payable |
|
|
9,135 |
|
|
|
— |
|
|
|
— |
|
|
|
|
|
|
|
|
|
|
|
Amounts collected for others |
|
|
43,423 |
|
|
|
— |
|
|
|
— |
|
|
|
|
|
|
|
|
|
|
|
Revenues |
|
|
47,745 |
|
|
|
— |
|
|
|
— |
|
|
|
|
|
|
|
|
|
|
|
Operating costs and expenses |
|
|
28,172 |
|
|
|
— |
|
|
|
— |
|
|
|
|
|
|
|
|
|
|
|
Customer’s deposits |
|
|
5 |
|
|
|
— |
|
|
|
— |
|
|
|
|
|
|
|
Chunghwa Telecom Japan Co., Ltd. |
|
a |
|
Accounts receivable |
|
|
1,940 |
|
|
|
— |
|
|
|
— |
|
|
|
|
|
|
|
|
|
|
|
Accounts payable |
|
|
9,703 |
|
|
|
— |
|
|
|
— |
|
|
|
|
|
|
|
|
|
|
|
Revenues |
|
|
16,513 |
|
|
|
— |
|
|
|
— |
|
|
|
|
|
|
|
|
|
|
|
Operating costs and expenses |
|
|
53,292 |
|
|
|
— |
|
|
|
— |
|
|
|
|
|
|
|
Light Era Development Co., Ltd. |
|
a |
|
Accounts receivable |
|
|
5 |
|
|
|
— |
|
|
|
— |
|
|
|
|
|
|
|
|
|
|
|
Accounts payable |
|
|
313 |
|
|
|
— |
|
|
|
— |
|
|
|
|
|
|
|
|
|
|
|
Revenues |
|
|
2,181 |
|
|
|
— |
|
|
|
— |
|
|
|
|
|
|
|
|
|
|
|
Work in process |
|
|
470 |
|
|
|
— |
|
|
|
— |
|
|
|
|
|
|
|
Chunghwa Telecom Singapore Pte., Ltd. |
|
a |
|
Accounts receivable |
|
|
5,444 |
|
|
|
— |
|
|
|
— |
|
|
|
|
|
|
|
|
|
|
|
Accounts payable |
|
|
3,813 |
|
|
|
— |
|
|
|
— |
|
|
|
|
|
|
|
|
|
|
|
Revenues |
|
|
46,567 |
|
|
|
— |
|
|
|
— |
|
|
|
|
|
|
|
|
|
|
|
Operating costs and expenses |
|
|
50,912 |
|
|
|
— |
|
|
|
— |
|
|
|
|
|
|
|
Chunghwa Investment Co., Ltd. |
|
a |
|
Revenues |
|
|
1,753 |
|
|
|
— |
|
|
|
— |
|
|
|
|
|
|
|
Chunghwa Telecom (China) Co., Ltd. |
|
a |
|
Accounts receivable |
|
|
586 |
|
|
|
— |
|
|
|
— |
|
|
|
|
|
|
|
|
|
|
|
Accounts payable |
|
|
770 |
|
|
|
— |
|
|
|
— |
|
|
|
|
|
|
|
|
|
|
|
Revenues |
|
|
150 |
|
|
|
— |
|
|
|
— |
|
|
|
|
|
|
|
|
|
|
|
Operating costs and expenses |
|
|
7,014 |
|
|
|
— |
|
|
|
— |
|
|
|
|
|
|
|
Smartfun Digital Co., Ltd. |
|
a |
|
Accounts receivable |
|
|
1,204 |
|
|
|
— |
|
|
|
— |
|
|
|
|
|
|
|
|
|
|
|
Accounts payable |
|
|
810 |
|
|
|
— |
|
|
|
— |
|
|
|
|
|
|
|
|
|
|
|
Amounts collected for others |
|
|
2,244 |
|
|
|
— |
|
|
|
— |
|
|
|
|
|
|
|
|
|
|
|
Revenues |
|
|
1,941 |
|
|
|
— |
|
|
|
— |
|
|
|
|
|
|
|
|
|
|
|
Non-operating income and gains |
|
|
182 |
|
|
|
— |
|
|
|
— |
|
|
|
|
|
|
|
|
|
|
|
Operating costs and expenses |
|
|
3,869 |
|
|
|
— |
|
|
|
— |
|
|
|
|
|
|
|
|
|
|
|
Customer’s deposits |
|
|
20 |
|
|
|
— |
|
|
|
— |
|
|
|
|
|
|
|
Chunghwa Telecom Vietnam Co., Ltd. |
|
a |
|
Accounts receivable |
|
|
2 |
|
|
|
— |
|
|
|
— |
|
|
|
|
|
|
|
|
|
|
|
Accounts payable |
|
|
148 |
|
|
|
— |
|
|
|
— |
|
|
|
|
|
|
|
|
|
|
|
Revenues |
|
|
35 |
|
|
|
— |
|
|
|
— |
|
|
|
|
|
|
|
|
|
|
|
Operating costs and expenses |
|
|
3,888 |
|
|
|
— |
|
|
|
— |
|
(Continued)
112
|
|
|
|
|
|
|
|
|
|
|
|
|
|
|
|
|
|
|
|
|
|
|
| Year |
|
No.
(Note 1) |
|
Company Name |
|
Related Party |
|
Nature of
Relationship
(Note 2) |
|
Transaction Details |
|
| |
|
|
|
|
Financial Statement Account |
|
Amount
(Note 5) |
|
|
Payment
Terms
(Note 3) |
|
|
% to
Total Sales or
Assets
(Note 4) |
|
|
|
|
|
|
|
|
|
|
|
|
|
|
|
|
Chunghwa Sochamp Technology Inc. |
|
a |
|
Accounts payable |
|
$ |
7,128 |
|
|
|
— |
|
|
|
— |
|
|
|
|
|
|
|
|
|
|
|
Revenues |
|
|
279 |
|
|
|
— |
|
|
|
— |
|
|
|
|
|
|
|
|
|
|
|
Operating costs and expenses |
|
|
4,027 |
|
|
|
— |
|
|
|
— |
|
|
|
|
|
|
|
|
|
|
|
Work in process |
|
|
45,415 |
|
|
|
— |
|
|
|
— |
|
|
|
|
|
|
|
|
|
|
|
Customer’s deposits |
|
|
95 |
|
|
|
— |
|
|
|
— |
|
|
|
|
|
|
|
Chief International Corp |
|
a |
|
Accounts receivable |
|
|
7,864 |
|
|
|
— |
|
|
|
— |
|
|
|
|
|
|
|
|
|
|
|
Accounts payable |
|
|
8,262 |
|
|
|
— |
|
|
|
— |
|
|
|
|
|
|
|
Honghwa Human Resources Co., Ltd. |
|
a |
|
Accounts payable |
|
|
134,647 |
|
|
|
— |
|
|
|
— |
|
|
|
|
|
|
|
|
|
|
|
Revenues |
|
|
424 |
|
|
|
— |
|
|
|
— |
|
|
|
|
|
|
|
|
|
|
|
Operating costs and expenses |
|
|
21,645 |
|
|
|
— |
|
|
|
— |
|
|
|
|
|
|
|
|
|
|
|
|
1 |
|
Senao International Co., Ltd. |
|
Chunghwa Telecom Co., Ltd. |
|
b |
|
Accounts receivable |
|
|
1,334,947 |
|
|
|
— |
|
|
|
— |
|
|
|
|
|
|
|
|
|
|
|
Other receivables |
|
|
581,294 |
|
|
|
— |
|
|
|
— |
|
|
|
|
|
|
|
|
|
|
|
Accounts payable |
|
|
7,827 |
|
|
|
— |
|
|
|
— |
|
|
|
|
|
|
|
|
|
|
|
Note payable |
|
|
18 |
|
|
|
— |
|
|
|
— |
|
|
|
|
|
|
|
|
|
|
|
Other payables |
|
|
160,669 |
|
|
|
— |
|
|
|
— |
|
|
|
|
|
|
|
|
|
|
|
Advances from customers |
|
|
14,027 |
|
|
|
— |
|
|
|
— |
|
|
|
|
|
|
|
|
|
|
|
Revenues |
|
|
9,633,846 |
|
|
|
— |
|
|
|
4 |
|
|
|
|
|
|
|
|
|
|
|
Non-operating income and gains |
|
|
67 |
|
|
|
— |
|
|
|
— |
|
|
|
|
|
|
|
|
|
|
|
Purchase |
|
|
112,606 |
|
|
|
— |
|
|
|
— |
|
|
|
|
|
|
|
|
|
|
|
Operating costs and expenses |
|
|
129,911 |
|
|
|
— |
|
|
|
— |
|
|
|
|
|
|
|
|
|
|
|
Non-operating expense and losses |
|
|
118 |
|
|
|
— |
|
|
|
— |
|
|
|
|
|
|
|
|
|
|
|
Refundable deposits |
|
|
1,061 |
|
|
|
— |
|
|
|
— |
|
|
|
|
|
|
|
CHIEF Telecom Inc. |
|
c |
|
Revenues |
|
|
296 |
|
|
|
— |
|
|
|
— |
|
|
|
|
|
|
|
Chunghwa System Integration Co., Ltd. |
|
c |
|
Revenues |
|
|
163 |
|
|
|
— |
|
|
|
— |
|
|
|
|
|
|
|
|
|
|
|
Operating costs and expenses |
|
|
7,671 |
|
|
|
— |
|
|
|
— |
|
|
|
|
|
|
|
Chunghwa International Yellow Pages Co., Ltd. |
|
c |
|
Revenues |
|
|
57 |
|
|
|
— |
|
|
|
— |
|
|
|
|
|
|
|
Spring House Entertainment Inc. |
|
c |
|
Revenues |
|
|
775 |
|
|
|
— |
|
|
|
— |
|
|
|
|
|
|
|
Light Era Development Co., Ltd. |
|
c |
|
Revenues |
|
|
76 |
|
|
|
— |
|
|
|
— |
|
|
|
|
|
|
|
Chunghwa Telecom (China) Co., Ltd. |
|
c |
|
Operating costs and expenses |
|
|
411 |
|
|
|
— |
|
|
|
— |
|
|
|
|
|
|
|
Smartfun Digital Co., Ltd. |
|
c |
|
Accounts payable |
|
|
1,050 |
|
|
|
— |
|
|
|
— |
|
|
|
|
|
|
|
|
|
|
|
Revenues |
|
|
522 |
|
|
|
— |
|
|
|
— |
|
|
|
|
|
|
|
|
|
|
|
|
2 |
|
CHIEF Telecom Inc. |
|
Chunghwa Telecom Co., Ltd. |
|
b |
|
Accounts receivable |
|
|
47,603 |
|
|
|
— |
|
|
|
— |
|
|
|
|
|
|
|
|
|
|
|
Prepaid expenses |
|
|
559 |
|
|
|
— |
|
|
|
— |
|
|
|
|
|
|
|
|
|
|
|
Accounts payable |
|
|
28,949 |
|
|
|
— |
|
|
|
— |
|
|
|
|
|
|
|
|
|
|
|
Advances from customers |
|
|
89 |
|
|
|
— |
|
|
|
— |
|
|
|
|
|
|
|
|
|
|
|
Revenues |
|
|
237,660 |
|
|
|
— |
|
|
|
— |
|
|
|
|
|
|
|
|
|
|
|
Operating costs and expenses |
|
|
186,366 |
|
|
|
— |
|
|
|
— |
|
|
|
|
|
|
|
|
|
|
|
Refundable deposits |
|
|
333 |
|
|
|
— |
|
|
|
— |
|
|
|
|
|
|
|
Senao International Co., Ltd. |
|
c |
|
Operating costs and expenses |
|
|
296 |
|
|
|
— |
|
|
|
— |
|
|
|
|
|
|
|
Chunghwa System Integration Co., Ltd. |
|
c |
|
Accounts receivable |
|
|
1 |
|
|
|
— |
|
|
|
— |
|
|
|
|
|
|
|
|
|
|
|
Revenues |
|
|
56 |
|
|
|
— |
|
|
|
— |
|
|
|
|
|
|
|
Chunghwa Telecom Singapore Pte., Ltd. |
|
c |
|
Accounts receivable |
|
|
2,030 |
|
|
|
— |
|
|
|
— |
|
|
|
|
|
|
|
|
|
|
|
Accounts payable |
|
|
553 |
|
|
|
— |
|
|
|
— |
|
|
|
|
|
|
|
|
|
|
|
Revenues |
|
|
9,374 |
|
|
|
— |
|
|
|
— |
|
|
|
|
|
|
|
|
|
|
|
Operating costs and expenses |
|
|
11,625 |
|
|
|
— |
|
|
|
— |
|
(Continued)
113
|
|
|
|
|
|
|
|
|
|
|
|
|
|
|
|
|
|
|
|
|
|
|
| Year |
|
No.
(Note 1) |
|
Company Name |
|
Related Party |
|
Nature of
Relationship
(Note 2) |
|
Transaction Details |
|
| |
|
|
|
|
Financial Statement Account |
|
Amount
(Note 5) |
|
|
Payment
Terms
(Note 3) |
|
|
% to
Total Sales or
Assets
(Note 4) |
|
|
|
|
|
|
|
|
|
|
|
|
|
|
|
|
Spring House Entertainment Inc. |
|
c |
|
Revenues |
|
$ |
1,077 |
|
|
|
— |
|
|
|
— |
|
|
|
|
|
|
|
Donghwa Telecom Co., Ltd. |
|
c |
|
Accounts receivable |
|
|
69 |
|
|
|
— |
|
|
|
— |
|
|
|
|
|
|
|
|
|
|
|
Revenues |
|
|
596 |
|
|
|
— |
|
|
|
— |
|
|
|
|
|
|
|
Chunghwa Telecom Japan Co., Ltd. |
|
c |
|
Operating costs and expenses |
|
|
413 |
|
|
|
— |
|
|
|
— |
|
|
|
|
|
|
|
Yao Yong Real Property Co., Ltd |
|
c |
|
Operating costs and expenses |
|
|
65,010 |
|
|
|
— |
|
|
|
— |
|
|
|
|
|
|
|
|
|
|
|
|
3 |
|
Chunghwa System Integration Co., Ltd. |
|
Chunghwa Telecom Co., Ltd. |
|
b |
|
Accounts receivable |
|
|
418,691 |
|
|
|
— |
|
|
|
— |
|
|
|
|
|
|
|
|
|
|
|
Accounts payable |
|
|
11,168 |
|
|
|
— |
|
|
|
— |
|
|
|
|
|
|
|
|
|
|
|
Deferred revenue |
|
|
67,081 |
|
|
|
— |
|
|
|
— |
|
|
|
|
|
|
|
|
|
|
|
Revenues |
|
|
1,513,737 |
|
|
|
— |
|
|
|
1 |
|
|
|
|
|
|
|
|
|
|
|
Operating costs and expenses |
|
|
16,767 |
|
|
|
— |
|
|
|
— |
|
|
|
|
|
|
|
|
|
|
|
Refundable deposits |
|
|
14,508 |
|
|
|
— |
|
|
|
— |
|
|
|
|
|
|
|
Senao International Co., Ltd. |
|
c |
|
Revenues |
|
|
7,671 |
|
|
|
— |
|
|
|
— |
|
|
|
|
|
|
|
|
|
|
|
Operating costs and expenses |
|
|
163 |
|
|
|
— |
|
|
|
— |
|
|
|
|
|
|
|
CHIEF Telecom Inc. |
|
c |
|
Accounts payable |
|
|
1 |
|
|
|
— |
|
|
|
— |
|
|
|
|
|
|
|
|
|
|
|
Operating costs and expenses |
|
|
56 |
|
|
|
— |
|
|
|
— |
|
|
|
|
|
|
|
Chunghwa International Yellow Pages Co., Ltd. |
|
c |
|
Revenues |
|
|
860 |
|
|
|
— |
|
|
|
— |
|
|
|
|
|
|
|
Spring House Entertainment Inc. |
|
c |
|
Revenues |
|
|
1,050 |
|
|
|
— |
|
|
|
— |
|
|
|
|
|
|
|
Light Era Development Co., Ltd. |
|
c |
|
Revenues |
|
|
151 |
|
|
|
— |
|
|
|
— |
|
|
|
|
|
|
|
Chunghwa Precision Test Tech. Co., Ltd. |
|
c |
|
Accounts receivable |
|
|
75 |
|
|
|
— |
|
|
|
— |
|
|
|
|
|
|
|
|
|
c |
|
Revenues |
|
|
1,144 |
|
|
|
— |
|
|
|
— |
|
|
|
|
|
|
|
Chunghwa Sochamp Technology Inc. |
|
c |
|
Revenues |
|
|
70 |
|
|
|
— |
|
|
|
— |
|
|
|
|
|
|
|
Honghwa Human Resources Co., Ltd. |
|
c |
|
Revenues |
|
|
281 |
|
|
|
— |
|
|
|
— |
|
|
|
|
|
|
|
|
|
|
|
|
4 |
|
Chunghwa International Yellow Pages Co., Ltd. |
|
Chunghwa Telecom Co., Ltd. |
|
b |
|
Accounts receivable |
|
|
9,028 |
|
|
|
— |
|
|
|
— |
|
|
|
|
|
|
|
|
|
|
|
Accrued custodial receipts |
|
|
92,834 |
|
|
|
— |
|
|
|
— |
|
|
|
|
|
|
|
|
|
|
|
Prepaid expenses |
|
|
3,685 |
|
|
|
— |
|
|
|
— |
|
|
|
|
|
|
|
|
|
|
|
Accounts payable |
|
|
2,247 |
|
|
|
— |
|
|
|
— |
|
|
|
|
|
|
|
|
|
|
|
Amounts collected for others |
|
|
6,642 |
|
|
|
— |
|
|
|
— |
|
|
|
|
|
|
|
|
|
|
|
Advances from customers |
|
|
769 |
|
|
|
— |
|
|
|
— |
|
|
|
|
|
|
|
|
|
|
|
Revenues |
|
|
37,513 |
|
|
|
— |
|
|
|
— |
|
|
|
|
|
|
|
|
|
|
|
Operating costs and expenses |
|
|
20,268 |
|
|
|
— |
|
|
|
— |
|
|
|
|
|
|
|
Senao International Co., Ltd. |
|
c |
|
Operating costs and expenses |
|
|
57 |
|
|
|
— |
|
|
|
— |
|
|
|
|
|
|
|
Chunghwa System Integration Co., Ltd. |
|
c |
|
Operating costs and expenses |
|
|
860 |
|
|
|
— |
|
|
|
— |
|
|
|
|
|
|
|
Light Era Development Co., Ltd. |
|
c |
|
Revenues |
|
|
271 |
|
|
|
— |
|
|
|
— |
|
|
|
|
|
|
|
|
|
|
|
|
5 |
|
Chunghwa Telecom Global, Inc. |
|
Chunghwa Telecom Co., Ltd. |
|
b |
|
Accounts receivable |
|
|
92,756 |
|
|
|
— |
|
|
|
— |
|
|
|
|
|
|
|
|
|
|
|
Prepaid expenses |
|
|
32 |
|
|
|
— |
|
|
|
— |
|
|
|
|
|
|
|
|
|
|
|
Accounts payable |
|
|
14,517 |
|
|
|
— |
|
|
|
— |
|
|
|
|
|
|
|
|
|
|
|
Advances from customers |
|
|
1,543 |
|
|
|
— |
|
|
|
— |
|
|
|
|
|
|
|
|
|
|
|
Revenues |
|
|
250,851 |
|
|
|
— |
|
|
|
— |
|
|
|
|
|
|
|
|
|
|
|
Operating costs and expenses |
|
|
34,403 |
|
|
|
— |
|
|
|
— |
|
|
|
|
|
|
|
|
|
|
|
Refundable deposits |
|
|
14,510 |
|
|
|
— |
|
|
|
— |
|
|
|
|
|
|
|
Donghwa Telecom Co., Ltd. |
|
c |
|
Accounts receivable |
|
|
270 |
|
|
|
— |
|
|
|
— |
|
|
|
|
|
|
|
|
|
|
|
Revenues |
|
|
2,443 |
|
|
|
— |
|
|
|
— |
|
(Continued)
114
|
|
|
|
|
|
|
|
|
|
|
|
|
|
|
|
|
|
|
|
|
|
|
| Year |
|
No.
(Note 1) |
|
Company Name |
|
Related Party |
|
Nature of
Relationship
(Note 2) |
|
Transaction Details |
|
| |
|
|
|
|
Financial Statement Account |
|
Amount
(Note 5) |
|
|
Payment
Terms
(Note 3) |
|
|
% to
Total Sales or
Assets
(Note 4) |
|
|
|
|
|
|
|
|
|
|
|
|
|
|
|
|
Chunghwa Telecom Singapore Pte., Ltd. |
|
c |
|
Accounts receivable |
|
$ |
4,290 |
|
|
|
— |
|
|
|
— |
|
|
|
|
|
|
|
|
|
|
|
Accounts payable |
|
|
2,987 |
|
|
|
— |
|
|
|
— |
|
|
|
|
|
|
|
|
|
|
|
Revenues |
|
|
4,925 |
|
|
|
— |
|
|
|
— |
|
|
|
|
|
|
|
|
|
|
|
Operating costs and expenses |
|
|
3,153 |
|
|
|
— |
|
|
|
— |
|
|
|
|
|
|
|
Chunghwa Precision Test Tech. Co., Ltd. |
|
c |
|
Accounts receivable |
|
|
68 |
|
|
|
— |
|
|
|
— |
|
|
|
|
|
|
|
|
|
|
|
Revenues |
|
|
312 |
|
|
|
— |
|
|
|
— |
|
|
|
|
|
|
|
|
|
|
|
|
6 |
|
Donghwa Telecom Co., Ltd. |
|
Chunghwa Telecom Co., Ltd. |
|
b |
|
Accounts receivable |
|
|
30,782 |
|
|
|
— |
|
|
|
— |
|
|
|
|
|
|
|
|
|
|
|
Prepaid expenses |
|
|
50,699 |
|
|
|
— |
|
|
|
— |
|
|
|
|
|
|
|
|
|
|
|
Accounts payable |
|
|
32,529 |
|
|
|
— |
|
|
|
— |
|
|
|
|
|
|
|
|
|
|
|
Advances from customers |
|
|
27,730 |
|
|
|
— |
|
|
|
— |
|
|
|
|
|
|
|
|
|
|
|
Revenues |
|
|
68,412 |
|
|
|
— |
|
|
|
— |
|
|
|
|
|
|
|
|
|
|
|
Operating costs and expenses |
|
|
105,818 |
|
|
|
— |
|
|
|
— |
|
|
|
|
|
|
|
CHIEF Telecom Inc. |
|
c |
|
Accounts payable |
|
|
69 |
|
|
|
— |
|
|
|
— |
|
|
|
|
|
|
|
|
|
|
|
Operating costs and expenses |
|
|
596 |
|
|
|
— |
|
|
|
— |
|
|
|
|
|
|
|
Chunghwa Telecom Global, Inc. |
|
c |
|
Accounts payable |
|
|
270 |
|
|
|
— |
|
|
|
— |
|
|
|
|
|
|
|
|
|
|
|
Operating costs and expenses |
|
|
2,443 |
|
|
|
— |
|
|
|
— |
|
|
|
|
|
|
|
Chunghwa Telecom Singapore Pte., Ltd. |
|
c |
|
Accounts payable |
|
|
2,066 |
|
|
|
— |
|
|
|
— |
|
|
|
|
|
|
|
|
|
|
|
Prepaid expenses |
|
|
21,778 |
|
|
|
— |
|
|
|
— |
|
|
|
|
|
|
|
|
|
|
|
Operating costs and expenses |
|
|
10,292 |
|
|
|
— |
|
|
|
— |
|
|
|
|
|
|
|
|
|
|
|
|
7 |
|
Spring House Entertainment Inc. |
|
Chunghwa Telecom Co., Ltd. |
|
b |
|
Accounts receivable |
|
|
9,099 |
|
|
|
— |
|
|
|
— |
|
|
|
|
|
|
|
|
|
|
|
Accrued custodial receipts |
|
|
43,423 |
|
|
|
— |
|
|
|
— |
|
|
|
|
|
|
|
|
|
|
|
Prepaid expenses |
|
|
36 |
|
|
|
— |
|
|
|
— |
|
|
|
|
|
|
|
|
|
|
|
Accounts payable |
|
|
4,382 |
|
|
|
— |
|
|
|
— |
|
|
|
|
|
|
|
|
|
|
|
Revenues |
|
|
28,172 |
|
|
|
— |
|
|
|
— |
|
|
|
|
|
|
|
|
|
|
|
Operating costs and expenses |
|
|
47,745 |
|
|
|
— |
|
|
|
— |
|
|
|
|
|
|
|
|
|
|
|
Refundable deposits |
|
|
5 |
|
|
|
— |
|
|
|
— |
|
|
|
|
|
|
|
Senao International Co., Ltd. |
|
c |
|
Operating costs and expenses |
|
|
775 |
|
|
|
— |
|
|
|
— |
|
|
|
|
|
|
|
CHIEF Telecom Inc. |
|
c |
|
Operating costs and expenses |
|
|
1,077 |
|
|
|
— |
|
|
|
— |
|
|
|
|
|
|
|
Chunghwa System Integration Co., Ltd. |
|
c |
|
Operating costs and expenses |
|
|
1,050 |
|
|
|
— |
|
|
|
— |
|
|
|
|
|
|
|
Smartfun Digital Co., Ltd. |
|
c |
|
Prepaid expenses |
|
|
4,275 |
|
|
|
— |
|
|
|
— |
|
|
|
|
|
|
|
|
|
|
|
Operating costs and expenses |
|
|
10,769 |
|
|
|
— |
|
|
|
— |
|
|
|
|
|
|
|
|
|
|
|
|
8 |
|
Light Era Development Co., Ltd. |
|
Chunghwa Telecom Co., Ltd. |
|
b |
|
Accounts receivable |
|
|
5 |
|
|
|
— |
|
|
|
— |
|
|
|
|
|
|
|
|
|
|
|
Prepaid expenses |
|
|
313 |
|
|
|
— |
|
|
|
— |
|
|
|
|
|
|
|
|
|
|
|
Deferred revenue |
|
|
60 |
|
|
|
— |
|
|
|
— |
|
|
|
|
|
|
|
|
|
|
|
Revenues |
|
|
410 |
|
|
|
— |
|
|
|
— |
|
|
|
|
|
|
|
|
|
|
|
Operating costs and expenses |
|
|
2,181 |
|
|
|
— |
|
|
|
— |
|
|
|
|
|
|
|
Senao International Co., Ltd. |
|
c |
|
Operating costs and expenses |
|
|
76 |
|
|
|
— |
|
|
|
— |
|
|
|
|
|
|
|
Chunghwa System Integration Co., Ltd. |
|
c |
|
Operating costs and expenses |
|
|
151 |
|
|
|
— |
|
|
|
— |
|
|
|
|
|
|
|
Chunghwa International Yellow Pages Co., Ltd. |
|
c |
|
Operating costs and expenses |
|
|
271 |
|
|
|
— |
|
|
|
— |
|
|
|
|
|
|
|
|
|
|
|
|
9 |
|
Chunghwa Telecom Singapore Pte., Ltd. |
|
Chunghwa Telecom Co., Ltd. |
|
b |
|
Accounts receivable |
|
|
3,767 |
|
|
|
— |
|
|
|
— |
|
|
|
|
|
|
|
|
|
|
|
Prepaid expenses |
|
|
46 |
|
|
|
— |
|
|
|
— |
|
|
|
|
|
|
|
|
|
|
|
Accounts payable |
|
|
5,444 |
|
|
|
— |
|
|
|
— |
|
(Continued)
115
|
|
|
|
|
|
|
|
|
|
|
|
|
|
|
|
|
|
|
|
|
|
|
| Year |
|
No.
(Note 1) |
|
Company Name |
|
Related Party |
|
Nature of
Relationship
(Note 2) |
|
Transaction Details |
|
| |
|
|
|
|
Financial Statement Account |
|
Amount
(Note 5) |
|
|
Payment
Terms
(Note 3) |
|
|
% to
Total Sales or
Assets
(Note 4) |
|
|
|
|
|
|
|
|
|
|
|
|
|
|
|
|
|
|
|
|
Revenues |
|
$ |
50,912 |
|
|
|
— |
|
|
|
— |
|
|
|
|
|
|
|
|
|
|
|
Operating costs and expenses |
|
|
46,567 |
|
|
|
— |
|
|
|
— |
|
|
|
|
|
|
|
CHIEF Telecom Inc. |
|
c |
|
Accounts receivable |
|
|
553 |
|
|
|
— |
|
|
|
— |
|
|
|
|
|
|
|
|
|
|
|
Accounts payable |
|
|
2,030 |
|
|
|
— |
|
|
|
— |
|
|
|
|
|
|
|
|
|
|
|
Revenues |
|
|
11,625 |
|
|
|
— |
|
|
|
— |
|
|
|
|
|
|
|
|
|
|
|
Operating costs and expenses |
|
|
9,374 |
|
|
|
— |
|
|
|
— |
|
|
|
|
|
|
|
Chunghwa Telecom Global, Inc. |
|
c |
|
Accounts receivable |
|
|
2,987 |
|
|
|
— |
|
|
|
— |
|
|
|
|
|
|
|
|
|
|
|
Accounts payable |
|
|
4,290 |
|
|
|
— |
|
|
|
— |
|
|
|
|
|
|
|
|
|
|
|
Revenues |
|
|
3,153 |
|
|
|
— |
|
|
|
— |
|
|
|
|
|
|
|
|
|
|
|
Operating costs and expenses |
|
|
4,925 |
|
|
|
— |
|
|
|
— |
|
|
|
|
|
|
|
Donghwa Telecom Co., Ltd. |
|
c |
|
Accounts receivable |
|
|
2,066 |
|
|
|
— |
|
|
|
— |
|
|
|
|
|
|
|
|
|
|
|
Advances from customers |
|
|
21,778 |
|
|
|
— |
|
|
|
— |
|
|
|
|
|
|
|
|
|
|
|
Revenues |
|
|
10,292 |
|
|
|
— |
|
|
|
— |
|
|
|
|
|
|
|
Chunghwa Telecom Japan Co., Ltd. |
|
c |
|
Accounts receivable |
|
|
761 |
|
|
|
— |
|
|
|
— |
|
|
|
|
|
|
|
|
|
|
|
Accounts payable |
|
|
394 |
|
|
|
— |
|
|
|
— |
|
|
|
|
|
|
|
|
|
|
|
Revenues |
|
|
10,012 |
|
|
|
— |
|
|
|
— |
|
|
|
|
|
|
|
|
|
|
|
Operating costs and expenses |
|
|
1,949 |
|
|
|
— |
|
|
|
— |
|
|
|
|
|
|
|
|
|
|
|
|
10 |
|
Chunghwa Telecom Japan Co., Ltd. |
|
Chunghwa Telecom Co., Ltd. |
|
b |
|
Accounts receivable |
|
|
9,563 |
|
|
|
— |
|
|
|
— |
|
|
|
|
|
|
|
|
|
|
|
Prepaid expenses |
|
|
140 |
|
|
|
— |
|
|
|
— |
|
|
|
|
|
|
|
|
|
|
|
Accounts payable |
|
|
1,429 |
|
|
|
— |
|
|
|
— |
|
|
|
|
|
|
|
|
|
|
|
Advances from customers |
|
|
511 |
|
|
|
— |
|
|
|
— |
|
|
|
|
|
|
|
|
|
|
|
Revenues |
|
|
53,292 |
|
|
|
— |
|
|
|
— |
|
|
|
|
|
|
|
|
|
|
|
Operating costs and expenses |
|
|
16,513 |
|
|
|
— |
|
|
|
— |
|
|
|
|
|
|
|
CHIEF Telecom Inc. |
|
c |
|
Revenues |
|
|
413 |
|
|
|
— |
|
|
|
— |
|
|
|
|
|
|
|
Chunghwa Telecom Singapore Pte., Ltd. |
|
c |
|
Accounts receivable |
|
|
394 |
|
|
|
— |
|
|
|
— |
|
|
|
|
|
|
|
|
|
|
|
Accounts payable |
|
|
761 |
|
|
|
— |
|
|
|
— |
|
|
|
|
|
|
|
|
|
|
|
Revenues |
|
|
1,949 |
|
|
|
— |
|
|
|
— |
|
|
|
|
|
|
|
|
|
|
|
Operating costs and expenses |
|
|
10,012 |
|
|
|
— |
|
|
|
— |
|
|
|
|
|
|
|
|
|
|
|
|
14 |
|
Chunghwa Investment Co., Ltd. |
|
Chunghwa Telecom Co., Ltd. |
|
b |
|
Operating costs and expenses |
|
|
1,753 |
|
|
|
— |
|
|
|
— |
|
|
|
|
|
|
|
|
|
|
|
|
20 |
|
Chunghwa Precision Test Tech. Co., Ltd. |
|
Chunghwa Telecom Co., Ltd. |
|
b |
|
Prepaid expenses |
|
|
1 |
|
|
|
— |
|
|
|
— |
|
|
|
|
|
|
|
|
|
|
|
Accounts payable |
|
|
38 |
|
|
|
— |
|
|
|
— |
|
|
|
|
|
|
|
|
|
|
|
Operating costs and expenses |
|
|
2,131 |
|
|
|
— |
|
|
|
— |
|
|
|
|
|
|
|
Chunghwa Telecom Global, Inc. |
|
c |
|
Accounts payable |
|
|
68 |
|
|
|
— |
|
|
|
— |
|
|
|
|
|
|
|
|
|
|
|
Operating costs and expenses |
|
|
312 |
|
|
|
— |
|
|
|
— |
|
|
|
|
|
|
|
Chunghwa System Integration Co., Ltd. |
|
c |
|
Accounts payable |
|
|
75 |
|
|
|
— |
|
|
|
— |
|
|
|
|
|
|
|
|
|
|
|
Operating costs and expenses |
|
|
1,144 |
|
|
|
— |
|
|
|
— |
|
|
|
|
|
|
|
|
|
|
|
|
|
|
|
|
|
|
— |
|
|
|
— |
|
|
|
|
|
|
|
|
|
|
|
|
25 |
|
Yao Yong Real Property Co., Ltd. |
|
CHIEF Telecom Inc. |
|
c |
|
Revenues |
|
|
65,010 |
|
|
|
— |
|
|
|
— |
|
|
|
|
|
|
|
|
|
|
|
|
30 |
|
Chunghwa Telecom (China) Co., Ltd. |
|
Chunghwa Telecom Co., Ltd. |
|
b |
|
Accounts receivable |
|
|
770 |
|
|
|
— |
|
|
|
— |
|
|
|
|
|
|
|
|
|
|
|
Accounts payable |
|
|
586 |
|
|
|
— |
|
|
|
— |
|
|
|
|
|
|
|
|
|
|
|
Revenues |
|
|
7,014 |
|
|
|
— |
|
|
|
— |
|
|
|
|
|
|
|
|
|
|
|
Operating costs and expenses |
|
|
150 |
|
|
|
— |
|
|
|
— |
|
(Continued)
116
|
|
|
|
|
|
|
|
|
|
|
|
|
|
|
|
|
|
|
|
|
|
|
| Year |
|
No.
(Note 1) |
|
Company Name |
|
Related Party |
|
Nature of
Relationship
(Note 2) |
|
Transaction Details |
|
| |
|
|
|
|
Financial Statement Account |
|
Amount
(Note 5) |
|
|
Payment
Terms
(Note 3) |
|
|
% to
Total Sales or
Assets
(Note 4) |
|
|
|
|
|
|
|
|
|
|
|
|
|
|
|
|
Senao International Co., Ltd. |
|
c |
|
Revenues |
|
$ |
411 |
|
|
|
— |
|
|
|
— |
|
|
|
|
|
|
|
Chunghwa Sochamp Technology Inc. |
|
c |
|
Accounts payable |
|
|
65 |
|
|
|
— |
|
|
|
— |
|
|
|
|
|
|
|
|
|
|
|
Operating costs and expenses |
|
|
130 |
|
|
|
— |
|
|
|
— |
|
|
|
|
|
|
|
|
|
|
|
|
31 |
|
Smartfun Digital Co., Ltd. |
|
Chunghwa Telecom Co., Ltd. |
|
b |
|
Accounts receivable |
|
|
810 |
|
|
|
— |
|
|
|
— |
|
|
|
|
|
|
|
|
|
|
|
Accrued custodial receipts |
|
|
2,244 |
|
|
|
— |
|
|
|
— |
|
|
|
|
|
|
|
|
|
|
|
Accounts payable |
|
|
305 |
|
|
|
— |
|
|
|
— |
|
|
|
|
|
|
|
|
|
|
|
Advances from customers |
|
|
899 |
|
|
|
— |
|
|
|
— |
|
|
|
|
|
|
|
|
|
|
|
Revenues |
|
|
3,869 |
|
|
|
— |
|
|
|
— |
|
|
|
|
|
|
|
|
|
|
|
Operating costs and expenses |
|
|
2,123 |
|
|
|
— |
|
|
|
— |
|
|
|
|
|
|
|
|
|
|
|
Refundable deposits |
|
|
20 |
|
|
|
— |
|
|
|
— |
|
|
|
|
|
|
|
Senao International Co., Ltd. |
|
c |
|
Accounts receivable |
|
|
1,050 |
|
|
|
— |
|
|
|
— |
|
|
|
|
|
|
|
Spring House Entertainment Inc. |
|
c |
|
Operating costs and expenses |
|
|
522 |
|
|
|
— |
|
|
|
— |
|
|
|
|
|
|
|
|
|
|
|
Advances from customers |
|
|
4,275 |
|
|
|
— |
|
|
|
— |
|
|
|
|
|
|
|
|
|
|
|
Revenues |
|
|
10,769 |
|
|
|
— |
|
|
|
— |
|
|
|
|
|
|
|
|
|
|
|
|
32 |
|
Chunghwa Telecom Vietnam Co., Ltd. |
|
Chunghwa Telecom Co., Ltd. |
|
b |
|
Accounts receivable |
|
|
148 |
|
|
|
— |
|
|
|
— |
|
|
|
|
|
|
|
|
|
|
|
Accounts payable |
|
|
2 |
|
|
|
— |
|
|
|
— |
|
|
|
|
|
|
|
|
|
|
|
Revenues |
|
|
3,888 |
|
|
|
— |
|
|
|
— |
|
|
|
|
|
|
|
|
|
|
|
Operating costs and expenses |
|
|
35 |
|
|
|
— |
|
|
|
— |
|
|
|
|
|
|
|
|
|
|
|
|
33 |
|
Chunghwa Sochamp Technology Inc. |
|
Chunghwa Telecom Co., Ltd. |
|
b |
|
Accounts receivable |
|
|
7,128 |
|
|
|
— |
|
|
|
— |
|
|
|
|
|
|
|
|
|
|
|
Advances from customers |
|
|
27,016 |
|
|
|
— |
|
|
|
— |
|
|
|
|
|
|
|
|
|
|
|
Revenues |
|
|
22,426 |
|
|
|
— |
|
|
|
— |
|
|
|
|
|
|
|
|
|
|
|
Operating costs and expenses |
|
|
279 |
|
|
|
— |
|
|
|
— |
|
|
|
|
|
|
|
|
|
|
|
Refundable deposits |
|
|
95 |
|
|
|
— |
|
|
|
— |
|
|
|
|
|
|
|
Chunghwa System Integration Co., Ltd. |
|
c |
|
Operating costs and expenses |
|
|
70 |
|
|
|
— |
|
|
|
— |
|
|
|
|
|
|
|
Chunghwa Telecom (China) Co., Ltd. |
|
c |
|
Accounts receivable |
|
|
65 |
|
|
|
— |
|
|
|
— |
|
|
|
|
|
|
|
|
|
|
|
Revenues |
|
|
130 |
|
|
|
— |
|
|
|
— |
|
|
|
|
|
|
|
|
|
|
|
|
35 |
|
Chief International Corp |
|
Chunghwa Telecom Co., Ltd. |
|
b |
|
Accounts receivable |
|
|
8,262 |
|
|
|
— |
|
|
|
— |
|
|
|
|
|
|
|
|
|
|
|
Accounts payable |
|
|
7,864 |
|
|
|
— |
|
|
|
— |
|
|
|
|
|
|
|
|
|
|
|
|
36 |
|
Honghwa Human Resources Co., Ltd. |
|
Chunghwa Telecom Co., Ltd. |
|
b |
|
Accounts receivable |
|
|
134,629 |
|
|
|
— |
|
|
|
— |
|
|
|
|
|
|
|
|
|
|
|
Prepaid expenses |
|
|
18 |
|
|
|
— |
|
|
|
— |
|
|
|
|
|
|
|
|
|
|
|
Revenues |
|
|
21,645 |
|
|
|
— |
|
|
|
— |
|
|
|
|
|
|
|
|
|
|
|
Operating costs and expenses |
|
|
424 |
|
|
|
— |
|
|
|
— |
|
|
|
|
|
|
|
Chunghwa System Integration Co., Ltd. |
|
c |
|
Operating costs and expenses |
|
|
281 |
|
|
|
— |
|
|
|
— |
|
| Note 1: |
Significant transactions between the Company and its subsidiaries or among subsidiaries are numbered as follows: |
| |
b. |
Subsidiaries are numbered from “1”. |
(Continued)
117
| Note 2: |
Related party transactions are divided into three categories as follows: |
| |
a. |
The Company to subsidiaries. |
| |
b. |
Subsidiaries to the Company. |
| |
c. |
Subsidiaries to subsidiaries. |
| Note 3: |
Transaction terms were determined in accordance with mutual agreements. |
| Note 4: |
For assets and liabilities, amount is shown as a percentage to consolidated total assets as of September 30, 2013, while revenues, costs and expenses are shown as a percentage to consolidated total operating
revenues for the nine months ended September 30, 2013. |
| Note 5: |
The amount was eliminated upon consolidation. |
(Concluded)
118