UNITED STATES SECURITIES AND EXCHANGE COMMISSION
Washington, D.C. 20549
Form 10-K
(Mark One)
ANNUAL REPORT PURSUANT TO SECTION 13 OR 15(d) OF THE SECURITIES EXCHANGE ACT OF 1934 | |
For the fiscal year ended December 31, 2019
or
TRANSITION REPORT PURSUANT TO SECTION 13 OR 15(d) OF THE SECURITIES EXCHANGE ACT OF 1934 | |
Commission file number 1-16335
(Exact name of registrant as specified in its charter)
(State or other jurisdiction of incorporation or organization) | (I.R.S. Employer Identification No.) | |
(Address of principal executive offices and zip code)
(918 ) 574-7000
(Registrant’s telephone number, including area code)
Securities registered pursuant to Section 12(b) of the Act:
Title of Each Class | Trading Symbol(s) | Name of Each Exchange on Which Registered | ||
Securities registered pursuant to Section 12(g) of the Act: None
Indicate by check mark if the registrant is a well-known seasoned issuer, as defined in Rule 405 of the Securities Act. Yes ☒ No o
Indicate by check mark if the registrant is not required to file reports pursuant to Section 13 or Section 15(d) of the Act. Yes ☐ No ☒
Indicate by check mark whether the registrant: (1) has filed all reports required to be filed by Section 13 or 15(d) of the Securities Exchange Act of 1934 during the preceding 12 months (or for such shorter period that the registrant was required to file such reports), and (2) has been subject to such filing requirements for the past 90 days. Yes ☒ No o
Indicate by check mark whether the registrant has submitted electronically every Interactive Data File required to be submitted pursuant to Rule 405 of Regulation S-T (§232.405 of this chapter) during the preceding 12 months (or for such shorter period that the registrant was required to submit such files). Yes ☒ No o
Indicate by check mark whether the registrant is a large accelerated filer, an accelerated filer, a non-accelerated filer, a smaller reporting company or an emerging growth company. See the definitions of “large accelerated filer,” “accelerated filer,” “smaller reporting company” and “emerging growth company” in Rule 12b-2 of the Exchange Act.
If an emerging growth company, indicate by check mark if the registrant has elected not to use the extended transition period for complying with any new or revised financial accounting standards provided pursuant to Section 13(a) of the Exchange Act. o
Indicate by check mark whether the registrant is a shell company (as defined in Rule 12b-2 of the Act). Yes ☐ No ☒
The aggregate market value of the registrant’s voting and non-voting common units held by non-affiliates computed by reference to the price at which the common units were last sold as of June 28, 2019 was $14,578,539,904 .
As of February 17, 2020, there were 227,787,597 common units outstanding.
DOCUMENTS INCORPORATED BY REFERENCE
Portions of the registrant’s Proxy Statement prepared for the solicitation of proxies in connection with the 2020 Annual Meeting of Limited Partners are to be incorporated by reference in Part III of this Form 10-K.
TABLE OF CONTENTS
Page | |||
PART I | |||
ITEM 1. | |||
ITEM 1A. | |||
ITEM 1B. | |||
ITEM 2. | |||
ITEM 3. | |||
ITEM 4. | |||
PART II | |||
ITEM 5. | |||
ITEM 6. | |||
ITEM 7. | |||
ITEM 7A. | |||
ITEM 8. | |||
ITEM 9. | |||
ITEM 9A. | |||
ITEM 9B. | |||
PART III | |||
ITEM 10. | |||
ITEM 11. | |||
ITEM 12. | |||
ITEM 13. | |||
ITEM 14. | |||
PART IV | |||
ITEM 15. | |||
Forward-Looking Statements
Except for statements of historical fact, all statements in this Annual Report on Form 10-K constitute forward-looking statements within the meaning of the federal securities laws. Forward-looking statements may be identified by words like “anticipates,” “believes,” “continue,” “could,” “estimates,” “expects,” “forecasts,” “goal,” “guidance,” “intends,” “may,” “might,” “plans,” “potential,” “projected,” “scheduled,” “should,” “will” and other similar expressions. The absence of such words or expressions does not necessarily mean the statements are not forward-looking. Although we believe our forward-looking statements are reasonable, statements made regarding future results are not guarantees of future performance and are subject to numerous assumptions, uncertainties and risks that are difficult to predict, including those described in Part I, Item 1A – Risk Factors of this Annual Report. Actual outcomes and results may be materially different from the results stated or implied in such forward-looking statements included in this report. You should not put any undue reliance on any forward-looking statement.
The following are among the important factors that could cause future results to differ materially from any expected, projected, forecasted, estimated or budgeted amounts, events or circumstances we have discussed in this report:
• | overall demand for refined products, crude oil and liquefied petroleum gases; |
• | price fluctuations for refined products, crude oil and liquefied petroleum gases and expectations about future prices for these products; |
• | changes in the production of crude oil in the basins served by our pipelines; |
• | changes in general economic conditions, interest rates and price levels; |
• | changes in the financial condition of our customers, vendors, derivatives counterparties, lenders or joint venture co-owners; |
• | our ability to secure financing in the credit and capital markets in amounts and on terms that will allow us to execute our business strategy, refinance our existing obligations when due and maintain adequate liquidity; |
• | development of alternative energy sources, including but not limited to natural gas, solar power, wind power, electric and battery-powered engines and geothermal energy, increased use of biofuels such as ethanol and biodiesel, increased conservation or fuel efficiency, increased use of electric vehicles, as well as regulatory developments or other trends that could affect demand for our services; |
• | changes in population in the markets served by our refined products pipeline system and changes in consumer preferences, driving patterns or rates of automobile ownership; |
• | changes in the product quality, throughput or interruption in service of refined products or crude oil pipelines owned and operated by third parties and connected to our assets; |
• | changes in demand for transportation or storage in our refined products, crude oil or marine terminals segments; |
• | changes in supply and demand patterns for our facilities due to geopolitical events, the activities of the Organization of the Petroleum Exporting Countries, changes in U.S. trade policies or in laws governing the importing and exporting of petroleum products, technological developments or other factors; |
• | our ability to manage interest rate and commodity price exposures; |
• | changes in our tariff rates or other terms of service implemented by the Federal Energy Regulatory Commission (“FERC”) or state regulatory agencies; |
• | shut-downs or cutbacks at refineries, oil wells, petrochemical plants or other customers or businesses that use or supply our services; |
• | the effect of weather patterns and other natural phenomena, including climate change, on our operations and demand for our services; |
• | an increase in the competition our operations encounter, including the effects of capacity over-build in the areas where we operate; |
• | the occurrence of natural disasters, terrorism, sabotage, protests or activism, operational hazards, equipment failures, system failures or unforeseen interruptions; |
• | our ability to obtain adequate levels of insurance at a reasonable cost, and the potential for losses to exceed the insurance coverage we do obtain; |
1
• | the treatment of us as a corporation for federal or state income tax purposes or if we become subject to significant forms of other taxation or more aggressive enforcement or increased assessments under existing forms of taxation; |
• | our ability to identify expansion projects with acceptable expected returns or to complete identified expansion projects on time and at projected costs; |
• | our ability to make and integrate accretive acquisitions and joint ventures and successfully execute our business strategy; |
• | uncertainty of estimates, including accruals and costs of environmental remediation; |
• | our ability to cooperate with and rely on our joint venture co-owners; |
• | actions by rating agencies concerning our credit ratings; |
• | our ability to timely obtain and maintain all necessary approvals, consents and permits required to operate our existing assets and to construct, acquire and operate any new or modified assets; |
• | our ability to promptly obtain all necessary services, materials, labor, supplies and rights-of-way required for construction of our growth projects, and to complete construction without significant delays, disputes or cost overruns; |
• | risks inherent in the use and security of information systems in our business and implementation of new software and hardware; |
• | changes in laws and regulations or the interpretations of such laws that govern our gas liquids blending activities, including the potential applicability of the Carmack Amendment, which broadly covers claims for damage or loss incurred to goods transported by a carrier in interstate commerce, to such activities, or changes regarding product quality specifications or renewable fuel obligations that impact our ability to produce gasoline volumes through our gas liquids blending activities or that require significant capital outlays for compliance; |
• | changes in laws and regulations to which we or our customers are or could become subject, including tax withholding requirements, safety, security, employment, hydraulic fracturing, derivatives transactions, trade and environmental laws and regulations, including laws and regulations designed to address climate change; |
• | the cost and effects of legal and administrative claims and proceedings against us, our subsidiaries or our joint ventures; |
• | the amount of our indebtedness, which could make us vulnerable to general adverse economic and industry conditions, limit our ability to borrow additional funds, place us at competitive disadvantages compared to our competitors that have less debt or have other adverse consequences; |
• | the effect of changes in accounting policies; |
• | the potential that our internal controls may not be adequate, weaknesses may be discovered or remediation of any identified weaknesses may not be successful; |
• | the ability and intent of our customers, vendors, lenders, joint venture co-owners or other third parties to perform on their contractual obligations to us; |
• | petroleum product supply disruptions; |
• | global and domestic repercussions from terrorist activities, including cyber attacks, and the government’s response thereto; and |
• | other factors and uncertainties inherent in the transportation, storage and distribution of petroleum products and the operation, acquisition and construction of assets related to such activities. |
This list of important factors is not exhaustive. The forward-looking statements in this Annual Report speak only as of the date hereof, and we undertake no obligation to publicly update or revise any forward-looking statement, whether as a result of new information, future events, changes in assumptions or otherwise, unless required by law.
2
MAGELLAN MIDSTREAM PARTNERS, L.P.
FORM 10-K
PART I
Item 1. Business
(a) General Development of Business
Unless indicated otherwise, the terms “our,” “we,” “us” and similar language refer to Magellan Midstream Partners, L.P. together with its subsidiaries. Magellan Midstream Partners, L.P. is a Delaware limited partnership formed in August 2000, and its common units are traded on the New York Stock Exchange under the ticker symbol “MMP.” Magellan GP, LLC, a wholly-owned Delaware limited liability company, serves as its general partner.
(b) [Reserved.]
(c) Narrative Description of Business
We are principally engaged in the transportation, storage and distribution of refined petroleum products and crude oil. As of December 31, 2019, our asset portfolio consisted of:
• | our refined products segment, comprised of our approximately 9,800-mile refined products pipeline system with 53 terminals as well as 25 independent terminals not connected to our pipeline system; |
• | our crude oil segment, comprised of approximately 2,200 miles of crude oil pipelines, a condensate splitter and 35 million barrels of aggregate storage capacity, of which approximately 23 million barrels are used for contract storage. Approximately 1,000 miles of these pipelines, the condensate splitter and 28 million barrels of this storage capacity (including 20 million barrels used for contract storage) are wholly-owned, with the remainder owned through joint ventures; and |
• | our marine storage segment, consisting of six marine terminals located along coastal waterways with an aggregate storage capacity of approximately 31 million barrels. Approximately 25 million barrels of this storage capacity are wholly-owned, with the remainder owned through joint ventures. |
Industry Background
The United States (“U.S.”) petroleum products transportation and distribution system links sources of crude oil supply with refineries and ultimately with end users of petroleum products. This system is comprised of a network of pipelines, terminals, storage facilities, waterborne vessels, railcars and trucks. For transportation of petroleum products, pipelines are generally the most reliable, lowest cost and safest alternative for intermediate and long-haul movements between different markets. Throughout the distribution system, terminals play a key role in facilitating product movements by providing storage, distribution, blending and other ancillary services.
Terminology common in our industry includes the following terms, which describe products that we transport, store, distribute or otherwise handle through our petroleum pipelines and terminals:
• | refined products are the output from crude oil refineries that are primarily used as fuels by consumers. Refined products include gasoline, diesel fuel, aviation fuel, kerosene and heating oil. Diesel fuel, kerosene and heating oil are also referred to as distillates; |
• | transmix is a mixture of refined products that forms when transported in pipelines. Transmix is fractionated and blended into usable refined products; |
• | liquefied petroleum gases or LPGs are liquids produced as by-products of the crude oil refining process and in connection with natural gas production. LPGs include butane and propane; |
3
• | blendstocks are products blended with refined products to change or enhance their characteristics such as increasing a gasoline’s octane or oxygen content. Blendstocks include alkylates, oxygenates and natural gasoline; |
• | heavy oils and feedstocks are products used as burner fuels or feedstocks for further processing by refineries and petrochemical facilities. Heavy oils and feedstocks include No. 6 fuel oil and vacuum gas oil; |
• | crude oil, which includes condensate, is a naturally occurring unrefined petroleum product recovered from underground that is used as feedstock by refineries, splitters and petrochemical facilities; and |
• | biofuels, such as ethanol and biodiesel, are fuels derived from living materials and typically blended with other refined products as required by government mandates. |
We use the term petroleum products to describe any, or a combination, of the above-noted products.
Description of Our Businesses
REFINED PRODUCTS
Our refined products segment consists of our refined products pipeline system and independent terminals. Our refined products pipeline system is the longest common carrier pipeline system for refined products and LPGs in the U.S., extending approximately 9,800 miles from the Texas Gulf Coast and covering a 15-state area across the central U.S. The system includes approximately 46 million barrels of aggregate usable storage capacity at 53 connected terminals. Our network of independent terminals includes 25 refined products terminals with 6 million barrels of storage located primarily in the southeastern U.S. and connected to third-party common carrier interstate pipelines, including the Colonial and Plantation pipelines.
Our refined products segment accounted for the following percentages of our consolidated revenue, operating margin and total assets:
Year Ended December 31, | ||||||
2017 | 2018 | 2019 | ||||
Percent of consolidated revenue | 72% | 72% | 69% | |||
Percent of consolidated operating margin | 58% | 58% | 55% | |||
Percent of consolidated total assets | 47% | 48% | 51% | |||
See Note 3—Segment Disclosures in the accompanying consolidated financial statements in Item 8 for a description of the non-generally accepted accounting principles (“GAAP”) measure of operating margin and additional financial information about our refined products segment.
Operations. Transportation, Terminalling and Ancillary Services. During 2019, approximately 70% of the refined products segment’s revenue (excluding product sales revenue) was generated from transportation tariffs on volumes shipped on our refined products pipeline system. These transportation tariffs vary depending upon where the product originates, where ultimate delivery occurs and any applicable discounts. All transportation rates and discounts are in published tariffs filed with the FERC or appropriate state agency. Included as part of these tariffs are charges for terminalling and storage of products at 31 of our pipeline system’s 53 connected terminals. Revenue from terminalling and storage at the other 22 terminals on our refined products pipeline system is derived from privately negotiated rates. Under our tariffs, we are allowed to deduct prescribed quantities of the products our shippers transport on our pipelines, which are commonly referred to as “tender deductions,” to compensate us for lost product during shipment due to metering inaccuracies, intermingling of products between batches (transmix), evaporation or other events that result in volume shortages during the shipment process. In return for these tender deductions, our customers receive a guaranteed delivery of the gross volume of products they ship with us, less the
4
amount of our tender deductions, irrespective of the actual amount of product shortages we incur during the shipment process.
In 2019, the products transported on our refined products pipeline system were comprised of 54% gasoline, 36% distillates and 10% aviation fuel and LPGs. The operating statistics below reflect our refined products pipeline system’s operations for the periods indicated:
Year Ended December 31, | |||||||||
2017 | 2018 | 2019 | |||||||
Shipments (million barrels): | |||||||||
Gasoline | 295.5 | 286.9 | 280.5 | ||||||
Distillates | 166.2 | 181.7 | 184.6 | ||||||
Aviation fuel | 26.5 | 31.0 | 41.1 | ||||||
LPGs | 9.9 | 11.0 | 9.7 | ||||||
Total shipments | 498.1 | 510.6 | 515.9 | ||||||
Our refined products pipeline system generates additional revenue from providing pipeline capacity and tank storage services, as well as providing services such as terminalling, ethanol and biodiesel unloading and loading, additive injection, custom blending, laboratory testing and data services to shippers, which are performed under a mix of “as needed,” monthly and long-term agreements.
Our independent terminals generate revenue primarily by charging fees based on the amount of product delivered through our facilities and from ancillary services such as additive injections and ethanol blending.
Commodity-Related Activities. Substantially all of the transportation and throughput services we provide are for third parties, and we do not take title to their products. We do take title of products related to tender deductions, product overages and our gas liquids blending and fractionation activities on our refined products pipeline system. The sales of these products generate product sales revenue.
Our gas liquids blending activity primarily involves purchasing butane and blending it into gasoline, which creates additional gasoline available for us to sell. This activity is limited by seasonal changes in gasoline vapor pressure specification requirements and by the varying quality of the gasoline products delivered to us. When the differential between the cost of gas liquids and the price of gasoline fluctuates, the product margin we earn from these activities is impacted. We hedge the economic margin from this blending activity by entering into forward physical or exchange-traded gasoline futures contracts at the time we purchase the related gas liquids. These blending activities accounted for approximately 76% of the total product margin for the refined products segment during 2019.
We also operate three fractionators along our pipeline system that separate transmix into gasoline and diesel. In addition to fractionating the transmix that results from our pipeline operations, we also purchase and fractionate transmix from third parties and sell the resulting refined products.
Product margin from commodity-related activities in our refined products segment was $130.4 million, $222.1 million and $117.5 million for the years ended December 31, 2017, 2018 and 2019, respectively. The amount of margin we earn from these activities and related hedges fluctuates with changes in petroleum prices (see Note 13–Derivative Financial Instruments to the consolidated financial statements included in Item 8 of this report for further information regarding our hedging activities). Product margin is a non-GAAP financial measure, but its components are determined in accordance with GAAP. Product margin, which is calculated as product sales revenue less cost of product sales, is used by management to evaluate the profitability of our commodity-related activities. The components of product margin included in operating profit, the nearest GAAP measurement, are provided in Note 3—Segment Disclosures to the consolidated financial statements included in Item 8 of this report.
5
Joint Venture Activities. We own a 50% interest in Powder Springs Logistics, LLC (“Powder Springs”), which was formed to construct and operate a gas liquids blending system near Atlanta, Georgia. Powder Springs began operations in 2017.
Markets and Competition. Shipments originate on our refined products pipeline system from direct connections to refineries or through interconnections with other pipelines or terminals for transportation and ultimate distribution to retail gasoline stations, truck stops, railroads, airports and other end users. Through direct refinery connections and interconnections with other interstate pipelines, our refined products system can access approximately 45% of U.S. refining capacity, and in particular is well-connected to Texas Gulf Coast and Mid-Continent refineries. As a result of its extensive connections to multiple refining regions, our pipeline system is well positioned to accommodate demand or supply shifts that may occur.
Our system is dependent on the ability of refiners and marketers to meet the demand for refined products in the markets they serve through shipments on our pipeline system. Demand for refined products is influenced by many factors, including driving patterns and consumer preferences, economic conditions, population changes, government regulations, changes in vehicle fuel efficiency and development of alternative energy sources. The demand for refined products in the market areas served by our pipeline system has historically been stable. We generally rely on recent historical trends on our system and third-party forecasts in assessing future refined products demand, and those forecasts vary both by forecaster and by product. While increases in vehicle efficiency and more widespread penetration of electric vehicles are generally expected to reduce demand for gasoline over time, distillate demand is expected to be less affected, while demand for aviation fuel and LPGs is expected to grow. Projections published by the Energy Information Administration in January 2020 suggest that overall demand for refined products in the market areas served by our pipeline system, primarily the West North Central and West South Central census districts, will decline approximately 0.5% annually over the next ten years.
In 2019, approximately 62% of the products transported on our refined products pipeline system originated from 18 direct refinery connections and 38% originated from connections with other pipelines or terminals. Our system is directly connected to and receives product from the following refineries:
Major Origins—Refineries (Listed Alphabetically)
Company | Refinery Location | |
CHS | McPherson, KS | |
CVR Energy | Coffeyville, KS | |
CVR Energy | Wynnewood, OK | |
Flint Hills Resources | Pine Bend, MN | |
HollyFrontier | El Dorado, KS | |
HollyFrontier | Tulsa, OK | |
HollyFrontier | Cheyenne, WY | |
Husky Energy | Superior, WI | |
Marathon | St. Paul, MN | |
Marathon | El Paso, TX | |
Marathon | Galveston Bay, TX | |
Par Pacific | Newcastle, WY | |
Phillips 66 | Ponca City, OK | |
Sinclair | Evansville, WY | |
Suncor Energy | Commerce City, CO | |
Valero | Ardmore, OK | |
Valero | Houston, TX | |
Valero | Texas City, TX | |
6
Our system is also supplied by connections to multiple pipelines and terminals, including those shown in the table below:
Major Origins—Pipelines and Terminals (Listed Alphabetically)
Pipeline/Terminal | Connection Location | Source of Product | ||
BP | Manhattan, IL | Whiting, IN refinery | ||
CHS | Fargo, ND | Laurel, MT refinery | ||
Explorer | Mt. Vernon, MO; Glenpool, OK; Dallas, TX; East Houston, TX; Pasadena, TX | Various Gulf Coast refineries | ||
Holly Energy Partners | Duncan, OK; El Paso, TX | Big Spring, TX refinery, Artesia, NM refinery | ||
Kinder Morgan | Galena Park and Pasadena, TX | Various Gulf Coast refineries and imports | ||
Magellan | Galena Park, TX | Various Gulf Coast refineries and imports | ||
Mid-America (Enterprise) | El Dorado, KS | Conway, KS storage | ||
NuStar Energy | Denver, CO; El Dorado, KS; Minneapolis, MN | Various OK & KS refineries, Mandan, ND refinery, McKee, TX refinery | ||
ONEOK | Des Moines, IA; Wayne, IL; Plattsburg, MO | Bushton, KS storage and Chicago, IL area refineries | ||
Phillips 66 | Denver, CO; Kansas City, KS; Pasadena, TX; Casper, WY | Borger, TX refinery, various Billings, MT area refineries, Sweeney, TX refinery | ||
Shell | East Houston, TX | Deer Park, TX refinery | ||
In certain markets, barge, truck or rail provide an alternative source for transporting refined products; however, pipelines are generally the most reliable, lowest cost and safest alternative for refined products movements between different markets. As a result, our pipeline system’s most significant competitors are other pipelines that serve the same markets.
Competition with other pipeline systems is based primarily on transportation charges, quality of customer service, proximity to end users and longstanding customer relationships. However, given the different supply sources on each pipeline, commodity prices at either the origin or destination point on a pipeline may outweigh transportation costs when customers choose which pipeline to use.
Another form of competition for pipelines is the use of exchange agreements among shippers. Under these agreements, a potential shipper agrees to supply a market near its refinery or terminal in exchange for receiving supply from another refinery or terminal in a different market. These agreements allow the two parties to reduce or eliminate the volumes transported and, therefore, the transportation fees paid to us. We compete with these alternatives through price incentives and through long-term commercial arrangements with potential exchange partners.
Government mandates increasingly require the use of renewable fuels, particularly ethanol. Due to technical and operational concerns, pipelines have generally not shipped ethanol, and most ethanol is transported by railroad, truck or barge. The increased use of ethanol has and will continue to compete with shipments on our pipeline system. However, our terminals have the necessary infrastructure to blend ethanol with refined products, and we earn revenue for these services.
Our independent terminals receive product primarily from the interstate pipelines to which they are connected and serve the retail, industrial and commercial sales markets along those pipelines. Demand for our services is driven primarily by end user demand for refined products in those markets. Our terminals compete with other independent terminal operators as well as integrated oil companies on the basis of terminal location and versatility, services provided and price.
7
Customers and Contracts. Our refined products pipeline system provides services to several different types of customers, including refiners, wholesalers, retailers, traders, railroads, airlines and regional farm cooperatives. End markets for refined products deliveries are primarily retail gasoline stations, truck stops, farm cooperatives, railroad fueling depots, military bases and commercial airports. LPG shippers include wholesalers and retailers that, in turn, sell to commercial, industrial, agricultural and residential heating customers. Published tariffs serve as contracts, and shippers nominate the volume to be shipped up to a month in advance. In addition, we enter into agreements with shippers that commonly result in payment, volume or term commitments in exchange for reduced tariff rates or expansion capital spending on our part. For 2019, approximately 40% of the shipments on our pipeline system were subject to these supplemental agreements. The average remaining life of these agreements was approximately three years as of December 31, 2019. While many of these supplemental agreements do not represent guaranteed volumes, they do reflect a significant level of shipper commitment to our refined products pipeline system.
For the year ended December 31, 2019, our refined products pipeline system had approximately 65 transportation customers. The top 10 shippers included independent refining companies, integrated oil companies, farm cooperatives and traders. Revenue attributable to these top 10 shippers for the year ended December 31, 2019 represented 34% of total revenue for our refined products segment and 51% of revenue excluding product sales.
Customers of our independent terminals include refiners, retailers, wholesalers and traders. Contracts vary in term and commitment and typically renew automatically, unless the customer elects to terminate, at the end of each contract period.
Product sales are primarily to trading and marketing companies active in the markets we serve. These sales agreements are generally short-term in nature.
CRUDE OIL
Our crude oil segment is comprised of approximately 2,200 miles of crude oil pipelines, a condensate splitter and storage facilities with an aggregate storage capacity of approximately 35 million barrels, of which 23 million barrels are used for contract storage. Approximately 1,000 miles of these pipelines, the condensate splitter and 28 million barrels of this storage capacity (including 20 million barrels used for contract storage) are wholly-owned, with the remainder owned through joint ventures.
The joint ventures in our crude oil segment are BridgeTex Pipeline Company, LLC (“BridgeTex”), Double Eagle Pipeline LLC (“Double Eagle”), HoustonLink Pipeline Company, LLC (“HoustonLink”), Saddlehorn Pipeline Company, LLC (“Saddlehorn”) and Seabrook Logistics, LLC (“Seabrook”).
Our crude oil segment accounted for the following percentages of our consolidated revenue, operating margin and total assets:
Year Ended December 31, | ||||||
2017 | 2018 | 2019 | ||||
Percent of consolidated revenue | 20% | 22% | 24% | |||
Percent of consolidated operating margin | 33% | 34% | 37% | |||
Percent of consolidated total assets | 38% | 35% | 33% | |||
See Note 3–Segment Disclosures in the accompanying consolidated financial statements in Item 8 for additional financial information about our crude oil segment.
Operations. Our crude oil assets are strategically located to serve crude oil supply, trading and demand centers. Revenue is generated primarily through transportation tariffs on our crude oil pipelines, storage fees from our crude oil terminals, providing pipeline capacity and tolling fees from our condensate splitter. In addition, we earn revenue for ancillary services including terminal throughput fees. We generally do not take title to the products
8
we ship or store for our crude oil customers. Our tariffs provide for tender deductions to compensate us for lost product during shipment due to metering inaccuracies, evaporation or other events that result in volume losses during the shipment process, and we take title to these products. We also take title to volumes shipped in connection with our crude oil marketing activities.
Our 450-mile Longhorn pipeline has the capacity to transport approximately 275,000 barrels per day (“bpd”) of crude oil from the Permian Basin in West Texas to Houston, Texas. Shipments originate on the Longhorn pipeline in Crane, Barnhart or Midland, Texas via trucks or interconnections with crude oil gathering systems owned by third parties and are delivered to our terminal at East Houston or to various points on the Houston Ship Channel, including multiple refineries connected to our Houston distribution system.
Our East Houston terminal includes approximately nine million barrels of crude oil storage, with approximately five million barrels used for contract storage and four million barrels dedicated to the operation of the Longhorn and BridgeTex pipelines. (See discussion of our BridgeTex joint venture under Joint Venture Activities below.) Our East Houston terminal is also connected to our Houston distribution system and to third-party pipelines, including the Zydeco pipeline. Argus’ West Texas Intermediate (“WTI”) Houston price assessment is based on trades at the terminal, and the terminal is the delivery point for the Permian WTI Crude Oil futures contract traded on the Intercontinental Exchange.
Our Houston distribution system consists of more than 100 miles of pipeline that connect our East Houston terminal through several interchanges to various points, including multiple refineries throughout the Houston area and crude oil import and export facilities, including through the facility owned by Seabrook discussed below. In addition, it is directly connected to other third-party crude oil pipelines providing us access to crude oil from the Permian and Eagle Ford basins, the strategic crude oil trading hub in Cushing, Oklahoma and crude oil imports.
Our Cushing terminal consists of approximately 13 million barrels of crude oil storage, all of which is used for contract storage. The facility primarily receives and distributes crude oil via the multiple common carrier pipelines that terminate in and originate from the Cushing crude oil trading hub, including the pipeline owned by our Saddlehorn joint venture discussed below, as well as short-haul pipeline connections with neighboring crude oil terminals.
We own approximately 400 miles of pipeline in Kansas and Oklahoma used for crude oil service. A portion of these pipelines is leased to third parties, and we earn revenue from these pipeline segments for capacity leased even if not used by the customers.
Our Corpus Christi terminal includes approximately two million barrels of condensate storage, with a portion used for contract storage and a portion used in conjunction with our Double Eagle joint venture discussed below. This terminal receives product primarily from trucks, barges and pipelines that connect to our terminal for further distribution to end users by trucks, pipeline or waterborne vessels. Our 50,000 bpd condensate splitter with approximately two million barrels of related storage is also located at our terminal in Corpus Christi.
Crude Oil Marketing Activities. Our crude oil marketing activities primarily involve purchasing and selling crude oil to be shipped on our Texas crude oil pipelines to facilitate intrastate shipments and maximize profitability on our crude oil pipeline assets. The revenues from these activities are reflected as product sales revenue in our consolidated statements of income. The product margin we earn from these activities is primarily based on the differential in market prices for crude oil between our origin and destination points.
Joint Venture Activities. We own a 30% interest in BridgeTex, a joint venture with an affiliate of Plains All American Pipeline, L.P. (“Plains”) and an affiliate of OMERS Infrastructure Management Inc. BridgeTex owns an approximately 400-mile pipeline currently capable of transporting up to 440,000 bpd of Permian Basin crude oil from Midland and Colorado City, Texas to our East Houston terminal. We serve as operator of the BridgeTex pipeline. We also have a long-term lease agreement with BridgeTex to provide it with capacity on our Houston distribution system.
9
We own a 50% interest in Double Eagle, a joint venture with an affiliate of Kinder Morgan, Inc. (“Kinder”) that transports condensate from the Eagle Ford basin in South Texas via an approximately 200-mile pipeline to our terminal in Corpus Christi or to an inter-connecting pipeline that transports product to the Houston area. An affiliate of Kinder serves as the operator of the Double Eagle pipeline. We have entered into a terminal throughput agreement with Double Eagle.
We own a 50% interest in HoustonLink, a joint venture with an affiliate of TC Energy Corporation (“TC Energy”). HoustonLink owns a crude oil pipeline connecting TC Energy’s Houston terminal, which is a termination point for TC Energy’s Marketlink Pipeline, to our nearby East Houston terminal. We serve as operator of the HoustonLink pipeline.
As of December 31, 2019, we owned a 40% interest in Saddlehorn, a joint venture with an affiliate of Plains and an affiliate of Western Midstream Partners, LP. Saddlehorn owns an undivided joint interest in an approximately 600-mile pipeline, which delivers various grades of crude oil from the DJ Basin as well as other Rocky Mountain production regions to storage facilities in Cushing, including our Cushing terminal. Saddlehorn currently has the capacity to deliver up to 190,000 bpd of crude oil, which is expected to increase to 290,000 bpd upon the completion of an expansion project in late 2020. We serve as operator of and have also entered into storage contracts with Saddlehorn. In February 2020, we and Plains each sold a 10% interest in Saddlehorn to an affiliate of Black Diamond Gathering LLC (see Item 7, Management’s Discussion and Analysis – Recent Developments for more information regarding the sale).
We own a 50% interest in Seabrook, a joint venture with an affiliate of LBC Tank Terminals, LLC (“LBC”). Seabrook owns approximately three million barrels of crude oil storage (two million barrels of which is used for contract storage) located in Seabrook, Texas, a pipeline connecting Seabrook’s storage facilities to an existing third-party pipeline that connects to a Houston-area refinery and another pipeline connecting its facility to our Houston distribution system. LBC serves as operator of the Seabrook terminal, while we serve as operator of the Seabrook pipelines. In addition, we have a long-term lease agreement with Seabrook that is utilized to provide our customers with crude oil storage capacity and dock access for crude oil imports and exports on the Texas Gulf Coast.
Markets and Competition. Market conditions experienced by our crude oil pipelines vary significantly by location. The Longhorn and BridgeTex pipelines deliver Permian Basin production to trading and demand centers in the Houston area, and consequently depend on the level of production in the Permian Basin for supply. Demand for shipments to the Houston area is driven primarily by the utilization of West Texas crude oil by Gulf Coast refineries and the price for crude oil on the Gulf Coast relative to its price in alternative markets, including export markets. Permian Basin production may vary based on numerous factors including overall crude oil prices and changes in costs of production, while Gulf Coast demand for Permian Basin production may change based on relative prices for competing crude oil or changes by refineries to their crude oil processing slates, as well as by overall domestic and international demand for petroleum products. The Longhorn and BridgeTex pipelines compete with alternative outlets for Permian Basin production, including pipelines that transport crude oil to the Cushing crude oil trading hub as well as other pipelines that currently transport or new pipelines that may transport Permian Basin crude to the Gulf Coast. These pipelines also compete with truck and rail alternatives for Permian Basin barrels. Further, these pipelines indirectly compete with other alternatives for delivering similar quality crude oil to the Gulf Coast, including pipelines from other producing regions such as the Mid-Continent, Bakken, Eagle Ford or Gulf of Mexico, as well as waterborne imports. Competition is based primarily on tariff rates, proximity to both supply sources and demand centers, connectivity, service offerings, crude quality and customer relationships.
Volumes on our Houston distribution system are driven by our customers’ demand for distribution of crude oil between our system’s various connections and as a result are affected in part by changes in origins and destinations of crude oil processed in or distributed through the Gulf Coast region. Our HoustonLink and Seabrook joint ventures offer our customers additional pipeline connectivity, crude oil storage and import and export capabilities in the Houston area. Our Houston distribution system competes with other distribution facilities in the Houston area based primarily on tariff rates, connectivity to supply sources and demand centers, customer service and customer relationships.
10
Our crude oil storage facilities in Cushing serve customers who value Cushing’s location as an interchange point for numerous interstate pipelines, including Saddlehorn, and its status as a crude oil trading hub. Demand for crude oil storage in Cushing could be affected by changes in crude oil pipeline flows that change the volume of crude oil that flows through or is stored in Cushing, as well as by developments of alternative trading hubs that reduce Cushing’s relative importance. In addition, demand for our storage services in Cushing could be affected by crude oil price volatility or price structures or by regulatory or financial conditions that affect the ability of our customers to store or trade crude oil. We compete in Cushing with numerous other storage providers, with competition based on a combination of connectivity, storage rates and other terms, customer service and customer relationships.
The Double Eagle pipeline depends on condensate production from the Eagle Ford basin for its supply and competes primarily with other pipelines and supply alternatives that are capable of transporting condensate from the Eagle Ford production area. Competition is based primarily on tariff rates, connectivity, customer service and customer relationships. The demand for Double Eagle’s services could be affected by changes in Eagle Ford condensate production or changes in demand for different grades of condensate. Eagle Ford production may vary based on numerous factors including overall crude oil prices and changes in costs of production. Demand for our condensate storage at Corpus Christi is subject to similar market conditions and competitive forces.
Our condensate splitter at our Corpus Christi terminal depends on condensate production and overall demand for products derived from condensate. Our splitter competes with other facilities in the Gulf Coast region including other splitters and refineries, as well as export alternatives.
The Saddlehorn pipeline depends on crude oil production primarily from the DJ Basin and broader Rocky Mountain region for its supply and competes primarily with other pipelines and supply alternatives that are capable of transporting crude oil from the DJ Basin and Rocky Mountain production area. Competition is based primarily on tariff rates, connectivity, customer service and customer relationships. The demand for Saddlehorn’s services could be affected by changes in DJ Basin crude oil production and additional investment in competing transportation alternatives out of the basin, as well as the status of Cushing as a crude oil trading hub. DJ Basin production may vary based on numerous factors including overall crude oil prices and changes in costs of production.
Customers and Contracts. We ship crude oil as a common carrier for several different types of customers, including crude oil producers, end users such as refiners and marketing and trading companies, including our marketing affiliate. Published transportation tariffs filed with the FERC or the appropriate state agency serve as contracts to ship on our crude oil pipelines, and shippers nominate volumes to be transported up to a month in advance, with rates varying by origin, destination and product grade. We typically reserve at least 10% of the shipping capacity of our pipelines for spot shippers. Spot barrel movements on our pipelines generally ship at higher rates than those charged to committed shippers. Generally, we secure long-term commitments to support our long-haul crude oil pipeline assets. The majority of the capacity on our Longhorn pipeline is supported by take-or-pay commitments, with a portion of those commitments set to expire in late 2020. We recently entered into a new long-term agreement for a significant portion of this capacity, with volumes under this new agreement ramping up over the next few years. Our Houston distribution system is generally not subject to long-term agreements. For 2019, approximately 30% of all volumes on our wholly-owned crude oil pipelines were subject to long-term commitments. The average remaining life of these contracts was approximately four years as of December 31, 2019. As of December 31, 2019, approximately 90% of our crude oil storage available for contract was under agreements with terms in excess of one year or that renew on an annual basis at our customers’ option. The average remaining life of our storage contracts was approximately two years as of December 31, 2019. These agreements obligate the customer to pay for storage capacity reserved even if not used by the customer. BridgeTex, Double Eagle, Saddlehorn and Seabrook also have long-term contracts. Additionally, we have a tolling agreement with one customer for the exclusive use of our condensate splitter in Corpus Christi with a remaining life of approximately three years.
11
MARINE STORAGE
We own and operate six marine storage terminals located along coastal waterways with approximately 31 million barrels of aggregate storage capacity. Our joint venture assets include six million barrels of storage capacity. Our marine terminals provide distribution, storage, blending, inventory management and additive injection services for refiners, marketers, traders and other end users of petroleum products.
The joint ventures in our marine storage segment are MVP Terminalling, LLC (“MVP”) and Texas Frontera, LLC (“Texas Frontera”).
Our marine storage segment accounted for the following percentages of our consolidated revenue, operating margin and total assets:
Year Ended December 31, | ||||||
2017 | 2018 | 2019 | ||||
Percent of consolidated revenue | 8% | 7% | 7% | |||
Percent of consolidated operating margin | 8% | 7% | 8% | |||
Percent of consolidated total assets | 12% | 14% | 14% | |||
See Note 3–Segment Disclosures in the accompanying consolidated financial statements in Item 8 for additional financial information about our marine storage segment.
Operations. Our marine storage terminals generate revenue primarily through providing storage services for a variety of customers. Refiners and chemical companies typically use our storage terminals due to tankage constraints at their facilities or the specialized handling requirements of the stored product. We also provide storage services to marketers and traders that require access to significant storage capacity. Because the rates charged at these terminals are unregulated, the marketplace determines the prices we charge for our services. In general, we do not take title to the products that are stored at or distributed from our marine terminals.
Our Galena Park, Texas marine terminal is located along the Houston Ship Channel and is our largest marine facility with 13 million barrels of wholly-owned usable storage capacity. This facility stores a mix of refined products, blendstocks, heavy oils and crude oil, and receives and distributes products by pipeline, truck, rail, barge and ship. An advantage of our Galena Park facility is that it provides our customers with access to multiple common carrier pipelines, including our Houston distribution system, as well as deep-water port facilities that accommodate both ship and barge traffic and loading and unloading facilities for trucks and rail cars.
Our Corpus Christi, Texas marine terminal is located near local refineries and petrochemical plants and includes almost two million barrels of usable storage capacity utilized for heavy oils and feedstocks. We receive and deliver products at our Corpus Christi facility primarily by ship, barge, truck and pipeline.
Our New Haven, Connecticut marine terminal is located on the Long Island Sound near the New York Harbor and has approximately four million barrels of usable storage capacity and handles heating oil, refined products, asphalt, ethanol and biodiesel. This facility receives and distributes products by pipeline, ship, barge and truck.
Our Marrero, Louisiana marine terminal is located on the Mississippi River and has approximately three million barrels of usable storage capacity. This facility handles heavy oils, distillates and asphalt. We receive products at our Marrero terminal by rail, ship and barge and deliver products from Marrero by rail, ship, barge and truck.
Our Wilmington, Delaware marine terminal is located at the Port of Wilmington along the Delaware River. The facility includes almost three million barrels of usable storage and handles refined products, ethanol, heavy oils and crude oil. We receive products at our Wilmington terminal by pipeline, ship and barge and deliver products from this facility by pipeline, truck, ship and barge.
12
In January 2020, we entered into an agreement to sell our New Haven, Marrero and Wilmington terminals, which is expected to close as soon as first quarter 2020, subject to regulatory approvals. See Note 19–Subsequent Events for information regarding the sale of these terminals.
Joint Venture Activities. We own a 50% interest in Texas Frontera, which owns approximately one million barrels of storage at our Galena Park terminal. We serve as operator of the Texas Frontera assets.
We own a 50% interest in MVP, which owns a refined products marine storage terminal along the Houston Ship Channel in Pasadena, Texas. The facility began operations in January 2019 with one million barrels of storage and a proprietary ship dock. Construction of an additional four million barrels of storage, truck loading facilities and a second ship dock was substantially complete in late 2019. We serve as operator of the MVP assets.
Markets and Competition. Our marine storage terminals compete with other terminals with respect to location, price, versatility and services provided. The competition primarily comes from integrated petroleum companies, refining and marketing companies, independent terminal companies and distribution companies with marketing and trading operations.
We believe the continued demand for storage and ancillary services at our marine terminals results from our cost-effective distribution services and key transportation links. The ancillary services we provide at our marine terminals, such as product heating, blending, mixing and additive injection, attract additional demand for our storage services and result in additional revenue opportunities. Demand can be influenced by projected changes in and volatility of petroleum product prices.
Customers and Contracts. We have long-standing relationships with refineries, suppliers and traders at our marine terminals. During 2019, approximately 90% of our wholly-owned marine storage terminal capacity was utilized, with the remaining not utilized primarily due to tank integrity work throughout the year. As of December 31, 2019, approximately 80% of our usable storage capacity was under contract with an average remaining life of approximately two years. These contracts obligate the customer to pay for terminal capacity reserved even if not used by the customer. Texas Frontera and MVP also have long-term contracts.
GENERAL BUSINESS INFORMATION
Major Customers
No customer accounted for more than 10% of our consolidated revenues during 2017, 2018 or 2019.
Commodity Positions and Hedges
Our policy is generally to purchase only those products necessary to conduct our normal business activities. We do not acquire physical inventory, futures contracts or other derivative instruments for the purpose of speculating on commodity price changes. Our gas liquids blending, fractionation and crude oil marketing activities result in our carrying significant levels of petroleum product inventories. In addition, we hold positions related to tender deductions and product overages. We use forward physical contracts and derivative instruments to hedge against commodity price changes and manage risks associated with our various commodity purchase and sale activities. Our risk management policies and procedures are designed to monitor our derivative instrument positions, as well as physical volumes, grades, locations, delivery schedules and storage capacity to help ensure that our hedging activities address the risks inherent in our commodity positions.
Regulation
Tariff Regulation. Our interstate common carrier pipeline operations are subject to rate regulation by the FERC under the Interstate Commerce Act, the Energy Policy Act of 1992 and rules and orders promulgated pursuant thereto. FERC regulation requires that interstate liquids pipeline rates be filed with the FERC, be posted publicly, be
13
nondiscriminatory, and be “just and reasonable.” Rate changes and the overall level of our rates may be subject to challenge by the FERC or shippers. If the FERC determines that our rates are not just and reasonable, we may be required to reduce our rates and pay refunds for up to two years of over-earning. The rates on approximately 40% of the shipments on our refined products pipeline system are regulated by the FERC primarily through an index methodology, which for the five-year period beginning July 1, 2016 is set at the annual change in the producer price index for finished goods (“PPI-FG”) plus 1.23%. As an alternative to cost-of-service or index-based rates, interstate liquids pipeline companies may establish rates by obtaining authority to charge market-based rates in competitive markets or by negotiation with unaffiliated shippers. Approximately 60% of our refined products pipeline system’s markets are either subject to regulations by the states in which we operate or are approved for market-based rates by the FERC, and in both cases these rates can generally be adjusted at our discretion based on market factors. Most of the tariffs on our long-haul crude oil pipelines are established by negotiated rates that generally provide for annual adjustments in line with changes in the FERC index, subject to certain modifications.
In addition, some shipments on our pipeline systems move within a single state and thus are considered to be intrastate commerce. The rates, terms and conditions of service offered by our intrastate pipelines are subject to certain regulations with respect to such intrastate transportation by state regulatory authorities in the states of Colorado, Illinois, Kansas, Minnesota, Oklahoma, Texas and Wyoming. Such state regulatory authorities could limit our ability to increase our rates or to set rates based on our costs, or could order us to reduce our rates and require the payment of refunds to shippers if our rates are found to have been unjust.
Commodity Market Regulation. Our conduct in petroleum markets and in hedging our exposure to commodity price fluctuations must comply with laws and regulations that prohibit market manipulation.
Wholesale sales of petroleum products are subject to provisions of the Energy Independence and Security Act of 2007 (“EISA”) and regulations by the Federal Trade Commission (“FTC”). Under the EISA, the FTC issued a rule that prohibits fraudulent or deceptive conduct (including false or misleading statements of material fact) in connection with wholesale purchases or sales of crude oil or refined products. The FTC rule also bans intentional failures to state a material fact when the omission makes a statement misleading and distorts, or is likely to distort, market conditions for any product covered by the rule. The FTC holds substantial enforcement authority under the EISA, including authority to request that a court impose significant fines.
Under the Commodity Exchange Act, the Commodity Futures Trading Commission (“CFTC”) is directed to prevent price manipulations for the commodities markets, including the physical energy, futures and swaps markets. Pursuant to the Dodd-Frank Act, the CFTC has adopted additional anti-market manipulation regulations that prohibit, among other things, fraud and price manipulation in the physical energy, futures and swaps markets. The CFTC also has statutory authority to assess significant fines.
Renewable Fuel Standard. We are an obligated party under the Renewable Fuel Standard (“RFS”) promulgated by the Environmental Protection Agency (“EPA”) and are required to satisfy our Renewable Volume Obligation (“RVO”) on an annual basis. To meet the RVO, the gasoline products we produce in our gas liquids blending activities must either contain the mandated renewable fuel components, or credits must be purchased to cover any shortfall. We met our RVO requirements for 2019 and expect to satisfy the requirements for 2020 mainly through the purchase of credits, known as Renewable Identification Numbers (“RINs”). As the RFS program is currently structured, the RVO of all obligated parties will increase over time unless adjusted by the EPA. The ability to incorporate increasing volumes of renewable fuel components into fuel products and the availability of RINs may be limited, which could increase our costs to comply with the RFS standards or limit our ability to blend.
Income Taxes. We are a partnership for income tax purposes and, therefore, are not subject to federal or state income taxes for most of the states in which we operate. The tax on our net income is borne by our unitholders through allocation to them of their share of our taxable income. Net income for financial statement purposes may differ significantly from taxable income allocated to unitholders because of differences between the tax basis and financial reporting basis of assets and liabilities and the taxable income allocation requirements under our partnership agreement. The aggregate difference in the basis of our net assets for financial and tax reporting
14
purposes cannot be readily determined because information regarding each unitholder’s tax attributes is not available to us.
As a publicly traded limited partnership, we are subject to a statutory requirement that our “qualifying income” (as defined by the Internal Revenue Code, related Treasury Regulations and Internal Revenue Service pronouncements) exceed 90% of our total gross income, determined on a calendar year basis. If our qualifying income does not meet this statutory requirement, we could be taxed as a corporation for federal and state income tax purposes. For the years ended December 31, 2017, 2018 and 2019, our qualifying income met the statutory requirement.
Environmental, Maintenance, Safety & Security
General. The operation of our pipeline systems, terminals and associated facilities is subject to strict and complex laws and regulations relating to the protection of the environment and workplace safety. These laws and regulations govern many aspects of our business including the work environment, the generation and disposal of waste, discharge of process and storm water, air emissions, remediation requirements and facility design requirements to protect against releases into the environment. We believe our assets are designed, operated and maintained in material compliance with these laws and regulations.
Environmental. Our estimates for remediation liabilities assume that we will be able to use traditionally acceptable remediation and monitoring methods, as well as associated engineering or institutional controls, to comply with applicable regulatory requirements. These estimates include the cost of performing environmental assessments, remediation and monitoring of the impacted environment such as soils, groundwater and surface water conditions. Our recorded environmental liabilities are estimates and total remediation costs may differ from current estimated amounts.
We may experience future releases of regulated materials into the environment or discover historical releases that were previously unidentified. While an asset integrity and maintenance program designed to prevent, promptly detect and address releases is an integral part of our operations, damages and liabilities arising out of any environmental release from our assets identified in the future could have a material adverse effect on our results of operations, financial position or cash flow.
Liabilities recognized for estimated environmental costs were $20.5 million and $14.9 million at December 31, 2018 and 2019, respectively. Environmental liabilities have been classified as other current or noncurrent based on management’s estimates regarding the timing of actual payments. We have insurance policies that provide coverage for remediation costs and liabilities arising from sudden and accidental releases of products applicable to all of our assets. Receivables from insurance carriers related to environmental matters were $4.1 million and $2.9 million at December 31, 2018 and 2019, respectively.
Hazardous Substances and Wastes. Our operations are subject to various laws and regulations that relate to the release of hazardous substances and solid wastes into water or soils. For instance, the Comprehensive Environmental Response, Compensation and Liability Act, as amended (“CERCLA”), also known as the Superfund law, and comparable state laws impose liability, without regard to fault or the legality of the original conduct, on certain classes of persons who are considered to be responsible for the release of a hazardous substance into the environment.
Our operations generate wastes, including hazardous wastes that are subject to the requirements of the Resource Conservation and Recovery Act (“RCRA”) and comparable state statutes. We are not currently required to comply with a substantial portion of the RCRA requirements as our operations routinely generate only small quantities of hazardous wastes, and we are not a hazardous waste treatment, storage or disposal facility operator that is required to obtain a RCRA hazardous waste permit. While RCRA currently exempts a number of wastes from being subject to hazardous waste requirements, including many oil and gas exploration and production wastes, the EPA could consider the adoption of stricter disposal standards for non-hazardous wastes. Moreover, it is possible that additional wastes, which could include non-hazardous wastes currently generated during operations, may be
15
designated as hazardous wastes. Hazardous wastes are subject to more rigorous and costly storage and disposal requirements than non-hazardous wastes. Changes in the regulations could materially increase our expenses.
We own or lease properties where hydrocarbons have been handled for many years. Although we have utilized operating and disposal practices that were standard in the industry at the time, hydrocarbons or other wastes may have been disposed of or released on, under or from the properties owned or leased by us or on or under other locations where these wastes have been taken for disposal. In addition, many of these properties were previously operated by third parties whose treatment and disposal or release of hydrocarbons or other wastes was not under our control. These properties and wastes disposed thereon may be subject to CERCLA, RCRA and analogous state laws. Under these laws, we could be required to remove or remediate previously disposed wastes, including wastes disposed of or released by prior owners or operators, to remediate contaminated property, including groundwater contaminated by prior owners or operators, or to make capital improvements to prevent future contamination.
Water Discharges. Our operations can result in the discharge of pollutants, including crude oil and refined products, and are subject to the Oil Pollution Act (“OPA”) and Clean Water Act (“CWA”). The OPA and CWA subject owners of facilities to strict, joint and potentially significant liability for removal costs and certain other consequences of a product spill such as natural resource damages, where the product spills into regulated waters, along federal shorelines or in the exclusive economic zone of the U.S. In the event of a product spill from one of our facilities into regulated waters, substantial liabilities could be imposed. States in which we operate have also enacted similar laws. The CWA imposes restrictions and strict controls regarding the discharge of pollutants into regulated waters. This law and comparable state laws require that permits be obtained to discharge pollutants into regulated waters and impose substantial potential liability for non-compliance. Compliance with these laws is not expected to have a material adverse effect on our business, financial position, results of operations or cash flows.
Air Emissions. Our operations are subject to the federal Clean Air Act (“CAA”) and comparable state and local laws and regulations, which regulate emissions of air pollutants from various industrial sources, including certain of our facilities, and impose various operating, monitoring and reporting requirements. Such laws and regulations may require that we obtain pre-approval for the construction or modification of certain projects or facilities expected to produce or increase air emissions, obtain and strictly comply with air permits and regulations containing various emissions and operational limitations and utilize specific emission control technologies to limit emissions. Failure to comply with these requirements could subject us to monetary penalties, injunctions, conditions or restrictions on operations and, potentially, criminal enforcement actions. We may be required to incur certain capital expenditures in the future for air pollution control equipment in connection with obtaining and maintaining operating permits and approvals for air emissions. We believe that our operations will not be materially adversely affected by such requirements.
Greenhouse Gas Emissions. The EPA has adopted regulations under existing provisions of the CAA that require certain large stationary sources to obtain pre-construction permits and operating permits for greenhouse gas emissions. In addition, the EPA requires the monitoring and reporting of greenhouse gas emissions from certain large greenhouse gas emissions sources, including petroleum facilities.
Federal and state legislative and regulatory initiatives may attempt to further address climate change or control or limit greenhouse gas emissions. Although it is not possible at this time to predict how they would impact our business, any such future laws or regulations could adversely affect demand for the products that we transport, store and distribute. Depending on the particular programs adopted, they could also increase our costs to operate and maintain our facilities by requiring that we measure and report our emissions, install new emission controls on our facilities, acquire allowances to authorize our emissions, pay any taxes related to our emissions and administer and manage an emissions program, among other things. We may be unable to include some or all of such increased costs in the rates charged to our customers and any such recovery may depend on events beyond our control, including the outcome of future rate proceedings before the FERC or state regulatory agencies and the provisions of any final legislation or implementing regulations.
Finally, many scientific studies conclude that increasing concentrations of greenhouse gases in the Earth’s atmosphere affect climate changes, which could result in the increased frequency and severity of storms, floods and
16
other climatic events. If any such effects were to occur, there may be an increased potential for adverse effects on our assets and operations.
Maintenance. Our pipeline systems are subject to regulation by the U.S. Department of Transportation’s Pipeline and Hazardous Materials Safety Administration (“PHMSA”) under the Hazardous Liquid Pipeline Safety Act of 1979, as amended (“HLPSA”). The HLPSA prescribes and enforces minimum federal safety standards for the transportation of hazardous liquids by pipeline including the design, construction, testing, operation and maintenance, spill response planning, and overall reporting and management related to our pipeline facilities. In addition to the amended HLPSA covered in Title 49 of the Code of Federal Regulations, subsequent statutes provide the framework for the pipeline hazardous liquid safety program and include provisions related to PHMSA’s authorities, administration, and regulatory activities. Most recently these statutes include the Pipeline Inspection, Protection, Enforcement and Safety Act of 2006, the Pipeline Safety, Regulatory Certainty, and Job Creation Act of 2011 and the Protecting our Infrastructure of Pipelines Enhancing Safety Act of 2016.
On October 1, 2019 PHMSA published in the Federal Register amendments to the Pipeline Safety Regulations codified at Title 49 of the Code of Federal Regulations. The revised rule includes, among other items, the requirement for integrity assessments at least once every 10 years for pipeline segments located outside of high consequence areas (“HCAs”) and requires all pipelines in HCAs to be capable of accommodating in-line inspection tools within 20 years unless basic construction cannot accommodate in-line inspection tools. The revised rule modified the definition of hazardous liquids to include ethanol, methanol, or other non-petroleum fuel which is flammable, toxic, or harmful to the environment and requires Geographic Information System (“GIS”) spatial data integration and analysis within the Integrity Management Program that includes defined data integration attributes which must be incorporated by October 1, 2022. Unless noted otherwise in the Federal Register notice, all requirements of the rule will take effect on July 1, 2020. We believe the revised rule will not have a material impact on our business.
PHMSA is advancing additional rulemakings regarding rupture detection, the installation of remotely controlled valves on newly constructed or entirely replaced hazardous liquid pipelines and revisions to the required repair criteria for integrity assessments. We believe that compliance with such regulatory changes will not have a material adverse effect on our results of operations.
In addition to regulations applicable to all of our pipelines, we have undertaken additional obligations to mitigate potential risks to health, safety and the environment on our Longhorn pipeline. Our compliance with these incremental obligations is subject to the oversight of the U.S. Department of Transportation through PHMSA.
States are largely preempted by federal law from regulating pipeline safety for interstate lines, but most states are certified by the U.S. Department of Transportation to assume responsibility for enforcing federal intrastate pipeline regulations and inspection of intrastate pipelines. States may adopt stricter standards for intrastate pipelines than those imposed by the federal government for interstate lines; however, states vary considerably in their authority and capacity to address pipeline safety. State standards may include requirements for facility design and management in addition to requirements for pipelines.
Our marine terminals along coastal waterways are subject to U.S. Coast Guard regulations and comparable state and municipal statutes relating to the design, installation, construction, testing, operation, replacement and management of these assets.
Safety. Our assets are subject to the requirements of the federal Occupational Safety and Health Act (“OSHA”) and comparable state statutes, which, among other things, require us to organize and disclose information about the hazardous materials used in our operations. Certain parts of this information must be reported to employees, contractors, state and local governmental authorities and local citizens upon request. We are subject to OSHA process safety management regulations and EPA risk management plan rules that are designed to identify and establish procedures to prevent or minimize the consequences of catastrophic releases of toxic, reactive, flammable or explosive chemicals. Compliance with these laws is not expected to have a material adverse effect on our business, financial position, results of operations or cash flows.
17
Security. Our assets can be subject to both physical and cyber security regulations depending on the nature of the facility. Some of our assets are regulated by the Department of Transportation, the EPA, the United States Coast Guard and the Department of Homeland Security (“DHS”). Compliance with these regulations is achieved by creating physical security plans, minimal physical security standards, marine terminal security drills and annual security audits of both marine and DHS-regulated facilities. Compliance with these laws is not expected to have a material adverse effect on our business, financial position, results of operations or cash flows.
Title to Properties
Substantially all of our pipelines are constructed on rights-of-way granted by the apparent record owners of the property, and in some instances, these rights-of-way have limited terms that may require periodic renegotiation or, if such negotiations are unsuccessful, may require us to seek to exercise the power of eminent domain where such remedy is available. Several rights-of-way for our pipelines and other real property assets are shared with other pipelines and by third parties. In many instances, lands over which rights-of-way have been obtained are subject to prior liens, which have not been subordinated to the rights-of-way grants. We have obtained permits from public authorities to cross over or under, or to lay facilities in or along, water courses, county roads, municipal streets and state highways, and in some instances, these permits are revocable at the election of the grantor. We have also obtained permits from railroad companies to cross over or under lands or rights-of-way, many of which are also revocable at the grantor’s election. In some cases, property for pipeline purposes was purchased in fee. In some states and under some circumstances, we have the right of eminent domain to acquire rights-of-way and land necessary for our pipelines.
Some of the leases, easements, rights-of-way, permits and licenses that have been transferred to us are only transferable with the consent of the grantor of these rights, which in some instances is a governmental entity. We believe that we have obtained or will obtain sufficient third-party consents, permits and authorizations to operate our business in all material respects.
We believe that we have satisfactory title to all of our assets. Although title to our properties is subject to encumbrances in some cases, such as customary interests generally retained in connection with the acquisition of real property, liens that can be imposed in some jurisdictions for government-initiated action to clean up environmental contamination, liens for current taxes and other burdens, and easements, restrictions and other encumbrances to which the underlying properties were subject at the time of acquisition, we believe that none of these burdens should materially detract from the value of our properties or from our interest in them or should materially interfere with their use in the operation of our business.
Employees
As of December 31, 2019, we had 1,884 employees, 878 of which were assigned to our refined products segment and concentrated in the central U.S., with approximately 26% of these employees represented by the United Steel Workers and covered by a collective bargaining agreement that expires in January 2022. At December 31, 2019, 224 of our employees were assigned to our crude oil segment and were concentrated in the central U.S., and none of these employees were covered by a collective bargaining agreement. There were 210 employees assigned to our marine storage segment at December 31, 2019, primarily in the Gulf and East Coast regions of the U.S., with approximately 14% of these employees represented by the International Union of Operating Engineers (“IUOE”) and covered by a collective bargaining agreement that expires in October 2020. All of the IUOE employees are located at the New Haven terminal, which we have agreed to sell. We expect the transaction to close as soon as first quarter of 2020.
(d) [Reserved.]
18
(e) Available Information
Our internet address is www.magellanlp.com. We make available free of charge on or through our website our annual report on Form 10-K, quarterly reports on Form 10-Q, current reports on Form 8-K and amendments to those reports filed or furnished pursuant to Section 13(a) or 15(d) of the Securities Exchange Act of 1934, as amended (the “Exchange Act”), as soon as reasonably practicable after we electronically file such material with, or furnish it to, the SEC.
Item 1A. Risk Factors
The nature of our business activities subjects us to a wide variety of hazards and risks. The following is a summary of the most significant risks relating to our business activities that we have identified. In addition to the factors discussed elsewhere in this Annual Report on Form 10-K, you should carefully consider the risks and uncertainties described below, which could have a material adverse effect on our business, financial condition or results of operations. These risks are not the only risks that we face. Our business could be impacted by additional risks and uncertainties not currently known or that we currently believe to be immaterial. If any of the events or circumstances described in these risks actually occur, they could materially harm our business, financial condition or results of operations and impair our ability to implement our business plans or complete development projects as scheduled.
Risks Related to Our Business
Neither our cash distributions nor any unit repurchases are guaranteed to occur. The cash that we generate from operations could decrease or fail to meet expectations, either of which could reduce our ability to pay cash distributions and repurchase our common units.
The amount of cash we can distribute to our unitholders principally depends upon the cash we generate from our operations, as well as cash reserves established by our general partner. Our distributable cash flow does not depend solely on profitability, which is affected by non-cash items. As a result, we could pay cash distributions during periods when we record net losses and could be unable to pay cash distributions during periods when we record net income. In addition, the amount of cash we generate from operations is affected by numerous factors beyond our control, fluctuates from quarter to quarter and may change over time. Significant or sustained reductions in the cash generated by our operations would reduce our ability to pay cash distributions.
Additionally, our general partner’s board of directors recently authorized the repurchase of up to $750 million of our common units through 2022. Our unit repurchase program does not obligate us to acquire a specific number of units during any period, and our decision to commence, discontinue or resume repurchases in any period will depend on many factors, including some of the factors used to determine our ability to pay cash distributions. Any failure to pay distributions at expected levels or the discontinuation of our unit repurchase program could result in a loss of investor confidence and a decrease in the value of our unit price.
Our financial results depend on the demand for the petroleum products that we transport, store and distribute. Unfavorable economic conditions, technological changes, regulatory developments or other factors in the U.S. or global marketplace could result in lower demand for these products for a sustained period of time.
Any sustained decrease in demand for petroleum products in the markets served by our pipelines or terminals could result in a significant reduction in the volume of products that we transport, store or distribute, and thereby reduce our cash flow and our ability to pay cash distributions. Global economic conditions have from time to time resulted in reduced demand for the products transported and stored by our pipelines and terminals and consequently for the services that we provide. Our financial results may also be affected by uncertain or changing economic conditions within certain regions or by supply or demand shifts between regions. If economic and market conditions remain uncertain or adverse conditions persist for an extended period, we could experience material adverse impacts to our business, financial condition or results of operations.
19
Other factors that could lead to a decrease in demand for the petroleum products we transport, store and distribute include:
• | an increase in the use of alternative fuel sources, such as ethanol, biodiesel, natural gas, fuel cells, solar power, wind power, electric and battery-powered engines and geothermal energy. Several governments and some automobile manufacturers have announced plans to significantly reduce or eliminate the use of traditional petroleum fuel powered vehicles, and significant increases in the production of electric vehicles are widely expected. In addition, current U.S. laws require a significant increase in the quantity of ethanol and biodiesel used in transportation fuels each year until 2022. Increases in the use of such alternative fuels could have a material adverse impact on the volume of petroleum-based fuels transported on our pipelines or distributed through our terminals; |
• | an increase in transportation fuel economy, whether as a result of a shift by consumers to more fuel-efficient vehicles, technological advances by manufacturers or federal, state or international regulations. Government regulations require increasing improvements in fuel economy standards. These standards are intended to reduce demand for petroleum products and could reduce demand for our services; |
• | changes in population or changes in consumer preferences, rates of automobile ownership or driving patterns in the markets we serve; |
• | an increase or decrease in the market prices of petroleum products, which may reduce supply or demand. Petroleum product prices have been volatile in recent years, and that volatility may continue in ways that we are unable to predict; |
• | higher fuel taxes or other governmental or regulatory actions that increase the cost of the products we handle; and |
• | lower exports of petroleum products to global markets resulting from weak economic conditions, regulatory changes, changing preferences for the type of petroleum products we export or preferences for alternative energy sources. |
A decrease in crude oil production in the basins served by our crude oil pipelines could reduce our revenues, which could adversely impact our results of operations and the amount of cash we generate.
Numerous factors can cause reductions in crude oil production in the regions served by our pipelines, including, among other factors, lower overall crude oil prices, regional price or quality differences, higher costs of crude oil production, exhaustion of reserves, weather or other natural causes, epidemics, adverse regulatory or legal developments, disruptions in financial or credit markets that inhibit production, or lower overall demand for crude oil and the products derived from crude oil. Crude oil prices have historically exhibited significant volatility and are influenced by, among other factors, worldwide and domestic supplies of and demand for crude oil, political and economic developments in often-volatile producing regions, actions taken by the Organization of Petroleum Exporting Countries, technological developments, government regulations, taxes, policies regarding the importing and exporting of crude oil and conditions in global financial markets.
We are unable to predict future prices of crude oil or what impact the crude price environment will have on future production overall or specifically on production in the basins we serve. Lower production in the regions served by our pipelines could result in lower shipments of uncommitted volume or could cause us to be unable to renew our contracts at existing volumes or rates. Any sustained decrease in the production of crude oil in the regions served by our crude oil pipelines could result in a significant reduction in the volume of products that we transport or the rates we are able to charge for such transportation services or both, thereby reducing our cash flow and our ability to pay cash distributions.
20
We depend on producers, gathering systems, refineries and petroleum pipelines owned and operated by others to supply our assets.
We depend on crude oil production and on connections with gathering systems, refineries and petroleum pipelines owned and operated by third parties to supply our assets. We cannot control or predict the amount of crude oil that will be delivered to us by the gathering systems and pipelines that supply our crude oil assets, nor can we control or predict the output of refineries that supply our refined products pipelines and terminals. Changes in the quality or quantity of this crude oil production, outages at these refineries or reduced or interrupted throughput on these gathering systems or pipelines due to weather-related or other natural causes, competitive forces, testing, line repair, damage, reduced operating pressures or other causes could reduce shipments on our pipelines or result in our being unable to receive products at or deliver products from our terminals or receive products for processing at our condensate splitter, any of which could materially adversely affect our cash flows and ability to pay cash distributions.
The closure of refineries that supply or are supplied by our refined products or crude oil pipelines could result in disruptions or reductions in the volumes we transport and store and in the amount of cash we generate.
Refineries that supply or are supplied by our facilities are subject to regulatory developments, including but not limited to regulations regarding fuel specifications, plant emissions and safety and security requirements that could significantly increase the cost of their operations and reduce their operating margins. For example, independent refiners have reported the costs to comply with renewable fuel standards have led to significant financial distress and at least one refiner cited the cost of renewable fuel standards compliance as a major reason behind its bankruptcy. In addition, the profitability of the refineries that supply our facilities is subject to regional and global supply and demand dynamics that are difficult to predict. A period of sustained weak demand or increased cost of supply could make refining uneconomic for some refineries, including those located along our refined products and crude oil pipelines. The closure of a refinery that delivers product to or receives crude from our pipelines could reduce the volumes we transport and the amount of cash we generate. Further, the closure of these or other refineries could result in our customers electing to store and distribute petroleum products through their proprietary terminals, which could result in a reduction of our storage volumes.
A decrease in contract renewals or renewals at lower rates or shorter terms could cause our revenue to decline or be more volatile, which could adversely impact our results of operations and the amount of cash we generate and our ability to make cash distributions.
A significant portion of the revenue we earn from transportation and storage services is received pursuant to multi-year contracts negotiated with our customers. Many of those contracts require our customers to pay for our services regardless of market conditions during the contract period. Changing market conditions, including changes in petroleum product supply or demand patterns, competitive factors, forward-price structure, financial market conditions, regulations, accounting rules or other factors could cause our customers to be unwilling to renew their contracts with us when those contracts terminate, or make them willing to renew only at lower rates or for shorter contract periods. For example, we have contracts that expire in late 2020, and we expect the rate we earn on the related capacity will be lower than provided for in the current contracts. Failure by our customers to renew any of their contracts with us on terms and at rates substantially similar to our existing contracts could result in lower utilization of our assets or cause our revenues to decline or be more volatile, any of which could adversely affect our results of operations, financial position and our ability to make cash distributions.
Competition could lead to lower levels of profits and reduce the amount of cash we generate.
We compete with other pipelines and terminals, as well as other modes of transportation, that provide similar services in the same markets as our assets. In addition, our competitors could construct new assets or redeploy existing assets in a manner that would result in more intense competition in the markets we serve. For example, storage facilities previously used to support refineries or other facilities have in some cases been redeployed to provide services that compete with our own services. Similarly, in some cases pipelines previously used to provide
21
services that did not compete with us have been repurposed to provide services that directly compete with certain of our services.
We compete with other transportation, storage and distribution alternatives on the basis of many factors, including but not limited to rates, service levels and offerings, geographic location, connectivity and reliability. Our customers could utilize the assets and services of our competitors instead of our assets and services, or we could be required to lower our prices or increase our costs to retain our customers.
Many of the competitors of our crude oil segment conduct extensive crude oil gathering and marketing activities that could enhance their competitive position. We conduct limited intrastate crude oil marketing and no gathering activities, and if we are unable to conduct activities and offer services similar to those conducted and offered by our competitors, our competitive position could be negatively impacted.
Any of these or other competitive forces could materially adversely affect our results of operations, financial position or cash flows, as well as our ability to pay cash distributions.
Our business is subject to the risk of a capacity overbuild in some of the markets in which we operate.
We and our joint ventures have made significant investments in new energy infrastructure to meet market demand, as have several of our competitors. For example, we have invested significantly in pipelines to deliver crude oil from the Permian Basin in west Texas to markets along the U.S. Gulf Coast and from the DJ Basin in Colorado to Cushing, Oklahoma. Similar investments have been made and additional investments may be made in the future by us, our competitors or by new entrants to the markets we serve. The success of these and similar projects largely relies on the realization of anticipated market demand, and these projects typically require significant development periods, during which time demand for such infrastructure may change, or additional investments by competitors may be made. Investments by us or others in new pipelines, storage or dock capacity could result in capacity that exceeds demand, which could reduce the utilization of our services or the prices we are able to charge for those services. For example, the development of new pipeline capacity from the Permian Basin, including several projects still under construction, will result in takeaway capacity that significantly exceeds current production. This excess capacity is expected to decrease the differential between the Permian and end markets, including Houston, resulting in a highly competitive environment for our transportation services and reducing the rates we are able to charge for those services. When infrastructure investments in the markets we serve result in capacity that exceeds the demand in those markets, our facilities could be underutilized, and we could be forced to reduce the rates we charge for our services, which could materially adversely affect our results of operations, financial position or cash flows, as well as our ability to pay cash distributions.
Mergers among our customers and competitors could result in lower volumes being shipped on our pipelines or products stored in or distributed through our terminals, thereby reducing the amount of cash we generate.
Mergers among our existing customers and our competitors could provide strong economic incentives for the combined entities to utilize their existing systems instead of ours in those markets where our systems compete. As a result, we could lose some or all of the volumes and associated revenue from these customers. As a significant portion of our operating costs are fixed, a reduction in volumes would result not only in less revenue, but also a decline in cash flow of a similar magnitude, which could materially adversely affect our results of operations, financial position or cash flows, as well as our ability to pay cash distributions.
Reduced volatility in energy prices or new government regulations could discourage our storage customers from holding positions in petroleum products, which could adversely affect the demand for our storage services.
We have constructed new storage tanks in response to customer demand. Many of our competitors have also built new storage facilities. The demand for new storage has resulted in part from our customers’ desire to have the ability to take advantage of profit opportunities created by volatility in the prices of petroleum products. Periods of prolonged stability in petroleum product prices or extended declining trends of prices could reduce demand for our storage services. If federal, state or international regulations are passed that discourage our customers from storing
22
these commodities, demand for our storage services could decrease, in which case we may be unable to identify customers willing to contract for such services or be forced to reduce the rates we charge for our services. The realization of any of these risks could materially reduce the amount of cash we generate.
The volume of crude oil we transport and the tariff rates we collect for transportation services partially depend upon unpredictable market differentials between our origin points and our destination points.
Our tariff rates are established in accordance with federal and state regulations which, in general, permit us to negotiate rates with shippers so long as such negotiated rates are not unduly discriminatory among similarly situated shippers. Applicable regulations and our obligations to certain classes of committed shippers may limit our ability to change our tariff rates. When the difference in market prices for crude oil between our origin points and our destination points is lower than our tariff rates, the volume of product we transport could decline or the tariff rate we collect could decrease. For example, when the posted tariff rate for transportation on the Longhorn pipeline is higher than the market differential, as experienced in late 2019, it is uneconomical for shippers to use Longhorn to move volumes from the Permian Basin to Houston. As a result, we experience lower revenues during such periods, which adversely impacts our results of operations and the amount of cash we generate.
Fluctuations in prices of petroleum products that we purchase and sell could materially adversely affect our results of operations.
We generate product sales revenue from our gas liquids blending, fractionation and intrastate crude oil marketing activities, as well as from the sale of product generated by the operations of our pipelines and terminals. We also maintain product inventory related to these activities. Significant fluctuations in market prices of petroleum products could result in unrealized gains or losses on transactions we enter to hedge our exposure to commodity price changes. To the extent these transactions have not been designated as hedges for accounting purposes, the associated unrealized gains and losses directly impact our reported results of operations. In addition, significant fluctuations in market prices of petroleum products could result in losses or lower profits from these activities, thereby reducing the amount of cash we generate and our ability to pay cash distributions.
We hedge prices of petroleum products by utilizing physical purchase and sale agreements and exchange-traded futures contracts. These hedging arrangements do not eliminate all price risks, could result in fluctuations in quarterly or annual financial results and could result in material cash obligations that could negatively impact our financial position or our ability to pay distributions to our unitholders. Further, non-compliance with our risk management policies and procedures could result in significant losses.
We hedge our exposure to price fluctuations for our petroleum products purchase and sale activities by utilizing physical purchase and sale agreements and exchange-traded futures contracts. To the extent these hedges do not qualify for hedge accounting treatment or are not designated as hedges, or if they result in material amounts of ineffectiveness, we could experience material fluctuations in our quarterly or annual reported results of operations. We may be required to post margin in connection with these hedges, which could result in material and unpredictable demands on our liquidity. These contracts may be for the purchase or sale of product in markets for a time frame different from those in which we are attempting to hedge our exposure, resulting in hedges that do not eliminate all price risks. In addition, our product sales and hedging operations involve the risk of non-compliance with our risk management policies. We cannot assure that our processes and procedures will detect and prevent all violations of our risk management policies, particularly if deception or other intentional misconduct is involved. If we incur a material loss related to commodity price risks, including as a result of non-compliance with our risk management policies and procedures, our results of operations or cash flows could be materially negatively impacted, which could have a negative impact on our unit price. Further, our requirement to post material amounts of margin in connection with our hedges could materially negatively impact our liquidity and our ability to pay cash distributions to our unitholders.
23
Changes in price levels could negatively impact our revenue, our expenses, or both, which could materially adversely affect our results from operations, our liquidity and our ability to pay cash distributions.
The operation of our assets and the execution of expansion projects require significant expenditures for labor, materials, property, equipment and services. Increases in the cost of these items could materially increase our expenses or capital costs. We may not be able to pass these increased costs on to our customers in the form of higher fees for our services.
Because we use the FERC’s PPI-based price indexing methodology to establish tariff rates in certain markets served by our pipelines, our revenues may be impacted by changes in price levels. The FERC’s indexing methodology is subject to review every five years and limits a pipeline’s rates in such markets each year to a new ceiling level, which is calculated as the previous year’s ceiling level multiplied by a percentage. For the five-year period beginning July 1, 2016, the indexing method provides for annual changes equal to the change in the PPI-FG plus 1.23%. This methodology could result in changes in our revenue that do not fully reflect changes in the costs we incur to operate and maintain our pipelines. For example, our costs could increase more quickly or by a greater amount than the PPI-FG index plus 1.23% used by the current FERC methodology. Further, in periods of general price deflation, the ceiling level provided for by the FERC’s index methodology could decrease requiring us to reduce our index-based rates, even if the actual costs we incur to operate our assets increase. Changes in price levels that lead to decreases in our revenue or increases in the prices we pay to operate and maintain our assets could materially adversely affect our results of operations, financial position or cash flows, as well as our ability to pay cash distributions.
Our business involves many hazards and operational risks, the occurrence of which could materially adversely affect our results of operations, financial position or cash flows and our ability to pay cash distributions. Non-compliance with our policies and procedures could result in significant losses.
Our operations are subject to many hazards inherent in the transportation and distribution of petroleum products, including ruptures, leaks and fires. In addition, our operations are exposed to potential natural disasters, including hurricanes, tornadoes, storms, floods and earthquakes. For example, in 2017, Hurricane Harvey hit the Texas Gulf Coast, disrupting our operations and negatively impacting our financial results. The risk of natural disasters and other operational risks could result in substantial losses due to personal injury or loss of life, severe damage to and destruction of property and equipment and pollution or other environmental damage, and may result in curtailment or suspension of our related operations. Some of our assets are located in or near high consequence areas such as residential and commercial centers or sensitive environments, and the potential damages are even greater in these areas. If a significant accident or event occurs or if any of our employees or agents violate or fail to observe the various policies and procedures we have adopted, including operational policies, safety policies and our code of business conduct, it could materially adversely affect our results of operations, financial position or cash flows and our ability to pay cash distributions.
Many of our storage tanks and significant portions of our pipeline system have been in service for several decades.
Our pipeline and storage assets are generally long-lived assets. As a result, some of our assets have been in service for several decades. The age and condition of these assets could result in increased maintenance or remediation expenditures and an increased risk of product releases and associated costs and liabilities. Any significant increase in these expenditures, costs or liabilities could materially adversely affect our results of operations, financial position or cash flows, as well as our ability to pay cash distributions.
We do not own all of the property on which our pipelines and facilities are located, and we rely on securing and retaining adequate rights-of-way and permits in order to operate our existing assets and complete growth projects.
We do not own all of the land on which our pipelines and facilities are located. As such, we are subject to the possibility of increased costs to retain necessary land use. In those instances in which we do not own the land on
24
which our facilities are located, we obtain the rights to construct and operate our pipelines on land owned by third parties or governmental agencies for a specific period of time. In addition, some of our facilities cross Native American lands pursuant to rights-of-way of limited terms. We may not be able to utilize the right of eminent domain in some jurisdictions and in some circumstances, such as land owned by Native American tribes or other government entities. Our ability to secure required permits and rights-of-way or otherwise proceed with construction of our expansion projects could encounter opposition from activists who may attempt to delay construction through protests and other means. The loss of these rights, through our inability to acquire or renew right-of-way contracts or otherwise, could have a material adverse effect on our business, financial condition, results of operations, cash flows and our ability to make cash distributions to unitholders.
Our insurance coverage may not be adequate to cover losses sustained and we may experience increased costs and decreased availability of insurance options.
We are not fully insured against all hazards or operational risks related to our businesses, and the insurance we carry requires that we meet certain deductibles before we can collect for any covered losses we sustain. If a significant accident or event occurs that is not fully insured, it could materially adversely affect our results of operations, financial position or cash flows and our ability to pay cash distributions.
Premiums and deductibles for our insurance policies could escalate as a result of market conditions or losses experienced by us or by other companies. In some instances, insurance could become unavailable or available only for reduced amounts of coverage. Increases in the cost of insurance or the inability to obtain insurance at rates that we consider commercially reasonable could materially affect our results of operations, financial position or cash flows and our ability to pay cash distributions.
Terrorist attacks aimed at our facilities or that impact our customers or the markets we serve could materially adversely affect our business.
The U.S. government has issued warnings that energy assets in general, and the nation’s pipeline and terminal infrastructure in particular, may be targets of terrorist organizations. The threat of terrorist attacks subjects our operations to increased risks. Any terrorist attack on our facilities, those of our customers or, in some cases, on energy infrastructure owned by others, could have a material adverse effect on our business. Similarly, any terrorist attack that severely disrupts the markets we serve could materially adversely affect our results of operations, financial position or cash flows, as well as our ability to pay cash distributions.
Cyber-attacks, or other information security breaches, that circumvent security measures taken by us or others with whom we conduct business or share information could result in increased costs or other damage to our business.
We rely on our information technology infrastructure to process, transmit and store electronic information, including information we use to operate our assets. In addition, we rely on third-party systems, including for example the electric grid and cloud-based software services, which could also be subject to security breaches or cyber-attacks, and the failure of which could have a material adverse effect on the operation of our assets. We and our third-party providers face cybersecurity and other security threats to our information technology infrastructure, which could include threats to our control systems and safety systems that operate our pipelines and other assets. We could face unlawful attempts to gain access to our information technology infrastructure, including coordinated attacks from hackers, including state-sponsored groups, “hacktivists” or private individuals. The age, operating systems or condition of our current information technology infrastructure and software assets and our ability to maintain and upgrade such assets could adversely affect our ability to resist cybersecurity threats. We could also face attempts to obtain unauthorized access by targeting acts of deception against individuals with legitimate access to physical locations or information.
Breaches in our information technology infrastructure or physical facilities, or other disruptions including those arising from theft, vandalism, fraud or unethical conduct, could result in damage to our assets, unnecessary waste, safety incidents, damage to people, property and the environment, reputational damage, potential liability or
25
the loss of contracts, and could materially adversely affect our results of operations, financial position or cash flows, as well as our ability to pay cash distributions.
Failure of critical information technology systems may impact our ability to operate our assets or manage our businesses, thereby reducing the amount of cash available for distribution.
We utilize information technology systems to operate our assets and manage our businesses. Some of these systems are proprietary systems that require specialized programming capabilities, while others are based upon or rely on technology that has been in service for many years. Failures of these systems could result in a failure of critical operational or financial controls and lead to a disruption of our operations, commercial activities or financial processes. Such failures could materially adversely affect our results of operations, financial position or cash flow, as well as our ability to pay cash distributions.
Our expansion projects may not immediately produce operating cash flows and may exceed our cost estimates or experience delays.
We have undertaken numerous large expansion projects that have required and will continue to require us to make significant capital investments. We often finance those projects primarily with new borrowings, and we will incur financing costs during the planning and construction phases of these projects; however, the operating cash flows we expect these projects to generate will not materialize until sometime after the projects are completed, if at all. As a result, our indebtedness relative to our earnings may increase during the period prior to the generation of those operating cash flows. In addition, the amount of time and investment necessary to complete these projects could materially exceed the estimates we used when determining whether to undertake them. For example, we must
compete with other companies for the materials and construction services required to complete these projects, and competition for these materials or services could result in significant delays or cost overruns.
Similarly, we must secure and retain required permits and rights-of-way in order to complete and operate these projects, and our inability to do so in a timely manner could result in significant delays or cost overruns. Our ability to secure required permits and rights-of-way or otherwise proceed with construction of our expansion projects could encounter opposition from political activists, who may attempt to delay energy infrastructure construction through protests and other means. Further, in many instances, the operations of our expansion projects are subject to the completion by third parties of connections or other related projects that are beyond our control. Delays or unanticipated costs associated with these third parties in the completion of these related projects could result in delays or cost overruns in the start-up of our own projects. In addition, we run the risk of failing to meet commitments to our customers as a result of project delays, which in some cases could allow our customers to terminate their commitments to us or otherwise negatively impact customer relationships and future financial results. Any cost overruns or unanticipated delays in the completion or commercial development of our expansion projects could reduce the anticipated returns on these projects, which in turn could materially increase our leverage and reduce our liquidity and our ability to pay cash distributions.
Potential future acquisitions and expansions may affect our business by substantially increasing the level of our indebtedness and liabilities, subjecting us to the risk of being unable to effectively integrate the new operations and diluting our unitholders.
From time to time we evaluate and acquire assets and businesses. We may issue significant amounts of additional equity securities and incur substantial additional indebtedness to finance future acquisitions, and our capitalization and results of operations may change significantly as a result. Our unitholders may not have an opportunity to review or evaluate the information and assumptions we use to determine whether to pursue an acquisition. An acquisition that we expect to be accretive could nevertheless reduce our cash from operations if we rely on faulty information, make inaccurate assumptions, assume unidentified liabilities or otherwise improperly value the acquired assets. In addition, any equity securities we issue to finance acquisitions would dilute our existing unitholders and could reduce our cash flow available for distribution on a per unit basis.
26
Acquisitions and business expansions involve numerous risks, including but not limited to difficulties in the assimilation of the assets and operations of the acquired businesses, inefficiencies and difficulties that arise due to our unfamiliarity with new assets and the businesses associated with them and their markets, challenges in managing or retaining new employees and establishing relationships with and retaining new customers and business partners, and the diversion of management’s attention from other business concerns. Further, unexpected costs and challenges may arise whenever businesses with different operations or management are combined, and we may experience unanticipated delays in realizing the benefits of an acquisition. Following an acquisition, we may discover previously unknown material liabilities associated with the acquired business for which we have no recourse from the seller.
We compete for acquisitions and new projects with numerous other established energy companies and many other potential investors. Increased competition for acquisitions or growth projects could limit our ability to execute our growth strategy or could result in our executing that strategy on substantially less attractive terms than we have previously experienced, either of which could have a material adverse effect on our results of operations or cash flows, as well as our ability to pay cash distributions.
Failure to generate or complete additional growth projects or make future acquisitions could reduce our ability to maintain or increase cash distributions to our unitholders.
Our ability to make cash distributions to our unitholders depends to a significant degree on our ability to successfully identify and execute additional growth projects and acquisitions. We face significant uncertainties and competition in the pursuit of such opportunities. For example, decisions regarding new growth projects rely on numerous estimates, including among other factors, predictions of future demand for our services, future supply shifts, crude oil production estimates, commodity price environments, regulatory developments, economic conditions and potential changes in the financial condition of our customers. Our predictions of such factors could cause us to forego certain investments or to lose opportunities to competitors who make investments based on more aggressive predictions or who are generally more tolerant of risk. Valuations of energy infrastructure assets have generally been elevated in recent years, which has made it difficult for us to be successful in our attempts to acquire new assets, as other bidders for those assets have been willing to pay prices and accept terms that did not meet our risk and return criteria. We cannot be certain that our own predictions are more accurate than those of other bidders, and our approach to risk could cause us to miss opportunities that could otherwise have created value for our unitholders. If we are unable to acquire new assets or develop additional expansion projects, we may not be able to maintain or increase cash distributions to our unitholders.
We do not have the same flexibility as other types of organizations to accumulate cash and retained earnings to protect against illiquidity in the future, and we rely on access to capital to fund acquisitions and growth projects and to refinance existing debt obligations. Unfavorable developments in capital markets could limit our ability to obtain funding or require us to secure funding on terms that could limit our financial flexibility, reduce our liquidity, dilute the interests of our existing unitholders and reduce our cash flows and ability to pay distributions or repurchase our units.
Our partnership agreement requires us to make quarterly distributions to our unitholders of all available cash, after taking into account reserves established by the board of directors of our general partner for commitments and contingencies, including capital investments, operating costs and debt service requirements. In addition, our general partner’s board of directors recently authorized the repurchase of up to $750 million of our common units through 2022. As a result, we do not accumulate equity in the form of retained earnings in a manner typical of many other forms of organization, including most traditional public corporations, and so are more likely than those organizations to require issuances of additional capital to finance our growth plans, meet unforeseen cash requirements and service our debt.
We regularly consider and pursue growth projects and acquisitions as part of our efforts to increase cash available for distribution to our unitholders. These transactions can be effected quickly, may occur at any time and may be significant in size relative to our existing assets and operations. For example, we estimate that we will spend approximately $400 million to complete our current slate of organic growth projects. We generally do not retain
27
sufficient cash flow to finance such projects or to finance major acquisitions, and consequently the execution of these plans requires regular access to external sources of capital. Similarly, we generally do not retain sufficient cash flow to repay our indebtedness when it matures, and we rely on new capital to refinance these obligations. Any limitations on our access to capital on satisfactory terms will impair our ability to execute on our strategies and could materially reduce our liquidity and our ability to make cash distributions.
Limitations on our access to capital, including on our ability to issue additional debt and equity, could result from events or causes beyond our control, and could include, among other factors, decreases in our creditworthiness or profitability, significant increases in interest rates, increases in the risk premium generally required by investors or in the premium required specifically for investments in energy-related companies or master limited partnerships, and decreases in the availability of credit or the tightening of terms required by lenders. Any limitations on our ability to refinance these obligations by securing new capital on satisfactory terms could severely limit our liquidity, our financial flexibility or our cash flows, and could result in the dilution of the interests of our existing unitholders.
Increases in interest rates could increase our financing costs, reduce the amount of cash we generate and adversely affect the trading price of our units.
As of December 31, 2019, the face value of our outstanding fixed-rate debt was $4.75 billion. We have a commercial paper program under which we may issue commercial paper notes in an amount up to the available capacity under our $1.0 billion revolving credit facility, and we expect to make additional floating rate borrowings under our commercial paper program or revolving credit facility as needed. As a result, we would have exposure to changes in short-term interest rates. We may also use interest rate derivatives to effectively convert some of our fixed-rate notes to floating-rate debt, thereby increasing our exposure to changes in short-term interest rates. In addition, the execution of our growth strategy and the refinancing of our existing debt could require that we issue additional fixed-rate debt, and consequently we also have potential exposure to changes in long-term interest rates. Rising interest rates could reduce the amount of cash we generate and materially adversely affect our liquidity and our ability to pay cash distributions. Moreover, the trading price of our units is sensitive to changes in interest rates and could be materially adversely affected by any increase in interest rates.
Restrictions contained in our debt instruments may limit our financial flexibility.
We are subject to restrictions with respect to our debt that may limit our flexibility in structuring or refinancing existing or future debt and may prevent us from engaging in certain beneficial transactions. These restrictions include, among other provisions, the maintenance of certain financial ratios, as well as limitations on our ability to incur additional indebtedness, to grant liens or to repay existing debt without prepayment premiums. These restrictions could result in higher costs of borrowing and impair our ability to generate additional cash.
The amount and timing of distributions to us from our joint ventures is not within our control, and we may be unable to cause our joint ventures to take or refrain from taking certain actions that may be in our best interest. In addition, as construction manager and operator of the majority of our joint ventures, we are exposed to additional risk and liability in connection with our responsibilities in those capacities.
As of December 31, 2019, we were engaged in eight joint ventures, all of which are in the form of limited liability companies (“LLC”), in which we share control with other entities according to the relevant joint venture agreements. Those agreements provide that the respective LLC management committees, including our representatives along with the representatives of the other owners of those LLCs, determine the amount and timing of distributions. Our joint ventures may establish separate financing arrangements that contain restrictive covenants that may limit or restrict the LLC’s ability to make cash distributions to us under certain circumstances. Any inability to generate cash or restrictions on cash distributions we receive from our joint ventures could materially impair our results of operations, cash flows and our ability to pay cash distributions.
In the case of Double Eagle and Seabrook, an affiliate of our joint venture co-owner serves as operator, and consequently we rely on affiliates of our joint venture co-owner for many of the management functions of those joint ventures. Without the cooperation of the other owners of those joint ventures, we may not be able to cause our
28
joint ventures to take or not take certain actions, even though those actions or inactions may be in the best interest of us or the particular joint venture. With respect to our other joint ventures, we are the construction manager and operator, which exposes us to additional risk and liability in connection with our responsibilities in those capacities.
If we are unable to agree with our joint venture co-owners on a significant matter, it could result in delays, litigation or operational impasses that could result in a material adverse effect on that joint venture’s financial condition, results of operations or cash flows. If the matter is significant to us, it could result in a material adverse effect on our results of operations, financial position or cash flows. If we fail to make a required capital contribution, we could be deemed to be in default under the applicable joint venture agreement. Our joint venture co-owners may be permitted to pursue a variety of remedies, including funding any deficiency resulting from our failure to make such capital contribution, which would result in a dilution of our ownership interest, or, in some cases, our joint venture co-owners may have the option to purchase all of our existing interest in the subject joint venture.
Moreover, subject to certain limitations in the respective joint venture agreements, any joint venture owner may sell or transfer its ownership interest in a joint venture, whether in a transaction involving third parties or the other joint venture owners. Any such transaction could result in our being co-owners with different or additional parties with whom we have not had a previous relationship or who may not provide the same strengths and benefits as prior co-owners.
We are exposed to counterparty risk. Nonpayment, commitment termination or nonperformance by our customers, vendors, joint venture co-owners, lenders or derivative counterparties could materially reduce our revenue, increase our expenses, impair our liquidity or otherwise negatively impact our results of operations, financial position or cash flows and our ability to pay cash distributions.
We are subject to risks of loss resulting from nonpayment or nonperformance by our customers to whom we extend credit. In addition, we frequently undertake capital expenditures based on commitments from customers from which we expect to realize the expected return on those expenditures, including take-or-pay commitments from our customers. Nonperformance by our customers of those commitments or termination of those commitments resulting from our inability to timely meet our obligations could result in substantial losses to us. Nonperformance by customers who back our capital projects could significantly impact our expected return from those projects.
We have undertaken numerous projects that require cooperation with and performance by joint venture co-owners. For example, Seabrook is operated by our joint venture co-owner, LBC Tank Terminals, LLC, which also must make capital contributions to the joint venture. Nonperformance by our joint venture co-owners could result in increased costs or delays that could decrease our returns on our joint venture projects.
We utilize third-party vendors to provide various functions, including, for example, certain construction activities, engineering services, facility inspections and operation of certain software systems. Using third parties to provide these functions has the effect of reducing our direct control over the services rendered. The failure of one or more of our third-party providers to deliver the expected services on a timely basis at the prices we expect and as required by contract could result in significant disruptions, costs to our operation or instances of a contractor’s non-compliance with applicable laws and regulations, which could materially adversely affect our business, financial condition, operating results or cash flows.
We also rely to a significant degree on the banks that lend to us under our revolving credit facility for financial liquidity, and any failure of those banks to perform on their obligations to us could significantly impair our liquidity. Furthermore, nonpayment by the counterparties to our interest rate and commodity derivatives could expose us to additional interest rate or commodity price risk. Any take-or-pay commitment terminations or substantial increase in the nonpayment or nonperformance by our customers, vendors, lenders or derivative counterparties could have a material adverse effect on our results of operations, financial position or cash flows and our ability to pay cash distributions.
29
Rate regulation, challenges by shippers of the rates we charge on our refined products and crude oil pipelines or changes in the jurisdictional characterization of our assets or activities by federal, state or local regulatory agencies may reduce the amount of cash we generate.
The FERC regulates the rates we can charge and the terms and conditions we can offer for interstate transportation service on our refined products and crude oil pipelines. State regulatory authorities regulate the rates we can charge and the terms and conditions we can offer for intrastate movements on our refined products and crude oil pipelines. The determination of the interstate or intrastate character of shipments on our petroleum products pipelines may change over time, which may change the rates we are allowed to charge for transportation and other related services. Shippers may protest our pipeline tariff filings, and the FERC or state regulatory authorities may investigate tariff terms. Further, other than for rates set under market-based rate authority, the FERC may order refunds of amounts collected under interstate rates that are determined to be in excess of a just and reasonable level when taking into consideration our pipeline system’s cost-of-service. State regulatory authorities could take similar measures for intrastate tariffs. In addition, shippers may challenge by complaint the lawfulness of tariff rates that have become final and effective. The FERC and state regulatory authorities may also investigate tariff terms absent shipper complaint. If existing rates are determined to be in excess of a just and reasonable level, we could be required to pay refunds to shippers, reduce rates and make other concessions.
The FERC’s ratemaking methodologies may limit our ability to set rates based on our actual costs or may delay the use of rates that reflect increased costs. The FERC’s primary ratemaking methodology applicable to us is price indexing. We use this methodology to establish our rates in approximately 40% of the markets for our refined products pipelines. The FERC’s indexing methodology is subject to review every five years and currently allows a pipeline to change its rates each year to a new ceiling level, which is calculated as the previous year’s ceiling level multiplied by a percentage. For the five-year period beginning July 1, 2016, the indexing method provides for annual changes in rates by a percentage equal to the change in the PPI-FG plus 1.23%. When the ceiling level falls, as it did in 2015, we are required to reduce our rates that are subject to the FERC’s price indexing methodology.
The FERC and relevant state regulatory authorities allow us to establish rates based on conditions in competitive markets without regard to the FERC’s index level or our cost-of-service. We establish market-based rates in approximately 60% of the markets for our refined products pipelines. The tariffs on most of our crude oil pipelines are at negotiated rates, but are still subject to regulation by the FERC or state agencies and subject to protest by shippers. If we were to lose our market-based rate authority, or if our negotiated rates were determined to be not just and reasonable, we could be required to establish rates on some other basis, such as our cost-of-service, which could materially adversely reduce our revenues.
On March 15, 2018, the FERC issued a Revised Policy Statement on Treatment of Income Taxes in which the FERC found that an impermissible double recovery results from granting an MLP pipeline both an income tax allowance and a return on equity pursuant to the FERC’s discounted cash flow methodology. The FERC revised its previous policy, stating that it would no longer permit an MLP pipeline to recover an income tax allowance in its cost of service. The FERC stated that it would incorporate the effects of the policy changes and the Tax Cuts and Jobs Act of 2017 on industry-wide pipeline costs in the 2020 five-year review of the liquids pipeline index level. The FERC will also apply the revised Policy Statement and the Tax Cuts and Jobs Act of 2017 to initial crude oil pipeline cost-of-service rates and cost-of-service rate changes on a going-forward basis under the FERC’s existing ratemaking policies, including cost-of-service rate proceedings resulting from shipper-initiated complaints. This revised policy could result in a material decrease in the next index adopted by the FERC in 2021.
30
Our operations are subject to extensive environmental, health, safety and other laws and regulations that impose significant requirements, costs and liabilities on us. These requirements, costs and liabilities could increase as a result of new laws or regulations or changes in the interpretation, implementation or enforcement of existing laws and regulations. Our customers are also subject to extensive environmental, health, safety and other laws and regulations, and any new laws or regulations or changes in the interpretation, implementation or enforcement of existing laws and regulations, including laws and regulations related to hydraulic fracturing, could result in decreased demand for our services.
Our operations are subject to extensive federal, state and local laws and regulations relating to the protection or preservation of the environment, natural resources and human health and safety, including but not limited to the CAA, the RCRA, the Oil Pollution Act, the CWA, the CERCLA, the HLPSA, the Pipeline Safety, Regulatory Certainty and Job Creation Act of 2011 and OSHA. Such laws and regulations affect almost all aspects of our operations and generally require us to obtain and comply with various environmental registrations, licenses, permits, credits, inspections and other approvals. We incur substantial costs to comply with these laws and regulations, and any failure to comply may expose us to civil, criminal and administrative fees, fines, penalties and interruptions in our operations that could have a material adverse impact on our results of operations, financial position and prospects. For example, if an accidental release or spill of petroleum products, chemicals or other hazardous substances occurs at or from our pipelines, storage or other facilities, we may experience significant operational disruptions, and we may have to pay a significant amount to remediate the release or spill, pay government penalties, address natural resource damages, compensate for human exposure and property damage, install costly pollution control equipment or undertake a combination of these and other measures. The resulting costs and liabilities could materially adversely affect our results of operations, financial position or cash flows. In addition, emission controls required under the CAA and other similar laws could require significant capital expenditures at our facilities.
Liability under such laws and regulations may be incurred without regard to fault. Private parties, including the owners of properties through which our pipelines pass, also may have the right to pursue legal actions to enforce compliance as well as to seek damages for non-compliance with such laws and regulations or for personal injury or property damage. Our insurance does not cover all environmental risks and costs, including potential fines and penalties, and may not provide sufficient coverage in the event an environmental claim is made against us.
Our assets have been used for many years to transport, store or distribute petroleum products. Over time our operations, or operations by our predecessors or third parties not under our control, may have resulted in the disposal or release of hydrocarbons or solid wastes at or from our terminal properties and along pipeline rights-of-way. In some cases, we may retain liability for such disposals or releases related to properties we no longer own. In addition, some of our terminals and pipelines are located on or near current or former refining and terminal sites, and there is a risk that contamination is present on those sites. We may be subject to strict, joint and several liability under a number of these environmental laws and regulations for such disposal and releases of hydrocarbons or solid wastes or the existence of contamination, even in circumstances where such activities or conditions were caused by third parties not under our control or were otherwise lawful at the time they occurred.
The laws and regulations that affect our operations, and the enforcement thereof, have become increasingly stringent over time. We cannot ensure that these laws and regulations will not be further revised or that new laws or regulations will not be adopted or become applicable to us. There can be no assurance as to the amount or timing of future expenditures to comply with laws and regulations, including expenditures for environmental compliance or remediation, and actual future expenditures may be different from the amounts we currently anticipate. We also face risks from political activists and protesters, who may attempt to delay energy infrastructure construction through protests, sabotage and other means. In addition to increasing our costs or liabilities, legal or regulatory changes or changes in the cost or availability of permits or related credits, where applicable, could also impact our ability to develop new projects. For example, changes that affect permitting or siting processes or the use of eminent domain could prevent or delay our ability to construct new pipelines or storage tanks. Revised or additional regulations that result in increased compliance costs or additional operating restrictions or liabilities could have a material adverse effect on our business, financial position, results of operations and prospects.
31
The Pipeline Safety, Regulatory Certainty and Job Creation Act of 2011 increased penalties for safety violations, established additional safety requirements for newly-constructed pipelines and required studies of certain safety issues that could result in the adoption of new regulatory requirements for existing pipelines. In October 2019, PHMSA modified its existing hazardous liquid pipeline regulations, requiring integrity assessments at least once every 10 years for pipeline segments located outside of high consequence areas (“HCAs”) and requires all pipelines in HCAs to be capable of accommodating in-line inspection tools within 20 years unless basic construction cannot accommodate in-line inspection tools. The revised rule modified the definition of hazardous liquids to include ethanol, methanol, or other non-petroleum fuel which is flammable, toxic, or harmful to the environment and requires Geographic Information System (“GIS”) spatial data integration and analysis within the Integrity Management Program that includes defined data integration attributes which must be incorporated by October 1, 2022. Unless noted otherwise in the Federal Register notice, all requirements of the rule will take effect on July 1, 2020. Compliance with such legislative and regulatory changes could increase our compliance costs and have a material adverse effect on our results of operations.
Our customers are also subject to extensive laws and regulations that affect their businesses, and new laws or regulations could materially adversely affect their businesses or prospects. For example, several of our most significant customers are refineries whose businesses could be significantly impacted by changes in environmental or health-related laws or regulations. In addition, we have made and continue to make significant investments in crude oil and condensate storage and transportation projects that serve customers who largely depend on production techniques, such as hydraulic fracturing, that are currently being scrutinized by some governmental authorities and have encountered political opposition that could result in increased regulatory costs or delays. We are unable to predict the ultimate outcome of any such future legislative or regulatory activity. Any changes in laws or regulations, or in the interpretation, implementation or enforcement of existing laws and regulations, that impose significant costs or liabilities on our customers, or that result in delays or cancellations of their projects, could reduce demand for our services and materially adversely affect our results of operations, financial position or cash flows and our ability to pay cash distributions.
Our business is subject to complex and evolving laws and regulations regarding privacy and data protection. Many of these laws and regulations are subject to change and uncertain interpretation and could result in claims, increased cost of operations or other harm to our business.
The regulatory environment surrounding data privacy and protection is constantly evolving and can be subject to significant change. New data protection laws pose increasingly complex compliance challenges and could elevate our costs. Complying with varying jurisdictional requirements could also increase the costs and complexity of compliance, and violations of applicable data protection laws can result in significant penalties. Any failure, or perceived failure, by us to comply with applicable data protection laws could result in proceedings or actions against us by governmental entities or others, subject us to significant fines, penalties, judgments and negative publicity, require us to change our business practices, increase the costs and complexity of compliance and materially adversely affect our business. As noted above, we are also subject to the possibility of cyber-attacks, which themselves may result in a violation of these laws.
Climate change legislation or regulations restricting emissions of “greenhouse gases” could result in increased operating costs and reduced demand for the products that we transport, store or distribute.
Federal and state legislative and regulatory initiatives, as well as those in other countries, have attempted to and may continue to address climate change and control or limit greenhouse gas emissions. Although it is not possible to predict how they will impact our business, any such laws or regulations could adversely affect demand for the products that we transport, store and distribute. Depending on the particular programs adopted, they could also increase our costs to operate and maintain our facilities by requiring that we measure and report our emissions, install new emission controls on our facilities, acquire allowances to authorize our emissions, pay taxes related to our emissions and administer and manage an emissions program, among other things. We may be unable to include some or all of such increased costs in the rates charged to our customers and any such recovery may depend on events beyond our control, including the outcome of future rate proceedings before the FERC or state regulatory agencies and the provisions of any final legislation or implementing regulations.
32
Finally, certain scientific studies conclude that increasing concentrations of greenhouse gases in the Earth’s atmosphere may affect climate changes, which could result in the increased frequency and severity of storms, floods and other climatic events. If any such effects occur, there may be material adverse effects on our assets and operations.
Our gas liquids blending activities subject us to federal regulations that govern renewable fuel requirements in the United States.
The Energy Independence and Security Act of 2007 expanded the required use of renewable fuels in the United States. Each year, the EPA establishes an RVO requirement for refiners and fuel manufacturers based on overall quotas established by the federal government. By virtue of our gas liquids blending activity and resulting gasoline production, we are an obligated party and receive an annual RVO from the EPA. In lieu of blending renewable fuels (such as ethanol and biodiesel), we typically purchase renewable energy credits, called RINs, to meet this obligation. RINs are generated when a gallon of biofuel such as ethanol or biodiesel is produced. RINs may be separated when the biofuel is blended into gasoline or diesel, at which point the RIN is available for use in compliance or is available for sale on the open market. Increases in the cost or decreases in the availability of RINs could have a material adverse impact on our results of operations, cash flows and cash distributions.
Our business is subject to federal, state, local and international laws and regulations that govern the product quality specifications of the petroleum products that we store, transport or sell.
Petroleum products that we store and transport are sold by our customers for consumption into the public market. Various federal, state and local agencies, as well as international regulatory bodies, have the authority to prescribe specific product quality specifications for commodities sold into the public market. Changes in product quality specifications or blending requirements could reduce demand, reduce our throughput volume, require us to incur additional handling costs or require capital expenditures. For instance, different product specifications for different markets impact the fungibility of the products in our system and could require the construction of additional storage. If we are unable to recover these costs through increased revenue, our cash flows and ability to pay cash distributions could be materially adversely affected.
In addition, changes in the quality of the products we receive on our refined products pipeline, or changes in the product specifications in the markets we serve, could reduce or eliminate our ability to blend products, which would result in a reduction of our revenue and operating profit from blending activities. Any such reduction of our revenue or operating profit could have a material adverse effect on our results of operations, financial position, cash flows and ability to pay cash distributions.
Our gas liquids blending activities are the subject of a request for a rulemaking by the FERC and have been challenged in litigation.
In February 2018, two associations representing shippers on interstate liquids pipelines petitioned the FERC for a broad rulemaking with respect to interactions between pipeline companies and their affiliates. Among other claims, petitioners allege that blending activities conducted by pipelines are discriminatory. In particular, petitioners made reference to a pending lawsuit against Colonial Pipeline Company (“Colonial”) and our joint venture with Colonial, Powder Springs, in which the plaintiff has claimed that blending of refined products shipped on a pipeline by the pipeline company or its affiliate constitutes conversion of the shipper’s property and violates the Carmack Amendment, which governs claims for damage or loss incurred to goods transported by a carrier in interstate commerce. We have historically generated significant product margins from blending activities on our refined products pipeline system. If the shipper’s claims are successful or if the FERC adopts new rules or regulations that inhibit or prohibit the blending activities of Powder Springs or of the refined products industry more broadly, our investment in Powder Springs could be impaired and the product margin we earn from these activities at multiple other locations could be significantly reduced, which would adversely affect our profitability, our financial position and our ability to make distributions.
33
Our business could be affected adversely by union disputes and strikes or work stoppages by our unionized employees.
As of December 31, 2019, approximately 14% of our workforce was covered by two collective bargaining agreements with different terms and dates of expirations. We could experience a work stoppage in the future as a result of disagreements with these labor unions. A prolonged work stoppage could have a material adverse effect on our business activities, results of operations and cash flows.
Our current employees may be difficult to retain or replace.
A significant percentage of our employees, including much of our management team are eligible for retirement over the next several years. Many of those employees have skills and institutional knowledge that have been developed over many years of service. As these employees retire, we may be unable to replace them with employees with comparable knowledge and experience. If we are unable to transfer knowledge successfully to new employees or are otherwise unable to recruit and retain talented personnel, we could experience materially increased costs or we could encounter other difficulties in running our business efficiently.
An impairment of long-lived assets, investments in non-controlled entities, goodwill or other intangibles could reduce our earnings and negatively impact the value of our common units.
At December 31, 2019, we had $6.4 billion of net property, plant and equipment, $1.2 billion of investments in non-controlled entities, $53.3 million of goodwill and $47.9 million of other intangibles. U.S. GAAP requires us to periodically test long-lived assets, investments in non-controlled entities, goodwill and other intangibles for impairment. For example, in 2018 we made the decision to discontinue commercial operations of our
ammonia pipeline due to the system’s low profitability and challenging economic outlook and recognized a $49.1 million impairment charge. If we were to determine that any of our long-lived assets, investments in non-controlled entities, goodwill or other intangibles were impaired, we would be required to take an immediate non-cash charge to earnings. Such charges could be material to our results of operations and could adversely impact the value of our common units.
Our partnership agreement restricts the voting rights of unitholders owning 20% or more of our common units and has other governance differences from typical corporations.
Unitholders’ voting rights are restricted by a provision in our partnership agreement stating that any units held by a person that owns 20% or more of any class of our common units then outstanding, other than our general partner and its affiliates, cannot be voted on any matter. In addition, our partnership agreement contains provisions limiting the ability of unitholders to call meetings or to acquire information about our operations, as well as other provisions limiting our unitholders’ ability to influence our management. As a result of this provision, the trading price of our common units may be lower than other forms of equity ownership due to the absence of a takeover premium in the trading price or other governance differences.
Your liability may not be limited if a court finds that unitholder action constitutes control of our business.
A general partner of a partnership generally has unlimited liability for the obligations of the partnership, except for those contractual obligations of the partnership that are expressly made without recourse to the general partner. Our partnership is organized under Delaware law, and we conduct business in a number of other states. The limitations on the liability of holders of limited partner interests for the obligations of a limited partnership have not been clearly established in some of the other states in which we do business. Our unitholders could be liable for any and all of our obligations as if they were a general partner if a court or government agency were to determine that:
• | We were conducting business in a state but had not complied with that particular state’s partnership statute; or |
34
• | Our unitholders’ rights to act with other unitholders to remove or replace the general partner, to approve some amendments to our partnership agreement or to take other actions under our partnership agreement constitute “control” of our business. |
Our general partner’s board of directors’ absolute discretion in determining our level of cash reserves may adversely affect our ability to make cash distributions to our unitholders.
Our partnership agreement requires our general partner’s board of directors to deduct from available cash the amount of any cash reserves that in its reasonable discretion are necessary to fund our future operating expenditures. In addition, the partnership agreement permits our general partner’s board of directors to reduce available cash by establishing cash reserves for the proper conduct of our business, to comply with applicable laws or agreements to which we are a party or to provide funds for future distributions to unitholders. Any such cash reserves could materially reduce the amount of cash available for distribution to our unitholders.
Our partnership agreement replaces our general partner’s fiduciary duties to holders of our common units with contractual standards governing its duties.
Our partnership agreement contains provisions that eliminate the fiduciary standards to which our general partner and its officers and directors would otherwise be held by state fiduciary law and replaces those duties with several different contractual standards. For example, our partnership agreement permits our general partner to make a number of decisions in its sole discretion, free of any duties to us and holders of our common units other than the implied contractual covenant of good faith and fair dealing. This provision entitles our general partner to consider only the interests and factors that it desires and relieves it of any duty or obligation to give any consideration to any interest of, or factors affecting, us or our unitholders. In addition, our partnership agreement grants broad rights of indemnification to our general partner and its officers and directors. By owning a common unit, a holder is treated as having consented to the provisions in our partnership agreement.
Our partnership agreement restricts the remedies available to holders of our common units for actions taken by our general partner that might otherwise constitute breaches of fiduciary duty.
Our partnership agreement contains provisions that restrict the remedies available to holders of our common units for actions taken by our general partner that might otherwise constitute breaches of fiduciary duty under state fiduciary duty law. For example, our partnership agreement:
• | provides that whenever our general partner is permitted or required to make a decision, in its capacity as our general partner, our general partner is permitted or required to make such a decision in good faith and will not be subject to any other or different standard imposed by our partnership agreement, Delaware law, or any other law, rule or regulation; |
• | provides that our general partner and its officers and directors will not be liable for monetary damages to us or our unitholders resulting from any act or omission of our general partner or its officers and directors, as the case may be, taken in good faith; and |
• | provides that, in the absence of bad faith, our general partner will not be in breach of its obligations under our partnership agreement or its fiduciary duties to us or our unitholders if a transaction with an affiliate or the resolution of a conflict of interest is approved in accordance with, or otherwise meets the standards set forth in, our partnership agreement. |
35
Common units held by persons who are not citizenship-eligible may be subject to redemption.
Our partnership agreement contains provisions that apply if we determine that the nationality, citizenship or other related status of a unitholder creates a substantial risk of cancellation or forfeiture of any property in which we have an interest. If a unitholder is not a person who meets the requirements to be a citizenship-eligible holder, which generally includes U.S. entities and individuals who are U.S. citizens, and, therefore, creates a risk to the partnership, the holder may have its common units redeemed by us. In addition, if a unitholder does not meet the requirements to be a citizenship-eligible holder, such holder will not be entitled to voting rights and may not receive distributions in kind upon our liquidation.
Tax Risks to Unitholders
Our tax treatment depends on our status as a partnership for federal income tax purposes. If the IRS were to treat us as a corporation for federal income tax purposes, or otherwise subject us to entity-level taxation, it would reduce the amount of cash available for distribution to our unitholders.
The anticipated after-tax economic benefit of an investment in our common units depends largely on our being treated as a partnership for federal income tax purposes.
Despite the fact that we are a limited partnership under Delaware law, it is possible in certain circumstances for a partnership such as ours to be treated as a corporation for federal income tax purposes. A change in our business or a change in current law could cause us to be treated as a corporation for federal income tax purposes or otherwise subject us to taxation as an entity.
If we were treated as a corporation for federal income tax purposes, we would pay federal income tax on our taxable income at the corporate tax rate, which is a maximum of 21%, and would likely pay state income tax at varying rates. Payments to our unitholders would generally be taxed again as corporate dividends, and no income, gains, losses or deductions would flow through to our unitholders. Because a tax would be imposed upon us as a corporation, our cash available for distribution to our unitholders would be substantially reduced over time. Therefore, treatment of us as a corporation would result in a material reduction in the anticipated cash flow and after-tax return to our unitholders, likely causing a substantial reduction in the value of our common units.
Our tax treatment or the tax treatment of our unitholders could be subject to potential legislative, judicial or administrative changes and differing interpretations, possibly on a retroactive basis.
Current law may change so as to cause us to be treated as a corporation for federal income tax purposes or otherwise subject us to entity-level taxation. From time to time the U.S. government considers substantive changes to the existing federal income tax laws that affect publicly traded partnerships. Significant tax reform legislation (commonly referred to as the “Tax Cuts and Jobs Act,” or the “TCJA”) did not impact our treatment as a partnership for federal income tax purposes; however, the TCJA did provide for significant changes to the taxation of our operations and to an investment in our common units, including, among other changes, an individual deduction for our unitholders relating to certain income from partnerships. Many of the provisions in the TCJA, including the deduction related to certain income from partnerships, are temporary and, without additional legislation, will sunset on December 31, 2025. We are unable to predict whether any such additional legislation or any other tax-related proposals will ultimately be enacted. Moreover, any modification to the federal income tax laws and interpretations thereof may or may not be applied retroactively. Any such changes could negatively impact a unitholder’s investment in our common units.
At the state level, changes in current state law may subject us to additional entity-level taxation by individual states. States frequently evaluate ways to subject partnerships to entity-level taxation through the imposition of state income, franchise and other forms of taxation. Imposition of any such taxes may materially reduce the cash available for distribution to our unitholders.
36
If the IRS contests the federal income tax positions we take, the market for our common units may be adversely impacted and the cost of any IRS contest will reduce our cash available for distribution to our unitholders.
The IRS has made no determination as to our status as a partnership for federal income tax purposes. The IRS may adopt positions that differ from the positions we take. It may be necessary to resort to administrative or court proceedings to sustain some or all of the positions we take. A court may not agree with some or all of the positions we take. Any contest with the IRS may materially and adversely impact the market for our common units and the price at which they trade. In addition, our costs of any contest with the IRS will be borne indirectly by our unitholders as the costs will reduce our cash available for distribution.
Our unitholders may be required to pay taxes on their share of our income even if they do not receive any cash distributions from us.
Because our unitholders will be treated as partners to whom we will allocate taxable income which could be different in amount than the cash we distribute, our unitholders will be required to pay any federal income taxes and, in some cases, state and local income taxes on their share of our taxable income even if they receive no cash distributions from us. Our unitholders may not receive cash distributions from us equal to their share of our taxable income or even equal to the actual tax liability that results from that income.
Tax gain or loss on disposition of our common units could be more or less than expected.
If our unitholders sell their common units, they will recognize a gain or loss equal to the difference between the amount realized and their tax basis in those common units. Prior distributions to our unitholders in excess of the total net taxable income they were allocated for a common unit, which decreased their tax basis in that common unit, will, in effect, become taxable income to our unitholders if the common unit is sold at a price greater than their tax basis in that common unit, even if the price they receive is less than their original cost. A substantial portion of the amount realized, whether or not representing gain, may be taxed as ordinary income due to potential recapture items, including depreciation recapture. In addition, because the amount realized includes a unitholder’s share of nonrecourse liabilities, if our unitholders sell their common units, they may incur a tax liability in excess of the amount of cash received from the sale.
Tax-exempt entities and foreign persons face unique tax issues from owning our common units that may result in adverse tax consequences to them.
Investment in common units by tax-exempt entities, such as employee benefit plans, individual retirement accounts (known as IRAs) and foreign persons raises issues unique to them. For example, virtually all of our income allocated to organizations that are exempt from federal income tax, including IRAs and other retirement plans, will be unrelated business taxable income and will be taxable to them. Distributions to foreign persons will be reduced by withholding taxes at the highest applicable effective tax rate, and foreign persons will be required to file U.S. federal tax returns and pay tax on their share of our taxable income. Upon the sale, exchange or other disposition of a common unit by a foreign unitholder, the transferee is generally required to withhold 10% of the amount realized on such sale, exchange or other disposition if any portion of the gain on such sale, exchange or other disposition would be treated as effectively connected with a U.S. trade or business. If the transferee fails to satisfy this withholding requirement, we will be required to deduct and withhold such amount (plus interest) from future distributions to the transferee. Because the “amount realized” would include a unitholder’s share of our nonrecourse liabilities, 10% of the amount realized could exceed the total cash purchase price for such disposed units. Due to this fact, our inability to match transferors and transferees of units, and other uncertainty surrounding the application of these withholding rules, the U.S. Department of the Treasury and the IRS have currently suspended these rules for transfers of certain publicly traded partnership interests, including transfers of our units, until regulations or other guidance has been finalized. It is unclear when such regulations or other guidance will be finalized. Tax-exempt entities or foreign persons should consult their tax advisor before investing in our common units.
37
We will treat each purchaser of common units as having the same tax benefits without regard to the actual common units purchased. The IRS may challenge this treatment, which could adversely affect the value of our common units.
Primarily because we cannot match transferors and transferees of common units, we have adopted depreciation and amortization positions that may not conform to all aspects of existing Treasury Regulations. A successful IRS challenge to those positions could adversely affect the amount of tax benefits available to our unitholders. It also could affect the timing of these tax benefits or the amount of gain from the sale of common units and could have a negative impact on the value of our common units or result in audit adjustments to our unitholders’ tax returns.
The IRS may challenge aspects of our proration method, and, if successful, we would be required to change the allocation of items of income, gain, loss and deduction among our unitholders.
We prorate our items of income, gain, loss and deduction between transferors and transferees of our common units each month based upon the ownership of our common units on the first business day of each month, instead of on the basis of the date a particular unit is transferred. The U.S. Department of Treasury and the IRS issued Treasury Regulations that permit publicly traded partnerships to use a monthly simplifying convention that is similar to ours, but they do not specifically authorize all aspects of the proration method we have adopted. If the IRS were to successfully challenge this method, we could be required to change the allocation of items of income, gain, loss and deduction among our unitholders.
A unitholder whose common units are loaned to a “short seller” to cover a short sale of common units may be considered to have disposed of those common units. If so, he would no longer be treated for tax purposes as a partner with respect to those common units during the period of the loan and may recognize gain or loss from the disposition.
Because a unitholder whose common units are loaned to a “short seller” to cover a short sale of common units may be considered to have disposed of the loaned common units, the unitholder may no longer be treated for tax purposes as a partner with respect to those common units during the period of the loan to the short seller and the unitholder may recognize gain or loss from such disposition. Moreover, during the period of the loan to the short seller, any of our income, gain, loss or deduction with respect to those common units may not be reportable by the unitholder and any cash distributions received by the unitholder as to those common units could be fully taxable as ordinary income. Unitholders desiring to assure their status as partners and avoid the risk of gain recognition from a loan to a short seller are urged to modify any applicable brokerage account agreements to prohibit their brokers from borrowing their common units.
We have adopted certain valuation methodologies in determining a unitholder’s allocations of income, gain, loss and deduction. The IRS may challenge these methodologies or the resulting allocations, and such a challenge could adversely affect the value of our common units.
In determining the items of income, gain, loss and deduction allocable to our unitholders, including when we issue additional units, we must determine the fair market value of our assets. Although we may from time to time consult with professional appraisers regarding valuation matters, we make many fair market value estimates using a methodology based on the market value of our common units as a means to measure the fair market value of our assets. The IRS may challenge these valuation methods and the resulting allocations of income, gain, loss and deduction.
A successful IRS challenge to these methods or allocations could adversely affect the amount, character and timing of taxable income or loss being allocated to our unitholders. It also could affect the amount of gain from our unitholders’ sale of our common units and could have a negative impact on the value of our common units or result in audit adjustments to our unitholders’ tax returns without the benefit of additional deductions.
38
Our unitholders may be subject to state and local taxes and return filing requirements in states where they do not live as a result of investing in our common units.
In addition to federal income taxes, our unitholders may be subject to other taxes, including state and local taxes, unincorporated business taxes and estate, inheritance or intangible taxes that are imposed by the various jurisdictions in which we conduct business or own property now or in the future, even if they do not live in any of those jurisdictions. Our unitholders may be required to file state and local income tax returns and pay state and local income taxes in some or all of these various jurisdictions. Further, our unitholders may be subject to penalties for failure to comply with those requirements. We currently own assets and conduct business in 25 states, most of which impose a personal income tax. As we make acquisitions or expand our business, we may own assets or conduct business in additional states that impose a personal income tax.
If the IRS makes audit adjustments to our income tax returns for tax years beginning after December 31, 2017, it may assess and collect any taxes (including any applicable penalties and interest) resulting from such audit adjustment directly from us, in which case our cash available for distribution to our unitholders might be substantially reduced.
Pursuant to the Bipartisan Budget Act of 2015, for tax years beginning after December 31, 2017, if the IRS makes audit adjustments to our income tax returns, it may assess and collect any taxes (including any applicable penalties and interest) resulting from such audit adjustment directly from us. Generally, we expect to elect to have our unitholders take such audit adjustment into account in accordance with their interests in us during the tax year under audit, but there can be no assurance that such election will be made, or applicable, in all circumstances. If we are unable to have our unitholders take such audit adjustment into account in accordance with their interests in us during the tax year under audit, our current unitholders may bear some or all of the economic burden resulting from such audit adjustment, even if such unitholders did not own units in us during the tax year under audit. If, as a result of any such audit adjustment, we are required to make payments of taxes, penalties and interest, our cash available for distribution to our unitholders might be substantially reduced.
Item 1B. | Unresolved Staff Comments |
None.
Item 2. | Properties |
See Item 1(c) for a description of the locations and general character of our material properties.
Item 3. | Legal Proceedings |
Butane Blending Patent Infringement Proceeding. On October 4, 2017, Sunoco Partners Marketing & Terminals L.P. (“Sunoco”) brought an action for patent infringement in the U.S. District Court for the District of Delaware alleging Magellan Midstream Partners, L.P. (“Magellan”) and Powder Springs Logistics, LLC (“Powder Springs”) have infringed patents relating to butane blending at the Powder Springs facility located in Powder Springs, Georgia. Sunoco has since submitted pleadings alleging that Magellan has also infringed various patents relating to butane blending at nine Magellan facilities, in addition to Powder Springs. Sunoco is seeking monetary damages, attorneys’ fees and a permanent injunction enjoining Magellan and Powder Springs from infringing the subject patents. We deny and are vigorously defending against all claims asserted by Sunoco. Although it is not possible to predict the ultimate outcome, we believe the ultimate resolution of this matter will not have a material adverse impact on our results of operations, financial position or cash flows.
Valves and Overfill Protection Systems Proceeding. In October 2019, we received a Notice of Probable Violation, Proposed Civil Penalty and Proposed Compliance Order from the Pipeline and Hazardous Materials Safety Administration alleging violations related to the records and maps necessary for the safe operation of remotely controlled valves at two facilities and the failure to inspect the overfill protection system on four breakout tanks at our terminal in Des Moines, Iowa. The penalties associated with these alleged violations could exceed
39
$100,000. While the results cannot be predicted with certainty, we believe the ultimate resolution of this matter will not have a material impact on our results of operations, financial position or cash flows.
Hurricane Harvey Enforcement Proceeding. In July 2018, we received a Notice of Enforcement letter from the Texas Commission on Environmental Quality alleging two air emission violations at our Galena Park, Texas terminal that occurred during Hurricane Harvey in third quarter 2017. The penalties associated with these alleged violations could exceed $100,000. While the results cannot be predicted with certainty, we believe the ultimate resolution of this matter will not have a material impact on our results of operations, financial position or cash flows.
Clean Air Act Enforcement Proceeding. In June 2017, we received an enforcement letter from the U.S. Department of Justice (“DOJ”) regarding a referral from the U.S. Environmental Protection Agency (“EPA”) relating to alleged Clean Air Act violations at our terminals in Mason City, Iowa, Great Bend and Kansas City, Kansas and Omaha, Nebraska. The DOJ subsequently withdrew from the proceeding. In September 2019, the EPA filed an Administrative Complaint and Notice of Opportunity for Hearing seeking penalties in excess of $100,000. The matter was settled on December 17, 2019 for less than $100,000.
U.S. Oil Recovery, EPA ID No.: TXN000607093 Superfund Site. We have liability at the U.S. Oil Recovery Superfund Site in Pasadena, Texas as a potential responsible party (“PRP”) under Section 107(a) of the Comprehensive Environmental Response, Compensation, and Liability Act (“CERCLA”). As a result of the EPA’s Administrative Settlement Agreement and Order on Consent for Removal Action, filed August 25, 2011, EPA Region 6, CERCLA Docket No. 06-10-11, we voluntarily entered into the PRP group responsible for the site investigation, stabilization and subsequent site cleanup. We have paid approximately $42,000 associated with the assessment phase. Until this assessment phase has been completed, we cannot reasonably estimate our proportionate share of the remediation costs associated with this site. While the results cannot be reasonably estimated, we believe the ultimate resolution of this matter will not have a material impact on our results of operations, financial position or cash flows.
Lake Calumet Cluster Site, EPA ID No.: ILD000716852 Superfund Site. We have liability at the Lake Calumet Cluster Superfund Site in Chicago, Illinois as a PRP under Sections 107(a) and 113(f)(1) of CERCLA. As a result of the EPA’s Administrative Settlement Agreement and Order for Remedial Investigation/Feasibility Study of June 2013, we voluntarily entered into the PRP group responsible for the investigation, cleanup and installation of an appropriate clay cap over the site. We have paid approximately $9,000 associated with the Remedial Investigation/Feasibility Study and cleanup costs to date. Our projected portion of the estimated cap installation is $55,000. While the results cannot be predicted with certainty, we believe the ultimate resolution of this matter will not have a material impact on our results of operations, financial position or cash flows.
We and the non-controlled entities in which we own an interest are a party to various other claims, legal actions and complaints. While the results cannot be predicted with certainty, management believes the ultimate resolution of these claims, legal actions and complaints after consideration of amounts accrued, insurance coverage or other indemnification arrangements will not have a material adverse effect on our future results of operations, financial position or cash flows.
Item 4. | Mine Safety Disclosures |
Not applicable.
40
PART II
Item 5. | Market for Registrant’s Common Equity, Related Stockholder Matters and Issuer Purchases of Equity Securities |
Our common units are listed and traded on the New York Stock Exchange under the ticker symbol “MMP.” At the close of business on February 17, 2020, we had 227,787,597 common units outstanding that were owned by approximately 155,000 record holders and beneficial owners (held in street name).
For information regarding common units that may be issued pursuant to our long-term incentive plan, see Item 12. Security Ownership of Certain Beneficial Owners and Management and Related Stockholder Matters.
We currently pay quarterly cash distributions of $1.0275 per common unit. In general, we intend to increase our cash distribution; however, we cannot guarantee that future distributions will increase or continue at current levels.
Unitholder Return Performance Presentation
The following graph compares the total unitholder return performance of our common units with the performance of (i) the Standard & Poor’s 500 Stock Index (“S&P 500”) and (ii) the Alerian MLP Infrastructure Index (“AMZI”). The graph assumes that $100 was invested in our common units and each comparison index beginning on December 31, 2014 and that all distributions or dividends were reinvested on a quarterly basis. The AMZI is a composite of energy infrastructure master limited partnerships, whose constituents earn the majority of their cash flow from midstream activities involving energy commodities and whose trading volume and market capitalization meet certain additional criteria.
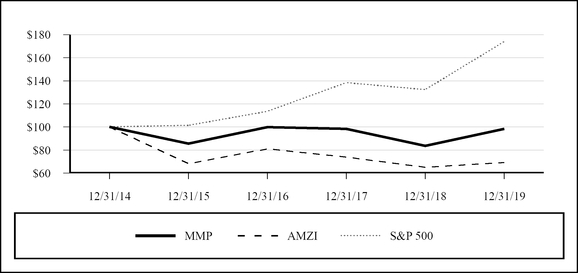
12/31/2014 | 12/31/2015 | 12/31/2016 | 12/31/2017 | 12/31/2018 | 12/31/2019 | |||||||
MMP | $100 | $86 | $100 | $98 | $84 | $98 | ||||||
AMZI | $100 | $68 | $81 | $74 | $65 | $69 | ||||||
S&P 500 | $100 | $101 | $114 | $138 | $132 | $174 | ||||||
The information provided in this section is being furnished to and not filed with the SEC. As such, this information is neither subject to Regulation 14A or 14C nor to the liabilities of Section 18 of the Exchange Act.
41
Item 6. | Selected Financial Data |
We have derived the summary selected historical financial data from our current and historical accounting records. Information concerning significant trends in our financial condition and results of operations is contained in Item 7. Management’s Discussion and Analysis of Financial Condition and Results of Operations.
Our operating results incorporate a number of significant estimates and uncertainties. Such matters could cause the data included herein not to be indicative of our future financial condition or results of operations. A discussion of our critical accounting estimates and how these estimates could impact our future financial condition or results of operations is included in Management’s Discussion and Analysis of Financial Condition and Results of Operations under Item 7 of this report. In addition, a discussion of the risk factors that could affect our business and future financial condition or results of operations is included under Item 1A. Risk Factors of this report. Additionally, the notes to our financial statements under Item 8. Financial Statements and Supplementary Data of this report include descriptions of areas where estimates and judgments could result in different amounts being recognized in our accompanying consolidated financial statements.
We believe that investors benefit from having access to the same financial measures utilized by management. In the following tables, we present the financial measure of distributable cash flow (“DCF”), which is not a generally accepted accounting principles (“GAAP”) measure. Our partnership agreement requires that all of our available cash, less amounts reserved by our general partner’s board of directors, be distributed to our unitholders. Management uses DCF to determine the amount of cash that our operations generated that is available for distribution to our unitholders and as a basis for recommending to our general partner’s board of directors the amount of cash distributions to be paid each period. We also use DCF as the basis for calculating our equity-based long-term incentive compensation. A reconciliation of DCF to net income, the nearest comparable GAAP measure, is included in the following tables.
In addition to DCF, the non-GAAP measures of operating margin (in the aggregate and by segment) and Adjusted EBITDA are presented in the following tables. A reconciliation of operating margin to operating profit and net income to Adjusted EBITDA, which are the nearest comparable GAAP financial measures, are included in the following tables. See Note 3 – Segment Disclosures under Item 8. Financial Statements and Supplementary Data of this report for a reconciliation of segment operating margin to segment operating profit. Operating margin is computed using amounts that are determined in accordance with GAAP and is an important measure of the economic performance of our core operations. Operating profit, alternatively, includes depreciation, amortization and impairment expense and general and administrative (“G&A”) expense that management does not focus on when evaluating the core profitability of an operation. Adjusted EBITDA is an important measure utilized by management and the investment community to assess the financial results of a company.
Since the non-GAAP measures presented here include adjustments specific to us, they may not be comparable to similarly-titled measures of other companies.
42
Year Ended December 31, | ||||||||||||||||||||
2015 | 2016 | 2017 | 2018 | 2019 | ||||||||||||||||
(in thousands, except per unit amounts) | ||||||||||||||||||||
Income Statement Data: | ||||||||||||||||||||
Transportation and terminals revenue | $ | 1,544,746 | $ | 1,591,119 | $ | 1,731,775 | $ | 1,878,988 | $ | 1,970,630 | ||||||||||
Product sales revenue | 629,836 | 599,602 | 758,206 | 927,220 | 736,092 | |||||||||||||||
Affiliate management fee revenue | 13,871 | 14,689 | 17,680 | 20,365 | 21,190 | |||||||||||||||
Total revenue | 2,188,453 | 2,205,410 | 2,507,661 | 2,826,573 | 2,727,912 | |||||||||||||||
Operating expenses | 523,650 | 528,672 | 577,978 | 649,436 | 634,081 | |||||||||||||||
Cost of product sales | 447,273 | 493,338 | 635,617 | 704,313 | 619,279 | |||||||||||||||
Subtotal | 1,217,530 | 1,183,400 | 1,294,066 | 1,472,824 | 1,474,552 | |||||||||||||||
Other operating income (expense) | — | — | — | — | 2,975 | |||||||||||||||
Earnings of non-controlled entities | 66,483 | 78,696 | 120,994 | 181,117 | 168,961 | |||||||||||||||
Operating margin | 1,284,013 | 1,262,096 | 1,415,060 | 1,653,941 | 1,646,488 | |||||||||||||||
Depreciation, amortization and impairment expense | 166,812 | 178,142 | 196,630 | 265,077 | 246,134 | |||||||||||||||
G&A expense | 149,948 | 147,165 | 165,717 | 194,283 | 196,650 | |||||||||||||||
Operating profit | 967,253 | 936,789 | 1,052,713 | 1,194,581 | 1,203,704 | |||||||||||||||
Interest expense, net | 143,177 | 165,410 | 193,718 | 200,514 | 198,554 | |||||||||||||||
Gain on disposition of assets | — | (28,144 | ) | (18,505 | ) | (353,797 | ) | (28,966 | ) | |||||||||||
Other (income) expense | 2,618 | (6,466 | ) | 4,139 | 13,868 | 11,830 | ||||||||||||||
Income before provision for income taxes | 821,458 | 805,989 | 873,361 | 1,333,996 | 1,022,286 | |||||||||||||||
Provision for income taxes | 2,336 | 3,218 | 3,830 | 71 | 1,437 | |||||||||||||||
Net income | $ | 819,122 | $ | 802,771 | $ | 869,531 | $ | 1,333,925 | $ | 1,020,849 | ||||||||||
Basic net income per common unit | $ | 3.60 | $ | 3.52 | $ | 3.81 | $ | 5.84 | $ | 4.46 | ||||||||||
Diluted net income per common unit | $ | 3.59 | $ | 3.52 | $ | 3.81 | $ | 5.84 | $ | 4.46 | ||||||||||
Balance Sheets Data: | ||||||||||||||||||||
Working capital (deficit)(a) | $ | (374,218 | ) | $ | (111,262 | ) | $ | (239,899 | ) | $ | (30,213 | ) | $ | (207,468 | ) | |||||
Total assets | $ | 6,041,567 | $ | 6,772,073 | $ | 7,394,375 | $ | 7,747,537 | $ | 8,437,729 | ||||||||||
Long-term debt, net | $ | 3,189,287 | $ | 4,087,192 | $ | 4,273,518 | $ | 4,211,380 | $ | 4,706,075 | ||||||||||
Partners’ capital | $ | 2,021,736 | $ | 2,092,105 | $ | 2,129,653 | $ | 2,643,434 | $ | 2,715,028 | ||||||||||
Cash Distribution Data: | ||||||||||||||||||||
Cash distributions declared per unit(b) | $ | 3.01 | $ | 3.32 | $ | 3.59 | $ | 3.87 | $ | 4.07 | ||||||||||
Cash distributions paid per unit(b) | $ | 2.92 | $ | 3.25 | $ | 3.52 | $ | 3.79 | $ | 4.04 | ||||||||||
43
Year Ended December 31, | ||||||||||||||||||||
2015 | 2016 | 2017 | 2018 | 2019 | ||||||||||||||||
(in thousands, except operating statistics) | ||||||||||||||||||||
Other Data: | ||||||||||||||||||||
Operating margin: | ||||||||||||||||||||
Refined products | $ | 778,515 | $ | 723,588 | $ | 825,746 | $ | 966,753 | $ | 901,054 | ||||||||||
Crude oil | 381,819 | 408,327 | 465,386 | 563,340 | 606,187 | |||||||||||||||
Marine storage | 119,828 | 125,226 | 118,654 | 117,901 | 133,741 | |||||||||||||||
Allocated partnership depreciation costs(c) | 3,851 | 4,955 | 5,274 | 5,947 | 5,506 | |||||||||||||||
Operating margin | $ | 1,284,013 | $ | 1,262,096 | $ | 1,415,060 | $ | 1,653,941 | $ | 1,646,488 | ||||||||||
Adjusted EBITDA and distributable cash flow: | ||||||||||||||||||||
Net income | $ | 819,122 | $ | 802,771 | $ | 869,531 | $ | 1,333,925 | $ | 1,020,849 | ||||||||||
Interest expense, net | 143,177 | 165,410 | 193,718 | 200,514 | 198,554 | |||||||||||||||
Depreciation, amortization and impairment(d) | 174,683 | 189,332 | 210,000 | 272,522 | 240,874 | |||||||||||||||
Equity-based incentive compensation(e) | 6,461 | 4,982 | 6,766 | 22,768 | 14,247 | |||||||||||||||
Gain on disposition of assets(f) | — | (28,144 | ) | (18,505 | ) | (351,215 | ) | (16,280 | ) | |||||||||||
Commodity-related adjustments(g) | 13,988 | 64,257 | 12,463 | (101,987 | ) | 88,223 | ||||||||||||||
Distributions received from operations of non-controlled entities in excess of earnings for the period | 14,572 | 9,293 | 25,216 | 15,584 | 34,641 | |||||||||||||||
Other(h) | — | 5,341 | 3,749 | 3,644 | — | |||||||||||||||
Adjusted EBITDA | 1,172,003 | 1,213,242 | 1,302,938 | 1,395,755 | 1,581,108 | |||||||||||||||
Interest expense, net, excluding debt issuance cost amortization(i) | (140,464 | ) | (162,251 | ) | (190,403 | ) | (197,274 | ) | (186,942 | ) | ||||||||||
Maintenance capital(j) | (88,685 | ) | (103,507 | ) | (91,163 | ) | (88,736 | ) | (96,702 | ) | ||||||||||
Distributable cash flow | $ | 942,854 | $ | 947,484 | $ | 1,021,372 | $ | 1,109,745 | $ | 1,297,464 | ||||||||||
Operating Statistics: | ||||||||||||||||||||
Refined products: | ||||||||||||||||||||
Transportation revenue per barrel shipped | $ | 1.439 | $ | 1.473 | $ | 1.495 | $ | 1.556 | $ | 1.616 | ||||||||||
Volume shipped (million barrels): | ||||||||||||||||||||
Gasoline | 268.1 | 275.4 | 295.5 | 286.9 | 280.5 | |||||||||||||||
Distillates | 152.5 | 150.2 | 166.2 | 181.7 | 184.6 | |||||||||||||||
Aviation fuel | 21.2 | 25.7 | 26.5 | 31.0 | 41.1 | |||||||||||||||
Liquefied petroleum gases | 9.7 | 10.4 | 9.9 | 11.0 | 9.7 | |||||||||||||||
Total volume shipped | 451.5 | 461.7 | 498.1 | 510.6 | 515.9 | |||||||||||||||
Crude oil: | ||||||||||||||||||||
Magellan 100%-owned assets: | ||||||||||||||||||||
Transportation revenue per barrel shipped(k) | $ | 1.118 | $ | 1.321 | $ | 1.348 | $ | 1.208 | $ | 0.939 | ||||||||||
Volume shipped (million barrels)(k) | 209.9 | 187.0 | 196.4 | 242.8 | 317.2 | |||||||||||||||
Crude oil terminal average utilization (million barrels per month) | 13.1 | 15.0 | 15.3 | 16.5 | 20.6 | |||||||||||||||
Select joint venture pipelines: | ||||||||||||||||||||
BridgeTex - volume shipped (million barrels)(l) | 75.2 | 79.0 | 98.4 | 138.2 | 156.3 | |||||||||||||||
Saddlehorn - volume shipped (million barrels)(m) | — | 5.2 | 19.0 | 27.4 | 56.1 | |||||||||||||||
Marine storage: | ||||||||||||||||||||
Marine terminal average utilization (million barrels per month) | 24.0 | 23.8 | 23.1 | 22.7 | 23.6 | |||||||||||||||
44
(a) | Working capital deficit at December 31, 2015 and 2017 included the current portion of long-term debt of approximately $250 million for each period. |
(b) | Cash distributions declared were determined based on DCF generated for each calendar year. Distributions were declared and paid within 45 days following the close of each quarter. Cash distributions paid represent cash payments for distributions during each of the periods presented. |
(c) | Certain depreciation expense was allocated to our various business segments, which in turn recognized these allocated costs as operating expense, reducing segment operating margin by these amounts. |
(d) | Prior year amounts have been reclassified to conform with the current year’s presentation. Depreciation, amortization and impairment expense is excluded from DCF to the extent it represents a non-cash expense. |
(e) | Because we intend to satisfy vesting of unit awards under our equity-based long-term incentive compensation plan with the issuance of common units, expenses related to this plan generally are deemed non-cash and excluded for DCF purposes. The amounts above have been reduced by cash payments associated with the plan, which are primarily related to tax withholdings. |
(f) | Gains on disposition of assets are excluded from DCF to the extent they are not related to our ongoing operations. The 2019 amounts above are net of gains on the disposition of residual assets from expansion projects, which are considered ongoing in nature, and as such are included in DCF. |
(g) | See Item 7. Management’s Discussion and Analysis of Financial Condition and Results of Operations – Distributable Cash Flow for a description of items included in our commodity-related adjustments. |
(h) | Other adjustments in 2018 include a $3.6 million adjustment recorded to partners' capital as required by our adoption of Accounting Standards Update 2014-09, Revenue from Contracts with Customers. The amount represents cash that we had previously received for deficiency payments but did not yet recognize in net income under the previous revenue recognition standard. Other adjustments in 2016 and 2017 include payments received from HollyFrontier Corporation in conjunction with the February 2016 Osage Pipe Line Company, LLC ("Osage") exchange transaction. These payments replaced distributions we would have received had the Osage transaction not occurred and are, therefore, included in our calculation of DCF. |
(i) | Interest expense in 2019 includes $8.3 million of debt prepayment premiums, which are excluded from DCF as they are financing activities and are not related to our ongoing operations. |
(j) | Maintenance capital expenditure projects maintain our existing assets and do not generate incremental DCF (i.e. incremental returns to our unitholders). For this reason, we deduct maintenance capital expenditures to determine DCF. |
(k) | Volume shipped includes shipments related to our crude oil marketing activities. Revenues from those activities are reflected as product sales revenue in our consolidated financial statements. Transportation revenue per barrel shipped reflects average rates on third-party volume only. |
(l) | These volumes reflect the total shipments for the BridgeTex pipeline, which was owned 50% by us through September 28, 2018 and 30% thereafter. |
(m) | These volumes reflect the total shipments for the Saddlehorn pipeline, which is owned 40% by us and began operations in September 2016. |
45
Item 7. | Management’s Discussion and Analysis of Financial Condition and Results of Operations |
Introduction
We are a publicly traded limited partnership principally engaged in the transportation, storage and distribution of refined petroleum products and crude oil. As of December 31, 2019, our asset portfolio consisted of:
• | our refined products segment, comprised of our approximately 9,800-mile refined products pipeline system with 53 terminals as well as 25 independent terminals not connected to our pipeline system; |
• | our crude oil segment, comprised of approximately 2,200 miles of crude oil pipelines, a condensate splitter and 35 million barrels of aggregate storage capacity, of which 23 million barrels are used for contract storage. Approximately 1,000 miles of these pipelines, the condensate splitter and 28 million barrels of this storage capacity (including 20 million barrels used for contract storage) are wholly-owned, with the remainder owned through joint ventures; and |
• | our marine storage segment, consisting of six marine terminals located along coastal waterways with an aggregate storage capacity of approximately 31 million barrels. Approximately 25 million barrels of this storage capacity are wholly-owned, with the remainder owned through joint ventures. |
The following discussion and analysis should be read in conjunction with our consolidated financial statements and related notes included in this annual report on Form 10-K for the year ended December 31, 2019.
See Item 1. Business for a detailed description of our business.
Overview
Our nation’s energy infrastructure is essential to provide safe, cost-efficient, reliable services that benefit our everyday lives. Our assets are an integral part of this energy network, transporting and storing petroleum products that enable our neighbors to travel by airplane and vehicle, farmers to work their fields to feed the world, and industries to move important goods across the country.
During 2019, we spent nearly $1 billion on organic growth projects, the highest amount in our history. A number of significant projects supported by long-term commitments were completed and placed into service during the year, enabling us to enhance our service offerings in support of our customers’ and the broader economy’s needs.
With the growth of our nation’s crude oil production, additional export capabilities have become of increased importance within our industry to distribute crude oil and refined petroleum products, such as gasoline and diesel fuel, to other markets within the United States and throughout the world.
To assist with this infrastructure need, we recently improved our refined products export capabilities by adding a new dock to our Galena Park, Texas marine terminal to provide our customers added flexibility at this critical and busy facility. Also in the Houston Ship Channel, we began operations at our new Pasadena joint venture marine terminal, with five million barrels of storage and two docks now complete and ready to serve our customers.
On the crude oil side, we expanded our export capabilities with more tankage constructed at our Seabrook Logistics joint venture terminal. Through our integrated service offering, customers can seamlessly transport crude oil from the prolific Permian Basin in west Texas through our pipeline systems to reach all of the refineries in the Houston and Texas City area or the export market through Seabrook Logistics.
We also significantly expanded our refined products capabilities in the state of Texas during 2019. Our refined products pipeline from Houston to west Texas has been constrained for quite some time, and our recently completed East Houston-to-Hearne pipeline is the first step to increase our capacity to meet additional demand for gasoline and diesel fuel in the Dallas-Ft. Worth area and other markets served by our system. The next step of this strategy is the
46
expansion of our west Texas pipeline system, which we expect to be operational during mid-2020. Both of these projects are supported by long-term customer commitments and expected to generate attractive returns.
Disciplined Foundation
We remain focused on capital discipline and managing our business for the long term. We recently announced our intention to sell three of our marine terminals as a result of our continuous evaluation of existing assets. We are always looking for ways to optimize our portfolio, and the divestiture of assets outside of our strategic footprint is an important element of our capital discipline.
Solid relationships with quality customers are also an important aspect of managing our business for the long term. We are known in the industry for our strategic assets, and our customer base is primarily comprised of investment-grade companies that rely heavily on our services. For large capital projects, we seek long-term customer commitments to provide ratable income and mitigate market risk. Our business fundamentals and financial position remain strong, bolstered by our commitment to capital discipline that we believe will serve as the foundation of our long-term success.
Creating Long-Term Value
Managing our business in a prudent manner for the long-term benefit of our investors remains our top priority. While our business has continued to perform very well and demand for our services remains strong, increasingly competitive dynamics in the crude oil business warrant a more conservative approach to our long track record of distribution growth. As a result, we expect to increase our average cash distributions by 3% in 2020. We also intend to maintain distribution coverage above 1.2 times for the foreseeable future. We believe these actions are more in-line with the inherent long-term growth profile of our base business.
While we continue to evaluate well in excess of $500 million of potential organic growth projects that would create incremental value for our investors, the reality is that we will most likely be in a lower capital spending environment over the next few years. Our first priority continues to be investing in attractive, high-quality growth projects, but we remain committed to our long-standing approach to capital discipline. We only plan to move forward on new opportunities if they meet or exceed our targeted returns and are appropriately adjusted for risk and long-term sustainability of cash flows. To the extent we have fewer opportunities that meet these requirements, we believe excess cash flow can be efficiently returned to our investors via other tools, including unit repurchases or special distributions.
Looking toward 2020 and beyond, our financial position is strong, with one of the healthiest balance sheets in the midstream space. We are well-positioned to respond to a more challenging market environment for us and the industry in general over the next few years, and are determined to maintain a balanced approach to running our business efficiently while at the same time continuing to pursue value-added growth opportunities.
Recent Developments
Terminals Sale. In January 2020, we announced an agreement to sell three marine terminals to Buckeye Partners, L.P. for $250 million, which is expected to close as soon as first quarter 2020, subject to regulatory approvals. The terminals are located in New Haven, Connecticut, Wilmington, Delaware and Marrero, Louisiana and are included in our marine storage segment.
47
Saddlehorn Pipeline Transactions. In August 2019, Saddlehorn announced the expansion of its pipeline capacity by a total of 100,000 barrels per day (“bpd”) to a new total capacity of approximately 290,000 bpd. The higher capacity is expected to be available in late 2020 following the addition of incremental pumping and storage capabilities. In conjunction with increased volume commitments, an affiliate of Black Diamond Gathering LLC (“Black Diamond”), which is majority-owned by Noble Midstream Partners LP, obtained an option to buy up to a 20% ownership interest in Saddlehorn. In February 2020, Black Diamond exercised its option, and as a result, we and one of our joint venture co-owners, an affiliate of Plains All American Pipeline, L.P., each sold a 10% interest in Saddlehorn to Black Diamond. We do not expect significant changes to our equity earnings from these transactions.
Unit Repurchase Program. Also in January 2020, we announced that our general partner’s board of directors authorized the repurchase of up to $750 million of our common units through 2022. We intend to purchase our common units from time-to-time through a variety of methods, including open market purchases and negotiated transactions, all in compliance with the rules of the Securities and Exchange Commission and other applicable legal requirements. The repurchase program does not obligate us to acquire any particular amount of common units, and the repurchase program may be suspended or discontinued at any time.
Cash Distribution. In January 2020, the board of directors of our general partner declared a quarterly cash distribution of $1.0275 per unit for the period of October 1, 2019 through December 31, 2019. This quarterly cash distribution was paid on February 14, 2020 to unitholders of record on February 7, 2020.
Results of Operations
We believe that investors benefit from having access to the same financial measures utilized by management. Operating margin, which is presented in the following table, is an important measure used by management to evaluate the economic performance of our core operations. Operating margin is not a generally accepted accounting principles (“GAAP”) measure, but the components of operating margin are computed using amounts that are determined in accordance with GAAP. A reconciliation of operating margin to operating profit, which is its nearest comparable GAAP financial measure, is included in the following table. Operating profit includes expense items, such as depreciation, amortization and impairment expense and general and administrative (“G&A”) expense, which management does not focus on when evaluating the core profitability of our separate operating segments. Additionally, product margin, which management primarily uses to evaluate the profitability of our commodity-related activities, is provided in this table. Product margin is a non-GAAP measure; however, its components of product sales revenue and cost of product sales are determined in accordance with GAAP. Our gas liquids blending, fractionation, crude oil marketing and other commodity-related activities generate significant revenue. We believe the product margin from these activities, which takes into account the related cost of product sales, better represents its importance to our results of operations.
48
Year Ended December 31, 2018 Compared to Year Ended December 31, 2019
Financial Highlights ($ in millions, except operating statistics) | Year Ended December 31, | Variance Favorable (Unfavorable) | |||||||||||||
2018 | 2019 | $ Change | % Change | ||||||||||||
Transportation and terminals revenue: | |||||||||||||||
Refined products | $ | 1,152.0 | $ | 1,187.0 | $ | 35.0 | 3 | % | |||||||
Crude oil | 549.8 | 602.0 | 52.2 | 9 | % | ||||||||||
Marine storage | 180.9 | 187.0 | 6.1 | 3 | % | ||||||||||
Intersegment eliminations | (3.7 | ) | (5.4 | ) | (1.7 | ) | (46 | )% | |||||||
Total transportation and terminals revenue | 1,879.0 | 1,970.6 | 91.6 | 5 | % | ||||||||||
Affiliate management fee revenue | 20.4 | 21.2 | 0.8 | 4 | % | ||||||||||
Operating expenses: | |||||||||||||||
Refined products | 424.8 | 411.9 | 12.9 | 3 | % | ||||||||||
Crude oil | 166.2 | 164.2 | 2.0 | 1 | % | ||||||||||
Marine storage | 68.0 | 68.9 | (0.9 | ) | (1 | )% | |||||||||
Intersegment eliminations | (9.6 | ) | (10.9 | ) | 1.3 | 14 | % | ||||||||
Total operating expenses | 649.4 | 634.1 | 15.3 | 2 | % | ||||||||||
Product margin: | |||||||||||||||
Product sales revenue | 927.2 | 736.1 | (191.1 | ) | (21 | )% | |||||||||
Cost of product sales | 704.3 | 619.3 | 85.0 | 12 | % | ||||||||||
Product margin | 222.9 | 116.8 | (106.1 | ) | (48 | )% | |||||||||
Other operating income (expense) | — | 3.0 | 3.0 | n/a | |||||||||||
Earnings of non-controlled entities | 181.1 | 169.0 | (12.1 | ) | (7 | )% | |||||||||
Operating margin | 1,654.0 | 1,646.5 | (7.5 | ) | — | % | |||||||||
Depreciation, amortization and impairment expense | 265.1 | 246.1 | 19.0 | 7 | % | ||||||||||
G&A expense | 194.3 | 196.7 | (2.4 | ) | (1 | )% | |||||||||
Operating profit | 1,194.6 | 1,203.7 | 9.1 | 1 | % | ||||||||||
Interest expense (net of interest income and interest capitalized) | 200.5 | 198.6 | 1.9 | 1 | % | ||||||||||
Gain on disposition of assets | (353.8 | ) | (29.0 | ) | (324.8 | ) | (92 | )% | |||||||
Other (income) expense | 13.9 | 11.8 | 2.1 | 15 | % | ||||||||||
Income before provision for income taxes | 1,334.0 | 1,022.3 | (311.7 | ) | (23 | )% | |||||||||
Provision for income taxes | 0.1 | 1.5 | (1.4 | ) | (1,400 | )% | |||||||||
Net income | $ | 1,333.9 | $ | 1,020.8 | $ | (313.1 | ) | (23 | )% | ||||||
Operating Statistics | |||||||||||||||
Refined products: | |||||||||||||||
Transportation revenue per barrel shipped | $ | 1.556 | $ | 1.616 | |||||||||||
Volume shipped (million barrels): | |||||||||||||||
Gasoline | 286.9 | 280.5 | |||||||||||||
Distillates | 181.7 | 184.6 | |||||||||||||
Aviation fuel | 31.0 | 41.1 | |||||||||||||
Liquefied petroleum gases | 11.0 | 9.7 | |||||||||||||
Total volume shipped | 510.6 | 515.9 | |||||||||||||
Crude oil: | |||||||||||||||
Magellan 100%-owned assets: | |||||||||||||||
Transportation revenue per barrel shipped(a) | $ | 1.208 | $ | 0.939 | |||||||||||
Volume shipped (million barrels)(a) | 242.8 | 317.2 | |||||||||||||
Crude oil terminal average utilization (million barrels per month) | 16.5 | 20.6 | |||||||||||||
Select joint venture pipelines: | |||||||||||||||
BridgeTex - volume shipped (million barrels)(b) | 138.2 | 156.3 | |||||||||||||
Saddlehorn - volume shipped (million barrels)(c) | 27.4 | 56.1 | |||||||||||||
Marine storage: | |||||||||||||||
Marine terminal average utilization (million barrels per month) | 22.7 | 23.6 | |||||||||||||
(a) Volume shipped includes shipments related to our crude oil marketing activities. Revenues from those activities are reflected as product sales revenue in our consolidated financial statements. Transportation revenue per barrel shipped reflects average rates on third-party volume only.
(b) These volumes reflect total shipments for the BridgeTex pipeline, owned 50% by us through September 28, 2018 and 30% thereafter.
(c) These volumes reflect the total shipments for the Saddlehorn pipeline, owned 40% by us.
49
Transportation and terminals revenue increased by $91.6 million, resulting from:
• | an increase in refined products revenue of $35.0 million due to a higher average transportation rate per barrel. The average rate per barrel in the current year was favorably impacted by the 2018 and 2019 mid-year tariff adjustments. Volume increased slightly between periods as additional shipments associated with a recent connection near El Paso and our new East Houston-to-Hearne pipeline segment were mainly offset by less short-haul movements on the South Texas pipelines. These supply-driven barrels were also primarily responsible for fluctuations between periods in the product mix we transported; |
• | an increase in crude oil revenue of $52.2 million primarily due to higher revenues from system storage that we provide to our customers in conjunction with new tanks at Cushing and Corpus Christi and increased system storage utilization at East Houston as well as storage capacity we lease from the Seabrook export facility. Higher transportation revenues from increased volumes on the Houston distribution system were partially offset by lower transportation revenue on our Longhorn pipeline as a result of lower average rates following long-term contract renewals in late 2018. Overall, the average crude oil transportation rate per barrel decreased between periods due to significantly higher volumes on our Houston distribution system, which move at a lower rate, and the lower average Longhorn rates; and |
• | an increase in marine storage revenue of $6.1 million primarily due to additional fees from new dock capacity at our Galena Park facility and higher storage availability related to timing of maintenance work. |
Operating expenses decreased $15.3 million, resulting from:
• | a decrease in refined products expenses of $12.9 million primarily due to lower asset integrity spending due to timing of maintenance work and lower compensation costs as a result of a pension valuation correction in 2018, partially offset by less favorable product overages (which reduce operating expenses) and higher property taxes; |
• | a decrease in crude oil expenses of $2.0 million primarily due to more favorable product overages (which reduce operating expenses), lower environmental accruals and lower expenses related to asset retirements, largely offset by fees we now pay to Seabrook for contract storage and ancillary services that we utilize to provide services to our shippers; and |
• | an increase in marine storage expenses of $0.9 million primarily due to higher operating taxes partially offset by lower expenses related to asset retirements. |
Product margin decreased $106.1 million primarily due to losses recognized in the current year on futures contracts compared to gains recognized in the prior year, partially offset by higher margins from our gas liquids blending activities. See Note 13 – Derivative Financial Instruments in Item 8. Financial Statements and Supplementary Data, as well as Other Items—Commodity Derivative Agreements below, for more information about our futures contracts.
Other operating income of $3.0 million in 2019 was primarily due to insurance settlements received in the current year related to Hurricane Harvey and proceeds received under a basis derivative agreement, largely offset by unrealized fair value adjustments on the basis derivative agreement.
Earnings of non-controlled entities decreased $12.1 million primarily due to lower earnings from Powder Springs as a result of losses recognized in the current year on futures contracts compared to gains in the prior year. Otherwise, lower BridgeTex earnings following the sale of a portion of our investment, representing a 20% interest, in late 2018 were mainly offset by higher earnings from Saddlehorn due to increased volumes and higher earnings from Seabrook due to the initiation of export capabilities in August 2018.
Depreciation, amortization and impairment expense decreased $19.0 million primarily due to a $49.1 million asset impairment charge recognized in 2018 related to our ammonia pipeline, partially offset by commencement of depreciation for expansion capital projects recently placed into service in the current year.
50
G&A expense increased $2.4 million primarily due to higher compensation costs resulting from higher bonus accruals due to company performance.
Interest expense, net of interest income and interest capitalized, decreased $1.9 million in 2019 primarily due to higher interest capitalized, partially offset by $8.3 million of debt prepayment costs in 2019 related to the early extinguishment of our 6.55% notes that were due July 2019. Our average outstanding debt increased from $4.5 billion in 2018 to $4.6 billion in 2019. Our weighted-average interest rate decreased from 4.8% in 2018 to 4.6% in 2019.
Gain on disposition of assets was $324.8 million unfavorable. In 2019, we recognized a deferred gain of $11.0 million related to the 2018 sale of our investment in BridgeTex, $12.7 million related to our discontinued Delaware Basin pipeline construction project that was sold to a third party and $5.3 million resulting from the sale of an inactive terminal along our refined products pipeline system. In 2018, we recognized a $353.8 million gain on the sale of a portion of our interest in BridgeTex.
Other expense was $2.1 million favorable in 2019 primarily due to lower pension-related costs in the current period. The 2018 period included the impact of a pension valuation correction.
Provision for income taxes was $1.4 million higher primarily due to favorable adjustments in 2018 resulting from the impact of a change in our tax position related to depreciation.
See Part I, Item 7. “Management’s Discussion and Analysis of Financial Condition and Results of Operations – Results of Operations” in our 2018 Annual Report on Form 10-K for a comparative discussion of the years ended December 31, 2017 and 2018.
51
Distributable Cash Flow
Distributable cash flow (“DCF”) and Adjusted EBITDA are non-GAAP measures. See Item 6. Selected Financial Data for a discussion of how management uses these non-GAAP measures. A reconciliation of DCF and Adjusted EBITDA for the years ended December 31, 2018 and 2019 to net income, which is the nearest comparable GAAP financial measure, is as follows (in millions):
Year Ended December 31, | ||||||||
2018 | 2019 | |||||||
Net income | $ | 1,333.9 | $ | 1,020.8 | ||||
Interest expense, net | 200.5 | 198.6 | ||||||
Depreciation, amortization and impairment(1) | 272.5 | 240.9 | ||||||
Equity-based incentive compensation(2) | 22.8 | 14.2 | ||||||
Gain on disposition of assets(3) | (351.2 | ) | (16.3 | ) | ||||
Commodity-related adjustments: | ||||||||
Derivative (gains) losses recognized in the period associated with future transactions(4) | (71.5 | ) | 29.7 | |||||
Derivative gains (losses) recognized in previous periods associated with transactions completed in the period(4) | (39.6 | ) | 71.2 | |||||
Inventory valuation adjustments(5) | 9.2 | (12.7 | ) | |||||
Total commodity-related adjustments | (101.9 | ) | 88.2 | |||||
Distributions received from operations of non-controlled entities in excess of earnings | 15.6 | 34.7 | ||||||
Other(6) | 3.6 | — | ||||||
Adjusted EBITDA | 1,395.8 | 1,581.1 | ||||||
Interest expense, net, excluding debt issuance cost amortization(7) | (197.3 | ) | (186.9 | ) | ||||
Maintenance capital(8) | (88.7 | ) | (96.7 | ) | ||||
DCF | $ | 1,109.8 | $ | 1,297.5 | ||||
(1) | Prior year amounts have been reclassified to conform with the current year’s presentation. Depreciation, amortization and impairment expense is excluded from DCF to the extent it represents a non-cash expense. |
(2) | Because we intend to satisfy vesting of unit awards under our equity-based long-term incentive compensation plan with the issuance of common units, expenses related to this plan generally are deemed non-cash and excluded for DCF purposes. The amounts above have been reduced by cash payments associated with the plan, which are primarily related to tax withholdings. |
(3) | Gains on disposition of assets are excluded from DCF to the extent they are not related to our ongoing operations. The 2019 amounts above are net of gains on the disposition of residual assets from expansion projects, which are considered ongoing in nature, and as such are included in DCF. |
(4) | Certain derivatives have not been designated as hedges for accounting purposes and the mark-to-market changes of these derivatives are recognized currently in net income. We exclude the net impact of these derivatives from our determination of DCF until the transactions are settled and, where applicable, the related products are sold. In the period in which these transactions are settled and any related products are sold, the net impact of the derivatives is included in DCF. |
(5) | We adjust DCF for lower of average cost or net realizable value adjustments related to inventory and firm purchase commitments as well as market valuations of short positions recognized each period as these are non-cash items. In subsequent periods when we physically sell or purchase the related products, we adjust DCF for the valuation adjustments previously recognized. |
(6) | Other adjustments in 2018 include a $3.6 million adjustment recorded to partners’ capital as required by our adoption of Accounting Standards Update 2014-09, Revenue from Contracts with Customers. The amount represents cash that we had previously received for deficiency payments but did not yet recognize in net income under the previous revenue recognition standard. |
(7) | Interest expense in 2019 includes $8.3 million of debt prepayment premiums that are excluded from DCF as they are financing activities and are not related to our ongoing operations. |
(8) | Maintenance capital expenditures maintain our existing assets and do not generate incremental DCF (i.e. incremental returns to our unitholders). For this reason, we deduct maintenance capital expenditures to determine DCF. |
52
Liquidity and Capital Resources
Cash Flows and Capital Expenditures
Operating Activities. Net cash provided by operating activities was $1,353.0 million and $1,321.2 million for the years ended December 31, 2018 and 2019, respectively. The $31.8 million decrease from 2018 to 2019 was due to lower net income as previously described and changes in our working capital, partially offset by adjustments for non-cash items.
Investing Activities. Net cash used by investing activities for the years ended December 31, 2018 and 2019 was $119.3 million and $1,007.3 million, respectively. During 2019, we spent $980.6 million on capital expenditures, which included $96.7 million for maintenance capital, $791.8 million for our expansion capital projects and $92.1 million for undivided joint interest projects for which cash was received from a third party. Additionally, we made net capital contributions of $203.9 million to our joint ventures, which we account for as investments in non-controlled entities, of which $198.9 million related to capital projects. During 2018, we sold a portion of our interest in BridgeTex for cash proceeds of $575.6 million. Also during 2018, we spent $562.3 million on capital expenditures, which included $88.7 million for maintenance capital, $425.0 million for our expansion capital projects and $48.6 million for undivided joint interest projects for which cash was received from a third party. Additionally, we contributed capital of $216.4 million in conjunction with our joint venture capital projects, which we account for as investments in non-controlled entities.
Financing Activities. Net cash used by financing activities for the years ended December 31, 2018 and 2019 was $1,100.5 million and $538.6 million, respectively. During 2019, we paid cash distributions of $921.6 million to our unitholders. Additionally, we received net proceeds of $996.4 million from borrowings under long-term notes, which were used to repay our $550.0 million of 6.55% notes due 2019 and outstanding commercial paper borrowings at that time. Also, in January 2019, our equity-based incentive compensation awards that vested December 31, 2018 were settled by issuing 208,268 common units and distributing those units to the long-term incentive plan (“LTIP”) participants, resulting in payments primarily associated with tax withholdings of $9.8 million. During 2018, we paid cash distributions of $865.4 million to our unitholders and repaid our $250.0 million of 6.40% notes due 2018. Also, in January 2018, our LTIP awards that vested December 31, 2017 were settled by issuing 168,913 common units to the LTIP participants, resulting in payments primarily associated with tax withholdings of $9.3 million.
The quarterly distribution amount related to fourth quarter 2019 earnings was $1.0275 per unit, which was paid in February 2020. Based on the number of common units currently outstanding and if we are able to meet management’s targeted distribution growth of 3% during 2020, total cash distributions of approximately $953 million will be paid to our unitholders related to 2020 earnings. Management believes we will have sufficient DCF to fund these distributions.
See Part I, Item 7. “Management’s Discussion and Analysis of Financial Condition and Results of Operations – Liquidity and Capital Resources” in our 2018 Annual Report on Form 10-K for a discussion of cash flows for the year ended December 31, 2017.
Capital Requirements
Capital spending for our business consists primarily of:
• | Maintenance capital expenditures. These capital expenditures include costs required to maintain equipment reliability and safety and to address environmental and other regulatory requirements rather than to generate incremental DCF; and |
53
• | Expansion capital expenditures. These expenditures are undertaken primarily to generate incremental DCF and include costs to acquire or construct additional assets to grow our business and to expand or upgrade our existing facilities and to construct new assets, which we refer to collectively as organic growth projects. Organic growth projects include, for example, capital expenditures that increase storage or throughput volumes or develop pipeline connections to new supply sources. |
During 2019, our maintenance capital spending was $96.7 million. For 2020, we expect to spend approximately $95 million on maintenance capital.
During 2019, we spent $990.7 million for our expansion capital projects, which included $198.9 million of contributions made to our joint ventures for their expansion projects. Based on the progress of projects already underway, we expect to spend approximately $400 million in 2020 to complete our current slate of expansion projects.
Liquidity
Cash generated from operations is a key source of liquidity for funding debt service, maintenance capital expenditures and quarterly distributions. Additional liquidity for purposes other than quarterly distributions, such as expansion capital expenditures and debt repayments, is available through borrowings under our commercial paper program and revolving credit facility, as well as from other borrowings or issuances of debt or common units (see Note 9 – Debt in Item 8. Financial Statements and Supplementary Data of this report for detail of our borrowings and debt outstanding at December 31, 2018 and 2019). If capital markets do not permit us to issue additional debt and equity securities, our business may be adversely affected, and we may not be able to acquire additional assets and businesses, fund organic growth projects or continue paying cash distributions at the current level.
Off-Balance Sheet Arrangements
None.
54
Contractual Obligations
The following table summarizes our contractual obligations as of December 31, 2019 (in millions):
Total | < 1 year | 1-3 years | 4-5 years | > 5 years | ||||||||||||||||
Long-term debt obligations(1) | $ | 4,750.0 | $ | — | $ | 550.0 | $ | — | $ | 4,200.0 | ||||||||||
Interest obligations(1) | 4,177.2 | 216.7 | 388.4 | 384.2 | 3,187.9 | |||||||||||||||
Operating lease obligations | 195.3 | 32.3 | 60.1 | 52.3 | 50.6 | |||||||||||||||
Storage contract commitments(2) | 19.3 | 7.4 | 10.2 | 0.6 | 1.1 | |||||||||||||||
Pipeline capacity commitments(3) | 66.6 | 10.8 | 21.6 | 21.6 | 12.6 | |||||||||||||||
Right-of-way obligations(4) | 13.3 | 1.8 | 3.5 | 3.3 | 4.7 | |||||||||||||||
Pension and postretirement medical obligations(5) | 147.2 | 33.0 | 82.6 | 21.9 | 9.7 | |||||||||||||||
Purchase commitments: | ||||||||||||||||||||
Product purchase commitments(6) | 62.4 | 62.4 | — | — | — | |||||||||||||||
Utility purchase commitments | 15.9 | 8.0 | 4.5 | 3.3 | 0.1 | |||||||||||||||
Derivative instruments(7) | — | — | — | — | — | |||||||||||||||
Equity-based incentive awards(8) | 52.1 | 31.0 | 21.1 | — | — | |||||||||||||||
Capital project purchase obligations | 154.6 | 152.4 | 2.2 | — | — | |||||||||||||||
Maintenance obligations | 113.8 | 113.2 | 0.6 | — | — | |||||||||||||||
Other | 10.2 | 4.9 | 5.3 | — | — | |||||||||||||||
Total | $ | 9,777.9 | $ | 673.9 | $ | 1,150.1 | $ | 487.2 | $ | 7,466.7 | ||||||||||
(1) | At December 31, 2019, we had no borrowings outstanding under our revolving credit facility or commercial paper program. For purposes of this table, we have reflected no assumed borrowings under our revolving credit facility or commercial paper program for any periods presented. We have included interest obligations based on the stated amounts of our fixed-rate obligations. |
(2) | Includes product storage we have contracted from third parties. The cost of storage services is recognized in cost of product sales on our consolidated statements of income. |
(3) | Includes pipeline capacity we have contracted from third parties. The cost of these commitments is recognized in operating expense on our consolidated statements of income. |
(4) | Represents right-of-way agreements with a contractual maturity date over one year. The cost of these obligations is recognized in operating expense on our consolidated statements of income. |
(5) | Represents the projected benefit obligation of our pension and postretirement medical plans less the fair value of plan assets. |
(6) | Includes product purchase commitments for which the price provisions are indexed based on the date of delivery. We have estimated the value of these commitments using the related index price curve as of December 31, 2019. Also, we have excluded certain product purchase agreements for which there is no specified or minimum quantity. |
(7) | As of December 31, 2019, we had entered into exchange-traded futures contracts representing 3.2 million barrels of petroleum products that we expect to sell in the future and 0.7 million barrels of gas liquids we expect to purchase in the future. At December 31, 2019, we had recorded a net liability of $10.2 million and made margin deposits of $27.4 million. We have excluded from this table the future net cash outflows, if any, under these futures contracts and the amounts of future margin deposit requirements because those amounts are uncertain. |
(8) | Settlements of our LTIP awards will differ from these reported amounts primarily due to differences between actual and current estimates of payout percentages and completion of the remaining portion of the requisite service periods. |
Other Items
Board of Director Election. In May 2019, Chansoo Joung was elected to our general partner’s board of directors as an independent director.
Executive Officer Promotions and Retirements. Aaron Milford, who previously held the position of Chief Financial Officer and Senior Vice President, was elected by our general partner’s board of directors as Chief Operating Officer effective May 1, 2019.
55
Jeff Holman, who previously held the position of Vice President, Finance and Treasurer, was elected by our general partner’s board of directors as Chief Financial Officer, Senior Vice President and Treasurer, also effective May 1, 2019, filling the vacancy created by Mr. Milford’s promotion.
Larry Davied, Senior Vice President of Technical Services, retired in September 2019 after 26 years of service with us or our predecessors. Michael Pearson was elected by our general partner’s board of directors to succeed Mr. Davied in this position. Before his promotion, Mr. Pearson was Vice President, Asset Integrity and has been with us since our inception.
Crude Oil Revenues. The revenues generated by our crude oil assets partially depend upon the difference in commodity prices between different markets. When price differentials between origin and destination points on our crude oil pipelines are lower than our uncommitted (or spot) tariff rates, it is generally uneconomical for customers without contractual obligations to ship. We have benefited from favorable price differentials in recent periods, as the pricing differential between Midland and Houston has generally been above our spot rates, encouraging high utilization of our crude oil transportation and dock assets. However, in late 2019, the differential between Midland and Houston was lower than our tariff rates, primarily due to the addition of new crude oil pipeline capacity in the region. As a result, we expect lower volumes on our crude oil assets at our spot rates. In addition, customers will likely be less willing to make term commitments for our crude oil services, and the rates at which customers will be willing to pay for both term commitments and uncommitted capacity will decrease from the levels we experienced previously. Due to these reduced volumes and lower rates, we expect crude oil revenues from our wholly-owned and joint venture crude oil assets to decrease. To optimize utilization of our crude oil assets, we have developed new tariff arrangements that make our services more economical for our shippers. In addition, we have initiated crude oil marketing activities to facilitate intrastate shipments on our Texas assets.
Pipeline Tariff Changes. The Federal Energy Regulatory Commission (“FERC”) regulates the rates charged on interstate common carrier pipeline operations primarily through an indexing methodology, which establishes the maximum amount by which index-based tariffs can be adjusted each year. Approximately 40% of our refined products tariffs are subject to this indexing methodology. The remaining 60% of our refined products tariffs are either subject to regulations by the states in which we operate or are approved for market-based rates by the FERC, and in both cases these rates can be adjusted at our discretion based on market factors. The current FERC-approved indexing method is the annual change in the producer price index for finished goods (“PPI-FG”) plus 1.23%. Based on the preliminary estimates for this indexing methodology in 2019, we expect to increase rates in the 40% of our markets that are subject to the FERC’s index methodology by approximately 2% on July 1, 2020. While we continue to evaluate the remaining 60% of our markets, we generally intend to increase rates in those markets by 3% to 4% on July 1, 2020, consistent with the 2019 rate increase for our competitive markets. Most of the tariffs on our long-haul crude oil pipelines are established at negotiated rates that generally provide for annual adjustments in line with changes in the FERC index, subject to certain modifications. We also expect to increase the rates of our crude oil pipelines by approximately 2% on average in July 2020.
Commodity Derivative Agreements. Certain of our business activities result in our owning various commodities, which exposes us to commodity price risk. We use forward physical commodity contracts and exchange-traded futures contracts to hedge against changes in prices of commodities that we expect to sell or purchase in future periods. During 2019, we also entered into a basis derivative agreement for which settlements are determined based on the basis differential of crude oil prices at different market locations.
For further information regarding the quantities of refined products and crude oil hedged at December 31, 2019 and the fair value of open hedge and basis derivative contracts at that date, please see Item 7A. Quantitative and Qualitative Disclosures about Market Risk.
Related Party Transactions. See Note 17 – Related Party Transactions in Item 8. Financial Statements and Supplementary Data of this report for detail of our related party transactions.
56
Critical Accounting Estimates
Our management has discussed the development and selection of the following critical accounting estimates with the audit committee of our general partner’s board of directors, which has reviewed and approved these disclosures.
Pension Obligations
We sponsor two union pension plans covering union employees and a pension plan for non-union employees. Various estimates and assumptions directly affect net periodic benefit expense and obligations for these plans. These estimates and assumptions include the expected long-term rates of return on plan assets, discount rates and the expected rate of compensation increase. Management reviews these assumptions annually and makes adjustments as necessary.
The following table presents the estimated increase (decrease) in net periodic benefit expense and obligations that would result from a 1% change in the specified assumption (in thousands):
Benefit Expense | Benefit Obligation | |||||||||||||||||||
1% Increase | 1% Decrease | 1% Increase | 1% Decrease | |||||||||||||||||
Pension benefits: | ||||||||||||||||||||
Discount rate | $ | (5,313 | ) | $ | 6,552 | $ | (44,374 | ) | $ | 55,404 | ||||||||||
Expected long-term rate of return on plan assets | $ | (2,572 | ) | $ | 2,572 | $ | — | $ | — | |||||||||||
Rate of compensation increase | $ | 5,051 | $ | (5,047 | ) | $ | 27,444 | $ | (27,465 | ) | ||||||||||
The following table sets forth the increase (decrease) in our pension funding based on our current funding policy assuming a 1% change in the specified criterion (in thousands):
1% Increase | 1% Decrease | |||||||
Rate of compensation increase | $ | 600 | $ | (599 | ) | |||
The discount rate directly affects the measurement of the benefit obligations of our pension benefit plans. The objective of the discount rate is to determine the amount, if invested at the December 31 measurement date in a portfolio of high-quality fixed income securities, that would provide the necessary cash flows to make benefit payments when due. Decreases in the discount rate increase the obligation and generally increase the related expense, while increases in the discount rate have the opposite effect. Changes in general economic and market conditions that affect interest rates on long-term high-quality fixed income securities as well as the duration of our plans’ liabilities affect our estimate of the discount rate.
We estimate the long-term expected rate of return on plan assets using expectations of capital market results, which includes an analysis of historical results as well as forward-looking projections. We base these capital market expectations on a long-term period and on our investment strategy and asset allocation. We develop our estimates using input from several external sources, including consultation with our third-party independent investment consultant. We develop the forward-looking capital market projections using a consensus of expectations by economists for inflation and dividend yield, along with expected changes in risk premiums. Because our determined rate is an estimate of future results, it could be significantly different from actual results. The expected rates of return on plan assets are long-term in nature; therefore, short-term market performance does not significantly affect our estimated long-term expected rate of return.
The expected rate of compensation increase represents average long-term salary increases. An increase in this rate causes the pension obligation and expense to increase.
57
Impairment of Long-Lived Assets, Goodwill and Investments
Impairment of Long-Lived Assets. Long-lived assets, including fixed assets and intangibles, are reviewed for impairment whenever events or changes in circumstances indicate that the carrying value may not be recoverable. Such indicators include, among others, the nature of the asset, the projected future economic benefit of the asset, changes in regulatory and political environments and historical and future cash flow and profitability measurements. If the carrying value of an asset exceeds the future undiscounted cash flows expected from the asset, we recognize an impairment charge for the excess of carrying value of the asset over its estimated fair value.
Goodwill. The goodwill relating to each of our reporting units is tested for impairment annually as well as when an event or change in circumstances indicates an impairment may have occurred. Under GAAP, we have the option to first assess qualitative factors to determine whether it is more likely than not that the fair value of one of our reporting units is greater than its carrying amount. If, after assessing the totality of events or circumstances, we determine it is more likely than not that the fair value of a reporting unit is greater than its carrying amount, we are not required to perform any further testing. However, if we conclude otherwise, we perform the first step of a two-step impairment test by calculating the fair value of the reporting unit and comparing the fair value with the carrying amount of the reporting unit. If the fair value of the reporting unit is less than its carrying value, an impairment loss is recorded to the extent that the implied fair value of the goodwill of the reporting unit is less than its carrying value. We have the option to bypass the qualitative assessment for any reporting unit in any period and proceed directly to performing the first step of the two-step goodwill impairment test.
For purposes of performing the impairment test for goodwill, our reporting units are our reportable segments. In 2017 and 2018, we elected to complete the quantitative goodwill impairment test and began with step one of the test as required by GAAP. Based on these assessments, we calculated that the fair value of each of our reporting units was greater than its carrying amount. In 2019, we elected to perform the qualitative assessment described above for purposes of our annual goodwill impairment test. Based on this assessment, we concluded that it was more likely than not that the fair value of each of our reporting units was greater than its carrying amount. Accordingly, no further testing was required.
Determination as to whether and how much goodwill or long-lived assets are impaired involves management estimates on highly uncertain matters such as future commodity prices, the effects of inflation and technology improvements on operating expenses and the outlook for national or regional market supply and demand conditions. We base the impairment reviews and calculations used in our impairment tests on assumptions that are consistent with our business plans and long-term investment decisions. See Note 5—Property, Plant and Equipment, Goodwill and Other Intangibles in Item 8. Financial Statements and Supplementary Data for additional information regarding impairments of goodwill and long-lived assets.
Investments. We evaluate investments in non-controlled entities for impairment whenever events or circumstances indicate that there is an other-than-temporary loss in value of the investment. When evidence of loss in value has occurred, we compare our estimate of fair value of the investment to the carrying value of the investment to determine whether an impairment has occurred. If the estimated fair value is less than the carrying value and we consider the decline in value to be other-than-temporary, the excess of the carrying value over the fair value is recognized in our consolidated financial statements as an impairment charge.
New Accounting Pronouncements
See Note 2 – Summary of Significant Accounting Policies in Item 8. Financial Statements and Supplementary Data of this report for a summary of new accounting pronouncements.
58
Item 7A. | Quantitative and Qualitative Disclosures About Market Risk |
We may be exposed to market risk through changes in commodity prices and interest rates and have established policies to monitor and control these market risks. We use derivative agreements to help manage our exposure to commodity price and interest rate risks.
Commodity Price Risk
Our commodity price risk primarily arises from our gas liquids blending and fractionation activities, and from managing product overages associated with our refined products and crude oil pipelines and terminals. We use derivatives such as forward physical contracts and exchange-traded futures contracts to help us manage commodity price risk.
Forward physical contracts that qualify for and are elected as normal purchases and sales are accounted for using traditional accrual accounting. As of December 31, 2019, we had commitments under forward purchase and sale contracts as follows (in millions):
Total | < 1 Year | 1 – 3 Years | |||||||||
Forward purchase contracts – notional value | $ | 62.4 | $ | 62.4 | $ | — | |||||
Forward purchase contracts – barrels | 1.5 | 1.5 | — | ||||||||
Forward sales contracts – notional value | $ | 16.0 | $ | 16.0 | $ | — | |||||
Forward sales contracts – barrels | 0.2 | 0.2 | — | ||||||||
We also use exchange-traded futures contracts to hedge against changes in the price of petroleum products we expect to sell or purchase. Virtually all of our open contracts did not qualify for hedge accounting treatment under ASC 815, Derivatives and Hedging, and we accounted for these contracts as economic hedges, with changes in fair value recognized currently in earnings. The fair value of these open futures contracts, representing 3.2 million barrels of petroleum products we expect to sell and 0.7 million barrels of gas liquids we expect to purchase, was a net liability of $10.2 million. With respect to these contracts, a $10.00 per barrel increase (decrease) in the prices of petroleum products we expect to sell would result in a $32.0 million decrease (increase) in our operating profit, while a $10.00 per barrel increase (decrease) in the price of gas liquids we expect to purchase would result in $7.0 million increase (decrease) in our operating profit. These increases or decreases in operating profit would be substantially offset by higher or lower product sales revenue or cost of product sales when the physical sale or purchase of those products occurs, respectively. These contracts may be for the purchase or sale of products in markets different from those in which we are attempting to hedge our exposure, and the related hedges may not eliminate all price risks.
During 2019, we entered into a basis derivative agreement with a joint venture co-owner’s affiliate, and, contemporaneously, that affiliate entered into an intrastate transportation services agreement with the joint venture. Settlements under the basis derivative agreement are determined based on the basis differential of crude oil prices at different market locations and a notional volume of 30,000 barrels per day. As a result, we are exposed to the differential in the forward price curves for crude oil in West Texas and the Houston Gulf Coast. With respect to this agreement, a $1.00 per barrel increase (decrease) in the differential would result in an approximately $7.0 million increase (decrease) in our operating profit.
Interest Rate Risk
Our use of variable rate debt and any future issuances of fixed rate debt expose us to interest rate risk. As of December 31, 2019, we did not have any variable rate debt outstanding.
59
Item 8. | Financial Statements and Supplementary Data |
Management’s Annual Report on Internal Control Over Financial Reporting
Management is responsible for establishing and maintaining adequate internal control over financial reporting as defined in Rule 13a-15(f) of the Securities Exchange Act of 1934, as amended. Our internal control over financial reporting is a process designed to provide reasonable assurance regarding the reliability of financial reporting and the preparation of financial statements for external purposes in accordance with generally accepted accounting principles.
Because of its inherent limitations, internal control over financial reporting may not prevent or detect misstatements. Also, projections of any evaluation of effectiveness to future periods are subject to the risk that controls may become inadequate because of changes in conditions, or that the degree of compliance with the policies or procedures may deteriorate.
Management assessed the effectiveness of its internal control over financial reporting as of December 31, 2019. In making this assessment, it used the criteria set forth in 2013 by the Committee of Sponsoring Organizations of the Treadway Commission in Internal Control—Integrated Framework. As a result of this assessment management has concluded that, as of December 31, 2019, its internal control over financial reporting is effective based on those criteria.
Ernst & Young LLP, the independent registered public accounting firm that audited our consolidated financial statements included in this Annual Report on Form 10-K, has issued an attestation report on the effectiveness of our internal control over financial reporting as of December 31, 2019. The report, which expresses an unqualified opinion on the effectiveness of our internal control over financial reporting as of December 31, 2019, is included herein under the heading “Report of Independent Registered Public Accounting Firm” relative to internal control over financial reporting.
By: | /S/ MICHAEL N. MEARS |
Chairman of the Board, President, Chief Executive Officer and Director of Magellan GP, LLC, General Partner of Magellan Midstream Partners, L.P. | |
By: | /S/ JEFF HOLMAN |
Senior Vice President, Chief Financial Officer and Treasurer of Magellan GP, LLC, General Partner of Magellan Midstream Partners, L.P. | |
60
Report of Independent Registered Public Accounting Firm
To the Common Unitholders of Magellan Midstream Partners, L.P. and the Board of Directors of Magellan GP, LLC, General Partner of Magellan Midstream Partners, L.P.
Opinion on the Financial Statements
We have audited the accompanying consolidated balance sheets of Magellan Midstream Partners, L.P. (the Partnership) as of December 31, 2019 and 2018, the related consolidated statements of income, comprehensive income, partners’ capital and cash flows for each of the three years in the period ended December 31, 2019, and the related notes (collectively referred to as the “consolidated financial statements”). In our opinion, the consolidated financial statements present fairly, in all material respects, the financial position of the Partnership at December 31, 2019 and 2018, and the results of its operations and its cash flows for each of the three years in the period ended December 31, 2019, in conformity with U.S. generally accepted accounting principles.
We also have audited, in accordance with the standards of the Public Company Accounting Oversight Board (United States) (PCAOB), the Partnership’s internal control over financial reporting as of December 31, 2019, based on criteria established in Internal Control-Integrated Framework issued by the Committee of Sponsoring Organizations of the Treadway Commission (2013 framework) and our report dated -February 18, 2020 expressed an unqualified opinion thereon.
Basis for Opinion
These financial statements are the responsibility of the Partnership’s management. Our responsibility is to express an opinion on the Partnership’s financial statements based on our audits. We are a public accounting firm registered with the PCAOB and are required to be independent with respect to the Partnership in accordance with the U.S. federal securities laws and the applicable rules and regulations of the Securities and Exchange Commission and the PCAOB.
We conducted our audits in accordance with the standards of the PCAOB. Those standards require that we plan and perform the audit to obtain reasonable assurance about whether the financial statements are free of material misstatement, whether due to error or fraud. Our audits included performing procedures to assess the risks of material misstatement of the financial statements, whether due to error or fraud, and performing procedures that respond to those risks. Such procedures included examining, on a test basis, evidence regarding the amounts and disclosures in the financial statements. Our audits also included evaluating the accounting principles used and significant estimates made by management, as well as evaluating the overall presentation of the financial statements. We believe that our audits provide a reasonable basis for our opinion.
Critical Audit Matter
The critical audit matter communicated below is a matter arising from the current period audit of the financial statements that was communicated or required to be communicated to the audit committee and that: (1) relates to accounts or disclosures that are material to the financial statements and (2) involved our especially challenging, subjective or complex judgments. The communication of the critical audit matter does not alter in any way our opinion on the consolidated financial statements, taken as a whole, and we are not, by communicating the critical audit matter below, providing a separate opinion on the critical audit matter or on the account or disclosures to which it relates.
61
Defined Benefit Pension Obligation | ||
Description of the Matter | At December 31, 2019, the Partnership’s defined benefit pension obligation was $381 million and exceeded the fair value of pension plan assets of $249 million, resulting in a net pension obligation of $132 million. As discussed in Note 11 to the consolidated financial statements, the Partnership updates the estimates used to measure the defined benefit pension obligation and plan assets annually or upon a remeasurement event to reflect the actual return on plan assets and updated actuarial assumptions. Auditing the pension obligation was complex due to the judgmental nature of certain actuarial assumptions used in the measurement process, including the discount rate, mortality rates, retirement rate and future compensation levels. The projected benefit obligation was sensitive to these assumptions. | |
How We Addressed the Matter in Our Audit | We obtained an understanding, evaluated the design and tested the operating effectiveness of controls over the Partnership’s review of the defined benefit pension obligation calculations, the significant actuarial assumptions and the data inputs provided to the third-party actuary. To test the defined benefit pension obligation, our audit procedures included, among others, evaluating the methodology used, the significant actuarial assumptions discussed above and the underlying data used in the measurement process. We compared the actuarial assumptions used by management to historical trends and evaluated the change in the defined benefit pension obligation from the prior year resulting from the change in service cost, interest cost, actuarial gains and losses, benefit payments, contributions and other activities. In addition, we involved our actuarial specialists to assist with our procedures including, among others, evaluating management’s methodology for determining the discount rate that reflects the maturity and duration of the benefit payments and is used to measure the defined benefit pension obligation. As part of this assessment, we compared the projected cash flows used in the current year measurement of the pension obligation to those in the prior year and compared the current year benefits paid to the prior year projected payments. To evaluate the future mortality rates, retirement rate and future compensation levels, we assessed whether the information is consistent with publicly available information, and whether any market data adjusted for entity-specific adjustments were applied. We also tested the completeness and accuracy of the underlying data, including the participant data used in the actuarial calculations. | |
/s/ Ernst & Young LLP
We have served as the Partnership’s auditor since 1999.
Tulsa, Oklahoma
February 18, 2020
62
Report of Independent Registered Public Accounting Firm
To the Common Unitholders of Magellan Midstream Partners, L.P. and the Board of Directors of Magellan GP, LLC, General Partner of Magellan Midstream Partners, L.P.
Opinion on Internal Control Over Financial Reporting
We have audited Magellan Midstream Partners, L.P.’s internal control over financial reporting as of December 31, 2019, based on criteria established in Internal Control-Integrated Framework issued by the Committee of Sponsoring Organizations of the Treadway Commission (2013 framework) (the COSO criteria). In our opinion, Magellan Midstream Partners, L.P. (the Partnership) maintained, in all material respects, effective internal control over financial reporting as of December 31, 2019, based on the COSO criteria.
We also have audited, in accordance with the standards of the Public Company Accounting Oversight Board (United States) (PCAOB), the consolidated balance sheets of the Partnership as of December 31, 2019 and 2018, the related consolidated statements of income, comprehensive income, partners’ capital and cash flows for each of the three years in the period ended December 31, 2019, and the related notes and our report dated February 18, 2020 expressed an unqualified opinion thereon.
Basis for Opinion
The Partnership’s management is responsible for maintaining effective internal control over financial reporting and for its assessment of the effectiveness of internal control over financial reporting included in the accompanying Management’s Annual Report on Internal Control over Financial Reporting. Our responsibility is to express an opinion on the Partnership’s internal control over financial reporting based on our audit. We are a public accounting firm registered with the PCAOB and are required to be independent with respect to the Partnership in accordance with the U.S. federal securities laws and the applicable rules and regulations of the Securities and Exchange Commission and the PCAOB.
We conducted our audit in accordance with the standards of the PCAOB. Those standards require that we plan and perform the audit to obtain reasonable assurance about whether effective internal control over financial reporting was maintained in all material respects.
Our audit included obtaining an understanding of internal control over financial reporting, assessing the risk that a material weakness exists, testing and evaluating the design and operating effectiveness of internal control based on the assessed risk, and performing such other procedures as we considered necessary in the circumstances. We believe that our audit provides a reasonable basis for our opinion.
Definition and Limitations of Internal Control Over Financial Reporting
An entity’s internal control over financial reporting is a process designed to provide reasonable assurance regarding the reliability of financial reporting and the preparation of financial statements for external purposes in accordance with generally accepted accounting principles. An entity’s internal control over financial reporting includes those policies and procedures that (1) pertain to the maintenance of records that, in reasonable detail, accurately and fairly reflect the transactions and dispositions of the assets of the entity; (2) provide reasonable assurance that transactions are recorded as necessary to permit preparation of financial statements in accordance with generally accepted accounting principles, and that receipts and expenditures of the entity are being made only in accordance with authorizations of management and directors of the entity; and (3) provide reasonable assurance regarding prevention or timely detection of unauthorized acquisition, use, or disposition of the entity’s assets that could have a material effect on the financial statements.
Because of its inherent limitations, internal control over financial reporting may not prevent or detect misstatements. Also, projections of any evaluation of effectiveness to future periods are subject to the risk that controls may become
63
inadequate because of changes in conditions, or that the degree of compliance with the policies or procedures may deteriorate.
/s/ Ernst & Young LLP
Tulsa, Oklahoma
February 18, 2020
64
MAGELLAN MIDSTREAM PARTNERS, L.P.
CONSOLIDATED STATEMENTS OF INCOME
(In thousands, except per unit amounts)
Year Ended December 31, | ||||||||||||
2017 | 2018 | 2019 | ||||||||||
Transportation and terminals revenue | $ | $ | $ | |||||||||
Product sales revenue | ||||||||||||
Affiliate management fee revenue | ||||||||||||
Total revenue | ||||||||||||
Costs and expenses: | ||||||||||||
Operating | ||||||||||||
Cost of product sales | ||||||||||||
Depreciation, amortization and impairment | ||||||||||||
General and administrative | ||||||||||||
Total costs and expenses | ||||||||||||
Other operating income (expense) | ||||||||||||
Earnings of non-controlled entities | ||||||||||||
Operating profit | ||||||||||||
Interest expense | ||||||||||||
Interest capitalized | ( | ) | ( | ) | ( | ) | ||||||
Interest income | ( | ) | ( | ) | ( | ) | ||||||
Gain on disposition of assets | ( | ) | ( | ) | ( | ) | ||||||
Other (income) expense | ||||||||||||
Income before provision for income taxes | ||||||||||||
Provision for income taxes | ||||||||||||
Net income | $ | $ | $ | |||||||||
Basic net income per common unit | $ | $ | $ | |||||||||
Diluted net income per common unit | $ | $ | $ | |||||||||
Weighted average number of common units outstanding used for basic net income per unit calculation | ||||||||||||
Weighted average number of common units outstanding used for diluted net income per unit calculation | ||||||||||||
See notes to consolidated financial statements.
65
MAGELLAN MIDSTREAM PARTNERS, L.P.
CONSOLIDATED STATEMENTS OF COMPREHENSIVE INCOME
(In thousands)
Year Ended December 31, | |||||||||||
2017 | 2018 | 2019 | |||||||||
Net income | $ | $ | $ | ||||||||
Other comprehensive income (loss): | |||||||||||
Derivative activity: | |||||||||||
Net gain (loss) on cash flow hedges | ( | ) | ( | ) | |||||||
Reclassification of net loss on cash flow hedges to income | |||||||||||
Changes in employee benefit plan assets and benefit obligations recognized in other comprehensive income: | |||||||||||
Net actuarial loss | ( | ) | ( | ) | ( | ) | |||||
Amortization of prior service credit | ( | ) | ( | ) | ( | ) | |||||
Amortization of actuarial loss | |||||||||||
Settlement cost | |||||||||||
Total other comprehensive income (loss) | ( | ) | ( | ) | |||||||
Comprehensive income | $ | $ | $ | ||||||||
See notes to consolidated financial statements.
66
MAGELLAN MIDSTREAM PARTNERS, L.P.
CONSOLIDATED BALANCE SHEETS
(In thousands)
December 31, | ||||||||
2018 | 2019 | |||||||
ASSETS | ||||||||
Current assets: | ||||||||
Cash and cash equivalents | $ | $ | ||||||
Trade accounts receivable | ||||||||
Other accounts receivable | ||||||||
Inventory | ||||||||
Commodity derivatives contracts, net | ||||||||
Commodity derivatives deposits | ||||||||
Other current assets | ||||||||
Total current assets | ||||||||
Property, plant and equipment | ||||||||
Less: accumulated depreciation | ||||||||
Net property, plant and equipment | ||||||||
Investments in non-controlled entities | ||||||||
Right-of-use asset, operating leases | — | |||||||
Long-term receivables | ||||||||
Goodwill | ||||||||
Other intangibles (less accumulated amortization of $2,979 and $6,255 at December 31, 2018 and 2019, respectively) | ||||||||
Restricted cash | ||||||||
Other noncurrent assets | ||||||||
Total assets | $ | $ | ||||||
LIABILITIES AND PARTNERS’ CAPITAL | ||||||||
Current liabilities: | ||||||||
Accounts payable | $ | $ | ||||||
Accrued payroll and benefits | ||||||||
Accrued interest payable | ||||||||
Accrued taxes other than income | ||||||||
Deferred revenue | ||||||||
Accrued product liabilities | ||||||||
Commodity derivatives contracts, net | ||||||||
Commodity derivatives deposits | ||||||||
Current portion of operating lease liability | — | |||||||
Current portion of long-term debt, net | ||||||||
Other current liabilities | ||||||||
Total current liabilities | ||||||||
Long-term operating lease liability | — | |||||||
Long-term debt, net | ||||||||
Long-term pension and benefits | ||||||||
Other noncurrent liabilities | ||||||||
Commitments and contingencies | ||||||||
Partners’ capital: | ||||||||
Common unitholders (228,195 units and 228,403 units outstanding at December 31, 2018 and 2019, respectively) | ||||||||
Accumulated other comprehensive loss | ( | ) | ( | ) | ||||
Total partners’ capital | ||||||||
Total liabilities and partners’ capital | $ | $ | ||||||
See notes to consolidated financial statements.
67
MAGELLAN MIDSTREAM PARTNERS, L.P.
CONSOLIDATED STATEMENTS OF CASH FLOWS
(In thousands)
Year Ended December 31, | ||||||||||||
2017 | 2018 | 2019 | ||||||||||
Operating Activities: | ||||||||||||
Net income | $ | $ | $ | |||||||||
Adjustments to reconcile net income to net cash provided by operating activities: | ||||||||||||
Depreciation, amortization and impairment expense | ||||||||||||
Gain on sale and retirement of assets | ( | ) | ( | ) | ( | ) | ||||||
Earnings of non-controlled entities | ( | ) | ( | ) | ( | ) | ||||||
Distributions from operations of non-controlled entities | ||||||||||||
Equity-based incentive compensation expense | ||||||||||||
Settlement cost, amortization of prior service credit and actuarial loss | ||||||||||||
Debt prepayment costs | ||||||||||||
Changes in components of operating assets and liabilities (Note 8) | ||||||||||||
Net cash provided by operating activities | ||||||||||||
Investing Activities: | ||||||||||||
Additions to property, plant and equipment, net(1) | ( | ) | ( | ) | ( | ) | ||||||
Proceeds from sale and disposition of assets | ||||||||||||
Investments in non-controlled entities | ( | ) | ( | ) | ( | ) | ||||||
Distributions from returns of investments in non-controlled entities | ||||||||||||
Deposits received from undivided joint interest third party | ||||||||||||
Net cash used by investing activities | ( | ) | ( | ) | ( | ) | ||||||
Financing Activities: | ||||||||||||
Distributions paid | ( | ) | ( | ) | ( | ) | ||||||
Net commercial paper repayments | ( | ) | ||||||||||
Borrowings under long-term notes | ||||||||||||
Payments on notes | ( | ) | ( | ) | ||||||||
Debt placement costs | ( | ) | ( | ) | ( | ) | ||||||
Net receipt (payment) on financial derivatives | ( | ) | ||||||||||
Payments associated with settlement of equity-based incentive compensation | ( | ) | ( | ) | ( | ) | ||||||
Debt prepayment costs | ( | ) | ||||||||||
Net cash used by financing activities | ( | ) | ( | ) | ( | ) | ||||||
Change in cash, cash equivalents and restricted cash | ( | ) | ||||||||||
Cash, cash equivalents and restricted cash at beginning of period | ||||||||||||
Cash, cash equivalents and restricted cash at end of period | $ | $ | $ | |||||||||
Supplemental non-cash investing and financing activities: | ||||||||||||
Contribution of property, plant and equipment to a non-controlled entity | $ | $ | $ | |||||||||
(1) Additions to property, plant and equipment | $ | ( | ) | $ | ( | ) | $ | ( | ) | |||
Changes in accounts payable and other current liabilities related to capital expenditures | ||||||||||||
Additions to property, plant and equipment, net | $ | ( | ) | $ | ( | ) | $ | ( | ) | |||
See notes to consolidated financial statements.
68
MAGELLAN MIDSTREAM PARTNERS, L.P.
CONSOLIDATED STATEMENT OF PARTNERS’ CAPITAL
(In thousands)
Common Unitholders | Accumulated Other Comprehensive Loss | Total Partners’ Capital | ||||||||||||
Balance, January 1, 2017 | $ | $ | ( | ) | $ | |||||||||
Comprehensive income: | ||||||||||||||
Net income | — | |||||||||||||
Total other comprehensive income (loss) | — | ( | ) | ( | ) | |||||||||
Total comprehensive income (loss) | ( | ) | ||||||||||||
Distributions | ( | ) | — | ( | ) | |||||||||
Equity-based incentive compensation expense | — | |||||||||||||
Issuance of common units in settlement of equity-based incentive plan awards | — | |||||||||||||
Payments associated with settlement of equity-based incentive compensation | ( | ) | — | ( | ) | |||||||||
Other | ( | ) | — | ( | ) | |||||||||
Balance, December 31, 2017 | ( | ) | ||||||||||||
Comprehensive income: | ||||||||||||||
Net income | — | |||||||||||||
Total other comprehensive income (loss) | — | |||||||||||||
Total comprehensive income (loss) | ||||||||||||||
Distributions | ( | ) | — | ( | ) | |||||||||
Equity-based incentive compensation expense | — | |||||||||||||
Issuance of common units in settlement of equity-based incentive plan awards | — | |||||||||||||
Payments associated with settlement of equity-based incentive compensation | ( | ) | — | ( | ) | |||||||||
ASC 606 cumulative effect | — | |||||||||||||
Other | ( | ) | — | ( | ) | |||||||||
Balance, December 31, 2018 | ( | ) | ||||||||||||
Comprehensive income: | ||||||||||||||
Net income | — | |||||||||||||
Total other comprehensive income (loss) | — | ( | ) | ( | ) | |||||||||
Total comprehensive income (loss) | ( | ) | ||||||||||||
Distributions | ( | ) | — | ( | ) | |||||||||
Equity-based incentive compensation expense | — | |||||||||||||
Issuance of common units in settlement of equity-based incentive plan awards | — | |||||||||||||
Payments associated with settlement of equity-based incentive compensation | ( | ) | — | ( | ) | |||||||||
Other | ( | ) | — | ( | ) | |||||||||
Balance, December 31, 2019 | $ | $ | ( | ) | $ | |||||||||
See notes to consolidated financial statements.
69
MAGELLAN MIDSTREAM PARTNERS, L.P.
NOTES TO CONSOLIDATED FINANCIAL STATEMENTS
1. Organization and Description of Business
Organization
Unless indicated otherwise, the terms “our,” “we,” “us” and similar language refer to Magellan Midstream Partners, L.P. together with its subsidiaries. Magellan Midstream Partners, L.P. is a Delaware limited partnership, and its common units are traded on the New York Stock Exchange under the ticker symbol “MMP.” Magellan GP, LLC, a wholly owned Delaware limited liability company, serves as its general partner.
Description of Business
We are principally engaged in the transportation, storage and distribution of refined petroleum products and crude oil. As of December 31, 2019, our asset portfolio consisted of:
• | our refined products segment, comprised of our approximately |
• | our crude oil segment, comprised of approximately |
• | our marine storage segment, consisting of |
Description of Products
Terminology common in our industry includes the following terms, which describe products that we transport, store, distribute or otherwise handle through our petroleum pipelines and terminals:
• | refined products are the output from crude oil refineries that are primarily used as fuels by consumers. Refined products include gasoline, diesel fuel, aviation fuel, kerosene and heating oil. Diesel fuel, kerosene and heating oil are also referred to as distillate; |
• | transmix is a mixture of refined products that forms when transported in pipelines. Transmix is fractionated and blended into usable refined products; |
• | liquefied petroleum gases, or LPGs, are liquids produced as by-products of the crude oil refining process and in connection with natural gas production. LPGs include butane and propane; |
• | blendstocks are products blended with refined products to change or enhance their characteristics such as increasing a gasoline’s octane or oxygen content. Blendstocks include alkylates, oxygenates and natural gasoline; |
• | heavy oils and feedstocks are products used as burner fuels or feedstocks for further processing by refineries and petrochemical facilities. Heavy oils and feedstocks include No. 6 fuel oil and vacuum gas oil; |
• | crude oil, which includes condensate, is a naturally occurring unrefined petroleum product recovered from underground that is used as feedstock by refineries, splitters and petrochemical facilities; and |
70
MAGELLAN MIDSTREAM PARTNERS, L.P.
NOTES TO CONSOLIDATED FINANCIAL STATEMENTS—Continued
• | biofuels, such as ethanol and biodiesel, are fuels derived from living materials and typically blended with other refined products as required by government mandates. |
We use the term petroleum products to describe any, or a combination, of the above-noted products.
2. | Summary of Significant Accounting Policies |
Significant Accounting Policies
Basis of Presentation. Our consolidated financial statements include our refined products, crude oil and marine storage operating segments. We consolidate all entities in which we have a controlling ownership interest. We apply the equity method of accounting to investments in entities over which we exercise significant influence but do not control. We eliminate all intercompany transactions.
Reclassifications. Certain prior year amounts have been reclassified to conform with the current period’s presentation.
Cash Equivalents. Cash and cash equivalents include demand and time deposits and funds that own highly marketable securities with original maturities of three months or less when acquired. We periodically assess the financial condition of the institutions where we hold these funds, and, at December 31, 2018 and 2019, we believed our credit risk relative to these funds was minimal.
Restricted Cash. Restricted cash includes cash that we are contractually required to use for the construction of fixed assets and is unavailable for general use. It is classified as noncurrent due to its designation to be used for the construction of noncurrent assets.
Product Overages and Shortages. Each period end we measure the volume of each type of product in our pipeline systems and terminals, which is compared to the volumes of our customers’ inventories (as adjusted for tender deductions). To the extent the product volumes in our pipeline systems and terminals exceed the volumes of our customers’ book inventories, we recognize a gain from the product overage and increase our product inventories. To the extent the product in our pipeline systems and terminals is less than our customers’ book inventories, we recognize a loss from the product shortage and we record a liability for product owed to our customers. The product overages we recognize are recorded based on market prices, and the resulting inventory is carried at weighted average cost. The product shortages we recognize are recorded based on our weighted average cost. Additionally, when product shortages result in a net short inventory position, the related liability is recorded based on period-end
71
MAGELLAN MIDSTREAM PARTNERS, L.P.
NOTES TO CONSOLIDATED FINANCIAL STATEMENTS—Continued
market prices. Product overages and shortages as well as adjustments to the value of net short inventory positions are recorded in operating expenses on our consolidated statements of income.
The amounts recognized as provision for income taxes in our consolidated statements of income are primarily
comprised of partnership-level taxes levied by the state of Texas. This tax is based on revenues less direct costs of sale for our assets apportioned to the state of Texas.
Net Income Per Unit. We calculate basic net income per common unit for each period by dividing net income by the weighted-average number of common units outstanding. The difference between our actual common units outstanding and our weighted-average number of common units outstanding used to calculate net income per common unit is due to the impact of: (i) the phantom units issued to our independent directors, which are included in the calculation of basic and diluted weighted average units outstanding and (ii) the weighted-average effect of units actually issued during a period. The difference between the weighted-average number of common units outstanding used for basic and diluted net income per unit calculations on our consolidated statements of income is primarily the dilutive effect of phantom unit awards granted pursuant to our long-term incentive plan, which have not yet vested in periods where contingent performance metrics have been met.
Revenue from Contracts with Customers | ||
Property, Plant and Equipment | ||
Goodwill and Other Intangible Assets | ||
Investments in Non-Controlled Entities | ||
Inventory | ||
Leases | ||
Pension and Postretirement Medical and Life Benefit Obligations | ||
Equity-Based Incentive Compensation | ||
Derivative Financial Instruments | ||
Contingencies and Environmental | ||
72
MAGELLAN MIDSTREAM PARTNERS, L.P.
NOTES TO CONSOLIDATED FINANCIAL STATEMENTS—Continued
New Accounting Pronouncements - Adopted by us on January 1, 2019
In February 2016, the Financial Accounting Standards Board (“FASB”) issued Accounting Standards Update (“ASU”) 2016-02, Leases (Topic 842). This ASU requires lessees to recognize a right-of-use asset and lease liability on the balance sheet for all leases, with the exception of short-term leases. The new accounting model for lessors remains largely the same, although some changes have been made to align it with the new lessee model and the new revenue recognition guidance. This update also requires companies to include additional disclosures regarding their lessee and lessor agreements. We adopted this standard on January 1, 2019, and it did not have a material impact on our consolidated statements of income or our leverage ratio as defined in our credit agreement. Adoption of this ASU resulted in an initial increase in our assets and liabilities by approximately $172 million due to the recognition of right-of-use assets and lease liabilities. See Note 10 – Leases for our lease disclosures.
3. | Segment Disclosures |
Our reportable segments are strategic business units that offer different products and services. Our segments are managed separately because each segment requires different marketing strategies and business knowledge. Management evaluates performance based on segment operating margin, which includes revenue from affiliates and external customers, operating expenses, cost of product sales and earnings of non-controlled entities.
We believe that investors benefit from having access to the same financial measures used by management. Operating margin, which is presented in the following tables, is an important measure used by management to evaluate the economic performance of our core operations. Operating margin is not a GAAP measure, but the components of operating margin are computed using amounts that are determined in accordance with GAAP. A reconciliation of operating margin to operating profit, which is its nearest comparable GAAP financial measure, is included in the tables below. Operating profit includes depreciation, amortization and impairment expense and G&A expense that management does not consider when evaluating the core profitability of our separate operating segments.
During 2018, we adopted ASC 606, Revenue from Contracts with Customers. Amounts from 2017 reflected in the following tables have not been adjusted and continue to be reflected in accordance with our historical accounting. Refer to Note 4 – Revenue for further details.
73
MAGELLAN MIDSTREAM PARTNERS, L.P.
NOTES TO CONSOLIDATED FINANCIAL STATEMENTS—Continued
Year Ended December 31, 2017 | ||||||||||||||||||||
(in thousands) | ||||||||||||||||||||
Refined Products | Crude Oil | Marine Storage | Intersegment Eliminations | Total | ||||||||||||||||
Transportation and terminals revenue | $ | $ | $ | $ | ( | ) | $ | |||||||||||||
Product sales revenue | ||||||||||||||||||||
Affiliate management fee revenue | ||||||||||||||||||||
Total revenue | ( | ) | ||||||||||||||||||
Operating expenses | ( | ) | ||||||||||||||||||
Cost of product sales | ||||||||||||||||||||
(Earnings) losses of non-controlled entities | ( | ) | ( | ) | ( | ) | ||||||||||||||
Operating margin | ||||||||||||||||||||
Depreciation, amortization and impairment expense | ||||||||||||||||||||
G&A expenses | ||||||||||||||||||||
Operating profit | $ | $ | $ | $ | $ | |||||||||||||||
Additions to long-lived assets | $ | $ | $ | $ | ||||||||||||||||
As of December 31, 2017 | ||||||||||||||||||||
Segment assets | $ | $ | $ | $ | ||||||||||||||||
Corporate assets | ||||||||||||||||||||
Total assets | $ | |||||||||||||||||||
Goodwill | $ | $ | $ | $ | ||||||||||||||||
Investments in non-controlled entities | $ | $ | $ | $ | ||||||||||||||||
74
MAGELLAN MIDSTREAM PARTNERS, L.P.
NOTES TO CONSOLIDATED FINANCIAL STATEMENTS—Continued
Year Ended December 31, 2018 | ||||||||||||||||||||
(in thousands) | ||||||||||||||||||||
Refined Products | Crude Oil | Marine Storage | Intersegment Eliminations | Total | ||||||||||||||||
Transportation and terminals revenue | $ | $ | $ | $ | ( | ) | $ | |||||||||||||
Product sales revenue | ||||||||||||||||||||
Affiliate management fee revenue | ||||||||||||||||||||
Total revenue | ( | ) | ||||||||||||||||||
Operating expenses | ( | ) | ||||||||||||||||||
Cost of product sales | ||||||||||||||||||||
Earnings of non-controlled entities | ( | ) | ( | ) | ( | ) | ( | ) | ||||||||||||
Operating margin | ||||||||||||||||||||
Depreciation, amortization and impairment expense | ||||||||||||||||||||
G&A expenses | ||||||||||||||||||||
Operating profit | $ | $ | $ | $ | $ | |||||||||||||||
Additions to long-lived assets | $ | $ | $ | $ | ||||||||||||||||
As of December 31, 2018 | ||||||||||||||||||||
Segment assets | $ | $ | $ | $ | ||||||||||||||||
Corporate assets | ||||||||||||||||||||
Total assets | $ | |||||||||||||||||||
Goodwill | $ | $ | $ | $ | ||||||||||||||||
Investments in non-controlled entities | $ | $ | $ | $ | ||||||||||||||||
75
MAGELLAN MIDSTREAM PARTNERS, L.P.
NOTES TO CONSOLIDATED FINANCIAL STATEMENTS—Continued
Year Ended December 31, 2019 | ||||||||||||||||||||
(in thousands) | ||||||||||||||||||||
Refined Products | Crude Oil | Marine Storage | Intersegment Eliminations | Total | ||||||||||||||||
Transportation and terminals revenue | $ | $ | $ | $ | ( | ) | $ | |||||||||||||
Product sales revenue | ||||||||||||||||||||
Affiliate management fee revenue | ||||||||||||||||||||
Total revenue | ( | ) | ||||||||||||||||||
Operating expenses | ( | ) | ||||||||||||||||||
Cost of product sales | ||||||||||||||||||||
Other operating (income) expense | ( | ) | ( | ) | ( | ) | ||||||||||||||
Earnings of non-controlled entities | ( | ) | ( | ) | ( | ) | ( | ) | ||||||||||||
Operating margin | ||||||||||||||||||||
Depreciation, amortization and impairment expense | ||||||||||||||||||||
G&A expenses | ||||||||||||||||||||
Operating profit | $ | $ | $ | $ | $ | |||||||||||||||
Additions to long-lived assets | $ | $ | $ | $ | ||||||||||||||||
As of December 31, 2019 | ||||||||||||||||||||
Segment assets | $ | $ | $ | $ | ||||||||||||||||
Corporate assets | ||||||||||||||||||||
Total assets | $ | |||||||||||||||||||
Goodwill | $ | $ | $ | $ | ||||||||||||||||
Investments in non-controlled entities | $ | $ | $ | $ | ||||||||||||||||
4. Revenue
Revenue recognition policies
Revenue is recognized upon the satisfaction of each performance obligation required by our customer contracts. Transportation and terminals revenue is recognized over time as our customers receive the benefits of our service as it is performed on their behalf using an output method based on actual deliveries. Revenue for our storage services is recognized over time using an output method based on the capacity of storage under contract with our customers. Product sales revenue is recognized at a point in time when our customers take control of the commodities purchased. We record back-to-back purchases and sales of petroleum products on a net basis.
We recognize pipeline transportation revenue for crude oil shipments when our customers’ product arrives at the customer-designated destination. For shipments of refined products under published tariffs that combine transportation and terminalling services, we recognize revenue when our customers take delivery of their product from our system. For shipments where terminalling services are not included in the tariff, we recognize revenue when our customers’ product arrives at the customer-designated destination. We have certain contracts that require counterparties to ship a minimum volume over an agreed-upon time period, which are contracted as minimum dollar or volume commitments. Revenue pursuant to these take-or-pay contracts is recognized when the customers utilize their committed volumes. Additionally, when we estimate that the customers will not utilize all or a portion of their committed volumes, we recognize revenue in proportion to the pattern of exercised rights for the respective commitment period.
76
MAGELLAN MIDSTREAM PARTNERS, L.P.
NOTES TO CONSOLIDATED FINANCIAL STATEMENTS—Continued
Our interstate common carrier petroleum products pipeline operations are subject to rate regulation by the Federal Energy Regulatory Commission (“FERC”) under the Interstate Commerce Act, the Energy Policy Act of 1992 and rules and orders promulgated pursuant thereto. FERC regulation requires that interstate pipeline rates be filed with the FERC, be posted publicly and be nondiscriminatory and “just and reasonable.” The rates on approximately 40 % of the shipments on our refined products pipeline system are regulated by the FERC primarily through an index methodology. As an alternative to cost-of-service or index-based rates, interstate pipeline companies may establish rates by obtaining authority to charge market-based rates in competitive markets or by negotiation with unaffiliated shippers. Approximately 60 % of our refined products pipeline system’s markets are either subject to regulations by the states in which we operate or are approved for market-based rates by the FERC, and in both cases these rates can generally be adjusted at our discretion based on market factors. Most of the tariffs on our crude oil pipelines are established by negotiated rates that generally provide for annual adjustments in line with changes in the FERC index, subject to certain modifications.
For both our index-based rates and our market-based rates, our published tariffs serve as contracts, and shippers nominate the volume to be shipped up to a month in advance. These tariffs include provisions which allow us to deduct from our customer’s inventory a small percentage of the products our customers transport on our pipeline systems. We refer to this non-monetary consideration as tender deduction revenue. We receive tender deductions from our customers as consideration for product losses during the transportation of petroleum products within our pipeline systems. Tender deduction revenue is generally recognized as transportation revenue when the customer's transported commodities reach their destination and is recorded at the fair value of the product received on the date received or the contract date, as applicable.
Product sales revenue pricing is contractually specified, and we have determined that each barrel sold represents a separate performance obligation. Transaction prices for our other services including terminalling, storage and ancillary services are typically contracted as a single performance obligation with our customers. In circumstances where multiple performance obligations are contractually required, we allocate the transaction price to the various performance obligations based on their relative standalone selling price.
77
MAGELLAN MIDSTREAM PARTNERS, L.P.
NOTES TO CONSOLIDATED FINANCIAL STATEMENTS—Continued
Statement of Income Disclosures
The following tables provide details of our revenues disaggregated by key activities that comprise our performance obligations by operating segment (in thousands):
Year Ended December 31, 2018 | ||||||||||||||||||||
Refined Products | Crude Oil | Marine Storage | Intersegment Eliminations | Total | ||||||||||||||||
Transportation | $ | $ | $ | $ | $ | |||||||||||||||
Terminalling | ||||||||||||||||||||
Storage | ( | ) | ||||||||||||||||||
Ancillary services | ||||||||||||||||||||
Lease revenue | ||||||||||||||||||||
Transportation and terminals revenue | ( | ) | ||||||||||||||||||
Product sales revenue | ||||||||||||||||||||
Affiliate management fee revenue | ||||||||||||||||||||
Total revenue | ( | ) | ||||||||||||||||||
Revenue not under the guidance of ASC 606: | ||||||||||||||||||||
Lease revenue(1) | ( | ) | ( | ) | ( | ) | ( | ) | ||||||||||||
(Gains) losses from futures contracts included in product sales revenue(2) | ( | ) | ( | ) | ||||||||||||||||
Affiliate management fee revenue | ( | ) | ( | ) | ( | ) | ( | ) | ||||||||||||
Total revenue from contracts with customers under ASC 606 | $ | $ | $ | $ | ( | ) | $ | |||||||||||||
(1) Lease revenue is accounted for under ASC 840, Leases.
(2) The impact on product sales revenue from futures contracts falls under the guidance of ASC 815, Derivatives and Hedging.
78
MAGELLAN MIDSTREAM PARTNERS, L.P.
NOTES TO CONSOLIDATED FINANCIAL STATEMENTS—Continued
Year Ended December 31, 2019 | ||||||||||||||||||||
Refined Products | Crude Oil | Marine Storage | Intersegment Eliminations | Total | ||||||||||||||||
Transportation | $ | $ | $ | $ | $ | |||||||||||||||
Terminalling | ||||||||||||||||||||
Storage | ( | ) | ||||||||||||||||||
Ancillary services | ||||||||||||||||||||
Lease revenue | ||||||||||||||||||||
Transportation and terminals revenue | ( | ) | ||||||||||||||||||
Product sales revenue | ||||||||||||||||||||
Affiliate management fee revenue | ||||||||||||||||||||
Total revenue | ( | ) | ||||||||||||||||||
Revenue not under the guidance of ASC 606: | ||||||||||||||||||||
Lease revenue(1) | ( | ) | ( | ) | ( | ) | ( | ) | ||||||||||||
(Gains) losses from futures contracts included in product sales revenue(2) | ||||||||||||||||||||
Affiliate management fee revenue | ( | ) | ( | ) | ( | ) | ( | ) | ||||||||||||
Total revenue from contracts with customers under ASC 606 | $ | $ | $ | $ | ( | ) | $ | |||||||||||||
(1) Lease revenue is accounted for under ASC 842, Leases.
(2) The impact on product sales revenue from futures contracts falls under the guidance of ASC 815, Derivatives and Hedging.
Balance Sheet Disclosures
We invoice customers on our refined products pipelines for transportation services when their product enters our system. At each period end, we record all invoiced amounts associated with products that have not yet been delivered (in-transit products) as a contract liability. This liability is presented as deferred revenue on our consolidated balance sheets. Deferred revenue is also recorded for pre-payments received in conjunction with take-or-pay contracts, storage contracts and other service offerings in which the service to our customers remains unfulfilled. Additionally, at each period end, we defer the direct costs we have incurred associated with our customers’ in-transit products as contract assets. Contract assets are presented on our consolidated balance sheets as other current assets. These direct costs are estimated based on our per-barrel direct delivery cost for the current period multiplied by the total in-transit barrels in our system at the end of the period multiplied by 50 % to reflect the average transportation costs incurred for all products across all of our pipeline systems. We use 50 % of the in-transit barrels because that best represents the average delivery point of all barrels in our pipeline system. These contract assets and contract liabilities are determined using judgments and assumptions that management considers reasonable.
79
MAGELLAN MIDSTREAM PARTNERS, L.P.
NOTES TO CONSOLIDATED FINANCIAL STATEMENTS—Continued
The following table summarizes our accounts receivable, contract assets and contract liabilities resulting from contracts with customers (in thousands):
December 31, 2018 | December 31, 2019 | |||||||
Accounts receivable from contracts with customers | $ | $ | ||||||
Contract assets | $ | $ | ||||||
Contract liabilities | $ | $ | ||||||
For the year ended December 31, 2019, we recognized $91.4 million of transportation and terminals revenue that was recorded in deferred revenue as of December 31, 2018.
Unfulfilled Performance Obligations
We have certain contracts with customers that represent customer commitments to purchase a minimum amount of our services over specified time periods. These contracts require us to provide services to our customers in the future and result in our having unfulfilled performance obligations (“UPOs”) to our customers related to the periods remaining under each contract. We have UPOs in many of our core business services, including transportation, terminalling and storage services. The UPOs will be recognized as revenue in the future as our customers utilize our services or when we estimate that our customers are not likely to use all or a portion of their commitments.
The following table provides the aggregate amount of the transaction price allocated to our UPOs as of December 31, 2019 by operating segment, including the range of years remaining on our contracts with customers and an estimate of revenues expected to be recognized over the next 12 months (dollars in thousands):
Refined Products | Crude Oil | Marine Storage | Total | |||||||||||||
Balances at December 31, 2019 | $ | $ | $ | $ | ||||||||||||
Remaining terms | 1 - 19 years | 1 - 10 years | 1 - 5 years | |||||||||||||
Estimated revenues from UPOs to be recognized in the next 12 months | $ | $ | $ | $ | ||||||||||||
In computing the value of these future revenues, we have used the current rates in effect as of December 31, 2019 and have not included any estimates for future rate changes due to changes in the FERC index or other contractually negotiated rate escalations. Our UPO balances include the full amount of our customer commitments as of December 31, 2019 through the expiration of the related contracts. The UPO balances disclosed exclude all performance obligations for which the original expected term is one year or less, the consideration is variable or the future use of our services is fully at the discretion of our customers.
5. | Property, Plant and Equipment, Goodwill and Other Intangibles |
Property, Plant and Equipment
Property, plant and equipment consist primarily of pipeline, pipeline-related equipment, storage tanks and processing equipment. We state property, plant and equipment at cost except for certain acquired assets recorded at fair value on their respective acquisition dates and impaired assets. We record impaired assets at fair value on the last impairment evaluation date for which an adjustment was required.
80
MAGELLAN MIDSTREAM PARTNERS, L.P.
NOTES TO CONSOLIDATED FINANCIAL STATEMENTS—Continued
We assign asset lives based on reasonable estimates when we place an asset into service. Subsequent events could cause us to change our estimates, which would affect the future calculation of depreciation expense.
When we sell or retire property, plant and equipment, we remove its carrying value and the related accumulated depreciation from our accounts and record any associated gains or losses on our consolidated statements of income in the period of sale or disposition.
We capitalize expenditures to replace existing assets and retire the replaced assets. We capitalize expenditures when they extend the useful life, increase the productivity or capacity or improve the safety or efficiency of the asset. We capitalize direct project costs such as labor and materials as incurred. Indirect project costs, such as overhead, are capitalized based on a percentage of direct labor charged to the respective capital project. We charge expenditures for maintenance, repairs and minor replacements to operating expense in the period incurred.
Property, plant and equipment consisted of the following (in thousands):
Estimated Depreciable Lives | ||||||||||
December 31, | ||||||||||
2018 | 2019 | |||||||||
Construction work-in-progress | $ | $ | ||||||||
Land and rights-of-way | ||||||||||
Buildings | 10 to 53 years | |||||||||
Storage tanks | 10 to 40 years | |||||||||
Pipeline and station equipment | 10 to 59 years | |||||||||
Processing equipment | 3 to 56 years | |||||||||
Other | 3 to 53 years | |||||||||
Property, Plant and Equipment, Gross | $ | $ | ||||||||
Other includes total interest capitalized on construction in progress as of December 31, 2018 and 2019 of $67.6 million and $86.4 million, respectively. Depreciation expense for the years ended December 31, 2017, 2018 and 2019 was $196.3 million, $214.4 million and $242.9 million, respectively.
Long-lived assets are reviewed for impairment whenever events or changes in circumstances indicate that the carrying value may not be recoverable. In reviewing for impairment, the carrying value of such assets is compared to the estimated undiscounted future cash flows expected from the use of the assets and their eventual disposition. If such cash flows are not sufficient to support the asset’s recorded value, an impairment charge is recognized to reduce the carrying value of the long-lived asset to its estimated fair value. The determination of future cash flows as well as the estimated fair value of long-lived assets involves significant estimates on the part of management.
During 2018, we made the decision to discontinue commercial operations of our ammonia pipeline due to the system’s low profitability and challenging economic outlook. We estimated the fair value of the ammonia pipeline assets based on expected future cash flows and recognized a $49.1 million impairment charge in depreciation, amortization and impairment expense on our consolidated statements of income in 2018.
81
MAGELLAN MIDSTREAM PARTNERS, L.P.
NOTES TO CONSOLIDATED FINANCIAL STATEMENTS—Continued
Goodwill
We record the excess of purchase price over the fair value of the tangible and identifiable intangible assets acquired and liabilities assumed in a business acquisition (or combination) as goodwill. The goodwill relating to each of our reporting units is tested for impairment annually as well as when an event or change in circumstances indicates an impairment may have occurred.
Other Intangibles
6. | Investments in Non-Controlled Entities |
We account for interests in affiliates that we do not control using the equity method of accounting. Under this method, an investment is recorded at our acquisition cost or capital contributions, as adjusted by contractual terms, plus equity in earnings or losses since acquisition or formation, plus interest capitalized, less distributions received and amortization of interest capitalized and excess net investment. Excess net investment is the amount by which our investment in a non-controlled entity exceeded our proportionate share of the book value of the net assets of that investment. We amortize excess net investment over the weighted-average depreciable asset lives of the equity investee. Our unamortized excess net investment was $34.8 million and $33.9 million at December 31, 2018 and 2019, respectively. The amount of unamortized excess investment is primarily related to our investment in BridgeTex. We evaluate equity method investments for impairment whenever events or circumstances indicate that there is an other-than-temporary loss in value of the investment. In the event that we determine that the loss in value of an investment is other-than-temporary, we would record a charge to earnings to adjust the carrying value to fair value. We recognized no equity investment impairments during 2017, 2018 and 2019.
82
MAGELLAN MIDSTREAM PARTNERS, L.P.
NOTES TO CONSOLIDATED FINANCIAL STATEMENTS—Continued
Our investments in non-controlled entities at December 31, 2019 were comprised of:
Entity | Ownership Interest | |
BridgeTex Pipeline Company, LLC (“BridgeTex”) | ||
Double Eagle Pipeline LLC (“Double Eagle”) | ||
HoustonLink Pipeline Company, LLC (“HoustonLink”) | ||
MVP Terminalling, LLC (“MVP”) | ||
Powder Springs Logistics, LLC (“Powder Springs”) | ||
Saddlehorn Pipeline Company, LLC (“Saddlehorn”) | ||
Seabrook Logistics, LLC (“Seabrook”) | ||
Texas Frontera, LLC (“Texas Frontera”) | ||
We serve as operator of BridgeTex, HoustonLink, MVP, Powder Springs, Saddlehorn, Texas Frontera and the pipeline activities of Seabrook. We receive fees for management services as well as reimbursement or payment to us for certain direct operational payroll and other overhead costs. The management fees we receive are reported as affiliate management fee revenue on our consolidated statements of income. Cost reimbursements we receive from these entities in connection with our operating services are included as reductions to costs and expenses on our consolidated statements of income and totaled $3.6 million, $3.9 million and $5.3 million, respectively, for the years ended December 31, 2017, 2018 and 2019.
We recorded the following revenue and expense transactions from certain of these non-controlled entities in our consolidated statements of income (in thousands):
Year Ended December 31, | ||||||||||||
2017 | 2018 | 2019 | ||||||||||
Transportation and terminals revenue: | ||||||||||||
BridgeTex, capacity lease | $ | $ | $ | |||||||||
Double Eagle, throughput revenue | $ | $ | $ | |||||||||
Saddlehorn, storage revenue | $ | $ | $ | |||||||||
Operating costs: | ||||||||||||
Seabrook, storage lease and ancillary services | $ | — | $ | $ | ||||||||
MVP, sale of air emission reduction credits (reduction of operating costs) | $ | — | $ | ( | ) | $ | — | |||||
Product sales revenue: | ||||||||||||
Powder Springs, butane sales | $ | — | $ | $ | — | |||||||
Seabrook, product sales | $ | — | $ | — | $ | |||||||
Cost of product sales: | ||||||||||||
BridgeTex, transportation charges | $ | $ | — | $ | — | |||||||
Powder Springs, butane purchases | $ | — | $ | $ | — | |||||||
Other income: | ||||||||||||
MVP, easement sale | $ | — | $ | — | $ | |||||||
83
MAGELLAN MIDSTREAM PARTNERS, L.P.
NOTES TO CONSOLIDATED FINANCIAL STATEMENTS—Continued
Our consolidated balance sheets reflected the following balances related to our investments in non-controlled entities (in thousands):
December 31, 2018 | ||||||||||||||||
Trade Accounts Receivable | Other Accounts Receivable | Other Accounts Payable | Long-Term Receivables | |||||||||||||
BridgeTex | $ | $ | $ | — | $ | — | ||||||||||
Double Eagle | $ | $ | — | $ | — | $ | — | |||||||||
MVP | $ | — | $ | $ | — | $ | — | |||||||||
Powder Springs | $ | — | $ | — | $ | — | $ | |||||||||
Saddlehorn | $ | — | $ | $ | — | $ | — | |||||||||
Seabrook | $ | — | $ | — | $ | $ | — | |||||||||
December 31, 2019 | ||||||||||||||||
Trade Accounts Receivable | Other Accounts Receivable | Other Accounts Payable | Long-Term Receivables | |||||||||||||
BridgeTex | $ | $ | $ | — | $ | — | ||||||||||
Double Eagle | $ | $ | — | $ | — | $ | — | |||||||||
HoustonLink | $ | $ | — | $ | — | $ | — | |||||||||
MVP | $ | — | $ | $ | — | $ | — | |||||||||
Powder Springs | $ | $ | — | $ | — | $ | ||||||||||
Saddlehorn | $ | — | $ | $ | — | $ | — | |||||||||
Seabrook | $ | $ | — | $ | $ | — | ||||||||||
We entered into a long-term terminalling and storage contract with Seabrook for exclusive use of dedicated tankage that provides our customers with crude oil storage capacity and dock access for crude oil imports and exports on the Texas Gulf Coast (see Note 10 – Leases for more details regarding this lease).
The financial results from MVP and Texas Frontera are included in our marine storage segment, the financial results from BridgeTex, Double Eagle, HoustonLink, Saddlehorn and Seabrook are included in our crude oil segment and the financial results from Powder Springs are included in our refined products segment, each as earnings of non-controlled entities.
84
MAGELLAN MIDSTREAM PARTNERS, L.P.
NOTES TO CONSOLIDATED FINANCIAL STATEMENTS—Continued
A summary of our investments in non-controlled entities (representing only our proportionate interests) follows (in thousands):
Investments at December 31, 2018 | $ | |||
Additional investment | ||||
Indemnification settlement | ( | ) | ||
Earnings of non-controlled entities: | ||||
Proportionate share of earnings | ||||
Amortization of excess investment and capitalized interest | ( | ) | ||
Earnings of non-controlled entities | ||||
Less: | ||||
Distributions from operations of non-controlled entities | ||||
Distributions from returns of investments in non-controlled entities | ||||
Investments at December 31, 2019 | $ | |||
Summarized financial information of our non-controlled entities (representing 100% of the interests in these entities) follows (in thousands):
December 31, | ||||||||
2018 | 2019 | |||||||
Current assets | $ | $ | ||||||
Noncurrent assets | ||||||||
Total assets | $ | $ | ||||||
Current liabilities | $ | $ | ||||||
Noncurrent liabilities | ||||||||
Total liabilities | $ | $ | ||||||
Equity | $ | $ | ||||||
Year Ended December 31, | ||||||||||||
2017 | 2018 | 2019 | ||||||||||
Revenue | $ | $ | $ | |||||||||
Net income | $ | $ | $ | |||||||||
7. | Inventory |
85
MAGELLAN MIDSTREAM PARTNERS, L.P.
NOTES TO CONSOLIDATED FINANCIAL STATEMENTS—Continued
Inventory at December 31, 2018 and 2019 was as follows (in thousands):
December 31, | ||||||||
2018 | 2019 | |||||||
Refined products | $ | $ | ||||||
Liquefied petroleum gases | ||||||||
Transmix | ||||||||
Crude oil | ||||||||
Additives | ||||||||
Total inventory | $ | $ | ||||||
During 2018 and 2019, we recorded lower of average cost or net realizable value adjustments of $18.5 million and $4.8 million, respectively, related to our refined products, transmix and crude oil inventories.
8. | Consolidated Statements of Cash Flows |
Changes in the components of operating assets and liabilities are as follows (in thousands):
Year Ended December 31, | ||||||||||||
2017 | 2018 | 2019 | ||||||||||
Trade accounts receivable and other accounts receivable | $ | ( | ) | $ | $ | ( | ) | |||||
Inventory | ( | ) | ( | ) | ||||||||
Accounts payable | ( | ) | ||||||||||
Accrued payroll and benefits | ||||||||||||
Accrued interest payable | ( | ) | ||||||||||
Accrued taxes other than income | ||||||||||||
Deferred revenue | ( | ) | ||||||||||
Accrued product liabilities | ( | ) | ||||||||||
Other current and noncurrent assets and liabilities | ( | ) | ||||||||||
Total | $ | $ | $ | |||||||||
86
MAGELLAN MIDSTREAM PARTNERS, L.P.
NOTES TO CONSOLIDATED FINANCIAL STATEMENTS—Continued
9. | Debt |
Long-term debt at December 31, 2018 and 2019 was as follows (in thousands):
December 31, | ||||||||
2018 | 2019 | |||||||
6.55% Notes due 2019(1) | $ | $ | ||||||
4.25% Notes due 2021 | ||||||||
3.20% Notes due 2025 | ||||||||
5.00% Notes due 2026 | ||||||||
6.40% Notes due 2037 | ||||||||
4.20% Notes due 2042 | ||||||||
5.15% Notes due 2043 | ||||||||
4.20% Notes due 2045 | ||||||||
4.25% Notes due 2046 | ||||||||
4.20% Notes due 2047 | ||||||||
4.85% Notes due 2049 | ||||||||
3.95% Notes due 2050 | ||||||||
Face value of long-term debt | ||||||||
Unamortized debt issuance costs(2) | ( | ) | ( | ) | ||||
Net unamortized debt discount(2) | ( | ) | ( | ) | ||||
Net unamortized amount of gains from historical fair value hedges(2) | ||||||||
Long-term debt, net, including current portion | ||||||||
Less: current portion of long-term debt, net(1) | ||||||||
Long-term debt, net | $ | $ | ||||||
(1) | At December 31, 2018, we had the ability and the intent to refinance approximately $ |
(2) | Debt issuance costs, note discounts and premiums and realized gains and losses of historical fair value hedges are being amortized or accreted to the applicable notes over the respective lives of those notes. |
At December 31, 2019, maturities of our debt were as follows: $0 in 2020; $550 million in 2021; $0 in 2022; $0 in 2023; $0 in 2024; and $4.2 billion thereafter.
2019 Debt Issuances
On August 19, 2019, we issued $500.0 million of 3.95 % senior notes due 2050 in an underwritten public
offering. The notes were issued at 99.91 % of par. Net proceeds from this offering were approximately $494.4 million after underwriting discounts and offering expenses. The net proceeds from this offering were used for general partnership purposes, including expansion capital projects.
87
MAGELLAN MIDSTREAM PARTNERS, L.P.
NOTES TO CONSOLIDATED FINANCIAL STATEMENTS—Continued
On January 18, 2019, we issued $500.0 million of 4.85 % senior notes due 2049 in an underwritten public
offering. The notes were issued at 99.371 % of par. Net proceeds from this offering were approximately $491.5 million after underwriting discounts and offering expenses. The net proceeds from this offering along with cash on hand were used to redeem our $550.0 million of 6.55 % senior notes due 2019 on February 11, 2019, prior to maturity. In connection with this offering, we recognized $8.3 million of debt prepayment costs that were recorded as interest expense in our consolidated statements of income.
Other Debt
Revolving Credit Facility. At December 31, 2019, the total borrowing capacity under our revolving credit facility maturing October 26, 2022 was $1.0 billion. Any borrowings outstanding under this facility are classified as long-term debt on our consolidated balance sheets. Borrowings under the facility are unsecured and bear interest at LIBOR plus a spread ranging from 1.000 % to 1.625 % based on our credit ratings. Additionally, an unused commitment fee is assessed at a rate from 0.100 % to 0.275 % depending on our credit ratings. The unused commitment fee was 0.125 % at December 31, 2019. Borrowings under this facility may be used for general purposes, including capital expenditures. As of December 31, 2018 and 2019, respectively, there were obligations for letters of credit of $6.8 million and $3.5 million, respectively. Amounts obligated for letters of credit are not reflected as debt on our consolidated balance sheets, but decrease our borrowing capacity under the facility. There were no borrowings outstanding under this facility at December 31, 2018 and 2019.
Our revolving credit facility requires us to maintain a specified ratio of consolidated debt to EBITDA (as defined in the credit agreement) of no greater than 5.0 to 1.0. In addition, the revolving credit facility and the indentures under which our senior notes were issued contain covenants that limit our ability to, among other things, incur indebtedness secured by certain liens or encumber our assets, engage in certain sale-leaseback transactions and consolidate, merge or dispose of all or substantially all of our assets. We were in compliance with these covenants as of and during the year ended December 31, 2019.
Commercial Paper Program. We have a commercial paper program under which we may issue commercial paper notes in an amount up to the available capacity under our $1.0 billion revolving credit facility. The maturities of the commercial paper notes vary, but may not exceed 397 days from the date of issuance. Because the commercial paper we can issue is limited to amounts available under our revolving credit facility, amounts outstanding under the program are classified as long-term debt. The commercial paper notes are sold under customary terms in the commercial paper market and are issued at a discount from par, or alternatively, are sold at par and bear varying interest rates on a fixed or floating basis. The weighted-average interest rate for commercial paper borrowings based on the number of days outstanding was 2.3 % and 2.6 %, respectively, for the year ended December 31, 2018 and 2019.
364-Day Revolving Credit Facility. In May 2019, we entered into a $500 million 364-day revolving credit facility. We did not make any borrowings under this agreement, which was terminated in January 2020.
During the years ending December 31, 2017, 2018 and 2019, total cash payments for interest on all indebtedness, excluding the impact of related interest rate swap agreements, were $206.2 million, $227.8 million and $217.1 million, respectively.
88
MAGELLAN MIDSTREAM PARTNERS, L.P.
NOTES TO CONSOLIDATED FINANCIAL STATEMENTS—Continued
10. | Leases |
As of January 1, 2019, we adopted ASU 2016-02, Leases (Topic 842) using the modified retrospective method of adoption. We elected to use the transition option that allows us to initially apply the new lease standard at the adoption date and recognize a cumulative-effect adjustment, if any, to the opening balance of retained earnings in the year of adoption. Comparable periods continue to be presented under the guidance of the previous standard, ASC 840. ASC 842 requires lessees to recognize a lease liability and right-of-use asset on the balance sheet for operating leases. For lessors, the new accounting model remains largely the same, although some changes have been made to align it with the new lessee model and the new revenue recognition guidance, ASC 606, Revenue from Contracts with Customers. Our adoption of ASC 842 did not result in any material adjustments to retained earnings, changes in the timing or amounts of lease costs or changes to our leverage ratio as defined in our credit agreement.
We have both lessee and lessor arrangements. Our leases are evaluated at inception or at any subsequent modification. Depending on the terms, leases are classified as either operating or finance leases if we are the lessee, or as operating, sales-type or direct financing leases if we are the lessor, as appropriate under ASC 842. Our lessee arrangements primarily include a terminalling and storage contract where we have exclusive use of dedicated tankage, leased pipelines and office buildings. Our lessor arrangements include pipeline capacity and storage contracts and our condensate splitter tolling agreement that qualify as operating leases under ASC 842. In addition, we have a long-term throughput and deficiency agreement with a customer that is being accounted for as a sales-type lease under ASC 842.
In accordance with ASC 842, we have made an accounting policy election to not apply the new standard to lessee arrangements with a term of one year or less and no purchase option that is reasonably certain of exercise. We will continue to account for these short-term arrangements by recognizing payments and expenses as incurred, without recording a lease liability and right-of-use asset.
We have also made an accounting policy election for both our lessee and lessor arrangements to combine lease and non-lease components. This election is applied to all of our lease arrangements as our non-lease components do not result in significant timing differences in the recognition of rental expenses or income.
Operating Leases – Lessee
We recognize a lease liability for each lease based on the present value of remaining minimum fixed rental payments (which includes payments under any renewal option that we are reasonably certain to exercise), using a discount rate that approximates the rate of interest we would have to pay to borrow on a collateralized basis over a similar term. We also recognize a right-of-use asset for each lease, valued at the lease liability, adjusted for prepaid or accrued rent balances existing at the time of initial recognition. The lease liability and right-of-use asset are reduced over the term of the lease as payments are made and the assets are used.
Related Party Operating Lease. We entered into a long-term terminalling and storage contract with Seabrook for exclusive use of dedicated tankage that provides our customers with crude oil storage capacity and dock access for crude oil imports and exports on the Texas Gulf Coast.
89
MAGELLAN MIDSTREAM PARTNERS, L.P.
NOTES TO CONSOLIDATED FINANCIAL STATEMENTS—Continued
Third Party Leases | Seabrook Lease | All Leases | |||||||||
2020 | $ | $ | $ | ||||||||
2021 | |||||||||||
2022 | |||||||||||
2023 | |||||||||||
2024 | |||||||||||
Thereafter | |||||||||||
Total future minimum rental payments | |||||||||||
Present value discount | $ | $ | |||||||||
Total operating lease liability | $ | $ | $ | ||||||||
The following tables provide further information about our operating leases (dollars in thousands):
Year Ended December 31, 2019 | ||||||||||||
Third Party Leases | Seabrook Lease | All Leases | ||||||||||
Fixed lease cost | $ | $ | $ | |||||||||
Short-term lease cost | ||||||||||||
Variable lease cost | ||||||||||||
Total lease cost | $ | $ | $ | |||||||||
As of and for the Year Ended December 31, 2019 | ||||||||||||
Third Party Leases | Seabrook Lease | All Leases | ||||||||||
Current lease liability | $ | $ | $ | |||||||||
Long-term lease liability | $ | $ | $ | |||||||||
Right-of-use asset | $ | $ | $ | |||||||||
Operating cash flows for operating leases | $ | $ | ||||||||||
Weighted average remaining lease term (years) | ||||||||||||
Weighted-average discount rate | ||||||||||||
Rent expense was $34.8 million and $42.1 million, respectively, for years ended December 31, 2017 and 2018 and was recognized in accordance with ASC 840.
Operating Leases – Lessor
We recognize fixed rental income on a straight-line basis over the life of the lease as revenue on our consolidated statements of income. Variable rental payments are recognized as revenue in the period in which the circumstances on which the variable lease payments are based occur.
90
MAGELLAN MIDSTREAM PARTNERS, L.P.
NOTES TO CONSOLIDATED FINANCIAL STATEMENTS—Continued
Future minimum payments receivable under operating leases with initial terms greater than one year as of December 31, 2019 are estimated as follows (in thousands):
2020 | $ | ||
2021 | |||
2022 | |||
2023 | |||
2024 | |||
Thereafter | |||
Total | $ | ||
We recognized variable lease revenue of $24.9 million, $51.8 million and $58.4 million, respectively, for the years ended December 31, 2017, 2018 and 2019, primarily related to our condensate splitter.
At December 31, 2019, property, plant and equipment utilized by our customers in operating lease arrangements consisted of: $231.2 million of processing equipment; $77.4 million of storage tanks; $49.8 million of pipeline and station equipment; and $32.1 million of other assets. The processing equipment primarily relates to our condensate splitter.
Sales-Type Lease – Lessor
We entered into a long-term throughput and deficiency agreement with a customer on a pipeline and related assets that we constructed in Texas and New Mexico, which contains minimum volume/payment commitments. Our customer has the option to purchase this pipeline and related assets at the end of the lease term for a nominal amount. This agreement was previously accounted for as a direct-financing lease under ASC 840 and is now being accounted for s a sales-type lease under ASC 842. The net investment under this arrangement as of December 31, 2018 and 2019 was as follows (in thousands):
December 31, 2018 | December 31, 2019 | |||||||
Total minimum lease payments receivable | $ | $ | ||||||
Less: Unearned income | ||||||||
Recorded net investment in direct financing lease | $ | $ | ||||||
The net investment in direct financing leases was classified in the consolidated balance sheets as follows (in millions):
December 31, 2018 | December 31, 2019 | |||||||
Other accounts receivable | $ | $ | ||||||
Long-term receivables | ||||||||
Total | $ | $ | ||||||
91
MAGELLAN MIDSTREAM PARTNERS, L.P.
NOTES TO CONSOLIDATED FINANCIAL STATEMENTS—Continued
11. | Employee Benefit Plans |
Our pension and postretirement benefit liabilities represent the funded status of the present value of benefit obligations of our employee benefit plans. We develop pension, postretirement medical and life benefit costs from third-party actuarial valuations. We establish actuarial assumptions to anticipate future events and use those assumptions when calculating the expense and liabilities related to these plans. These factors include assumptions management makes concerning expected investment return on plan assets, discount rates, health care costs trend rates, turnover rates and rates of future compensation increases, among others. In addition, we use subjective factors such as withdrawal and mortality rates to develop actuarial valuations. Management reviews and updates these assumptions on an annual basis. The actuarial assumptions that we use may differ from actual results due to changing market rates or other factors. These differences could affect the amount of pension and postretirement medical and life benefit expense we will recognize in future periods.
Defined Contribution Plan. We sponsor a defined contribution plan in which we match our employees’ qualifying contributions, resulting in additional expense to us. Expenses related to the defined contribution plan were $9.9 million, $11.0 million and $11.4 million in 2017, 2018 and 2019, respectively.
Defined Benefit Plans. We sponsor two union pension plans that cover certain union employees (“USW plan” and “IUOE plan,” collectively, the “Union plans”), a pension plan for all non-union employees (“Salaried plan”) and a postretirement benefit plan for certain employees. The annual measurement date of these plans is December 31.
The following table presents the changes in benefit obligations and plan assets for pension benefits and other postretirement benefits, as well as the end-of-period accumulated benefit obligation for the years ended December 31, 2018 and 2019 (in thousands):
Pension Benefits | Other Postretirement Benefits | |||||||||||||||
2018 | 2019 | 2018 | 2019 | |||||||||||||
Change in benefit obligations: | ||||||||||||||||
Benefit obligations at beginning of year | $ | $ | $ | $ | ||||||||||||
Service cost | ||||||||||||||||
Interest cost | ||||||||||||||||
Plan participants’ contributions | ||||||||||||||||
Actuarial (gain) loss | ( | ) | ( | ) | ||||||||||||
Benefits paid | ( | ) | ( | ) | ( | ) | ( | ) | ||||||||
Settlement payments | ( | ) | ( | ) | ||||||||||||
Benefit obligations at end of year | ||||||||||||||||
Change in plan assets: | ||||||||||||||||
Fair value of plan assets at beginning of year | ||||||||||||||||
Employer contributions | ||||||||||||||||
Plan participants’ contributions | ||||||||||||||||
Actual (loss) return on plan assets | ( | ) | ||||||||||||||
Benefits paid | ( | ) | ( | ) | ( | ) | ( | ) | ||||||||
Settlement payments | ( | ) | ( | ) | ||||||||||||
Fair value of plan assets at end of year | ||||||||||||||||
Funded status at end of year | $ | ( | ) | $ | ( | ) | $ | ( | ) | $ | ( | ) | ||||
Accumulated benefit obligations | $ | $ | ||||||||||||||
92
MAGELLAN MIDSTREAM PARTNERS, L.P.
NOTES TO CONSOLIDATED FINANCIAL STATEMENTS—Continued
The pension benefit obligations experienced an actuarial loss of $54.2 million in 2019 primarily due to the impact of decreases in the discount rates used to calculate the benefit obligations, partially offset by changes in salary assumptions and higher asset returns.
Amounts recognized in the consolidated balance sheets included in these financial statements were as follows (in thousands):
Pension Benefits | Other Postretirement Benefits | |||||||||||||||
2018 | 2019 | 2018 | 2019 | |||||||||||||
Amounts recognized in consolidated balance sheets: | ||||||||||||||||
Current accrued benefit cost | $ | $ | $ | $ | ||||||||||||
Long-term pension and benefits | ||||||||||||||||
Accumulated other comprehensive loss: | ||||||||||||||||
Net actuarial loss | ( | ) | ( | ) | ( | ) | ( | ) | ||||||||
Prior service credit | ||||||||||||||||
( | ) | ( | ) | ( | ) | ( | ) | |||||||||
Net amount of liabilities and accumulated other comprehensive loss recognized in consolidated balance sheets | $ | $ | $ | $ | ||||||||||||
Net periodic benefit expense for the years ended December 31, 2017, 2018 and 2019 was as follows (in thousands):
Pension Benefits | Other Postretirement Benefits | |||||||||||||||||||||||
2017 | 2018 | 2019 | 2017 | 2018 | 2019 | |||||||||||||||||||
Components of net periodic pension and postretirement benefit expense: | ||||||||||||||||||||||||
Service cost | $ | $ | $ | $ | $ | $ | ||||||||||||||||||
Interest cost | ||||||||||||||||||||||||
Expected return on plan assets | ( | ) | ( | ) | ( | ) | ||||||||||||||||||
Amortization of prior service credit | ( | ) | ( | ) | ( | ) | ||||||||||||||||||
Amortization of actuarial loss | ||||||||||||||||||||||||
Settlement cost | ||||||||||||||||||||||||
Net periodic expense | $ | $ | $ | $ | $ | $ | ||||||||||||||||||
The service component of our net periodic benefit expense (credit) is presented in operating expense and G&A expense, and the non-service components are presented in other (income) expense in our consolidated statements of income.
Net periodic benefit expense for the year ended December 31, 2018 includes corrections of $19.4 million resulting from an error in our third-party actuary’s valuation of our pension liabilities and net periodic pension expense. In addition, long-term pension and benefits increased $22.2 million and accumulated other comprehensive loss increased $2.8 million in our 2018 consolidated balance sheets as a result of this valuation error.
93
MAGELLAN MIDSTREAM PARTNERS, L.P.
NOTES TO CONSOLIDATED FINANCIAL STATEMENTS—Continued
Changes in plan assets and benefit obligations recognized in other comprehensive income (loss) during 2017, 2018 and 2019 were as follows (in thousands):
Pension Benefits | Other Postretirement Benefits | |||||||||||||||||||||||
2017 | 2018 | 2019 | 2017 | 2018 | 2019 | |||||||||||||||||||
Beginning balance | $ | ( | ) | $ | ( | ) | $ | ( | ) | $ | ( | ) | $ | ( | ) | $ | ( | ) | ||||||
Net actuarial gain (loss) | ( | ) | ( | ) | ( | ) | ( | ) | ||||||||||||||||
Amortization of prior service credit | ( | ) | ( | ) | ( | ) | ||||||||||||||||||
Amortization of actuarial loss | ||||||||||||||||||||||||
Settlement cost | ||||||||||||||||||||||||
Amount recognized in other comprehensive loss | ( | ) | ( | ) | ( | ) | ||||||||||||||||||
Ending balance | $ | ( | ) | $ | ( | ) | $ | ( | ) | $ | ( | ) | $ | ( | ) | $ | ( | ) | ||||||
Actuarial gains and losses are amortized over the average future service period of the current active plan participants expected to receive benefits. The corridor approach is used to determine when actuarial gains and losses are to be amortized and is equal to 10% of the greater of the projected benefit obligation or the market related value of plan assets. The amount of gain or loss in excess of the calculated corridor is subject to amortization. The estimated net actuarial loss and prior service credit for the defined benefit pension plans that will be amortized from AOCL into net periodic benefit cost in 2020 are $5.7 million and $0.2 million, respectively. The estimated net actuarial loss for the other defined benefit postretirement plan that will be amortized from AOCL into net periodic benefit cost in 2020 is $0.5 million.
The weighted-average rate assumptions used to determine projected benefit obligations were as follows:
December 31, | ||||
2018 | 2019 | |||
Discount rate—Salaried plan | ||||
Discount rate—USW plan | ||||
Discount rate—IUOE plan | ||||
Discount rate—Other Postretirement Benefits | ||||
Rate of compensation increase—Salaried plan | ||||
Rate of compensation increase—USW plan | ||||
Rate of compensation increase—IUOE plan | ||||
94
MAGELLAN MIDSTREAM PARTNERS, L.P.
NOTES TO CONSOLIDATED FINANCIAL STATEMENTS—Continued
The weighted-average rate assumptions used to determine net pension and other postretirement benefit plans expense were as follows:
For the Year Ended December 31, | ||||||
2017 | 2018 | 2019 | ||||
Discount rate—Salaried plan | ||||||
Discount rate—USW plan | ||||||
Discount rate—IUOE plan | ||||||
Discount rate—Other Postretirement Benefits | ||||||
Rate of compensation increase—Salaried plan | 4% - 11% | |||||
Rate of compensation increase—USW plan | ||||||
Rate of compensation increase—IUOE plan | ||||||
Expected rate of return on plan assets—Salaried plan | ||||||
Expected rate of return on plan assets—USW plan | ||||||
Expected rate of return on plan assets—IUOE plan | ||||||
The non-pension postretirement benefit plans provide for retiree contributions and contain other cost-sharing features such as deductibles and coinsurance. The accounting for these plans anticipates future cost sharing that is consistent with management’s expressed intent to increase the retiree contribution rate generally in line with health care cost increases.
The annual assumed rate of increase in the health care cost trend rate for 2020 is 6.0 % decreasing systematically to 5.08 % by 2027 for pre-65 year old participants. As of December 31, 2019, a 1.0% change in assumed health care cost trend rates would be immaterial.
The fair values of the pension plan assets at December 31, 2018 were as follows (in thousands):
Asset Category | Total | Quoted Prices in Active Markets for Identical Assets (Level 1) | Significant Observable Inputs (Level 2) | Significant Unobservable Inputs (Level 3) | ||||||||||||
Domestic Equity Securities(1): | ||||||||||||||||
Small-cap fund | $ | $ | $ | — | $ | — | ||||||||||
Mid-cap fund | — | — | ||||||||||||||
Large-cap fund | — | — | ||||||||||||||
International equity fund | — | — | ||||||||||||||
Fixed Income Securities(1): | ||||||||||||||||
Short-term bond fund | — | — | ||||||||||||||
Intermediate-term bond fund | — | — | ||||||||||||||
Long-term investment grade bond funds | — | — | ||||||||||||||
Other: | ||||||||||||||||
Short-term investment fund | — | — | ||||||||||||||
Group annuity contract | — | — | ||||||||||||||
Fair value of plan assets | $ | $ | $ | — | $ | |||||||||||
(1) We hold equity and fixed income securities through investments in mutual funds, which are dedicated to each category as indicated.
95
MAGELLAN MIDSTREAM PARTNERS, L.P.
NOTES TO CONSOLIDATED FINANCIAL STATEMENTS—Continued
The fair values of the pension plan assets at December 31, 2019 were as follows (in thousands):
Asset Category | Total | Quoted Prices in Active Markets for Identical Assets (Level 1) | Significant Observable Inputs (Level 2) | Significant Unobservable Inputs (Level 3) | ||||||||||||
Domestic Equity Securities(1): | ||||||||||||||||
Small-cap fund | $ | $ | $ | — | $ | — | ||||||||||
Mid-cap fund | — | — | ||||||||||||||
Large-cap fund | — | — | ||||||||||||||
International equity fund | — | — | ||||||||||||||
Fixed Income Securities(1): | ||||||||||||||||
Short-term bond fund | — | — | ||||||||||||||
Intermediate-term bond fund | — | — | ||||||||||||||
Long-term investment grade bond funds | — | — | ||||||||||||||
Other: | ||||||||||||||||
Short-term investment fund | — | — | ||||||||||||||
Group annuity contract | — | — | ||||||||||||||
Fair value of plan assets | $ | $ | $ | — | $ | |||||||||||
(1) We hold equity and fixed income securities through investments in mutual funds, which are dedicated to each category as indicated.
As reflected in the tables above, Level 3 activity was not material.
The investment strategies for the various funds held as pension plan assets by asset category are as follows:
Asset Category | Fund’s Investment Strategy | |
Domestic Equity Securities: | ||
Fixed Income Securities: | ||
Other: | ||
96
MAGELLAN MIDSTREAM PARTNERS, L.P.
NOTES TO CONSOLIDATED FINANCIAL STATEMENTS—Continued
The expected long-term rate of return on plan assets was determined by combining a review of projected returns, historical returns of portfolios with assets similar to the current portfolios of the union and non-union pension plans and target weightings of each asset classification. Our investment objective for the assets within the pension plans is to earn a return that meets or exceeds the growth of obligations that result from interest and changes in the discount rate, while avoiding excessive risk. Defined diversification goals are set in order to reduce the risk of wide swings in the market value from year to year, or of incurring large losses that may result from concentrated positions. As a result, our plan assets have no significant concentrations of credit risk. Additionally, liquidity risks are minimized because all of the funds that the plans have invested in are publicly traded. We evaluate risks based on the potential impact to the predictability of contribution requirements, probability of under-funding, expected risk-adjusted returns and investment return volatility. Funds are invested with multiple investment managers. Our liabilities are calculated using rates defined by the Pension Protection Act of 2006. Approximately 70 % of the plans’ investments are allocated to fixed-income securities and invested to match the durations of the plans’ short, intermediate and long-term pension liabilities, with the amount invested in each duration reflecting that duration’s proportion of the plans’ liabilities. The remaining approximately 30 % of the plans’ investments are allocated to equity securities.
The target allocation and actual weighted-average asset allocation percentages at December 31, 2018 and 2019 were as follows:
2018 | 2019 | |||||||
Actual | Target | Actual | Target | |||||
Equity securities | ||||||||
Fixed income securities | ||||||||
Other | ||||||||
As of December 31, 2019, the benefit amounts expected to be paid from plan assets through December 31, 2029 were as follows (in thousands):
Pension Benefits | Other Postretirement Benefits | |||||||
2020 | $ | $ | ||||||
2021 | $ | $ | ||||||
2022 | $ | $ | ||||||
2023 | $ | $ | ||||||
2024 | $ | $ | ||||||
2025 through 2029 | $ | $ | ||||||
Contributions estimated to be paid by us into the plans in 2020 are $31.3 million and $1.2 million for the pension and other postretirement benefit plans, respectively.
97
MAGELLAN MIDSTREAM PARTNERS, L.P.
NOTES TO CONSOLIDATED FINANCIAL STATEMENTS—Continued
12. |
The compensation committee of our general partner’s board of directors administers our long-term incentive plan (“LTIP”) covering certain of our employees and the independent directors of our general partner. The LTIP primarily consists of phantom units and permits the grant of awards covering an aggregate of 11.9 million of our common units. The estimated units remaining available under the LTIP at December 31, 2019 totaled approximately 1.6 million. The awards include: (i) performance-based awards issued to certain officers and other key employees (“performance-based awards”), (ii) time-based awards issued to certain officers and other key employees (“time-based awards,” and together with performance-based awards, “employee awards”), and (iii) awards issued to independent members of our general partner’s board of directors (“director awards”) that may be deferred and if deferred may be paid in cash. All of the awards include distribution equivalent rights, except non-deferred director awards.
The LTIP requires employee awards to be settled in our common units, except the settlement of distribution equivalents, which we pay in cash. As a result, we classify employee awards as equity. Fair value for these awards is determined on the grant date, and we recognize this value as compensation expense ratably over the requisite service period, which is the vesting period of each award. The vesting period for employee awards is generally three years ; however, certain awards have been issued with shorter vesting periods while others have vesting periods of up to four years . Because employee awards contain distribution equivalent rights, the fair value of our employee awards is based on the closing price of our units on the grant date.
Payouts for performance-based awards are subject to the attainment of a financial metric and to an adjustment for our total unitholder return (the “TUR adjustment”), and the fair value of these awards is adjusted for the fair value of the TUR adjustment. The financial metric for the performance-based awards is our distributable cash flow per unit excluding commodity-related activities for the last year of the three-year vesting period as compared to established threshold, target and stretch levels. The payouts for the performance-related component of the awards can range from 0 % for results below threshold, up to 200 % for actual results at stretch or above. The TUR adjustment is based on our total unitholder return at the end of the three-year vesting period of the awards in relation to the total unitholder returns of certain peer entities and can increase or decrease the payout of the award by as much as 50 %. Payouts related to time-based awards are based solely on the completion of the requisite service period by the employee and contain no provisions that provide for a payout other than the original number of units awarded and the associated distribution equivalents.
Performance-based awards are subject to forfeiture if a participant’s employment is terminated for any reason other than for termination within two years of a change-in-control that occurs on an involuntary basis without cause or on a voluntary basis for good cause, or due to retirement, disability or death prior to the vesting date. These awards can vest early under certain circumstances following a change in control. Time-based awards are subject to forfeiture if a participant’s employment is terminated for any reason other than retirement, death or disability prior to the vesting date, or as the result of certain other employment restrictions. If an employee award recipient retires, dies or becomes disabled prior to the end of the vesting period, the award is prorated based upon months of employment completed during the vesting period, and the award is settled shortly after the end of the vesting period.
Compensation expense for our equity awards is calculated as the number of unit awards less forfeitures, multiplied by the grant date fair value of those awards, multiplied by the percentage of the requisite service period completed at each period end, multiplied by the expected payout percentage, less previously-recognized compensation expense.
Non-deferred director awards are paid in units valued on the grant date, with compensation expense calculated as the number of units awarded multiplied by the fair value of those units at that date. We classify deferred director awards as liability awards because they may be settled in cash. Because deferred director awards have distribution
98
MAGELLAN MIDSTREAM PARTNERS, L.P.
NOTES TO CONSOLIDATED FINANCIAL STATEMENTS—Continued
equivalent rights, the fair value of these awards equals the closing price of our units at the measurement date. Compensation expense for deferred director awards is calculated as the number of units awarded, multiplied by the fair value of those awards on the measurement date, less previously-recognized compensation expense. Director awards deferred prior to 2015 are paid in January of the year following the director’s resignation from the board of directors of our general partner or death. Director awards deferred after January 1, 2015 are paid 60 days following the director’s death or resignation from the board of directors of our general partner.
The following table includes the changes during the current fiscal year in the number of non-vested units that have been granted by the compensation committee. The amounts below do not include adjustments for above-target or below-target performance.
Performance-Based Awards | Time-Based Awards | Total Awards | |||||||||||||||||||
Number of Unit Awards | Weighted-Average Fair Value | Number of Unit Awards | Weighted-Average Fair Value | Number of Unit Awards | Weighted-Average Fair Value | ||||||||||||||||
Non-vested units - 1/1/2019 | $ | $ | $ | ||||||||||||||||||
Units granted during 2019 | $ | $ | $ | ||||||||||||||||||
Units vested during 2019 | ( | ) | $ | ( | ) | $ | ( | ) | $ | ||||||||||||
Units forfeited during 2019 | ( | ) | $ | ( | ) | $ | ( | ) | $ | ||||||||||||
Non-vested units - 12/31/19 | $ | $ | $ | ||||||||||||||||||
The table below summarizes the total non-vested unit awards outstanding adjusted for estimated amounts of above-target financial performance to determine the total number of unit awards included in our total equity-based liability accrual.
Grant Date | Non-Vested Unit Awards | Adjustment to Unit Awards in Anticipation of Achieving Above- Target Financial Results | Total Unit Award Accrual | Vesting Date | Unrecognized Compensation Expense(a) (in millions) | |||||||||||
Performance-Based Awards: | ||||||||||||||||
2018 Awards | 12/31/2020 | $ | ||||||||||||||
2019 Awards | 12/31/2021 | |||||||||||||||
Time-Based Awards: | ||||||||||||||||
2020 Vesting Date | 12/31/2020 | |||||||||||||||
2021 Vesting Date | 12/31/2021 | |||||||||||||||
2022 Vesting Date | 12/31/2022 | |||||||||||||||
Total | $ | |||||||||||||||
(a) Unrecognized compensation expense will be recognized over the remaining vesting period of the awards.
99
MAGELLAN MIDSTREAM PARTNERS, L.P.
NOTES TO CONSOLIDATED FINANCIAL STATEMENTS—Continued
Weighted-Average Fair Value
The weighted-average fair value of awards granted during 2017, 2018 and 2019 was as follows:
Performance-Based Awards | Time-Based Awards | |||||||||||||
Number of Unit Awards | Weighted-Average Fair Value | Number of Unit Awards | Weighted-Average Fair Value | |||||||||||
Units granted during 2017 | $ | $ | ||||||||||||
Units granted during 2018 | $ | $ | ||||||||||||
Units granted during 2019 | $ | $ | ||||||||||||
Vested Unit Awards
The table below sets forth the numbers and values of units that vested in each of the three years ended December 31, 2019. The vested common units include adjustments for above-target financial and market performance.
Vesting Date | Vested Common Units | Fair Value of Unit Awards on Vesting Date (in millions) | Intrinsic Value of Unit Awards on Vesting Date (in millions) | |||
12/31/2017 | $ | $ | ||||
12/31/2018 | $ | $ | ||||
12/31/2019 | $ | $ | ||||
Cash Flow Effects of LTIP Settlements
The difference between the common units issued to the participants and the total number of unit awards vested primarily represents the tax withholdings associated with the award settlement, which we pay in cash.
Settlement Date | Number of Common Units Issued, Net of Tax Withholdings | Tax Withholdings and Other Cash Payments (in millions) | Employer Taxes (in millions) | Total Cash Payments (in millions) | ||||
January 2017 | $ | $ | $ | |||||
January 2018 | $ | $ | $ | |||||
January 2019 | $ | $ | $ | |||||
100
MAGELLAN MIDSTREAM PARTNERS, L.P.
NOTES TO CONSOLIDATED FINANCIAL STATEMENTS—Continued
Compensation Expense Summary
Equity-based incentive compensation expense for 2017, 2018 and 2019, primarily recorded as G&A expense on our consolidated statements of income, was as follows (in thousands):
Year Ended December 31, | ||||||||||||
2017 | 2018 | 2019 | ||||||||||
Performance awards | $ | $ | $ | |||||||||
Time-based awards | ||||||||||||
Total | $ | $ | $ | |||||||||
13. | Derivative Financial Instruments |
We use derivative instruments to manage market price risks associated with inventories, interest rates and certain forecasted transactions. For those instruments that qualify for hedge accounting, the accounting treatment depends on their intended use and their designation. We divide derivative financial instruments qualifying for hedge accounting treatment into two categories: (1) cash flow hedges and (2) fair value hedges. We execute cash flow hedges to hedge against the variability in cash flows related to a forecasted transaction and execute fair value hedges to hedge against the changes in the value of a recognized asset or liability. At the inception of a hedged transaction, we document the relationship between the hedging instrument and the hedged item, the risk management objectives and the methods used for assessing and testing hedge effectiveness. We also assess, both at the inception of the hedge and on an on-going basis, whether the derivatives that are used in our hedging transactions are highly effective in offsetting changes in cash flows or fair value of the hedged item. If we determine that a derivative originally designated as a cash flow or fair value hedge is no longer highly effective, we discontinue hedge accounting prospectively and record the change in the fair value of the derivative in current earnings. The changes in fair value of derivative financial instruments that are not designated as hedges for accounting purposes, which we refer to as economic hedges, are included in current earnings.
As part of our risk management process, we assess the creditworthiness of the financial and other institutions with which we execute financial derivatives. Such financial instruments involve the risk of non-performance by the counterparty, which could result in material losses to us.
Our policies prohibit us from engaging in speculative trading activities.
Interest Rate Derivatives
We periodically enter into interest rate derivatives to hedge the fair value of debt or hedge against variability in
interest rates. For interest rate cash flow hedges, we record the unrealized gains or losses as an adjustment to other comprehensive income. The realized gains and losses from our cash flow hedges are recognized into earnings as an adjustment to our periodic interest expense over the life of the related debt issuance. For fair value hedges on long-term debt, we record the unrealized gains or losses as an adjustment to long-term debt, and realized amounts as an adjustment to our periodic interest expense. Adjustments resulting from discontinued hedges continue to be recognized in accordance with their historic hedging relationships.
In 2019, upon issuance of our $500.0 million of 3.95 % notes due 2050, we terminated and settled treasury lock agreements we had previously entered into to protect against the variability of interest payments on this anticipated debt issuance for a loss of $25.3 million, which was included in our statements of cash flows as a net payment on financial derivatives. These agreements were accounted for as cash flow hedges. The loss was recorded to other
101
MAGELLAN MIDSTREAM PARTNERS, L.P.
NOTES TO CONSOLIDATED FINANCIAL STATEMENTS—Continued
comprehensive income (loss) and will be recognized into earnings as an adjustment to our periodic interest expense over the life of the associated notes.
In 2019, upon issuance of $500.0 million of 4.85 % notes due 2049, we terminated and settled treasury lock agreements that we had previously entered into to protect against the variability of interest payments on this anticipated debt issuance for a loss of $8.0 million, which was included in our statements of cash flows as a net payment on financial derivatives. These agreements were accounted for as cash flow hedges. The loss was recorded to other comprehensive income (loss) and will be recognized into earnings as an adjustment to our periodic interest expense over the life of the associated notes.
During 2018, we terminated and settled $200.0 million of interest rate derivative agreements with cumulative gains of $24.6 million. These agreements were previously entered into to protect against the risk of variability of interest payments on debt we issued in 2019. These agreements were accounted for as cash flow hedges. The gains were recorded to other comprehensive income (loss) and will be recognized into earnings as an adjustment to our periodic interest expense over the life of the associated notes. These gains were also reported as a net receipt on financial derivatives in the financing activities of our consolidated statements of cash flows in 2018.
Commodity Derivatives
Our gas liquids blending activities produce gasoline, and we can reasonably estimate the timing and quantities of sales of these products. We use a combination of exchange-based commodities futures contracts and forward purchase and sale contracts to help manage commodity price changes and mitigate the risk of decline in the product margin realized from our gas liquids blending activities. Further, certain of our other commercial operations generate petroleum products, and we also use futures contracts to hedge against price changes for some of these commodities.
Forward physical purchase and sale contracts that qualify for and are elected as normal purchases and sales are accounted for using traditional accrual accounting, whereby changes in the mark-to-market values of such contracts are not recognized in income, rather the revenues and expenses associated with such transactions are recognized during the period when commodities are physically delivered or received. Physical forward commodity contracts subject to this exception are evaluated for the probability of future delivery and are periodically tested once the forecasted period has passed to determine whether similar forward contracts are probable of physical delivery in the future.
We record the effective portion of the gains or losses for commodity-based contracts designated as fair value hedges as adjustments to the assets being hedged and the ineffective portions as well as amounts excluded from the assessment of hedge effectiveness as adjustments to other income or expense. We recognize the change in fair value of economic hedges that hedge against changes in the price of petroleum products that we expect to sell or purchase in the future currently in earnings as adjustments to product sales revenue, cost of product sales, or operating expenses, as applicable.
Our open futures contracts at December 31, 2019 were as follows:
Type of Contract/Accounting Methodology | Product Represented by the Contract and Associated Barrels | Maturity Dates | ||
Futures - Economic Hedges | 3.2 million barrels of refined products and crude oil | Between January and May 2020 | ||
Futures - Economic Hedges | 0.7 million barrels of gas liquids | Between January and April 2020 | ||
102
MAGELLAN MIDSTREAM PARTNERS, L.P.
NOTES TO CONSOLIDATED FINANCIAL STATEMENTS—Continued
Commodity Derivatives Contracts and Deposits Offsets
At December 31, 2019, we had made margin deposits of $27.4 million for our futures contracts with our counterparties, which were recorded as current assets under commodity derivatives deposits on our consolidated balance sheets. At December 31, 2018, we held margin deposits of $37.3 million for our futures contracts with our counterparties, which were recorded as a current liabilities under commodity derivatives deposits on our consolidated balance sheets. We have the right to offset the combined fair values of our open futures contracts against our margin deposits under a master netting arrangement for each counterparty; however, we have elected to present the combined fair values of our open futures contracts separately from the related margin deposits on our consolidated balance sheets. Additionally, we have the right to offset the fair values of our futures contracts together for each counterparty, which we have elected to do, and we report the combined net balances on our consolidated balance sheets. A schedule of the derivative amounts we have offset and the deposit amounts we could offset under a master netting arrangement are provided below as of December 31, 2018 and 2019 (in thousands):
Gross Amounts of Recognized Assets (Liabilities) | Gross Amounts of Assets (Liabilities) Offset in the Consolidated Balance Sheets | Net Amounts of Assets (Liabilities) Presented in the Consolidated Balance Sheets | Margin Deposit Amounts Not Offset in the Consolidated Balance Sheets | Net Asset Amount(1) | ||||||||||||||||
As of December 31, 2018 | $ | $ | ( | ) | $ | $ | ( | ) | $ | |||||||||||
As of December 31, 2019 | $ | ( | ) | $ | $ | ( | ) | $ | $ | |||||||||||
(1) Amount represents the maximum loss we would incur if all of our counterparties failed to perform on their derivative contracts.
Basis Derivative Agreement
During 2019, we entered into a basis derivative agreement with a joint venture co-owner’s affiliate, and, contemporaneously, that affiliate entered into an intrastate transportation services agreement with the joint venture. Settlements under the basis derivative agreement are determined based on the basis differential of crude oil prices at different market locations and a notional volume of 30,000 barrels per day. As a result, we account for this agreement as a derivative. The agreement will expire in early 2022. We recognize the changes in fair value of this agreement based on forward price curves for crude oil in West Texas and the Houston Gulf Coast in other operating income (expense) in our consolidated statements of income. The liability for this agreement at December 31, 2019 was $17.3 million.
Impact of Derivatives on Our Financial Statements
Comprehensive Income
The changes in derivative activity included in AOCL for the years ended December 31, 2017, 2018 and 2019 were as follows (in thousands):
Year Ended December 31, | ||||||||||||
Derivative Gains (Losses) Included in AOCL | 2017 | 2018 | 2019 | |||||||||
Beginning balance | $ | ( | ) | $ | ( | ) | $ | ( | ) | |||
Net gain (loss) on interest rate contract cash flow hedges | ( | ) | ( | ) | ||||||||
Reclassification of net loss on cash flow hedges to income | ||||||||||||
Ending balance | $ | ( | ) | $ | ( | ) | $ | ( | ) | |||
103
MAGELLAN MIDSTREAM PARTNERS, L.P.
NOTES TO CONSOLIDATED FINANCIAL STATEMENTS—Continued
The following is a summary of the effect on our consolidated statements of income for the years ended December 31, 2017, 2018 and 2019 of derivatives that were designated as cash flow hedges (in thousands):
Interest Rate Contracts | |||||||||||||||
Amount of Gain (Loss) Recognized in AOCL on Derivatives | Location of Loss Reclassified from AOCL into Income | Amount of Loss Reclassified from AOCL into Income | |||||||||||||
Year Ended December 31, 2017 | $ | ( | ) | Interest expense | $ | ( | ) | ||||||||
Year Ended December 31, 2018 | $ | Interest expense | $ | ( | ) | ||||||||||
Year Ended December 31, 2019 | $ | ( | ) | Interest expense | $ | ( | ) | ||||||||
As of December 31, 2019, the net loss estimated to be classified to interest expense over the next twelve months from AOCL is approximately $3.2 million. This amount relates to the amortization of losses on interest rate contracts over the life of the related debt instruments.
The following table provides a summary of the effect on our consolidated statements of income for the years ended December 31, 2017, 2018 and 2019 of derivatives that were not designated as hedging instruments (in thousands):
Amount of Gain (Loss) Recognized on Derivative | ||||||||||||||
Year Ended December 31, | ||||||||||||||
Derivative Instrument | Location of Gain (Loss) Recognized on Derivatives | 2017 | 2018 | 2019 | ||||||||||
Futures contracts | Product sales revenue | $ | ( | ) | $ | $ | ( | ) | ||||||
Futures contracts | Cost of product sales | ( | ) | ( | ) | |||||||||
Futures contracts | Operating expenses | |||||||||||||
Basis derivative agreement | Other operating income (expense) | ( | ) | |||||||||||
Total | $ | ( | ) | $ | $ | ( | ) | |||||||
The impact of the derivatives in the above table was reflected as cash from operations on our consolidated statements of cash flows.
Balance Sheets
The following table provides a summary of the fair value of derivatives, which are presented on a net basis in our consolidated balance sheets, that were designated as hedging instruments as of December 31, 2018 (in thousands). There were no derivatives designated as hedging instruments as of December 31, 2019.
December 31, 2018 | ||||||||||||
Asset Derivatives | Liability Derivatives | |||||||||||
Derivative Instrument | Balance Sheet Location | Fair Value | Balance Sheet Location | Fair Value | ||||||||
Futures contracts | Commodity derivatives contracts, net | $ | Commodity derivatives contracts, net | $ | ||||||||
Interest rate contracts | Other noncurrent assets | Other noncurrent liabilities | ||||||||||
Total | $ | Total | $ | |||||||||
104
MAGELLAN MIDSTREAM PARTNERS, L.P.
NOTES TO CONSOLIDATED FINANCIAL STATEMENTS—Continued
The following tables provide a summary of the fair value of derivatives, which are presented on a net basis in our consolidated balance sheets, that were not designated as hedging instruments as of December 31, 2018 and 2019 (in thousands):
December 31, 2018 | ||||||||||||
Asset Derivatives | Liability Derivatives | |||||||||||
Derivative Instrument | Balance Sheet Location | Fair Value | Balance Sheet Location | Fair Value | ||||||||
Futures contracts | Commodity derivatives contracts, net | $ | Commodity derivatives contracts, net | $ | ||||||||
December 31, 2019 | ||||||||||||
Asset Derivatives | Liability Derivatives | |||||||||||
Derivative Instrument | Balance Sheet Location | Fair Value | Balance Sheet Location | Fair Value | ||||||||
Futures contracts | Commodity derivatives contracts, net | $ | Commodity derivatives contracts, net | $ | ||||||||
Basis derivative agreement | Other current assets | Other current liabilities | ||||||||||
Basis derivative agreement | Other noncurrent assets | Other noncurrent liabilities | ||||||||||
Total | $ | Total | $ | |||||||||
14. | Fair Value Disclosures |
Fair Value Methods and Assumptions - Financial Assets and Liabilities
The following methods and assumptions were used in estimating fair value for our financial assets and liabilities:
• | Commodity derivatives contracts. These include exchange-traded futures contracts related to petroleum products. These contracts are carried at fair value on our consolidated balance sheets and are valued based on quoted prices in active markets. See Note 13 – Derivative Financial Instruments for further disclosures regarding these contracts. |
• | Interest rate contracts. These include forward-starting interest rate swap agreements to hedge against the risk of variability of interest payments on future debt. These contracts are carried at fair value on our consolidated balance sheets and are valued based on an assumed exchange, at the end of each period, in an orderly transaction with a participant in the market in which the financial instrument is traded. The exchange value was calculated using present value techniques on estimated future cash flows based on forward interest rate curves. See Note 13 – Derivative Financial Instruments for further disclosures regarding these contracts. |
• | Basis Derivative Agreement. During 2019, we entered into a basis derivative agreement with a joint venture co-owner’s affiliate, and, contemporaneously, that affiliate entered into an intrastate transportation services agreement with the joint venture. Settlements under the basis derivative agreement are determined based on the basis differential of crude oil prices at different market locations and a notional volume of |
105
MAGELLAN MIDSTREAM PARTNERS, L.P.
NOTES TO CONSOLIDATED FINANCIAL STATEMENTS—Continued
• | Long-term receivables. These primarily include payments receivable under a sales-type leasing arrangement and cost reimbursement payments receivable. These receivables were recorded at fair value on our consolidated balance sheets, using then-current market rates to estimate the present value of future cash flows. |
• | Guarantees. At December 31, 2018, these guarantees primarily included an indemnification agreement we entered into in connection with the partial sale of our interest in BridgeTex. This indemnification was recorded at fair value on our consolidated balance sheets upon initial recognition, using probability-weighted potential outcome scenarios to estimate our possible liability for specific events covered by this indemnification. In first quarter 2019, certain litigation subject to the indemnification agreement was settled, which resulted in our paying $ |
• | Debt. The fair value of our publicly traded notes was based on the prices of those notes at December 31, 2018 and 2019; however, where recent observable market trades were not available, prices were determined using adjustments to the last traded value for that debt issuance or by adjustments to the prices of similar debt instruments of peer entities that are actively traded. The carrying amount of borrowings, if any, under our revolving credit facility and our commercial paper program approximates fair value due to the frequent repricing of these obligations. |
Fair Value Measurements - Financial Assets and Liabilities
The following tables summarize the carrying amounts, fair values and fair value measurements recorded or disclosed as of December 31, 2018 and 2019, based on the three levels established by ASC 820; Fair Value Measurements and Disclosures (in thousands):
Fair Value Measurements as of December 31, 2018 using: | ||||||||||||||||||||
Assets (Liabilities) | Carrying Amount | Fair Value | Quoted Prices in Active Markets for Identical Assets (Level 1) | Significant Other Observable Inputs (Level 2) | Significant Unobservable Inputs (Level 3) | |||||||||||||||
Commodity derivatives contracts | $ | $ | $ | $ | $ | |||||||||||||||
Interest rate contracts | $ | ( | ) | $ | ( | ) | $ | $ | ( | ) | $ | |||||||||
Long-term receivables | $ | $ | $ | $ | $ | |||||||||||||||
Guarantees | $ | ( | ) | $ | ( | ) | $ | $ | $ | ( | ) | |||||||||
Debt | $ | ( | ) | $ | ( | ) | $ | $ | ( | ) | $ | |||||||||
106
MAGELLAN MIDSTREAM PARTNERS, L.P.
NOTES TO CONSOLIDATED FINANCIAL STATEMENTS—Continued
Fair Value Measurements as of December 31, 2019 using: | ||||||||||||||||||||
Assets (Liabilities) | Carrying Amount | Fair Value | Quoted Prices in Active Markets for Identical Assets (Level 1) | Significant Other Observable Inputs (Level 2) | Significant Unobservable Inputs (Level 3) | |||||||||||||||
Commodity derivatives contracts | $ | ( | ) | $ | ( | ) | $ | ( | ) | $ | $ | |||||||||
Basis derivative agreement | $ | ( | ) | $ | ( | ) | $ | $ | ( | ) | $ | |||||||||
Long-term receivables | $ | $ | $ | $ | $ | |||||||||||||||
Guarantees | $ | ( | ) | $ | ( | ) | $ | $ | $ | ( | ) | |||||||||
Debt | $ | ( | ) | $ | ( | ) | $ | $ | ( | ) | $ | |||||||||
15. | Commitments and Contingencies |
Certain conditions may exist as of the date our consolidated financial statements are issued that could result in a loss to us, but which will only be resolved when one or more future events occur or fail to occur. Our management assesses such contingent liabilities, which inherently involves significant judgment. In assessing loss contingencies related to legal proceedings that are pending against us or for unasserted claims that may result in proceedings, our management, with input from legal counsel, evaluates the perceived merits of any legal proceedings or unasserted claims as well as the perceived merits of the amount of relief sought or expected to be sought therein.
Environmental expenditures are charged to operating expense or capitalized based on the nature of the expenditures. Environmental expenditures that meet the capitalization criteria for property, plant and equipment, as well as costs that mitigate or prevent environmental contamination that has yet to occur, are capitalized. We expense expenditures that relate to an existing condition caused by past operations. We initially record environmental liabilities assumed in a business combination at fair value; otherwise, we record environmental liabilities on an undiscounted basis. We recognize liabilities for other commitments and contingencies when, after analyzing the available information, we determine it is probable that an asset has been impaired, or that a liability has been incurred and the amount of impairment or loss can be reasonably estimated. When we can estimate a range of probable loss, we accrue the most likely amount within that range, or if no amount is more likely than another, we accrue the minimum of the range of probable loss. We expense legal costs associated with loss contingencies as incurred.
We record environmental liabilities independently of any potential claim for recovery. Accruals related to environmental matters are generally determined based on site-specific plans for remediation, taking into account currently available facts, existing technologies and presently enacted laws and regulations. Accruals for environmental matters reflect our prior remediation experience and include an estimate for costs such as fees paid to contractors, outside engineering and consulting firms. Accruals for estimated losses from environmental remediation obligations generally are recognized no later than completion of the remediation feasibility study. Such accruals are adjusted as further information develops or circumstances change.
We maintain specific insurance coverage, which may cover all or portions of certain environmental expenditures less a deductible. We recognize receivables in cases where we consider the realization of reimbursements of remediation costs as probable. We would sustain losses to the extent of amounts we have recognized as environmental receivables if the counterparties to those transactions were unable to perform their obligations to us.
107
MAGELLAN MIDSTREAM PARTNERS, L.P.
NOTES TO CONSOLIDATED FINANCIAL STATEMENTS—Continued
Butane Blending Patent Infringement Proceeding
On October 4, 2017, Sunoco Partners Marketing & Terminals L.P. (“Sunoco”) brought an action for patent infringement in the U.S. District Court for the District of Delaware alleging Magellan Midstream Partners, L.P. (“Magellan”) and Powder Springs Logistics, LLC (“Powder Springs”) have infringed patents relating to butane blending at the Powder Springs facility located in Powder Springs, Georgia. Sunoco has since submitted pleadings alleging that Magellan has also infringed various patents relating to butane blending at nine Magellan facilities, in addition to Powder Springs. Sunoco is seeking monetary damages, attorneys’ fees and a permanent injunction enjoining Magellan and Powder Springs from infringing the subject patents. We deny and are vigorously defending against all claims asserted by Sunoco. Although it is not possible to predict the ultimate outcome, we believe the ultimate resolution of this matter will not have a material adverse impact on our results of operations, financial position or cash flows.
Environmental Liabilities
Liabilities recognized for estimated environmental costs were $20.5 million and $14.9 million at December 31, 2018 and December 31, 2019, respectively. We have classified environmental liabilities as other current or noncurrent based on management’s estimates regarding the timing of actual payments. Environmental expenses recognized as a result of changes in our environmental liabilities are included in operating expenses on our consolidated statements of income. Environmental expenses were $9.0 million, $15.0 million and $4.4 million for the years ended December 31, 2017, 2018 and 2019, respectively.
Environmental Receivables
Receivables from insurance carriers and other third parties related to environmental matters at December 31, 2018 were $4.1 million, of which $2.4 million and $1.7 million were recorded to other accounts receivable and long-term receivables, respectively, on our consolidated balance sheets. Receivables from insurance carriers related to environmental matters at December 31, 2019 were $2.9 million, of which $1.8 million and $1.1 million were recorded to other accounts receivable and long-term receivables, respectively, on our consolidated balance sheets. Amounts received from insurance carriers and other third parties related to environmental matters during 2017, 2018 and 2019 were $0.7 million, $3.1 million and $1.4 million, respectively.
Other
We have entered into an agreement to guarantee our 50 % pro rata share, up to $25.0 million, of obligations under Powder Springs’ credit facility. As of December 31, 2019, our consolidated balance sheets reflected a $0.4 million other current liability and a corresponding increase in our investment in non-controlled entities on our consolidated balance sheets to reflect the fair value of this guarantee.
We and the non-controlled entities in which we own an interest are a party to various other claims, legal actions and complaints, including without limitation those disclosed in Item 3. Legal Proceedings of Part I of this annual report on Form 10-K. While the results cannot be predicted with certainty, management believes the ultimate resolution of these claims, legal actions and complaints after consideration of amounts accrued, insurance coverage or other indemnification arrangements will not have a material adverse effect on our results of operations, financial position or cash flows.
108
MAGELLAN MIDSTREAM PARTNERS, L.P.
NOTES TO CONSOLIDATED FINANCIAL STATEMENTS—Continued
16. | Major Customers and Concentration of Risks |
Major Customers. No customer accounted for more than 10 % of our consolidated revenues during 2017, 2018 or 2019.
Concentration of Risks. We transport, store and distribute petroleum products for refiners, producers, marketers, traders and end users of those products. Our revenue producing activities are concentrated in the central U.S. Concentrations of customers may affect our overall credit risk as our customers may be similarly affected by changes in economic, regulatory or other factors. We generally secure transportation and storage revenue with warehouseman’s liens. We periodically evaluate the financial condition and creditworthiness of our customers and require additional security as we deem necessary.
As of December 31, 2019, we had 1,884 employees, 878 of which were assigned to our refined products segment and concentrated in the central U.S., with approximately 26 % of these employees represented by the United Steel Workers and covered by a collective bargaining agreement that expires in January 2022. At December 31, 2019, 224 of our employees were assigned to our crude oil segment and were concentrated in the central U.S., and none of these employees were covered by a collective bargaining agreement. There were 210 employees assigned to our marine storage segment at December 31, 2019, primarily in the Gulf and East Coast regions of the U.S., with approximately 14 % of these employees represented by the International Union of Operating Engineers (“IUOE”) and covered by a collective bargaining agreement that expires in October 2020. All of the IUOE employees are located at the New Haven terminal, which we have agreed to sell and expect to close as soon as first quarter of 2020.
17. | Related Party Transactions |
Stacy P. Methvin is an independent member of our general partner’s board of directors and is also a director of one of our customers. We received tariff, terminalling and other ancillary revenue from this customer of $16.6 million, $21.7 million and $29.6 million for the periods ending December 31, 2017, 2018 and 2019, respectively. We recorded a receivable of $1.9 million and $3.8 million from this customer at December 31, 2018 and 2019, respectively. We also made a one-time payment of $0.2 million in 2019 to a subsidiary of this customer for an easement related to one of our expansion projects.
109
MAGELLAN MIDSTREAM PARTNERS, L.P.
NOTES TO CONSOLIDATED FINANCIAL STATEMENTS—Continued
18.Partners’ Capital and Distributions
Partners’ Capital
The following table details the changes in the number of our common units outstanding from January 1, 2017 through December 31, 2019:
Common units outstanding on January 1, 2017 | |
January 2017—Settlement of employee LTIP awards | |
During 2017—Other(a) | |
Common units outstanding on December 31, 2017 | |
January 2018—Settlement of employee LTIP awards | |
During 2018—Other(a) | |
Common units outstanding on December 31, 2018 | |
February 2019—Settlement of employee LTIP awards | |
During 2019—Other(a) | |
Common units outstanding on December 31, 2019 | |
(a) |
Our partnership agreement allows us to issue additional partnership securities for any partnership purpose at any time and from time to time for consideration and on terms and conditions as our general partner determines, all without approval by our unitholders.
Common unitholders have the following rights, among others:
• | right to receive distributions of our available cash within |
• | right to elect the board members of our general partner; |
• | right to remove Magellan GP, LLC as our general partner upon a |
• | right to transfer common unit ownership to substitute common unitholders; |
• | right to receive an annual report, containing audited financial statements and a report on those financial statements by our independent public accountants, within |
• | right to receive information reasonably required for tax reporting purposes within |
• | right to vote according to the unitholder’s percentage interest in us at any meeting that may be called by our general partner; and |
• | right to inspect our books and records at the unitholder’s own expense. |
In the event of liquidation, we would distribute all property and cash in excess of that required to discharge all liabilities to the unitholders in proportion to the positive balances in their respective capital accounts. The common unitholders’ liability is generally limited to their investment.
110
MAGELLAN MIDSTREAM PARTNERS, L.P.
NOTES TO CONSOLIDATED FINANCIAL STATEMENTS—Continued
Distributions
Distributions we paid during 2017, 2018 and 2019 were as follows (in thousands, except per unit amount):
Payment Date | Per Unit Cash Distribution Amount | Total Cash Distribution | ||||||
2/14/2017 | $ | $ | ||||||
5/15/2017 | ||||||||
8/14/2017 | ||||||||
11/14/2017 | ||||||||
Total | $ | $ | ||||||
2/14/2018 | $ | $ | ||||||
5/15/2018 | ||||||||
8/14/2018 | ||||||||
11/14/2018 | ||||||||
Total | $ | $ | ||||||
2/14/2019 | $ | $ | ||||||
5/15/2019 | ||||||||
8/14/2019 | ||||||||
11/14/2019 | ||||||||
Total | $ | $ | ||||||
19. Subsequent Events
Recognizable events
No recognizable events have occurred subsequent to December 31, 2019.
Non-recognizable events
On January 21, 2020, we announced an agreement to sell three marine terminals to Buckeye Partners, L.P. for $250 million. The terminals are located in New Haven, Connecticut, Wilmington, Delaware and Marrero, Louisiana. The sales price approximates the net book value of our investment in these terminals, and the impact of this transaction is not expected to be material to our 2020 financial statements.
Also on January 21, 2020, we announced that our general partner’s board of directors authorized the repurchase of up to $750 million of common units through 2022. We intend to purchase our common units from time-to-time through a variety of methods, including open market purchases and negotiated transactions, all in compliance with the rules of the Securities and Exchange Commission and other applicable legal requirements.
111
Quarterly Financial Data (unaudited)
Summarized quarterly financial data is as follows (in thousands, except per unit amounts):
2018 | First Quarter | Second Quarter | Third Quarter | Fourth Quarter | ||||||||||||
Revenue | $ | 678,779 | $ | 644,091 | $ | 638,020 | $ | 865,683 | ||||||||
Total costs and expenses | $ | 441,323 | $ | 420,433 | $ | 396,242 | $ | 555,111 | ||||||||
Operating margin | $ | 370,429 | $ | 373,077 | $ | 399,190 | $ | 511,245 | ||||||||
Net income | $ | 210,910 | $ | 214,409 | $ | 594,534 | $ | 314,072 | ||||||||
Basic net income per common unit | $ | 0.92 | $ | 0.94 | $ | 2.60 | $ | 1.38 | ||||||||
Diluted net income per common unit | $ | 0.92 | $ | 0.94 | $ | 2.60 | $ | 1.37 | ||||||||
2019 | ||||||||||||||||
Revenue | $ | 628,935 | $ | 701,699 | $ | 656,596 | $ | 740,682 | ||||||||
Total costs and expenses | $ | 422,985 | $ | 436,718 | $ | 385,927 | $ | 450,514 | ||||||||
Operating margin | $ | 352,012 | $ | 415,655 | $ | 428,262 | $ | 450,559 | ||||||||
Net income | $ | 207,663 | $ | 253,703 | $ | 273,038 | $ | 286,445 | ||||||||
Basic net income per common unit | $ | 0.91 | $ | 1.11 | $ | 1.19 | $ | 1.25 | ||||||||
Diluted net income per common unit | $ | 0.91 | $ | 1.11 | $ | 1.19 | $ | 1.25 | ||||||||
In fourth quarter 2018, we made the decision to discontinue commercial operations of our ammonia pipeline due to the system’s low profitability and challenging economic outlook. As a result, we recognized a $49.1 million impairment charge, which impacted total costs and expenses and net income on our consolidated statements of income.
In third quarter 2018, we sold a 20% interest in BridgeTex to an affiliate of OMERS Infrastructure Management Inc., which reduced our ongoing ownership in BridgeTex to a 30% interest. We received $575.6 million in cash from the sale and recognized a gain of $353.8 million that impacted net income on our consolidated statements of income.
112
Item 9. | Changes in and Disagreements with Accountants on Accounting and Financial Disclosure |
None.
Item 9A. | Controls and Procedures |
Evaluation of Disclosure Controls and Procedures
We performed an evaluation of the effectiveness of the design and operation of our “disclosure controls and procedures” (as defined in Rules 13a-15(e) and 15d-15(e) under the Securities Exchange Act of 1934, as amended (the “Exchange Act”)) as of the end of the period covered by this report. We performed this evaluation under the supervision and with the participation of our management, including our general partner’s Chief Executive Officer (“CEO”) and Chief Financial Officer (“CFO”). Based upon that evaluation, our general partner’s CEO and CFO concluded that, as of the end of the period covered by this report, our disclosure controls and procedures were effective to provide reasonable assurance that information required to be disclosed in the reports that we file or submit under the Exchange Act is recorded, processed, summarized and reported within the time periods specified in the Securities and Exchange Commission’s rules and forms. Our disclosure controls and procedures include controls and procedures designed so that information required to be disclosed in reports filed or submitted under the Exchange Act is accumulated and communicated to management, including the CEO and the CFO, as appropriate, to allow timely decisions regarding required disclosure. There has been no change in our internal control over financial reporting that occurred during the quarter ended December 31, 2019 that has materially affected, or is reasonably likely to materially affect, our internal control over financial reporting.
Management’s Report on Internal Control Over Financial Reporting
See “Management’s Annual Report on Internal Control Over Financial Reporting” set forth in Item 8. Financial Statements and Supplementary Data.
Item 9B. | Other Information |
None.
113
PART III
Item 10. | Directors, Executive Officers and Corporate Governance |
The information regarding the directors and executive officers of our general partner and our corporate governance required by Items 401, 405, 406 and 407(c)(3), (d)(4) and (d)(5) of Regulation S-K will be presented in our definitive proxy statement to be filed pursuant to Regulation 14A (our “Proxy Statement”) under the following captions, which information is to be incorporated by reference herein:
• | Director Election Proposal; |
• | Executive Officers of our General Partner; |
• | Section 16(a) Beneficial Ownership Reporting Compliance; |
• | Code of Ethics; |
• | Corporate Governance – Director Nominations; and |
• | Corporate Governance – Board Committees. |
Item 11. | Executive Compensation |
The information regarding executive compensation required by Items 402 and 407(e)(4) and (e)(5) of Regulation S-K will be presented in our Proxy Statement under the following captions, which information is to be incorporated by reference herein:
• | Compensation of Directors and Executive Officers; |
• | Corporate Governance – Compensation Committee – Interlocks and Insider Participation; and |
• | Compensation of Directors and Executive Officers – Compensation Committee Report. |
Item 12. | Security Ownership of Certain Beneficial Owners and Management and Related Stockholder Matters |
The information regarding securities authorized for issuance under equity compensation plans and security ownership required by Items 201(d) and 403 of Regulation S-K will be presented in our Proxy Statement under the following captions, which information is to be incorporated by reference herein:
• | Securities Authorized for Issuance Under Equity Compensation Plans; and |
• | Security Ownership of Certain Beneficial Owners and Management. |
Item 13. | Certain Relationships and Related Transactions, and Director Independence |
The information regarding certain relationships and related transactions and director independence required by Items 404 and 407(a) of Regulation S-K will be presented in our Proxy Statement under the following captions, which information is to be incorporated by reference herein:
• | Transactions with Related Persons, Promoters and Certain Control Persons; and |
• | Corporate Governance – Director Independence. |
Item 14. | Principal Accountant Fees and Services |
The information regarding principal accountant fees and services required by Item 9(e) of Schedule 14A of the Exchange Act will be presented in our Proxy Statement under the caption “Independent Auditor Proposal,” which information is to be incorporated by reference herein.
114
PART IV
Item 15. Exhibits and Financial Statement Schedules
(a)1 and (a)2.
Page | ||
Covered by reports of independent auditors: | ||
Not covered by reports of independent auditors: | ||
We have omitted all other required schedules since the required information is not present or is not present in amounts sufficient to require submission of the schedule, or because the information required is included in the financial statements and notes thereto.
(a)3, (b) and (c). The exhibits listed below on the Index to Exhibits are filed or incorporated by reference as part of this annual report.
115
Index to Exhibits
Exhibit No. | Description | |
Exhibit 3 | ||
*(a) | ||
*(b) | ||
*(c) | ||
*(d) | ||
*(e) | ||
*(f) | ||
*(g) | ||
*(h) | ||
Exhibit 4 | ||
*(a) | ||
*(b) | ||
*(c) | ||
*(d) | ||
*(e) | ||
*(f) | ||
*(g) | ||
*(h) | ||
*(i) | ||
*(j) | ||
*(k) | ||
*(l) | ||
*(m) | ||
*(n) | ||
(o) | ||
Exhibit 10 | ||
*(a) | ||
(b) | ||
116
Exhibit No. | Description | |
(c) | ||
*(d) | ||
*(e) | ||
*(f) | ||
*(g) | ||
*(h) | ||
(i) | ||
(j) | ||
*(k) | ||
*(l) | ||
Exhibit 14 | ||
*(a) | ||
(b) | ||
Exhibit 21 | ||
Exhibit 23 | ||
Exhibit 31 | ||
(a) | ||
(b) | ||
Exhibit 32 | ||
(a) | ||
(b) | ||
Exhibit 101.INS | XBRL Instance Document - the instance document does not appear in the Interactive Data File because its XBRL tags are embedded within the Inline XBRL document. | |
Exhibit 101.SCH | XBRL Taxonomy Extension Schema. | |
Exhibit 101.CAL | XBRL Taxonomy Extension Calculation Linkbase. | |
Exhibit 101.DEF | XBRL Taxonomy Extension Definition Linkbase. | |
Exhibit 101.LAB | XBRL Taxonomy Extension Label Linkbase. | |
Exhibit 101.PRE | XBRL Taxonomy Extension Presentation Linkbase. | |
* | Each such exhibit has heretofore been filed with the Securities and Exchange Commission as part of the filing indicated and is incorporated herein by reference. |
117
SIGNATURES
Pursuant to the requirements of Section 13 or 15(d) of the Securities Exchange Act of 1934, the registrant has duly caused this report to be signed on its behalf by the undersigned, thereunto duly authorized.
MAGELLAN MIDSTREAM PARTNERS, L.P. (Registrant) | ||
By: | MAGELLAN GP, LLC, its general partner | |
By: | /s/ JEFF HOLMAN | |
Jeff Holman Senior Vice President, Chief Financial Officer and Treasurer | ||
Date: February 18, 2020
Pursuant to the requirements of the Securities Exchange Act of 1934, this report has been signed below by the following persons on behalf of the registrant and in the capacity and on the dates indicated.
118
Signature | Title | Date | ||
/s/ MICHAEL N. MEARS | Chairman of the Board and Principal Executive Officer of Magellan GP, LLC, General Partner of Magellan Midstream Partners, L.P. | February 18, 2020 | ||
Michael N. Mears | ||||
/s/ JEFF HOLMAN | Principal Financial and Accounting Officer of Magellan GP, LLC, General Partner of Magellan Midstream Partners, L.P. | February 18, 2020 | ||
Jeff Holman | ||||
/s/ WALTER R. ARNHEIM | Director of Magellan GP, LLC, General Partner of Magellan Midstream Partners, L.P. | February 18, 2020 | ||
Walter R. Arnheim | ||||
/s/ ROBERT G. CROYLE | Director of Magellan GP, LLC, General Partner of Magellan Midstream Partners, L.P. | February 18, 2020 | ||
Robert G. Croyle | ||||
/s/ LORI A. GOBILLOT | Director of Magellan GP, LLC, General Partner of Magellan Midstream Partners, L.P. | February 18, 2020 | ||
Lori A. Gobillot | ||||
/s/ EDWARD J. GUAY | Director of Magellan GP, LLC, General Partner of Magellan Midstream Partners, L.P. | February 18, 2020 | ||
Edward J. Guay | ||||
/s/ CHANSOO JOUNG | Director of Magellan GP, LLC, General Partner of Magellan Midstream Partners, L.P. | February 18, 2020 | ||
Chansoo Joung | ||||
/s/ STACY P. METHVIN | Director of Magellan GP, LLC, General Partner of Magellan Midstream Partners, L.P. | February 18, 2020 | ||
Stacy P. Methvin | ||||
/s/ JAMES R. MONTAGUE | Director of Magellan GP, LLC, General Partner of Magellan Midstream Partners, L.P. | February 18, 2020 | ||
James R. Montague | ||||
/s/ BARRY R. PEARL | Director of Magellan GP, LLC, General Partner of Magellan Midstream Partners, L.P. | February 18, 2020 | ||
Barry R. Pearl | ||||
119