| Label |
Element |
Value |
| Risk/Return: |
rr_RiskReturnAbstract |
|
|
| Registrant Name |
dei_EntityRegistrantName |
COLUMBIA FUNDS SERIES TRUST |
|
| Prospectus Date |
rr_ProspectusDate |
Sep.
01,
2013 |
|
|
Columbia California Intermediate Municipal Bond Fund
|
|
|
|
| Risk/Return: |
rr_RiskReturnAbstract |
|
|
| Risk/Return [Heading] |
rr_RiskReturnHeading |
Summary of the Fund |
|
| Objective [Heading] |
rr_ObjectiveHeading |
Investment Objective |
|
| Objective, Primary [Text Block] |
rr_ObjectivePrimaryTextBlock |
Columbia California Intermediate Municipal Bond Fund (the Fund) seeks current income exempt from U.S. federal income tax and California individual income tax, consistent with moderate fluctuation of principal. |
|
| Expense [Heading] |
rr_ExpenseHeading |
Fees and Expenses of the Fund |
|
| Expense Narrative [Text Block] |
rr_ExpenseNarrativeTextBlock |
This table describes the fees and expenses that you may pay if you buy and hold shares of the Fund. You may qualify for sales charge discounts if you and members of your immediate family invest, or agree to invest in the future, at least $50,000 in certain classes of shares of eligible funds distributed by Columbia Management Investment Distributors, Inc. More information about these and other discounts is available from your financial intermediary, in the Choosing a Share Class section beginning on page 18 of the Fund’s prospectus and in Appendix S to the Statement of Additional Information (SAI) under Sales Charge Waivers beginning on page S-1. |
|
| Shareholder Fees Caption [Text] |
rr_ShareholderFeesCaption |
Shareholder Fees (fees paid directly from your investment) |
|
| Operating Expenses Caption [Text] |
rr_OperatingExpensesCaption |
Annual Fund Operating Expenses (expenses that you pay each year as a percentage of the value of your investment) |
|
| Fee Waiver or Reimbursement over Assets, Date of Termination |
rr_FeeWaiverOrReimbursementOverAssetsDateOfTermination |
August 31, 2014 |
|
| Portfolio Turnover [Heading] |
rr_PortfolioTurnoverHeading |
Portfolio Turnover |
|
| Portfolio Turnover [Text Block] |
rr_PortfolioTurnoverTextBlock |
The Fund may pay transaction costs, such as commissions, when it buys and sells securities (or “turns over” its portfolio). A higher portfolio turnover rate may indicate higher transaction costs and may result in higher taxes when Fund shares are held in a taxable account. These costs, which are not reflected in annual fund operating expenses or in the example, affect the Fund’s performance. During the most recent fiscal year, the Fund’s portfolio turnover rate was 8% of the average value of its portfolio. |
|
| Portfolio Turnover, Rate |
rr_PortfolioTurnoverRate |
8.00% |
|
| Expense Breakpoint Discounts [Text] |
rr_ExpenseBreakpointDiscounts |
You may qualify for sales charge discounts if you and members of your immediate family invest, or agree to invest in the future, at least $50,000 in certain classes of shares of eligible funds distributed by Columbia Management Investment Distributors, Inc. More information about these and other discounts is available from your financial intermediary, in the Choosing a Share Class section beginning on page 18 of the Fund’s prospectus and in Appendix S to the Statement of Additional Information (SAI) under Sales Charge Waivers beginning on page S-1. |
|
| Expense Breakpoint, Minimum Investment Required [Amount] |
rr_ExpenseBreakpointMinimumInvestmentRequiredAmount |
$ 50,000 |
|
| Other Expenses, New Fund, Based on Estimates [Text] |
rr_OtherExpensesNewFundBasedOnEstimates |
other expenses for Class R4 and Class R5 are based on estimated amounts for the Fund's current fiscal year. |
|
| Expenses Restated to Reflect Current [Text] |
rr_ExpensesRestatedToReflectCurrent |
Other expenses for Class A, Class B, Class C and Class Z have been restated to reflect contractual changes to certain fees paid by the Fund |
|
| Expense Example [Heading] |
rr_ExpenseExampleHeading |
Example |
|
| Expense Example Narrative [Text Block] |
rr_ExpenseExampleNarrativeTextBlock |
The following example is intended to help you compare the cost of investing in the Fund with the cost of investing in other mutual funds. The example illustrates the hypothetical expenses that you would incur over the time periods indicated, and assumes that:- you invest $10,000 in the applicable class of Fund shares for the periods indicated,
- your investment has a 5% return each year, and
- the Fund’s total annual operating expenses remain the same as shown in the Annual Fund Operating Expenses table above.
Since the waivers and/or reimbursements shown in the Annual Fund Operating Expenses table above expire as indicated in the preceding table, they are only reflected in the 1 year example and the first year of the other examples. Although your actual costs may be higher or lower, based on the assumptions listed above, your costs would be: |
|
| Strategy [Heading] |
rr_StrategyHeading |
Principal Investment Strategies |
|
| Strategy Narrative [Text Block] |
rr_StrategyNarrativeTextBlock |
Under normal circumstances, the Fund invests at least 80% of its net assets (including the amount of any borrowings for investment purposes) in securities that pay interest exempt from U.S. federal income tax (but not necessarily the federal alternative minimum tax) and California individual income tax. These securities are issued by or on behalf of the State of California and its political subdivisions, agencies, authorities and instrumentalities, by other qualified issuers and by funds that invest in such securities. Qualified issuers include issuers located in U.S. territories Guam, Puerto Rico and the U.S. Virgin Islands. The Fund may invest up to 20% of its net assets in securities that pay interest subject to taxation.
The Fund normally invests at least 80% of its total assets in municipal securities that, at the time of purchase, are rated investment grade or are unrated but determined to be of comparable quality. The Fund may invest up to 10% of its total assets in securities that, at the time of purchase, are rated below investment grade or are unrated but determined to be of comparable quality (commonly referred to as “high yield securities” or “ junk bonds”).
While the Fund may invest in securities of any maturity, under normal circumstances, the Fund’s dollar-weighted average maturity will be between three and ten years. |
|
| Risk [Heading] |
rr_RiskHeading |
Principal Risks |
|
| Risk Narrative [Text Block] |
rr_RiskNarrativeTextBlock |
An investment in the Fund involves risk, including those described below. There is no assurance that the Fund will achieve its investment objective and you may lose money. The value of the Fund’s holdings may decline, and the Fund’s net asset value (NAV) and Fund share price may go down.
Active Management Risk. Due to its active management, the Fund could underperform its benchmark index and/or other funds with similar investment objectives. The Fund may fail to achieve its investment objective and you may lose money.
Changing Distribution Level Risk. The amount of the distributions paid by the Fund will vary and generally depends on the amount of interest income and/or dividends received by the Fund on the securities it holds. The Fund may not be able to pay distributions or may have to reduce its distribution level if the interest income and/or dividends the Fund receives from its investments decline.
Counterparty Risk. Counterparty risk is the risk that a counterparty to a financial instrument held by the Fund or by a special purpose or structured vehicle invested in by the Fund may become insolvent or otherwise fail to perform its obligations, and the Fund may obtain no or limited recovery of its investment, and any recovery may be significantly delayed.
Credit Risk. Credit risk is the risk that the issuer of a fixed-income security may or will default or otherwise become unable or unwilling, or is perceived to be unable or unwilling, to honor a financial obligation, such as making payments to the Fund when due. If the Fund purchases unrated securities, or if the rating of a security is lowered after purchase, the Fund will depend on analysis of credit risk more heavily than usual. Unrated securities held by the Fund may present increased credit risk as compared to higher-rated securities.
Geographic Concentration Risk/State Risk. Because the Fund invests substantially in municipal securities issued by the state identified in the Fund’s name and political sub-divisions of that state, the Fund will be particularly affected by adverse tax, legislative, regulatory, demographic or political changes as well as changes impacting the state's financial, economic or other condition and prospects. In addition, because of the relatively small number of issuers of tax-exempt securities in the state, the Fund may invest a higher percentage of assets in a single issuer and, therefore, be more exposed to the risk of loss than a fund that invests more broadly. The value of municipal and other securities owned by the Fund also may be adversely affected by future changes in federal or state income tax laws.
Interest Rate Risk. Interest rate risk is the risk of losses attributable to changes in interest rates. In general, if prevailing interest rates rise, the values of debt securities will tend to fall, and if interest rates fall, the values of debt securities will tend to rise. Changes in the value of a debt security usually will not affect the amount of income the Fund receives from it but may affect the value of the Fund's shares. In general, the longer the maturity or duration of a debt security, the greater its sensitivity to changes in interest rates. Interest rate declines also may increase prepayments of debt obligations, which, in turn, would increase prepayment risk. As interest rates rise or spreads widen, the likelihood of prepayment decreases.
Issuer Risk. An issuer in which the Fund invests may perform poorly, and the value of its securities may therefore decline, which would negatively affect the Fund’s performance. Poor performance may be caused by poor management decisions, competitive pressures, breakthroughs in technology, reliance on suppliers, labor problems or shortages, corporate restructurings, fraudulent disclosures, natural disasters or other events, conditions or factors.
Liquidity Risk. Liquidity risk is the risk associated with a lack of marketability of investments which may make it difficult to sell the investment at a desirable time or price. The Fund may have to lower the selling price of its investment, sell other investments, or forego another, more appealing investment opportunity. Judgment plays a larger role in valuing these investments as compared to valuing more liquid investments.
Low and Below Investment Grade (High-Yield) Securities Risk. Securities with the lowest investment grade rating, securities rated below investment grade (commonly called “high-yield” or “junk” bonds) and unrated securities of comparable quality expose the Fund to a greater risk of loss of principal and income than a fund that invests solely or primarily in investment grade securities. In addition, these investments have greater price fluctuations, are less liquid and are more likely to experience a default than higher-rated securities. High-yield securities are considered to be predominantly speculative with respect to the issuer’s capacity to pay interest and repay principal.
Market Risk. Market risk refers to the possibility that the market values of securities or other investments that the Fund holds will fall, sometimes rapidly or unpredictably, or fail to rise. An investment in the Fund could lose money over short or even long periods.
Municipal Securities Risk. Municipal securities may be fully or partially backed by the taxing authority of the local government, by the credit of a private issuer, by the current or anticipated revenues from a specific project or specific assets or by domestic or foreign entities providing credit support, such as letters of credit, guarantees or insurance, and are generally classified into general obligation bonds and special revenue obligations. General obligation bonds are backed by an issuer's taxing authority and may be vulnerable to limits on a government's power or ability to raise revenue or increase taxes. They may also depend for payment on legislative appropriation and/or funding or other support from other governmental bodies. Revenue obligations are payable from revenues generated by a particular project or other revenue source, and are typically subject to greater risk of default than general obligation bonds because investors can look only to the revenue generated by the project or other revenue source backing the project, rather than to the general taxing authority of the state or local government issuer of the obligations. Because many municipal securities are issued to finance projects in sectors such as education, health care, transportation and utilities, conditions in those sectors can affect the overall municipal market. Municipal securities generally pay interest that, in the opinion of bond counsel, is free from U.S. federal income tax (and, in some cases, the federal alternative minimum tax). There is no assurance that the Internal Revenue Service (IRS) will agree with this opinion or that U.S. federal income tax law will not change.
Prepayment and Extension Risk. Prepayment and extension risk is the risk that a loan, bond or other security or investment might be called or otherwise converted, prepaid or redeemed before maturity, and the portfolio managers may not be able to invest the proceeds in other investments providing as high a level of income, resulting in a reduced yield to the Fund. As interest rates decrease or spreads narrow, the likelihood of prepayment increases. The portfolio managers may be unable to capitalize on securities with higher interest rates or wider spreads because the Fund’s investments are locked in at a lower rate for a longer period of time.
Reinvestment Risk. Reinvestment risk is the risk that the Fund will not be able to reinvest income or principal at the same return it is currently earning. |
|
| Risk Lose Money [Text] |
rr_RiskLoseMoney |
There is no assurance that the Fund will achieve its investment objective and you may lose money. |
|
| Bar Chart and Performance Table [Heading] |
rr_BarChartAndPerformanceTableHeading |
Performance Information |
|
| Performance Narrative [Text Block] |
rr_PerformanceNarrativeTextBlock |
The following bar chart and table show you how the Fund has performed in the past, and can help you understand the risks of investing in the Fund. The bar chart shows how the Fund’s Class A share performance (without sales charges) has varied for each full calendar year shown. If the sales charges were reflected, returns shown would be lower. Class A share performance (without sales charges) is shown in the bar chart because Class A shares have at least ten calendar years of performance and Class A shares are the most common share class across the Columbia Funds complex that are available for investment by the general public. The table below the bar chart compares the Fund’s returns (after applicable sales charges) for the periods shown with benchmark performance.
The performance of one or more share classes shown in the table below begins before the indicated inception date for such share class. The returns shown for each such share class include the returns of the Fund’s Class Z shares (adjusted to reflect the higher class-related operating expenses of such classes, where applicable) for periods prior to its inception date. Class R4 shares of the Fund commenced operations after the periods ended shown in the table below and, therefore, performance is not yet available.
Any share class that does not have available performance would have annual returns substantially similar to those of Class Z shares. Except for differences in annual returns resulting from differences in expenses and sales charges (where applicable), the share classes of the Fund would have substantially similar annual returns because all share classes of the Fund invest in the same portfolio of securities.
The after-tax returns shown in the table below are calculated using the highest historical individual U.S. federal marginal income tax rates and do not reflect the impact of state, local or foreign taxes. Your actual after-tax returns will depend on your personal tax situation and may differ from those shown in the table. In addition, the after-tax returns shown in the table do not apply to shares held in tax-deferred accounts such as 401(k) plans or Individual Retirement Accounts (IRAs). The after-tax returns are shown only for Class A shares and will vary for other share classes. Returns after taxes on distributions and sale of Fund shares are higher than before-tax returns for certain periods shown because they reflect the tax benefit of capital losses realized on the redemption of Fund shares. After-tax returns are shown for Class A shares because Class A shares have at least ten calendar years of performance and Class A shares are the most common share class across the Columbia Funds complex that are available for investment by the general public.
The Fund’s past performance (before and after taxes) is no guarantee of how the Fund will perform in the future. Updated performance information can be obtained by calling toll-free 800.345.6611 or visiting columbiamanagement.com. |
|
| Performance Information Illustrates Variability of Returns [Text] |
rr_PerformanceInformationIllustratesVariabilityOfReturns |
The following bar chart and table show you how the Fund has performed in the past, and can help you understand the risks of investing in the Fund. The bar chart shows how the Fund’s Class A share performance (without sales charges) has varied for each full calendar year shown. If the sales charges were reflected, returns shown would be lower. Class A share performance (without sales charges) is shown in the bar chart because Class A shares have at least ten calendar years of performance and Class A shares are the most common share class across the Columbia Funds complex that are available for investment by the general public. The table below the bar chart compares the Fund’s returns (after applicable sales charges) for the periods shown with benchmark performance. |
|
| Performance One Year or Less [Text] |
rr_PerformanceOneYearOrLess |
Class R4 shares of the Fund commenced operations after the periods ended shown in the table below and, therefore, performance is not yet available. |
|
| Performance Availability Phone [Text] |
rr_PerformanceAvailabilityPhone |
800.345.6611 |
|
| Performance Availability Website Address [Text] |
rr_PerformanceAvailabilityWebSiteAddress |
columbiamanagement.com |
|
| Performance Past Does Not Indicate Future [Text] |
rr_PerformancePastDoesNotIndicateFuture |
The Fund’s past performance (before and after taxes) is no guarantee of how the Fund will perform in the future. |
|
| Bar Chart [Heading] |
rr_BarChartHeading |
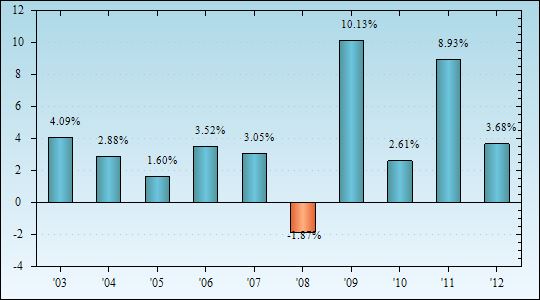
Year by Year Total Return (%)
as of December 31 Each Year |
|
| Bar Chart Does Not Reflect Sales Loads [Text] |
rr_BarChartDoesNotReflectSalesLoads |
The bar chart shows how the Fund’s Class A share performance (without sales charges) has varied for each full calendar year shown. If the sales charges were reflected, returns shown would be lower. |
|
| Bar Chart Closing [Text Block] |
rr_BarChartClosingTextBlock |
Best and Worst Quarterly Returns
During the Period Shown in the Bar Chart
Best 3rd Quarter 2009 7.20%
Worst 4th Quarter 2010 -3.81% |
|
| Performance Table Heading |
rr_PerformanceTableHeading |
Average Annual Total Returns After Applicable Sales Charges (for periods ended December 31, 2012) |
|
| Performance Table Uses Highest Federal Rate |
rr_PerformanceTableUsesHighestFederalRate |
The after-tax returns shown in the table below are calculated using the highest historical individual U.S. federal marginal income tax rates and do not reflect the impact of state, local or foreign taxes. |
|
| Performance Table Not Relevant to Tax Deferred |
rr_PerformanceTableNotRelevantToTaxDeferred |
In addition, the after-tax returns shown in the table do not apply to shares held in tax-deferred accounts such as 401(k) plans or Individual Retirement Accounts (IRAs). |
|
| Performance Table One Class of after Tax Shown [Text] |
rr_PerformanceTableOneClassOfAfterTaxShown |
The after-tax returns are shown only for Class A shares and will vary for other share classes. |
|
| Performance Table Explanation after Tax Higher |
rr_PerformanceTableExplanationAfterTaxHigher |
Returns after taxes on distributions and sale of Fund shares are higher than before-tax returns for certain periods shown because they reflect the tax benefit of capital losses realized on the redemption of Fund shares. |
|
|
Columbia California Intermediate Municipal Bond Fund | Class A
|
|
|
|
| Risk/Return: |
rr_RiskReturnAbstract |
|
|
| Maximum sales charge (load) imposed on purchases (as a % of offering price) |
rr_MaximumSalesChargeImposedOnPurchasesOverOfferingPrice |
3.25% |
|
| Maximum deferred sales charge (load) imposed on redemptions (as a % of the lower of the original purchase price or current net asset value) |
rr_MaximumDeferredSalesChargeOverOther |
1.00% |
[1] |
| Management fees |
rr_ManagementFeesOverAssets |
0.40% |
|
| Distribution and/or service (12b-1) fees |
rr_DistributionAndService12b1FeesOverAssets |
0.25% |
|
| Other expenses |
rr_OtherExpensesOverAssets |
0.31% |
[2] |
| Total annual Fund operating expenses |
rr_ExpensesOverAssets |
0.96% |
|
| Less: Fee waivers and/or expense reimbursements |
rr_FeeWaiverOrReimbursementOverAssets |
(0.22%) |
[3] |
| Total annual Fund operating expenses after fee waivers and/or expense reimbursements |
rr_NetExpensesOverAssets |
0.74% |
|
| Expenses Deferred Charges [Text Block] |
rr_ExpensesDeferredChargesTextBlock |
This charge is imposed on certain investments of between $1 million and $50 million redeemed within 18 months of purchase, as follows: 1.00% if redeemed within 12 months of purchase, and 0.50% if redeemed more than 12, but less than 18, months after purchase, with certain limited exceptions. |
|
| 1 year |
rr_ExpenseExampleYear01 |
398 |
|
| 3 years |
rr_ExpenseExampleYear03 |
600 |
|
| 5 years |
rr_ExpenseExampleYear05 |
818 |
|
| 10 years |
rr_ExpenseExampleYear10 |
1,445 |
|
| 1 year |
rr_ExpenseExampleNoRedemptionYear01 |
398 |
|
| 3 years |
rr_ExpenseExampleNoRedemptionYear03 |
600 |
|
| 5 years |
rr_ExpenseExampleNoRedemptionYear05 |
818 |
|
| 10 years |
rr_ExpenseExampleNoRedemptionYear10 |
1,445 |
|
| 2003 |
rr_AnnualReturn2003 |
3.15% |
[4] |
| 2004 |
rr_AnnualReturn2004 |
2.33% |
[4] |
| 2005 |
rr_AnnualReturn2005 |
1.47% |
[4] |
| 2006 |
rr_AnnualReturn2006 |
4.21% |
[4] |
| 2007 |
rr_AnnualReturn2007 |
2.73% |
[4] |
| 2008 |
rr_AnnualReturn2008 |
(1.02%) |
[4] |
| 2009 |
rr_AnnualReturn2009 |
9.33% |
[4] |
| 2010 |
rr_AnnualReturn2010 |
2.99% |
[4] |
| 2011 |
rr_AnnualReturn2011 |
10.20% |
[4] |
| 2012 |
rr_AnnualReturn2012 |
6.00% |
[4] |
| Year to Date Return, Label |
rr_YearToDateReturnLabel |
Year to Date return |
|
| Bar Chart, Year to Date Return, Date |
rr_BarChartYearToDateReturnDate |
Jun. 30,
2013 |
|
| Bar Chart, Year to Date Return |
rr_BarChartYearToDateReturn |
(2.82%) |
|
| Highest Quarterly Return, Label |
rr_HighestQuarterlyReturnLabel |
Best |
|
| Highest Quarterly Return, Date |
rr_BarChartHighestQuarterlyReturnDate |
Sep. 30,
2009 |
|
| Highest Quarterly Return |
rr_BarChartHighestQuarterlyReturn |
7.20% |
|
| Lowest Quarterly Return, Label |
rr_LowestQuarterlyReturnLabel |
Worst |
|
| Lowest Quarterly Return, Date |
rr_BarChartLowestQuarterlyReturnDate |
Dec. 31,
2010 |
|
| Lowest Quarterly Return |
rr_BarChartLowestQuarterlyReturn |
(3.81%) |
|
| 1 Year |
rr_AverageAnnualReturnYear01 |
2.52% |
|
| 5 Years |
rr_AverageAnnualReturnYear05 |
4.73% |
|
| 10 Years |
rr_AverageAnnualReturnYear10 |
3.74% |
|
| Share Class Inception Date |
rr_AverageAnnualReturnInceptionDate |
Sep.
09,
2002 |
|
|
Columbia California Intermediate Municipal Bond Fund | Class B
|
|
|
|
| Risk/Return: |
rr_RiskReturnAbstract |
|
|
| Maximum sales charge (load) imposed on purchases (as a % of offering price) |
rr_MaximumSalesChargeImposedOnPurchasesOverOfferingPrice |
none
|
|
| Maximum deferred sales charge (load) imposed on redemptions (as a % of the lower of the original purchase price or current net asset value) |
rr_MaximumDeferredSalesChargeOverOther |
3.00% |
[5] |
| Management fees |
rr_ManagementFeesOverAssets |
0.40% |
|
| Distribution and/or service (12b-1) fees |
rr_DistributionAndService12b1FeesOverAssets |
1.00% |
|
| Other expenses |
rr_OtherExpensesOverAssets |
0.31% |
[2] |
| Total annual Fund operating expenses |
rr_ExpensesOverAssets |
1.71% |
|
| Less: Fee waivers and/or expense reimbursements |
rr_FeeWaiverOrReimbursementOverAssets |
(0.22%) |
[3] |
| Total annual Fund operating expenses after fee waivers and/or expense reimbursements |
rr_NetExpensesOverAssets |
1.49% |
|
| Expenses Deferred Charges [Text Block] |
rr_ExpensesDeferredChargesTextBlock |
This charge decreases over time. |
|
| 1 year |
rr_ExpenseExampleYear01 |
452 |
|
| 3 years |
rr_ExpenseExampleYear03 |
717 |
|
| 5 years |
rr_ExpenseExampleYear05 |
908 |
|
| 10 years |
rr_ExpenseExampleYear10 |
1,802 |
|
| 1 year |
rr_ExpenseExampleNoRedemptionYear01 |
152 |
|
| 3 years |
rr_ExpenseExampleNoRedemptionYear03 |
517 |
|
| 5 years |
rr_ExpenseExampleNoRedemptionYear05 |
908 |
|
| 10 years |
rr_ExpenseExampleNoRedemptionYear10 |
1,802 |
|
| 1 Year |
rr_AverageAnnualReturnYear01 |
2.21% |
|
| 5 Years |
rr_AverageAnnualReturnYear05 |
4.64% |
|
| 10 Years |
rr_AverageAnnualReturnYear10 |
3.31% |
|
| Share Class Inception Date |
rr_AverageAnnualReturnInceptionDate |
Aug. 29,
2002 |
|
|
Columbia California Intermediate Municipal Bond Fund | Class C
|
|
|
|
| Risk/Return: |
rr_RiskReturnAbstract |
|
|
| Maximum sales charge (load) imposed on purchases (as a % of offering price) |
rr_MaximumSalesChargeImposedOnPurchasesOverOfferingPrice |
none
|
|
| Maximum deferred sales charge (load) imposed on redemptions (as a % of the lower of the original purchase price or current net asset value) |
rr_MaximumDeferredSalesChargeOverOther |
1.00% |
[6] |
| Management fees |
rr_ManagementFeesOverAssets |
0.40% |
|
| Distribution and/or service (12b-1) fees |
rr_DistributionAndService12b1FeesOverAssets |
1.00% |
|
| Other expenses |
rr_OtherExpensesOverAssets |
0.31% |
[2] |
| Total annual Fund operating expenses |
rr_ExpensesOverAssets |
1.71% |
|
| Less: Fee waivers and/or expense reimbursements |
rr_FeeWaiverOrReimbursementOverAssets |
(0.22%) |
[3] |
| Total annual Fund operating expenses after fee waivers and/or expense reimbursements |
rr_NetExpensesOverAssets |
1.49% |
|
| Expenses Deferred Charges [Text Block] |
rr_ExpensesDeferredChargesTextBlock |
This charge applies to redemptions within one year of purchase, with certain limited exceptions. |
|
| 1 year |
rr_ExpenseExampleYear01 |
252 |
|
| 3 years |
rr_ExpenseExampleYear03 |
517 |
|
| 5 years |
rr_ExpenseExampleYear05 |
908 |
|
| 10 years |
rr_ExpenseExampleYear10 |
2,001 |
|
| 1 year |
rr_ExpenseExampleNoRedemptionYear01 |
152 |
|
| 3 years |
rr_ExpenseExampleNoRedemptionYear03 |
517 |
|
| 5 years |
rr_ExpenseExampleNoRedemptionYear05 |
908 |
|
| 10 years |
rr_ExpenseExampleNoRedemptionYear10 |
2,001 |
|
| 1 Year |
rr_AverageAnnualReturnYear01 |
4.20% |
|
| 5 Years |
rr_AverageAnnualReturnYear05 |
4.61% |
|
| 10 Years |
rr_AverageAnnualReturnYear10 |
3.31% |
|
| Share Class Inception Date |
rr_AverageAnnualReturnInceptionDate |
Sep. 11,
2002 |
|
|
Columbia California Intermediate Municipal Bond Fund | Class R4
|
|
|
|
| Risk/Return: |
rr_RiskReturnAbstract |
|
|
| Maximum sales charge (load) imposed on purchases (as a % of offering price) |
rr_MaximumSalesChargeImposedOnPurchasesOverOfferingPrice |
none
|
|
| Maximum deferred sales charge (load) imposed on redemptions (as a % of the lower of the original purchase price or current net asset value) |
rr_MaximumDeferredSalesChargeOverOther |
none
|
|
| Management fees |
rr_ManagementFeesOverAssets |
0.40% |
|
| Distribution and/or service (12b-1) fees |
rr_DistributionAndService12b1FeesOverAssets |
none
|
|
| Other expenses |
rr_OtherExpensesOverAssets |
0.31% |
[2] |
| Total annual Fund operating expenses |
rr_ExpensesOverAssets |
0.71% |
|
| Less: Fee waivers and/or expense reimbursements |
rr_FeeWaiverOrReimbursementOverAssets |
(0.22%) |
[3] |
| Total annual Fund operating expenses after fee waivers and/or expense reimbursements |
rr_NetExpensesOverAssets |
0.49% |
|
| 1 year |
rr_ExpenseExampleYear01 |
50 |
|
| 3 years |
rr_ExpenseExampleYear03 |
205 |
|
| 5 years |
rr_ExpenseExampleYear05 |
373 |
|
| 10 years |
rr_ExpenseExampleYear10 |
862 |
|
| 1 year |
rr_ExpenseExampleNoRedemptionYear01 |
50 |
|
| 3 years |
rr_ExpenseExampleNoRedemptionYear03 |
205 |
|
| 5 years |
rr_ExpenseExampleNoRedemptionYear05 |
373 |
|
| 10 years |
rr_ExpenseExampleNoRedemptionYear10 |
862 |
|
|
Columbia California Intermediate Municipal Bond Fund | Class R5
|
|
|
|
| Risk/Return: |
rr_RiskReturnAbstract |
|
|
| Maximum sales charge (load) imposed on purchases (as a % of offering price) |
rr_MaximumSalesChargeImposedOnPurchasesOverOfferingPrice |
none
|
|
| Maximum deferred sales charge (load) imposed on redemptions (as a % of the lower of the original purchase price or current net asset value) |
rr_MaximumDeferredSalesChargeOverOther |
none
|
|
| Management fees |
rr_ManagementFeesOverAssets |
0.40% |
|
| Distribution and/or service (12b-1) fees |
rr_DistributionAndService12b1FeesOverAssets |
none
|
|
| Other expenses |
rr_OtherExpensesOverAssets |
0.16% |
[2] |
| Total annual Fund operating expenses |
rr_ExpensesOverAssets |
0.56% |
|
| Less: Fee waivers and/or expense reimbursements |
rr_FeeWaiverOrReimbursementOverAssets |
(0.16%) |
[3] |
| Total annual Fund operating expenses after fee waivers and/or expense reimbursements |
rr_NetExpensesOverAssets |
0.40% |
|
| 1 year |
rr_ExpenseExampleYear01 |
41 |
|
| 3 years |
rr_ExpenseExampleYear03 |
163 |
|
| 5 years |
rr_ExpenseExampleYear05 |
297 |
|
| 10 years |
rr_ExpenseExampleYear10 |
686 |
|
| 1 year |
rr_ExpenseExampleNoRedemptionYear01 |
41 |
|
| 3 years |
rr_ExpenseExampleNoRedemptionYear03 |
163 |
|
| 5 years |
rr_ExpenseExampleNoRedemptionYear05 |
297 |
|
| 10 years |
rr_ExpenseExampleNoRedemptionYear10 |
686 |
|
| 1 Year |
rr_AverageAnnualReturnYear01 |
6.27% |
|
| 5 Years |
rr_AverageAnnualReturnYear05 |
5.66% |
|
| 10 Years |
rr_AverageAnnualReturnYear10 |
4.35% |
|
| Share Class Inception Date |
rr_AverageAnnualReturnInceptionDate |
Nov.
08,
2012 |
|
|
Columbia California Intermediate Municipal Bond Fund | Class Z
|
|
|
|
| Risk/Return: |
rr_RiskReturnAbstract |
|
|
| Maximum sales charge (load) imposed on purchases (as a % of offering price) |
rr_MaximumSalesChargeImposedOnPurchasesOverOfferingPrice |
none
|
|
| Maximum deferred sales charge (load) imposed on redemptions (as a % of the lower of the original purchase price or current net asset value) |
rr_MaximumDeferredSalesChargeOverOther |
none
|
|
| Management fees |
rr_ManagementFeesOverAssets |
0.40% |
|
| Distribution and/or service (12b-1) fees |
rr_DistributionAndService12b1FeesOverAssets |
none
|
|
| Other expenses |
rr_OtherExpensesOverAssets |
0.31% |
[2] |
| Total annual Fund operating expenses |
rr_ExpensesOverAssets |
0.71% |
|
| Less: Fee waivers and/or expense reimbursements |
rr_FeeWaiverOrReimbursementOverAssets |
(0.22%) |
[3] |
| Total annual Fund operating expenses after fee waivers and/or expense reimbursements |
rr_NetExpensesOverAssets |
0.49% |
|
| 1 year |
rr_ExpenseExampleYear01 |
50 |
|
| 3 years |
rr_ExpenseExampleYear03 |
205 |
|
| 5 years |
rr_ExpenseExampleYear05 |
373 |
|
| 10 years |
rr_ExpenseExampleYear10 |
862 |
|
| 1 year |
rr_ExpenseExampleNoRedemptionYear01 |
50 |
|
| 3 years |
rr_ExpenseExampleNoRedemptionYear03 |
205 |
|
| 5 years |
rr_ExpenseExampleNoRedemptionYear05 |
373 |
|
| 10 years |
rr_ExpenseExampleNoRedemptionYear10 |
$ 862 |
|
| 1 Year |
rr_AverageAnnualReturnYear01 |
6.27% |
|
| 5 Years |
rr_AverageAnnualReturnYear05 |
5.66% |
|
| 10 Years |
rr_AverageAnnualReturnYear10 |
4.35% |
|
| Share Class Inception Date |
rr_AverageAnnualReturnInceptionDate |
Aug. 19,
2002 |
|
|
Columbia California Intermediate Municipal Bond Fund | returns after taxes on distributions | Class A
|
|
|
|
| Risk/Return: |
rr_RiskReturnAbstract |
|
|
| 1 Year |
rr_AverageAnnualReturnYear01 |
2.52% |
|
| 5 Years |
rr_AverageAnnualReturnYear05 |
4.72% |
|
| 10 Years |
rr_AverageAnnualReturnYear10 |
3.71% |
|
| Share Class Inception Date |
rr_AverageAnnualReturnInceptionDate |
Sep.
09,
2002 |
|
|
Columbia California Intermediate Municipal Bond Fund | returns after taxes on distributions and sale of Fund shares | Class A
|
|
|
|
| Risk/Return: |
rr_RiskReturnAbstract |
|
|
| 1 Year |
rr_AverageAnnualReturnYear01 |
2.71% |
|
| 5 Years |
rr_AverageAnnualReturnYear05 |
4.51% |
|
| 10 Years |
rr_AverageAnnualReturnYear10 |
3.65% |
|
| Share Class Inception Date |
rr_AverageAnnualReturnInceptionDate |
Sep.
09,
2002 |
|
|
Columbia California Intermediate Municipal Bond Fund | Barclays California 3-15 Year Blend Municipal Bond Index (reflects no deductions for fees, expenses or taxes)
|
|
|
|
| Risk/Return: |
rr_RiskReturnAbstract |
|
|
| 1 Year |
rr_AverageAnnualReturnYear01 |
6.02% |
|
| 5 Years |
rr_AverageAnnualReturnYear05 |
6.10% |
|
| 10 Years |
rr_AverageAnnualReturnYear10 |
5.05% |
|
|
Columbia California Intermediate Municipal Bond Fund | Barclays 3-15 Year Blend Municipal Bond Index (reflects no deductions for fees, expenses or taxes)
|
|
|
|
| Risk/Return: |
rr_RiskReturnAbstract |
|
|
| 1 Year |
rr_AverageAnnualReturnYear01 |
5.15% |
|
| 5 Years |
rr_AverageAnnualReturnYear05 |
5.88% |
|
| 10 Years |
rr_AverageAnnualReturnYear10 |
4.91% |
|
|
|
|