| Label |
Element |
Value |
| (WFA Income Funds - Classes A and C) | (Wells Fargo Adjustable Rate Government Fund) |
|
|
|
| Prospectus: |
rr_ProspectusTable |
|
|
| Objective [Heading] |
rr_ObjectiveHeading |
Investment Objective
|
|
| Objective, Primary [Text Block] |
rr_ObjectivePrimaryTextBlock |
The Fund seeks current income consistent with capital preservation.
|
|
| Expense [Heading] |
rr_ExpenseHeading |
Fees and Expenses
|
|
| Expense Narrative [Text Block] |
rr_ExpenseNarrativeTextBlock |
These tables are intended to help you understand the various costs and expenses you will pay if you buy and hold shares of the Fund. You may qualify for sales charge discounts if you and your family invest, or agree to invest in the future, at least $50,000 in the aggregate in specified classes of certain Wells Fargo Funds. More information about these and other discounts is available from your financial professional and in "Share Class Features" and "Reductions and Waivers of Sales Charges" on pages 52 and 54 of the Prospectus and "Additional Purchase and Redemption Information" on page 71 of the Statement of Additional Information. Investors who purchase through certain intermediaries may be subject to different sales charge discounts than those outlined shares in these sections. Please see Appendix A on page 74 for further information.
|
|
| Expense Breakpoint Discounts [Text] |
rr_ExpenseBreakpointDiscounts |
You may qualify for sales charge discounts if you and your family invest, or agree to invest in the future, at least $50,000 in the aggregate in specified classes of certain Wells Fargo Funds.
|
|
| Expense Breakpoint, Minimum Investment Required [Amount] |
rr_ExpenseBreakpointMinimumInvestmentRequiredAmount |
$ 50,000
|
|
| Shareholder Fees Caption [Text] |
rr_ShareholderFeesCaption |
Shareholder Fees (fees paid directly from your investment)
|
|
| Operating Expenses Caption [Text] |
rr_OperatingExpensesCaption |
Annual Fund Operating Expenses (expenses that you pay each year as a percentage of the value of your investment)
|
|
| Fee Waiver or Reimbursement over Assets, Date of Termination |
rr_FeeWaiverOrReimbursementOverAssetsDateOfTermination |
December 31, 2018
|
|
| Expenses Deferred Charges [Text Block] |
rr_ExpensesDeferredChargesTextBlock |
Investments of $500,000 or more are not subject to a front-end sales charge but generally will be subject to a deferred sales charge of 0.40% if redeemed within 12 months from the date of purchase.
|
|
| Expense Example [Heading] |
rr_ExpenseExampleHeading |
Example of Expenses
|
|
| Expense Example Narrative [Text Block] |
rr_ExpenseExampleNarrativeTextBlock |
The example below is intended to help you compare the costs of investing in the Fund with the costs of investing in other mutual funds. The example assumes a $10,000 initial investment, 5% annual total return, and that fees and expenses remain the same as in the tables above. To the extent that the Manager is waiving fees or reimbursing expenses, the example assumes that such waiver or reimbursement will only be in place through the date noted above. Although your actual costs may be higher or lower, based on these assumptions your costs would be:
|
|
| Expense Example by, Year, Caption [Text] |
rr_ExpenseExampleByYearCaption |
Assuming Redemption at End of Period
|
|
| Expense Example, No Redemption, By Year, Caption [Text] |
rr_ExpenseExampleNoRedemptionByYearCaption |
Assuming No Redemption
|
|
| Portfolio Turnover [Heading] |
rr_PortfolioTurnoverHeading |
Portfolio Turnover
|
|
| Portfolio Turnover [Text Block] |
rr_PortfolioTurnoverTextBlock |
The Fund pays transaction costs, such as commissions, when it buys and sells securities (or "turns over" its portfolio). A higher portfolio turnover rate may indicate higher transaction costs and may result in higher taxes when Fund shares are held in a taxable account. These costs, which are not reflected in annual fund operating expenses or in the example, affect the Fund's performance. During the most recent fiscal year, the Fund's portfolio turnover rate was 2% of the average value of its portfolio.
|
|
| Portfolio Turnover, Rate |
rr_PortfolioTurnoverRate |
2.00%
|
|
| Strategy [Heading] |
rr_StrategyHeading |
Principal Investment Strategies
|
|
| Strategy Narrative [Text Block] |
rr_StrategyNarrativeTextBlock |
Under normal circumstances, we invest:
-
at least 80% of the Fund's net assets in mortgage-backed and asset-backed securities issued or guaranteed by U.S. Government agencies or government-sponsored entities, that have interest rates that reset at periodic intervals; and
-
up to 20% of the Fund's total assets in obligations that pay fixed interest rates.
We invest principally in mortgage-backed securities (including collateralized mortgage obligations (CMOs)) and asset-backed securities issued or guaranteed by U.S. Government agencies or government-sponsored entities. Under normal circumstances, we expect to maintain an average credit quality rating for the portfolio equivalent to the highest rating available from a Nationally Recognized Statistical Ratings Organization (NRSRO). In the event that a NRSRO assigns U.S. sovereign debt a rating below its highest rating, we expect to maintain an average credit quality rating that is equivalent to the average rating assigned to U.S. sovereign debt. As part of our mortgage-backed securities investment strategy, we may enter into dollar roll transactions. Under normal circumstances, the dollar-weighted average reset period of the adjustable rate securities held by the Fund will not exceed one year.
We employ a top-down, macroeconomic outlook to determine the portfolio's duration, yield curve positioning, issuer selection and sector allocation. Macroeconomic factors considered may include, among others, the pace of economic growth, employment conditions, corporate profits, inflation, monetary and fiscal policy, as well as the influence of international economic and financial conditions. In combination with our top-down macroeconomic approach, we employ a bottom-up process of fundamental securities analysis to select the specific securities for investment. Elements of this evaluation may include the effect of changing principal prepayments, interest rate and yield spread volatility, and the impact of changes in the level and shape of the yield curve on a security's value. We may sell a security based on how we expect these factors to affect a security's value relative to its indicated sales price as well as changes in portfolio strategy or cash flow needs. A security may also be sold and replaced with one that presents a better value or risk/reward profile.
|
|
| Risk [Heading] |
rr_RiskHeading |
Principal Investment Risks
|
|
| Risk Narrative [Text Block] |
rr_RiskNarrativeTextBlock |
An investment in the Fund may lose money, is not a deposit of Wells Fargo Bank, N.A. or its affiliates, is not insured or guaranteed by the Federal Deposit Insurance Corporation or any other governmental agency, and is primarily subject to the risks briefly summarized below.
Credit Risk. The issuer or guarantor of a debt security may be unable or perceived to be unable to pay interest or repay principal when they become due, which could cause the value of an investment to decline and a Fund to lose money.
Interest Rate Risk. When interest rates (which are currently near historic lows) rise, the value of debt securities tends to fall. When interest rates decline, interest that a Fund is able to earn on its investments in debt securities may also decline, but the value of those securities may increase.
Management Risk. Investment decisions, techniques, analyses or models implemented by a Fund's manager or sub-adviser in seeking to achieve the Fund's investment objective may not produce the returns expected, may cause the Fund's shares to lose value or may cause the Fund to underperform other funds with similar investment objectives.
Market Risk. The values of, and/or the income generated by, securities held by a Fund may decline due to general market conditions or other factors, including those directly involving the issuers of such securities. Security markets are volatile and may decline significantly in response to adverse issuer, regulatory, political, or economic developments. Different sectors of the market and different security types may react differently to such developments.
Mortgage- and Asset-Backed Securities Risk. Mortgage- and asset-backed securities may decline in value and become less liquid when defaults on the underlying mortgages or assets occur and may exhibit additional volatility in periods of rising interest rates. Rising interest rates tend to extend the duration of these securities, making them more sensitive to changes in interest rates than instruments with fixed payment schedules. When interest rates decline or are low, the prepayment of mortgages or assets underlying such securities can reduce a Fund's returns.
U.S. Government Obligations Risk. U.S. Government obligations may be adversely impacted by changes in interest rates, and securities issued or guaranteed by U.S. Government agencies or government-sponsored entities may not be backed by the full faith and credit of the U.S. Government.
|
|
| Risk Lose Money [Text] |
rr_RiskLoseMoney |
An investment in the Fund may lose money
|
|
| Risk Not Insured Depository Institution [Text] |
rr_RiskNotInsuredDepositoryInstitution |
An investment in the Fund may lose money, is not a deposit of Wells Fargo Bank, N.A. or its affiliates, is not insured or guaranteed by the Federal Deposit Insurance Corporation or any other governmental agency
|
|
| Bar Chart and Performance Table [Heading] |
rr_BarChartAndPerformanceTableHeading |
Performance
|
|
| Performance Narrative [Text Block] |
rr_PerformanceNarrativeTextBlock |
The following information provides some indication of the risks of investing in the Fund by showing changes in the Fund's performance from year to year. The Fund's average annual total returns are compared to the performance of one or more indices. Past performance before and after taxes is no guarantee of future results. Current month-end performance is available on the Fund's website at wellsfargofunds.com.
|
|
| Bar Chart Does Not Reflect Sales Loads [Text] |
rr_BarChartDoesNotReflectSalesLoads |
returns do not reflect sales charges and would be lower if they did
|
|
| Bar Chart Closing [Text Block] |
rr_BarChartClosingTextBlock |
Highest Quarter: 1st Quarter 2009 | +3.01% | | Lowest Quarter: 4th Quarter 2008 | -2.80% | Year-to-date total return as of 9/30/2017 is +0.14% |
|
|
| Performance Table Heading |
rr_PerformanceTableHeading |
Average Annual Total Returns for the periods ended 12/31/2016 (returns reflect applicable sales charges)
|
[1] |
| Performance Table Closing [Text Block] |
rr_PerformanceTableClosingTextBlock |
After-tax returns are calculated using the historical highest individual federal marginal income tax rates and do not reflect the impact of state, local or foreign taxes. Actual after-tax returns depend on an investor's tax situation and may differ from those shown, and after-tax returns shown are not relevant to tax-exempt investors or investors who hold their Fund shares through tax-deferred arrangements, such as 401(k) Plans or Individual Retirement Accounts. After-tax returns are shown for only one class of shares. After-tax returns for any other class will vary.
|
|
| Performance Table Does Reflect Sales Loads |
rr_PerformanceTableDoesReflectSalesLoads |
returns reflect applicable sales charges
|
|
| Performance Table Uses Highest Federal Rate |
rr_PerformanceTableUsesHighestFederalRate |
After-tax returns are calculated using the historical highest individual federal marginal income tax rates and do not reflect the impact of state, local or foreign taxes.
|
|
| Performance Table Not Relevant to Tax Deferred |
rr_PerformanceTableNotRelevantToTaxDeferred |
Actual after-tax returns depend on an investor's tax situation and may differ from those shown, and after-tax returns shown are not relevant to tax-exempt investors or investors who hold their Fund shares through tax-deferred arrangements, such as 401(k) Plans or Individual Retirement Accounts.
|
|
| Performance Past Does Not Indicate Future [Text] |
rr_PerformancePastDoesNotIndicateFuture |
Past performance before and after taxes is no guarantee of future results.
|
|
| Performance Information Illustrates Variability of Returns [Text] |
rr_PerformanceInformationIllustratesVariabilityOfReturns |
The following information provides some indication of the risks of investing in the Fund by showing changes in the Fund's performance from year to year. The Fund's average annual total returns are compared to the performance of one or more indices. Past performance before and after taxes is no guarantee of future results.
|
|
| Performance Table One Class of after Tax Shown [Text] |
rr_PerformanceTableOneClassOfAfterTaxShown |
After-tax returns are shown for only one class of shares.
|
|
| Performance Availability Website Address [Text] |
rr_PerformanceAvailabilityWebSiteAddress |
wellsfargofunds.com
|
|
| (WFA Income Funds - Classes A and C) | (Wells Fargo Adjustable Rate Government Fund) | Bloomberg Barclays 6-Month Treasury Bill Index (reflects no deduction for fees, expenses, or taxes) |
|
|
|
| Prospectus: |
rr_ProspectusTable |
|
|
| 1 Year |
rr_AverageAnnualReturnYear01 |
0.67%
|
|
| 5 Years |
rr_AverageAnnualReturnYear05 |
0.28%
|
|
| 10 Years |
rr_AverageAnnualReturnYear10 |
1.18%
|
|
| (WFA Income Funds - Classes A and C) | (Wells Fargo Adjustable Rate Government Fund) | Class A |
|
|
|
| Prospectus: |
rr_ProspectusTable |
|
|
| Maximum sales charge (load) imposed on purchases (as a percentage of offering price) |
rr_MaximumSalesChargeImposedOnPurchasesOverOfferingPrice |
2.00%
|
|
| Maximum deferred sales charge (load) (as a percentage of offering price) |
rr_MaximumDeferredSalesChargeOverOfferingPrice |
none
|
[2] |
| Management Fees |
rr_ManagementFeesOverAssets |
0.35%
|
|
| Distribution (12b-1) Fees |
rr_DistributionAndService12b1FeesOverAssets |
none
|
|
| Other Expenses |
rr_OtherExpensesOverAssets |
0.45%
|
|
| Total Annual Fund Operating Expenses |
rr_ExpensesOverAssets |
0.80%
|
|
| Fee Waivers |
rr_FeeWaiverOrReimbursementOverAssets |
(0.06%)
|
|
| Total Annual Fund Operating Expenses After Fee Waivers |
rr_NetExpensesOverAssets |
0.74%
|
[3] |
| Expense Example, with Redemption, 1 Year |
rr_ExpenseExampleYear01 |
$ 274
|
|
| Expense Example, with Redemption, 3 Years |
rr_ExpenseExampleYear03 |
444
|
|
| Expense Example, with Redemption, 5 Years |
rr_ExpenseExampleYear05 |
630
|
|
| Expense Example, with Redemption, 10 Years |
rr_ExpenseExampleYear10 |
$ 1,165
|
|
| Bar Chart [Heading] |
rr_BarChartHeading |
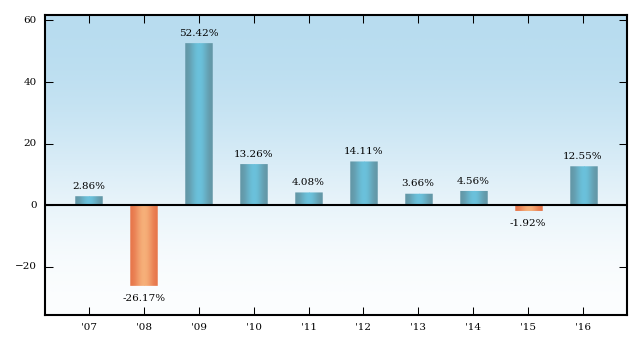
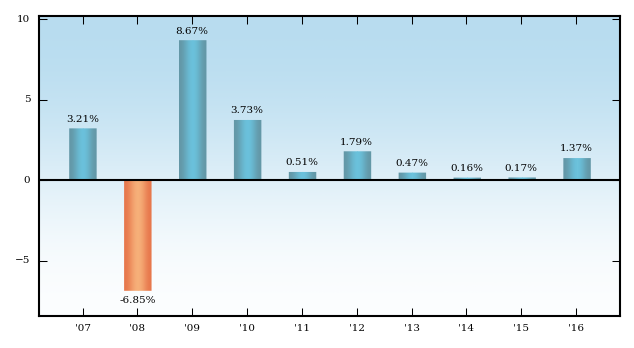
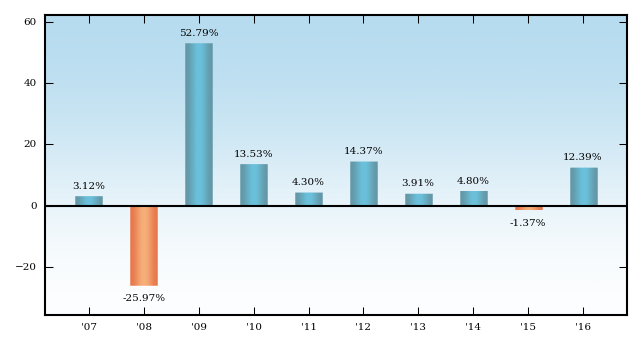
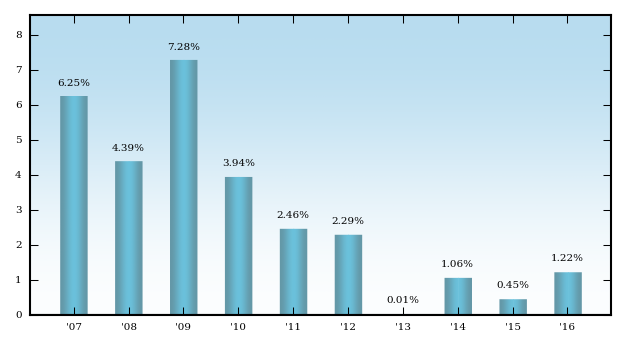
Calendar Year Total Returns for Class A as of 12/31 each year (returns do not reflect sales charges and would be lower if they did)
|
[1] |
| Annual Return 2007 |
rr_AnnualReturn2007 |
4.48%
|
|
| Annual Return 2008 |
rr_AnnualReturn2008 |
(1.21%)
|
|
| Annual Return 2009 |
rr_AnnualReturn2009 |
6.60%
|
|
| Annual Return 2010 |
rr_AnnualReturn2010 |
2.76%
|
|
| Annual Return 2011 |
rr_AnnualReturn2011 |
1.79%
|
|
| Annual Return 2012 |
rr_AnnualReturn2012 |
1.81%
|
|
| Annual Return 2013 |
rr_AnnualReturn2013 |
0.33%
|
|
| Annual Return 2014 |
rr_AnnualReturn2014 |
0.69%
|
|
| Annual Return 2015 |
rr_AnnualReturn2015 |
(0.30%)
|
|
| Annual Return 2016 |
rr_AnnualReturn2016 |
0.46%
|
|
| Year to Date Return, Label |
rr_YearToDateReturnLabel |
Year-to-date total return as of 9/30/2017 is +0.14%
|
|
| Bar Chart, Year to Date Return |
rr_BarChartYearToDateReturn |
0.14%
|
|
| Bar Chart, Year to Date Return, Date |
rr_BarChartYearToDateReturnDate |
Sep. 30, 2017
|
|
| Highest Quarterly Return, Label |
rr_HighestQuarterlyReturnLabel |
Highest Quarter: 1st Quarter 2009
|
|
| Highest Quarterly Return |
rr_BarChartHighestQuarterlyReturn |
3.01%
|
|
| Highest Quarterly Return, Date |
rr_BarChartHighestQuarterlyReturnDate |
Mar. 31, 2009
|
|
| Lowest Quarterly Return, Label |
rr_LowestQuarterlyReturnLabel |
Lowest Quarter: 4th Quarter 2008
|
|
| Lowest Quarterly Return |
rr_BarChartLowestQuarterlyReturn |
(2.80%)
|
|
| Lowest Quarterly Return, Date |
rr_BarChartLowestQuarterlyReturnDate |
Dec. 31, 2008
|
|
| 1 Year |
rr_AverageAnnualReturnYear01 |
(1.50%)
|
|
| 5 Years |
rr_AverageAnnualReturnYear05 |
0.18%
|
|
| 10 Years |
rr_AverageAnnualReturnYear10 |
1.51%
|
|
| Inception Date of Share Class |
rr_AverageAnnualReturnInceptionDate |
Jun. 30, 2000
|
|
| (WFA Income Funds - Classes A and C) | (Wells Fargo Adjustable Rate Government Fund) | Class A | (after taxes on distributions) |
|
|
|
| Prospectus: |
rr_ProspectusTable |
|
|
| 1 Year |
rr_AverageAnnualReturnYear01 |
(1.75%)
|
|
| 5 Years |
rr_AverageAnnualReturnYear05 |
(0.10%)
|
|
| 10 Years |
rr_AverageAnnualReturnYear10 |
0.80%
|
|
| Inception Date of Share Class |
rr_AverageAnnualReturnInceptionDate |
Jun. 30, 2000
|
|
| (WFA Income Funds - Classes A and C) | (Wells Fargo Adjustable Rate Government Fund) | Class A | (after taxes on distributions and the sale of Fund Shares) |
|
|
|
| Prospectus: |
rr_ProspectusTable |
|
|
| 1 Year |
rr_AverageAnnualReturnYear01 |
(0.85%)
|
|
| 5 Years |
rr_AverageAnnualReturnYear05 |
0.02%
|
|
| 10 Years |
rr_AverageAnnualReturnYear10 |
0.90%
|
|
| Inception Date of Share Class |
rr_AverageAnnualReturnInceptionDate |
Jun. 30, 2000
|
|
| (WFA Income Funds - Classes A and C) | (Wells Fargo Adjustable Rate Government Fund) | Class C |
|
|
|
| Prospectus: |
rr_ProspectusTable |
|
|
| Maximum sales charge (load) imposed on purchases (as a percentage of offering price) |
rr_MaximumSalesChargeImposedOnPurchasesOverOfferingPrice |
none
|
|
| Maximum deferred sales charge (load) (as a percentage of offering price) |
rr_MaximumDeferredSalesChargeOverOfferingPrice |
1.00%
|
|
| Management Fees |
rr_ManagementFeesOverAssets |
0.35%
|
|
| Distribution (12b-1) Fees |
rr_DistributionAndService12b1FeesOverAssets |
0.75%
|
|
| Other Expenses |
rr_OtherExpensesOverAssets |
0.45%
|
|
| Total Annual Fund Operating Expenses |
rr_ExpensesOverAssets |
1.55%
|
|
| Fee Waivers |
rr_FeeWaiverOrReimbursementOverAssets |
(0.06%)
|
|
| Total Annual Fund Operating Expenses After Fee Waivers |
rr_NetExpensesOverAssets |
1.49%
|
[3] |
| Expense Example, with Redemption, 1 Year |
rr_ExpenseExampleYear01 |
$ 252
|
|
| Expense Example, with Redemption, 3 Years |
rr_ExpenseExampleYear03 |
484
|
|
| Expense Example, with Redemption, 5 Years |
rr_ExpenseExampleYear05 |
839
|
|
| Expense Example, with Redemption, 10 Years |
rr_ExpenseExampleYear10 |
1,840
|
|
| Expense Example, No Redemption, 1 Year |
rr_ExpenseExampleNoRedemptionYear01 |
152
|
|
| Expense Example, No Redemption, 3 Years |
rr_ExpenseExampleNoRedemptionYear03 |
484
|
|
| Expense Example, No Redemption, 5 Years |
rr_ExpenseExampleNoRedemptionYear05 |
839
|
|
| Expense Example, No Redemption, 10 Years |
rr_ExpenseExampleNoRedemptionYear10 |
$ 1,840
|
|
| 1 Year |
rr_AverageAnnualReturnYear01 |
(1.29%)
|
|
| 5 Years |
rr_AverageAnnualReturnYear05 |
(0.16%)
|
|
| 10 Years |
rr_AverageAnnualReturnYear10 |
0.96%
|
|
| Inception Date of Share Class |
rr_AverageAnnualReturnInceptionDate |
Jun. 30, 2000
|
|
| (WFA Income Funds - Classes A and C) | (Wells Fargo Core Plus Bond Fund) |
|
|
|
| Prospectus: |
rr_ProspectusTable |
|
|
| Objective [Heading] |
rr_ObjectiveHeading |
Investment Objective
|
|
| Objective, Primary [Text Block] |
rr_ObjectivePrimaryTextBlock |
The Fund seeks total return, consisting of current income and capital appreciation.
|
|
| Expense [Heading] |
rr_ExpenseHeading |
Fees and Expenses
|
|
| Expense Narrative [Text Block] |
rr_ExpenseNarrativeTextBlock |
These tables are intended to help you understand the various costs and expenses you will pay if you buy and hold shares of the Fund. You may qualify for sales charge discounts if you and your family invest, or agree to invest in the future, at least $50,000 in the aggregate in specified classes of certain Wells Fargo Funds. More information about these and other discounts is available from your financial professional and in "Share Class Features" and "Reductions and Waivers of Sales Charges" on pages 52 and 54 of the Prospectus and "Additional Purchase and Redemption Information" on page 71 of the Statement of Additional Information. Investors who purchase through certain intermediaries may be subject to different sales charge discounts than those outlined shares in these sections. Please see Appendix A on page 74 for further information.
|
|
| Expense Breakpoint Discounts [Text] |
rr_ExpenseBreakpointDiscounts |
You may qualify for sales charge discounts if you and your family invest, or agree to invest in the future, at least $50,000 in the aggregate in specified classes of certain Wells Fargo Funds.
|
|
| Expense Breakpoint, Minimum Investment Required [Amount] |
rr_ExpenseBreakpointMinimumInvestmentRequiredAmount |
$ 50,000
|
|
| Shareholder Fees Caption [Text] |
rr_ShareholderFeesCaption |
Shareholder Fees (fees paid directly from your investment)
|
|
| Operating Expenses Caption [Text] |
rr_OperatingExpensesCaption |
Annual Fund Operating Expenses (expenses that you pay each year as a percentage of the value of your investment)
|
[4] |
| Fee Waiver or Reimbursement over Assets, Date of Termination |
rr_FeeWaiverOrReimbursementOverAssetsDateOfTermination |
December 31, 2018
|
|
| Expenses Restated to Reflect Current [Text] |
rr_ExpensesRestatedToReflectCurrent |
Expenses have been adjusted as necessary from amounts incurred during the Fund's most recent fiscal year to reflect current fees and expenses.
|
|
| Expenses Deferred Charges [Text Block] |
rr_ExpensesDeferredChargesTextBlock |
Investments of $1 million or more are not subject to a front-end sales charge but generally will be subject to a deferred sales charge of 1.00% if redeemed within 18 months from the date of purchase.
|
|
| Expense Example [Heading] |
rr_ExpenseExampleHeading |
Example of Expenses
|
|
| Expense Example Narrative [Text Block] |
rr_ExpenseExampleNarrativeTextBlock |
The example below is intended to help you compare the costs of investing in the Fund with the costs of investing in other mutual funds. The example assumes a $10,000 initial investment, 5% annual total return, and that fees and expenses remain the same as in the tables above. To the extent that the Manager is waiving fees or reimbursing expenses, the example assumes that such waiver or reimbursement will only be in place through the date noted above. Although your actual costs may be higher or lower, based on these assumptions your costs would be:
|
|
| Expense Example by, Year, Caption [Text] |
rr_ExpenseExampleByYearCaption |
Assuming Redemption at End of Period
|
|
| Expense Example, No Redemption, By Year, Caption [Text] |
rr_ExpenseExampleNoRedemptionByYearCaption |
Assuming No Redemption
|
|
| Portfolio Turnover [Heading] |
rr_PortfolioTurnoverHeading |
Portfolio Turnover
|
|
| Portfolio Turnover [Text Block] |
rr_PortfolioTurnoverTextBlock |
The Fund pays transaction costs, such as commissions, when it buys and sells securities (or "turns over" its portfolio). A higher portfolio turnover rate may indicate higher transaction costs and may result in higher taxes when Fund shares are held in a taxable account. These costs, which are not reflected in annual fund operating expenses or in the example, affect the Fund's performance. During the most recent fiscal year, the Fund's portfolio turnover rate was 199% of the average value of its portfolio.
|
|
| Portfolio Turnover, Rate |
rr_PortfolioTurnoverRate |
199.00%
|
|
| Strategy [Heading] |
rr_StrategyHeading |
Principal Investment Strategies
|
|
| Strategy Narrative [Text Block] |
rr_StrategyNarrativeTextBlock |
Under normal circumstances, we invest:
-
at least 80% of the Fund's net assets in debt securities;
-
up to 35% of the Fund's total assets in debt securities that are below investment-grade; and
-
up to 25% of the Fund's total assets in debt securities of foreign issuers, including emerging markets issuers and debt securities denominated in foreign currencies.
We invest principally in debt securities, including corporate, mortgage- and asset-backed securities, bank loans, foreign sovereign debt, supranational agencies, and U.S. Government obligations. These securities may have fixed, floating or variable rates and may include debt securities of both domestic and foreign issuers. We invest in both investment-grade and below investment-grade debt securities (often called "high yield" securities or "junk bonds"), including unrated securities, as well as securities that are in default at the time of purchase.
We may invest in debt securities of foreign issuers, including emerging markets issuers, denominated in any currency. We may seek to add yield by having exposures to a variety of credits, mortgages, and higher yielding countries and currencies. We may also use futures and swap agreements to manage risk or to enhance return. We may enter into currency-related transactions through derivative instruments, including currency and cross currency forwards. The use of derivative currency transactions is intended to allow the Fund to manage, hedge or reduce a foreign currency-specific risk exposure of a portfolio security or its denominated currency or to obtain net long exposure to selected currencies for the purpose of generating income or additional returns.
While we may purchase securities of any maturity or duration, under normal circumstances, we expect to maintain an overall portfolio dollar-weighted average effective duration that is within 1 year of that of the Fund's benchmark. The Fund's benchmark, the Bloomberg Barclays U.S. Aggregate Bond Index, had a duration of 5.90 years, as of November 30, 2017. "Dollar-Weighted Average Effective Duration" is an aggregate measure of the sensitivity of a fund's fixed income portfolio securities to changes in interest rates. As a general matter, the price of a fixed income security with a longer effective duration will fluctuate more in response to changes in interest rates than the price of a fixed income security with a shorter effective duration.
|
|
| Risk [Heading] |
rr_RiskHeading |
Principal Investment Risks
|
|
| Risk Narrative [Text Block] |
rr_RiskNarrativeTextBlock |
An investment in the Fund may lose money, is not a deposit of Wells Fargo Bank, N.A. or its affiliates, is not insured or guaranteed by the Federal Deposit Insurance Corporation or any other governmental agency, and is primarily subject to the risks briefly summarized below.
Credit Risk. The issuer or guarantor of a debt security may be unable or perceived to be unable to pay interest or repay principal when they become due, which could cause the value of an investment to decline and a Fund to lose money.
Derivatives Risk. The use of derivatives, such as futures, options and swap agreements, can lead to losses, including those magnified by leverage, particularly when derivatives are used to enhance return rather than mitigate risk. Certain derivative instruments may be difficult to sell when the portfolio manager believes it would be appropriate to do so, or the other party to a derivative contract may be unwilling or unable to fulfill its contractual obligations.
Emerging Markets Risk. Emerging market securities typically present even greater exposure to the risks described under "Foreign Investment Risk" and may be particularly sensitive to global economic conditions. Emerging market securities are also typically less liquid than securities of developed countries and could be difficult to sell, particularly during a market downturn.
Foreign Currency Contracts Risk. A Fund that enters into forwards or other foreign currency contracts, which are a type of derivative, is subject to the risk that the portfolio manager may be incorrect in his or her judgment of future exchange rate changes.
Foreign Investment Risk. Foreign investments may be subject to lower liquidity, greater price volatility and risks related to adverse political, regulatory, market or economic developments. Foreign investments may involve exposure to changes in foreign currency exchange rates and may be subject to higher withholding and other taxes.
Futures Contracts Risk. A Fund that uses futures contracts, which are a type of derivative, is subject to the risk of loss caused by unanticipated market movements. In addition, there may at times be an imperfect correlation between the movement in the prices of futures contracts and the value of their underlying instruments or indexes and there may at times not be a liquid secondary market for certain futures contracts.
High Yield Securities Risk. High yield securities and unrated securities of similar credit quality (commonly known as "junk bonds") have a much greater risk of default or of not returning principal and their values tend to be more volatile than higher-rated securities with similar maturities.
Interest Rate Risk. When interest rates (which are currently near historic lows) rise, the value of debt securities tends to fall. When interest rates decline, interest that a Fund is able to earn on its investments in debt securities may also decline, but the value of those securities may increase.
Loan Risk. Loans may be unrated, less liquid and more difficult to value than traditional debt securities. The highly leveraged capital structure of the borrowers in such transactions may make such loans especially vulnerable to adverse changes in financial, economic or market conditions. A Fund may be unable to sell loans at a desired time or price. The Fund may also not be able to control amendments, waivers or the exercise of any remedies that a lender would have under a direct loan and may assume liability as a lender.
Management Risk. Investment decisions, techniques, analyses or models implemented by a Fund's manager or sub-adviser in seeking to achieve the Fund's investment objective may not produce the returns expected, may cause the Fund's shares to lose value or may cause the Fund to underperform other funds with similar investment objectives.
Market Risk. The values of, and/or the income generated by, securities held by a Fund may decline due to general market conditions or other factors, including those directly involving the issuers of such securities. Security markets are volatile and may decline significantly in response to adverse issuer, regulatory, political, or economic developments. Different sectors of the market and different security types may react differently to such developments.
Mortgage- and Asset-Backed Securities Risk. Mortgage- and asset-backed securities may decline in value and become less liquid when defaults on the underlying mortgages or assets occur and may exhibit additional volatility in periods of rising interest rates. Rising interest rates tend to extend the duration of these securities, making them more sensitive to changes in interest rates than instruments with fixed payment schedules. When interest rates decline or are low, the prepayment of mortgages or assets underlying such securities can reduce a Fund's returns.
Swaps Risk. Depending on their structure, swap agreements and options to enter into swap agreements ("swaptions"), both of which are types of derivatives, may increase or decrease a Fund's exposure to long- or short-term interest rates, foreign currency values, mortgage-backed securities, corporate borrowing rates, or credit events or other reference points such as security prices or inflation rates.
U.S. Government Obligations Risk. U.S. Government obligations may be adversely impacted by changes in interest rates, and securities issued or guaranteed by U.S. Government agencies or government-sponsored entities may not be backed by the full faith and credit of the U.S. Government.
|
|
| Risk Lose Money [Text] |
rr_RiskLoseMoney |
An investment in the Fund may lose money
|
|
| Risk Not Insured Depository Institution [Text] |
rr_RiskNotInsuredDepositoryInstitution |
An investment in the Fund may lose money, is not a deposit of Wells Fargo Bank, N.A. or its affiliates, is not insured or guaranteed by the Federal Deposit Insurance Corporation or any other governmental agency
|
|
| Bar Chart and Performance Table [Heading] |
rr_BarChartAndPerformanceTableHeading |
Performance
|
|
| Performance Narrative [Text Block] |
rr_PerformanceNarrativeTextBlock |
The following information provides some indication of the risks of investing in the Fund by showing changes in the Fund's performance from year to year. The Fund's average annual total returns are compared to the performance of one or more indices. Past performance before and after taxes is no guarantee of future results. Current month-end performance is available on the Fund's website at wellsfargofunds.com.
|
|
| Bar Chart Does Not Reflect Sales Loads [Text] |
rr_BarChartDoesNotReflectSalesLoads |
Returns do not reflect sales charges and would be lower if they did
|
|
| Bar Chart Closing [Text Block] |
rr_BarChartClosingTextBlock |
Highest Quarter: 3rd Quarter 2009 | +5.53% | | Lowest Quarter: 2nd Quarter 2013 | -2.73% | Year-to-date total return as of 9/30/2017 is +4.71% |
|
|
| Performance Table Heading |
rr_PerformanceTableHeading |
Average Annual Total Returns for the periods ended 12/31/2016 (returns reflect applicable sales charges)
|
|
| Performance Table Closing [Text Block] |
rr_PerformanceTableClosingTextBlock |
After-tax returns are calculated using the historical highest individual federal marginal income tax rates and do not reflect the impact of state, local or foreign taxes. Actual after-tax returns depend on an investor's tax situation and may differ from those shown, and after-tax returns shown are not relevant to tax-exempt investors or investors who hold their Fund shares through tax-deferred arrangements, such as 401(k) Plans or Individual Retirement Accounts. After-tax returns are shown for only one class of shares. After-tax returns for any other class will vary.
|
|
| Performance Table Does Reflect Sales Loads |
rr_PerformanceTableDoesReflectSalesLoads |
returns reflect applicable sales charges
|
|
| Performance Table Uses Highest Federal Rate |
rr_PerformanceTableUsesHighestFederalRate |
After-tax returns are calculated using the historical highest individual federal marginal income tax rates and do not reflect the impact of state, local or foreign taxes.
|
|
| Performance Table Not Relevant to Tax Deferred |
rr_PerformanceTableNotRelevantToTaxDeferred |
Actual after-tax returns depend on an investor's tax situation and may differ from those shown, and after-tax returns shown are not relevant to tax-exempt investors or investors who hold their Fund shares through tax-deferred arrangements, such as 401(k) Plans or Individual Retirement Accounts.
|
|
| Performance Past Does Not Indicate Future [Text] |
rr_PerformancePastDoesNotIndicateFuture |
Past performance before and after taxes is no guarantee of future results.
|
|
| Performance Information Illustrates Variability of Returns [Text] |
rr_PerformanceInformationIllustratesVariabilityOfReturns |
The following information provides some indication of the risks of investing in the Fund by showing changes in the Fund's performance from year to year. The Fund's average annual total returns are compared to the performance of one or more indices. Past performance before and after taxes is no guarantee of future results.
|
|
| Performance Table One Class of after Tax Shown [Text] |
rr_PerformanceTableOneClassOfAfterTaxShown |
After-tax returns are shown for only one class of shares.
|
|
| Performance Availability Website Address [Text] |
rr_PerformanceAvailabilityWebSiteAddress |
wellsfargofunds.com
|
|
| (WFA Income Funds - Classes A and C) | (Wells Fargo Core Plus Bond Fund) | Bloomberg Barclays U.S. Aggregate Bond Index (reflects no deduction for fees, expenses, or taxes) |
|
|
|
| Prospectus: |
rr_ProspectusTable |
|
|
| 1 Year |
rr_AverageAnnualReturnYear01 |
2.65%
|
|
| 5 Years |
rr_AverageAnnualReturnYear05 |
2.23%
|
|
| 10 Years |
rr_AverageAnnualReturnYear10 |
4.34%
|
|
| (WFA Income Funds - Classes A and C) | (Wells Fargo Core Plus Bond Fund) | Class A |
|
|
|
| Prospectus: |
rr_ProspectusTable |
|
|
| Maximum sales charge (load) imposed on purchases (as a percentage of offering price) |
rr_MaximumSalesChargeImposedOnPurchasesOverOfferingPrice |
4.50%
|
|
| Maximum deferred sales charge (load) (as a percentage of offering price) |
rr_MaximumDeferredSalesChargeOverOfferingPrice |
none
|
[5] |
| Management Fees |
rr_ManagementFeesOverAssets |
0.45%
|
|
| Distribution (12b-1) Fees |
rr_DistributionAndService12b1FeesOverAssets |
none
|
|
| Other Expenses |
rr_OtherExpensesOverAssets |
0.48%
|
|
| Acquired Fund Fees and Expenses |
rr_AcquiredFundFeesAndExpensesOverAssets |
0.01%
|
|
| Total Annual Fund Operating Expenses |
rr_ExpensesOverAssets |
0.94%
|
|
| Fee Waivers |
rr_FeeWaiverOrReimbursementOverAssets |
(0.20%)
|
|
| Total Annual Fund Operating Expenses After Fee Waivers |
rr_NetExpensesOverAssets |
0.74%
|
[6] |
| Expense Example, with Redemption, 1 Year |
rr_ExpenseExampleYear01 |
$ 522
|
|
| Expense Example, with Redemption, 3 Years |
rr_ExpenseExampleYear03 |
717
|
|
| Expense Example, with Redemption, 5 Years |
rr_ExpenseExampleYear05 |
928
|
|
| Expense Example, with Redemption, 10 Years |
rr_ExpenseExampleYear10 |
$ 1,535
|
|
| Bar Chart [Heading] |
rr_BarChartHeading |
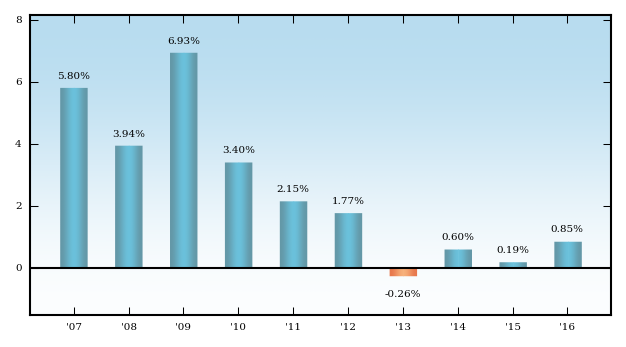
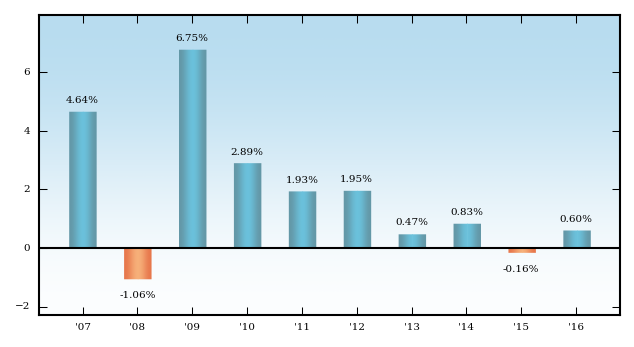
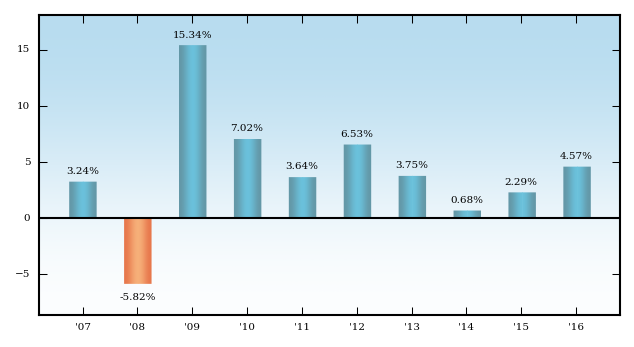
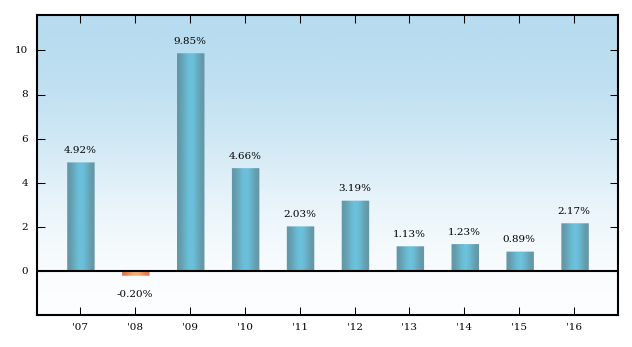
Calendar Year Total Returns for Class A as of 12/31 each year (Returns do not reflect sales charges and would be lower if they did)
|
|
| Annual Return 2007 |
rr_AnnualReturn2007 |
6.24%
|
|
| Annual Return 2008 |
rr_AnnualReturn2008 |
2.29%
|
|
| Annual Return 2009 |
rr_AnnualReturn2009 |
11.87%
|
|
| Annual Return 2010 |
rr_AnnualReturn2010 |
7.98%
|
|
| Annual Return 2011 |
rr_AnnualReturn2011 |
7.77%
|
|
| Annual Return 2012 |
rr_AnnualReturn2012 |
5.59%
|
|
| Annual Return 2013 |
rr_AnnualReturn2013 |
(1.52%)
|
|
| Annual Return 2014 |
rr_AnnualReturn2014 |
6.47%
|
|
| Annual Return 2015 |
rr_AnnualReturn2015 |
(0.05%)
|
|
| Annual Return 2016 |
rr_AnnualReturn2016 |
5.75%
|
|
| Year to Date Return, Label |
rr_YearToDateReturnLabel |
Year-to-date total return as of 9/30/2017 is +4.71%
|
|
| Bar Chart, Year to Date Return |
rr_BarChartYearToDateReturn |
4.71%
|
|
| Bar Chart, Year to Date Return, Date |
rr_BarChartYearToDateReturnDate |
Sep. 30, 2017
|
|
| Highest Quarterly Return, Label |
rr_HighestQuarterlyReturnLabel |
Highest Quarter: 3rd Quarter 2009
|
|
| Highest Quarterly Return |
rr_BarChartHighestQuarterlyReturn |
5.53%
|
|
| Highest Quarterly Return, Date |
rr_BarChartHighestQuarterlyReturnDate |
Sep. 30, 2009
|
|
| Lowest Quarterly Return, Label |
rr_LowestQuarterlyReturnLabel |
Lowest Quarter: 2nd Quarter 2013
|
|
| Lowest Quarterly Return |
rr_BarChartLowestQuarterlyReturn |
(2.73%)
|
|
| Lowest Quarterly Return, Date |
rr_BarChartLowestQuarterlyReturnDate |
Jun. 30, 2013
|
|
| 1 Year |
rr_AverageAnnualReturnYear01 |
1.02%
|
|
| 5 Years |
rr_AverageAnnualReturnYear05 |
2.25%
|
|
| 10 Years |
rr_AverageAnnualReturnYear10 |
4.69%
|
|
| Inception Date of Share Class |
rr_AverageAnnualReturnInceptionDate |
Jul. 13, 1998
|
|
| (WFA Income Funds - Classes A and C) | (Wells Fargo Core Plus Bond Fund) | Class A | (after taxes on distributions) |
|
|
|
| Prospectus: |
rr_ProspectusTable |
|
|
| 1 Year |
rr_AverageAnnualReturnYear01 |
(0.18%)
|
|
| 5 Years |
rr_AverageAnnualReturnYear05 |
1.16%
|
|
| 10 Years |
rr_AverageAnnualReturnYear10 |
3.35%
|
|
| Inception Date of Share Class |
rr_AverageAnnualReturnInceptionDate |
Jul. 13, 1998
|
|
| (WFA Income Funds - Classes A and C) | (Wells Fargo Core Plus Bond Fund) | Class A | (after taxes on distributions and the sale of Fund Shares) |
|
|
|
| Prospectus: |
rr_ProspectusTable |
|
|
| 1 Year |
rr_AverageAnnualReturnYear01 |
0.59%
|
|
| 5 Years |
rr_AverageAnnualReturnYear05 |
1.31%
|
|
| 10 Years |
rr_AverageAnnualReturnYear10 |
3.14%
|
|
| Inception Date of Share Class |
rr_AverageAnnualReturnInceptionDate |
Jul. 13, 1998
|
|
| (WFA Income Funds - Classes A and C) | (Wells Fargo Core Plus Bond Fund) | Class C |
|
|
|
| Prospectus: |
rr_ProspectusTable |
|
|
| Maximum sales charge (load) imposed on purchases (as a percentage of offering price) |
rr_MaximumSalesChargeImposedOnPurchasesOverOfferingPrice |
none
|
|
| Maximum deferred sales charge (load) (as a percentage of offering price) |
rr_MaximumDeferredSalesChargeOverOfferingPrice |
1.00%
|
|
| Management Fees |
rr_ManagementFeesOverAssets |
0.45%
|
|
| Distribution (12b-1) Fees |
rr_DistributionAndService12b1FeesOverAssets |
0.75%
|
|
| Other Expenses |
rr_OtherExpensesOverAssets |
0.48%
|
|
| Acquired Fund Fees and Expenses |
rr_AcquiredFundFeesAndExpensesOverAssets |
0.01%
|
|
| Total Annual Fund Operating Expenses |
rr_ExpensesOverAssets |
1.69%
|
|
| Fee Waivers |
rr_FeeWaiverOrReimbursementOverAssets |
(0.20%)
|
|
| Total Annual Fund Operating Expenses After Fee Waivers |
rr_NetExpensesOverAssets |
1.49%
|
[6] |
| Expense Example, with Redemption, 1 Year |
rr_ExpenseExampleYear01 |
$ 252
|
|
| Expense Example, with Redemption, 3 Years |
rr_ExpenseExampleYear03 |
513
|
|
| Expense Example, with Redemption, 5 Years |
rr_ExpenseExampleYear05 |
899
|
|
| Expense Example, with Redemption, 10 Years |
rr_ExpenseExampleYear10 |
1,981
|
|
| Expense Example, No Redemption, 1 Year |
rr_ExpenseExampleNoRedemptionYear01 |
152
|
|
| Expense Example, No Redemption, 3 Years |
rr_ExpenseExampleNoRedemptionYear03 |
513
|
|
| Expense Example, No Redemption, 5 Years |
rr_ExpenseExampleNoRedemptionYear05 |
899
|
|
| Expense Example, No Redemption, 10 Years |
rr_ExpenseExampleNoRedemptionYear10 |
$ 1,981
|
|
| 1 Year |
rr_AverageAnnualReturnYear01 |
3.90%
|
|
| 5 Years |
rr_AverageAnnualReturnYear05 |
2.43%
|
|
| 10 Years |
rr_AverageAnnualReturnYear10 |
4.38%
|
|
| Inception Date of Share Class |
rr_AverageAnnualReturnInceptionDate |
Jul. 13, 1998
|
|
| (WFA Income Funds - Classes A and C) | (Wells Fargo Government Securities Fund) |
|
|
|
| Prospectus: |
rr_ProspectusTable |
|
|
| Objective [Heading] |
rr_ObjectiveHeading |
Investment Objective
|
|
| Objective, Primary [Text Block] |
rr_ObjectivePrimaryTextBlock |
The Fund seeks current income.
|
|
| Expense [Heading] |
rr_ExpenseHeading |
Fees and Expenses
|
|
| Expense Narrative [Text Block] |
rr_ExpenseNarrativeTextBlock |
These tables are intended to help you understand the various costs and expenses you will pay if you buy and hold shares of the Fund. You may qualify for sales charge discounts if you and your family invest, or agree to invest in the future, at least $50,000 in the aggregate in specified classes of certain Wells Fargo Funds. More information about these and other discounts is available from your financial professional and in "Share Class Features" and "Reductions and Waivers of Sales Charges" on pages 52 and 54 of the Prospectus and "Additional Purchase and Redemption Information" on page 71 of the Statement of Additional Information. Investors who purchase through certain intermediaries may be subject to different sales charge discounts than those outlined shares in these sections. Please see Appendix A on page 74 for further information.
|
|
| Expense Breakpoint Discounts [Text] |
rr_ExpenseBreakpointDiscounts |
You may qualify for sales charge discounts if you and your family invest, or agree to invest in the future, at least $50,000 in the aggregate in specified classes of certain Wells Fargo Funds.
|
|
| Expense Breakpoint, Minimum Investment Required [Amount] |
rr_ExpenseBreakpointMinimumInvestmentRequiredAmount |
$ 50,000
|
|
| Shareholder Fees Caption [Text] |
rr_ShareholderFeesCaption |
Shareholder Fees (fees paid directly from your investment)
|
|
| Operating Expenses Caption [Text] |
rr_OperatingExpensesCaption |
Annual Fund Operating Expenses (expenses that you pay each year as a percentage of the value of your investment)
|
[4] |
| Fee Waiver or Reimbursement over Assets, Date of Termination |
rr_FeeWaiverOrReimbursementOverAssetsDateOfTermination |
December 31, 2018
|
|
| Expenses Restated to Reflect Current [Text] |
rr_ExpensesRestatedToReflectCurrent |
Expenses have been adjusted as necessary from amounts incurred during the Fund's most recent fiscal year to reflect current fees and expenses.
|
|
| Expenses Deferred Charges [Text Block] |
rr_ExpensesDeferredChargesTextBlock |
Investments of $1 million or more are not subject to a front-end sales charge but generally will be subject to a deferred sales charge of 1.00% if redeemed within 18 months from the date of purchase.
|
|
| Expense Example [Heading] |
rr_ExpenseExampleHeading |
Example of Expenses
|
|
| Expense Example Narrative [Text Block] |
rr_ExpenseExampleNarrativeTextBlock |
The example below is intended to help you compare the costs of investing in the Fund with the costs of investing in other mutual funds. The example assumes a $10,000 initial investment, 5% annual total return, and that fees and expenses remain the same as in the tables above. To the extent that the Manager is waiving fees or reimbursing expenses, the example assumes that such waiver or reimbursement will only be in place through the date noted above. Although your actual costs may be higher or lower, based on these assumptions your costs would be:
|
|
| Expense Example by, Year, Caption [Text] |
rr_ExpenseExampleByYearCaption |
Assuming Redemption at End of Period
|
|
| Expense Example, No Redemption, By Year, Caption [Text] |
rr_ExpenseExampleNoRedemptionByYearCaption |
Assuming No Redemption
|
|
| Portfolio Turnover [Heading] |
rr_PortfolioTurnoverHeading |
Portfolio Turnover
|
|
| Portfolio Turnover [Text Block] |
rr_PortfolioTurnoverTextBlock |
The Fund pays transaction costs, such as commissions, when it buys and sells securities (or "turns over" its portfolio). A higher portfolio turnover rate may indicate higher transaction costs and may result in higher taxes when Fund shares are held in a taxable account. These costs, which are not reflected in annual fund operating expenses or in the example, affect the Fund's performance. During the most recent fiscal year, the Fund's portfolio turnover rate was 299% of the average value of its portfolio.
|
|
| Portfolio Turnover, Rate |
rr_PortfolioTurnoverRate |
299.00%
|
|
| Strategy [Heading] |
rr_StrategyHeading |
Principal Investment Strategies
|
|
| Strategy Narrative [Text Block] |
rr_StrategyNarrativeTextBlock |
Under normal circumstances, we invest:
-
at least 80% of the Fund's net assets in U.S. Government obligations and repurchase agreements collateralized by U.S. Government obligations; and
-
up to 20% of the Fund's net assets in non-government investment-grade debt securities.
We invest principally in U.S. Government obligations, including debt securities issued or guaranteed by the U.S. Treasury, U.S. Government agencies or government-sponsored entities. These securities may have fixed, floating or variable rates and also include mortgage-backed securities. As part of our mortgage-backed securities investment strategy, we may enter into dollar rolls. We may also use futures for duration and yield curve management.
We employ a top-down, macroeconomic outlook to determine the portfolio's duration, yield curve positioning and sector allocation. Macroeconomic factors considered may include, among others, the pace of economic growth, employment conditions, inflation, monetary and fiscal policy, as well as the influence of international economic and financial conditions. In combination with our top-down, macroeconomic approach, we employ a bottom-up process of fundamental securities analysis to select the specific securities for investment. Elements of this evaluation may include duration measurements, historical yield spread relationships, volatility trends, mortgage refinance rates, as well as other factors. We may sell a security due to changes in our outlook, as well as changes in portfolio strategy or cash flow needs. A security may also be sold and replaced with one that presents a better value or risk/reward profile.
|
|
| Risk [Heading] |
rr_RiskHeading |
Principal Investment Risks
|
|
| Risk Narrative [Text Block] |
rr_RiskNarrativeTextBlock |
An investment in the Fund may lose money, is not a deposit of Wells Fargo Bank, N.A. or its affiliates, is not insured or guaranteed by the Federal Deposit Insurance Corporation or any other governmental agency, and is primarily subject to the risks briefly summarized below.
Credit Risk. The issuer or guarantor of a debt security may be unable or perceived to be unable to pay interest or repay principal when they become due, which could cause the value of an investment to decline and a Fund to lose money.
Derivatives Risk. The use of derivatives, such as futures, options and swap agreements, can lead to losses, including those magnified by leverage, particularly when derivatives are used to enhance return rather than mitigate risk. Certain derivative instruments may be difficult to sell when the portfolio manager believes it would be appropriate to do so, or the other party to a derivative contract may be unwilling or unable to fulfill its contractual obligations.
Futures Contracts Risk. A Fund that uses futures contracts, which are a type of derivative, is subject to the risk of loss caused by unanticipated market movements. In addition, there may at times be an imperfect correlation between the movement in the prices of futures contracts and the value of their underlying instruments or indexes and there may at times not be a liquid secondary market for certain futures contracts.
Interest Rate Risk. When interest rates (which are currently near historic lows) rise, the value of debt securities tends to fall. When interest rates decline, interest that a Fund is able to earn on its investments in debt securities may also decline, but the value of those securities may increase.
Management Risk. Investment decisions, techniques, analyses or models implemented by a Fund's manager or sub-adviser in seeking to achieve the Fund's investment objective may not produce the returns expected, may cause the Fund's shares to lose value or may cause the Fund to underperform other funds with similar investment objectives.
Market Risk. The values of, and/or the income generated by, securities held by a Fund may decline due to general market conditions or other factors, including those directly involving the issuers of such securities. Security markets are volatile and may decline significantly in response to adverse issuer, regulatory, political, or economic developments. Different sectors of the market and different security types may react differently to such developments.
Mortgage- and Asset-Backed Securities Risk. Mortgage- and asset-backed securities may decline in value and become less liquid when defaults on the underlying mortgages or assets occur and may exhibit additional volatility in periods of rising interest rates. Rising interest rates tend to extend the duration of these securities, making them more sensitive to changes in interest rates than instruments with fixed payment schedules. When interest rates decline or are low, the prepayment of mortgages or assets underlying such securities can reduce a Fund's returns.
U.S. Government Obligations Risk. U.S. Government obligations may be adversely impacted by changes in interest rates, and securities issued or guaranteed by U.S. Government agencies or government-sponsored entities may not be backed by the full faith and credit of the U.S. Government.
|
|
| Risk Lose Money [Text] |
rr_RiskLoseMoney |
An investment in the Fund may lose money
|
|
| Risk Not Insured Depository Institution [Text] |
rr_RiskNotInsuredDepositoryInstitution |
An investment in the Fund may lose money, is not a deposit of Wells Fargo Bank, N.A. or its affiliates, is not insured or guaranteed by the Federal Deposit Insurance Corporation or any other governmental agency
|
|
| Bar Chart and Performance Table [Heading] |
rr_BarChartAndPerformanceTableHeading |
Performance
|
|
| Performance Narrative [Text Block] |
rr_PerformanceNarrativeTextBlock |
The following information provides some indication of the risks of investing in the Fund by showing changes in the Fund's performance from year to year. The Fund's average annual total returns are compared to the performance of one or more indices. Past performance before and after taxes is no guarantee of future results. Current month-end performance is available on the Fund's website at wellsfargofunds.com.
|
|
| Bar Chart Does Not Reflect Sales Loads [Text] |
rr_BarChartDoesNotReflectSalesLoads |
Returns do not reflect sales charges and would be lower if they did
|
|
| Bar Chart Closing [Text Block] |
rr_BarChartClosingTextBlock |
Highest Quarter: 4th Quarter 2008 | +4.44% | | Lowest Quarter: 4th Quarter 2016 | -3.12% | Year-to-date total return as of 9/30/2017 is +2.00% |
|
|
| Performance Table Heading |
rr_PerformanceTableHeading |
Average Annual Total Returns for the periods ended 12/31/2016 (returns reflect applicable sales charges)
|
[7] |
| Performance Table Closing [Text Block] |
rr_PerformanceTableClosingTextBlock |
After-tax returns are calculated using the historical highest individual federal marginal income tax rates and do not reflect the impact of state, local or foreign taxes. Actual after-tax returns depend on an investor's tax situation and may differ from those shown, and after-tax returns shown are not relevant to tax-exempt investors or investors who hold their Fund shares through tax-deferred arrangements, such as 401(k) Plans or Individual Retirement Accounts. After-tax returns are shown for only one class of shares. After-tax returns for any other class will vary.
|
|
| Performance Table Does Reflect Sales Loads |
rr_PerformanceTableDoesReflectSalesLoads |
returns reflect applicable sales charges
|
|
| Performance Table Uses Highest Federal Rate |
rr_PerformanceTableUsesHighestFederalRate |
After-tax returns are calculated using the historical highest individual federal marginal income tax rates and do not reflect the impact of state, local or foreign taxes.
|
|
| Performance Table Not Relevant to Tax Deferred |
rr_PerformanceTableNotRelevantToTaxDeferred |
Actual after-tax returns depend on an investor's tax situation and may differ from those shown, and after-tax returns shown are not relevant to tax-exempt investors or investors who hold their Fund shares through tax-deferred arrangements, such as 401(k) Plans or Individual Retirement Accounts.
|
|
| Performance Past Does Not Indicate Future [Text] |
rr_PerformancePastDoesNotIndicateFuture |
Past performance before and after taxes is no guarantee of future results.
|
|
| Performance Information Illustrates Variability of Returns [Text] |
rr_PerformanceInformationIllustratesVariabilityOfReturns |
The following information provides some indication of the risks of investing in the Fund by showing changes in the Fund's performance from year to year. The Fund's average annual total returns are compared to the performance of one or more indices. Past performance before and after taxes is no guarantee of future results.
|
|
| Performance Table One Class of after Tax Shown [Text] |
rr_PerformanceTableOneClassOfAfterTaxShown |
After-tax returns are shown for only one class of shares.
|
|
| Performance Availability Website Address [Text] |
rr_PerformanceAvailabilityWebSiteAddress |
wellsfargofunds.com
|
|
| (WFA Income Funds - Classes A and C) | (Wells Fargo Government Securities Fund) | Bloomberg Barclays U.S. Aggregate Bond Index (reflects no deduction for fees, expenses, or taxes) |
|
|
|
| Prospectus: |
rr_ProspectusTable |
|
|
| 1 Year |
rr_AverageAnnualReturnYear01 |
1.36%
|
|
| 5 Years |
rr_AverageAnnualReturnYear05 |
1.62%
|
|
| 10 Years |
rr_AverageAnnualReturnYear10 |
3.99%
|
|
| (WFA Income Funds - Classes A and C) | (Wells Fargo Government Securities Fund) | Bloomberg Barclays Intermediate U.S. Government Index (reflects no deduction for fees, expenses, or taxes) |
|
|
|
| Prospectus: |
rr_ProspectusTable |
|
|
| 1 Year |
rr_AverageAnnualReturnYear01 |
1.05%
|
|
| 5 Years |
rr_AverageAnnualReturnYear05 |
1.04%
|
|
| 10 Years |
rr_AverageAnnualReturnYear10 |
3.42%
|
|
| (WFA Income Funds - Classes A and C) | (Wells Fargo Government Securities Fund) | Class A |
|
|
|
| Prospectus: |
rr_ProspectusTable |
|
|
| Maximum sales charge (load) imposed on purchases (as a percentage of offering price) |
rr_MaximumSalesChargeImposedOnPurchasesOverOfferingPrice |
4.50%
|
|
| Maximum deferred sales charge (load) (as a percentage of offering price) |
rr_MaximumDeferredSalesChargeOverOfferingPrice |
none
|
[5] |
| Management Fees |
rr_ManagementFeesOverAssets |
0.43%
|
|
| Distribution (12b-1) Fees |
rr_DistributionAndService12b1FeesOverAssets |
none
|
|
| Other Expenses |
rr_OtherExpensesOverAssets |
0.44%
|
|
| Total Annual Fund Operating Expenses |
rr_ExpensesOverAssets |
0.87%
|
|
| Fee Waivers |
rr_FeeWaiverOrReimbursementOverAssets |
(0.02%)
|
|
| Total Annual Fund Operating Expenses After Fee Waivers |
rr_NetExpensesOverAssets |
0.85%
|
[8] |
| Expense Example, with Redemption, 1 Year |
rr_ExpenseExampleYear01 |
$ 533
|
|
| Expense Example, with Redemption, 3 Years |
rr_ExpenseExampleYear03 |
713
|
|
| Expense Example, with Redemption, 5 Years |
rr_ExpenseExampleYear05 |
909
|
|
| Expense Example, with Redemption, 10 Years |
rr_ExpenseExampleYear10 |
$ 1,473
|
|
| Bar Chart [Heading] |
rr_BarChartHeading |
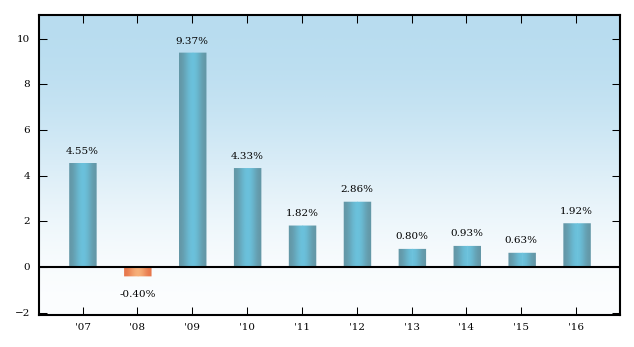
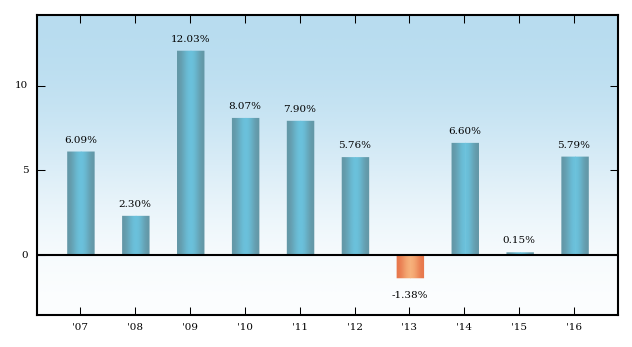
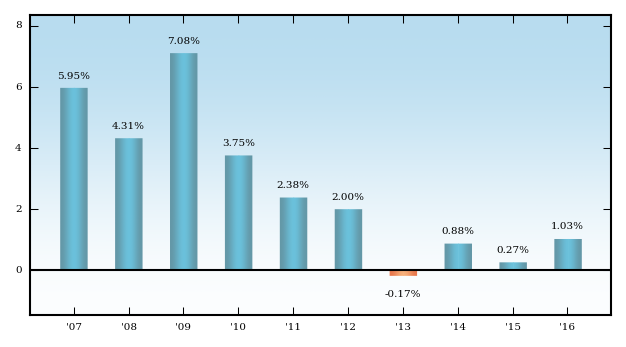
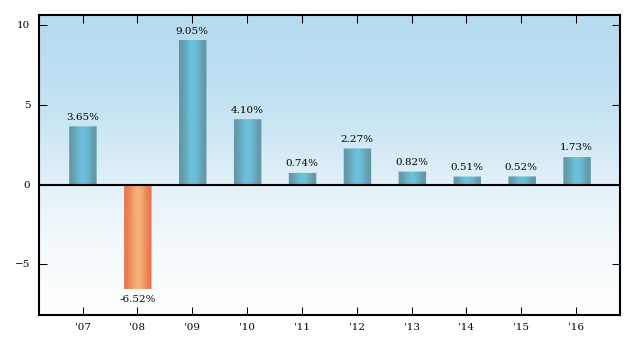
Calendar Year Total Returns for Class A as of 12/31 each year (Returns do not reflect sales charges and would be lower if they did)
|
[7] |
| Annual Return 2007 |
rr_AnnualReturn2007 |
6.98%
|
|
| Annual Return 2008 |
rr_AnnualReturn2008 |
7.67%
|
|
| Annual Return 2009 |
rr_AnnualReturn2009 |
3.58%
|
|
| Annual Return 2010 |
rr_AnnualReturn2010 |
5.48%
|
|
| Annual Return 2011 |
rr_AnnualReturn2011 |
6.92%
|
|
| Annual Return 2012 |
rr_AnnualReturn2012 |
2.54%
|
|
| Annual Return 2013 |
rr_AnnualReturn2013 |
(2.54%)
|
|
| Annual Return 2014 |
rr_AnnualReturn2014 |
5.14%
|
|
| Annual Return 2015 |
rr_AnnualReturn2015 |
0.30%
|
|
| Annual Return 2016 |
rr_AnnualReturn2016 |
1.01%
|
|
| Year to Date Return, Label |
rr_YearToDateReturnLabel |
Year-to-date total return as of 9/30/2017 is +2.00%
|
|
| Bar Chart, Year to Date Return |
rr_BarChartYearToDateReturn |
2.00%
|
|
| Bar Chart, Year to Date Return, Date |
rr_BarChartYearToDateReturnDate |
Sep. 30, 2017
|
|
| Highest Quarterly Return, Label |
rr_HighestQuarterlyReturnLabel |
Highest Quarter: 4th Quarter 2008
|
|
| Highest Quarterly Return |
rr_BarChartHighestQuarterlyReturn |
4.44%
|
|
| Highest Quarterly Return, Date |
rr_BarChartHighestQuarterlyReturnDate |
Dec. 31, 2008
|
|
| Lowest Quarterly Return, Label |
rr_LowestQuarterlyReturnLabel |
Lowest Quarter: 4th Quarter 2016
|
|
| Lowest Quarterly Return |
rr_BarChartLowestQuarterlyReturn |
(3.12%)
|
|
| Lowest Quarterly Return, Date |
rr_BarChartLowestQuarterlyReturnDate |
Dec. 31, 2016
|
|
| 1 Year |
rr_AverageAnnualReturnYear01 |
(3.53%)
|
|
| 5 Years |
rr_AverageAnnualReturnYear05 |
0.33%
|
|
| 10 Years |
rr_AverageAnnualReturnYear10 |
3.18%
|
|
| Inception Date of Share Class |
rr_AverageAnnualReturnInceptionDate |
Aug. 31, 1999
|
|
| (WFA Income Funds - Classes A and C) | (Wells Fargo Government Securities Fund) | Class A | (after taxes on distributions) |
|
|
|
| Prospectus: |
rr_ProspectusTable |
|
|
| 1 Year |
rr_AverageAnnualReturnYear01 |
(4.86%)
|
|
| 5 Years |
rr_AverageAnnualReturnYear05 |
(0.39%)
|
|
| 10 Years |
rr_AverageAnnualReturnYear10 |
2.06%
|
|
| Inception Date of Share Class |
rr_AverageAnnualReturnInceptionDate |
Aug. 31, 1999
|
|
| (WFA Income Funds - Classes A and C) | (Wells Fargo Government Securities Fund) | Class A | (after taxes on distributions and the sale of Fund Shares) |
|
|
|
| Prospectus: |
rr_ProspectusTable |
|
|
| 1 Year |
rr_AverageAnnualReturnYear01 |
(1.85%)
|
|
| 5 Years |
rr_AverageAnnualReturnYear05 |
none
|
|
| 10 Years |
rr_AverageAnnualReturnYear10 |
2.06%
|
|
| Inception Date of Share Class |
rr_AverageAnnualReturnInceptionDate |
Aug. 31, 1999
|
|
| (WFA Income Funds - Classes A and C) | (Wells Fargo Government Securities Fund) | Class C |
|
|
|
| Prospectus: |
rr_ProspectusTable |
|
|
| Maximum sales charge (load) imposed on purchases (as a percentage of offering price) |
rr_MaximumSalesChargeImposedOnPurchasesOverOfferingPrice |
none
|
|
| Maximum deferred sales charge (load) (as a percentage of offering price) |
rr_MaximumDeferredSalesChargeOverOfferingPrice |
1.00%
|
|
| Management Fees |
rr_ManagementFeesOverAssets |
0.43%
|
|
| Distribution (12b-1) Fees |
rr_DistributionAndService12b1FeesOverAssets |
0.75%
|
|
| Other Expenses |
rr_OtherExpensesOverAssets |
0.44%
|
|
| Total Annual Fund Operating Expenses |
rr_ExpensesOverAssets |
1.62%
|
|
| Fee Waivers |
rr_FeeWaiverOrReimbursementOverAssets |
(0.02%)
|
|
| Total Annual Fund Operating Expenses After Fee Waivers |
rr_NetExpensesOverAssets |
1.60%
|
[8] |
| Expense Example, with Redemption, 1 Year |
rr_ExpenseExampleYear01 |
$ 263
|
|
| Expense Example, with Redemption, 3 Years |
rr_ExpenseExampleYear03 |
509
|
|
| Expense Example, with Redemption, 5 Years |
rr_ExpenseExampleYear05 |
879
|
|
| Expense Example, with Redemption, 10 Years |
rr_ExpenseExampleYear10 |
1,920
|
|
| Expense Example, No Redemption, 1 Year |
rr_ExpenseExampleNoRedemptionYear01 |
163
|
|
| Expense Example, No Redemption, 3 Years |
rr_ExpenseExampleNoRedemptionYear03 |
509
|
|
| Expense Example, No Redemption, 5 Years |
rr_ExpenseExampleNoRedemptionYear05 |
879
|
|
| Expense Example, No Redemption, 10 Years |
rr_ExpenseExampleNoRedemptionYear10 |
$ 1,920
|
|
| 1 Year |
rr_AverageAnnualReturnYear01 |
(0.74%)
|
|
| 5 Years |
rr_AverageAnnualReturnYear05 |
0.50%
|
|
| 10 Years |
rr_AverageAnnualReturnYear10 |
2.88%
|
|
| Inception Date of Share Class |
rr_AverageAnnualReturnInceptionDate |
Dec. 26, 2002
|
|
| (WFA Income Funds - Classes A and C) | (Wells Fargo High Yield Bond Fund) |
|
|
|
| Prospectus: |
rr_ProspectusTable |
|
|
| Objective [Heading] |
rr_ObjectiveHeading |
Investment Objective
|
|
| Objective, Primary [Text Block] |
rr_ObjectivePrimaryTextBlock |
The Fund seeks total return, consisting of a high level of current income and capital appreciation.
|
|
| Expense [Heading] |
rr_ExpenseHeading |
Fees and Expenses
|
|
| Expense Narrative [Text Block] |
rr_ExpenseNarrativeTextBlock |
These tables are intended to help you understand the various costs and expenses you will pay if you buy and hold shares of the Fund. You may qualify for sales charge discounts if you and your family invest, or agree to invest in the future, at least $50,000 in the aggregate in specified classes of certain Wells Fargo Funds. More information about these and other discounts is available from your financial professional and in "Share Class Features" and "Reductions and Waivers of Sales Charges" on pages 52 and 54 of the Prospectus and "Additional Purchase and Redemption Information" on page 71 of the Statement of Additional Information. Investors who purchase through certain intermediaries may be subject to different sales charge discounts than those outlined shares in these sections. Please see Appendix A on page 74 for further information.
|
|
| Expense Breakpoint Discounts [Text] |
rr_ExpenseBreakpointDiscounts |
You may qualify for sales charge discounts if you and your family invest, or agree to invest in the future, at least $50,000 in the aggregate in specified classes of certain Wells Fargo Funds.
|
|
| Expense Breakpoint, Minimum Investment Required [Amount] |
rr_ExpenseBreakpointMinimumInvestmentRequiredAmount |
$ 50,000
|
|
| Shareholder Fees Caption [Text] |
rr_ShareholderFeesCaption |
Shareholder Fees (fees paid directly from your investment)
|
|
| Operating Expenses Caption [Text] |
rr_OperatingExpensesCaption |
Annual Fund Operating Expenses (expenses that you pay each year as a percentage of the value of your investment)
|
[4] |
| Fee Waiver or Reimbursement over Assets, Date of Termination |
rr_FeeWaiverOrReimbursementOverAssetsDateOfTermination |
December 31, 2018
|
|
| Expenses Restated to Reflect Current [Text] |
rr_ExpensesRestatedToReflectCurrent |
Expenses have been adjusted as necessary from amounts incurred during the Fund's most recent fiscal year to reflect current fees and expenses.
|
|
| Expenses Deferred Charges [Text Block] |
rr_ExpensesDeferredChargesTextBlock |
Investments of $1 million or more are not subject to a front-end sales charge but generally will be subject to a deferred sales charge of 1.00% if redeemed within 18 months from the date of purchase.
|
|
| Expense Example [Heading] |
rr_ExpenseExampleHeading |
Example of Expenses
|
|
| Expense Example Narrative [Text Block] |
rr_ExpenseExampleNarrativeTextBlock |
The example below is intended to help you compare the costs of investing in the Fund with the costs of investing in other mutual funds. The example assumes a $10,000 initial investment, 5% annual total return, and that fees and expenses remain the same as in the tables above. To the extent that the Manager is waiving fees or reimbursing expenses, the example assumes that such waiver or reimbursement will only be in place through the date noted above. Although your actual costs may be higher or lower, based on these assumptions your costs would be:
|
|
| Expense Example by, Year, Caption [Text] |
rr_ExpenseExampleByYearCaption |
Assuming Redemption at End of Period
|
|
| Expense Example, No Redemption, By Year, Caption [Text] |
rr_ExpenseExampleNoRedemptionByYearCaption |
Assuming No Redemption
|
|
| Portfolio Turnover [Heading] |
rr_PortfolioTurnoverHeading |
Portfolio Turnover
|
|
| Portfolio Turnover [Text Block] |
rr_PortfolioTurnoverTextBlock |
The Fund pays transaction costs, such as commissions, when it buys and sells securities (or "turns over" its portfolio). A higher portfolio turnover rate may indicate higher transaction costs and may result in higher taxes when Fund shares are held in a taxable account. These costs, which are not reflected in annual fund operating expenses or in the example, affect the Fund's performance. During the most recent fiscal year, the Fund's portfolio turnover rate was 20% of the average value of its portfolio.
|
|
| Portfolio Turnover, Rate |
rr_PortfolioTurnoverRate |
20.00%
|
|
| Strategy [Heading] |
rr_StrategyHeading |
Principal Investment Strategies
|
|
| Strategy Narrative [Text Block] |
rr_StrategyNarrativeTextBlock |
Under normal circumstances, we invest:
-
at least 80% of the Fund's net assets in debt securities that are below-investment grade; and
-
up to 10% of the Fund's total assets in equity securities, including common and preferred stocks.
We invest principally in below investment-grade debt securities (often called "high yield" securities or "junk bonds") of corporate issuers. These include traditional corporate bonds as well as convertible bonds. These securities may have fixed, floating or variable rates. We may invest in below investment-grade debt securities of any credit quality. The average credit quality of the Fund's portfolio is expected to be equivalent to B or higher based on the credit ratings assigned to underlying securities by Moody's, Standard & Poor's, from other Nationally Recognized Statistical Ratings Organizations, or our credit quality assessment of the underlying securities. We do not manage the Fund's portfolio to a specific maturity or duration. We may also use futures for duration and yield curve management. We may invest up to 10% of the Fund's total assets in equity securities, including common and preferred stocks. For equity securities, we seek out dividend yielding securities of companies that we believe have strong fundamental attributes. We may invest in equity securities of companies of any size.
Securities in the Fund's portfolio may be issued by domestic or foreign issuers (including foreign governments), and may include securities of emerging markets issuers.
We start our investment process by looking at macroeconomic factors, such as the pace of economic growth, employment conditions, corporate profits, inflation rates, monetary and fiscal policy, within the context of other even broader factors, including the influence of international economic and financial conditions. This top-down, macroeconomic outlook helps us to determine the sectors and industries in which we believe the portfolio should invest, and in what proportions. We then seek those industries within this macroeconomic environment which we find attractive - industries that are either growing at or above the rate of economic growth (growth industries) or out of favor industries with potentially improving outlooks (value industries.) Within those industries, we prefer companies with sustainable competitive advantages and high barriers to entry, and we specifically seek companies with strong management teams and financial flexibility.
We regularly review the investments of the portfolio and may sell a portfolio holding when it has achieved its valuation target, there is deterioration in the underlying fundamentals of the business, or we have identified a more attractive investment opportunity.
|
|
| Risk [Heading] |
rr_RiskHeading |
Principal Investment Risks
|
|
| Risk Narrative [Text Block] |
rr_RiskNarrativeTextBlock |
An investment in the Fund may lose money, is not a deposit of Wells Fargo Bank, N.A. or its affiliates, is not insured or guaranteed by the Federal Deposit Insurance Corporation or any other governmental agency, and is primarily subject to the risks briefly summarized below.
Convertible Securities Risk. A convertible security has characteristics of both equity and debt securities and, as a result, is exposed to risks that are typically associated with both types of securities. The market value of a convertible security tends to decline as interest rates increase but also tends to reflect changes in the market price of the common stock of the issuing company.
Credit Risk. The issuer or guarantor of a debt security may be unable or perceived to be unable to pay interest or repay principal when they become due, which could cause the value of an investment to decline and a Fund to lose money.
Derivatives Risk. The use of derivatives, such as futures, options and swap agreements, can lead to losses, including those magnified by leverage, particularly when derivatives are used to enhance return rather than mitigate risk. Certain derivative instruments may be difficult to sell when the portfolio manager believes it would be appropriate to do so, or the other party to a derivative contract may be unwilling or unable to fulfill its contractual obligations.
Emerging Markets Risk. Emerging market securities typically present even greater exposure to the risks described under "Foreign Investment Risk" and may be particularly sensitive to global economic conditions. Emerging market securities are also typically less liquid than securities of developed countries and could be difficult to sell, particularly during a market downturn.
Foreign Investment Risk. Foreign investments may be subject to lower liquidity, greater price volatility and risks related to adverse political, regulatory, market or economic developments. Foreign investments may involve exposure to changes in foreign currency exchange rates and may be subject to higher withholding and other taxes.
Futures Contracts Risk. A Fund that uses futures contracts, which are a type of derivative, is subject to the risk of loss caused by unanticipated market movements. In addition, there may at times be an imperfect correlation between the movement in the prices of futures contracts and the value of their underlying instruments or indexes and there may at times not be a liquid secondary market for certain futures contracts.
Growth/Value Investing Risk. Securities that exhibit growth or value characteristics tend to perform differently and shift into and out of favor with investors depending on changes in market and economic sentiment and conditions.
High Yield Securities Risk. High yield securities and unrated securities of similar credit quality (commonly known as "junk bonds") have a much greater risk of default or of not returning principal and their values tend to be more volatile than higher-rated securities with similar maturities.
Interest Rate Risk. When interest rates (which are currently near historic lows) rise, the value of debt securities tends to fall. When interest rates decline, interest that a Fund is able to earn on its investments in debt securities may also decline, but the value of those securities may increase.
Management Risk. Investment decisions, techniques, analyses or models implemented by a Fund's manager or sub-adviser in seeking to achieve the Fund's investment objective may not produce the returns expected, may cause the Fund's shares to lose value or may cause the Fund to underperform other funds with similar investment objectives.
Market Risk. The values of, and/or the income generated by, securities held by a Fund may decline due to general market conditions or other factors, including those directly involving the issuers of such securities. Security markets are volatile and may decline significantly in response to adverse issuer, regulatory, political, or economic developments. Different sectors of the market and different security types may react differently to such developments.
|
|
| Risk Lose Money [Text] |
rr_RiskLoseMoney |
An investment in the Fund may lose money
|
|
| Risk Not Insured Depository Institution [Text] |
rr_RiskNotInsuredDepositoryInstitution |
An investment in the Fund may lose money, is not a deposit of Wells Fargo Bank, N.A. or its affiliates, is not insured or guaranteed by the Federal Deposit Insurance Corporation or any other governmental agency
|
|
| Bar Chart and Performance Table [Heading] |
rr_BarChartAndPerformanceTableHeading |
Performance
|
|
| Performance Narrative [Text Block] |
rr_PerformanceNarrativeTextBlock |
The following information provides some indication of the risks of investing in the Fund by showing changes in the Fund's performance from year to year. The Fund's average annual total returns are compared to the performance of one or more indices. Past performance before and after taxes is no guarantee of future results. Current month-end performance is available on the Fund's website at wellsfargofunds.com.
|
|
| Bar Chart Does Not Reflect Sales Loads [Text] |
rr_BarChartDoesNotReflectSalesLoads |
Returns do not reflect sales charges and would be lower if they did
|
|
| Bar Chart Closing [Text Block] |
rr_BarChartClosingTextBlock |
Highest Quarter: 2nd Quarter 2009 | +20.52% | | Lowest Quarter: 4th Quarter 2008 | -17.04% | Year-to-date total return as of 9/30/2017 is +6.71% |
|
|
| Performance Table Heading |
rr_PerformanceTableHeading |
Average Annual Total Returns for the periods ended 12/31/2016 (returns reflect applicable sales charges)
|
[9] |
| Performance Table Closing [Text Block] |
rr_PerformanceTableClosingTextBlock |
After-tax returns are calculated using the historical highest individual federal marginal income tax rates and do not reflect the impact of state, local or foreign taxes. Actual after-tax returns depend on an investor's tax situation and may differ from those shown, and after-tax returns shown are not relevant to tax-exempt investors or investors who hold their Fund shares through tax-deferred arrangements, such as 401(k) Plans or Individual Retirement Accounts. After-tax returns are shown for only one class of shares. After-tax returns for any other class will vary.
|
|
| Performance Table Does Reflect Sales Loads |
rr_PerformanceTableDoesReflectSalesLoads |
returns reflect applicable sales charges
|
|
| Performance Table Uses Highest Federal Rate |
rr_PerformanceTableUsesHighestFederalRate |
After-tax returns are calculated using the historical highest individual federal marginal income tax rates and do not reflect the impact of state, local or foreign taxes.
|
|
| Performance Table Not Relevant to Tax Deferred |
rr_PerformanceTableNotRelevantToTaxDeferred |
Actual after-tax returns depend on an investor's tax situation and may differ from those shown, and after-tax returns shown are not relevant to tax-exempt investors or investors who hold their Fund shares through tax-deferred arrangements, such as 401(k) Plans or Individual Retirement Accounts.
|
|
| Performance Past Does Not Indicate Future [Text] |
rr_PerformancePastDoesNotIndicateFuture |
Past performance before and after taxes is no guarantee of future results.
|
|
| Performance Information Illustrates Variability of Returns [Text] |
rr_PerformanceInformationIllustratesVariabilityOfReturns |
The following information provides some indication of the risks of investing in the Fund by showing changes in the Fund's performance from year to year. The Fund's average annual total returns are compared to the performance of one or more indices. Past performance before and after taxes is no guarantee of future results.
|
|
| Performance Table One Class of after Tax Shown [Text] |
rr_PerformanceTableOneClassOfAfterTaxShown |
After-tax returns are shown for only one class of shares.
|
|
| Performance Availability Website Address [Text] |
rr_PerformanceAvailabilityWebSiteAddress |
wellsfargofunds.com
|
|
| (WFA Income Funds - Classes A and C) | (Wells Fargo High Yield Bond Fund) | ICE BofA Merrill Lynch U.S. High Yield Constrained Index (reflects no deduction for fees, expenses, or taxes) |
|
|
|
| Prospectus: |
rr_ProspectusTable |
|
|
| 1 Year |
rr_AverageAnnualReturnYear01 |
17.49%
|
|
| 5 Years |
rr_AverageAnnualReturnYear05 |
7.35%
|
|
| 10 Years |
rr_AverageAnnualReturnYear10 |
7.45%
|
|
| (WFA Income Funds - Classes A and C) | (Wells Fargo High Yield Bond Fund) | Class A |
|
|
|
| Prospectus: |
rr_ProspectusTable |
|
|
| Maximum sales charge (load) imposed on purchases (as a percentage of offering price) |
rr_MaximumSalesChargeImposedOnPurchasesOverOfferingPrice |
4.50%
|
|
| Maximum deferred sales charge (load) (as a percentage of offering price) |
rr_MaximumDeferredSalesChargeOverOfferingPrice |
none
|
[5] |
| Management Fees |
rr_ManagementFeesOverAssets |
0.55%
|
|
| Distribution (12b-1) Fees |
rr_DistributionAndService12b1FeesOverAssets |
none
|
|
| Other Expenses |
rr_OtherExpensesOverAssets |
0.47%
|
|
| Total Annual Fund Operating Expenses |
rr_ExpensesOverAssets |
1.02%
|
|
| Fee Waivers |
rr_FeeWaiverOrReimbursementOverAssets |
(0.09%)
|
|
| Total Annual Fund Operating Expenses After Fee Waivers |
rr_NetExpensesOverAssets |
0.93%
|
[10] |
| Expense Example, with Redemption, 1 Year |
rr_ExpenseExampleYear01 |
$ 541
|
|
| Expense Example, with Redemption, 3 Years |
rr_ExpenseExampleYear03 |
752
|
|
| Expense Example, with Redemption, 5 Years |
rr_ExpenseExampleYear05 |
980
|
|
| Expense Example, with Redemption, 10 Years |
rr_ExpenseExampleYear10 |
$ 1,634
|
|
| Bar Chart [Heading] |
rr_BarChartHeading |
Calendar Year Total Returns for Class A as of 12/31 each year (Returns do not reflect sales charges and would be lower if they did)
|
[9] |
| Annual Return 2007 |
rr_AnnualReturn2007 |
2.86%
|
|
| Annual Return 2008 |
rr_AnnualReturn2008 |
(26.17%)
|
|
| Annual Return 2009 |
rr_AnnualReturn2009 |
52.42%
|
|
| Annual Return 2010 |
rr_AnnualReturn2010 |
13.26%
|
|
| Annual Return 2011 |
rr_AnnualReturn2011 |
4.08%
|
|
| Annual Return 2012 |
rr_AnnualReturn2012 |
14.11%
|
|
| Annual Return 2013 |
rr_AnnualReturn2013 |
3.66%
|
|
| Annual Return 2014 |
rr_AnnualReturn2014 |
4.56%
|
|
| Annual Return 2015 |
rr_AnnualReturn2015 |
(1.92%)
|
|
| Annual Return 2016 |
rr_AnnualReturn2016 |
12.55%
|
|
| Year to Date Return, Label |
rr_YearToDateReturnLabel |
Year-to-date total return as of 9/30/2017 is +6.71%
|
|
| Bar Chart, Year to Date Return |
rr_BarChartYearToDateReturn |
6.71%
|
|
| Bar Chart, Year to Date Return, Date |
rr_BarChartYearToDateReturnDate |
Sep. 30, 2017
|
|
| Highest Quarterly Return, Label |
rr_HighestQuarterlyReturnLabel |
Highest Quarter: 2nd Quarter 2009
|
|
| Highest Quarterly Return |
rr_BarChartHighestQuarterlyReturn |
20.52%
|
|
| Highest Quarterly Return, Date |
rr_BarChartHighestQuarterlyReturnDate |
Jun. 30, 2009
|
|
| Lowest Quarterly Return, Label |
rr_LowestQuarterlyReturnLabel |
Lowest Quarter: 4th Quarter 2008
|
|
| Lowest Quarterly Return |
rr_BarChartLowestQuarterlyReturn |
(17.04%)
|
|
| Lowest Quarterly Return, Date |
rr_BarChartLowestQuarterlyReturnDate |
Dec. 31, 2008
|
|
| 1 Year |
rr_AverageAnnualReturnYear01 |
7.63%
|
|
| 5 Years |
rr_AverageAnnualReturnYear05 |
5.47%
|
|
| 10 Years |
rr_AverageAnnualReturnYear10 |
5.92%
|
|
| Inception Date of Share Class |
rr_AverageAnnualReturnInceptionDate |
Jan. 20, 1998
|
|
| (WFA Income Funds - Classes A and C) | (Wells Fargo High Yield Bond Fund) | Class A | (after taxes on distributions) |
|
|
|
| Prospectus: |
rr_ProspectusTable |
|
|
| 1 Year |
rr_AverageAnnualReturnYear01 |
5.65%
|
|
| 5 Years |
rr_AverageAnnualReturnYear05 |
3.50%
|
|
| 10 Years |
rr_AverageAnnualReturnYear10 |
3.46%
|
|
| Inception Date of Share Class |
rr_AverageAnnualReturnInceptionDate |
Jan. 20, 1998
|
|
| (WFA Income Funds - Classes A and C) | (Wells Fargo High Yield Bond Fund) | Class A | (after taxes on distributions and the sale of Fund Shares) |
|
|
|
| Prospectus: |
rr_ProspectusTable |
|
|
| 1 Year |
rr_AverageAnnualReturnYear01 |
4.27%
|
|
| 5 Years |
rr_AverageAnnualReturnYear05 |
3.33%
|
|
| 10 Years |
rr_AverageAnnualReturnYear10 |
3.49%
|
|
| Inception Date of Share Class |
rr_AverageAnnualReturnInceptionDate |
Jan. 20, 1998
|
|
| (WFA Income Funds - Classes A and C) | (Wells Fargo High Yield Bond Fund) | Class C |
|
|
|
| Prospectus: |
rr_ProspectusTable |
|
|
| Maximum sales charge (load) imposed on purchases (as a percentage of offering price) |
rr_MaximumSalesChargeImposedOnPurchasesOverOfferingPrice |
none
|
|
| Maximum deferred sales charge (load) (as a percentage of offering price) |
rr_MaximumDeferredSalesChargeOverOfferingPrice |
1.00%
|
|
| Management Fees |
rr_ManagementFeesOverAssets |
0.55%
|
|
| Distribution (12b-1) Fees |
rr_DistributionAndService12b1FeesOverAssets |
0.75%
|
|
| Other Expenses |
rr_OtherExpensesOverAssets |
0.47%
|
|
| Total Annual Fund Operating Expenses |
rr_ExpensesOverAssets |
1.77%
|
|
| Fee Waivers |
rr_FeeWaiverOrReimbursementOverAssets |
(0.09%)
|
|
| Total Annual Fund Operating Expenses After Fee Waivers |
rr_NetExpensesOverAssets |
1.68%
|
[10] |
| Expense Example, with Redemption, 1 Year |
rr_ExpenseExampleYear01 |
$ 271
|
|
| Expense Example, with Redemption, 3 Years |
rr_ExpenseExampleYear03 |
548
|
|
| Expense Example, with Redemption, 5 Years |
rr_ExpenseExampleYear05 |
951
|
|
| Expense Example, with Redemption, 10 Years |
rr_ExpenseExampleYear10 |
2,076
|
|
| Expense Example, No Redemption, 1 Year |
rr_ExpenseExampleNoRedemptionYear01 |
171
|
|
| Expense Example, No Redemption, 3 Years |
rr_ExpenseExampleNoRedemptionYear03 |
548
|
|
| Expense Example, No Redemption, 5 Years |
rr_ExpenseExampleNoRedemptionYear05 |
951
|
|
| Expense Example, No Redemption, 10 Years |
rr_ExpenseExampleNoRedemptionYear10 |
$ 2,076
|
|
| 1 Year |
rr_AverageAnnualReturnYear01 |
10.72%
|
|
| 5 Years |
rr_AverageAnnualReturnYear05 |
5.64%
|
|
| 10 Years |
rr_AverageAnnualReturnYear10 |
5.63%
|
|
| Inception Date of Share Class |
rr_AverageAnnualReturnInceptionDate |
Jan. 21, 1998
|
|
| (WFA Income Funds - Classes A and C) | (Wells Fargo Short Duration Government Bond Fund) |
|
|
|
| Prospectus: |
rr_ProspectusTable |
|
|
| Objective [Heading] |
rr_ObjectiveHeading |
Investment Objective
|
|
| Objective, Primary [Text Block] |
rr_ObjectivePrimaryTextBlock |
The Fund seeks to provide current income consistent with capital preservation.
|
|
| Expense [Heading] |
rr_ExpenseHeading |
Fees and Expenses
|
|
| Expense Narrative [Text Block] |
rr_ExpenseNarrativeTextBlock |
These tables are intended to help you understand the various costs and expenses you will pay if you buy and hold shares of the Fund. You may qualify for sales charge discounts if you and your family invest, or agree to invest in the future, at least $50,000 in the aggregate in specified classes of certain Wells Fargo Funds. More information about these and other discounts is available from your financial professional and in "Share Class Features" and "Reductions and Waivers of Sales Charges" on pages 52 and 54 of the Prospectus and "Additional Purchase and Redemption Information" on page 71 of the Statement of Additional Information. Investors who purchase through certain intermediaries may be subject to different sales charge discounts than those outlined shares in these sections. Please see Appendix A on page 74 for further information.
|
|
| Expense Breakpoint Discounts [Text] |
rr_ExpenseBreakpointDiscounts |
You may qualify for sales charge discounts if you and your family invest, or agree to invest in the future, at least $50,000 in the aggregate in specified classes of certain Wells Fargo Funds.
|
|
| Expense Breakpoint, Minimum Investment Required [Amount] |
rr_ExpenseBreakpointMinimumInvestmentRequiredAmount |
$ 50,000
|
|
| Shareholder Fees Caption [Text] |
rr_ShareholderFeesCaption |
Shareholder Fees (fees paid directly from your investment)
|
|
| Operating Expenses Caption [Text] |
rr_OperatingExpensesCaption |
Annual Fund Operating Expenses (expenses that you pay each year as a percentage of the value of your investment)
|
|
| Fee Waiver or Reimbursement over Assets, Date of Termination |
rr_FeeWaiverOrReimbursementOverAssetsDateOfTermination |
December 31, 2018
|
|
| Expenses Deferred Charges [Text Block] |
rr_ExpensesDeferredChargesTextBlock |
Investments of $500,000 or more are not subject to a front-end sales charge but generally will be subject to a deferred sales charge of 0.40% if redeemed within 12 months from the date of purchase.
|
|
| Expense Example [Heading] |
rr_ExpenseExampleHeading |
Example of Expenses
|
|
| Expense Example Narrative [Text Block] |
rr_ExpenseExampleNarrativeTextBlock |
The example below is intended to help you compare the costs of investing in the Fund with the costs of investing in other mutual funds. The example assumes a $10,000 initial investment, 5% annual total return, and that fees and expenses remain the same as in the tables above. To the extent that the Manager is waiving fees or reimbursing expenses, the example assumes that such waiver or reimbursement will only be in place through the date noted above. Although your actual costs may be higher or lower, based on these assumptions your costs would be:
|
|
| Expense Example by, Year, Caption [Text] |
rr_ExpenseExampleByYearCaption |
Assuming Redemption at End of Period
|
|
| Expense Example, No Redemption, By Year, Caption [Text] |
rr_ExpenseExampleNoRedemptionByYearCaption |
Assuming No Redemption
|
|
| Portfolio Turnover [Heading] |
rr_PortfolioTurnoverHeading |
Portfolio Turnover
|
|
| Portfolio Turnover [Text Block] |
rr_PortfolioTurnoverTextBlock |
The Fund pays transaction costs, such as commissions, when it buys and sells securities (or "turns over" its portfolio). A higher portfolio turnover rate may indicate higher transaction costs and may result in higher taxes when Fund shares are held in a taxable account. These costs, which are not reflected in annual fund operating expenses or in the example, affect the Fund's performance. During the most recent fiscal year, the Fund's portfolio turnover rate was 348% of the average value of its portfolio.
|
|
| Portfolio Turnover, Rate |
rr_PortfolioTurnoverRate |
348.00%
|
|
| Strategy [Heading] |
rr_StrategyHeading |
Principal Investment Strategies
|
|
| Strategy Narrative [Text Block] |
rr_StrategyNarrativeTextBlock |
Under normal circumstances, we invest:
We invest principally in U.S. Government obligations, including debt securities issued or guaranteed by the U.S. Treasury, U.S. Government agencies or government-sponsored entities. We will purchase only securities that are rated, at the time of purchase, within the two highest rating categories assigned by a Nationally Recognized Statistical Ratings Organization, or are deemed by us to be of comparable quality. As part of our investment strategy, we may enter into mortgage dollar rolls. While we may purchase securities of any maturity or duration, under normal circumstances, we expect the portfolio's overall dollar-weighted average effective duration to be less than that of a 3-year U.S. Treasury note. "Dollar-Weighted Average Effective Duration" is an aggregate measure of the sensitivity of a fund's fixed income portfolio securities to changes in interest rates. As a general matter, the price of a fixed income security with a longer effective duration will fluctuate more in response to changes in interest rates than the price of a fixed income security with a shorter effective duration.
We invest in debt securities that we believe offer competitive returns and are undervalued, offering additional income and/or price appreciation potential, relative to other debt securities of similar credit quality and interest rate sensitivity. As part of our investment strategy, we invest in mortgage-backed securities guaranteed by U.S. Government agencies that we believe will sufficiently outperform U.S. Treasuries. We may sell a security that has achieved its desired return or if we believe the security or its sector has become overvalued. We may also sell a security if a more attractive opportunity becomes available or if the security is no longer attractive due to its risk profile or as a result of changes in the overall market environment.
|
|
| Risk [Heading] |
rr_RiskHeading |
Principal Investment Risks
|
|
| Risk Narrative [Text Block] |
rr_RiskNarrativeTextBlock |
An investment in the Fund may lose money, is not a deposit of Wells Fargo Bank, N.A. or its affiliates, is not insured or guaranteed by the Federal Deposit Insurance Corporation or any other governmental agency, and is primarily subject to the risks briefly summarized below.
Credit Risk. The issuer or guarantor of a debt security may be unable or perceived to be unable to pay interest or repay principal when they become due, which could cause the value of an investment to decline and a Fund to lose money.
Interest Rate Risk. When interest rates (which are currently near historic lows) rise, the value of debt securities tends to fall. When interest rates decline, interest that a Fund is able to earn on its investments in debt securities may also decline, but the value of those securities may increase.
Management Risk. Investment decisions, techniques, analyses or models implemented by a Fund's manager or sub-adviser in seeking to achieve the Fund's investment objective may not produce the returns expected, may cause the Fund's shares to lose value or may cause the Fund to underperform other funds with similar investment objectives.
Market Risk. The values of, and/or the income generated by, securities held by a Fund may decline due to general market conditions or other factors, including those directly involving the issuers of such securities. Security markets are volatile and may decline significantly in response to adverse issuer, regulatory, political, or economic developments. Different sectors of the market and different security types may react differently to such developments.
Mortgage- and Asset-Backed Securities Risk. Mortgage- and asset-backed securities may decline in value and become less liquid when defaults on the underlying mortgages or assets occur and may exhibit additional volatility in periods of rising interest rates. Rising interest rates tend to extend the duration of these securities, making them more sensitive to changes in interest rates than instruments with fixed payment schedules. When interest rates decline or are low, the prepayment of mortgages or assets underlying such securities can reduce a Fund's returns.
U.S. Government Obligations Risk. U.S. Government obligations may be adversely impacted by changes in interest rates, and securities issued or guaranteed by U.S. Government agencies or government-sponsored entities may not be backed by the full faith and credit of the U.S. Government.
|
|
| Risk Lose Money [Text] |
rr_RiskLoseMoney |
An investment in the Fund may lose money
|
|
| Risk Not Insured Depository Institution [Text] |
rr_RiskNotInsuredDepositoryInstitution |
An investment in the Fund may lose money, is not a deposit of Wells Fargo Bank, N.A. or its affiliates, is not insured or guaranteed by the Federal Deposit Insurance Corporation or any other governmental agency
|
|
| Bar Chart and Performance Table [Heading] |
rr_BarChartAndPerformanceTableHeading |
Performance
|
|
| Performance Narrative [Text Block] |
rr_PerformanceNarrativeTextBlock |
The following information provides some indication of the risks of investing in the Fund by showing changes in the Fund's performance from year to year. The Fund's average annual total returns are compared to the performance of one or more indices. Past performance before and after taxes is no guarantee of future results. Current month-end performance is available on the Fund's website at wellsfargofunds.com.
|
|
| Bar Chart Does Not Reflect Sales Loads [Text] |
rr_BarChartDoesNotReflectSalesLoads |
Returns do not reflect sales charges and would be lower if they did
|
|
| Bar Chart Closing [Text Block] |
rr_BarChartClosingTextBlock |
Highest Quarter: 1st Quarter 2009 | +3.54% | | Lowest Quarter: 2nd Quarter 2013 | -0.56% | Year-to-date total return as of 9/30/2017 is +0.65% |
|
|
| Performance Table Heading |
rr_PerformanceTableHeading |
Average Annual Total Returns for the periods ended 12/31/2016 (returns reflect applicable sales charges)
|
|
| Performance Table Closing [Text Block] |
rr_PerformanceTableClosingTextBlock |
After-tax returns are calculated using the historical highest individual federal marginal income tax rates and do not reflect the impact of state, local or foreign taxes. Actual after-tax returns depend on an investor's tax situation and may differ from those shown, and after-tax returns shown are not relevant to tax-exempt investors or investors who hold their Fund shares through tax-deferred arrangements, such as 401(k) Plans or Individual Retirement Accounts. After-tax returns are shown for only one class of shares. After-tax returns for any other class will vary.
|
|
| Performance Table Does Reflect Sales Loads |
rr_PerformanceTableDoesReflectSalesLoads |
returns reflect applicable sales charges
|
|
| Performance Table Uses Highest Federal Rate |
rr_PerformanceTableUsesHighestFederalRate |
After-tax returns are calculated using the historical highest individual federal marginal income tax rates and do not reflect the impact of state, local or foreign taxes.
|
|
| Performance Table Not Relevant to Tax Deferred |
rr_PerformanceTableNotRelevantToTaxDeferred |
Actual after-tax returns depend on an investor's tax situation and may differ from those shown, and after-tax returns shown are not relevant to tax-exempt investors or investors who hold their Fund shares through tax-deferred arrangements, such as 401(k) Plans or Individual Retirement Accounts.
|
|
| Performance Past Does Not Indicate Future [Text] |
rr_PerformancePastDoesNotIndicateFuture |
Past performance before and after taxes is no guarantee of future results.
|
|
| Performance Information Illustrates Variability of Returns [Text] |
rr_PerformanceInformationIllustratesVariabilityOfReturns |
The following information provides some indication of the risks of investing in the Fund by showing changes in the Fund's performance from year to year. The Fund's average annual total returns are compared to the performance of one or more indices. Past performance before and after taxes is no guarantee of future results.
|
|
| Performance Table One Class of after Tax Shown [Text] |
rr_PerformanceTableOneClassOfAfterTaxShown |
After-tax returns are shown for only one class of shares.
|
|
| Performance Availability Website Address [Text] |
rr_PerformanceAvailabilityWebSiteAddress |
wellsfargofunds.com
|
|
| (WFA Income Funds - Classes A and C) | (Wells Fargo Short Duration Government Bond Fund) | Bloomberg Barclays U.S. 1-3 Year Government Bond Index (reflects no deduction for fees, expenses, or taxes) |
|
|
|
| Prospectus: |
rr_ProspectusTable |
|
|
| 1 Year |
rr_AverageAnnualReturnYear01 |
0.87%
|
|
| 5 Years |
rr_AverageAnnualReturnYear05 |
0.59%
|
|
| 10 Years |
rr_AverageAnnualReturnYear10 |
2.18%
|
|
| (WFA Income Funds - Classes A and C) | (Wells Fargo Short Duration Government Bond Fund) | Class A |
|
|
|
| Prospectus: |
rr_ProspectusTable |
|
|
| Maximum sales charge (load) imposed on purchases (as a percentage of offering price) |
rr_MaximumSalesChargeImposedOnPurchasesOverOfferingPrice |
2.00%
|
|
| Maximum deferred sales charge (load) (as a percentage of offering price) |
rr_MaximumDeferredSalesChargeOverOfferingPrice |
none
|
[2] |
| Management Fees |
rr_ManagementFeesOverAssets |
0.35%
|
|
| Distribution (12b-1) Fees |
rr_DistributionAndService12b1FeesOverAssets |
none
|
|
| Other Expenses |
rr_OtherExpensesOverAssets |
0.44%
|
|
| Total Annual Fund Operating Expenses |
rr_ExpensesOverAssets |
0.79%
|
|
| Fee Waivers |
rr_FeeWaiverOrReimbursementOverAssets |
(0.01%)
|
|
| Total Annual Fund Operating Expenses After Fee Waivers |
rr_NetExpensesOverAssets |
0.78%
|
[3] |
| Expense Example, with Redemption, 1 Year |
rr_ExpenseExampleYear01 |
$ 278
|
|
| Expense Example, with Redemption, 3 Years |
rr_ExpenseExampleYear03 |
446
|
|
| Expense Example, with Redemption, 5 Years |
rr_ExpenseExampleYear05 |
629
|
|
| Expense Example, with Redemption, 10 Years |
rr_ExpenseExampleYear10 |
$ 1,157
|
|
| Bar Chart [Heading] |
rr_BarChartHeading |
Calendar Year Total Returns for Class A as of 12/31 each year (Returns do not reflect sales charges and would be lower if they did)
|
|
| Annual Return 2007 |
rr_AnnualReturn2007 |
5.80%
|
|
| Annual Return 2008 |
rr_AnnualReturn2008 |
3.94%
|
|
| Annual Return 2009 |
rr_AnnualReturn2009 |
6.93%
|
|
| Annual Return 2010 |
rr_AnnualReturn2010 |
3.40%
|
|
| Annual Return 2011 |
rr_AnnualReturn2011 |
2.15%
|
|
| Annual Return 2012 |
rr_AnnualReturn2012 |
1.77%
|
|
| Annual Return 2013 |
rr_AnnualReturn2013 |
(0.26%)
|
|
| Annual Return 2014 |
rr_AnnualReturn2014 |
0.60%
|
|
| Annual Return 2015 |
rr_AnnualReturn2015 |
0.19%
|
|
| Annual Return 2016 |
rr_AnnualReturn2016 |
0.85%
|
|
| Year to Date Return, Label |
rr_YearToDateReturnLabel |
Year-to-date total return as of 9/30/2017 is +0.65%
|
|
| Bar Chart, Year to Date Return |
rr_BarChartYearToDateReturn |
0.65%
|
|
| Bar Chart, Year to Date Return, Date |
rr_BarChartYearToDateReturnDate |
Sep. 30, 2017
|
|
| Highest Quarterly Return, Label |
rr_HighestQuarterlyReturnLabel |
Highest Quarter: 1st Quarter 2009
|
|
| Highest Quarterly Return |
rr_BarChartHighestQuarterlyReturn |
3.54%
|
|
| Highest Quarterly Return, Date |
rr_BarChartHighestQuarterlyReturnDate |
Mar. 31, 2009
|
|
| Lowest Quarterly Return, Label |
rr_LowestQuarterlyReturnLabel |
Lowest Quarter: 2nd Quarter 2013
|
|
| Lowest Quarterly Return |
rr_BarChartLowestQuarterlyReturn |
(0.56%)
|
|
| Lowest Quarterly Return, Date |
rr_BarChartLowestQuarterlyReturnDate |
Jun. 30, 2013
|
|
| 1 Year |
rr_AverageAnnualReturnYear01 |
(1.17%)
|
|
| 5 Years |
rr_AverageAnnualReturnYear05 |
0.22%
|
|
| 10 Years |
rr_AverageAnnualReturnYear10 |
2.30%
|
|
| Inception Date of Share Class |
rr_AverageAnnualReturnInceptionDate |
Mar. 11, 1996
|
|
| (WFA Income Funds - Classes A and C) | (Wells Fargo Short Duration Government Bond Fund) | Class A | (after taxes on distributions) |
|
|
|
| Prospectus: |
rr_ProspectusTable |
|
|
| 1 Year |
rr_AverageAnnualReturnYear01 |
(1.83%)
|
|
| 5 Years |
rr_AverageAnnualReturnYear05 |
(0.40%)
|
|
| 10 Years |
rr_AverageAnnualReturnYear10 |
1.39%
|
|
| Inception Date of Share Class |
rr_AverageAnnualReturnInceptionDate |
Mar. 11, 1996
|
|
| (WFA Income Funds - Classes A and C) | (Wells Fargo Short Duration Government Bond Fund) | Class A | (after taxes on distributions and the sale of Fund Shares) |
|
|
|
| Prospectus: |
rr_ProspectusTable |
|
|
| 1 Year |
rr_AverageAnnualReturnYear01 |
(0.66%)
|
|
| 5 Years |
rr_AverageAnnualReturnYear05 |
(0.09%)
|
|
| 10 Years |
rr_AverageAnnualReturnYear10 |
1.43%
|
|
| Inception Date of Share Class |
rr_AverageAnnualReturnInceptionDate |
Mar. 11, 1996
|
|
| (WFA Income Funds - Classes A and C) | (Wells Fargo Short Duration Government Bond Fund) | Class C |
|
|
|
| Prospectus: |
rr_ProspectusTable |
|
|
| Maximum sales charge (load) imposed on purchases (as a percentage of offering price) |
rr_MaximumSalesChargeImposedOnPurchasesOverOfferingPrice |
none
|
|
| Maximum deferred sales charge (load) (as a percentage of offering price) |
rr_MaximumDeferredSalesChargeOverOfferingPrice |
1.00%
|
|
| Management Fees |
rr_ManagementFeesOverAssets |
0.35%
|
|
| Distribution (12b-1) Fees |
rr_DistributionAndService12b1FeesOverAssets |
0.75%
|
|
| Other Expenses |
rr_OtherExpensesOverAssets |
0.44%
|
|
| Total Annual Fund Operating Expenses |
rr_ExpensesOverAssets |
1.54%
|
|
| Fee Waivers |
rr_FeeWaiverOrReimbursementOverAssets |
(0.01%)
|
|
| Total Annual Fund Operating Expenses After Fee Waivers |
rr_NetExpensesOverAssets |
1.53%
|
[3] |
| Expense Example, with Redemption, 1 Year |
rr_ExpenseExampleYear01 |
$ 256
|
|
| Expense Example, with Redemption, 3 Years |
rr_ExpenseExampleYear03 |
485
|
|
| Expense Example, with Redemption, 5 Years |
rr_ExpenseExampleYear05 |
838
|
|
| Expense Example, with Redemption, 10 Years |
rr_ExpenseExampleYear10 |
1,834
|
|
| Expense Example, No Redemption, 1 Year |
rr_ExpenseExampleNoRedemptionYear01 |
156
|
|
| Expense Example, No Redemption, 3 Years |
rr_ExpenseExampleNoRedemptionYear03 |
485
|
|
| Expense Example, No Redemption, 5 Years |
rr_ExpenseExampleNoRedemptionYear05 |
838
|
|
| Expense Example, No Redemption, 10 Years |
rr_ExpenseExampleNoRedemptionYear10 |
$ 1,834
|
|
| 1 Year |
rr_AverageAnnualReturnYear01 |
(0.90%)
|
|
| 5 Years |
rr_AverageAnnualReturnYear05 |
(0.14%)
|
|
| 10 Years |
rr_AverageAnnualReturnYear10 |
1.74%
|
|
| Inception Date of Share Class |
rr_AverageAnnualReturnInceptionDate |
May 31, 2002
|
|
| (WFA Income Funds - Classes A and C) | (Wells Fargo Short-Term Bond Fund) |
|
|
|
| Prospectus: |
rr_ProspectusTable |
|
|
| Objective [Heading] |
rr_ObjectiveHeading |
Investment Objective
|
|
| Objective, Primary [Text Block] |
rr_ObjectivePrimaryTextBlock |
The Fund seeks current income consistent with capital preservation.
|
|
| Expense [Heading] |
rr_ExpenseHeading |
Fees and Expenses
|
|
| Expense Narrative [Text Block] |
rr_ExpenseNarrativeTextBlock |
These tables are intended to help you understand the various costs and expenses you will pay if you buy and hold shares of the Fund. You may qualify for sales charge discounts if you and your family invest, or agree to invest in the future, at least $50,000 in the aggregate in specified classes of certain Wells Fargo Funds. More information about these and other discounts is available from your financial professional and in "Share Class Features" and "Reductions and Waivers of Sales Charges" on pages 52 and 54 of the Prospectus and "Additional Purchase and Redemption Information" on page 71 of the Statement of Additional Information. Investors who purchase through certain intermediaries may be subject to different sales charge discounts than those outlined shares in these sections. Please see Appendix A on page 74 for further information.
|
|
| Expense Breakpoint Discounts [Text] |
rr_ExpenseBreakpointDiscounts |
You may qualify for sales charge discounts if you and your family invest, or agree to invest in the future, at least $50,000 in the aggregate in specified classes of certain Wells Fargo Funds.
|
|
| Expense Breakpoint, Minimum Investment Required [Amount] |
rr_ExpenseBreakpointMinimumInvestmentRequiredAmount |
$ 50,000
|
|
| Shareholder Fees Caption [Text] |
rr_ShareholderFeesCaption |
Shareholder Fees (fees paid directly from your investment)
|
|
| Operating Expenses Caption [Text] |
rr_OperatingExpensesCaption |
Annual Fund Operating Expenses (expenses that you pay each year as a percentage of the value of your investment)
|
|
| Fee Waiver or Reimbursement over Assets, Date of Termination |
rr_FeeWaiverOrReimbursementOverAssetsDateOfTermination |
December 31, 2018
|
|
| Expenses Deferred Charges [Text Block] |
rr_ExpensesDeferredChargesTextBlock |
Investments of $500,000 or more are not subject to a front-end sales charge but generally will be subject to a deferred sales charge of 0.40% if redeemed within 12 months from the date of purchase.
|
|
| Expense Example [Heading] |
rr_ExpenseExampleHeading |
Example of Expenses
|
|
| Expense Example Narrative [Text Block] |
rr_ExpenseExampleNarrativeTextBlock |
The example below is intended to help you compare the costs of investing in the Fund with the costs of investing in other mutual funds. The example assumes a $10,000 initial investment, 5% annual total return, and that fees and expenses remain the same as in the tables above. To the extent that the Manager is waiving fees or reimbursing expenses, the example assumes that such waiver or reimbursement will only be in place through the date noted above. Although your actual costs may be higher or lower, based on these assumptions your costs would be:
|
|
| Expense Example by, Year, Caption [Text] |
rr_ExpenseExampleByYearCaption |
Assuming Redemption at End of Period
|
|
| Expense Example, No Redemption, By Year, Caption [Text] |
rr_ExpenseExampleNoRedemptionByYearCaption |
Assuming No Redemption
|
|
| Portfolio Turnover [Heading] |
rr_PortfolioTurnoverHeading |
Portfolio Turnover
|
|
| Portfolio Turnover [Text Block] |
rr_PortfolioTurnoverTextBlock |
The Fund pays transaction costs, such as commissions, when it buys and sells securities (or "turns over" its portfolio). A higher portfolio turnover rate may indicate higher transaction costs and may result in higher taxes when Fund shares are held in a taxable account. These costs, which are not reflected in annual fund operating expenses or in the example, affect the Fund's performance. During the most recent fiscal year, the Fund's portfolio turnover rate was 50% of the average value of its portfolio.
|
|
| Portfolio Turnover, Rate |
rr_PortfolioTurnoverRate |
50.00%
|
|
| Strategy [Heading] |
rr_StrategyHeading |
Principal Investment Strategies
|
|
| Strategy Narrative [Text Block] |
rr_StrategyNarrativeTextBlock |
Under normal circumstances, we invest:
-
at least 80% of the Fund's net assets in debt securities;
-
up to 25% of the Fund's total assets in U.S. dollar-denominated debt securities of foreign issuers; and
-
up to 15% of the Fund's total assets in below investment-grade debt securities.
We invest principally in debt securities. We may invest in a variety of debt securities, including corporate, mortgage- and asset-backed securities, bank loans and U.S. Government obligations. These securities may have fixed, floating or variable rates. We invest in both investment-grade and below investment-grade debt securities (often called "high yield securities" or "junk bonds") and may also invest in U.S. dollar-denominated debt securities of foreign issuers. As part of our below investment-grade debt securities investment strategy, we will generally invest in securities that are rated at least BB by Standard & Poor's or Ba by Moody's, or an equivalent quality rating from another Nationally Recognized Statistical Ratings Organization, or are deemed by us to be of comparable quality. We may also use futures for duration and yield curve management. While we may purchase securities of any maturity, under normal circumstances, we expect the Fund's dollar-weighted average effective maturity to be three years or less. "Dollar-Weighted Average Effective Maturity" is a measure of the average time until the final payment of principal and interest is due on fixed income securities in the Fund's portfolio.
We employ a top-down macroeconomic outlook to determine the portfolio's duration, yield curve positioning, credit quality and sector allocation. Macroeconomic factors considered may include, among others, the pace of economic growth, employment conditions, corporate profits, inflation, monetary and fiscal policy, as well as the influence of international economic and financial conditions. In combination with our top-down macroeconomic approach, we employ a bottom-up process of fundamental securities analysis to determine the specific securities for investment. Elements of this evaluation may include credit research, duration measurements, historical yield spread relationships, volatility trends, mortgage refinance rates, as well as other factors. Our credit analysis may consider an issuer's general financial condition, its competitive position and its management strategies, as well as industry characteristics and other factors. We may sell a security due to changes in credit characteristics or outlook, as well as changes in portfolio strategy or cash flow needs. A security may also be sold and replaced with one that presents a better value or risk/reward profile.
|
|
| Risk [Heading] |
rr_RiskHeading |
Principal Investment Risks
|
|
| Risk Narrative [Text Block] |
rr_RiskNarrativeTextBlock |
An investment in the Fund may lose money, is not a deposit of Wells Fargo Bank, N.A. or its affiliates, is not insured or guaranteed by the Federal Deposit Insurance Corporation or any other governmental agency, and is primarily subject to the risks briefly summarized below.
Credit Risk. The issuer or guarantor of a debt security may be unable or perceived to be unable to pay interest or repay principal when they become due, which could cause the value of an investment to decline and a Fund to lose money.
Derivatives Risk. The use of derivatives, such as futures, options and swap agreements, can lead to losses, including those magnified by leverage, particularly when derivatives are used to enhance return rather than mitigate risk. Certain derivative instruments may be difficult to sell when the portfolio manager believes it would be appropriate to do so, or the other party to a derivative contract may be unwilling or unable to fulfill its contractual obligations.
Foreign Investment Risk. Foreign investments may be subject to lower liquidity, greater price volatility and risks related to adverse political, regulatory, market or economic developments. Foreign investments may involve exposure to changes in foreign currency exchange rates and may be subject to higher withholding and other taxes.
Futures Contracts Risk. A Fund that uses futures contracts, which are a type of derivative, is subject to the risk of loss caused by unanticipated market movements. In addition, there may at times be an imperfect correlation between the movement in the prices of futures contracts and the value of their underlying instruments or indexes and there may at times not be a liquid secondary market for certain futures contracts.
High Yield Securities Risk. High yield securities and unrated securities of similar credit quality (commonly known as "junk bonds") have a much greater risk of default or of not returning principal and their values tend to be more volatile than higher-rated securities with similar maturities.
Interest Rate Risk. When interest rates (which are currently near historic lows) rise, the value of debt securities tends to fall. When interest rates decline, interest that a Fund is able to earn on its investments in debt securities may also decline, but the value of those securities may increase.
Loan Risk. Loans may be unrated, less liquid and more difficult to value than traditional debt securities. The highly leveraged capital structure of the borrowers in such transactions may make such loans especially vulnerable to adverse changes in financial, economic or market conditions. A Fund may be unable to sell loans at a desired time or price. The Fund may also not be able to control amendments, waivers or the exercise of any remedies that a lender would have under a direct loan and may assume liability as a lender.
Management Risk. Investment decisions, techniques, analyses or models implemented by a Fund's manager or sub-adviser in seeking to achieve the Fund's investment objective may not produce the returns expected, may cause the Fund's shares to lose value or may cause the Fund to underperform other funds with similar investment objectives.
Market Risk. The values of, and/or the income generated by, securities held by a Fund may decline due to general market conditions or other factors, including those directly involving the issuers of such securities. Security markets are volatile and may decline significantly in response to adverse issuer, regulatory, political, or economic developments. Different sectors of the market and different security types may react differently to such developments.
Mortgage- and Asset-Backed Securities Risk. Mortgage- and asset-backed securities may decline in value and become less liquid when defaults on the underlying mortgages or assets occur and may exhibit additional volatility in periods of rising interest rates. Rising interest rates tend to extend the duration of these securities, making them more sensitive to changes in interest rates than instruments with fixed payment schedules. When interest rates decline or are low, the prepayment of mortgages or assets underlying such securities can reduce a Fund's returns.
U.S. Government Obligations Risk. U.S. Government obligations may be adversely impacted by changes in interest rates, and securities issued or guaranteed by U.S. Government agencies or government-sponsored entities may not be backed by the full faith and credit of the U.S. Government.
|
|
| Risk Lose Money [Text] |
rr_RiskLoseMoney |
An investment in the Fund may lose money
|
|
| Risk Not Insured Depository Institution [Text] |
rr_RiskNotInsuredDepositoryInstitution |
An investment in the Fund may lose money, is not a deposit of Wells Fargo Bank, N.A. or its affiliates, is not insured or guaranteed by the Federal Deposit Insurance Corporation or any other governmental agency
|
|
| Bar Chart and Performance Table [Heading] |
rr_BarChartAndPerformanceTableHeading |
Performance
|
|
| Performance Narrative [Text Block] |
rr_PerformanceNarrativeTextBlock |
The following information provides some indication of the risks of investing in the Fund by showing changes in the Fund's performance from year to year. The Fund's average annual total returns are compared to the performance of one or more indices. Past performance before and after taxes is no guarantee of future results. Current month-end performance is available on the Fund's website at wellsfargofunds.com.
|
|
| Bar Chart Does Not Reflect Sales Loads [Text] |
rr_BarChartDoesNotReflectSalesLoads |
Returns do not reflect sales charges and would be lower if they did
|
|
| Bar Chart Closing [Text Block] |
rr_BarChartClosingTextBlock |
Highest Quarter: 3rd Quarter 2009 | +3.68% | | Lowest Quarter: 3rd Quarter 2008 | -1.11% | Year-to-date total return as of 9/30/2017 is +1.28% |
|
|
| Performance Table Heading |
rr_PerformanceTableHeading |
Average Annual Total Returns for the periods ended 12/31/2016 (returns reflect applicable sales charges)
|
[11] |
| Performance Table Closing [Text Block] |
rr_PerformanceTableClosingTextBlock |
After-tax returns are calculated using the historical highest individual federal marginal income tax rates and do not reflect the impact of state, local or foreign taxes. Actual after-tax returns depend on an investor's tax situation and may differ from those shown, and after-tax returns shown are not relevant to tax-exempt investors or investors who hold their Fund shares through tax-deferred arrangements, such as 401(k) Plans or Individual Retirement Accounts. After-tax returns are shown for only one class of shares. After-tax returns for any other class will vary.
|
|
| Performance Table Does Reflect Sales Loads |
rr_PerformanceTableDoesReflectSalesLoads |
returns reflect applicable sales charges
|
|
| Performance Table Uses Highest Federal Rate |
rr_PerformanceTableUsesHighestFederalRate |
After-tax returns are calculated using the historical highest individual federal marginal income tax rates and do not reflect the impact of state, local or foreign taxes.
|
|
| Performance Table Not Relevant to Tax Deferred |
rr_PerformanceTableNotRelevantToTaxDeferred |
Actual after-tax returns depend on an investor's tax situation and may differ from those shown, and after-tax returns shown are not relevant to tax-exempt investors or investors who hold their Fund shares through tax-deferred arrangements, such as 401(k) Plans or Individual Retirement Accounts.
|
|
| Performance Past Does Not Indicate Future [Text] |
rr_PerformancePastDoesNotIndicateFuture |
Past performance before and after taxes is no guarantee of future results.
|
|
| Performance Information Illustrates Variability of Returns [Text] |
rr_PerformanceInformationIllustratesVariabilityOfReturns |
The following information provides some indication of the risks of investing in the Fund by showing changes in the Fund's performance from year to year. The Fund's average annual total returns are compared to the performance of one or more indices. Past performance before and after taxes is no guarantee of future results.
|
|
| Performance Table One Class of after Tax Shown [Text] |
rr_PerformanceTableOneClassOfAfterTaxShown |
After-tax returns are shown for only one class of shares.
|
|
| Performance Availability Website Address [Text] |
rr_PerformanceAvailabilityWebSiteAddress |
wellsfargofunds.com
|
|
| (WFA Income Funds - Classes A and C) | (Wells Fargo Short-Term Bond Fund) | Bloomberg Barclays U.S. 1-3 Year Government/Credit Bond Index (reflects no deduction for fees, expenses, or taxes) |
|
|
|
| Prospectus: |
rr_ProspectusTable |
|
|
| 1 Year |
rr_AverageAnnualReturnYear01 |
1.28%
|
|
| 5 Years |
rr_AverageAnnualReturnYear05 |
0.92%
|
|
| 10 Years |
rr_AverageAnnualReturnYear10 |
2.44%
|
|
| (WFA Income Funds - Classes A and C) | (Wells Fargo Short-Term Bond Fund) | Class A |
|
|
|
| Prospectus: |
rr_ProspectusTable |
|
|
| Maximum sales charge (load) imposed on purchases (as a percentage of offering price) |
rr_MaximumSalesChargeImposedOnPurchasesOverOfferingPrice |
2.00%
|
|
| Maximum deferred sales charge (load) (as a percentage of offering price) |
rr_MaximumDeferredSalesChargeOverOfferingPrice |
none
|
[2] |
| Management Fees |
rr_ManagementFeesOverAssets |
0.35%
|
|
| Distribution (12b-1) Fees |
rr_DistributionAndService12b1FeesOverAssets |
none
|
|
| Other Expenses |
rr_OtherExpensesOverAssets |
0.46%
|
|
| Acquired Fund Fees and Expenses |
rr_AcquiredFundFeesAndExpensesOverAssets |
0.01%
|
|
| Total Annual Fund Operating Expenses |
rr_ExpensesOverAssets |
0.82%
|
|
| Fee Waivers |
rr_FeeWaiverOrReimbursementOverAssets |
(0.09%)
|
|
| Total Annual Fund Operating Expenses After Fee Waivers |
rr_NetExpensesOverAssets |
0.73%
|
[12] |
| Expense Example, with Redemption, 1 Year |
rr_ExpenseExampleYear01 |
$ 273
|
|
| Expense Example, with Redemption, 3 Years |
rr_ExpenseExampleYear03 |
448
|
|
| Expense Example, with Redemption, 5 Years |
rr_ExpenseExampleYear05 |
637
|
|
| Expense Example, with Redemption, 10 Years |
rr_ExpenseExampleYear10 |
$ 1,185
|
|
| Bar Chart [Heading] |
rr_BarChartHeading |
Calendar Year Total Returns for Class A as of 12/31 each year (Returns do not reflect sales charges and would be lower if they did)
|
[11] |
| Annual Return 2007 |
rr_AnnualReturn2007 |
4.55%
|
|
| Annual Return 2008 |
rr_AnnualReturn2008 |
(0.40%)
|
|
| Annual Return 2009 |
rr_AnnualReturn2009 |
9.37%
|
|
| Annual Return 2010 |
rr_AnnualReturn2010 |
4.33%
|
|
| Annual Return 2011 |
rr_AnnualReturn2011 |
1.82%
|
|
| Annual Return 2012 |
rr_AnnualReturn2012 |
2.86%
|
|
| Annual Return 2013 |
rr_AnnualReturn2013 |
0.80%
|
|
| Annual Return 2014 |
rr_AnnualReturn2014 |
0.93%
|
|
| Annual Return 2015 |
rr_AnnualReturn2015 |
0.63%
|
|
| Annual Return 2016 |
rr_AnnualReturn2016 |
1.92%
|
|
| Year to Date Return, Label |
rr_YearToDateReturnLabel |
Year-to-date total return as of 9/30/2017 is +1.28%
|
|
| Bar Chart, Year to Date Return |
rr_BarChartYearToDateReturn |
1.28%
|
|
| Bar Chart, Year to Date Return, Date |
rr_BarChartYearToDateReturnDate |
Sep. 30, 2017
|
|
| Highest Quarterly Return, Label |
rr_HighestQuarterlyReturnLabel |
Highest Quarter: 3rd Quarter 2009
|
|
| Highest Quarterly Return |
rr_BarChartHighestQuarterlyReturn |
3.68%
|
|
| Highest Quarterly Return, Date |
rr_BarChartHighestQuarterlyReturnDate |
Sep. 30, 2009
|
|
| Lowest Quarterly Return, Label |
rr_LowestQuarterlyReturnLabel |
Lowest Quarter: 3rd Quarter 2008
|
|
| Lowest Quarterly Return |
rr_BarChartLowestQuarterlyReturn |
(1.11%)
|
|
| Lowest Quarterly Return, Date |
rr_BarChartLowestQuarterlyReturnDate |
Sep. 30, 2008
|
|
| 1 Year |
rr_AverageAnnualReturnYear01 |
(0.12%)
|
|
| 5 Years |
rr_AverageAnnualReturnYear05 |
1.02%
|
|
| 10 Years |
rr_AverageAnnualReturnYear10 |
2.44%
|
|
| Inception Date of Share Class |
rr_AverageAnnualReturnInceptionDate |
Aug. 31, 1999
|
|
| (WFA Income Funds - Classes A and C) | (Wells Fargo Short-Term Bond Fund) | Class A | (after taxes on distributions) |
|
|
|
| Prospectus: |
rr_ProspectusTable |
|
|
| 1 Year |
rr_AverageAnnualReturnYear01 |
(0.69%)
|
|
| 5 Years |
rr_AverageAnnualReturnYear05 |
0.48%
|
|
| 10 Years |
rr_AverageAnnualReturnYear10 |
1.57%
|
|
| Inception Date of Share Class |
rr_AverageAnnualReturnInceptionDate |
Aug. 31, 1999
|
|
| (WFA Income Funds - Classes A and C) | (Wells Fargo Short-Term Bond Fund) | Class A | (after taxes on distributions and the sale of Fund Shares) |
|
|
|
| Prospectus: |
rr_ProspectusTable |
|
|
| 1 Year |
rr_AverageAnnualReturnYear01 |
(0.07%)
|
|
| 5 Years |
rr_AverageAnnualReturnYear05 |
0.55%
|
|
| 10 Years |
rr_AverageAnnualReturnYear10 |
1.54%
|
|
| Inception Date of Share Class |
rr_AverageAnnualReturnInceptionDate |
Aug. 31, 1999
|
|
| (WFA Income Funds - Classes A and C) | (Wells Fargo Short-Term Bond Fund) | Class C |
|
|
|
| Prospectus: |
rr_ProspectusTable |
|
|
| Maximum sales charge (load) imposed on purchases (as a percentage of offering price) |
rr_MaximumSalesChargeImposedOnPurchasesOverOfferingPrice |
none
|
|
| Maximum deferred sales charge (load) (as a percentage of offering price) |
rr_MaximumDeferredSalesChargeOverOfferingPrice |
1.00%
|
|
| Management Fees |
rr_ManagementFeesOverAssets |
0.35%
|
|
| Distribution (12b-1) Fees |
rr_DistributionAndService12b1FeesOverAssets |
0.75%
|
|
| Other Expenses |
rr_OtherExpensesOverAssets |
0.46%
|
|
| Acquired Fund Fees and Expenses |
rr_AcquiredFundFeesAndExpensesOverAssets |
0.01%
|
|
| Total Annual Fund Operating Expenses |
rr_ExpensesOverAssets |
1.57%
|
|
| Fee Waivers |
rr_FeeWaiverOrReimbursementOverAssets |
(0.09%)
|
|
| Total Annual Fund Operating Expenses After Fee Waivers |
rr_NetExpensesOverAssets |
1.48%
|
[12] |
| Expense Example, with Redemption, 1 Year |
rr_ExpenseExampleYear01 |
$ 251
|
|
| Expense Example, with Redemption, 3 Years |
rr_ExpenseExampleYear03 |
487
|
|
| Expense Example, with Redemption, 5 Years |
rr_ExpenseExampleYear05 |
847
|
|
| Expense Example, with Redemption, 10 Years |
rr_ExpenseExampleYear10 |
1,860
|
|
| Expense Example, No Redemption, 1 Year |
rr_ExpenseExampleNoRedemptionYear01 |
151
|
|
| Expense Example, No Redemption, 3 Years |
rr_ExpenseExampleNoRedemptionYear03 |
487
|
|
| Expense Example, No Redemption, 5 Years |
rr_ExpenseExampleNoRedemptionYear05 |
847
|
|
| Expense Example, No Redemption, 10 Years |
rr_ExpenseExampleNoRedemptionYear10 |
$ 1,860
|
|
| 1 Year |
rr_AverageAnnualReturnYear01 |
0.05%
|
|
| 5 Years |
rr_AverageAnnualReturnYear05 |
0.65%
|
|
| 10 Years |
rr_AverageAnnualReturnYear10 |
1.85%
|
|
| Inception Date of Share Class |
rr_AverageAnnualReturnInceptionDate |
Mar. 31, 2008
|
|
| (WFA Income Funds - Classes A and C) | (Wells Fargo Short-Term High Yield Bond Fund) |
|
|
|
| Prospectus: |
rr_ProspectusTable |
|
|
| Objective [Heading] |
rr_ObjectiveHeading |
Investment Objective
|
|
| Objective, Primary [Text Block] |
rr_ObjectivePrimaryTextBlock |
The Fund seeks total return, consisting of a high level of current income and capital appreciation.
|
|
| Expense [Heading] |
rr_ExpenseHeading |
Fees and Expenses
|
|
| Expense Narrative [Text Block] |
rr_ExpenseNarrativeTextBlock |
These tables are intended to help you understand the various costs and expenses you will pay if you buy and hold shares of the Fund. You may qualify for sales charge discounts if you and your family invest, or agree to invest in the future, at least $50,000 in the aggregate in specified classes of certain Wells Fargo Funds. More information about these and other discounts is available from your financial professional and in "Share Class Features" and "Reductions and Waivers of Sales Charges" on pages 52 and 54 of the Prospectus and "Additional Purchase and Redemption Information" on page 71 of the Statement of Additional Information. Investors who purchase through certain intermediaries may be subject to different sales charge discounts than those outlined shares in these sections. Please see Appendix A on page 74 for further information.
|
|
| Expense Breakpoint Discounts [Text] |
rr_ExpenseBreakpointDiscounts |
You may qualify for sales charge discounts if you and your family invest, or agree to invest in the future, at least $50,000 in the aggregate in specified classes of certain Wells Fargo Funds.
|
|
| Expense Breakpoint, Minimum Investment Required [Amount] |
rr_ExpenseBreakpointMinimumInvestmentRequiredAmount |
$ 50,000
|
|
| Shareholder Fees Caption [Text] |
rr_ShareholderFeesCaption |
Shareholder Fees (fees paid directly from your investment)
|
|
| Operating Expenses Caption [Text] |
rr_OperatingExpensesCaption |
Annual Fund Operating Expenses (expenses that you pay each year as a percentage of the value of your investment)
|
|
| Fee Waiver or Reimbursement over Assets, Date of Termination |
rr_FeeWaiverOrReimbursementOverAssetsDateOfTermination |
December 31, 2018
|
|
| Expenses Deferred Charges [Text Block] |
rr_ExpensesDeferredChargesTextBlock |
Investments of $500,000 or more are not subject to a front-end sales charge but generally will be subject to a deferred sales charge of 0.50% if redeemed within 12 months from the date of purchase.
|
|
| Expense Example [Heading] |
rr_ExpenseExampleHeading |
Example of Expenses
|
|
| Expense Example Narrative [Text Block] |
rr_ExpenseExampleNarrativeTextBlock |
The example below is intended to help you compare the costs of investing in the Fund with the costs of investing in other mutual funds. The example assumes a $10,000 initial investment, 5% annual total return, and that fees and expenses remain the same as in the tables above. To the extent that the Manager is waiving fees or reimbursing expenses, the example assumes that such waiver or reimbursement will only be in place through the date noted above. Although your actual costs may be higher or lower, based on these assumptions your costs would be:
|
|
| Expense Example by, Year, Caption [Text] |
rr_ExpenseExampleByYearCaption |
Assuming Redemption at End of Period
|
|
| Expense Example, No Redemption, By Year, Caption [Text] |
rr_ExpenseExampleNoRedemptionByYearCaption |
Assuming No Redemption
|
|
| Portfolio Turnover [Heading] |
rr_PortfolioTurnoverHeading |
Portfolio Turnover
|
|
| Portfolio Turnover [Text Block] |
rr_PortfolioTurnoverTextBlock |
The Fund pays transaction costs, such as commissions, when it buys and sells securities (or "turns over" its portfolio). A higher portfolio turnover rate may indicate higher transaction costs and may result in higher taxes when Fund shares are held in a taxable account. These costs, which are not reflected in annual fund operating expenses or in the example, affect the Fund's performance. During the most recent fiscal year, the Fund's portfolio turnover rate was 35% of the average value of its portfolio.
|
|
| Portfolio Turnover, Rate |
rr_PortfolioTurnoverRate |
35.00%
|
|
| Strategy [Heading] |
rr_StrategyHeading |
Principal Investment Strategies
|
|
| Strategy Narrative [Text Block] |
rr_StrategyNarrativeTextBlock |
Under normal circumstances, we invest:
We invest principally in below investment-grade debt securities (often called "high-yield" securities or "junk bonds") of corporate issuers. These include traditional corporate bonds as well as bank loans. These securities may have fixed, floating or variable rates. As part of our below investment-grade debt securities investment strategy, we will generally invest in securities that are rated BB through CCC by Standard & Poor's or Ba through Caa by Moody's, or an equivalent quality rating from another Nationally Recognized Statistical Ratings Organization, or are deemed by us to be of comparable quality. We may also use credit default swap agreements to reduce cash positions and to cost-effectively increase credit exposure, and futures to manage duration exposure. While we may purchase securities of any maturity, under normal circumstances, we expect the Fund's dollar-weighted average effective maturity to be three years or less. "Dollar-Weighted Average Effective Maturity" is a measure of the average time until the final payment of principal and interest is due on fixed income securities in the Fund's portfolio.
We start our investment process with a focus on bottom-up fundamental credit analysis to generate new ideas, to understand the potential risks, to select individual securities that may potentially add value from income and/or capital appreciation. Our credit research may include an assessment of an issuer's general financial condition, its competitive positioning and management strength, as well as industry characteristics and other factors. We may sell a security due to changes in credit characteristics or outlook, as well as changes in portfolio strategy or cash flow needs. A security may also be sold and replaced with one that presents a better value or risk/reward profile.
|
|
| Risk [Heading] |
rr_RiskHeading |
Principal Investment Risks
|
|
| Risk Narrative [Text Block] |
rr_RiskNarrativeTextBlock |
An investment in the Fund may lose money, is not a deposit of Wells Fargo Bank, N.A. or its affiliates, is not insured or guaranteed by the Federal Deposit Insurance Corporation or any other governmental agency, and is primarily subject to the risks briefly summarized below.
Credit Risk. The issuer or guarantor of a debt security may be unable or perceived to be unable to pay interest or repay principal when they become due, which could cause the value of an investment to decline and a Fund to lose money.
Derivatives Risk. The use of derivatives, such as futures, options and swap agreements, can lead to losses, including those magnified by leverage, particularly when derivatives are used to enhance return rather than mitigate risk. Certain derivative instruments may be difficult to sell when the portfolio manager believes it would be appropriate to do so, or the other party to a derivative contract may be unwilling or unable to fulfill its contractual obligations.
Foreign Investment Risk. Foreign investments may be subject to lower liquidity, greater price volatility and risks related to adverse political, regulatory, market or economic developments. Foreign investments may involve exposure to changes in foreign currency exchange rates and may be subject to higher withholding and other taxes.
Futures Contracts Risk. A Fund that uses futures contracts, which are a type of derivative, is subject to the risk of loss caused by unanticipated market movements. In addition, there may at times be an imperfect correlation between the movement in the prices of futures contracts and the value of their underlying instruments or indexes and there may at times not be a liquid secondary market for certain futures contracts.
High Yield Securities Risk. High yield securities and unrated securities of similar credit quality (commonly known as "junk bonds") have a much greater risk of default or of not returning principal and their values tend to be more volatile than higher-rated securities with similar maturities.
Interest Rate Risk. When interest rates (which are currently near historic lows) rise, the value of debt securities tends to fall. When interest rates decline, interest that a Fund is able to earn on its investments in debt securities may also decline, but the value of those securities may increase.
Loan Risk. Loans may be unrated, less liquid and more difficult to value than traditional debt securities. The highly leveraged capital structure of the borrowers in such transactions may make such loans especially vulnerable to adverse changes in financial, economic or market conditions. A Fund may be unable to sell loans at a desired time or price. The Fund may also not be able to control amendments, waivers or the exercise of any remedies that a lender would have under a direct loan and may assume liability as a lender.
Management Risk. Investment decisions, techniques, analyses or models implemented by a Fund's manager or sub-adviser in seeking to achieve the Fund's investment objective may not produce the returns expected, may cause the Fund's shares to lose value or may cause the Fund to underperform other funds with similar investment objectives.
Market Risk. The values of, and/or the income generated by, securities held by a Fund may decline due to general market conditions or other factors, including those directly involving the issuers of such securities. Security markets are volatile and may decline significantly in response to adverse issuer, regulatory, political, or economic developments. Different sectors of the market and different security types may react differently to such developments.
Swaps Risk. Depending on their structure, swap agreements and options to enter into swap agreements ("swaptions"), both of which are types of derivatives, may increase or decrease a Fund's exposure to long- or short-term interest rates, foreign currency values, mortgage-backed securities, corporate borrowing rates, or credit events or other reference points such as security prices or inflation rates.
|
|
| Risk Lose Money [Text] |
rr_RiskLoseMoney |
An investment in the Fund may lose money
|
|
| Risk Not Insured Depository Institution [Text] |
rr_RiskNotInsuredDepositoryInstitution |
An investment in the Fund may lose money, is not a deposit of Wells Fargo Bank, N.A. or its affiliates, is not insured or guaranteed by the Federal Deposit Insurance Corporation or any other governmental agency
|
|
| Bar Chart and Performance Table [Heading] |
rr_BarChartAndPerformanceTableHeading |
Performance
|
|
| Performance Narrative [Text Block] |
rr_PerformanceNarrativeTextBlock |
The following information provides some indication of the risks of investing in the Fund by showing changes in the Fund's performance from year to year. The Fund's average annual total returns are compared to the performance of one or more indices. Past performance before and after taxes is no guarantee of future results. Current month-end performance is available on the Fund's website at wellsfargofunds.com.
|
|
| Bar Chart Does Not Reflect Sales Loads [Text] |
rr_BarChartDoesNotReflectSalesLoads |
Returns do not reflect sales charges and would be lower if they did
|
|
| Bar Chart Closing [Text Block] |
rr_BarChartClosingTextBlock |
Highest Quarter: 1st Quarter 2009 | +4.75% | | Lowest Quarter: 4th Quarter 2008 | -5.69% | Year-to-date total return as of 9/30/2017 is +1.87% |
|
|
| Performance Table Heading |
rr_PerformanceTableHeading |
Average Annual Total Returns for the periods ended 12/31/2016 (returns reflect applicable sales charges)
|
[13] |
| Performance Table Closing [Text Block] |
rr_PerformanceTableClosingTextBlock |
After-tax returns are calculated using the historical highest individual federal marginal income tax rates and do not reflect the impact of state, local or foreign taxes. Actual after-tax returns depend on an investor's tax situation and may differ from those shown, and after-tax returns shown are not relevant to tax-exempt investors or investors who hold their Fund shares through tax-deferred arrangements, such as 401(k) Plans or Individual Retirement Accounts. After-tax returns are shown for only one class of shares. After-tax returns for any other class will vary.
|
|
| Performance Table Does Reflect Sales Loads |
rr_PerformanceTableDoesReflectSalesLoads |
returns reflect applicable sales charges
|
|
| Performance Table Uses Highest Federal Rate |
rr_PerformanceTableUsesHighestFederalRate |
After-tax returns are calculated using the historical highest individual federal marginal income tax rates and do not reflect the impact of state, local or foreign taxes.
|
|
| Performance Table Not Relevant to Tax Deferred |
rr_PerformanceTableNotRelevantToTaxDeferred |
Actual after-tax returns depend on an investor's tax situation and may differ from those shown, and after-tax returns shown are not relevant to tax-exempt investors or investors who hold their Fund shares through tax-deferred arrangements, such as 401(k) Plans or Individual Retirement Accounts.
|
|
| Performance Past Does Not Indicate Future [Text] |
rr_PerformancePastDoesNotIndicateFuture |
Past performance before and after taxes is no guarantee of future results.
|
|
| Performance Information Illustrates Variability of Returns [Text] |
rr_PerformanceInformationIllustratesVariabilityOfReturns |
The following information provides some indication of the risks of investing in the Fund by showing changes in the Fund's performance from year to year. The Fund's average annual total returns are compared to the performance of one or more indices. Past performance before and after taxes is no guarantee of future results.
|
|
| Performance Table One Class of after Tax Shown [Text] |
rr_PerformanceTableOneClassOfAfterTaxShown |
After-tax returns are shown for only one class of shares.
|
|
| Performance Availability Website Address [Text] |
rr_PerformanceAvailabilityWebSiteAddress |
wellsfargofunds.com
|
|
| (WFA Income Funds - Classes A and C) | (Wells Fargo Short-Term High Yield Bond Fund) | ICE BofA Merrill Lynch High Yield U.S. Corporates, Cash Pay, BB Rated, 1-5 Years Index (reflects no deduction for fees, expenses, or taxes) |
|
|
|
| Prospectus: |
rr_ProspectusTable |
|
|
| 1 Year |
rr_AverageAnnualReturnYear01 |
10.39%
|
|
| 5 Years |
rr_AverageAnnualReturnYear05 |
6.37%
|
|
| 10 Years |
rr_AverageAnnualReturnYear10 |
6.59%
|
|
| (WFA Income Funds - Classes A and C) | (Wells Fargo Short-Term High Yield Bond Fund) | Class A |
|
|
|
| Prospectus: |
rr_ProspectusTable |
|
|
| Maximum sales charge (load) imposed on purchases (as a percentage of offering price) |
rr_MaximumSalesChargeImposedOnPurchasesOverOfferingPrice |
3.00%
|
|
| Maximum deferred sales charge (load) (as a percentage of offering price) |
rr_MaximumDeferredSalesChargeOverOfferingPrice |
none
|
[14] |
| Management Fees |
rr_ManagementFeesOverAssets |
0.48%
|
|
| Distribution (12b-1) Fees |
rr_DistributionAndService12b1FeesOverAssets |
none
|
|
| Other Expenses |
rr_OtherExpensesOverAssets |
0.44%
|
|
| Acquired Fund Fees and Expenses |
rr_AcquiredFundFeesAndExpensesOverAssets |
0.01%
|
|
| Total Annual Fund Operating Expenses |
rr_ExpensesOverAssets |
0.93%
|
|
| Fee Waivers |
rr_FeeWaiverOrReimbursementOverAssets |
(0.11%)
|
|
| Total Annual Fund Operating Expenses After Fee Waivers |
rr_NetExpensesOverAssets |
0.82%
|
[15] |
| Expense Example, with Redemption, 1 Year |
rr_ExpenseExampleYear01 |
$ 381
|
|
| Expense Example, with Redemption, 3 Years |
rr_ExpenseExampleYear03 |
577
|
|
| Expense Example, with Redemption, 5 Years |
rr_ExpenseExampleYear05 |
789
|
|
| Expense Example, with Redemption, 10 Years |
rr_ExpenseExampleYear10 |
$ 1,399
|
|
| Bar Chart [Heading] |
rr_BarChartHeading |
Calendar Year Total Returns for Class A as of 12/31 each year (Returns do not reflect sales charges and would be lower if they did)
|
[13] |
| Annual Return 2007 |
rr_AnnualReturn2007 |
3.24%
|
|
| Annual Return 2008 |
rr_AnnualReturn2008 |
(5.82%)
|
|
| Annual Return 2009 |
rr_AnnualReturn2009 |
15.34%
|
|
| Annual Return 2010 |
rr_AnnualReturn2010 |
7.12%
|
|
| Annual Return 2011 |
rr_AnnualReturn2011 |
3.35%
|
|
| Annual Return 2012 |
rr_AnnualReturn2012 |
6.49%
|
|
| Annual Return 2013 |
rr_AnnualReturn2013 |
3.46%
|
|
| Annual Return 2014 |
rr_AnnualReturn2014 |
0.52%
|
|
| Annual Return 2015 |
rr_AnnualReturn2015 |
2.13%
|
|
| Annual Return 2016 |
rr_AnnualReturn2016 |
4.40%
|
|
| Year to Date Return, Label |
rr_YearToDateReturnLabel |
Year-to-date total return as of 9/30/2017 is +1.87%
|
|
| Bar Chart, Year to Date Return |
rr_BarChartYearToDateReturn |
1.87%
|
|
| Bar Chart, Year to Date Return, Date |
rr_BarChartYearToDateReturnDate |
Sep. 30, 2017
|
|
| Highest Quarterly Return, Label |
rr_HighestQuarterlyReturnLabel |
Highest Quarter: 1st Quarter 2009
|
|
| Highest Quarterly Return |
rr_BarChartHighestQuarterlyReturn |
4.75%
|
|
| Highest Quarterly Return, Date |
rr_BarChartHighestQuarterlyReturnDate |
Mar. 31, 2009
|
|
| Lowest Quarterly Return, Label |
rr_LowestQuarterlyReturnLabel |
Lowest Quarter: 4th Quarter 2008
|
|
| Lowest Quarterly Return |
rr_BarChartLowestQuarterlyReturn |
(5.69%)
|
|
| Lowest Quarterly Return, Date |
rr_BarChartLowestQuarterlyReturnDate |
Dec. 31, 2008
|
|
| 1 Year |
rr_AverageAnnualReturnYear01 |
1.27%
|
|
| 5 Years |
rr_AverageAnnualReturnYear05 |
2.75%
|
|
| 10 Years |
rr_AverageAnnualReturnYear10 |
3.58%
|
|
| Inception Date of Share Class |
rr_AverageAnnualReturnInceptionDate |
Feb. 29, 2000
|
|
| (WFA Income Funds - Classes A and C) | (Wells Fargo Short-Term High Yield Bond Fund) | Class A | (after taxes on distributions) |
|
|
|
| Prospectus: |
rr_ProspectusTable |
|
|
| 1 Year |
rr_AverageAnnualReturnYear01 |
(0.01%)
|
|
| 5 Years |
rr_AverageAnnualReturnYear05 |
1.33%
|
|
| 10 Years |
rr_AverageAnnualReturnYear10 |
1.92%
|
|
| Inception Date of Share Class |
rr_AverageAnnualReturnInceptionDate |
Feb. 29, 2000
|
|
| (WFA Income Funds - Classes A and C) | (Wells Fargo Short-Term High Yield Bond Fund) | Class A | (after taxes on distributions and the sale of Fund Shares) |
|
|
|
| Prospectus: |
rr_ProspectusTable |
|
|
| 1 Year |
rr_AverageAnnualReturnYear01 |
0.71%
|
|
| 5 Years |
rr_AverageAnnualReturnYear05 |
1.48%
|
|
| 10 Years |
rr_AverageAnnualReturnYear10 |
2.08%
|
|
| Inception Date of Share Class |
rr_AverageAnnualReturnInceptionDate |
Feb. 29, 2000
|
|
| (WFA Income Funds - Classes A and C) | (Wells Fargo Short-Term High Yield Bond Fund) | Class C |
|
|
|
| Prospectus: |
rr_ProspectusTable |
|
|
| Maximum sales charge (load) imposed on purchases (as a percentage of offering price) |
rr_MaximumSalesChargeImposedOnPurchasesOverOfferingPrice |
none
|
|
| Maximum deferred sales charge (load) (as a percentage of offering price) |
rr_MaximumDeferredSalesChargeOverOfferingPrice |
1.00%
|
|
| Management Fees |
rr_ManagementFeesOverAssets |
0.48%
|
|
| Distribution (12b-1) Fees |
rr_DistributionAndService12b1FeesOverAssets |
0.75%
|
|
| Other Expenses |
rr_OtherExpensesOverAssets |
0.44%
|
|
| Acquired Fund Fees and Expenses |
rr_AcquiredFundFeesAndExpensesOverAssets |
0.01%
|
|
| Total Annual Fund Operating Expenses |
rr_ExpensesOverAssets |
1.68%
|
|
| Fee Waivers |
rr_FeeWaiverOrReimbursementOverAssets |
(0.11%)
|
|
| Total Annual Fund Operating Expenses After Fee Waivers |
rr_NetExpensesOverAssets |
1.57%
|
[15] |
| Expense Example, with Redemption, 1 Year |
rr_ExpenseExampleYear01 |
$ 260
|
|
| Expense Example, with Redemption, 3 Years |
rr_ExpenseExampleYear03 |
519
|
|
| Expense Example, with Redemption, 5 Years |
rr_ExpenseExampleYear05 |
902
|
|
| Expense Example, with Redemption, 10 Years |
rr_ExpenseExampleYear10 |
1,978
|
|
| Expense Example, No Redemption, 1 Year |
rr_ExpenseExampleNoRedemptionYear01 |
160
|
|
| Expense Example, No Redemption, 3 Years |
rr_ExpenseExampleNoRedemptionYear03 |
519
|
|
| Expense Example, No Redemption, 5 Years |
rr_ExpenseExampleNoRedemptionYear05 |
902
|
|
| Expense Example, No Redemption, 10 Years |
rr_ExpenseExampleNoRedemptionYear10 |
$ 1,978
|
|
| 1 Year |
rr_AverageAnnualReturnYear01 |
2.62%
|
|
| 5 Years |
rr_AverageAnnualReturnYear05 |
2.61%
|
|
| 10 Years |
rr_AverageAnnualReturnYear10 |
3.12%
|
|
| Inception Date of Share Class |
rr_AverageAnnualReturnInceptionDate |
Mar. 31, 2008
|
|
| (WFA Income Funds - Classes A and C) | (Wells Fargo Ultra Short-Term Income Fund) |
|
|
|
| Prospectus: |
rr_ProspectusTable |
|
|
| Objective [Heading] |
rr_ObjectiveHeading |
Investment Objective
|
|
| Objective, Primary [Text Block] |
rr_ObjectivePrimaryTextBlock |
The Fund seeks current income consistent with capital preservation.
|
|
| Expense [Heading] |
rr_ExpenseHeading |
Fees and Expenses
|
|
| Expense Narrative [Text Block] |
rr_ExpenseNarrativeTextBlock |
These tables are intended to help you understand the various costs and expenses you will pay if you buy and hold shares of the Fund. You may qualify for sales charge discounts if you and your family invest, or agree to invest in the future, at least $50,000 in the aggregate in specified classes of certain Wells Fargo Funds. More information about these and other discounts is available from your financial professional and in "Share Class Features" and "Reductions and Waivers of Sales Charges" on pages 52 and 54 of the Prospectus and "Additional Purchase and Redemption Information" on page 71 of the Statement of Additional Information. Investors who purchase through certain intermediaries may be subject to different sales charge discounts than those outlined shares in these sections. Please see Appendix A on page 74 for further information.
|
|
| Expense Breakpoint Discounts [Text] |
rr_ExpenseBreakpointDiscounts |
You may qualify for sales charge discounts if you and your family invest, or agree to invest in the future, at least $50,000 in the aggregate in specified classes of certain Wells Fargo Funds.
|
|
| Expense Breakpoint, Minimum Investment Required [Amount] |
rr_ExpenseBreakpointMinimumInvestmentRequiredAmount |
$ 50,000
|
|
| Shareholder Fees Caption [Text] |
rr_ShareholderFeesCaption |
Shareholder Fees (fees paid directly from your investment)
|
|
| Operating Expenses Caption [Text] |
rr_OperatingExpensesCaption |
Annual Fund Operating Expenses (expenses that you pay each year as a percentage of the value of your investment)
|
|
| Fee Waiver or Reimbursement over Assets, Date of Termination |
rr_FeeWaiverOrReimbursementOverAssetsDateOfTermination |
December 31, 2018
|
|
| Expense Example [Heading] |
rr_ExpenseExampleHeading |
Example of Expenses
|
|
| Expense Example Narrative [Text Block] |
rr_ExpenseExampleNarrativeTextBlock |
The example below is intended to help you compare the costs of investing in the Fund with the costs of investing in other mutual funds. The example assumes a $10,000 initial investment, 5% annual total return, and that fees and expenses remain the same as in the tables above. To the extent that the Manager is waiving fees or reimbursing expenses, the example assumes that such waiver or reimbursement will only be in place through the date noted above. Although your actual costs may be higher or lower, based on these assumptions your costs would be:
|
|
| Expense Example by, Year, Caption [Text] |
rr_ExpenseExampleByYearCaption |
Assuming Redemption at End of Period
|
|
| Expense Example, No Redemption, By Year, Caption [Text] |
rr_ExpenseExampleNoRedemptionByYearCaption |
Assuming No Redemption
|
|
| Portfolio Turnover [Heading] |
rr_PortfolioTurnoverHeading |
Portfolio Turnover
|
|
| Portfolio Turnover [Text Block] |
rr_PortfolioTurnoverTextBlock |
The Fund pays transaction costs, such as commissions, when it buys and sells securities (or "turns over" its portfolio). A higher portfolio turnover rate may indicate higher transaction costs and may result in higher taxes when Fund shares are held in a taxable account. These costs, which are not reflected in annual fund operating expenses or in the example, affect the Fund's performance. During the most recent fiscal year, the Fund's portfolio turnover rate was 56% of the average value of its portfolio.
|
|
| Portfolio Turnover, Rate |
rr_PortfolioTurnoverRate |
56.00%
|
|
| Strategy [Heading] |
rr_StrategyHeading |
Principal Investment Strategies
|
|
| Strategy Narrative [Text Block] |
rr_StrategyNarrativeTextBlock |
Under normal circumstances, we invest:
-
at least 80% of the Fund's net assets in income-producing debt securities;
-
up to 25% of the Fund's total assets in U.S. dollar-denominated debt securities of foreign issuers; and
-
up to 15% of the Fund's total assets in below investment-grade debt securities.
We invest principally in income-producing debt securities. Our portfolio holdings may include U.S. Government obligations, corporate debt securities, bank loans and mortgage- and asset-backed debt securities. These securities may have fixed, floating or variable rates. We may invest in investment-grade and below investment-grade debt securities (often called "high-yield" securities or "junk bonds"), as well as in debt securities of both domestic and foreign issuers. As part of our below investment-grade debt securities investment strategy, we will generally invest in securities that are rated at least BB by Standard & Poor's or Ba by Moody's, or an equivalent quality rating from another Nationally Recognized Statistical Ratings Organization, or are deemed by us to be of comparable quality. We may also use futures for duration and yield curve management. While we may purchase securities of any maturity, under normal circumstances, we expect the Fund's dollar-weighted average effective maturity to be one year or less. "Dollar-Weighted Average Effective Maturity" is a measure of the average time until the final payment of principal and interest is due on fixed income securities in the Fund's portfolio.
We employ a top-down, macroeconomic outlook to determine the portfolio's duration, yield curve positioning, credit quality and sector allocation. Macroeconomic factors considered may include, among others, the pace of economic growth, employment conditions, corporate profits, inflation, monetary and fiscal policy, as well as the influence of international economic and financial conditions. In combination with our top-down, macroeconomic approach, we employ a bottom-up process of fundamental securities analysis to select the specific securities for investment. Elements of this evaluation may include credit research, duration measurements, historical yield spread relationships, volatility trends, mortgage refinance rates, as well as other factors. Our credit analysis may consider an issuer's general financial condition, its competitive position and its management strategies, as well as industry characteristics and other factors. We may sell a security due to changes in credit characteristics or outlook, as well as changes in portfolio strategy or cash flow needs. A security may also be sold and replaced with one that presents a better value or risk/reward profile.
|
|
| Risk [Heading] |
rr_RiskHeading |
Principal Investment Risks
|
|
| Risk Narrative [Text Block] |
rr_RiskNarrativeTextBlock |
An investment in the Fund may lose money, is not a deposit of Wells Fargo Bank, N.A. or its affiliates, is not insured or guaranteed by the Federal Deposit Insurance Corporation or any other governmental agency, and is primarily subject to the risks briefly summarized below.
Credit Risk. The issuer or guarantor of a debt security may be unable or perceived to be unable to pay interest or repay principal when they become due, which could cause the value of an investment to decline and a Fund to lose money.
Derivatives Risk. The use of derivatives, such as futures, options and swap agreements, can lead to losses, including those magnified by leverage, particularly when derivatives are used to enhance return rather than mitigate risk. Certain derivative instruments may be difficult to sell when the portfolio manager believes it would be appropriate to do so, or the other party to a derivative contract may be unwilling or unable to fulfill its contractual obligations.
Foreign Investment Risk. Foreign investments may be subject to lower liquidity, greater price volatility and risks related to adverse political, regulatory, market or economic developments. Foreign investments may involve exposure to changes in foreign currency exchange rates and may be subject to higher withholding and other taxes.
Futures Contracts Risk. A Fund that uses futures contracts, which are a type of derivative, is subject to the risk of loss caused by unanticipated market movements. In addition, there may at times be an imperfect correlation between the movement in the prices of futures contracts and the value of their underlying instruments or indexes and there may at times not be a liquid secondary market for certain futures contracts.
High Yield Securities Risk. High yield securities and unrated securities of similar credit quality (commonly known as "junk bonds") have a much greater risk of default or of not returning principal and their values tend to be more volatile than higher-rated securities with similar maturities.
Interest Rate Risk. When interest rates (which are currently near historic lows) rise, the value of debt securities tends to fall. When interest rates decline, interest that a Fund is able to earn on its investments in debt securities may also decline, but the value of those securities may increase.
Loan Risk. Loans may be unrated, less liquid and more difficult to value than traditional debt securities. The highly leveraged capital structure of the borrowers in such transactions may make such loans especially vulnerable to adverse changes in financial, economic or market conditions. A Fund may be unable to sell loans at a desired time or price. The Fund may also not be able to control amendments, waivers or the exercise of any remedies that a lender would have under a direct loan and may assume liability as a lender.
Management Risk. Investment decisions, techniques, analyses or models implemented by a Fund's manager or sub-adviser in seeking to achieve the Fund's investment objective may not produce the returns expected, may cause the Fund's shares to lose value or may cause the Fund to underperform other funds with similar investment objectives.
Market Risk. The values of, and/or the income generated by, securities held by a Fund may decline due to general market conditions or other factors, including those directly involving the issuers of such securities. Security markets are volatile and may decline significantly in response to adverse issuer, regulatory, political, or economic developments. Different sectors of the market and different security types may react differently to such developments.
Mortgage- and Asset-Backed Securities Risk. Mortgage- and asset-backed securities may decline in value and become less liquid when defaults on the underlying mortgages or assets occur and may exhibit additional volatility in periods of rising interest rates. Rising interest rates tend to extend the duration of these securities, making them more sensitive to changes in interest rates than instruments with fixed payment schedules. When interest rates decline or are low, the prepayment of mortgages or assets underlying such securities can reduce a Fund's returns.
U.S. Government Obligations Risk. U.S. Government obligations may be adversely impacted by changes in interest rates, and securities issued or guaranteed by U.S. Government agencies or government-sponsored entities may not be backed by the full faith and credit of the U.S. Government.
|
|
| Risk Lose Money [Text] |
rr_RiskLoseMoney |
An investment in the Fund may lose money
|
|
| Risk Not Insured Depository Institution [Text] |
rr_RiskNotInsuredDepositoryInstitution |
An investment in the Fund may lose money, is not a deposit of Wells Fargo Bank, N.A. or its affiliates, is not insured or guaranteed by the Federal Deposit Insurance Corporation or any other governmental agency
|
|
| Bar Chart and Performance Table [Heading] |
rr_BarChartAndPerformanceTableHeading |
Performance
|
|
| Performance Narrative [Text Block] |
rr_PerformanceNarrativeTextBlock |
The following information provides some indication of the risks of investing in the Fund by showing changes in the Fund's performance from year to year. The Fund's average annual total returns are compared to the performance of one or more indices. Past performance before and after taxes is no guarantee of future results. Current month-end performance is available on the Fund's website at wellsfargofunds.com.
|
|
| Bar Chart Does Not Reflect Sales Loads [Text] |
rr_BarChartDoesNotReflectSalesLoads |
Returns do not reflect sales charges and would be lower if they did
|
|
| Bar Chart Closing [Text Block] |
rr_BarChartClosingTextBlock |
Highest Quarter: 3rd Quarter 2009 | +3.84% | | Lowest Quarter: 4th Quarter 2008 | -4.74% | Year-to-date total return as of 9/30/2017 is +0.96% |
|
|
| Performance Table Heading |
rr_PerformanceTableHeading |
Average Annual Total Returns for the periods ended 12/31/2016 (returns reflect applicable sales charges)
|
[16] |
| Performance Table Closing [Text Block] |
rr_PerformanceTableClosingTextBlock |
After-tax returns are calculated using the historical highest individual federal marginal income tax rates and do not reflect the impact of state, local or foreign taxes. Actual after-tax returns depend on an investor's tax situation and may differ from those shown, and after-tax returns shown are not relevant to tax-exempt investors or investors who hold their Fund shares through tax-deferred arrangements, such as 401(k) Plans or Individual Retirement Accounts. After-tax returns are shown for only one class of shares. After-tax returns for any other class will vary.
|
|
| Performance Table Does Reflect Sales Loads |
rr_PerformanceTableDoesReflectSalesLoads |
returns reflect applicable sales charges
|
|
| Performance Table Uses Highest Federal Rate |
rr_PerformanceTableUsesHighestFederalRate |
After-tax returns are calculated using the historical highest individual federal marginal income tax rates and do not reflect the impact of state, local or foreign taxes.
|
|
| Performance Table Not Relevant to Tax Deferred |
rr_PerformanceTableNotRelevantToTaxDeferred |
Actual after-tax returns depend on an investor's tax situation and may differ from those shown, and after-tax returns shown are not relevant to tax-exempt investors or investors who hold their Fund shares through tax-deferred arrangements, such as 401(k) Plans or Individual Retirement Accounts.
|
|
| Performance Past Does Not Indicate Future [Text] |
rr_PerformancePastDoesNotIndicateFuture |
Past performance before and after taxes is no guarantee of future results.
|
|
| Performance Information Illustrates Variability of Returns [Text] |
rr_PerformanceInformationIllustratesVariabilityOfReturns |
The following information provides some indication of the risks of investing in the Fund by showing changes in the Fund's performance from year to year. The Fund's average annual total returns are compared to the performance of one or more indices. Past performance before and after taxes is no guarantee of future results.
|
|
| Performance Table One Class of after Tax Shown [Text] |
rr_PerformanceTableOneClassOfAfterTaxShown |
After-tax returns are shown for only one class of shares.
|
|
| Performance Availability Website Address [Text] |
rr_PerformanceAvailabilityWebSiteAddress |
wellsfargofunds.com
|
|
| (WFA Income Funds - Classes A and C) | (Wells Fargo Ultra Short-Term Income Fund) | Bloomberg Barclays Short-Term U.S. Government/Credit Bond Index (reflects no deduction for fees, expenses, or taxes) |
|
|
|
| Prospectus: |
rr_ProspectusTable |
|
|
| 1 Year |
rr_AverageAnnualReturnYear01 |
0.80%
|
|
| 5 Years |
rr_AverageAnnualReturnYear05 |
0.37%
|
|
| 10 Years |
rr_AverageAnnualReturnYear10 |
1.34%
|
|
| (WFA Income Funds - Classes A and C) | (Wells Fargo Ultra Short-Term Income Fund) | Class A |
|
|
|
| Prospectus: |
rr_ProspectusTable |
|
|
| Maximum sales charge (load) imposed on purchases (as a percentage of offering price) |
rr_MaximumSalesChargeImposedOnPurchasesOverOfferingPrice |
2.00%
|
|
| Maximum deferred sales charge (load) (as a percentage of offering price) |
rr_MaximumDeferredSalesChargeOverOfferingPrice |
none
|
|
| Management Fees |
rr_ManagementFeesOverAssets |
0.34%
|
|
| Distribution (12b-1) Fees |
rr_DistributionAndService12b1FeesOverAssets |
none
|
|
| Other Expenses |
rr_OtherExpensesOverAssets |
0.45%
|
|
| Acquired Fund Fees and Expenses |
rr_AcquiredFundFeesAndExpensesOverAssets |
0.01%
|
|
| Total Annual Fund Operating Expenses |
rr_ExpensesOverAssets |
0.80%
|
|
| Fee Waivers |
rr_FeeWaiverOrReimbursementOverAssets |
(0.09%)
|
|
| Total Annual Fund Operating Expenses After Fee Waivers |
rr_NetExpensesOverAssets |
0.71%
|
[17] |
| Expense Example, with Redemption, 1 Year |
rr_ExpenseExampleYear01 |
$ 271
|
|
| Expense Example, with Redemption, 3 Years |
rr_ExpenseExampleYear03 |
442
|
|
| Expense Example, with Redemption, 5 Years |
rr_ExpenseExampleYear05 |
627
|
|
| Expense Example, with Redemption, 10 Years |
rr_ExpenseExampleYear10 |
$ 1,162
|
|
| Bar Chart [Heading] |
rr_BarChartHeading |
Calendar Year Total Returns for Class A as of 12/31 each year (Returns do not reflect sales charges and would be lower if they did)
|
[16] |
| Annual Return 2007 |
rr_AnnualReturn2007 |
3.21%
|
|
| Annual Return 2008 |
rr_AnnualReturn2008 |
(6.85%)
|
|
| Annual Return 2009 |
rr_AnnualReturn2009 |
8.67%
|
|
| Annual Return 2010 |
rr_AnnualReturn2010 |
3.73%
|
|
| Annual Return 2011 |
rr_AnnualReturn2011 |
0.51%
|
|
| Annual Return 2012 |
rr_AnnualReturn2012 |
1.79%
|
|
| Annual Return 2013 |
rr_AnnualReturn2013 |
0.47%
|
|
| Annual Return 2014 |
rr_AnnualReturn2014 |
0.16%
|
|
| Annual Return 2015 |
rr_AnnualReturn2015 |
0.17%
|
|
| Annual Return 2016 |
rr_AnnualReturn2016 |
1.37%
|
|
| Year to Date Return, Label |
rr_YearToDateReturnLabel |
Year-to-date total return as of 9/30/2017 is +0.96%
|
|
| Bar Chart, Year to Date Return |
rr_BarChartYearToDateReturn |
0.96%
|
|
| Bar Chart, Year to Date Return, Date |
rr_BarChartYearToDateReturnDate |
Sep. 30, 2017
|
|
| Highest Quarterly Return, Label |
rr_HighestQuarterlyReturnLabel |
Highest Quarter: 3rd Quarter 2009
|
|
| Highest Quarterly Return |
rr_BarChartHighestQuarterlyReturn |
3.84%
|
|
| Highest Quarterly Return, Date |
rr_BarChartHighestQuarterlyReturnDate |
Sep. 30, 2009
|
|
| Lowest Quarterly Return, Label |
rr_LowestQuarterlyReturnLabel |
Lowest Quarter: 4th Quarter 2008
|
|
| Lowest Quarterly Return |
rr_BarChartLowestQuarterlyReturn |
(4.74%)
|
|
| Lowest Quarterly Return, Date |
rr_BarChartLowestQuarterlyReturnDate |
Dec. 31, 2008
|
|
| 1 Year |
rr_AverageAnnualReturnYear01 |
(0.65%)
|
|
| 5 Years |
rr_AverageAnnualReturnYear05 |
0.38%
|
|
| 10 Years |
rr_AverageAnnualReturnYear10 |
1.05%
|
|
| Inception Date of Share Class |
rr_AverageAnnualReturnInceptionDate |
Aug. 31, 1999
|
|
| (WFA Income Funds - Classes A and C) | (Wells Fargo Ultra Short-Term Income Fund) | Class A | (after taxes on distributions) |
|
|
|
| Prospectus: |
rr_ProspectusTable |
|
|
| 1 Year |
rr_AverageAnnualReturnYear01 |
(1.09%)
|
|
| 5 Years |
rr_AverageAnnualReturnYear05 |
0.05%
|
|
| 10 Years |
rr_AverageAnnualReturnYear10 |
0.33%
|
|
| Inception Date of Share Class |
rr_AverageAnnualReturnInceptionDate |
Aug. 31, 1999
|
|
| (WFA Income Funds - Classes A and C) | (Wells Fargo Ultra Short-Term Income Fund) | Class A | (after taxes on distributions and the sale of Fund Shares) |
|
|
|
| Prospectus: |
rr_ProspectusTable |
|
|
| 1 Year |
rr_AverageAnnualReturnYear01 |
(0.37%)
|
|
| 5 Years |
rr_AverageAnnualReturnYear05 |
0.15%
|
|
| 10 Years |
rr_AverageAnnualReturnYear10 |
0.54%
|
|
| Inception Date of Share Class |
rr_AverageAnnualReturnInceptionDate |
Aug. 31, 1999
|
|
| (WFA Income Funds - Classes A and C) | (Wells Fargo Ultra Short-Term Income Fund) | Class C |
|
|
|
| Prospectus: |
rr_ProspectusTable |
|
|
| Maximum sales charge (load) imposed on purchases (as a percentage of offering price) |
rr_MaximumSalesChargeImposedOnPurchasesOverOfferingPrice |
none
|
|
| Maximum deferred sales charge (load) (as a percentage of offering price) |
rr_MaximumDeferredSalesChargeOverOfferingPrice |
1.00%
|
|
| Management Fees |
rr_ManagementFeesOverAssets |
0.34%
|
|
| Distribution (12b-1) Fees |
rr_DistributionAndService12b1FeesOverAssets |
0.75%
|
|
| Other Expenses |
rr_OtherExpensesOverAssets |
0.45%
|
|
| Acquired Fund Fees and Expenses |
rr_AcquiredFundFeesAndExpensesOverAssets |
0.01%
|
|
| Total Annual Fund Operating Expenses |
rr_ExpensesOverAssets |
1.55%
|
|
| Fee Waivers |
rr_FeeWaiverOrReimbursementOverAssets |
(0.09%)
|
|
| Total Annual Fund Operating Expenses After Fee Waivers |
rr_NetExpensesOverAssets |
1.46%
|
[17] |
| Expense Example, with Redemption, 1 Year |
rr_ExpenseExampleYear01 |
$ 249
|
|
| Expense Example, with Redemption, 3 Years |
rr_ExpenseExampleYear03 |
481
|
|
| Expense Example, with Redemption, 5 Years |
rr_ExpenseExampleYear05 |
836
|
|
| Expense Example, with Redemption, 10 Years |
rr_ExpenseExampleYear10 |
1,838
|
|
| Expense Example, No Redemption, 1 Year |
rr_ExpenseExampleNoRedemptionYear01 |
149
|
|
| Expense Example, No Redemption, 3 Years |
rr_ExpenseExampleNoRedemptionYear03 |
481
|
|
| Expense Example, No Redemption, 5 Years |
rr_ExpenseExampleNoRedemptionYear05 |
836
|
|
| Expense Example, No Redemption, 10 Years |
rr_ExpenseExampleNoRedemptionYear10 |
$ 1,838
|
|
| 1 Year |
rr_AverageAnnualReturnYear01 |
(0.38%)
|
|
| 5 Years |
rr_AverageAnnualReturnYear05 |
0.04%
|
|
| 10 Years |
rr_AverageAnnualReturnYear10 |
0.50%
|
|
| Inception Date of Share Class |
rr_AverageAnnualReturnInceptionDate |
Jul. 18, 2008
|
|
| (WFA Income Funds - Administrator Class) | (Wells Fargo Adjustable Rate Government Fund) |
|
|
|
| Prospectus: |
rr_ProspectusTable |
|
|
| Objective [Heading] |
rr_ObjectiveHeading |
Investment Objective
|
|
| Objective, Primary [Text Block] |
rr_ObjectivePrimaryTextBlock |
The Fund seeks current income consistent with capital preservation.
|
|
| Expense [Heading] |
rr_ExpenseHeading |
Fees and Expenses
|
|
| Expense Narrative [Text Block] |
rr_ExpenseNarrativeTextBlock |
These tables are intended to help you understand the various costs and expenses you will pay if you buy and hold shares of the Fund.
|
|
| Shareholder Fees Caption [Text] |
rr_ShareholderFeesCaption |
Shareholder Fees (fees paid directly from your investment)
|
|
| Operating Expenses Caption [Text] |
rr_OperatingExpensesCaption |
Annual Fund Operating Expenses (expenses that you pay each year as a percentage of the value of your investment)
|
|
| Fee Waiver or Reimbursement over Assets, Date of Termination |
rr_FeeWaiverOrReimbursementOverAssetsDateOfTermination |
December 31, 2018
|
|
| Expense Example [Heading] |
rr_ExpenseExampleHeading |
Example of Expenses
|
|
| Expense Example Narrative [Text Block] |
rr_ExpenseExampleNarrativeTextBlock |
The example below is intended to help you compare the costs of investing in the Fund with the costs of investing in other mutual funds. The example assumes a $10,000 initial investment, 5% annual total return, and that fees and expenses remain the same as in the tables above. To the extent that the Manager is waiving fees or reimbursing expenses, the example assumes that such waiver or reimbursement will only be in place through the date noted above. Although your actual costs may be higher or lower, based on these assumptions your costs would be:
|
|
| Portfolio Turnover [Heading] |
rr_PortfolioTurnoverHeading |
Portfolio Turnover
|
|
| Portfolio Turnover [Text Block] |
rr_PortfolioTurnoverTextBlock |
The Fund pays transaction costs, such as commissions, when it buys and sells securities (or "turns over" its portfolio). A higher portfolio turnover rate may indicate higher transaction costs and may result in higher taxes when Fund shares are held in a taxable account. These costs, which are not reflected in annual fund operating expenses or in the example, affect the Fund's performance. During the most recent fiscal year, the Fund's portfolio turnover rate was 2% of the average value of its portfolio.
|
|
| Portfolio Turnover, Rate |
rr_PortfolioTurnoverRate |
2.00%
|
|
| Strategy [Heading] |
rr_StrategyHeading |
Principal Investment Strategies
|
|
| Strategy Narrative [Text Block] |
rr_StrategyNarrativeTextBlock |
Under normal circumstances, we invest:
-
at least 80% of the Fund's net assets in mortgage-backed and asset-backed securities issued or guaranteed by U.S. Government agencies or government-sponsored entities, that have interest rates that reset at periodic intervals; and
-
up to 20% of the Fund's total assets in obligations that pay fixed interest rates.
We invest principally in mortgage-backed securities (including collateralized mortgage obligations (CMOs)) and asset-backed securities issued or guaranteed by U.S. Government agencies or government-sponsored entities. Under normal circumstances, we expect to maintain an average credit quality rating for the portfolio equivalent to the highest rating available from a Nationally Recognized Statistical Ratings Organization (NRSRO). In the event that a NRSRO assigns U.S. sovereign debt a rating below its highest rating, we expect to maintain an average credit quality rating that is equivalent to the average rating assigned to U.S. sovereign debt. As part of our mortgage-backed securities investment strategy, we may enter into dollar roll transactions. Under normal circumstances, the dollar-weighted average reset period of the adjustable rate securities held by the Fund will not exceed one year.
We employ a top-down, macroeconomic outlook to determine the portfolio's duration, yield curve positioning, issuer selection and sector allocation. Macroeconomic factors considered may include, among others, the pace of economic growth, employment conditions, corporate profits, inflation, monetary and fiscal policy, as well as the influence of international economic and financial conditions. In combination with our top-down macroeconomic approach, we employ a bottom-up process of fundamental securities analysis to select the specific securities for investment. Elements of this evaluation may include the effect of changing principal prepayments, interest rate and yield spread volatility, and the impact of changes in the level and shape of the yield curve on a security's value. We may sell a security based on how we expect these factors to affect a security's value relative to its indicated sales price as well as changes in portfolio strategy or cash flow needs. A security may also be sold and replaced with one that presents a better value or risk/reward profile.
|
|
| Risk [Heading] |
rr_RiskHeading |
Principal Investment Risks
|
|
| Risk Narrative [Text Block] |
rr_RiskNarrativeTextBlock |
An investment in the Fund may lose money, is not a deposit of Wells Fargo Bank, N.A. or its affiliates, is not insured or guaranteed by the Federal Deposit Insurance Corporation or any other governmental agency, and is primarily subject to the risks briefly summarized below.
Credit Risk. The issuer or guarantor of a debt security may be unable or perceived to be unable to pay interest or repay principal when they become due, which could cause the value of an investment to decline and a Fund to lose money.
Interest Rate Risk. When interest rates (which are currently near historic lows) rise, the value of debt securities tends to fall. When interest rates decline, interest that a Fund is able to earn on its investments in debt securities may also decline, but the value of those securities may increase.
Management Risk. Investment decisions, techniques, analyses or models implemented by a Fund's manager or sub-adviser in seeking to achieve the Fund's investment objective may not produce the returns expected, may cause the Fund's shares to lose value or may cause the Fund to underperform other funds with similar investment objectives.
Market Risk. The values of, and/or the income generated by, securities held by a Fund may decline due to general market conditions or other factors, including those directly involving the issuers of such securities. Security markets are volatile and may decline significantly in response to adverse issuer, regulatory, political, or economic developments. Different sectors of the market and different security types may react differently to such developments.
Mortgage- and Asset-Backed Securities Risk. Mortgage- and asset-backed securities may decline in value and become less liquid when defaults on the underlying mortgages or assets occur and may exhibit additional volatility in periods of rising interest rates. Rising interest rates tend to extend the duration of these securities, making them more sensitive to changes in interest rates than instruments with fixed payment schedules. When interest rates decline or are low, the prepayment of mortgages or assets underlying such securities can reduce a Fund's returns.
U.S. Government Obligations Risk. U.S. Government obligations may be adversely impacted by changes in interest rates, and securities issued or guaranteed by U.S. Government agencies or government-sponsored entities may not be backed by the full faith and credit of the U.S. Government.
|
|
| Risk Lose Money [Text] |
rr_RiskLoseMoney |
An investment in the Fund may lose money
|
|
| Risk Not Insured Depository Institution [Text] |
rr_RiskNotInsuredDepositoryInstitution |
An investment in the Fund may lose money, is not a deposit of Wells Fargo Bank, N.A. or its affiliates, is not insured or guaranteed by the Federal Deposit Insurance Corporation or any other governmental agency
|
|
| Bar Chart and Performance Table [Heading] |
rr_BarChartAndPerformanceTableHeading |
Performance
|
|
| Performance Narrative [Text Block] |
rr_PerformanceNarrativeTextBlock |
The following information provides some indication of the risks of investing in the Fund by showing changes in the Fund's performance from year to year. The Fund's average annual total returns are compared to the performance of one or more indices. Past performance before and after taxes is no guarantee of future results. Current month-end performance is available on the Fund's website at wellsfargofunds.com.
|
|
| Bar Chart Closing [Text Block] |
rr_BarChartClosingTextBlock |
Highest Quarter: 1st Quarter 2009 | +3.05% | | Lowest Quarter: 4th Quarter 2008 | -2.76% | Year-to-date total return as of 9/30/2017 is +0.24% |
|
|
| Performance Table Heading |
rr_PerformanceTableHeading |
Average Annual Total Returns for the periods ended 12/31/2016
|
[18] |
| Performance Table Closing [Text Block] |
rr_PerformanceTableClosingTextBlock |
After-tax returns are calculated using the historical highest individual federal marginal income tax rates and do not reflect the impact of state, local or foreign taxes. Actual after-tax returns depend on an investor's tax situation and may differ from those shown, and after-tax returns shown are not relevant to tax-exempt investors or investors who hold their Fund shares through tax-deferred arrangements, such as 401(k) Plans or Individual Retirement Accounts.
|
|
| Performance Table Uses Highest Federal Rate |
rr_PerformanceTableUsesHighestFederalRate |
After-tax returns are calculated using the historical highest individual federal marginal income tax rates and do not reflect the impact of state, local or foreign taxes.
|
|
| Performance Table Not Relevant to Tax Deferred |
rr_PerformanceTableNotRelevantToTaxDeferred |
Actual after-tax returns depend on an investor's tax situation and may differ from those shown, and after-tax returns shown are not relevant to tax-exempt investors or investors who hold their Fund shares through tax-deferred arrangements, such as 401(k) Plans or Individual Retirement Accounts.
|
|
| Performance Past Does Not Indicate Future [Text] |
rr_PerformancePastDoesNotIndicateFuture |
Past performance before and after taxes is no guarantee of future results.
|
|
| Performance Information Illustrates Variability of Returns [Text] |
rr_PerformanceInformationIllustratesVariabilityOfReturns |
The following information provides some indication of the risks of investing in the Fund by showing changes in the Fund's performance from year to year. The Fund's average annual total returns are compared to the performance of one or more indices. Past performance before and after taxes is no guarantee of future results.
|
|
| Performance Availability Website Address [Text] |
rr_PerformanceAvailabilityWebSiteAddress |
wellsfargofunds.com
|
|
| (WFA Income Funds - Administrator Class) | (Wells Fargo Adjustable Rate Government Fund) | Bloomberg Barclays 6-Month Treasury Bill Index (reflects no deduction for fees, expenses, or taxes) |
|
|
|
| Prospectus: |
rr_ProspectusTable |
|
|
| 1 Year |
rr_AverageAnnualReturnYear01 |
0.67%
|
|
| 5 Years |
rr_AverageAnnualReturnYear05 |
0.28%
|
|
| 10 Years |
rr_AverageAnnualReturnYear10 |
1.18%
|
|
| (WFA Income Funds - Administrator Class) | (Wells Fargo Adjustable Rate Government Fund) | Administrator Class |
|
|
|
| Prospectus: |
rr_ProspectusTable |
|
|
| Maximum sales charge (load) imposed on purchases (as a percentage of offering price) |
rr_MaximumSalesChargeImposedOnPurchasesOverOfferingPrice |
none
|
|
| Maximum deferred sales charge (load) (as a percentage of offering price) |
rr_MaximumDeferredSalesChargeOverOfferingPrice |
none
|
|
| Management Fees |
rr_ManagementFeesOverAssets |
0.35%
|
|
| Distribution (12b-1) Fees |
rr_DistributionAndService12b1FeesOverAssets |
none
|
|
| Other Expenses |
rr_OtherExpensesOverAssets |
0.39%
|
|
| Total Annual Fund Operating Expenses |
rr_ExpensesOverAssets |
0.74%
|
|
| Fee Waivers |
rr_FeeWaiverOrReimbursementOverAssets |
(0.14%)
|
|
| Total Annual Fund Operating Expenses After Fee Waivers |
rr_NetExpensesOverAssets |
0.60%
|
[19] |
| Expense Example, with Redemption, 1 Year |
rr_ExpenseExampleYear01 |
$ 61
|
|
| Expense Example, with Redemption, 3 Years |
rr_ExpenseExampleYear03 |
222
|
|
| Expense Example, with Redemption, 5 Years |
rr_ExpenseExampleYear05 |
398
|
|
| Expense Example, with Redemption, 10 Years |
rr_ExpenseExampleYear10 |
$ 905
|
|
| Bar Chart [Heading] |
rr_BarChartHeading |
Calendar Year Total Returns for Administrator Class as of 12/31 each year
|
[18] |
| Annual Return 2007 |
rr_AnnualReturn2007 |
4.64%
|
|
| Annual Return 2008 |
rr_AnnualReturn2008 |
(1.06%)
|
|
| Annual Return 2009 |
rr_AnnualReturn2009 |
6.75%
|
|
| Annual Return 2010 |
rr_AnnualReturn2010 |
2.89%
|
|
| Annual Return 2011 |
rr_AnnualReturn2011 |
1.93%
|
|
| Annual Return 2012 |
rr_AnnualReturn2012 |
1.95%
|
|
| Annual Return 2013 |
rr_AnnualReturn2013 |
0.47%
|
|
| Annual Return 2014 |
rr_AnnualReturn2014 |
0.83%
|
|
| Annual Return 2015 |
rr_AnnualReturn2015 |
(0.16%)
|
|
| Annual Return 2016 |
rr_AnnualReturn2016 |
0.60%
|
|
| Year to Date Return, Label |
rr_YearToDateReturnLabel |
Year-to-date total return as of 9/30/2017 is +0.24%
|
|
| Bar Chart, Year to Date Return |
rr_BarChartYearToDateReturn |
0.24%
|
|
| Bar Chart, Year to Date Return, Date |
rr_BarChartYearToDateReturnDate |
Sep. 30, 2017
|
|
| Highest Quarterly Return, Label |
rr_HighestQuarterlyReturnLabel |
Highest Quarter: 1st Quarter 2009
|
|
| Highest Quarterly Return |
rr_BarChartHighestQuarterlyReturn |
3.05%
|
|
| Highest Quarterly Return, Date |
rr_BarChartHighestQuarterlyReturnDate |
Mar. 31, 2009
|
|
| Lowest Quarterly Return, Label |
rr_LowestQuarterlyReturnLabel |
Lowest Quarter: 4th Quarter 2008
|
|
| Lowest Quarterly Return |
rr_BarChartLowestQuarterlyReturn |
(2.76%)
|
|
| Lowest Quarterly Return, Date |
rr_BarChartLowestQuarterlyReturnDate |
Dec. 31, 2008
|
|
| 1 Year |
rr_AverageAnnualReturnYear01 |
0.60%
|
|
| 5 Years |
rr_AverageAnnualReturnYear05 |
0.73%
|
|
| 10 Years |
rr_AverageAnnualReturnYear10 |
1.86%
|
|
| Inception Date of Share Class |
rr_AverageAnnualReturnInceptionDate |
Jul. 30, 2010
|
|
| (WFA Income Funds - Administrator Class) | (Wells Fargo Adjustable Rate Government Fund) | Administrator Class | (after taxes on distributions) |
|
|
|
| Prospectus: |
rr_ProspectusTable |
|
|
| 1 Year |
rr_AverageAnnualReturnYear01 |
0.30%
|
|
| 5 Years |
rr_AverageAnnualReturnYear05 |
0.40%
|
|
| 10 Years |
rr_AverageAnnualReturnYear10 |
1.08%
|
|
| Inception Date of Share Class |
rr_AverageAnnualReturnInceptionDate |
Jul. 30, 2010
|
|
| (WFA Income Funds - Administrator Class) | (Wells Fargo Adjustable Rate Government Fund) | Administrator Class | (after taxes on distributions and the sale of Fund Shares) |
|
|
|
| Prospectus: |
rr_ProspectusTable |
|
|
| 1 Year |
rr_AverageAnnualReturnYear01 |
0.34%
|
|
| 5 Years |
rr_AverageAnnualReturnYear05 |
0.42%
|
|
| 10 Years |
rr_AverageAnnualReturnYear10 |
1.14%
|
|
| Inception Date of Share Class |
rr_AverageAnnualReturnInceptionDate |
Jul. 30, 2010
|
|
| (WFA Income Funds - Administrator Class) | (Wells Fargo Core Plus Bond Fund) |
|
|
|
| Prospectus: |
rr_ProspectusTable |
|
|
| Objective [Heading] |
rr_ObjectiveHeading |
Investment Objective
|
|
| Objective, Primary [Text Block] |
rr_ObjectivePrimaryTextBlock |
The Fund seeks total return, consisting of current income and capital appreciation.
|
|
| Expense [Heading] |
rr_ExpenseHeading |
Fees and Expenses
|
|
| Expense Narrative [Text Block] |
rr_ExpenseNarrativeTextBlock |
These tables are intended to help you understand the various costs and expenses you will pay if you buy and hold shares of the Fund.
|
|
| Shareholder Fees Caption [Text] |
rr_ShareholderFeesCaption |
Shareholder Fees (fees paid directly from your investment)
|
|
| Operating Expenses Caption [Text] |
rr_OperatingExpensesCaption |
Annual Fund Operating Expenses (expenses that you pay each year as a percentage of the value of your investment)
|
[20] |
| Fee Waiver or Reimbursement over Assets, Date of Termination |
rr_FeeWaiverOrReimbursementOverAssetsDateOfTermination |
December 31, 2018
|
|
| Expenses Restated to Reflect Current [Text] |
rr_ExpensesRestatedToReflectCurrent |
Expenses have been adjusted as necessary from amounts incurred during the Fund's most recent fiscal year to reflect current fees and expenses.
|
|
| Expense Example [Heading] |
rr_ExpenseExampleHeading |
Example of Expenses
|
|
| Expense Example Narrative [Text Block] |
rr_ExpenseExampleNarrativeTextBlock |
The example below is intended to help you compare the costs of investing in the Fund with the costs of investing in other mutual funds. The example assumes a $10,000 initial investment, 5% annual total return, and that fees and expenses remain the same as in the tables above. To the extent that the Manager is waiving fees or reimbursing expenses, the example assumes that such waiver or reimbursement will only be in place through the date noted above. Although your actual costs may be higher or lower, based on these assumptions your costs would be:
|
|
| Portfolio Turnover [Heading] |
rr_PortfolioTurnoverHeading |
Portfolio Turnover
|
|
| Portfolio Turnover [Text Block] |
rr_PortfolioTurnoverTextBlock |
The Fund pays transaction costs, such as commissions, when it buys and sells securities (or "turns over" its portfolio). A higher portfolio turnover rate may indicate higher transaction costs and may result in higher taxes when Fund shares are held in a taxable account. These costs, which are not reflected in annual fund operating expenses or in the example, affect the Fund's performance. During the most recent fiscal year, the Fund's portfolio turnover rate was 199% of the average value of its portfolio.
|
|
| Portfolio Turnover, Rate |
rr_PortfolioTurnoverRate |
199.00%
|
|
| Strategy [Heading] |
rr_StrategyHeading |
Principal Investment Strategies
|
|
| Strategy Narrative [Text Block] |
rr_StrategyNarrativeTextBlock |
Under normal circumstances, we invest:
-
at least 80% of the Fund's net assets in debt securities;
-
up to 35% of the Fund's total assets in debt securities that are below investment-grade; and
-
up to 25% of the Fund's total assets in debt securities of foreign issuers, including emerging markets issuers and debt securities denominated in foreign currencies.
We invest principally in debt securities, including corporate, mortgage- and asset-backed securities, bank loans, foreign sovereign debt, supranational agencies, and U.S. Government obligations. These securities may have fixed, floating or variable rates and may include debt securities of both domestic and foreign issuers. We invest in both investment-grade and below investment-grade debt securities (often called "high yield" securities or "junk bonds"), including unrated securities, as well as securities that are in default at the time of purchase.
We may invest in debt securities of foreign issuers, including emerging markets issuers, denominated in any currency. We may seek to add yield by having exposures to a variety of credits, mortgages, and higher yielding countries and currencies. We may also use futures and swap agreements to manage risk or to enhance return. We may enter into currency-related transactions through derivative instruments, including currency and cross currency forwards. The use of derivative currency transactions is intended to allow the Fund to manage, hedge or reduce a foreign currency-specific risk exposure of a portfolio security or its denominated currency or to obtain net long exposure to selected currencies for the purpose of generating income or additional returns.
While we may purchase securities of any maturity or duration, under normal circumstances, we expect to maintain an overall portfolio dollar-weighted average effective duration that is within 1 year of that of the Fund's benchmark. The Fund's benchmark, the Bloomberg Barclays U.S. Aggregate Bond Index, had a duration of 5.90 years, as of November 30, 2017. "Dollar-Weighted Average Effective Duration" is an aggregate measure of the sensitivity of a fund's fixed income portfolio securities to changes in interest rates. As a general matter, the price of a fixed income security with a longer effective duration will fluctuate more in response to changes in interest rates than the price of a fixed income security with a shorter effective duration.
|
|
| Risk [Heading] |
rr_RiskHeading |
Principal Investment Risks
|
|
| Risk Narrative [Text Block] |
rr_RiskNarrativeTextBlock |
An investment in the Fund may lose money, is not a deposit of Wells Fargo Bank, N.A. or its affiliates, is not insured or guaranteed by the Federal Deposit Insurance Corporation or any other governmental agency, and is primarily subject to the risks briefly summarized below.
Credit Risk. The issuer or guarantor of a debt security may be unable or perceived to be unable to pay interest or repay principal when they become due, which could cause the value of an investment to decline and a Fund to lose money.
Derivatives Risk. The use of derivatives, such as futures, options and swap agreements, can lead to losses, including those magnified by leverage, particularly when derivatives are used to enhance return rather than mitigate risk. Certain derivative instruments may be difficult to sell when the portfolio manager believes it would be appropriate to do so, or the other party to a derivative contract may be unwilling or unable to fulfill its contractual obligations.
Emerging Markets Risk. Emerging market securities typically present even greater exposure to the risks described under "Foreign Investment Risk" and may be particularly sensitive to global economic conditions. Emerging market securities are also typically less liquid than securities of developed countries and could be difficult to sell, particularly during a market downturn.
Foreign Currency Contracts Risk. A Fund that enters into forwards or other foreign currency contracts, which are a type of derivative, is subject to the risk that the portfolio manager may be incorrect in his or her judgment of future exchange rate changes.
Foreign Investment Risk. Foreign investments may be subject to lower liquidity, greater price volatility and risks related to adverse political, regulatory, market or economic developments. Foreign investments may involve exposure to changes in foreign currency exchange rates and may be subject to higher withholding and other taxes.
Futures Contracts Risk. A Fund that uses futures contracts, which are a type of derivative, is subject to the risk of loss caused by unanticipated market movements. In addition, there may at times be an imperfect correlation between the movement in the prices of futures contracts and the value of their underlying instruments or indexes and there may at times not be a liquid secondary market for certain futures contracts.
High Yield Securities Risk. High yield securities and unrated securities of similar credit quality (commonly known as "junk bonds") have a much greater risk of default or of not returning principal and their values tend to be more volatile than higher-rated securities with similar maturities.
Interest Rate Risk. When interest rates (which are currently near historic lows) rise, the value of debt securities tends to fall. When interest rates decline, interest that a Fund is able to earn on its investments in debt securities may also decline, but the value of those securities may increase.
Loan Risk. Loans may be unrated, less liquid and more difficult to value than traditional debt securities. The highly leveraged capital structure of the borrowers in such transactions may make such loans especially vulnerable to adverse changes in financial, economic or market conditions. A Fund may be unable to sell loans at a desired time or price. The Fund may also not be able to control amendments, waivers or the exercise of any remedies that a lender would have under a direct loan and may assume liability as a lender.
Management Risk. Investment decisions, techniques, analyses or models implemented by a Fund's manager or sub-adviser in seeking to achieve the Fund's investment objective may not produce the returns expected, may cause the Fund's shares to lose value or may cause the Fund to underperform other funds with similar investment objectives.
Market Risk. The values of, and/or the income generated by, securities held by a Fund may decline due to general market conditions or other factors, including those directly involving the issuers of such securities. Security markets are volatile and may decline significantly in response to adverse issuer, regulatory, political, or economic developments. Different sectors of the market and different security types may react differently to such developments.
Mortgage- and Asset-Backed Securities Risk. Mortgage- and asset-backed securities may decline in value and become less liquid when defaults on the underlying mortgages or assets occur and may exhibit additional volatility in periods of rising interest rates. Rising interest rates tend to extend the duration of these securities, making them more sensitive to changes in interest rates than instruments with fixed payment schedules. When interest rates decline or are low, the prepayment of mortgages or assets underlying such securities can reduce a Fund's returns.
Swaps Risk. Depending on their structure, swap agreements and options to enter into swap agreements ("swaptions"), both of which are types of derivatives, may increase or decrease a Fund's exposure to long- or short-term interest rates, foreign currency values, mortgage-backed securities, corporate borrowing rates, or credit events or other reference points such as security prices or inflation rates.
U.S. Government Obligations Risk. U.S. Government obligations may be adversely impacted by changes in interest rates, and securities issued or guaranteed by U.S. Government agencies or government-sponsored entities may not be backed by the full faith and credit of the U.S. Government.
|
|
| Risk Lose Money [Text] |
rr_RiskLoseMoney |
An investment in the Fund may lose money
|
|
| Risk Not Insured Depository Institution [Text] |
rr_RiskNotInsuredDepositoryInstitution |
An investment in the Fund may lose money, is not a deposit of Wells Fargo Bank, N.A. or its affiliates, is not insured or guaranteed by the Federal Deposit Insurance Corporation or any other governmental agency
|
|
| Bar Chart and Performance Table [Heading] |
rr_BarChartAndPerformanceTableHeading |
Performance
|
|
| Performance Narrative [Text Block] |
rr_PerformanceNarrativeTextBlock |
The following information provides some indication of the risks of investing in the Fund by showing changes in the Fund's performance from year to year. The Fund's average annual total returns are compared to the performance of one or more indices. Past performance before and after taxes is no guarantee of future results. Current month-end performance is available on the Fund's website at wellsfargofunds.com.
|
|
| Bar Chart Closing [Text Block] |
rr_BarChartClosingTextBlock |
Highest Quarter: 3rd Quarter 2009 | +5.57% | | Lowest Quarter: 2nd Quarter 2013 | -2.70% | Year-to-date total return as of 9/30/2017 is +4.79% |
|
|
| Performance Table Heading |
rr_PerformanceTableHeading |
Average Annual Total Returns for the periods ended 12/31/2016
|
[21] |
| Performance Table Closing [Text Block] |
rr_PerformanceTableClosingTextBlock |
After-tax returns are calculated using the historical highest individual federal marginal income tax rates and do not reflect the impact of state, local or foreign taxes. Actual after-tax returns depend on an investor's tax situation and may differ from those shown, and after-tax returns shown are not relevant to tax-exempt investors or investors who hold their Fund shares through tax-deferred arrangements, such as 401(k) Plans or Individual Retirement Accounts.
|
|
| Performance Table Uses Highest Federal Rate |
rr_PerformanceTableUsesHighestFederalRate |
After-tax returns are calculated using the historical highest individual federal marginal income tax rates and do not reflect the impact of state, local or foreign taxes.
|
|
| Performance Table Not Relevant to Tax Deferred |
rr_PerformanceTableNotRelevantToTaxDeferred |
Actual after-tax returns depend on an investor's tax situation and may differ from those shown, and after-tax returns shown are not relevant to tax-exempt investors or investors who hold their Fund shares through tax-deferred arrangements, such as 401(k) Plans or Individual Retirement Accounts.
|
|
| Performance Past Does Not Indicate Future [Text] |
rr_PerformancePastDoesNotIndicateFuture |
Past performance before and after taxes is no guarantee of future results.
|
|
| Performance Information Illustrates Variability of Returns [Text] |
rr_PerformanceInformationIllustratesVariabilityOfReturns |
The following information provides some indication of the risks of investing in the Fund by showing changes in the Fund's performance from year to year. The Fund's average annual total returns are compared to the performance of one or more indices. Past performance before and after taxes is no guarantee of future results.
|
|
| Performance Availability Website Address [Text] |
rr_PerformanceAvailabilityWebSiteAddress |
wellsfargofunds.com
|
|
| (WFA Income Funds - Administrator Class) | (Wells Fargo Core Plus Bond Fund) | Bloomberg Barclays U.S. Aggregate Bond Index (reflects no deduction for fees, expenses, or taxes) |
|
|
|
| Prospectus: |
rr_ProspectusTable |
|
|
| 1 Year |
rr_AverageAnnualReturnYear01 |
2.65%
|
|
| 5 Years |
rr_AverageAnnualReturnYear05 |
2.23%
|
|
| 10 Years |
rr_AverageAnnualReturnYear10 |
4.34%
|
|
| (WFA Income Funds - Administrator Class) | (Wells Fargo Core Plus Bond Fund) | Administrator Class |
|
|
|
| Prospectus: |
rr_ProspectusTable |
|
|
| Maximum sales charge (load) imposed on purchases (as a percentage of offering price) |
rr_MaximumSalesChargeImposedOnPurchasesOverOfferingPrice |
none
|
|
| Maximum deferred sales charge (load) (as a percentage of offering price) |
rr_MaximumDeferredSalesChargeOverOfferingPrice |
none
|
|
| Management Fees |
rr_ManagementFeesOverAssets |
0.45%
|
|
| Distribution (12b-1) Fees |
rr_DistributionAndService12b1FeesOverAssets |
none
|
|
| Other Expenses |
rr_OtherExpensesOverAssets |
0.42%
|
|
| Acquired Fund Fees and Expenses |
rr_AcquiredFundFeesAndExpensesOverAssets |
0.01%
|
|
| Total Annual Fund Operating Expenses |
rr_ExpensesOverAssets |
0.88%
|
|
| Fee Waivers |
rr_FeeWaiverOrReimbursementOverAssets |
(0.25%)
|
|
| Total Annual Fund Operating Expenses After Fee Waivers |
rr_NetExpensesOverAssets |
0.63%
|
[22] |
| Expense Example, with Redemption, 1 Year |
rr_ExpenseExampleYear01 |
$ 64
|
|
| Expense Example, with Redemption, 3 Years |
rr_ExpenseExampleYear03 |
256
|
|
| Expense Example, with Redemption, 5 Years |
rr_ExpenseExampleYear05 |
463
|
|
| Expense Example, with Redemption, 10 Years |
rr_ExpenseExampleYear10 |
$ 1,061
|
|
| Bar Chart [Heading] |
rr_BarChartHeading |
Calendar Year Total Returns for Administrator Class as of 12/31 each year
|
[21] |
| Annual Return 2007 |
rr_AnnualReturn2007 |
6.09%
|
|
| Annual Return 2008 |
rr_AnnualReturn2008 |
2.30%
|
|
| Annual Return 2009 |
rr_AnnualReturn2009 |
12.03%
|
|
| Annual Return 2010 |
rr_AnnualReturn2010 |
8.07%
|
|
| Annual Return 2011 |
rr_AnnualReturn2011 |
7.90%
|
|
| Annual Return 2012 |
rr_AnnualReturn2012 |
5.76%
|
|
| Annual Return 2013 |
rr_AnnualReturn2013 |
(1.38%)
|
|
| Annual Return 2014 |
rr_AnnualReturn2014 |
6.60%
|
|
| Annual Return 2015 |
rr_AnnualReturn2015 |
0.15%
|
|
| Annual Return 2016 |
rr_AnnualReturn2016 |
5.79%
|
|
| Year to Date Return, Label |
rr_YearToDateReturnLabel |
Year-to-date total return as of 9/30/2017 is +4.79%
|
|
| Bar Chart, Year to Date Return |
rr_BarChartYearToDateReturn |
4.79%
|
|
| Bar Chart, Year to Date Return, Date |
rr_BarChartYearToDateReturnDate |
Sep. 30, 2017
|
|
| Highest Quarterly Return, Label |
rr_HighestQuarterlyReturnLabel |
Highest Quarter: 3rd Quarter 2009
|
|
| Highest Quarterly Return |
rr_BarChartHighestQuarterlyReturn |
5.57%
|
|
| Highest Quarterly Return, Date |
rr_BarChartHighestQuarterlyReturnDate |
Sep. 30, 2009
|
|
| Lowest Quarterly Return, Label |
rr_LowestQuarterlyReturnLabel |
Lowest Quarter: 2nd Quarter 2013
|
|
| Lowest Quarterly Return |
rr_BarChartLowestQuarterlyReturn |
(2.70%)
|
|
| Lowest Quarterly Return, Date |
rr_BarChartLowestQuarterlyReturnDate |
Jun. 30, 2013
|
|
| 1 Year |
rr_AverageAnnualReturnYear01 |
5.79%
|
|
| 5 Years |
rr_AverageAnnualReturnYear05 |
3.33%
|
|
| 10 Years |
rr_AverageAnnualReturnYear10 |
5.26%
|
|
| Inception Date of Share Class |
rr_AverageAnnualReturnInceptionDate |
Jul. 30, 2010
|
|
| (WFA Income Funds - Administrator Class) | (Wells Fargo Core Plus Bond Fund) | Administrator Class | (after taxes on distributions) |
|
|
|
| Prospectus: |
rr_ProspectusTable |
|
|
| 1 Year |
rr_AverageAnnualReturnYear01 |
4.48%
|
|
| 5 Years |
rr_AverageAnnualReturnYear05 |
2.18%
|
|
| 10 Years |
rr_AverageAnnualReturnYear10 |
3.86%
|
|
| Inception Date of Share Class |
rr_AverageAnnualReturnInceptionDate |
Jul. 30, 2010
|
|
| (WFA Income Funds - Administrator Class) | (Wells Fargo Core Plus Bond Fund) | Administrator Class | (after taxes on distributions and the sale of Fund Shares) |
|
|
|
| Prospectus: |
rr_ProspectusTable |
|
|
| 1 Year |
rr_AverageAnnualReturnYear01 |
3.28%
|
|
| 5 Years |
rr_AverageAnnualReturnYear05 |
2.11%
|
|
| 10 Years |
rr_AverageAnnualReturnYear10 |
3.58%
|
|
| Inception Date of Share Class |
rr_AverageAnnualReturnInceptionDate |
Jul. 30, 2010
|
|
| (WFA Income Funds - Administrator Class) | (Wells Fargo Government Securities Fund) |
|
|
|
| Prospectus: |
rr_ProspectusTable |
|
|
| Objective [Heading] |
rr_ObjectiveHeading |
Investment Objective
|
|
| Objective, Primary [Text Block] |
rr_ObjectivePrimaryTextBlock |
The Fund seeks current income.
|
|
| Expense [Heading] |
rr_ExpenseHeading |
Fees and Expenses
|
|
| Expense Narrative [Text Block] |
rr_ExpenseNarrativeTextBlock |
These tables are intended to help you understand the various costs and expenses you will pay if you buy and hold shares of the Fund.
|
|
| Shareholder Fees Caption [Text] |
rr_ShareholderFeesCaption |
Shareholder Fees (fees paid directly from your investment)
|
|
| Operating Expenses Caption [Text] |
rr_OperatingExpensesCaption |
Annual Fund Operating Expenses (expenses that you pay each year as a percentage of the value of your investment)
|
[20] |
| Fee Waiver or Reimbursement over Assets, Date of Termination |
rr_FeeWaiverOrReimbursementOverAssetsDateOfTermination |
December 31, 2018
|
|
| Expenses Restated to Reflect Current [Text] |
rr_ExpensesRestatedToReflectCurrent |
Expenses have been adjusted as necessary from amounts incurred during the Fund's most recent fiscal year to reflect current fees and expenses.
|
|
| Expense Example [Heading] |
rr_ExpenseExampleHeading |
Example of Expenses
|
|
| Expense Example Narrative [Text Block] |
rr_ExpenseExampleNarrativeTextBlock |
The example below is intended to help you compare the costs of investing in the Fund with the costs of investing in other mutual funds. The example assumes a $10,000 initial investment, 5% annual total return, and that fees and expenses remain the same as in the tables above. To the extent that the Manager is waiving fees or reimbursing expenses, the example assumes that such waiver or reimbursement will only be in place through the date noted above. Although your actual costs may be higher or lower, based on these assumptions your costs would be:
|
|
| Portfolio Turnover [Heading] |
rr_PortfolioTurnoverHeading |
Portfolio Turnover
|
|
| Portfolio Turnover [Text Block] |
rr_PortfolioTurnoverTextBlock |
The Fund pays transaction costs, such as commissions, when it buys and sells securities (or "turns over" its portfolio). A higher portfolio turnover rate may indicate higher transaction costs and may result in higher taxes when Fund shares are held in a taxable account. These costs, which are not reflected in annual fund operating expenses or in the example, affect the Fund's performance. During the most recent fiscal year, the Fund's portfolio turnover rate was 299% of the average value of its portfolio.
|
|
| Portfolio Turnover, Rate |
rr_PortfolioTurnoverRate |
299.00%
|
|
| Strategy [Heading] |
rr_StrategyHeading |
Principal Investment Strategies
|
|
| Strategy Narrative [Text Block] |
rr_StrategyNarrativeTextBlock |
Under normal circumstances, we invest:
-
at least 80% of the Fund's net assets in U.S. Government obligations and repurchase agreements collateralized by U.S. Government obligations; and
-
up to 20% of the Fund's net assets in non-government investment-grade debt securities.
We invest principally in U.S. Government obligations, including debt securities issued or guaranteed by the U.S. Treasury, U.S. Government agencies or government-sponsored entities. These securities may have fixed, floating or variable rates and also include mortgage-backed securities. As part of our mortgage-backed securities investment strategy, we may enter into dollar rolls. We may also use futures for duration and yield curve management.
We employ a top-down, macroeconomic outlook to determine the portfolio's duration, yield curve positioning and sector allocation. Macroeconomic factors considered may include, among others, the pace of economic growth, employment conditions, inflation, monetary and fiscal policy, as well as the influence of international economic and financial conditions. In combination with our top-down, macroeconomic approach, we employ a bottom-up process of fundamental securities analysis to select the specific securities for investment. Elements of this evaluation may include duration measurements, historical yield spread relationships, volatility trends, mortgage refinance rates, as well as other factors. We may sell a security due to changes in our outlook, as well as changes in portfolio strategy or cash flow needs. A security may also be sold and replaced with one that presents a better value or risk/reward profile.
|
|
| Risk [Heading] |
rr_RiskHeading |
Principal Investment Risks
|
|
| Risk Narrative [Text Block] |
rr_RiskNarrativeTextBlock |
An investment in the Fund may lose money, is not a deposit of Wells Fargo Bank, N.A. or its affiliates, is not insured or guaranteed by the Federal Deposit Insurance Corporation or any other governmental agency, and is primarily subject to the risks briefly summarized below.
Credit Risk. The issuer or guarantor of a debt security may be unable or perceived to be unable to pay interest or repay principal when they become due, which could cause the value of an investment to decline and a Fund to lose money.
Derivatives Risk. The use of derivatives, such as futures, options and swap agreements, can lead to losses, including those magnified by leverage, particularly when derivatives are used to enhance return rather than mitigate risk. Certain derivative instruments may be difficult to sell when the portfolio manager believes it would be appropriate to do so, or the other party to a derivative contract may be unwilling or unable to fulfill its contractual obligations.
Futures Contracts Risk. A Fund that uses futures contracts, which are a type of derivative, is subject to the risk of loss caused by unanticipated market movements. In addition, there may at times be an imperfect correlation between the movement in the prices of futures contracts and the value of their underlying instruments or indexes and there may at times not be a liquid secondary market for certain futures contracts.
Interest Rate Risk. When interest rates (which are currently near historic lows) rise, the value of debt securities tends to fall. When interest rates decline, interest that a Fund is able to earn on its investments in debt securities may also decline, but the value of those securities may increase.
Management Risk. Investment decisions, techniques, analyses or models implemented by a Fund's manager or sub-adviser in seeking to achieve the Fund's investment objective may not produce the returns expected, may cause the Fund's shares to lose value or may cause the Fund to underperform other funds with similar investment objectives.
Market Risk. The values of, and/or the income generated by, securities held by a Fund may decline due to general market conditions or other factors, including those directly involving the issuers of such securities. Security markets are volatile and may decline significantly in response to adverse issuer, regulatory, political, or economic developments. Different sectors of the market and different security types may react differently to such developments.
Mortgage- and Asset-Backed Securities Risk. Mortgage- and asset-backed securities may decline in value and become less liquid when defaults on the underlying mortgages or assets occur and may exhibit additional volatility in periods of rising interest rates. Rising interest rates tend to extend the duration of these securities, making them more sensitive to changes in interest rates than instruments with fixed payment schedules. When interest rates decline or are low, the prepayment of mortgages or assets underlying such securities can reduce a Fund's returns.
U.S. Government Obligations Risk. U.S. Government obligations may be adversely impacted by changes in interest rates, and securities issued or guaranteed by U.S. Government agencies or government-sponsored entities may not be backed by the full faith and credit of the U.S. Government.
|
|
| Risk Lose Money [Text] |
rr_RiskLoseMoney |
An investment in the Fund may lose money
|
|
| Risk Not Insured Depository Institution [Text] |
rr_RiskNotInsuredDepositoryInstitution |
An investment in the Fund may lose money, is not a deposit of Wells Fargo Bank, N.A. or its affiliates, is not insured or guaranteed by the Federal Deposit Insurance Corporation or any other governmental agency
|
|
| Bar Chart and Performance Table [Heading] |
rr_BarChartAndPerformanceTableHeading |
Performance
|
|
| Performance Narrative [Text Block] |
rr_PerformanceNarrativeTextBlock |
The following information provides some indication of the risks of investing in the Fund by showing changes in the Fund's performance from year to year. The Fund's average annual total returns are compared to the performance of one or more indices. Past performance before and after taxes is no guarantee of future results. Current month-end performance is available on the Fund's website at wellsfargofunds.com.
|
|
| Bar Chart Closing [Text Block] |
rr_BarChartClosingTextBlock |
Highest Quarter: 4th Quarter 2008 | +4.49% | | Lowest Quarter: 4th Quarter 2016 | -3.07% | Year-to-date total return as of 9/30/2017 is +2.16% |
|
|
| Performance Table Heading |
rr_PerformanceTableHeading |
Average Annual Total Returns for the periods ended 12/31/2016
|
[23] |
| Performance Table Closing [Text Block] |
rr_PerformanceTableClosingTextBlock |
After-tax returns are calculated using the historical highest individual federal marginal income tax rates and do not reflect the impact of state, local or foreign taxes. Actual after-tax returns depend on an investor's tax situation and may differ from those shown, and after-tax returns shown are not relevant to tax-exempt investors or investors who hold their Fund shares through tax-deferred arrangements, such as 401(k) Plans or Individual Retirement Accounts.
|
|
| Performance Table Uses Highest Federal Rate |
rr_PerformanceTableUsesHighestFederalRate |
After-tax returns are calculated using the historical highest individual federal marginal income tax rates and do not reflect the impact of state, local or foreign taxes.
|
|
| Performance Table Not Relevant to Tax Deferred |
rr_PerformanceTableNotRelevantToTaxDeferred |
Actual after-tax returns depend on an investor's tax situation and may differ from those shown, and after-tax returns shown are not relevant to tax-exempt investors or investors who hold their Fund shares through tax-deferred arrangements, such as 401(k) Plans or Individual Retirement Accounts.
|
|
| Performance Past Does Not Indicate Future [Text] |
rr_PerformancePastDoesNotIndicateFuture |
Past performance before and after taxes is no guarantee of future results.
|
|
| Performance Information Illustrates Variability of Returns [Text] |
rr_PerformanceInformationIllustratesVariabilityOfReturns |
The following information provides some indication of the risks of investing in the Fund by showing changes in the Fund's performance from year to year. The Fund's average annual total returns are compared to the performance of one or more indices. Past performance before and after taxes is no guarantee of future results.
|
|
| Performance Availability Website Address [Text] |
rr_PerformanceAvailabilityWebSiteAddress |
wellsfargofunds.com
|
|
| (WFA Income Funds - Administrator Class) | (Wells Fargo Government Securities Fund) | Bloomberg Barclays U.S. Aggregate ex Credit Index (reflects no deduction for fees, expenses, or taxes) |
|
|
|
| Prospectus: |
rr_ProspectusTable |
|
|
| 1 Year |
rr_AverageAnnualReturnYear01 |
1.36%
|
|
| 5 Years |
rr_AverageAnnualReturnYear05 |
1.62%
|
|
| 10 Years |
rr_AverageAnnualReturnYear10 |
3.99%
|
|
| (WFA Income Funds - Administrator Class) | (Wells Fargo Government Securities Fund) | Bloomberg Barclays Intermediate U.S. Government Index (reflects no deduction for fees, expenses, or taxes) |
|
|
|
| Prospectus: |
rr_ProspectusTable |
|
|
| 1 Year |
rr_AverageAnnualReturnYear01 |
1.05%
|
|
| 5 Years |
rr_AverageAnnualReturnYear05 |
1.04%
|
|
| 10 Years |
rr_AverageAnnualReturnYear10 |
3.42%
|
|
| (WFA Income Funds - Administrator Class) | (Wells Fargo Government Securities Fund) | Administrator Class |
|
|
|
| Prospectus: |
rr_ProspectusTable |
|
|
| Maximum sales charge (load) imposed on purchases (as a percentage of offering price) |
rr_MaximumSalesChargeImposedOnPurchasesOverOfferingPrice |
none
|
|
| Maximum deferred sales charge (load) (as a percentage of offering price) |
rr_MaximumDeferredSalesChargeOverOfferingPrice |
none
|
|
| Management Fees |
rr_ManagementFeesOverAssets |
0.43%
|
|
| Distribution (12b-1) Fees |
rr_DistributionAndService12b1FeesOverAssets |
none
|
|
| Other Expenses |
rr_OtherExpensesOverAssets |
0.38%
|
|
| Total Annual Fund Operating Expenses |
rr_ExpensesOverAssets |
0.81%
|
|
| Fee Waivers |
rr_FeeWaiverOrReimbursementOverAssets |
(0.17%)
|
|
| Total Annual Fund Operating Expenses After Fee Waivers |
rr_NetExpensesOverAssets |
0.64%
|
[24] |
| Expense Example, with Redemption, 1 Year |
rr_ExpenseExampleYear01 |
$ 65
|
|
| Expense Example, with Redemption, 3 Years |
rr_ExpenseExampleYear03 |
242
|
|
| Expense Example, with Redemption, 5 Years |
rr_ExpenseExampleYear05 |
433
|
|
| Expense Example, with Redemption, 10 Years |
rr_ExpenseExampleYear10 |
$ 986
|
|
| Bar Chart [Heading] |
rr_BarChartHeading |
Calendar Year Total Returns for Administrator Class as of 12/31 each year
|
[23] |
| Annual Return 2007 |
rr_AnnualReturn2007 |
7.19%
|
|
| Annual Return 2008 |
rr_AnnualReturn2008 |
7.88%
|
|
| Annual Return 2009 |
rr_AnnualReturn2009 |
3.79%
|
|
| Annual Return 2010 |
rr_AnnualReturn2010 |
5.67%
|
|
| Annual Return 2011 |
rr_AnnualReturn2011 |
7.15%
|
|
| Annual Return 2012 |
rr_AnnualReturn2012 |
2.67%
|
|
| Annual Return 2013 |
rr_AnnualReturn2013 |
(2.24%)
|
|
| Annual Return 2014 |
rr_AnnualReturn2014 |
5.27%
|
|
| Annual Return 2015 |
rr_AnnualReturn2015 |
0.60%
|
|
| Annual Return 2016 |
rr_AnnualReturn2016 |
1.23%
|
|
| Year to Date Return, Label |
rr_YearToDateReturnLabel |
Year-to-date total return as of 9/30/2017 is +2.16%
|
|
| Bar Chart, Year to Date Return |
rr_BarChartYearToDateReturn |
2.16%
|
|
| Bar Chart, Year to Date Return, Date |
rr_BarChartYearToDateReturnDate |
Sep. 30, 2017
|
|
| Highest Quarterly Return, Label |
rr_HighestQuarterlyReturnLabel |
Highest Quarter: 4th Quarter 2008
|
|
| Highest Quarterly Return |
rr_BarChartHighestQuarterlyReturn |
4.49%
|
|
| Highest Quarterly Return, Date |
rr_BarChartHighestQuarterlyReturnDate |
Dec. 31, 2008
|
|
| Lowest Quarterly Return, Label |
rr_LowestQuarterlyReturnLabel |
Lowest Quarter: 4th Quarter 2016
|
|
| Lowest Quarterly Return |
rr_BarChartLowestQuarterlyReturn |
(3.07%)
|
|
| Lowest Quarterly Return, Date |
rr_BarChartLowestQuarterlyReturnDate |
Dec. 31, 2016
|
|
| 1 Year |
rr_AverageAnnualReturnYear01 |
1.23%
|
|
| 5 Years |
rr_AverageAnnualReturnYear05 |
1.47%
|
|
| 10 Years |
rr_AverageAnnualReturnYear10 |
3.87%
|
|
| Inception Date of Share Class |
rr_AverageAnnualReturnInceptionDate |
Apr. 08, 2005
|
|
| (WFA Income Funds - Administrator Class) | (Wells Fargo Government Securities Fund) | Administrator Class | (after taxes on distributions) |
|
|
|
| Prospectus: |
rr_ProspectusTable |
|
|
| 1 Year |
rr_AverageAnnualReturnYear01 |
(0.25%)
|
|
| 5 Years |
rr_AverageAnnualReturnYear05 |
0.66%
|
|
| 10 Years |
rr_AverageAnnualReturnYear10 |
2.66%
|
|
| Inception Date of Share Class |
rr_AverageAnnualReturnInceptionDate |
Apr. 08, 2005
|
|
| (WFA Income Funds - Administrator Class) | (Wells Fargo Government Securities Fund) | Administrator Class | (after taxes on distributions and the sale of Fund Shares) |
|
|
|
| Prospectus: |
rr_ProspectusTable |
|
|
| 1 Year |
rr_AverageAnnualReturnYear01 |
0.85%
|
|
| 5 Years |
rr_AverageAnnualReturnYear05 |
0.84%
|
|
| 10 Years |
rr_AverageAnnualReturnYear10 |
2.57%
|
|
| Inception Date of Share Class |
rr_AverageAnnualReturnInceptionDate |
Apr. 08, 2005
|
|
| (WFA Income Funds - Administrator Class) | (Wells Fargo High Yield Bond Fund) |
|
|
|
| Prospectus: |
rr_ProspectusTable |
|
|
| Objective [Heading] |
rr_ObjectiveHeading |
Investment Objective
|
|
| Objective, Primary [Text Block] |
rr_ObjectivePrimaryTextBlock |
The Fund seeks total return, consisting of a high level of current income and capital appreciation.
|
|
| Expense [Heading] |
rr_ExpenseHeading |
Fees and Expenses
|
|
| Expense Narrative [Text Block] |
rr_ExpenseNarrativeTextBlock |
These tables are intended to help you understand the various costs and expenses you will pay if you buy and hold shares of the Fund.
|
|
| Shareholder Fees Caption [Text] |
rr_ShareholderFeesCaption |
Shareholder Fees (fees paid directly from your investment)
|
|
| Operating Expenses Caption [Text] |
rr_OperatingExpensesCaption |
Annual Fund Operating Expenses (expenses that you pay each year as a percentage of the value of your investment)
|
[20] |
| Fee Waiver or Reimbursement over Assets, Date of Termination |
rr_FeeWaiverOrReimbursementOverAssetsDateOfTermination |
December 31, 2018
|
|
| Expenses Restated to Reflect Current [Text] |
rr_ExpensesRestatedToReflectCurrent |
Expenses have been adjusted as necessary from amounts incurred during the Fund's most recent fiscal year to reflect current fees and expenses.
|
|
| Expense Example [Heading] |
rr_ExpenseExampleHeading |
Example of Expenses
|
|
| Expense Example Narrative [Text Block] |
rr_ExpenseExampleNarrativeTextBlock |
The example below is intended to help you compare the costs of investing in the Fund with the costs of investing in other mutual funds. The example assumes a $10,000 initial investment, 5% annual total return, and that fees and expenses remain the same as in the tables above. To the extent that the Manager is waiving fees or reimbursing expenses, the example assumes that such waiver or reimbursement will only be in place through the date noted above. Although your actual costs may be higher or lower, based on these assumptions your costs would be:
|
|
| Portfolio Turnover [Heading] |
rr_PortfolioTurnoverHeading |
Portfolio Turnover
|
|
| Portfolio Turnover [Text Block] |
rr_PortfolioTurnoverTextBlock |
The Fund pays transaction costs, such as commissions, when it buys and sells securities (or "turns over" its portfolio). A higher portfolio turnover rate may indicate higher transaction costs and may result in higher taxes when Fund shares are held in a taxable account. These costs, which are not reflected in annual fund operating expenses or in the example, affect the Fund's performance. During the most recent fiscal year, the Fund's portfolio turnover rate was 20% of the average value of its portfolio.
|
|
| Portfolio Turnover, Rate |
rr_PortfolioTurnoverRate |
20.00%
|
|
| Strategy [Heading] |
rr_StrategyHeading |
Principal Investment Strategies
|
|
| Strategy Narrative [Text Block] |
rr_StrategyNarrativeTextBlock |
Under normal circumstances, we invest:
-
at least 80% of the Fund's net assets in debt securities that are below-investment grade; and
-
up to 10% of the Fund's total assets in equity securities, including common and preferred stocks.
We invest principally in below investment-grade debt securities (often called "high yield" securities or "junk bonds") of corporate issuers. These include traditional corporate bonds as well as convertible bonds. These securities may have fixed, floating or variable rates. We may invest in below investment-grade debt securities of any credit quality. The average credit quality of the Fund's portfolio is expected to be equivalent to B or higher based on the credit ratings assigned to underlying securities by Moody's, Standard & Poor's, from other Nationally Recognized Statistical Ratings Organizations, or our credit quality assessment of the underlying securities. We do not manage the Fund's portfolio to a specific maturity or duration. We may also use futures for duration and yield curve management. We may invest up to 10% of the Fund's total assets in equity securities, including common and preferred stocks. For equity securities, we seek out dividend yielding securities of companies that we believe have strong fundamental attributes. We may invest in equity securities of companies of any size.
Securities in the Fund's portfolio may be issued by domestic or foreign issuers (including foreign governments), and may include securities of emerging markets issuers.
We start our investment process by looking at macroeconomic factors, such as the pace of economic growth, employment conditions, corporate profits, inflation rates, monetary and fiscal policy, within the context of other even broader factors, including the influence of international economic and financial conditions. This top-down, macroeconomic outlook helps us to determine the sectors and industries in which we believe the portfolio should invest, and in what proportions. We then seek those industries within this macroeconomic environment which we find attractive - industries that are either growing at or above the rate of economic growth (growth industries) or out of favor industries with potentially improving outlooks (value industries.) Within those industries, we prefer companies with sustainable competitive advantages and high barriers to entry, and we specifically seek companies with strong management teams and financial flexibility.
We regularly review the investments of the portfolio and may sell a portfolio holding when it has achieved its valuation target, there is deterioration in the underlying fundamentals of the business, or we have identified a more attractive investment opportunity.
|
|
| Risk [Heading] |
rr_RiskHeading |
Principal Investment Risks
|
|
| Risk Narrative [Text Block] |
rr_RiskNarrativeTextBlock |
An investment in the Fund may lose money, is not a deposit of Wells Fargo Bank, N.A. or its affiliates, is not insured or guaranteed by the Federal Deposit Insurance Corporation or any other governmental agency, and is primarily subject to the risks briefly summarized below.
Convertible Securities Risk. A convertible security has characteristics of both equity and debt securities and, as a result, is exposed to risks that are typically associated with both types of securities. The market value of a convertible security tends to decline as interest rates increase but also tends to reflect changes in the market price of the common stock of the issuing company.
Credit Risk. The issuer or guarantor of a debt security may be unable or perceived to be unable to pay interest or repay principal when they become due, which could cause the value of an investment to decline and a Fund to lose money.
Derivatives Risk. The use of derivatives, such as futures, options and swap agreements, can lead to losses, including those magnified by leverage, particularly when derivatives are used to enhance return rather than mitigate risk. Certain derivative instruments may be difficult to sell when the portfolio manager believes it would be appropriate to do so, or the other party to a derivative contract may be unwilling or unable to fulfill its contractual obligations.
Emerging Markets Risk. Emerging market securities typically present even greater exposure to the risks described under "Foreign Investment Risk" and may be particularly sensitive to global economic conditions. Emerging market securities are also typically less liquid than securities of developed countries and could be difficult to sell, particularly during a market downturn.
Foreign Investment Risk. Foreign investments may be subject to lower liquidity, greater price volatility and risks related to adverse political, regulatory, market or economic developments. Foreign investments may involve exposure to changes in foreign currency exchange rates and may be subject to higher withholding and other taxes.
Futures Contracts Risk. A Fund that uses futures contracts, which are a type of derivative, is subject to the risk of loss caused by unanticipated market movements. In addition, there may at times be an imperfect correlation between the movement in the prices of futures contracts and the value of their underlying instruments or indexes and there may at times not be a liquid secondary market for certain futures contracts.
Growth/Value Investing Risk. Securities that exhibit growth or value characteristics tend to perform differently and shift into and out of favor with investors depending on changes in market and economic sentiment and conditions.
High Yield Securities Risk. High yield securities and unrated securities of similar credit quality (commonly known as "junk bonds") have a much greater risk of default or of not returning principal and their values tend to be more volatile than higher-rated securities with similar maturities.
Interest Rate Risk. When interest rates (which are currently near historic lows) rise, the value of debt securities tends to fall. When interest rates decline, interest that a Fund is able to earn on its investments in debt securities may also decline, but the value of those securities may increase.
Management Risk. Investment decisions, techniques, analyses or models implemented by a Fund's manager or sub-adviser in seeking to achieve the Fund's investment objective may not produce the returns expected, may cause the Fund's shares to lose value or may cause the Fund to underperform other funds with similar investment objectives.
Market Risk. The values of, and/or the income generated by, securities held by a Fund may decline due to general market conditions or other factors, including those directly involving the issuers of such securities. Security markets are volatile and may decline significantly in response to adverse issuer, regulatory, political, or economic developments. Different sectors of the market and different security types may react differently to such developments.
|
|
| Risk Lose Money [Text] |
rr_RiskLoseMoney |
An investment in the Fund may lose money
|
|
| Risk Not Insured Depository Institution [Text] |
rr_RiskNotInsuredDepositoryInstitution |
An investment in the Fund may lose money, is not a deposit of Wells Fargo Bank, N.A. or its affiliates, is not insured or guaranteed by the Federal Deposit Insurance Corporation or any other governmental agency
|
|
| Bar Chart and Performance Table [Heading] |
rr_BarChartAndPerformanceTableHeading |
Performance
|
|
| Performance Narrative [Text Block] |
rr_PerformanceNarrativeTextBlock |
The following information provides some indication of the risks of investing in the Fund by showing changes in the Fund's performance from year to year. The Fund's average annual total returns are compared to the performance of one or more indices. Past performance before and after taxes is no guarantee of future results. Current month-end performance is available on the Fund's website at wellsfargofunds.com.
|
|
| Bar Chart Closing [Text Block] |
rr_BarChartClosingTextBlock |
Highest Quarter: 2nd Quarter 2009 | +20.59% | | Lowest Quarter: 4th Quarter 2008 | -16.99% | Year-to-date total return as of 9/30/2017 is +6.82% |
|
|
| Performance Table Heading |
rr_PerformanceTableHeading |
Average Annual Total Returns for the periods ended 12/31/2016
|
[25] |
| Performance Table Closing [Text Block] |
rr_PerformanceTableClosingTextBlock |
After-tax returns are calculated using the historical highest individual federal marginal income tax rates and do not reflect the impact of state, local or foreign taxes. Actual after-tax returns depend on an investor's tax situation and may differ from those shown, and after-tax returns shown are not relevant to tax-exempt investors or investors who hold their Fund shares through tax-deferred arrangements, such as 401(k) Plans or Individual Retirement Accounts.
|
|
| Performance Table Uses Highest Federal Rate |
rr_PerformanceTableUsesHighestFederalRate |
After-tax returns are calculated using the historical highest individual federal marginal income tax rates and do not reflect the impact of state, local or foreign taxes.
|
|
| Performance Table Not Relevant to Tax Deferred |
rr_PerformanceTableNotRelevantToTaxDeferred |
Actual after-tax returns depend on an investor's tax situation and may differ from those shown, and after-tax returns shown are not relevant to tax-exempt investors or investors who hold their Fund shares through tax-deferred arrangements, such as 401(k) Plans or Individual Retirement Accounts.
|
|
| Performance Past Does Not Indicate Future [Text] |
rr_PerformancePastDoesNotIndicateFuture |
Past performance before and after taxes is no guarantee of future results.
|
|
| Performance Information Illustrates Variability of Returns [Text] |
rr_PerformanceInformationIllustratesVariabilityOfReturns |
The following information provides some indication of the risks of investing in the Fund by showing changes in the Fund's performance from year to year. The Fund's average annual total returns are compared to the performance of one or more indices. Past performance before and after taxes is no guarantee of future results.
|
|
| Performance Availability Website Address [Text] |
rr_PerformanceAvailabilityWebSiteAddress |
wellsfargofunds.com
|
|
| (WFA Income Funds - Administrator Class) | (Wells Fargo High Yield Bond Fund) | ICE BofA Merrill Lynch U.S. High Yield Constrained Index (reflects no deduction for fees, expenses, or taxes) |
|
|
|
| Prospectus: |
rr_ProspectusTable |
|
|
| 1 Year |
rr_AverageAnnualReturnYear01 |
17.49%
|
|
| 5 Years |
rr_AverageAnnualReturnYear05 |
7.35%
|
|
| 10 Years |
rr_AverageAnnualReturnYear10 |
7.45%
|
|
| (WFA Income Funds - Administrator Class) | (Wells Fargo High Yield Bond Fund) | Administrator Class |
|
|
|
| Prospectus: |
rr_ProspectusTable |
|
|
| Maximum sales charge (load) imposed on purchases (as a percentage of offering price) |
rr_MaximumSalesChargeImposedOnPurchasesOverOfferingPrice |
none
|
|
| Maximum deferred sales charge (load) (as a percentage of offering price) |
rr_MaximumDeferredSalesChargeOverOfferingPrice |
none
|
|
| Management Fees |
rr_ManagementFeesOverAssets |
0.55%
|
|
| Distribution (12b-1) Fees |
rr_DistributionAndService12b1FeesOverAssets |
none
|
|
| Other Expenses |
rr_OtherExpensesOverAssets |
0.41%
|
|
| Total Annual Fund Operating Expenses |
rr_ExpensesOverAssets |
0.96%
|
|
| Fee Waivers |
rr_FeeWaiverOrReimbursementOverAssets |
(0.16%)
|
|
| Total Annual Fund Operating Expenses After Fee Waivers |
rr_NetExpensesOverAssets |
0.80%
|
[26] |
| Expense Example, with Redemption, 1 Year |
rr_ExpenseExampleYear01 |
$ 82
|
|
| Expense Example, with Redemption, 3 Years |
rr_ExpenseExampleYear03 |
290
|
|
| Expense Example, with Redemption, 5 Years |
rr_ExpenseExampleYear05 |
515
|
|
| Expense Example, with Redemption, 10 Years |
rr_ExpenseExampleYear10 |
$ 1,163
|
|
| Bar Chart [Heading] |
rr_BarChartHeading |
Calendar Year Total Returns for Administrator Class as of 12/31 each year
|
[25] |
| Annual Return 2007 |
rr_AnnualReturn2007 |
3.12%
|
|
| Annual Return 2008 |
rr_AnnualReturn2008 |
(25.97%)
|
|
| Annual Return 2009 |
rr_AnnualReturn2009 |
52.79%
|
|
| Annual Return 2010 |
rr_AnnualReturn2010 |
13.53%
|
|
| Annual Return 2011 |
rr_AnnualReturn2011 |
4.30%
|
|
| Annual Return 2012 |
rr_AnnualReturn2012 |
14.37%
|
|
| Annual Return 2013 |
rr_AnnualReturn2013 |
3.91%
|
|
| Annual Return 2014 |
rr_AnnualReturn2014 |
4.80%
|
|
| Annual Return 2015 |
rr_AnnualReturn2015 |
(1.37%)
|
|
| Annual Return 2016 |
rr_AnnualReturn2016 |
12.39%
|
|
| Year to Date Return, Label |
rr_YearToDateReturnLabel |
Year-to-date total return as of 9/30/2017 is +6.82%
|
|
| Bar Chart, Year to Date Return |
rr_BarChartYearToDateReturn |
6.82%
|
|
| Bar Chart, Year to Date Return, Date |
rr_BarChartYearToDateReturnDate |
Sep. 30, 2017
|
|
| Highest Quarterly Return, Label |
rr_HighestQuarterlyReturnLabel |
Highest Quarter: 2nd Quarter 2009
|
|
| Highest Quarterly Return |
rr_BarChartHighestQuarterlyReturn |
20.59%
|
|
| Highest Quarterly Return, Date |
rr_BarChartHighestQuarterlyReturnDate |
Jun. 30, 2009
|
|
| Lowest Quarterly Return, Label |
rr_LowestQuarterlyReturnLabel |
Lowest Quarter: 4th Quarter 2008
|
|
| Lowest Quarterly Return |
rr_BarChartLowestQuarterlyReturn |
(16.99%)
|
|
| Lowest Quarterly Return, Date |
rr_BarChartLowestQuarterlyReturnDate |
Dec. 31, 2008
|
|
| 1 Year |
rr_AverageAnnualReturnYear01 |
12.39%
|
|
| 5 Years |
rr_AverageAnnualReturnYear05 |
6.66%
|
|
| 10 Years |
rr_AverageAnnualReturnYear10 |
6.67%
|
|
| Inception Date of Share Class |
rr_AverageAnnualReturnInceptionDate |
Apr. 14, 1998
|
|
| (WFA Income Funds - Administrator Class) | (Wells Fargo High Yield Bond Fund) | Administrator Class | (after taxes on distributions) |
|
|
|
| Prospectus: |
rr_ProspectusTable |
|
|
| 1 Year |
rr_AverageAnnualReturnYear01 |
10.24%
|
|
| 5 Years |
rr_AverageAnnualReturnYear05 |
4.57%
|
|
| 10 Years |
rr_AverageAnnualReturnYear10 |
4.09%
|
|
| Inception Date of Share Class |
rr_AverageAnnualReturnInceptionDate |
Apr. 14, 1998
|
|
| (WFA Income Funds - Administrator Class) | (Wells Fargo High Yield Bond Fund) | Administrator Class | (after taxes on distributions and the sale of Fund Shares) |
|
|
|
| Prospectus: |
rr_ProspectusTable |
|
|
| 1 Year |
rr_AverageAnnualReturnYear01 |
6.96%
|
|
| 5 Years |
rr_AverageAnnualReturnYear05 |
4.21%
|
|
| 10 Years |
rr_AverageAnnualReturnYear10 |
4.04%
|
|
| Inception Date of Share Class |
rr_AverageAnnualReturnInceptionDate |
Apr. 14, 1998
|
|
| (WFA Income Funds - Administrator Class) | (Wells Fargo Short Duration Government Bond Fund) |
|
|
|
| Prospectus: |
rr_ProspectusTable |
|
|
| Objective [Heading] |
rr_ObjectiveHeading |
Investment Objective
|
|
| Objective, Primary [Text Block] |
rr_ObjectivePrimaryTextBlock |
The Fund seeks to provide current income consistent with capital preservation.
|
|
| Expense [Heading] |
rr_ExpenseHeading |
Fees and Expenses
|
|
| Expense Narrative [Text Block] |
rr_ExpenseNarrativeTextBlock |
These tables are intended to help you understand the various costs and expenses you will pay if you buy and hold shares of the Fund.
|
|
| Shareholder Fees Caption [Text] |
rr_ShareholderFeesCaption |
Shareholder Fees (fees paid directly from your investment)
|
|
| Operating Expenses Caption [Text] |
rr_OperatingExpensesCaption |
Annual Fund Operating Expenses (expenses that you pay each year as a percentage of the value of your investment)
|
|
| Fee Waiver or Reimbursement over Assets, Date of Termination |
rr_FeeWaiverOrReimbursementOverAssetsDateOfTermination |
December 31, 2018
|
|
| Expense Example [Heading] |
rr_ExpenseExampleHeading |
Example of Expenses
|
|
| Expense Example Narrative [Text Block] |
rr_ExpenseExampleNarrativeTextBlock |
The example below is intended to help you compare the costs of investing in the Fund with the costs of investing in other mutual funds. The example assumes a $10,000 initial investment, 5% annual total return, and that fees and expenses remain the same as in the tables above. To the extent that the Manager is waiving fees or reimbursing expenses, the example assumes that such waiver or reimbursement will only be in place through the date noted above. Although your actual costs may be higher or lower, based on these assumptions your costs would be:
|
|
| Portfolio Turnover [Heading] |
rr_PortfolioTurnoverHeading |
Portfolio Turnover
|
|
| Portfolio Turnover [Text Block] |
rr_PortfolioTurnoverTextBlock |
The Fund pays transaction costs, such as commissions, when it buys and sells securities (or "turns over" its portfolio). A higher portfolio turnover rate may indicate higher transaction costs and may result in higher taxes when Fund shares are held in a taxable account. These costs, which are not reflected in annual fund operating expenses or in the example, affect the Fund's performance. During the most recent fiscal year, the Fund's portfolio turnover rate was 348% of the average value of its portfolio.
|
|
| Portfolio Turnover, Rate |
rr_PortfolioTurnoverRate |
348.00%
|
|
| Strategy [Heading] |
rr_StrategyHeading |
Principal Investment Strategies
|
|
| Strategy Narrative [Text Block] |
rr_StrategyNarrativeTextBlock |
Under normal circumstances, we invest:
We invest principally in U.S. Government obligations, including debt securities issued or guaranteed by the U.S. Treasury, U.S. Government agencies or government-sponsored entities. We will purchase only securities that are rated, at the time of purchase, within the two highest rating categories assigned by a Nationally Recognized Statistical Ratings Organization, or are deemed by us to be of comparable quality. As part of our investment strategy, we may enter into mortgage dollar rolls. While we may purchase securities of any maturity or duration, under normal circumstances, we expect the portfolio's overall dollar-weighted average effective duration to be less than that of a 3-year U.S. Treasury note. "Dollar-Weighted Average Effective Duration" is an aggregate measure of the sensitivity of a fund's fixed income portfolio securities to changes in interest rates. As a general matter, the price of a fixed income security with a longer effective duration will fluctuate more in response to changes in interest rates than the price of a fixed income security with a shorter effective duration.
We invest in debt securities that we believe offer competitive returns and are undervalued, offering additional income and/or price appreciation potential, relative to other debt securities of similar credit quality and interest rate sensitivity. As part of our investment strategy, we invest in mortgage-backed securities guaranteed by U.S. Government agencies that we believe will sufficiently outperform U.S. Treasuries. We may sell a security that has achieved its desired return or if we believe the security or its sector has become overvalued. We may also sell a security if a more attractive opportunity becomes available or if the security is no longer attractive due to its risk profile or as a result of changes in the overall market environment.
|
|
| Risk [Heading] |
rr_RiskHeading |
Principal Investment Risks
|
|
| Risk Narrative [Text Block] |
rr_RiskNarrativeTextBlock |
An investment in the Fund may lose money, is not a deposit of Wells Fargo Bank, N.A. or its affiliates, is not insured or guaranteed by the Federal Deposit Insurance Corporation or any other governmental agency, and is primarily subject to the risks briefly summarized below.
Credit Risk. The issuer or guarantor of a debt security may be unable or perceived to be unable to pay interest or repay principal when they become due, which could cause the value of an investment to decline and a Fund to lose money.
Interest Rate Risk. When interest rates (which are currently near historic lows) rise, the value of debt securities tends to fall. When interest rates decline, interest that a Fund is able to earn on its investments in debt securities may also decline, but the value of those securities may increase.
Management Risk. Investment decisions, techniques, analyses or models implemented by a Fund's manager or sub-adviser in seeking to achieve the Fund's investment objective may not produce the returns expected, may cause the Fund's shares to lose value or may cause the Fund to underperform other funds with similar investment objectives.
Market Risk. The values of, and/or the income generated by, securities held by a Fund may decline due to general market conditions or other factors, including those directly involving the issuers of such securities. Security markets are volatile and may decline significantly in response to adverse issuer, regulatory, political, or economic developments. Different sectors of the market and different security types may react differently to such developments.
Mortgage- and Asset-Backed Securities Risk. Mortgage- and asset-backed securities may decline in value and become less liquid when defaults on the underlying mortgages or assets occur and may exhibit additional volatility in periods of rising interest rates. Rising interest rates tend to extend the duration of these securities, making them more sensitive to changes in interest rates than instruments with fixed payment schedules. When interest rates decline or are low, the prepayment of mortgages or assets underlying such securities can reduce a Fund's returns.
U.S. Government Obligations Risk. U.S. Government obligations may be adversely impacted by changes in interest rates, and securities issued or guaranteed by U.S. Government agencies or government-sponsored entities may not be backed by the full faith and credit of the U.S. Government.
|
|
| Risk Lose Money [Text] |
rr_RiskLoseMoney |
An investment in the Fund may lose money
|
|
| Risk Not Insured Depository Institution [Text] |
rr_RiskNotInsuredDepositoryInstitution |
An investment in the Fund may lose money, is not a deposit of Wells Fargo Bank, N.A. or its affiliates, is not insured or guaranteed by the Federal Deposit Insurance Corporation or any other governmental agency
|
|
| Bar Chart and Performance Table [Heading] |
rr_BarChartAndPerformanceTableHeading |
Performance
|
|
| Performance Narrative [Text Block] |
rr_PerformanceNarrativeTextBlock |
The following information provides some indication of the risks of investing in the Fund by showing changes in the Fund's performance from year to year. The Fund's average annual total returns are compared to the performance of one or more indices. Past performance before and after taxes is no guarantee of future results. Current month-end performance is available on the Fund's website at wellsfargofunds.com.
|
|
| Bar Chart Closing [Text Block] |
rr_BarChartClosingTextBlock |
Highest Quarter: 1st Quarter 2009 | +3.50% | | Lowest Quarter: 4th Quarter 2016 | -0.56% | Year-to-date total return as of 9/30/2017 is +0.89% |
|
|
| Performance Table Heading |
rr_PerformanceTableHeading |
Average Annual Total Returns for the periods ended 12/31/2016
|
|
| Performance Table Closing [Text Block] |
rr_PerformanceTableClosingTextBlock |
After-tax returns are calculated using the historical highest individual federal marginal income tax rates and do not reflect the impact of state, local or foreign taxes. Actual after-tax returns depend on an investor's tax situation and may differ from those shown, and after-tax returns shown are not relevant to tax-exempt investors or investors who hold their Fund shares through tax-deferred arrangements, such as 401(k) Plans or Individual Retirement Accounts.
|
|
| Performance Table Uses Highest Federal Rate |
rr_PerformanceTableUsesHighestFederalRate |
After-tax returns are calculated using the historical highest individual federal marginal income tax rates and do not reflect the impact of state, local or foreign taxes.
|
|
| Performance Table Not Relevant to Tax Deferred |
rr_PerformanceTableNotRelevantToTaxDeferred |
Actual after-tax returns depend on an investor's tax situation and may differ from those shown, and after-tax returns shown are not relevant to tax-exempt investors or investors who hold their Fund shares through tax-deferred arrangements, such as 401(k) Plans or Individual Retirement Accounts.
|
|
| Performance Past Does Not Indicate Future [Text] |
rr_PerformancePastDoesNotIndicateFuture |
Past performance before and after taxes is no guarantee of future results.
|
|
| Performance Information Illustrates Variability of Returns [Text] |
rr_PerformanceInformationIllustratesVariabilityOfReturns |
The following information provides some indication of the risks of investing in the Fund by showing changes in the Fund's performance from year to year. The Fund's average annual total returns are compared to the performance of one or more indices. Past performance before and after taxes is no guarantee of future results.
|
|
| Performance Availability Website Address [Text] |
rr_PerformanceAvailabilityWebSiteAddress |
wellsfargofunds.com
|
|
| (WFA Income Funds - Administrator Class) | (Wells Fargo Short Duration Government Bond Fund) | Bloomberg Barclays U.S. 1-3 Year Government Bond Index (reflects no deduction for fees, expenses, or taxes) |
|
|
|
| Prospectus: |
rr_ProspectusTable |
|
|
| 1 Year |
rr_AverageAnnualReturnYear01 |
0.87%
|
|
| 5 Years |
rr_AverageAnnualReturnYear05 |
0.59%
|
|
| 10 Years |
rr_AverageAnnualReturnYear10 |
2.18%
|
|
| (WFA Income Funds - Administrator Class) | (Wells Fargo Short Duration Government Bond Fund) | Administrator Class |
|
|
|
| Prospectus: |
rr_ProspectusTable |
|
|
| Maximum sales charge (load) imposed on purchases (as a percentage of offering price) |
rr_MaximumSalesChargeImposedOnPurchasesOverOfferingPrice |
none
|
|
| Maximum deferred sales charge (load) (as a percentage of offering price) |
rr_MaximumDeferredSalesChargeOverOfferingPrice |
none
|
|
| Management Fees |
rr_ManagementFeesOverAssets |
0.35%
|
|
| Distribution (12b-1) Fees |
rr_DistributionAndService12b1FeesOverAssets |
none
|
|
| Other Expenses |
rr_OtherExpensesOverAssets |
0.38%
|
|
| Total Annual Fund Operating Expenses |
rr_ExpensesOverAssets |
0.73%
|
|
| Fee Waivers |
rr_FeeWaiverOrReimbursementOverAssets |
(0.13%)
|
|
| Total Annual Fund Operating Expenses After Fee Waivers |
rr_NetExpensesOverAssets |
0.60%
|
[19] |
| Expense Example, with Redemption, 1 Year |
rr_ExpenseExampleYear01 |
$ 61
|
|
| Expense Example, with Redemption, 3 Years |
rr_ExpenseExampleYear03 |
220
|
|
| Expense Example, with Redemption, 5 Years |
rr_ExpenseExampleYear05 |
393
|
|
| Expense Example, with Redemption, 10 Years |
rr_ExpenseExampleYear10 |
$ 894
|
|
| Bar Chart [Heading] |
rr_BarChartHeading |
Calendar Year Total Returns for Administrator Class as of 12/31 each year
|
|
| Annual Return 2007 |
rr_AnnualReturn2007 |
5.95%
|
|
| Annual Return 2008 |
rr_AnnualReturn2008 |
4.31%
|
|
| Annual Return 2009 |
rr_AnnualReturn2009 |
7.08%
|
|
| Annual Return 2010 |
rr_AnnualReturn2010 |
3.75%
|
|
| Annual Return 2011 |
rr_AnnualReturn2011 |
2.38%
|
|
| Annual Return 2012 |
rr_AnnualReturn2012 |
2.00%
|
|
| Annual Return 2013 |
rr_AnnualReturn2013 |
(0.17%)
|
|
| Annual Return 2014 |
rr_AnnualReturn2014 |
0.88%
|
|
| Annual Return 2015 |
rr_AnnualReturn2015 |
0.27%
|
|
| Annual Return 2016 |
rr_AnnualReturn2016 |
1.03%
|
|
| Year to Date Return, Label |
rr_YearToDateReturnLabel |
Year-to-date total return as of 9/30/2017 is +0.89%
|
|
| Bar Chart, Year to Date Return |
rr_BarChartYearToDateReturn |
0.89%
|
|
| Bar Chart, Year to Date Return, Date |
rr_BarChartYearToDateReturnDate |
Sep. 30, 2017
|
|
| Highest Quarterly Return, Label |
rr_HighestQuarterlyReturnLabel |
Highest Quarter: 1st Quarter 2009
|
|
| Highest Quarterly Return |
rr_BarChartHighestQuarterlyReturn |
3.50%
|
|
| Highest Quarterly Return, Date |
rr_BarChartHighestQuarterlyReturnDate |
Mar. 31, 2009
|
|
| Lowest Quarterly Return, Label |
rr_LowestQuarterlyReturnLabel |
Lowest Quarter: 4th Quarter 2016
|
|
| Lowest Quarterly Return |
rr_BarChartLowestQuarterlyReturn |
(0.56%)
|
|
| Lowest Quarterly Return, Date |
rr_BarChartLowestQuarterlyReturnDate |
Dec. 31, 2016
|
|
| 1 Year |
rr_AverageAnnualReturnYear01 |
1.03%
|
|
| 5 Years |
rr_AverageAnnualReturnYear05 |
0.80%
|
|
| 10 Years |
rr_AverageAnnualReturnYear10 |
2.72%
|
|
| Inception Date of Share Class |
rr_AverageAnnualReturnInceptionDate |
Dec. 18, 1992
|
|
| (WFA Income Funds - Administrator Class) | (Wells Fargo Short Duration Government Bond Fund) | Administrator Class | (after taxes on distributions) |
|
|
|
| Prospectus: |
rr_ProspectusTable |
|
|
| 1 Year |
rr_AverageAnnualReturnYear01 |
0.28%
|
|
| 5 Years |
rr_AverageAnnualReturnYear05 |
0.09%
|
|
| 10 Years |
rr_AverageAnnualReturnYear10 |
1.72%
|
|
| Inception Date of Share Class |
rr_AverageAnnualReturnInceptionDate |
Dec. 18, 1992
|
|
| (WFA Income Funds - Administrator Class) | (Wells Fargo Short Duration Government Bond Fund) | Administrator Class | (after taxes on distributions and the sale of Fund Shares) |
|
|
|
| Prospectus: |
rr_ProspectusTable |
|
|
| 1 Year |
rr_AverageAnnualReturnYear01 |
0.59%
|
|
| 5 Years |
rr_AverageAnnualReturnYear05 |
0.31%
|
|
| 10 Years |
rr_AverageAnnualReturnYear10 |
1.73%
|
|
| Inception Date of Share Class |
rr_AverageAnnualReturnInceptionDate |
Dec. 18, 1992
|
|
| (WFA Income Funds - Administrator Class) | (Wells Fargo Short-Term High Yield Bond Fund) |
|
|
|
| Prospectus: |
rr_ProspectusTable |
|
|
| Objective [Heading] |
rr_ObjectiveHeading |
Investment Objective
|
|
| Objective, Primary [Text Block] |
rr_ObjectivePrimaryTextBlock |
The Fund seeks total return, consisting of a high level of current income and capital appreciation.
|
|
| Expense [Heading] |
rr_ExpenseHeading |
Fees and Expenses
|
|
| Expense Narrative [Text Block] |
rr_ExpenseNarrativeTextBlock |
These tables are intended to help you understand the various costs and expenses you will pay if you buy and hold shares of the Fund.
|
|
| Shareholder Fees Caption [Text] |
rr_ShareholderFeesCaption |
Shareholder Fees (fees paid directly from your investment)
|
|
| Operating Expenses Caption [Text] |
rr_OperatingExpensesCaption |
Annual Fund Operating Expenses (expenses that you pay each year as a percentage of the value of your investment)
|
|
| Fee Waiver or Reimbursement over Assets, Date of Termination |
rr_FeeWaiverOrReimbursementOverAssetsDateOfTermination |
December 31, 2018
|
|
| Expense Example [Heading] |
rr_ExpenseExampleHeading |
Example of Expenses
|
|
| Expense Example Narrative [Text Block] |
rr_ExpenseExampleNarrativeTextBlock |
The example below is intended to help you compare the costs of investing in the Fund with the costs of investing in other mutual funds. The example assumes a $10,000 initial investment, 5% annual total return, and that fees and expenses remain the same as in the tables above. To the extent that the Manager is waiving fees or reimbursing expenses, the example assumes that such waiver or reimbursement will only be in place through the date noted above. Although your actual costs may be higher or lower, based on these assumptions your costs would be:
|
|
| Portfolio Turnover [Heading] |
rr_PortfolioTurnoverHeading |
Portfolio Turnover
|
|
| Portfolio Turnover [Text Block] |
rr_PortfolioTurnoverTextBlock |
The Fund pays transaction costs, such as commissions, when it buys and sells securities (or "turns over" its portfolio). A higher portfolio turnover rate may indicate higher transaction costs and may result in higher taxes when Fund shares are held in a taxable account. These costs, which are not reflected in annual fund operating expenses or in the example, affect the Fund's performance. During the most recent fiscal year, the Fund's portfolio turnover rate was 35% of the average value of its portfolio.
|
|
| Portfolio Turnover, Rate |
rr_PortfolioTurnoverRate |
35.00%
|
|
| Strategy [Heading] |
rr_StrategyHeading |
Principal Investment Strategies
|
|
| Strategy Narrative [Text Block] |
rr_StrategyNarrativeTextBlock |
Under normal circumstances, we invest:
We invest principally in below investment-grade debt securities (often called "high-yield" securities or "junk bonds") of corporate issuers. These include traditional corporate bonds as well as bank loans. These securities may have fixed, floating or variable rates. As part of our below investment-grade debt securities investment strategy, we will generally invest in securities that are rated BB through CCC by Standard & Poor's or Ba through Caa by Moody's, or an equivalent quality rating from another Nationally Recognized Statistical Ratings Organization, or are deemed by us to be of comparable quality. We may also use credit default swap agreements to reduce cash positions and to cost-effectively increase credit exposure, and futures to manage duration exposure. While we may purchase securities of any maturity, under normal circumstances, we expect the Fund's dollar-weighted average effective maturity to be three years or less. "Dollar-Weighted Average Effective Maturity" is a measure of the average time until the final payment of principal and interest is due on fixed income securities in the Fund's portfolio.
We start our investment process with a focus on bottom-up fundamental credit analysis to generate new ideas, to understand the potential risks, to select individual securities that may potentially add value from income and/or capital appreciation. Our credit research may include an assessment of an issuer's general financial condition, its competitive positioning and management strength, as well as industry characteristics and other factors. We may sell a security due to changes in credit characteristics or outlook, as well as changes in portfolio strategy or cash flow needs. A security may also be sold and replaced with one that presents a better value or risk/reward profile.
|
|
| Risk [Heading] |
rr_RiskHeading |
Principal Investment Risks
|
|
| Risk Narrative [Text Block] |
rr_RiskNarrativeTextBlock |
An investment in the Fund may lose money, is not a deposit of Wells Fargo Bank, N.A. or its affiliates, is not insured or guaranteed by the Federal Deposit Insurance Corporation or any other governmental agency, and is primarily subject to the risks briefly summarized below.
Credit Risk. The issuer or guarantor of a debt security may be unable or perceived to be unable to pay interest or repay principal when they become due, which could cause the value of an investment to decline and a Fund to lose money.
Derivatives Risk. The use of derivatives, such as futures, options and swap agreements, can lead to losses, including those magnified by leverage, particularly when derivatives are used to enhance return rather than mitigate risk. Certain derivative instruments may be difficult to sell when the portfolio manager believes it would be appropriate to do so, or the other party to a derivative contract may be unwilling or unable to fulfill its contractual obligations.
Foreign Investment Risk. Foreign investments may be subject to lower liquidity, greater price volatility and risks related to adverse political, regulatory, market or economic developments. Foreign investments may involve exposure to changes in foreign currency exchange rates and may be subject to higher withholding and other taxes.
Futures Contracts Risk. A Fund that uses futures contracts, which are a type of derivative, is subject to the risk of loss caused by unanticipated market movements. In addition, there may at times be an imperfect correlation between the movement in the prices of futures contracts and the value of their underlying instruments or indexes and there may at times not be a liquid secondary market for certain futures contracts.
High Yield Securities Risk. High yield securities and unrated securities of similar credit quality (commonly known as "junk bonds") have a much greater risk of default or of not returning principal and their values tend to be more volatile than higher-rated securities with similar maturities.
Interest Rate Risk. When interest rates (which are currently near historic lows) rise, the value of debt securities tends to fall. When interest rates decline, interest that a Fund is able to earn on its investments in debt securities may also decline, but the value of those securities may increase.
Loan Risk. Loans may be unrated, less liquid and more difficult to value than traditional debt securities. The highly leveraged capital structure of the borrowers in such transactions may make such loans especially vulnerable to adverse changes in financial, economic or market conditions. A Fund may be unable to sell loans at a desired time or price. The Fund may also not be able to control amendments, waivers or the exercise of any remedies that a lender would have under a direct loan and may assume liability as a lender.
Management Risk. Investment decisions, techniques, analyses or models implemented by a Fund's manager or sub-adviser in seeking to achieve the Fund's investment objective may not produce the returns expected, may cause the Fund's shares to lose value or may cause the Fund to underperform other funds with similar investment objectives.
Market Risk. The values of, and/or the income generated by, securities held by a Fund may decline due to general market conditions or other factors, including those directly involving the issuers of such securities. Security markets are volatile and may decline significantly in response to adverse issuer, regulatory, political, or economic developments. Different sectors of the market and different security types may react differently to such developments.
Swaps Risk. Depending on their structure, swap agreements and options to enter into swap agreements ("swaptions"), both of which are types of derivatives, may increase or decrease a Fund's exposure to long- or short-term interest rates, foreign currency values, mortgage-backed securities, corporate borrowing rates, or credit events or other reference points such as security prices or inflation rates.
|
|
| Risk Lose Money [Text] |
rr_RiskLoseMoney |
An investment in the Fund may lose money
|
|
| Risk Not Insured Depository Institution [Text] |
rr_RiskNotInsuredDepositoryInstitution |
An investment in the Fund may lose money, is not a deposit of Wells Fargo Bank, N.A. or its affiliates, is not insured or guaranteed by the Federal Deposit Insurance Corporation or any other governmental agency
|
|
| Bar Chart and Performance Table [Heading] |
rr_BarChartAndPerformanceTableHeading |
Performance
|
|
| Performance Narrative [Text Block] |
rr_PerformanceNarrativeTextBlock |
The following information provides some indication of the risks of investing in the Fund by showing changes in the Fund's performance from year to year. The Fund's average annual total returns are compared to the performance of one or more indices. Past performance before and after taxes is no guarantee of future results. Current month-end performance is available on the Fund's website at wellsfargofunds.com.
|
|
| Bar Chart Closing [Text Block] |
rr_BarChartClosingTextBlock |
Highest Quarter: 1st Quarter 2009 | +4.75% | | Lowest Quarter: 4th Quarter 2008 | -5.69% | Year-to-date total return as of 9/30/2017 is +1.99% |
|
|
| Performance Table Heading |
rr_PerformanceTableHeading |
Average Annual Total Returns for the periods ended 12/31/2016
|
[27] |
| Performance Table Closing [Text Block] |
rr_PerformanceTableClosingTextBlock |
After-tax returns are calculated using the historical highest individual federal marginal income tax rates and do not reflect the impact of state, local or foreign taxes. Actual after-tax returns depend on an investor's tax situation and may differ from those shown, and after-tax returns shown are not relevant to tax-exempt investors or investors who hold their Fund shares through tax-deferred arrangements, such as 401(k) Plans or Individual Retirement Accounts.
|
|
| Performance Table Uses Highest Federal Rate |
rr_PerformanceTableUsesHighestFederalRate |
After-tax returns are calculated using the historical highest individual federal marginal income tax rates and do not reflect the impact of state, local or foreign taxes.
|
|
| Performance Table Not Relevant to Tax Deferred |
rr_PerformanceTableNotRelevantToTaxDeferred |
Actual after-tax returns depend on an investor's tax situation and may differ from those shown, and after-tax returns shown are not relevant to tax-exempt investors or investors who hold their Fund shares through tax-deferred arrangements, such as 401(k) Plans or Individual Retirement Accounts.
|
|
| Performance Past Does Not Indicate Future [Text] |
rr_PerformancePastDoesNotIndicateFuture |
Past performance before and after taxes is no guarantee of future results.
|
|
| Performance Information Illustrates Variability of Returns [Text] |
rr_PerformanceInformationIllustratesVariabilityOfReturns |
The following information provides some indication of the risks of investing in the Fund by showing changes in the Fund's performance from year to year. The Fund's average annual total returns are compared to the performance of one or more indices. Past performance before and after taxes is no guarantee of future results.
|
|
| Performance Availability Website Address [Text] |
rr_PerformanceAvailabilityWebSiteAddress |
wellsfargofunds.com
|
|
| (WFA Income Funds - Administrator Class) | (Wells Fargo Short-Term High Yield Bond Fund) | ICE BofA Merrill Lynch High Yield U.S. Corporates, Cash Pay, BB Rated, 1-5 Year Index (reflects no deduction for fees, expenses, or taxes) |
|
|
|
| Prospectus: |
rr_ProspectusTable |
|
|
| 1 Year |
rr_AverageAnnualReturnYear01 |
10.39%
|
|
| 5 Years |
rr_AverageAnnualReturnYear05 |
6.37%
|
|
| 10 Years |
rr_AverageAnnualReturnYear10 |
6.59%
|
|
| (WFA Income Funds - Administrator Class) | (Wells Fargo Short-Term High Yield Bond Fund) | Administrator Class |
|
|
|
| Prospectus: |
rr_ProspectusTable |
|
|
| Maximum sales charge (load) imposed on purchases (as a percentage of offering price) |
rr_MaximumSalesChargeImposedOnPurchasesOverOfferingPrice |
none
|
|
| Maximum deferred sales charge (load) (as a percentage of offering price) |
rr_MaximumDeferredSalesChargeOverOfferingPrice |
none
|
|
| Management Fees |
rr_ManagementFeesOverAssets |
0.48%
|
|
| Distribution (12b-1) Fees |
rr_DistributionAndService12b1FeesOverAssets |
none
|
|
| Other Expenses |
rr_OtherExpensesOverAssets |
0.38%
|
|
| Acquired Fund Fees and Expenses |
rr_AcquiredFundFeesAndExpensesOverAssets |
0.01%
|
|
| Total Annual Fund Operating Expenses |
rr_ExpensesOverAssets |
0.87%
|
|
| Fee Waivers |
rr_FeeWaiverOrReimbursementOverAssets |
(0.21%)
|
|
| Total Annual Fund Operating Expenses After Fee Waivers |
rr_NetExpensesOverAssets |
0.66%
|
[28] |
| Expense Example, with Redemption, 1 Year |
rr_ExpenseExampleYear01 |
$ 67
|
|
| Expense Example, with Redemption, 3 Years |
rr_ExpenseExampleYear03 |
257
|
|
| Expense Example, with Redemption, 5 Years |
rr_ExpenseExampleYear05 |
462
|
|
| Expense Example, with Redemption, 10 Years |
rr_ExpenseExampleYear10 |
$ 1,053
|
|
| Bar Chart [Heading] |
rr_BarChartHeading |
Calendar Year Total Returns for Administrator Class as of 12/31 each year
|
[27] |
| Annual Return 2007 |
rr_AnnualReturn2007 |
3.24%
|
|
| Annual Return 2008 |
rr_AnnualReturn2008 |
(5.82%)
|
|
| Annual Return 2009 |
rr_AnnualReturn2009 |
15.34%
|
|
| Annual Return 2010 |
rr_AnnualReturn2010 |
7.02%
|
|
| Annual Return 2011 |
rr_AnnualReturn2011 |
3.64%
|
|
| Annual Return 2012 |
rr_AnnualReturn2012 |
6.53%
|
|
| Annual Return 2013 |
rr_AnnualReturn2013 |
3.75%
|
|
| Annual Return 2014 |
rr_AnnualReturn2014 |
0.68%
|
|
| Annual Return 2015 |
rr_AnnualReturn2015 |
2.29%
|
|
| Annual Return 2016 |
rr_AnnualReturn2016 |
4.57%
|
|
| Year to Date Return, Label |
rr_YearToDateReturnLabel |
Year-to-date total return as of 9/30/2017 is +1.99%
|
|
| Bar Chart, Year to Date Return |
rr_BarChartYearToDateReturn |
1.99%
|
|
| Bar Chart, Year to Date Return, Date |
rr_BarChartYearToDateReturnDate |
Sep. 30, 2017
|
|
| Highest Quarterly Return, Label |
rr_HighestQuarterlyReturnLabel |
Highest Quarter: 1st Quarter 2009
|
|
| Highest Quarterly Return |
rr_BarChartHighestQuarterlyReturn |
4.75%
|
|
| Highest Quarterly Return, Date |
rr_BarChartHighestQuarterlyReturnDate |
Mar. 31, 2009
|
|
| Lowest Quarterly Return, Label |
rr_LowestQuarterlyReturnLabel |
Lowest Quarter: 4th Quarter 2008
|
|
| Lowest Quarterly Return |
rr_BarChartLowestQuarterlyReturn |
(5.69%)
|
|
| Lowest Quarterly Return, Date |
rr_BarChartLowestQuarterlyReturnDate |
Dec. 31, 2008
|
|
| 1 Year |
rr_AverageAnnualReturnYear01 |
4.57%
|
|
| 5 Years |
rr_AverageAnnualReturnYear05 |
3.54%
|
|
| 10 Years |
rr_AverageAnnualReturnYear10 |
4.00%
|
|
| Inception Date of Share Class |
rr_AverageAnnualReturnInceptionDate |
Jul. 30, 2010
|
|
| (WFA Income Funds - Administrator Class) | (Wells Fargo Short-Term High Yield Bond Fund) | Administrator Class | (after taxes on distributions) |
|
|
|
| Prospectus: |
rr_ProspectusTable |
|
|
| 1 Year |
rr_AverageAnnualReturnYear01 |
3.17%
|
|
| 5 Years |
rr_AverageAnnualReturnYear05 |
2.04%
|
|
| 10 Years |
rr_AverageAnnualReturnYear10 |
2.29%
|
|
| Inception Date of Share Class |
rr_AverageAnnualReturnInceptionDate |
Jul. 30, 2010
|
|
| (WFA Income Funds - Administrator Class) | (Wells Fargo Short-Term High Yield Bond Fund) | Administrator Class | (after taxes on distributions and the sale of Fund Shares) |
|
|
|
| Prospectus: |
rr_ProspectusTable |
|
|
| 1 Year |
rr_AverageAnnualReturnYear01 |
2.57%
|
|
| 5 Years |
rr_AverageAnnualReturnYear05 |
2.06%
|
|
| 10 Years |
rr_AverageAnnualReturnYear10 |
2.39%
|
|
| Inception Date of Share Class |
rr_AverageAnnualReturnInceptionDate |
Jul. 30, 2010
|
|
| (WFA Income Funds - Administrator Class) | (Wells Fargo Ultra Short-Term Income Fund) |
|
|
|
| Prospectus: |
rr_ProspectusTable |
|
|
| Objective [Heading] |
rr_ObjectiveHeading |
Investment Objective
|
|
| Objective, Primary [Text Block] |
rr_ObjectivePrimaryTextBlock |
The Fund seeks current income consistent with capital preservation.
|
|
| Expense [Heading] |
rr_ExpenseHeading |
Fees and Expenses
|
|
| Expense Narrative [Text Block] |
rr_ExpenseNarrativeTextBlock |
These tables are intended to help you understand the various costs and expenses you will pay if you buy and hold shares of the Fund.
|
|
| Shareholder Fees Caption [Text] |
rr_ShareholderFeesCaption |
Shareholder Fees (fees paid directly from your investment)
|
|
| Operating Expenses Caption [Text] |
rr_OperatingExpensesCaption |
Annual Fund Operating Expenses (expenses that you pay each year as a percentage of the value of your investment)
|
|
| Fee Waiver or Reimbursement over Assets, Date of Termination |
rr_FeeWaiverOrReimbursementOverAssetsDateOfTermination |
December 31, 2018
|
|
| Expense Example [Heading] |
rr_ExpenseExampleHeading |
Example of Expenses
|
|
| Expense Example Narrative [Text Block] |
rr_ExpenseExampleNarrativeTextBlock |
The example below is intended to help you compare the costs of investing in the Fund with the costs of investing in other mutual funds. The example assumes a $10,000 initial investment, 5% annual total return, and that fees and expenses remain the same as in the tables above. To the extent that the Manager is waiving fees or reimbursing expenses, the example assumes that such waiver or reimbursement will only be in place through the date noted above. Although your actual costs may be higher or lower, based on these assumptions your costs would be:
|
|
| Portfolio Turnover [Heading] |
rr_PortfolioTurnoverHeading |
Portfolio Turnover
|
|
| Portfolio Turnover [Text Block] |
rr_PortfolioTurnoverTextBlock |
The Fund pays transaction costs, such as commissions, when it buys and sells securities (or "turns over" its portfolio). A higher portfolio turnover rate may indicate higher transaction costs and may result in higher taxes when Fund shares are held in a taxable account. These costs, which are not reflected in annual fund operating expenses or in the example, affect the Fund's performance. During the most recent fiscal year, the Fund's portfolio turnover rate was 56% of the average value of its portfolio.
|
|
| Portfolio Turnover, Rate |
rr_PortfolioTurnoverRate |
56.00%
|
|
| Strategy [Heading] |
rr_StrategyHeading |
Principal Investment Strategies
|
|
| Strategy Narrative [Text Block] |
rr_StrategyNarrativeTextBlock |
Under normal circumstances, we invest:
-
at least 80% of the Fund's net assets in income-producing debt securities;
-
up to 25% of the Fund's total assets in U.S. dollar-denominated debt securities of foreign issuers; and
-
up to 15% of the Fund's total assets in below investment-grade debt securities.
We invest principally in income-producing debt securities. Our portfolio holdings may include U.S. Government obligations, corporate debt securities, bank loans and mortgage- and asset-backed debt securities. These securities may have fixed, floating or variable rates. We may invest in investment-grade and below investment-grade debt securities (often called "high-yield" securities or "junk bonds"), as well as in debt securities of both domestic and foreign issuers. As part of our below investment-grade debt securities investment strategy, we will generally invest in securities that are rated at least BB by Standard & Poor's or Ba by Moody's, or an equivalent quality rating from another Nationally Recognized Statistical Ratings Organization, or are deemed by us to be of comparable quality. We may also use futures for duration and yield curve management. While we may purchase securities of any maturity, under normal circumstances, we expect the Fund's dollar-weighted average effective maturity to be one year or less. "Dollar-Weighted Average Effective Maturity" is a measure of the average time until the final payment of principal and interest is due on fixed income securities in the Fund's portfolio.
We employ a top-down, macroeconomic outlook to determine the portfolio's duration, yield curve positioning, credit quality and sector allocation. Macroeconomic factors considered may include, among others, the pace of economic growth, employment conditions, corporate profits, inflation, monetary and fiscal policy, as well as the influence of international economic and financial conditions. In combination with our top-down, macroeconomic approach, we employ a bottom-up process of fundamental securities analysis to select the specific securities for investment. Elements of this evaluation may include credit research, duration measurements, historical yield spread relationships, volatility trends, mortgage refinance rates, as well as other factors. Our credit analysis may consider an issuer's general financial condition, its competitive position and its management strategies, as well as industry characteristics and other factors. We may sell a security due to changes in credit characteristics or outlook, as well as changes in portfolio strategy or cash flow needs. A security may also be sold and replaced with one that presents a better value or risk/reward profile.
|
|
| Risk [Heading] |
rr_RiskHeading |
Principal Investment Risks
|
|
| Risk Narrative [Text Block] |
rr_RiskNarrativeTextBlock |
An investment in the Fund may lose money, is not a deposit of Wells Fargo Bank, N.A. or its affiliates, is not insured or guaranteed by the Federal Deposit Insurance Corporation or any other governmental agency, and is primarily subject to the risks briefly summarized below.
Credit Risk. The issuer or guarantor of a debt security may be unable or perceived to be unable to pay interest or repay principal when they become due, which could cause the value of an investment to decline and a Fund to lose money.
Derivatives Risk. The use of derivatives, such as futures, options and swap agreements, can lead to losses, including those magnified by leverage, particularly when derivatives are used to enhance return rather than mitigate risk. Certain derivative instruments may be difficult to sell when the portfolio manager believes it would be appropriate to do so, or the other party to a derivative contract may be unwilling or unable to fulfill its contractual obligations.
Foreign Investment Risk. Foreign investments may be subject to lower liquidity, greater price volatility and risks related to adverse political, regulatory, market or economic developments. Foreign investments may involve exposure to changes in foreign currency exchange rates and may be subject to higher withholding and other taxes.
Futures Contracts Risk. A Fund that uses futures contracts, which are a type of derivative, is subject to the risk of loss caused by unanticipated market movements. In addition, there may at times be an imperfect correlation between the movement in the prices of futures contracts and the value of their underlying instruments or indexes and there may at times not be a liquid secondary market for certain futures contracts.
High Yield Securities Risk. High yield securities and unrated securities of similar credit quality (commonly known as "junk bonds") have a much greater risk of default or of not returning principal and their values tend to be more volatile than higher-rated securities with similar maturities.
Interest Rate Risk. When interest rates (which are currently near historic lows) rise, the value of debt securities tends to fall. When interest rates decline, interest that a Fund is able to earn on its investments in debt securities may also decline, but the value of those securities may increase.
Loan Risk. Loans may be unrated, less liquid and more difficult to value than traditional debt securities. The highly leveraged capital structure of the borrowers in such transactions may make such loans especially vulnerable to adverse changes in financial, economic or market conditions. A Fund may be unable to sell loans at a desired time or price. The Fund may also not be able to control amendments, waivers or the exercise of any remedies that a lender would have under a direct loan and may assume liability as a lender.
Management Risk. Investment decisions, techniques, analyses or models implemented by a Fund's manager or sub-adviser in seeking to achieve the Fund's investment objective may not produce the returns expected, may cause the Fund's shares to lose value or may cause the Fund to underperform other funds with similar investment objectives.
Market Risk. The values of, and/or the income generated by, securities held by a Fund may decline due to general market conditions or other factors, including those directly involving the issuers of such securities. Security markets are volatile and may decline significantly in response to adverse issuer, regulatory, political, or economic developments. Different sectors of the market and different security types may react differently to such developments.
Mortgage- and Asset-Backed Securities Risk. Mortgage- and asset-backed securities may decline in value and become less liquid when defaults on the underlying mortgages or assets occur and may exhibit additional volatility in periods of rising interest rates. Rising interest rates tend to extend the duration of these securities, making them more sensitive to changes in interest rates than instruments with fixed payment schedules. When interest rates decline or are low, the prepayment of mortgages or assets underlying such securities can reduce a Fund's returns.
U.S. Government Obligations Risk. U.S. Government obligations may be adversely impacted by changes in interest rates, and securities issued or guaranteed by U.S. Government agencies or government-sponsored entities may not be backed by the full faith and credit of the U.S. Government.
|
|
| Risk Lose Money [Text] |
rr_RiskLoseMoney |
An investment in the Fund may lose money
|
|
| Risk Not Insured Depository Institution [Text] |
rr_RiskNotInsuredDepositoryInstitution |
An investment in the Fund may lose money, is not a deposit of Wells Fargo Bank, N.A. or its affiliates, is not insured or guaranteed by the Federal Deposit Insurance Corporation or any other governmental agency
|
|
| Bar Chart and Performance Table [Heading] |
rr_BarChartAndPerformanceTableHeading |
Performance
|
|
| Performance Narrative [Text Block] |
rr_PerformanceNarrativeTextBlock |
The following information provides some indication of the risks of investing in the Fund by showing changes in the Fund's performance from year to year. The Fund's average annual total returns are compared to the performance of one or more indices. Past performance before and after taxes is no guarantee of future results. Current month-end performance is available on the Fund's website at wellsfargofunds.com.
|
|
| Bar Chart Closing [Text Block] |
rr_BarChartClosingTextBlock |
Highest Quarter: 3rd Quarter 2009 | +3.89% | | Lowest Quarter: 4th Quarter 2008 | -4.61% | Year-to-date total return as of 9/30/2017 is +1.08% |
|
|
| Performance Table Heading |
rr_PerformanceTableHeading |
Average Annual Total Returns for the periods ended 12/31/2016
|
|
| Performance Table Closing [Text Block] |
rr_PerformanceTableClosingTextBlock |
After-tax returns are calculated using the historical highest individual federal marginal income tax rates and do not reflect the impact of state, local or foreign taxes. Actual after-tax returns depend on an investor's tax situation and may differ from those shown, and after-tax returns shown are not relevant to tax-exempt investors or investors who hold their Fund shares through tax-deferred arrangements, such as 401(k) Plans or Individual Retirement Accounts.
|
|
| Performance Table Uses Highest Federal Rate |
rr_PerformanceTableUsesHighestFederalRate |
After-tax returns are calculated using the historical highest individual federal marginal income tax rates and do not reflect the impact of state, local or foreign taxes.
|
|
| Performance Table Not Relevant to Tax Deferred |
rr_PerformanceTableNotRelevantToTaxDeferred |
Actual after-tax returns depend on an investor's tax situation and may differ from those shown, and after-tax returns shown are not relevant to tax-exempt investors or investors who hold their Fund shares through tax-deferred arrangements, such as 401(k) Plans or Individual Retirement Accounts.
|
|
| Performance Past Does Not Indicate Future [Text] |
rr_PerformancePastDoesNotIndicateFuture |
Past performance before and after taxes is no guarantee of future results.
|
|
| Performance Information Illustrates Variability of Returns [Text] |
rr_PerformanceInformationIllustratesVariabilityOfReturns |
The following information provides some indication of the risks of investing in the Fund by showing changes in the Fund's performance from year to year. The Fund's average annual total returns are compared to the performance of one or more indices. Past performance before and after taxes is no guarantee of future results.
|
|
| Performance Availability Website Address [Text] |
rr_PerformanceAvailabilityWebSiteAddress |
wellsfargofunds.com
|
|
| (WFA Income Funds - Administrator Class) | (Wells Fargo Ultra Short-Term Income Fund) | Bloomberg Barclays Short-Term U.S. Government/Credit Bond Index (reflects no deduction for fees, expenses, or taxes) |
|
|
|
| Prospectus: |
rr_ProspectusTable |
|
|
| 1 Year |
rr_AverageAnnualReturnYear01 |
0.80%
|
|
| 5 Years |
rr_AverageAnnualReturnYear05 |
0.37%
|
|
| 10 Years |
rr_AverageAnnualReturnYear10 |
1.34%
|
|
| (WFA Income Funds - Administrator Class) | (Wells Fargo Ultra Short-Term Income Fund) | Administrator Class |
|
|
|
| Prospectus: |
rr_ProspectusTable |
|
|
| Maximum sales charge (load) imposed on purchases (as a percentage of offering price) |
rr_MaximumSalesChargeImposedOnPurchasesOverOfferingPrice |
none
|
|
| Maximum deferred sales charge (load) (as a percentage of offering price) |
rr_MaximumDeferredSalesChargeOverOfferingPrice |
none
|
|
| Management Fees |
rr_ManagementFeesOverAssets |
0.34%
|
|
| Distribution (12b-1) Fees |
rr_DistributionAndService12b1FeesOverAssets |
none
|
|
| Other Expenses |
rr_OtherExpensesOverAssets |
0.39%
|
|
| Acquired Fund Fees and Expenses |
rr_AcquiredFundFeesAndExpensesOverAssets |
0.01%
|
|
| Total Annual Fund Operating Expenses |
rr_ExpensesOverAssets |
0.74%
|
|
| Fee Waivers |
rr_FeeWaiverOrReimbursementOverAssets |
(0.18%)
|
|
| Total Annual Fund Operating Expenses After Fee Waivers |
rr_NetExpensesOverAssets |
0.56%
|
[29] |
| Expense Example, with Redemption, 1 Year |
rr_ExpenseExampleYear01 |
$ 57
|
|
| Expense Example, with Redemption, 3 Years |
rr_ExpenseExampleYear03 |
218
|
|
| Expense Example, with Redemption, 5 Years |
rr_ExpenseExampleYear05 |
394
|
|
| Expense Example, with Redemption, 10 Years |
rr_ExpenseExampleYear10 |
$ 902
|
|
| Bar Chart [Heading] |
rr_BarChartHeading |
Calendar Year Total Returns for Administrator Class as of 12/31 each year
|
|
| Annual Return 2007 |
rr_AnnualReturn2007 |
3.40%
|
|
| Annual Return 2008 |
rr_AnnualReturn2008 |
(6.63%)
|
|
| Annual Return 2009 |
rr_AnnualReturn2009 |
8.72%
|
|
| Annual Return 2010 |
rr_AnnualReturn2010 |
3.90%
|
|
| Annual Return 2011 |
rr_AnnualReturn2011 |
0.54%
|
|
| Annual Return 2012 |
rr_AnnualReturn2012 |
2.07%
|
|
| Annual Return 2013 |
rr_AnnualReturn2013 |
0.62%
|
|
| Annual Return 2014 |
rr_AnnualReturn2014 |
0.31%
|
|
| Annual Return 2015 |
rr_AnnualReturn2015 |
0.32%
|
|
| Annual Return 2016 |
rr_AnnualReturn2016 |
1.53%
|
|
| Year to Date Return, Label |
rr_YearToDateReturnLabel |
Year-to-date total return as of 9/30/2017 is +1.08%
|
|
| Bar Chart, Year to Date Return |
rr_BarChartYearToDateReturn |
1.08%
|
|
| Bar Chart, Year to Date Return, Date |
rr_BarChartYearToDateReturnDate |
Sep. 30, 2017
|
|
| Highest Quarterly Return, Label |
rr_HighestQuarterlyReturnLabel |
Highest Quarter: 3rd Quarter 2009
|
|
| Highest Quarterly Return |
rr_BarChartHighestQuarterlyReturn |
3.89%
|
|
| Highest Quarterly Return, Date |
rr_BarChartHighestQuarterlyReturnDate |
Sep. 30, 2009
|
|
| Lowest Quarterly Return, Label |
rr_LowestQuarterlyReturnLabel |
Lowest Quarter: 4th Quarter 2008
|
|
| Lowest Quarterly Return |
rr_BarChartLowestQuarterlyReturn |
(4.61%)
|
|
| Lowest Quarterly Return, Date |
rr_BarChartLowestQuarterlyReturnDate |
Dec. 31, 2008
|
|
| 1 Year |
rr_AverageAnnualReturnYear01 |
1.53%
|
|
| 5 Years |
rr_AverageAnnualReturnYear05 |
0.97%
|
|
| 10 Years |
rr_AverageAnnualReturnYear10 |
1.41%
|
|
| Inception Date of Share Class |
rr_AverageAnnualReturnInceptionDate |
Apr. 08, 2005
|
|
| (WFA Income Funds - Administrator Class) | (Wells Fargo Ultra Short-Term Income Fund) | Administrator Class | (after taxes on distributions) |
|
|
|
| Prospectus: |
rr_ProspectusTable |
|
|
| 1 Year |
rr_AverageAnnualReturnYear01 |
1.02%
|
|
| 5 Years |
rr_AverageAnnualReturnYear05 |
0.56%
|
|
| 10 Years |
rr_AverageAnnualReturnYear10 |
0.63%
|
|
| Inception Date of Share Class |
rr_AverageAnnualReturnInceptionDate |
Apr. 08, 2005
|
|
| (WFA Income Funds - Administrator Class) | (Wells Fargo Ultra Short-Term Income Fund) | Administrator Class | (after taxes on distributions and the sale of Fund Shares) |
|
|
|
| Prospectus: |
rr_ProspectusTable |
|
|
| 1 Year |
rr_AverageAnnualReturnYear01 |
0.86%
|
|
| 5 Years |
rr_AverageAnnualReturnYear05 |
0.57%
|
|
| 10 Years |
rr_AverageAnnualReturnYear10 |
0.79%
|
|
| Inception Date of Share Class |
rr_AverageAnnualReturnInceptionDate |
Apr. 08, 2005
|
|
| (WFA Income Funds - Institutional Class) | (Wells Fargo Adjustable Rate Government Fund) |
|
|
|
| Prospectus: |
rr_ProspectusTable |
|
|
| Objective [Heading] |
rr_ObjectiveHeading |
Investment Objective
|
|
| Objective, Primary [Text Block] |
rr_ObjectivePrimaryTextBlock |
The Fund seeks current income consistent with capital preservation.
|
|
| Expense [Heading] |
rr_ExpenseHeading |
Fees and Expenses
|
|
| Expense Narrative [Text Block] |
rr_ExpenseNarrativeTextBlock |
These tables are intended to help you understand the various costs and expenses you will pay if you buy and hold shares of the Fund.
|
|
| Shareholder Fees Caption [Text] |
rr_ShareholderFeesCaption |
Shareholder Fees (fees paid directly from your investment)
|
|
| Operating Expenses Caption [Text] |
rr_OperatingExpensesCaption |
Annual Fund Operating Expenses (expenses that you pay each year as a percentage of the value of your investment)
|
|
| Fee Waiver or Reimbursement over Assets, Date of Termination |
rr_FeeWaiverOrReimbursementOverAssetsDateOfTermination |
December 31, 2018
|
|
| Expense Example [Heading] |
rr_ExpenseExampleHeading |
Example of Expenses
|
|
| Expense Example Narrative [Text Block] |
rr_ExpenseExampleNarrativeTextBlock |
The example below is intended to help you compare the costs of investing in the Fund with the costs of investing in other mutual funds. The example assumes a $10,000 initial investment, 5% annual total return, and that fees and expenses remain the same as in the tables above. To the extent that the Manager is waiving fees or reimbursing expenses, the example assumes that such waiver or reimbursement will only be in place through the date noted above. Although your actual costs may be higher or lower, based on these assumptions your costs would be:
|
|
| Portfolio Turnover [Heading] |
rr_PortfolioTurnoverHeading |
Portfolio Turnover
|
|
| Portfolio Turnover [Text Block] |
rr_PortfolioTurnoverTextBlock |
The Fund pays transaction costs, such as commissions, when it buys and sells securities (or "turns over" its portfolio). A higher portfolio turnover rate may indicate higher transaction costs and may result in higher taxes when Fund shares are held in a taxable account. These costs, which are not reflected in annual fund operating expenses or in the example, affect the Fund's performance. During the most recent fiscal year, the Fund's portfolio turnover rate was 2% of the average value of its portfolio.
|
|
| Portfolio Turnover, Rate |
rr_PortfolioTurnoverRate |
2.00%
|
|
| Strategy [Heading] |
rr_StrategyHeading |
Principal Investment Strategies
|
|
| Strategy Narrative [Text Block] |
rr_StrategyNarrativeTextBlock |
Under normal circumstances, we invest:
-
at least 80% of the Fund's net assets in mortgage-backed and asset-backed securities issued or guaranteed by U.S. Government agencies or government-sponsored entities, that have interest rates that reset at periodic intervals; and
-
up to 20% of the Fund's total assets in obligations that pay fixed interest rates.
We invest principally in mortgage-backed securities (including collateralized mortgage obligations (CMOs)) and asset-backed securities issued or guaranteed by U.S. Government agencies or government-sponsored entities. Under normal circumstances, we expect to maintain an average credit quality rating for the portfolio equivalent to the highest rating available from a Nationally Recognized Statistical Ratings Organization (NRSRO). In the event that a NRSRO assigns U.S. sovereign debt a rating below its highest rating, we expect to maintain an average credit quality rating that is equivalent to the average rating assigned to U.S. sovereign debt. As part of our mortgage-backed securities investment strategy, we may enter into dollar roll transactions. Under normal circumstances, the dollar-weighted average reset period of the adjustable rate securities held by the Fund will not exceed one year.
We employ a top-down, macroeconomic outlook to determine the portfolio's duration, yield curve positioning, issuer selection and sector allocation. Macroeconomic factors considered may include, among others, the pace of economic growth, employment conditions, corporate profits, inflation, monetary and fiscal policy, as well as the influence of international economic and financial conditions. In combination with our top-down macroeconomic approach, we employ a bottom-up process of fundamental securities analysis to select the specific securities for investment. Elements of this evaluation may include the effect of changing principal prepayments, interest rate and yield spread volatility, and the impact of changes in the level and shape of the yield curve on a security's value. We may sell a security based on how we expect these factors to affect a security's value relative to its indicated sales price as well as changes in portfolio strategy or cash flow needs. A security may also be sold and replaced with one that presents a better value or risk/reward profile.
|
|
| Risk [Heading] |
rr_RiskHeading |
Principal Investment Risks
|
|
| Risk Narrative [Text Block] |
rr_RiskNarrativeTextBlock |
An investment in the Fund may lose money, is not a deposit of Wells Fargo Bank, N.A. or its affiliates, is not insured or guaranteed by the Federal Deposit Insurance Corporation or any other governmental agency, and is primarily subject to the risks briefly summarized below.
Credit Risk. The issuer or guarantor of a debt security may be unable or perceived to be unable to pay interest or repay principal when they become due, which could cause the value of an investment to decline and a Fund to lose money.
Interest Rate Risk. When interest rates (which are currently near historic lows) rise, the value of debt securities tends to fall. When interest rates decline, interest that a Fund is able to earn on its investments in debt securities may also decline, but the value of those securities may increase.
Management Risk. Investment decisions, techniques, analyses or models implemented by a Fund's manager or sub-adviser in seeking to achieve the Fund's investment objective may not produce the returns expected, may cause the Fund's shares to lose value or may cause the Fund to underperform other funds with similar investment objectives.
Market Risk. The values of, and/or the income generated by, securities held by a Fund may decline due to general market conditions or other factors, including those directly involving the issuers of such securities. Security markets are volatile and may decline significantly in response to adverse issuer, regulatory, political, or economic developments. Different sectors of the market and different security types may react differently to such developments.
Mortgage- and Asset-Backed Securities Risk. Mortgage- and asset-backed securities may decline in value and become less liquid when defaults on the underlying mortgages or assets occur and may exhibit additional volatility in periods of rising interest rates. Rising interest rates tend to extend the duration of these securities, making them more sensitive to changes in interest rates than instruments with fixed payment schedules. When interest rates decline or are low, the prepayment of mortgages or assets underlying such securities can reduce a Fund's returns.
U.S. Government Obligations Risk. U.S. Government obligations may be adversely impacted by changes in interest rates, and securities issued or guaranteed by U.S. Government agencies or government-sponsored entities may not be backed by the full faith and credit of the U.S. Government.
|
|
| Risk Lose Money [Text] |
rr_RiskLoseMoney |
An investment in the Fund may lose money
|
|
| Risk Not Insured Depository Institution [Text] |
rr_RiskNotInsuredDepositoryInstitution |
An investment in the Fund may lose money, is not a deposit of Wells Fargo Bank, N.A. or its affiliates, is not insured or guaranteed by the Federal Deposit Insurance Corporation or any other governmental agency
|
|
| Bar Chart and Performance Table [Heading] |
rr_BarChartAndPerformanceTableHeading |
Performance
|
|
| Performance Narrative [Text Block] |
rr_PerformanceNarrativeTextBlock |
The following information provides some indication of the risks of investing in the Fund by showing changes in the Fund's performance from year to year. The Fund's average annual total returns are compared to the performance of one or more indices. Past performance before and after taxes is no guarantee of future results. Current month-end performance is available on the Fund's website at wellsfargofunds.com.
|
|
| Bar Chart Closing [Text Block] |
rr_BarChartClosingTextBlock |
Highest Quarter: 1st Quarter 2009 | +3.08% | | Lowest Quarter: 4th Quarter 2008 | -2.74% | Year-to-date total return as of 9/30/2017 is +0.35% |
|
|
| Performance Table Heading |
rr_PerformanceTableHeading |
Average Annual Total Returns for the periods ended 12/31/2016
|
[30] |
| Performance Table Closing [Text Block] |
rr_PerformanceTableClosingTextBlock |
After-tax returns are calculated using the historical highest individual federal marginal income tax rates and do not reflect the impact of state, local or foreign taxes. Actual after-tax returns depend on an investor's tax situation and may differ from those shown, and after-tax returns shown are not relevant to tax-exempt investors or investors who hold their Fund shares through tax-deferred arrangements, such as 401(k) Plans or Individual Retirement Accounts.
|
|
| Performance Table Uses Highest Federal Rate |
rr_PerformanceTableUsesHighestFederalRate |
After-tax returns are calculated using the historical highest individual federal marginal income tax rates and do not reflect the impact of state, local or foreign taxes.
|
|
| Performance Table Not Relevant to Tax Deferred |
rr_PerformanceTableNotRelevantToTaxDeferred |
Actual after-tax returns depend on an investor's tax situation and may differ from those shown, and after-tax returns shown are not relevant to tax-exempt investors or investors who hold their Fund shares through tax-deferred arrangements, such as 401(k) Plans or Individual Retirement Accounts.
|
|
| Performance Past Does Not Indicate Future [Text] |
rr_PerformancePastDoesNotIndicateFuture |
Past performance before and after taxes is no guarantee of future results.
|
|
| Performance Information Illustrates Variability of Returns [Text] |
rr_PerformanceInformationIllustratesVariabilityOfReturns |
The following information provides some indication of the risks of investing in the Fund by showing changes in the Fund's performance from year to year. The Fund's average annual total returns are compared to the performance of one or more indices. Past performance before and after taxes is no guarantee of future results.
|
|
| Performance Availability Website Address [Text] |
rr_PerformanceAvailabilityWebSiteAddress |
wellsfargofunds.com
|
|
| (WFA Income Funds - Institutional Class) | (Wells Fargo Adjustable Rate Government Fund) | Bloomberg Barclays 6-Month Treasury Bill Index (reflects no deduction for fees, expenses, or taxes) |
|
|
|
| Prospectus: |
rr_ProspectusTable |
|
|
| 1 Year |
rr_AverageAnnualReturnYear01 |
0.67%
|
|
| 5 Years |
rr_AverageAnnualReturnYear05 |
0.28%
|
|
| 10 Years |
rr_AverageAnnualReturnYear10 |
1.18%
|
|
| (WFA Income Funds - Institutional Class) | (Wells Fargo Adjustable Rate Government Fund) | Institutional Class |
|
|
|
| Prospectus: |
rr_ProspectusTable |
|
|
| Maximum sales charge (load) imposed on purchases (as a percentage of offering price) |
rr_MaximumSalesChargeImposedOnPurchasesOverOfferingPrice |
none
|
|
| Maximum deferred sales charge (load) (as a percentage of offering price) |
rr_MaximumDeferredSalesChargeOverOfferingPrice |
none
|
|
| Management Fees |
rr_ManagementFeesOverAssets |
0.35%
|
|
| Distribution (12b-1) Fees |
rr_DistributionAndService12b1FeesOverAssets |
none
|
|
| Other Expenses |
rr_OtherExpensesOverAssets |
0.12%
|
|
| Total Annual Fund Operating Expenses |
rr_ExpensesOverAssets |
0.47%
|
|
| Fee Waivers |
rr_FeeWaiverOrReimbursementOverAssets |
(0.01%)
|
|
| Total Annual Fund Operating Expenses After Fee Waivers |
rr_NetExpensesOverAssets |
0.46%
|
[31] |
| Expense Example, with Redemption, 1 Year |
rr_ExpenseExampleYear01 |
$ 47
|
|
| Expense Example, with Redemption, 3 Years |
rr_ExpenseExampleYear03 |
150
|
|
| Expense Example, with Redemption, 5 Years |
rr_ExpenseExampleYear05 |
262
|
|
| Expense Example, with Redemption, 10 Years |
rr_ExpenseExampleYear10 |
$ 590
|
|
| Bar Chart [Heading] |
rr_BarChartHeading |
Calendar Year Total Returns for Institutional Class as of 12/31 each year
|
[30] |
| Annual Return 2007 |
rr_AnnualReturn2007 |
4.75%
|
|
| Annual Return 2008 |
rr_AnnualReturn2008 |
(0.95%)
|
|
| Annual Return 2009 |
rr_AnnualReturn2009 |
6.87%
|
|
| Annual Return 2010 |
rr_AnnualReturn2010 |
3.01%
|
|
| Annual Return 2011 |
rr_AnnualReturn2011 |
2.05%
|
|
| Annual Return 2012 |
rr_AnnualReturn2012 |
2.06%
|
|
| Annual Return 2013 |
rr_AnnualReturn2013 |
0.61%
|
|
| Annual Return 2014 |
rr_AnnualReturn2014 |
0.98%
|
|
| Annual Return 2015 |
rr_AnnualReturn2015 |
(0.02%)
|
|
| Annual Return 2016 |
rr_AnnualReturn2016 |
0.74%
|
|
| Year to Date Return, Label |
rr_YearToDateReturnLabel |
Year-to-date total return as of 9/30/2017 is +0.35%
|
|
| Bar Chart, Year to Date Return |
rr_BarChartYearToDateReturn |
0.35%
|
|
| Bar Chart, Year to Date Return, Date |
rr_BarChartYearToDateReturnDate |
Sep. 30, 2017
|
|
| Highest Quarterly Return, Label |
rr_HighestQuarterlyReturnLabel |
Highest Quarter: 1st Quarter 2009
|
|
| Highest Quarterly Return |
rr_BarChartHighestQuarterlyReturn |
3.08%
|
|
| Highest Quarterly Return, Date |
rr_BarChartHighestQuarterlyReturnDate |
Mar. 31, 2009
|
|
| Lowest Quarterly Return, Label |
rr_LowestQuarterlyReturnLabel |
Lowest Quarter: 4th Quarter 2008
|
|
| Lowest Quarterly Return |
rr_BarChartLowestQuarterlyReturn |
(2.74%)
|
|
| Lowest Quarterly Return, Date |
rr_BarChartLowestQuarterlyReturnDate |
Dec. 31, 2008
|
|
| 1 Year |
rr_AverageAnnualReturnYear01 |
0.74%
|
|
| 5 Years |
rr_AverageAnnualReturnYear05 |
0.87%
|
|
| 10 Years |
rr_AverageAnnualReturnYear10 |
1.99%
|
|
| Inception Date of Share Class |
rr_AverageAnnualReturnInceptionDate |
Oct. 01, 1991
|
|
| (WFA Income Funds - Institutional Class) | (Wells Fargo Adjustable Rate Government Fund) | Institutional Class | (after taxes on distributions) |
|
|
|
| Prospectus: |
rr_ProspectusTable |
|
|
| 1 Year |
rr_AverageAnnualReturnYear01 |
0.40%
|
|
| 5 Years |
rr_AverageAnnualReturnYear05 |
0.49%
|
|
| 10 Years |
rr_AverageAnnualReturnYear10 |
1.18%
|
|
| Inception Date of Share Class |
rr_AverageAnnualReturnInceptionDate |
Oct. 01, 1991
|
|
| (WFA Income Funds - Institutional Class) | (Wells Fargo Adjustable Rate Government Fund) | Institutional Class | (after taxes on distributions and the sale of Fund Shares) |
|
|
|
| Prospectus: |
rr_ProspectusTable |
|
|
| 1 Year |
rr_AverageAnnualReturnYear01 |
0.42%
|
|
| 5 Years |
rr_AverageAnnualReturnYear05 |
0.50%
|
|
| 10 Years |
rr_AverageAnnualReturnYear10 |
1.23%
|
|
| Inception Date of Share Class |
rr_AverageAnnualReturnInceptionDate |
Oct. 01, 1991
|
|
| (WFA Income Funds - Institutional Class) | (Wells Fargo Conservative Income Fund) |
|
|
|
| Prospectus: |
rr_ProspectusTable |
|
|
| Objective [Heading] |
rr_ObjectiveHeading |
Investment Objective
|
|
| Objective, Primary [Text Block] |
rr_ObjectivePrimaryTextBlock |
The Fund seeks current income consistent with capital preservation.
|
|
| Expense [Heading] |
rr_ExpenseHeading |
Fees and Expenses
|
|
| Expense Narrative [Text Block] |
rr_ExpenseNarrativeTextBlock |
These tables are intended to help you understand the various costs and expenses you will pay if you buy and hold shares of the Fund.
|
|
| Shareholder Fees Caption [Text] |
rr_ShareholderFeesCaption |
Shareholder Fees (fees paid directly from your investment)
|
|
| Operating Expenses Caption [Text] |
rr_OperatingExpensesCaption |
Annual Fund Operating Expenses (expenses that you pay each year as a percentage of the value of your investment)
|
|
| Fee Waiver or Reimbursement over Assets, Date of Termination |
rr_FeeWaiverOrReimbursementOverAssetsDateOfTermination |
December 31, 2018
|
|
| Expense Example [Heading] |
rr_ExpenseExampleHeading |
Example of Expenses
|
|
| Expense Example Narrative [Text Block] |
rr_ExpenseExampleNarrativeTextBlock |
The example below is intended to help you compare the costs of investing in the Fund with the costs of investing in other mutual funds. The example assumes a $10,000 initial investment, 5% annual total return, and that fees and expenses remain the same as in the tables above. To the extent that the Manager is waiving fees or reimbursing expenses, the example assumes that such waiver or reimbursement will only be in place through the date noted above. Although your actual costs may be higher or lower, based on these assumptions your costs would be:
|
|
| Portfolio Turnover [Heading] |
rr_PortfolioTurnoverHeading |
Portfolio Turnover
|
|
| Portfolio Turnover [Text Block] |
rr_PortfolioTurnoverTextBlock |
The Fund pays transaction costs, such as commissions, when it buys and sells securities (or "turns over" its portfolio). A higher portfolio turnover rate may indicate higher transaction costs and may result in higher taxes when Fund shares are held in a taxable account. These costs, which are not reflected in annual fund operating expenses or in the example, affect the Fund's performance. During the most recent fiscal year, the Fund's portfolio turnover rate was 197% of the average value of its portfolio.
|
|
| Portfolio Turnover, Rate |
rr_PortfolioTurnoverRate |
197.00%
|
|
| Strategy [Heading] |
rr_StrategyHeading |
Principal Investment Strategies
|
|
| Strategy Narrative [Text Block] |
rr_StrategyNarrativeTextBlock |
Under normal circumstances, we invest:
Under normal circumstances, we invest substantially all of the Fund's net assets in high-quality, U.S. dollar-denominated short-term fixed-, floating- and variable-rate debt securities that have received either a minimum short-term rating of at least A-1 (or its equivalent) or a minimum long-term rating of A minus (or its equivalent), by one or more Nationally Recognized Statistical Ratings Organizations, or, if unrated, that are deemed by us to be of comparable quality at the time of purchase.
Our portfolio holdings may include commercial paper, repurchase agreements, certificates of deposit, time deposits, bankers' acceptances, U.S. Government obligations, municipal securities, corporate debt securities and mortgage- and asset-backed securities. We may invest in the U.S. dollar-denominated debt securities of both domestic and foreign issuers. We may also use Treasury futures for duration and yield curve management. The Fund will not invest in auction rate securities, structured investment vehicle (SIV) structures or mortgage- or asset-backed securities primarily backed by sub-prime or Alt-A residential collateral.
While we may invest in securities with a maximum maturity, average life or demand feature of three and one quarter years, under normal circumstances, we expect the Fund's dollar-weighted average effective maturity to be one year or less. "Dollar-Weighted Average Effective Maturity" is a measure of the average time until the final payment of principal and interest is due on fixed income securities in the Fund's portfolio.
We employ a combination of bottom-up, security-level analysis with a top down macroeconomic view to formulate security selection, sector and credit quality positioning, and duration decisions. Macroeconomic factors considered may include, among others, the pace of economic growth, employment conditions, corporate profits, inflation, monetary and fiscal policy, as well as the influence of international economic and financial conditions.
Our security selection process employs fundamental and quantitative techniques to identify attractive, risk-adjusted return opportunities among high-quality debt securities. Elements of this evaluation may include, among others, credit research, the measurement of volatility trends and historical yield spread relationships, and estimates of liquidity and investor demand. Our fundamental credit analysis may consider an issuer's general financial condition, its competitive position and its management strategies, as well as industry characteristics and other factors.
Though the Fund's net asset value will fluctuate, the Fund's principal investment strategies are intended to manage volatility.
The Fund is not a money market fund.
|
|
| Risk [Heading] |
rr_RiskHeading |
Principal Investment Risks
|
|
| Risk Narrative [Text Block] |
rr_RiskNarrativeTextBlock |
An investment in the Fund may lose money, is not a deposit of Wells Fargo Bank, N.A. or its affiliates, is not insured or guaranteed by the Federal Deposit Insurance Corporation or any other governmental agency, and is primarily subject to the risks briefly summarized below.
Credit Risk. The issuer or guarantor of a debt security may be unable or perceived to be unable to pay interest or repay principal when they become due, which could cause the value of an investment to decline and a Fund to lose money.
Derivatives Risk. The use of derivatives, such as futures, options and swap agreements, can lead to losses, including those magnified by leverage, particularly when derivatives are used to enhance return rather than mitigate risk. Certain derivative instruments may be difficult to sell when the portfolio manager believes it would be appropriate to do so, or the other party to a derivative contract may be unwilling or unable to fulfill its contractual obligations.
Foreign Investment Risk. Foreign investments may be subject to lower liquidity, greater price volatility and risks related to adverse political, regulatory, market or economic developments. Foreign investments may involve exposure to changes in foreign currency exchange rates and may be subject to higher withholding and other taxes.
Futures Contracts Risk. A Fund that uses futures contracts, which are a type of derivative, is subject to the risk of loss caused by unanticipated market movements. In addition, there may at times be an imperfect correlation between the movement in the prices of futures contracts and the value of their underlying instruments or indexes and there may at times not be a liquid secondary market for certain futures contracts.
Interest Rate Risk. When interest rates (which are currently near historic lows) rise, the value of debt securities tends to fall. When interest rates decline, interest that a Fund is able to earn on its investments in debt securities may also decline, but the value of those securities may increase.
Management Risk. Investment decisions, techniques, analyses or models implemented by a Fund's manager or sub-adviser in seeking to achieve the Fund's investment objective may not produce the returns expected, may cause the Fund's shares to lose value or may cause the Fund to underperform other funds with similar investment objectives.
Market Risk. The values of, and/or the income generated by, securities held by a Fund may decline due to general market conditions or other factors, including those directly involving the issuers of such securities. Security markets are volatile and may decline significantly in response to adverse issuer, regulatory, political, or economic developments. Different sectors of the market and different security types may react differently to such developments.
Mortgage- and Asset-Backed Securities Risk. Mortgage- and asset-backed securities may decline in value and become less liquid when defaults on the underlying mortgages or assets occur and may exhibit additional volatility in periods of rising interest rates. Rising interest rates tend to extend the duration of these securities, making them more sensitive to changes in interest rates than instruments with fixed payment schedules. When interest rates decline or are low, the prepayment of mortgages or assets underlying such securities can reduce a Fund's returns.
Municipal Securities Risk. Municipal securities may be fully or partially backed or enhanced by the taxing authority of a local government, by the current or anticipated revenues from a specific project or specific assets, or by the credit of, or liquidity enhancement provided by, a private issuer. Various types of municipal securities are often related in such a way that political, economic or business developments affecting one obligation could affect other municipal securities held by a Fund.
U.S. Government Obligations Risk. U.S. Government obligations may be adversely impacted by changes in interest rates, and securities issued or guaranteed by U.S. Government agencies or government-sponsored entities may not be backed by the full faith and credit of the U.S. Government.
|
|
| Risk Lose Money [Text] |
rr_RiskLoseMoney |
An investment in the Fund may lose money
|
|
| Risk Not Insured Depository Institution [Text] |
rr_RiskNotInsuredDepositoryInstitution |
An investment in the Fund may lose money, is not a deposit of Wells Fargo Bank, N.A. or its affiliates, is not insured or guaranteed by the Federal Deposit Insurance Corporation or any other governmental agency
|
|
| Bar Chart and Performance Table [Heading] |
rr_BarChartAndPerformanceTableHeading |
Performance
|
|
| Performance Narrative [Text Block] |
rr_PerformanceNarrativeTextBlock |
The following information provides some indication of the risks of investing in the Fund by showing changes in the Fund's performance from year to year. The Fund's average annual total returns are compared to the performance of one or more indices. Past performance before and after taxes is no guarantee of future results. Current month-end performance is available on the Fund's website at wellsfargofunds.com.
|
|
| Bar Chart Closing [Text Block] |
rr_BarChartClosingTextBlock |
Highest Quarter: 3rd Quarter 2016 | +0.33% | | Lowest Quarter: 3rd Quarter 2015 | +0.02% | Year-to-date total return as of 9/30/2017 is +1.07% |
|
|
| Performance Table Heading |
rr_PerformanceTableHeading |
Average Annual Total Returns for the periods ended 12/31/2016
|
|
| Performance Table Closing [Text Block] |
rr_PerformanceTableClosingTextBlock |
After-tax returns are calculated using the historical highest individual federal marginal income tax rates and do not reflect the impact of state, local or foreign taxes. Actual after-tax returns depend on an investor's tax situation and may differ from those shown, and after-tax returns shown are not relevant to tax-exempt investors or investors who hold their Fund shares through tax-deferred arrangements, such as 401(k) Plans or Individual Retirement Accounts.
|
|
| Performance Table Uses Highest Federal Rate |
rr_PerformanceTableUsesHighestFederalRate |
After-tax returns are calculated using the historical highest individual federal marginal income tax rates and do not reflect the impact of state, local or foreign taxes.
|
|
| Performance Table Not Relevant to Tax Deferred |
rr_PerformanceTableNotRelevantToTaxDeferred |
Actual after-tax returns depend on an investor's tax situation and may differ from those shown, and after-tax returns shown are not relevant to tax-exempt investors or investors who hold their Fund shares through tax-deferred arrangements, such as 401(k) Plans or Individual Retirement Accounts.
|
|
| Performance Past Does Not Indicate Future [Text] |
rr_PerformancePastDoesNotIndicateFuture |
Past performance before and after taxes is no guarantee of future results.
|
|
| Performance Information Illustrates Variability of Returns [Text] |
rr_PerformanceInformationIllustratesVariabilityOfReturns |
The following information provides some indication of the risks of investing in the Fund by showing changes in the Fund's performance from year to year. The Fund's average annual total returns are compared to the performance of one or more indices. Past performance before and after taxes is no guarantee of future results.
|
|
| Performance Availability Website Address [Text] |
rr_PerformanceAvailabilityWebSiteAddress |
wellsfargofunds.com
|
|
| (WFA Income Funds - Institutional Class) | (Wells Fargo Conservative Income Fund) | Bloomberg Barclays 6-9 Month Treasury Bills Index (reflects no deduction for fees, expenses, or taxes) |
|
|
|
| Prospectus: |
rr_ProspectusTable |
|
|
| 1 Year |
rr_AverageAnnualReturnYear01 |
0.49%
|
|
| 5 Years |
rr_AverageAnnualReturnYear05 |
|
|
| Since Inception |
rr_AverageAnnualReturnSinceInception |
0.22%
|
[32] |
| (WFA Income Funds - Institutional Class) | (Wells Fargo Conservative Income Fund) | Institutional Class |
|
|
|
| Prospectus: |
rr_ProspectusTable |
|
|
| Maximum sales charge (load) imposed on purchases (as a percentage of offering price) |
rr_MaximumSalesChargeImposedOnPurchasesOverOfferingPrice |
none
|
|
| Maximum deferred sales charge (load) (as a percentage of offering price) |
rr_MaximumDeferredSalesChargeOverOfferingPrice |
none
|
|
| Management Fees |
rr_ManagementFeesOverAssets |
0.25%
|
|
| Distribution (12b-1) Fees |
rr_DistributionAndService12b1FeesOverAssets |
none
|
|
| Other Expenses |
rr_OtherExpensesOverAssets |
0.11%
|
|
| Total Annual Fund Operating Expenses |
rr_ExpensesOverAssets |
0.36%
|
|
| Fee Waivers |
rr_FeeWaiverOrReimbursementOverAssets |
(0.09%)
|
|
| Total Annual Fund Operating Expenses After Fee Waivers |
rr_NetExpensesOverAssets |
0.27%
|
[31] |
| Expense Example, with Redemption, 1 Year |
rr_ExpenseExampleYear01 |
$ 28
|
|
| Expense Example, with Redemption, 3 Years |
rr_ExpenseExampleYear03 |
107
|
|
| Expense Example, with Redemption, 5 Years |
rr_ExpenseExampleYear05 |
193
|
|
| Expense Example, with Redemption, 10 Years |
rr_ExpenseExampleYear10 |
$ 447
|
|
| Bar Chart [Heading] |
rr_BarChartHeading |
Calendar Year Total Returns for the Institutional Class as of 12/31 each year
|
|
| Annual Return 2014 |
rr_AnnualReturn2014 |
0.38%
|
|
| Annual Return 2015 |
rr_AnnualReturn2015 |
0.28%
|
|
| Annual Return 2016 |
rr_AnnualReturn2016 |
1.06%
|
|
| Year to Date Return, Label |
rr_YearToDateReturnLabel |
Year-to-date total return as of 9/30/2017 is +1.07%
|
|
| Bar Chart, Year to Date Return |
rr_BarChartYearToDateReturn |
1.07%
|
|
| Bar Chart, Year to Date Return, Date |
rr_BarChartYearToDateReturnDate |
Sep. 30, 2017
|
|
| Highest Quarterly Return, Label |
rr_HighestQuarterlyReturnLabel |
Highest Quarter: 3rd Quarter 2016
|
|
| Highest Quarterly Return |
rr_BarChartHighestQuarterlyReturn |
0.33%
|
|
| Highest Quarterly Return, Date |
rr_BarChartHighestQuarterlyReturnDate |
Sep. 30, 2016
|
|
| Lowest Quarterly Return, Label |
rr_LowestQuarterlyReturnLabel |
Lowest Quarter: 3rd Quarter 2015
|
|
| Lowest Quarterly Return |
rr_BarChartLowestQuarterlyReturn |
0.02%
|
|
| Lowest Quarterly Return, Date |
rr_BarChartLowestQuarterlyReturnDate |
Sep. 30, 2015
|
|
| 1 Year |
rr_AverageAnnualReturnYear01 |
1.06%
|
|
| 5 Years |
rr_AverageAnnualReturnYear05 |
|
|
| Since Inception |
rr_AverageAnnualReturnSinceInception |
0.58%
|
[32] |
| Inception Date of Share Class |
rr_AverageAnnualReturnInceptionDate |
May 31, 2013
|
|
| (WFA Income Funds - Institutional Class) | (Wells Fargo Conservative Income Fund) | Institutional Class | (after taxes on distributions) |
|
|
|
| Prospectus: |
rr_ProspectusTable |
|
|
| 1 Year |
rr_AverageAnnualReturnYear01 |
0.69%
|
|
| 5 Years |
rr_AverageAnnualReturnYear05 |
|
|
| Since Inception |
rr_AverageAnnualReturnSinceInception |
0.33%
|
[32] |
| Inception Date of Share Class |
rr_AverageAnnualReturnInceptionDate |
May 31, 2013
|
|
| (WFA Income Funds - Institutional Class) | (Wells Fargo Conservative Income Fund) | Institutional Class | (after taxes on distributions and the sale of Fund Shares) |
|
|
|
| Prospectus: |
rr_ProspectusTable |
|
|
| 1 Year |
rr_AverageAnnualReturnYear01 |
0.60%
|
|
| 5 Years |
rr_AverageAnnualReturnYear05 |
|
|
| Since Inception |
rr_AverageAnnualReturnSinceInception |
0.33%
|
[32] |
| Inception Date of Share Class |
rr_AverageAnnualReturnInceptionDate |
May 31, 2013
|
|
| (WFA Income Funds - Institutional Class) | (Wells Fargo Core Plus Bond Fund) |
|
|
|
| Prospectus: |
rr_ProspectusTable |
|
|
| Objective [Heading] |
rr_ObjectiveHeading |
Investment Objective
|
|
| Objective, Primary [Text Block] |
rr_ObjectivePrimaryTextBlock |
The Fund seeks total return, consisting of current income and capital appreciation.
|
|
| Expense [Heading] |
rr_ExpenseHeading |
Fees and Expenses
|
|
| Expense Narrative [Text Block] |
rr_ExpenseNarrativeTextBlock |
These tables are intended to help you understand the various costs and expenses you will pay if you buy and hold shares of the Fund.
|
|
| Shareholder Fees Caption [Text] |
rr_ShareholderFeesCaption |
Shareholder Fees (fees paid directly from your investment)
|
|
| Operating Expenses Caption [Text] |
rr_OperatingExpensesCaption |
Annual Fund Operating Expenses (expenses that you pay each year as a percentage of the value of your investment)
|
[33] |
| Fee Waiver or Reimbursement over Assets, Date of Termination |
rr_FeeWaiverOrReimbursementOverAssetsDateOfTermination |
December 31, 2018
|
|
| Expenses Restated to Reflect Current [Text] |
rr_ExpensesRestatedToReflectCurrent |
Expenses have been adjusted as necessary from amounts incurred during the Fund's most recent fiscal year to reflect current fees and expenses.
|
|
| Expense Example [Heading] |
rr_ExpenseExampleHeading |
Example of Expenses
|
|
| Expense Example Narrative [Text Block] |
rr_ExpenseExampleNarrativeTextBlock |
The example below is intended to help you compare the costs of investing in the Fund with the costs of investing in other mutual funds. The example assumes a $10,000 initial investment, 5% annual total return, and that fees and expenses remain the same as in the tables above. To the extent that the Manager is waiving fees or reimbursing expenses, the example assumes that such waiver or reimbursement will only be in place through the date noted above. Although your actual costs may be higher or lower, based on these assumptions your costs would be:
|
|
| Portfolio Turnover [Heading] |
rr_PortfolioTurnoverHeading |
Portfolio Turnover
|
|
| Portfolio Turnover [Text Block] |
rr_PortfolioTurnoverTextBlock |
The Fund pays transaction costs, such as commissions, when it buys and sells securities (or "turns over" its portfolio). A higher portfolio turnover rate may indicate higher transaction costs and may result in higher taxes when Fund shares are held in a taxable account. These costs, which are not reflected in annual fund operating expenses or in the example, affect the Fund's performance. During the most recent fiscal year, the Fund's portfolio turnover rate was 199% of the average value of its portfolio.
|
|
| Portfolio Turnover, Rate |
rr_PortfolioTurnoverRate |
199.00%
|
|
| Strategy [Heading] |
rr_StrategyHeading |
Principal Investment Strategies
|
|
| Strategy Narrative [Text Block] |
rr_StrategyNarrativeTextBlock |
Under normal circumstances, we invest:
-
at least 80% of the Fund's net assets in debt securities;
-
up to 35% of the Fund's total assets in debt securities that are below investment-grade; and
-
up to 25% of the Fund's total assets in debt securities of foreign issuers, including emerging markets issuers and debt securities denominated in foreign currencies.
We invest principally in debt securities, including corporate, mortgage- and asset-backed securities, bank loans, foreign sovereign debt, supranational agencies, and U.S. Government obligations. These securities may have fixed, floating or variable rates and may include debt securities of both domestic and foreign issuers. We invest in both investment-grade and below investment-grade debt securities (often called "high yield" securities or "junk bonds"), including unrated securities, as well as securities that are in default at the time of purchase.
We may invest in debt securities of foreign issuers, including emerging markets issuers, denominated in any currency. We may seek to add yield by having exposures to a variety of credits, mortgages, and higher yielding countries and currencies. We may also use futures and swap agreements to manage risk or to enhance return. We may enter into currency-related transactions through derivative instruments, including currency and cross currency forwards. The use of derivative currency transactions is intended to allow the Fund to manage, hedge or reduce a foreign currency-specific risk exposure of a portfolio security or its denominated currency or to obtain net long exposure to selected currencies for the purpose of generating income or additional returns.
While we may purchase securities of any maturity or duration, under normal circumstances, we expect to maintain an overall portfolio dollar-weighted average effective duration that is within 1 year of that of the Fund's benchmark. The Fund's benchmark, the Bloomberg Barclays U.S. Aggregate Bond Index, had a duration of 5.90 years, as of November 30, 2017. "Dollar-Weighted Average Effective Duration" is an aggregate measure of the sensitivity of a fund's fixed income portfolio securities to changes in interest rates. As a general matter, the price of a fixed income security with a longer effective duration will fluctuate more in response to changes in interest rates than the price of a fixed income security with a shorter effective duration.
|
|
| Risk [Heading] |
rr_RiskHeading |
Principal Investment Risks
|
|
| Risk Narrative [Text Block] |
rr_RiskNarrativeTextBlock |
An investment in the Fund may lose money, is not a deposit of Wells Fargo Bank, N.A. or its affiliates, is not insured or guaranteed by the Federal Deposit Insurance Corporation or any other governmental agency, and is primarily subject to the risks briefly summarized below.
Credit Risk. The issuer or guarantor of a debt security may be unable or perceived to be unable to pay interest or repay principal when they become due, which could cause the value of an investment to decline and a Fund to lose money.
Derivatives Risk. The use of derivatives, such as futures, options and swap agreements, can lead to losses, including those magnified by leverage, particularly when derivatives are used to enhance return rather than mitigate risk. Certain derivative instruments may be difficult to sell when the portfolio manager believes it would be appropriate to do so, or the other party to a derivative contract may be unwilling or unable to fulfill its contractual obligations.
Emerging Markets Risk. Emerging market securities typically present even greater exposure to the risks described under "Foreign Investment Risk" and may be particularly sensitive to global economic conditions. Emerging market securities are also typically less liquid than securities of developed countries and could be difficult to sell, particularly during a market downturn.
Foreign Currency Contracts Risk. A Fund that enters into forwards or other foreign currency contracts, which are a type of derivative, is subject to the risk that the portfolio manager may be incorrect in his or her judgment of future exchange rate changes.
Foreign Investment Risk. Foreign investments may be subject to lower liquidity, greater price volatility and risks related to adverse political, regulatory, market or economic developments. Foreign investments may involve exposure to changes in foreign currency exchange rates and may be subject to higher withholding and other taxes.
Futures Contracts Risk. A Fund that uses futures contracts, which are a type of derivative, is subject to the risk of loss caused by unanticipated market movements. In addition, there may at times be an imperfect correlation between the movement in the prices of futures contracts and the value of their underlying instruments or indexes and there may at times not be a liquid secondary market for certain futures contracts.
High Yield Securities Risk. High yield securities and unrated securities of similar credit quality (commonly known as "junk bonds") have a much greater risk of default or of not returning principal and their values tend to be more volatile than higher-rated securities with similar maturities.
Interest Rate Risk. When interest rates (which are currently near historic lows) rise, the value of debt securities tends to fall. When interest rates decline, interest that a Fund is able to earn on its investments in debt securities may also decline, but the value of those securities may increase.
Loan Risk. Loans may be unrated, less liquid and more difficult to value than traditional debt securities. The highly leveraged capital structure of the borrowers in such transactions may make such loans especially vulnerable to adverse changes in financial, economic or market conditions. A Fund may be unable to sell loans at a desired time or price. The Fund may also not be able to control amendments, waivers or the exercise of any remedies that a lender would have under a direct loan and may assume liability as a lender.
Management Risk. Investment decisions, techniques, analyses or models implemented by a Fund's manager or sub-adviser in seeking to achieve the Fund's investment objective may not produce the returns expected, may cause the Fund's shares to lose value or may cause the Fund to underperform other funds with similar investment objectives.
Market Risk. The values of, and/or the income generated by, securities held by a Fund may decline due to general market conditions or other factors, including those directly involving the issuers of such securities. Security markets are volatile and may decline significantly in response to adverse issuer, regulatory, political, or economic developments. Different sectors of the market and different security types may react differently to such developments.
Mortgage- and Asset-Backed Securities Risk. Mortgage- and asset-backed securities may decline in value and become less liquid when defaults on the underlying mortgages or assets occur and may exhibit additional volatility in periods of rising interest rates. Rising interest rates tend to extend the duration of these securities, making them more sensitive to changes in interest rates than instruments with fixed payment schedules. When interest rates decline or are low, the prepayment of mortgages or assets underlying such securities can reduce a Fund's returns.
Swaps Risk. Depending on their structure, swap agreements and options to enter into swap agreements ("swaptions"), both of which are types of derivatives, may increase or decrease a Fund's exposure to long- or short-term interest rates, foreign currency values, mortgage-backed securities, corporate borrowing rates, or credit events or other reference points such as security prices or inflation rates.
U.S. Government Obligations Risk. U.S. Government obligations may be adversely impacted by changes in interest rates, and securities issued or guaranteed by U.S. Government agencies or government-sponsored entities may not be backed by the full faith and credit of the U.S. Government.
|
|
| Risk Lose Money [Text] |
rr_RiskLoseMoney |
An investment in the Fund may lose money
|
|
| Risk Not Insured Depository Institution [Text] |
rr_RiskNotInsuredDepositoryInstitution |
An investment in the Fund may lose money, is not a deposit of Wells Fargo Bank, N.A. or its affiliates, is not insured or guaranteed by the Federal Deposit Insurance Corporation or any other governmental agency
|
|
| Bar Chart and Performance Table [Heading] |
rr_BarChartAndPerformanceTableHeading |
Performance
|
|
| Performance Narrative [Text Block] |
rr_PerformanceNarrativeTextBlock |
The following information provides some indication of the risks of investing in the Fund by showing changes in the Fund's performance from year to year. The Fund's average annual total returns are compared to the performance of one or more indices. Past performance before and after taxes is no guarantee of future results. Current month-end performance is available on the Fund's website at wellsfargofunds.com.
|
|
| Bar Chart Closing [Text Block] |
rr_BarChartClosingTextBlock |
Highest Quarter: 3rd Quarter 2009 | +5.61% | | Lowest Quarter: 2nd Quarter 2013 | -2.66% | Year-to-date total return as of 9/30/2017 is +4.94% |
|
|
| Performance Table Heading |
rr_PerformanceTableHeading |
Average Annual Total Returns for the periods ended 12/31/2016
|
[34] |
| Performance Table Closing [Text Block] |
rr_PerformanceTableClosingTextBlock |
After-tax returns are calculated using the historical highest individual federal marginal income tax rates and do not reflect the impact of state, local or foreign taxes. Actual after-tax returns depend on an investor's tax situation and may differ from those shown, and after-tax returns shown are not relevant to tax-exempt investors or investors who hold their Fund shares through tax-deferred arrangements, such as 401(k) Plans or Individual Retirement Accounts.
|
|
| Performance Table Uses Highest Federal Rate |
rr_PerformanceTableUsesHighestFederalRate |
After-tax returns are calculated using the historical highest individual federal marginal income tax rates and do not reflect the impact of state, local or foreign taxes.
|
|
| Performance Table Not Relevant to Tax Deferred |
rr_PerformanceTableNotRelevantToTaxDeferred |
Actual after-tax returns depend on an investor's tax situation and may differ from those shown, and after-tax returns shown are not relevant to tax-exempt investors or investors who hold their Fund shares through tax-deferred arrangements, such as 401(k) Plans or Individual Retirement Accounts.
|
|
| Performance Past Does Not Indicate Future [Text] |
rr_PerformancePastDoesNotIndicateFuture |
Past performance before and after taxes is no guarantee of future results.
|
|
| Performance Information Illustrates Variability of Returns [Text] |
rr_PerformanceInformationIllustratesVariabilityOfReturns |
The following information provides some indication of the risks of investing in the Fund by showing changes in the Fund's performance from year to year. The Fund's average annual total returns are compared to the performance of one or more indices. Past performance before and after taxes is no guarantee of future results.
|
|
| Performance Availability Website Address [Text] |
rr_PerformanceAvailabilityWebSiteAddress |
wellsfargofunds.com
|
|
| (WFA Income Funds - Institutional Class) | (Wells Fargo Core Plus Bond Fund) | Bloomberg Barclays U.S. Aggregate Bond Index (reflects no deduction for fees, expenses, or taxes) |
|
|
|
| Prospectus: |
rr_ProspectusTable |
|
|
| 1 Year |
rr_AverageAnnualReturnYear01 |
2.65%
|
|
| 5 Years |
rr_AverageAnnualReturnYear05 |
2.23%
|
|
| 10 Years |
rr_AverageAnnualReturnYear10 |
4.34%
|
|
| (WFA Income Funds - Institutional Class) | (Wells Fargo Core Plus Bond Fund) | Institutional Class |
|
|
|
| Prospectus: |
rr_ProspectusTable |
|
|
| Maximum sales charge (load) imposed on purchases (as a percentage of offering price) |
rr_MaximumSalesChargeImposedOnPurchasesOverOfferingPrice |
none
|
|
| Maximum deferred sales charge (load) (as a percentage of offering price) |
rr_MaximumDeferredSalesChargeOverOfferingPrice |
none
|
|
| Management Fees |
rr_ManagementFeesOverAssets |
0.45%
|
|
| Distribution (12b-1) Fees |
rr_DistributionAndService12b1FeesOverAssets |
none
|
|
| Other Expenses |
rr_OtherExpensesOverAssets |
0.15%
|
|
| Acquired Fund Fees and Expenses |
rr_AcquiredFundFeesAndExpensesOverAssets |
0.01%
|
|
| Total Annual Fund Operating Expenses |
rr_ExpensesOverAssets |
0.61%
|
|
| Fee Waivers |
rr_FeeWaiverOrReimbursementOverAssets |
(0.20%)
|
|
| Total Annual Fund Operating Expenses After Fee Waivers |
rr_NetExpensesOverAssets |
0.41%
|
[35] |
| Expense Example, with Redemption, 1 Year |
rr_ExpenseExampleYear01 |
$ 42
|
|
| Expense Example, with Redemption, 3 Years |
rr_ExpenseExampleYear03 |
175
|
|
| Expense Example, with Redemption, 5 Years |
rr_ExpenseExampleYear05 |
320
|
|
| Expense Example, with Redemption, 10 Years |
rr_ExpenseExampleYear10 |
$ 743
|
|
| Bar Chart [Heading] |
rr_BarChartHeading |
Calendar Year Total Returns for Institutional Class as of 12/31 each year
|
[34] |
| Annual Return 2007 |
rr_AnnualReturn2007 |
6.24%
|
|
| Annual Return 2008 |
rr_AnnualReturn2008 |
2.44%
|
|
| Annual Return 2009 |
rr_AnnualReturn2009 |
12.19%
|
|
| Annual Return 2010 |
rr_AnnualReturn2010 |
8.31%
|
|
| Annual Return 2011 |
rr_AnnualReturn2011 |
8.14%
|
|
| Annual Return 2012 |
rr_AnnualReturn2012 |
5.98%
|
|
| Annual Return 2013 |
rr_AnnualReturn2013 |
(1.22%)
|
|
| Annual Return 2014 |
rr_AnnualReturn2014 |
6.73%
|
|
| Annual Return 2015 |
rr_AnnualReturn2015 |
0.29%
|
|
| Annual Return 2016 |
rr_AnnualReturn2016 |
5.96%
|
|
| Year to Date Return, Label |
rr_YearToDateReturnLabel |
Year-to-date total return as of 9/30/2017 is +4.94%
|
|
| Bar Chart, Year to Date Return |
rr_BarChartYearToDateReturn |
4.94%
|
|
| Bar Chart, Year to Date Return, Date |
rr_BarChartYearToDateReturnDate |
Sep. 30, 2017
|
|
| Highest Quarterly Return, Label |
rr_HighestQuarterlyReturnLabel |
Highest Quarter: 3rd Quarter 2009
|
|
| Highest Quarterly Return |
rr_BarChartHighestQuarterlyReturn |
5.61%
|
|
| Highest Quarterly Return, Date |
rr_BarChartHighestQuarterlyReturnDate |
Sep. 30, 2009
|
|
| Lowest Quarterly Return, Label |
rr_LowestQuarterlyReturnLabel |
Lowest Quarter: 2nd Quarter 2013
|
|
| Lowest Quarterly Return |
rr_BarChartLowestQuarterlyReturn |
(2.66%)
|
|
| Lowest Quarterly Return, Date |
rr_BarChartLowestQuarterlyReturnDate |
Jun. 30, 2013
|
|
| 1 Year |
rr_AverageAnnualReturnYear01 |
5.96%
|
|
| 5 Years |
rr_AverageAnnualReturnYear05 |
3.49%
|
|
| 10 Years |
rr_AverageAnnualReturnYear10 |
5.44%
|
|
| Inception Date of Share Class |
rr_AverageAnnualReturnInceptionDate |
Jul. 18, 2008
|
|
| (WFA Income Funds - Institutional Class) | (Wells Fargo Core Plus Bond Fund) | Institutional Class | (after taxes on distributions) |
|
|
|
| Prospectus: |
rr_ProspectusTable |
|
|
| 1 Year |
rr_AverageAnnualReturnYear01 |
4.57%
|
|
| 5 Years |
rr_AverageAnnualReturnYear05 |
2.28%
|
|
| 10 Years |
rr_AverageAnnualReturnYear10 |
3.99%
|
|
| Inception Date of Share Class |
rr_AverageAnnualReturnInceptionDate |
Jul. 18, 2008
|
|
| (WFA Income Funds - Institutional Class) | (Wells Fargo Core Plus Bond Fund) | Institutional Class | (after taxes on distributions and the sale of Fund Shares) |
|
|
|
| Prospectus: |
rr_ProspectusTable |
|
|
| 1 Year |
rr_AverageAnnualReturnYear01 |
3.38%
|
|
| 5 Years |
rr_AverageAnnualReturnYear05 |
2.21%
|
|
| 10 Years |
rr_AverageAnnualReturnYear10 |
3.70%
|
|
| Inception Date of Share Class |
rr_AverageAnnualReturnInceptionDate |
Jul. 18, 2008
|
|
| (WFA Income Funds - Institutional Class) | (Wells Fargo Government Securities Fund) |
|
|
|
| Prospectus: |
rr_ProspectusTable |
|
|
| Objective [Heading] |
rr_ObjectiveHeading |
Investment Objective
|
|
| Objective, Primary [Text Block] |
rr_ObjectivePrimaryTextBlock |
The Fund seeks current income.
|
|
| Expense [Heading] |
rr_ExpenseHeading |
Fees and Expenses
|
|
| Expense Narrative [Text Block] |
rr_ExpenseNarrativeTextBlock |
These tables are intended to help you understand the various costs and expenses you will pay if you buy and hold shares of the Fund.
|
|
| Shareholder Fees Caption [Text] |
rr_ShareholderFeesCaption |
Shareholder Fees (fees paid directly from your investment)
|
|
| Operating Expenses Caption [Text] |
rr_OperatingExpensesCaption |
Annual Fund Operating Expenses (expenses that you pay each year as a percentage of the value of your investment)
|
[33] |
| Fee Waiver or Reimbursement over Assets, Date of Termination |
rr_FeeWaiverOrReimbursementOverAssetsDateOfTermination |
December 31, 2018
|
|
| Expenses Restated to Reflect Current [Text] |
rr_ExpensesRestatedToReflectCurrent |
Expenses have been adjusted as necessary from amounts incurred during the Fund's most recent fiscal year to reflect current fees and expenses.
|
|
| Expense Example [Heading] |
rr_ExpenseExampleHeading |
Example of Expenses
|
|
| Expense Example Narrative [Text Block] |
rr_ExpenseExampleNarrativeTextBlock |
The example below is intended to help you compare the costs of investing in the Fund with the costs of investing in other mutual funds. The example assumes a $10,000 initial investment, 5% annual total return, and that fees and expenses remain the same as in the tables above. To the extent that the Manager is waiving fees or reimbursing expenses, the example assumes that such waiver or reimbursement will only be in place through the date noted above. Although your actual costs may be higher or lower, based on these assumptions your costs would be:
|
|
| Portfolio Turnover [Heading] |
rr_PortfolioTurnoverHeading |
Portfolio Turnover
|
|
| Portfolio Turnover [Text Block] |
rr_PortfolioTurnoverTextBlock |
The Fund pays transaction costs, such as commissions, when it buys and sells securities (or "turns over" its portfolio). A higher portfolio turnover rate may indicate higher transaction costs and may result in higher taxes when Fund shares are held in a taxable account. These costs, which are not reflected in annual fund operating expenses or in the example, affect the Fund's performance. During the most recent fiscal year, the Fund's portfolio turnover rate was 299% of the average value of its portfolio.
|
|
| Portfolio Turnover, Rate |
rr_PortfolioTurnoverRate |
299.00%
|
|
| Strategy [Heading] |
rr_StrategyHeading |
Principal Investment Strategies
|
|
| Strategy Narrative [Text Block] |
rr_StrategyNarrativeTextBlock |
Under normal circumstances, we invest:
-
at least 80% of the Fund's net assets in U.S. Government obligations and repurchase agreements collateralized by U.S. Government obligations; and
-
up to 20% of the Fund's net assets in non-government investment-grade debt securities.
We invest principally in U.S. Government obligations, including debt securities issued or guaranteed by the U.S. Treasury, U.S. Government agencies or government-sponsored entities. These securities may have fixed, floating or variable rates and also include mortgage-backed securities. As part of our mortgage-backed securities investment strategy, we may enter into dollar rolls. We may also use futures for duration and yield curve management.
We employ a top-down, macroeconomic outlook to determine the portfolio's duration, yield curve positioning and sector allocation. Macroeconomic factors considered may include, among others, the pace of economic growth, employment conditions, inflation, monetary and fiscal policy, as well as the influence of international economic and financial conditions. In combination with our top-down, macroeconomic approach, we employ a bottom-up process of fundamental securities analysis to select the specific securities for investment. Elements of this evaluation may include duration measurements, historical yield spread relationships, volatility trends, mortgage refinance rates, as well as other factors. We may sell a security due to changes in our outlook, as well as changes in portfolio strategy or cash flow needs. A security may also be sold and replaced with one that presents a better value or risk/reward profile.
|
|
| Risk [Heading] |
rr_RiskHeading |
Principal Investment Risks
|
|
| Risk Narrative [Text Block] |
rr_RiskNarrativeTextBlock |
An investment in the Fund may lose money, is not a deposit of Wells Fargo Bank, N.A. or its affiliates, is not insured or guaranteed by the Federal Deposit Insurance Corporation or any other governmental agency, and is primarily subject to the risks briefly summarized below.
Credit Risk. The issuer or guarantor of a debt security may be unable or perceived to be unable to pay interest or repay principal when they become due, which could cause the value of an investment to decline and a Fund to lose money.
Derivatives Risk. The use of derivatives, such as futures, options and swap agreements, can lead to losses, including those magnified by leverage, particularly when derivatives are used to enhance return rather than mitigate risk. Certain derivative instruments may be difficult to sell when the portfolio manager believes it would be appropriate to do so, or the other party to a derivative contract may be unwilling or unable to fulfill its contractual obligations.
Futures Contracts Risk. A Fund that uses futures contracts, which are a type of derivative, is subject to the risk of loss caused by unanticipated market movements. In addition, there may at times be an imperfect correlation between the movement in the prices of futures contracts and the value of their underlying instruments or indexes and there may at times not be a liquid secondary market for certain futures contracts.
Interest Rate Risk. When interest rates (which are currently near historic lows) rise, the value of debt securities tends to fall. When interest rates decline, interest that a Fund is able to earn on its investments in debt securities may also decline, but the value of those securities may increase.
Management Risk. Investment decisions, techniques, analyses or models implemented by a Fund's manager or sub-adviser in seeking to achieve the Fund's investment objective may not produce the returns expected, may cause the Fund's shares to lose value or may cause the Fund to underperform other funds with similar investment objectives.
Market Risk. The values of, and/or the income generated by, securities held by a Fund may decline due to general market conditions or other factors, including those directly involving the issuers of such securities. Security markets are volatile and may decline significantly in response to adverse issuer, regulatory, political, or economic developments. Different sectors of the market and different security types may react differently to such developments.
Mortgage- and Asset-Backed Securities Risk. Mortgage- and asset-backed securities may decline in value and become less liquid when defaults on the underlying mortgages or assets occur and may exhibit additional volatility in periods of rising interest rates. Rising interest rates tend to extend the duration of these securities, making them more sensitive to changes in interest rates than instruments with fixed payment schedules. When interest rates decline or are low, the prepayment of mortgages or assets underlying such securities can reduce a Fund's returns.
U.S. Government Obligations Risk. U.S. Government obligations may be adversely impacted by changes in interest rates, and securities issued or guaranteed by U.S. Government agencies or government-sponsored entities may not be backed by the full faith and credit of the U.S. Government.
|
|
| Risk Lose Money [Text] |
rr_RiskLoseMoney |
An investment in the Fund may lose money
|
|
| Risk Not Insured Depository Institution [Text] |
rr_RiskNotInsuredDepositoryInstitution |
An investment in the Fund may lose money, is not a deposit of Wells Fargo Bank, N.A. or its affiliates, is not insured or guaranteed by the Federal Deposit Insurance Corporation or any other governmental agency
|
|
| Bar Chart and Performance Table [Heading] |
rr_BarChartAndPerformanceTableHeading |
Performance
|
|
| Performance Narrative [Text Block] |
rr_PerformanceNarrativeTextBlock |
The following information provides some indication of the risks of investing in the Fund by showing changes in the Fund's performance from year to year. The Fund's average annual total returns are compared to the performance of one or more indices. Past performance before and after taxes is no guarantee of future results. Current month-end performance is available on the Fund's website at wellsfargofunds.com.
|
|
| Bar Chart Closing [Text Block] |
rr_BarChartClosingTextBlock |
Highest Quarter: 4th Quarter 2008 | +4.55% | | Lowest Quarter: 4th Quarter 2016 | -3.04% | Year-to-date total return as of 9/30/2017 is +2.28% |
|
|
| Performance Table Heading |
rr_PerformanceTableHeading |
Average Annual Total Returns for the periods ended 12/31/2016
|
|
| Performance Table Closing [Text Block] |
rr_PerformanceTableClosingTextBlock |
After-tax returns are calculated using the historical highest individual federal marginal income tax rates and do not reflect the impact of state, local or foreign taxes. Actual after-tax returns depend on an investor's tax situation and may differ from those shown, and after-tax returns shown are not relevant to tax-exempt investors or investors who hold their Fund shares through tax-deferred arrangements, such as 401(k) Plans or Individual Retirement Accounts.
|
|
| Performance Table Uses Highest Federal Rate |
rr_PerformanceTableUsesHighestFederalRate |
After-tax returns are calculated using the historical highest individual federal marginal income tax rates and do not reflect the impact of state, local or foreign taxes.
|
|
| Performance Table Not Relevant to Tax Deferred |
rr_PerformanceTableNotRelevantToTaxDeferred |
Actual after-tax returns depend on an investor's tax situation and may differ from those shown, and after-tax returns shown are not relevant to tax-exempt investors or investors who hold their Fund shares through tax-deferred arrangements, such as 401(k) Plans or Individual Retirement Accounts.
|
|
| Performance Past Does Not Indicate Future [Text] |
rr_PerformancePastDoesNotIndicateFuture |
Past performance before and after taxes is no guarantee of future results.
|
|
| Performance Information Illustrates Variability of Returns [Text] |
rr_PerformanceInformationIllustratesVariabilityOfReturns |
The following information provides some indication of the risks of investing in the Fund by showing changes in the Fund's performance from year to year. The Fund's average annual total returns are compared to the performance of one or more indices. Past performance before and after taxes is no guarantee of future results.
|
|
| Performance Availability Website Address [Text] |
rr_PerformanceAvailabilityWebSiteAddress |
wellsfargofunds.com
|
|
| (WFA Income Funds - Institutional Class) | (Wells Fargo Government Securities Fund) | Bloomberg Barclays U.S. Aggregate ex Credit Index (reflects no deduction for fees, expenses, or taxes) |
|
|
|
| Prospectus: |
rr_ProspectusTable |
|
|
| 1 Year |
rr_AverageAnnualReturnYear01 |
1.36%
|
|
| 5 Years |
rr_AverageAnnualReturnYear05 |
1.62%
|
|
| 10 Years |
rr_AverageAnnualReturnYear10 |
3.99%
|
|
| (WFA Income Funds - Institutional Class) | (Wells Fargo Government Securities Fund) | Bloomberg Barclays Intermediate U.S. Government Bond Index (reflects no deduction for fees, expenses, or taxes) |
|
|
|
| Prospectus: |
rr_ProspectusTable |
|
|
| 1 Year |
rr_AverageAnnualReturnYear01 |
1.05%
|
|
| 5 Years |
rr_AverageAnnualReturnYear05 |
1.04%
|
|
| 10 Years |
rr_AverageAnnualReturnYear10 |
3.42%
|
|
| (WFA Income Funds - Institutional Class) | (Wells Fargo Government Securities Fund) | Institutional Class |
|
|
|
| Prospectus: |
rr_ProspectusTable |
|
|
| Maximum sales charge (load) imposed on purchases (as a percentage of offering price) |
rr_MaximumSalesChargeImposedOnPurchasesOverOfferingPrice |
none
|
|
| Maximum deferred sales charge (load) (as a percentage of offering price) |
rr_MaximumDeferredSalesChargeOverOfferingPrice |
none
|
|
| Management Fees |
rr_ManagementFeesOverAssets |
0.43%
|
|
| Distribution (12b-1) Fees |
rr_DistributionAndService12b1FeesOverAssets |
none
|
|
| Other Expenses |
rr_OtherExpensesOverAssets |
0.11%
|
|
| Total Annual Fund Operating Expenses |
rr_ExpensesOverAssets |
0.54%
|
|
| Fee Waivers |
rr_FeeWaiverOrReimbursementOverAssets |
(0.06%)
|
|
| Total Annual Fund Operating Expenses After Fee Waivers |
rr_NetExpensesOverAssets |
0.48%
|
[36] |
| Expense Example, with Redemption, 1 Year |
rr_ExpenseExampleYear01 |
$ 49
|
|
| Expense Example, with Redemption, 3 Years |
rr_ExpenseExampleYear03 |
167
|
|
| Expense Example, with Redemption, 5 Years |
rr_ExpenseExampleYear05 |
296
|
|
| Expense Example, with Redemption, 10 Years |
rr_ExpenseExampleYear10 |
$ 671
|
|
| Bar Chart [Heading] |
rr_BarChartHeading |
Calendar Year Total Returns for Institutional Class as of 12/31 each year
|
|
| Annual Return 2007 |
rr_AnnualReturn2007 |
7.43%
|
|
| Annual Return 2008 |
rr_AnnualReturn2008 |
8.02%
|
|
| Annual Return 2009 |
rr_AnnualReturn2009 |
4.02%
|
|
| Annual Return 2010 |
rr_AnnualReturn2010 |
5.88%
|
|
| Annual Return 2011 |
rr_AnnualReturn2011 |
7.33%
|
|
| Annual Return 2012 |
rr_AnnualReturn2012 |
2.92%
|
|
| Annual Return 2013 |
rr_AnnualReturn2013 |
(2.18%)
|
|
| Annual Return 2014 |
rr_AnnualReturn2014 |
5.54%
|
|
| Annual Return 2015 |
rr_AnnualReturn2015 |
0.67%
|
|
| Annual Return 2016 |
rr_AnnualReturn2016 |
1.39%
|
|
| Year to Date Return, Label |
rr_YearToDateReturnLabel |
Year-to-date total return as of 9/30/2017 is +2.28%
|
|
| Bar Chart, Year to Date Return |
rr_BarChartYearToDateReturn |
2.28%
|
|
| Bar Chart, Year to Date Return, Date |
rr_BarChartYearToDateReturnDate |
Sep. 30, 2017
|
|
| Highest Quarterly Return, Label |
rr_HighestQuarterlyReturnLabel |
Highest Quarter: 4th Quarter 2008
|
|
| Highest Quarterly Return |
rr_BarChartHighestQuarterlyReturn |
4.55%
|
|
| Highest Quarterly Return, Date |
rr_BarChartHighestQuarterlyReturnDate |
Dec. 31, 2008
|
|
| Lowest Quarterly Return, Label |
rr_LowestQuarterlyReturnLabel |
Lowest Quarter: 4th Quarter 2016
|
|
| Lowest Quarterly Return |
rr_BarChartLowestQuarterlyReturn |
(3.04%)
|
|
| Lowest Quarterly Return, Date |
rr_BarChartLowestQuarterlyReturnDate |
Dec. 31, 2016
|
|
| 1 Year |
rr_AverageAnnualReturnYear01 |
1.39%
|
|
| 5 Years |
rr_AverageAnnualReturnYear05 |
1.64%
|
|
| 10 Years |
rr_AverageAnnualReturnYear10 |
4.05%
|
|
| Inception Date of Share Class |
rr_AverageAnnualReturnInceptionDate |
Aug. 31, 1999
|
|
| (WFA Income Funds - Institutional Class) | (Wells Fargo Government Securities Fund) | Institutional Class | (after taxes on distributions) |
|
|
|
| Prospectus: |
rr_ProspectusTable |
|
|
| 1 Year |
rr_AverageAnnualReturnYear01 |
(0.16%)
|
|
| 5 Years |
rr_AverageAnnualReturnYear05 |
0.75%
|
|
| 10 Years |
rr_AverageAnnualReturnYear10 |
2.77%
|
|
| Inception Date of Share Class |
rr_AverageAnnualReturnInceptionDate |
Aug. 31, 1999
|
|
| (WFA Income Funds - Institutional Class) | (Wells Fargo Government Securities Fund) | Institutional Class | (after taxes on distributions and the sale of Fund Shares) |
|
|
|
| Prospectus: |
rr_ProspectusTable |
|
|
| 1 Year |
rr_AverageAnnualReturnYear01 |
0.94%
|
|
| 5 Years |
rr_AverageAnnualReturnYear05 |
0.93%
|
|
| 10 Years |
rr_AverageAnnualReturnYear10 |
2.68%
|
|
| Inception Date of Share Class |
rr_AverageAnnualReturnInceptionDate |
Aug. 31, 1999
|
|
| (WFA Income Funds - Institutional Class) | (Wells Fargo High Yield Bond Fund) |
|
|
|
| Prospectus: |
rr_ProspectusTable |
|
|
| Objective [Heading] |
rr_ObjectiveHeading |
Investment Objective
|
|
| Objective, Primary [Text Block] |
rr_ObjectivePrimaryTextBlock |
The Fund seeks total return, consisting of a high level of current income and capital appreciation.
|
|
| Expense [Heading] |
rr_ExpenseHeading |
Fees and Expenses
|
|
| Expense Narrative [Text Block] |
rr_ExpenseNarrativeTextBlock |
These tables are intended to help you understand the various costs and expenses you will pay if you buy and hold shares of the Fund.
|
|
| Shareholder Fees Caption [Text] |
rr_ShareholderFeesCaption |
Shareholder Fees (fees paid directly from your investment)
|
|
| Operating Expenses Caption [Text] |
rr_OperatingExpensesCaption |
Annual Fund Operating Expenses (expenses that you pay each year as a percentage of the value of your investment)
|
[33] |
| Fee Waiver or Reimbursement over Assets, Date of Termination |
rr_FeeWaiverOrReimbursementOverAssetsDateOfTermination |
December 31, 2018
|
|
| Expenses Restated to Reflect Current [Text] |
rr_ExpensesRestatedToReflectCurrent |
Expenses have been adjusted as necessary from amounts incurred during the Fund's most recent fiscal year to reflect current fees and expenses.
|
|
| Expense Example [Heading] |
rr_ExpenseExampleHeading |
Example of Expenses
|
|
| Expense Example Narrative [Text Block] |
rr_ExpenseExampleNarrativeTextBlock |
The example below is intended to help you compare the costs of investing in the Fund with the costs of investing in other mutual funds. The example assumes a $10,000 initial investment, 5% annual total return, and that fees and expenses remain the same as in the tables above. To the extent that the Manager is waiving fees or reimbursing expenses, the example assumes that such waiver or reimbursement will only be in place through the date noted above. Although your actual costs may be higher or lower, based on these assumptions your costs would be:
|
|
| Portfolio Turnover [Heading] |
rr_PortfolioTurnoverHeading |
Portfolio Turnover
|
|
| Portfolio Turnover [Text Block] |
rr_PortfolioTurnoverTextBlock |
The Fund pays transaction costs, such as commissions, when it buys and sells securities (or "turns over" its portfolio). A higher portfolio turnover rate may indicate higher transaction costs and may result in higher taxes when Fund shares are held in a taxable account. These costs, which are not reflected in annual fund operating expenses or in the example, affect the Fund's performance. During the most recent fiscal year, the Fund's portfolio turnover rate was 20% of the average value of its portfolio.
|
|
| Portfolio Turnover, Rate |
rr_PortfolioTurnoverRate |
20.00%
|
|
| Strategy [Heading] |
rr_StrategyHeading |
Principal Investment Strategies
|
|
| Strategy Narrative [Text Block] |
rr_StrategyNarrativeTextBlock |
Under normal circumstances, we invest:
-
at least 80% of the Fund's net assets in debt securities that are below-investment grade; and
-
up to 10% of the Fund's total assets in equity securities, including common and preferred stocks.
We invest principally in below investment-grade debt securities (often called "high yield" securities or "junk bonds") of corporate issuers. These include traditional corporate bonds as well as convertible bonds. These securities may have fixed, floating or variable rates. We may invest in below investment-grade debt securities of any credit quality. The average credit quality of the Fund's portfolio is expected to be equivalent to B or higher based on the credit ratings assigned to underlying securities by Moody's, Standard & Poor's, from other Nationally Recognized Statistical Ratings Organizations, or our credit quality assessment of the underlying securities. We do not manage the Fund's portfolio to a specific maturity or duration. We may also use futures for duration and yield curve management. We may invest up to 10% of the Fund's total assets in equity securities, including common and preferred stocks. For equity securities, we seek out dividend yielding securities of companies that we believe have strong fundamental attributes. We may invest in equity securities of companies of any size.
Securities in the Fund's portfolio may be issued by domestic or foreign issuers (including foreign governments), and may include securities of emerging markets issuers.
We start our investment process by looking at macroeconomic factors, such as the pace of economic growth, employment conditions, corporate profits, inflation rates, monetary and fiscal policy, within the context of other even broader factors, including the influence of international economic and financial conditions. This top-down, macroeconomic outlook helps us to determine the sectors and industries in which we believe the portfolio should invest, and in what proportions. We then seek those industries within this macroeconomic environment which we find attractive - industries that are either growing at or above the rate of economic growth (growth industries) or out of favor industries with potentially improving outlooks (value industries.) Within those industries, we prefer companies with sustainable competitive advantages and high barriers to entry, and we specifically seek companies with strong management teams and financial flexibility.
We regularly review the investments of the portfolio and may sell a portfolio holding when it has achieved its valuation target, there is deterioration in the underlying fundamentals of the business, or we have identified a more attractive investment opportunity.
|
|
| Risk [Heading] |
rr_RiskHeading |
Principal Investment Risks
|
|
| Risk Narrative [Text Block] |
rr_RiskNarrativeTextBlock |
An investment in the Fund may lose money, is not a deposit of Wells Fargo Bank, N.A. or its affiliates, is not insured or guaranteed by the Federal Deposit Insurance Corporation or any other governmental agency, and is primarily subject to the risks briefly summarized below.
Convertible Securities Risk. A convertible security has characteristics of both equity and debt securities and, as a result, is exposed to risks that are typically associated with both types of securities. The market value of a convertible security tends to decline as interest rates increase but also tends to reflect changes in the market price of the common stock of the issuing company.
Credit Risk. The issuer or guarantor of a debt security may be unable or perceived to be unable to pay interest or repay principal when they become due, which could cause the value of an investment to decline and a Fund to lose money.
Derivatives Risk. The use of derivatives, such as futures, options and swap agreements, can lead to losses, including those magnified by leverage, particularly when derivatives are used to enhance return rather than mitigate risk. Certain derivative instruments may be difficult to sell when the portfolio manager believes it would be appropriate to do so, or the other party to a derivative contract may be unwilling or unable to fulfill its contractual obligations.
Emerging Markets Risk. Emerging market securities typically present even greater exposure to the risks described under "Foreign Investment Risk" and may be particularly sensitive to global economic conditions. Emerging market securities are also typically less liquid than securities of developed countries and could be difficult to sell, particularly during a market downturn.
Foreign Investment Risk. Foreign investments may be subject to lower liquidity, greater price volatility and risks related to adverse political, regulatory, market or economic developments. Foreign investments may involve exposure to changes in foreign currency exchange rates and may be subject to higher withholding and other taxes.
Futures Contracts Risk. A Fund that uses futures contracts, which are a type of derivative, is subject to the risk of loss caused by unanticipated market movements. In addition, there may at times be an imperfect correlation between the movement in the prices of futures contracts and the value of their underlying instruments or indexes and there may at times not be a liquid secondary market for certain futures contracts.
Growth/Value Investing Risk. Securities that exhibit growth or value characteristics tend to perform differently and shift into and out of favor with investors depending on changes in market and economic sentiment and conditions.
High Yield Securities Risk. High yield securities and unrated securities of similar credit quality (commonly known as "junk bonds") have a much greater risk of default or of not returning principal and their values tend to be more volatile than higher-rated securities with similar maturities.
Interest Rate Risk. When interest rates (which are currently near historic lows) rise, the value of debt securities tends to fall. When interest rates decline, interest that a Fund is able to earn on its investments in debt securities may also decline, but the value of those securities may increase.
Management Risk. Investment decisions, techniques, analyses or models implemented by a Fund's manager or sub-adviser in seeking to achieve the Fund's investment objective may not produce the returns expected, may cause the Fund's shares to lose value or may cause the Fund to underperform other funds with similar investment objectives.
Market Risk. The values of, and/or the income generated by, securities held by a Fund may decline due to general market conditions or other factors, including those directly involving the issuers of such securities. Security markets are volatile and may decline significantly in response to adverse issuer, regulatory, political, or economic developments. Different sectors of the market and different security types may react differently to such developments.
|
|
| Risk Lose Money [Text] |
rr_RiskLoseMoney |
An investment in the Fund may lose money
|
|
| Risk Not Insured Depository Institution [Text] |
rr_RiskNotInsuredDepositoryInstitution |
An investment in the Fund may lose money, is not a deposit of Wells Fargo Bank, N.A. or its affiliates, is not insured or guaranteed by the Federal Deposit Insurance Corporation or any other governmental agency
|
|
| Bar Chart and Performance Table [Heading] |
rr_BarChartAndPerformanceTableHeading |
Performance
|
|
| Performance Narrative [Text Block] |
rr_PerformanceNarrativeTextBlock |
The following information provides some indication of the risks of investing in the Fund by showing changes in the Fund's performance from year to year. The Fund's average annual total returns are compared to the performance of one or more indices. Past performance before and after taxes is no guarantee of future results. Current month-end performance is available on the Fund's website at wellsfargofunds.com.
|
|
| Bar Chart Closing [Text Block] |
rr_BarChartClosingTextBlock |
Highest Quarter: 2nd Quarter 2009 | +20.59% | | Lowest Quarter: 4th Quarter 2008 | -16.99% | Year-to-date total return as of 9/30/2017 is +7.03% |
|
|
| Performance Table Heading |
rr_PerformanceTableHeading |
Average Annual Total Returns for the periods ended 12/31/2016
|
[37] |
| Performance Table Closing [Text Block] |
rr_PerformanceTableClosingTextBlock |
After-tax returns are calculated using the historical highest individual federal marginal income tax rates and do not reflect the impact of state, local or foreign taxes. Actual after-tax returns depend on an investor's tax situation and may differ from those shown, and after-tax returns shown are not relevant to tax-exempt investors or investors who hold their Fund shares through tax-deferred arrangements, such as 401(k) Plans or Individual Retirement Accounts.
|
|
| Performance Table Uses Highest Federal Rate |
rr_PerformanceTableUsesHighestFederalRate |
After-tax returns are calculated using the historical highest individual federal marginal income tax rates and do not reflect the impact of state, local or foreign taxes.
|
|
| Performance Table Not Relevant to Tax Deferred |
rr_PerformanceTableNotRelevantToTaxDeferred |
Actual after-tax returns depend on an investor's tax situation and may differ from those shown, and after-tax returns shown are not relevant to tax-exempt investors or investors who hold their Fund shares through tax-deferred arrangements, such as 401(k) Plans or Individual Retirement Accounts.
|
|
| Performance Past Does Not Indicate Future [Text] |
rr_PerformancePastDoesNotIndicateFuture |
Past performance before and after taxes is no guarantee of future results.
|
|
| Performance Information Illustrates Variability of Returns [Text] |
rr_PerformanceInformationIllustratesVariabilityOfReturns |
The following information provides some indication of the risks of investing in the Fund by showing changes in the Fund's performance from year to year. The Fund's average annual total returns are compared to the performance of one or more indices. Past performance before and after taxes is no guarantee of future results.
|
|
| Performance Availability Website Address [Text] |
rr_PerformanceAvailabilityWebSiteAddress |
wellsfargofunds.com
|
|
| (WFA Income Funds - Institutional Class) | (Wells Fargo High Yield Bond Fund) | ICE BofA Merrill Lynch U.S. High Yield Constrained Index (reflects no deduction for fees, expenses, or taxes) |
|
|
|
| Prospectus: |
rr_ProspectusTable |
|
|
| 1 Year |
rr_AverageAnnualReturnYear01 |
17.49%
|
|
| 5 Years |
rr_AverageAnnualReturnYear05 |
7.35%
|
|
| 10 Years |
rr_AverageAnnualReturnYear10 |
7.45%
|
|
| (WFA Income Funds - Institutional Class) | (Wells Fargo High Yield Bond Fund) | Institutional Class |
|
|
|
| Prospectus: |
rr_ProspectusTable |
|
|
| Maximum sales charge (load) imposed on purchases (as a percentage of offering price) |
rr_MaximumSalesChargeImposedOnPurchasesOverOfferingPrice |
none
|
|
| Maximum deferred sales charge (load) (as a percentage of offering price) |
rr_MaximumDeferredSalesChargeOverOfferingPrice |
none
|
|
| Management Fees |
rr_ManagementFeesOverAssets |
0.55%
|
|
| Distribution (12b-1) Fees |
rr_DistributionAndService12b1FeesOverAssets |
none
|
|
| Other Expenses |
rr_OtherExpensesOverAssets |
0.14%
|
|
| Total Annual Fund Operating Expenses |
rr_ExpensesOverAssets |
0.69%
|
|
| Fee Waivers |
rr_FeeWaiverOrReimbursementOverAssets |
(0.16%)
|
|
| Total Annual Fund Operating Expenses After Fee Waivers |
rr_NetExpensesOverAssets |
0.53%
|
[38] |
| Expense Example, with Redemption, 1 Year |
rr_ExpenseExampleYear01 |
$ 54
|
|
| Expense Example, with Redemption, 3 Years |
rr_ExpenseExampleYear03 |
205
|
|
| Expense Example, with Redemption, 5 Years |
rr_ExpenseExampleYear05 |
368
|
|
| Expense Example, with Redemption, 10 Years |
rr_ExpenseExampleYear10 |
$ 843
|
|
| Bar Chart [Heading] |
rr_BarChartHeading |
Calendar Year Total Returns for Institutional Class as of 12/31 each year
|
[37] |
| Annual Return 2007 |
rr_AnnualReturn2007 |
3.12%
|
|
| Annual Return 2008 |
rr_AnnualReturn2008 |
(25.97%)
|
|
| Annual Return 2009 |
rr_AnnualReturn2009 |
52.79%
|
|
| Annual Return 2010 |
rr_AnnualReturn2010 |
13.53%
|
|
| Annual Return 2011 |
rr_AnnualReturn2011 |
4.30%
|
|
| Annual Return 2012 |
rr_AnnualReturn2012 |
14.37%
|
|
| Annual Return 2013 |
rr_AnnualReturn2013 |
3.91%
|
|
| Annual Return 2014 |
rr_AnnualReturn2014 |
5.11%
|
|
| Annual Return 2015 |
rr_AnnualReturn2015 |
(1.90%)
|
|
| Annual Return 2016 |
rr_AnnualReturn2016 |
12.96%
|
|
| Year to Date Return, Label |
rr_YearToDateReturnLabel |
Year-to-date total return as of 9/30/2017 is +7.03%
|
|
| Bar Chart, Year to Date Return |
rr_BarChartYearToDateReturn |
7.03%
|
|
| Bar Chart, Year to Date Return, Date |
rr_BarChartYearToDateReturnDate |
Sep. 30, 2017
|
|
| Highest Quarterly Return, Label |
rr_HighestQuarterlyReturnLabel |
Highest Quarter: 2nd Quarter 2009
|
|
| Highest Quarterly Return |
rr_BarChartHighestQuarterlyReturn |
20.59%
|
|
| Highest Quarterly Return, Date |
rr_BarChartHighestQuarterlyReturnDate |
Jun. 30, 2009
|
|
| Lowest Quarterly Return, Label |
rr_LowestQuarterlyReturnLabel |
Lowest Quarter: 4th Quarter 2008
|
|
| Lowest Quarterly Return |
rr_BarChartLowestQuarterlyReturn |
(16.99%)
|
|
| Lowest Quarterly Return, Date |
rr_BarChartLowestQuarterlyReturnDate |
Dec. 31, 2008
|
|
| 1 Year |
rr_AverageAnnualReturnYear01 |
12.96%
|
|
| 5 Years |
rr_AverageAnnualReturnYear05 |
6.72%
|
|
| 10 Years |
rr_AverageAnnualReturnYear10 |
6.69%
|
|
| Inception Date of Share Class |
rr_AverageAnnualReturnInceptionDate |
Oct. 31, 2014
|
|
| (WFA Income Funds - Institutional Class) | (Wells Fargo High Yield Bond Fund) | Institutional Class | (after taxes on distributions) |
|
|
|
| Prospectus: |
rr_ProspectusTable |
|
|
| 1 Year |
rr_AverageAnnualReturnYear01 |
10.71%
|
|
| 5 Years |
rr_AverageAnnualReturnYear05 |
4.60%
|
|
| 10 Years |
rr_AverageAnnualReturnYear10 |
4.11%
|
|
| Inception Date of Share Class |
rr_AverageAnnualReturnInceptionDate |
Oct. 31, 2014
|
|
| (WFA Income Funds - Institutional Class) | (Wells Fargo High Yield Bond Fund) | Institutional Class | (after taxes on distributions and the sale of Fund Shares) |
|
|
|
| Prospectus: |
rr_ProspectusTable |
|
|
| 1 Year |
rr_AverageAnnualReturnYear01 |
7.27%
|
|
| 5 Years |
rr_AverageAnnualReturnYear05 |
4.24%
|
|
| 10 Years |
rr_AverageAnnualReturnYear10 |
4.06%
|
|
| Inception Date of Share Class |
rr_AverageAnnualReturnInceptionDate |
Oct. 31, 2014
|
|
| (WFA Income Funds - Institutional Class) | (Wells Fargo Short Duration Government Bond Fund) |
|
|
|
| Prospectus: |
rr_ProspectusTable |
|
|
| Objective [Heading] |
rr_ObjectiveHeading |
Investment Objective
|
|
| Objective, Primary [Text Block] |
rr_ObjectivePrimaryTextBlock |
The Fund seeks to provide current income consistent with capital preservation.
|
|
| Expense [Heading] |
rr_ExpenseHeading |
Fees and Expenses
|
|
| Expense Narrative [Text Block] |
rr_ExpenseNarrativeTextBlock |
These tables are intended to help you understand the various costs and expenses you will pay if you buy and hold shares of the Fund.
|
|
| Shareholder Fees Caption [Text] |
rr_ShareholderFeesCaption |
Shareholder Fees (fees paid directly from your investment)
|
|
| Operating Expenses Caption [Text] |
rr_OperatingExpensesCaption |
Annual Fund Operating Expenses (expenses that you pay each year as a percentage of the value of your investment)
|
|
| Fee Waiver or Reimbursement over Assets, Date of Termination |
rr_FeeWaiverOrReimbursementOverAssetsDateOfTermination |
December 31, 2018
|
|
| Expense Example [Heading] |
rr_ExpenseExampleHeading |
Example of Expenses
|
|
| Expense Example Narrative [Text Block] |
rr_ExpenseExampleNarrativeTextBlock |
The example below is intended to help you compare the costs of investing in the Fund with the costs of investing in other mutual funds. The example assumes a $10,000 initial investment, 5% annual total return, and that fees and expenses remain the same as in the tables above. To the extent that the Manager is waiving fees or reimbursing expenses, the example assumes that such waiver or reimbursement will only be in place through the date noted above. Although your actual costs may be higher or lower, based on these assumptions your costs would be:
|
|
| Portfolio Turnover [Heading] |
rr_PortfolioTurnoverHeading |
Portfolio Turnover
|
|
| Portfolio Turnover [Text Block] |
rr_PortfolioTurnoverTextBlock |
The Fund pays transaction costs, such as commissions, when it buys and sells securities (or "turns over" its portfolio). A higher portfolio turnover rate may indicate higher transaction costs and may result in higher taxes when Fund shares are held in a taxable account. These costs, which are not reflected in annual fund operating expenses or in the example, affect the Fund's performance. During the most recent fiscal year, the Fund's portfolio turnover rate was 348% of the average value of its portfolio.
|
|
| Portfolio Turnover, Rate |
rr_PortfolioTurnoverRate |
348.00%
|
|
| Strategy [Heading] |
rr_StrategyHeading |
Principal Investment Strategies
|
|
| Strategy Narrative [Text Block] |
rr_StrategyNarrativeTextBlock |
Under normal circumstances, we invest:
We invest principally in U.S. Government obligations, including debt securities issued or guaranteed by the U.S. Treasury, U.S. Government agencies or government-sponsored entities. We will purchase only securities that are rated, at the time of purchase, within the two highest rating categories assigned by a Nationally Recognized Statistical Ratings Organization, or are deemed by us to be of comparable quality. As part of our investment strategy, we may enter into mortgage dollar rolls. While we may purchase securities of any maturity or duration, under normal circumstances, we expect the portfolio's overall dollar-weighted average effective duration to be less than that of a 3-year U.S. Treasury note. "Dollar-Weighted Average Effective Duration" is an aggregate measure of the sensitivity of a fund's fixed income portfolio securities to changes in interest rates. As a general matter, the price of a fixed income security with a longer effective duration will fluctuate more in response to changes in interest rates than the price of a fixed income security with a shorter effective duration.
We invest in debt securities that we believe offer competitive returns and are undervalued, offering additional income and/or price appreciation potential, relative to other debt securities of similar credit quality and interest rate sensitivity. As part of our investment strategy, we invest in mortgage-backed securities guaranteed by U.S. Government agencies that we believe will sufficiently outperform U.S. Treasuries. We may sell a security that has achieved its desired return or if we believe the security or its sector has become overvalued. We may also sell a security if a more attractive opportunity becomes available or if the security is no longer attractive due to its risk profile or as a result of changes in the overall market environment.
|
|
| Risk [Heading] |
rr_RiskHeading |
Principal Investment Risks
|
|
| Risk Narrative [Text Block] |
rr_RiskNarrativeTextBlock |
An investment in the Fund may lose money, is not a deposit of Wells Fargo Bank, N.A. or its affiliates, is not insured or guaranteed by the Federal Deposit Insurance Corporation or any other governmental agency, and is primarily subject to the risks briefly summarized below.
Credit Risk. The issuer or guarantor of a debt security may be unable or perceived to be unable to pay interest or repay principal when they become due, which could cause the value of an investment to decline and a Fund to lose money.
Interest Rate Risk. When interest rates (which are currently near historic lows) rise, the value of debt securities tends to fall. When interest rates decline, interest that a Fund is able to earn on its investments in debt securities may also decline, but the value of those securities may increase.
Management Risk. Investment decisions, techniques, analyses or models implemented by a Fund's manager or sub-adviser in seeking to achieve the Fund's investment objective may not produce the returns expected, may cause the Fund's shares to lose value or may cause the Fund to underperform other funds with similar investment objectives.
Market Risk. The values of, and/or the income generated by, securities held by a Fund may decline due to general market conditions or other factors, including those directly involving the issuers of such securities. Security markets are volatile and may decline significantly in response to adverse issuer, regulatory, political, or economic developments. Different sectors of the market and different security types may react differently to such developments.
Mortgage- and Asset-Backed Securities Risk. Mortgage- and asset-backed securities may decline in value and become less liquid when defaults on the underlying mortgages or assets occur and may exhibit additional volatility in periods of rising interest rates. Rising interest rates tend to extend the duration of these securities, making them more sensitive to changes in interest rates than instruments with fixed payment schedules. When interest rates decline or are low, the prepayment of mortgages or assets underlying such securities can reduce a Fund's returns.
U.S. Government Obligations Risk. U.S. Government obligations may be adversely impacted by changes in interest rates, and securities issued or guaranteed by U.S. Government agencies or government-sponsored entities may not be backed by the full faith and credit of the U.S. Government.
|
|
| Risk Lose Money [Text] |
rr_RiskLoseMoney |
An investment in the Fund may lose money
|
|
| Risk Not Insured Depository Institution [Text] |
rr_RiskNotInsuredDepositoryInstitution |
An investment in the Fund may lose money, is not a deposit of Wells Fargo Bank, N.A. or its affiliates, is not insured or guaranteed by the Federal Deposit Insurance Corporation or any other governmental agency
|
|
| Bar Chart and Performance Table [Heading] |
rr_BarChartAndPerformanceTableHeading |
Performance
|
|
| Performance Narrative [Text Block] |
rr_PerformanceNarrativeTextBlock |
The following information provides some indication of the risks of investing in the Fund by showing changes in the Fund's performance from year to year. The Fund's average annual total returns are compared to the performance of one or more indices. Past performance before and after taxes is no guarantee of future results. Current month-end performance is available on the Fund's website at wellsfargofunds.com.
|
|
| Bar Chart Closing [Text Block] |
rr_BarChartClosingTextBlock |
Highest Quarter: 1st Quarter 2009 | +3.54% | | Lowest Quarter: 4th Quarter 2016 | -0.52% | Year-to-date total return as of 9/30/2017 is +1.03% |
|
|
| Performance Table Heading |
rr_PerformanceTableHeading |
Average Annual Total Returns for the periods ended 12/31/2016
|
[39] |
| Performance Table Closing [Text Block] |
rr_PerformanceTableClosingTextBlock |
After-tax returns are calculated using the historical highest individual federal marginal income tax rates and do not reflect the impact of state, local or foreign taxes. Actual after-tax returns depend on an investor's tax situation and may differ from those shown, and after-tax returns shown are not relevant to tax-exempt investors or investors who hold their Fund shares through tax-deferred arrangements, such as 401(k) Plans or Individual Retirement Accounts.
|
|
| Performance Table Uses Highest Federal Rate |
rr_PerformanceTableUsesHighestFederalRate |
After-tax returns are calculated using the historical highest individual federal marginal income tax rates and do not reflect the impact of state, local or foreign taxes.
|
|
| Performance Table Not Relevant to Tax Deferred |
rr_PerformanceTableNotRelevantToTaxDeferred |
Actual after-tax returns depend on an investor's tax situation and may differ from those shown, and after-tax returns shown are not relevant to tax-exempt investors or investors who hold their Fund shares through tax-deferred arrangements, such as 401(k) Plans or Individual Retirement Accounts.
|
|
| Performance Past Does Not Indicate Future [Text] |
rr_PerformancePastDoesNotIndicateFuture |
Past performance before and after taxes is no guarantee of future results.
|
|
| Performance Information Illustrates Variability of Returns [Text] |
rr_PerformanceInformationIllustratesVariabilityOfReturns |
The following information provides some indication of the risks of investing in the Fund by showing changes in the Fund's performance from year to year. The Fund's average annual total returns are compared to the performance of one or more indices. Past performance before and after taxes is no guarantee of future results.
|
|
| Performance Availability Website Address [Text] |
rr_PerformanceAvailabilityWebSiteAddress |
wellsfargofunds.com
|
|
| (WFA Income Funds - Institutional Class) | (Wells Fargo Short Duration Government Bond Fund) | Bloomberg Barclays U.S. 1-3 Year Government Bond Index (reflects no deduction for fees, expenses, or taxes) |
|
|
|
| Prospectus: |
rr_ProspectusTable |
|
|
| 1 Year |
rr_AverageAnnualReturnYear01 |
0.87%
|
|
| 5 Years |
rr_AverageAnnualReturnYear05 |
0.59%
|
|
| 10 Years |
rr_AverageAnnualReturnYear10 |
2.18%
|
|
| (WFA Income Funds - Institutional Class) | (Wells Fargo Short Duration Government Bond Fund) | Institutional Class |
|
|
|
| Prospectus: |
rr_ProspectusTable |
|
|
| Maximum sales charge (load) imposed on purchases (as a percentage of offering price) |
rr_MaximumSalesChargeImposedOnPurchasesOverOfferingPrice |
none
|
|
| Maximum deferred sales charge (load) (as a percentage of offering price) |
rr_MaximumDeferredSalesChargeOverOfferingPrice |
none
|
|
| Management Fees |
rr_ManagementFeesOverAssets |
0.35%
|
|
| Distribution (12b-1) Fees |
rr_DistributionAndService12b1FeesOverAssets |
none
|
|
| Other Expenses |
rr_OtherExpensesOverAssets |
0.11%
|
|
| Total Annual Fund Operating Expenses |
rr_ExpensesOverAssets |
0.46%
|
|
| Fee Waivers |
rr_FeeWaiverOrReimbursementOverAssets |
(0.04%)
|
|
| Total Annual Fund Operating Expenses After Fee Waivers |
rr_NetExpensesOverAssets |
0.42%
|
[31] |
| Expense Example, with Redemption, 1 Year |
rr_ExpenseExampleYear01 |
$ 43
|
|
| Expense Example, with Redemption, 3 Years |
rr_ExpenseExampleYear03 |
144
|
|
| Expense Example, with Redemption, 5 Years |
rr_ExpenseExampleYear05 |
254
|
|
| Expense Example, with Redemption, 10 Years |
rr_ExpenseExampleYear10 |
$ 575
|
|
| Bar Chart [Heading] |
rr_BarChartHeading |
Calendar Year Total Returns for Institutional Class as of 12/31 each year
|
[39] |
| Annual Return 2007 |
rr_AnnualReturn2007 |
6.25%
|
|
| Annual Return 2008 |
rr_AnnualReturn2008 |
4.39%
|
|
| Annual Return 2009 |
rr_AnnualReturn2009 |
7.28%
|
|
| Annual Return 2010 |
rr_AnnualReturn2010 |
3.94%
|
|
| Annual Return 2011 |
rr_AnnualReturn2011 |
2.46%
|
|
| Annual Return 2012 |
rr_AnnualReturn2012 |
2.29%
|
|
| Annual Return 2013 |
rr_AnnualReturn2013 |
0.01%
|
|
| Annual Return 2014 |
rr_AnnualReturn2014 |
1.06%
|
|
| Annual Return 2015 |
rr_AnnualReturn2015 |
0.45%
|
|
| Annual Return 2016 |
rr_AnnualReturn2016 |
1.22%
|
|
| Year to Date Return, Label |
rr_YearToDateReturnLabel |
Year-to-date total return as of 9/30/2017 is +1.03%
|
|
| Bar Chart, Year to Date Return |
rr_BarChartYearToDateReturn |
1.03%
|
|
| Bar Chart, Year to Date Return, Date |
rr_BarChartYearToDateReturnDate |
Sep. 30, 2017
|
|
| Highest Quarterly Return, Label |
rr_HighestQuarterlyReturnLabel |
Highest Quarter: 1st Quarter 2009
|
|
| Highest Quarterly Return |
rr_BarChartHighestQuarterlyReturn |
3.54%
|
|
| Highest Quarterly Return, Date |
rr_BarChartHighestQuarterlyReturnDate |
Mar. 31, 2009
|
|
| Lowest Quarterly Return, Label |
rr_LowestQuarterlyReturnLabel |
Lowest Quarter: 4th Quarter 2016
|
|
| Lowest Quarterly Return |
rr_BarChartLowestQuarterlyReturn |
(0.52%)
|
|
| Lowest Quarterly Return, Date |
rr_BarChartLowestQuarterlyReturnDate |
Dec. 31, 2016
|
|
| 1 Year |
rr_AverageAnnualReturnYear01 |
1.22%
|
|
| 5 Years |
rr_AverageAnnualReturnYear05 |
1.00%
|
|
| 10 Years |
rr_AverageAnnualReturnYear10 |
2.91%
|
|
| Inception Date of Share Class |
rr_AverageAnnualReturnInceptionDate |
Apr. 08, 2005
|
|
| (WFA Income Funds - Institutional Class) | (Wells Fargo Short Duration Government Bond Fund) | Institutional Class | (after taxes on distributions) |
|
|
|
| Prospectus: |
rr_ProspectusTable |
|
|
| 1 Year |
rr_AverageAnnualReturnYear01 |
0.38%
|
|
| 5 Years |
rr_AverageAnnualReturnYear05 |
0.22%
|
|
| 10 Years |
rr_AverageAnnualReturnYear10 |
1.83%
|
|
| Inception Date of Share Class |
rr_AverageAnnualReturnInceptionDate |
Apr. 08, 2005
|
|
| (WFA Income Funds - Institutional Class) | (Wells Fargo Short Duration Government Bond Fund) | Institutional Class | (after taxes on distributions and the sale of Fund Shares) |
|
|
|
| Prospectus: |
rr_ProspectusTable |
|
|
| 1 Year |
rr_AverageAnnualReturnYear01 |
0.69%
|
|
| 5 Years |
rr_AverageAnnualReturnYear05 |
0.43%
|
|
| 10 Years |
rr_AverageAnnualReturnYear10 |
1.84%
|
|
| Inception Date of Share Class |
rr_AverageAnnualReturnInceptionDate |
Apr. 08, 2005
|
|
| (WFA Income Funds - Institutional Class) | (Wells Fargo Short-Term Bond Fund) |
|
|
|
| Prospectus: |
rr_ProspectusTable |
|
|
| Objective [Heading] |
rr_ObjectiveHeading |
Investment Objective
|
|
| Objective, Primary [Text Block] |
rr_ObjectivePrimaryTextBlock |
The Fund seeks current income consistent with capital preservation.
|
|
| Expense [Heading] |
rr_ExpenseHeading |
Fees and Expenses
|
|
| Expense Narrative [Text Block] |
rr_ExpenseNarrativeTextBlock |
These tables are intended to help you understand the various costs and expenses you will pay if you buy and hold shares of the Fund.
|
|
| Shareholder Fees Caption [Text] |
rr_ShareholderFeesCaption |
Shareholder Fees (fees paid directly from your investment)
|
|
| Operating Expenses Caption [Text] |
rr_OperatingExpensesCaption |
Annual Fund Operating Expenses (expenses that you pay each year as a percentage of the value of your investment)
|
[33] |
| Fee Waiver or Reimbursement over Assets, Date of Termination |
rr_FeeWaiverOrReimbursementOverAssetsDateOfTermination |
December 31, 2018
|
|
| Expenses Restated to Reflect Current [Text] |
rr_ExpensesRestatedToReflectCurrent |
Expenses have been adjusted as necessary from amounts incurred during the Fund's most recent fiscal year to reflect current fees and expenses.
|
|
| Expense Example [Heading] |
rr_ExpenseExampleHeading |
Example of Expenses
|
|
| Expense Example Narrative [Text Block] |
rr_ExpenseExampleNarrativeTextBlock |
The example below is intended to help you compare the costs of investing in the Fund with the costs of investing in other mutual funds. The example assumes a $10,000 initial investment, 5% annual total return, and that fees and expenses remain the same as in the tables above. To the extent that the Manager is waiving fees or reimbursing expenses, the example assumes that such waiver or reimbursement will only be in place through the date noted above. Although your actual costs may be higher or lower, based on these assumptions your costs would be:
|
|
| Portfolio Turnover [Heading] |
rr_PortfolioTurnoverHeading |
Portfolio Turnover
|
|
| Portfolio Turnover [Text Block] |
rr_PortfolioTurnoverTextBlock |
The Fund pays transaction costs, such as commissions, when it buys and sells securities (or "turns over" its portfolio). A higher portfolio turnover rate may indicate higher transaction costs and may result in higher taxes when Fund shares are held in a taxable account. These costs, which are not reflected in annual fund operating expenses or in the example, affect the Fund's performance. During the most recent fiscal year, the Fund's portfolio turnover rate was 50% of the average value of its portfolio.
|
|
| Portfolio Turnover, Rate |
rr_PortfolioTurnoverRate |
50.00%
|
|
| Strategy [Heading] |
rr_StrategyHeading |
Principal Investment Strategies
|
|
| Strategy Narrative [Text Block] |
rr_StrategyNarrativeTextBlock |
Under normal circumstances, we invest:
-
at least 80% of the Fund's net assets in debt securities;
-
up to 25% of the Fund's total assets in U.S. dollar-denominated debt securities of foreign issuers; and
-
up to 15% of the Fund's total assets in below investment-grade debt securities.
We invest principally in debt securities. We may invest in a variety of debt securities, including corporate, mortgage- and asset-backed securities, bank loans and U.S. Government obligations. These securities may have fixed, floating or variable rates. We invest in both investment-grade and below investment-grade debt securities (often called "high yield securities" or "junk bonds") and may also invest in U.S. dollar-denominated debt securities of foreign issuers. As part of our below investment-grade debt securities investment strategy, we will generally invest in securities that are rated at least BB by Standard & Poor's or Ba by Moody's, or an equivalent quality rating from another Nationally Recognized Statistical Ratings Organization, or are deemed by us to be of comparable quality. We may also use futures for duration and yield curve management. While we may purchase securities of any maturity, under normal circumstances, we expect the Fund's dollar-weighted average effective maturity to be three years or less. "Dollar-Weighted Average Effective Maturity" is a measure of the average time until the final payment of principal and interest is due on fixed income securities in the Fund's portfolio.
We employ a top-down macroeconomic outlook to determine the portfolio's duration, yield curve positioning, credit quality and sector allocation. Macroeconomic factors considered may include, among others, the pace of economic growth, employment conditions, corporate profits, inflation, monetary and fiscal policy, as well as the influence of international economic and financial conditions. In combination with our top-down macroeconomic approach, we employ a bottom-up process of fundamental securities analysis to determine the specific securities for investment. Elements of this evaluation may include credit research, duration measurements, historical yield spread relationships, volatility trends, mortgage refinance rates, as well as other factors. Our credit analysis may consider an issuer's general financial condition, its competitive position and its management strategies, as well as industry characteristics and other factors. We may sell a security due to changes in credit characteristics or outlook, as well as changes in portfolio strategy or cash flow needs. A security may also be sold and replaced with one that presents a better value or risk/reward profile.
|
|
| Risk [Heading] |
rr_RiskHeading |
Principal Investment Risks
|
|
| Risk Narrative [Text Block] |
rr_RiskNarrativeTextBlock |
An investment in the Fund may lose money, is not a deposit of Wells Fargo Bank, N.A. or its affiliates, is not insured or guaranteed by the Federal Deposit Insurance Corporation or any other governmental agency, and is primarily subject to the risks briefly summarized below.
Credit Risk. The issuer or guarantor of a debt security may be unable or perceived to be unable to pay interest or repay principal when they become due, which could cause the value of an investment to decline and a Fund to lose money.
Derivatives Risk. The use of derivatives, such as futures, options and swap agreements, can lead to losses, including those magnified by leverage, particularly when derivatives are used to enhance return rather than mitigate risk. Certain derivative instruments may be difficult to sell when the portfolio manager believes it would be appropriate to do so, or the other party to a derivative contract may be unwilling or unable to fulfill its contractual obligations.
Foreign Investment Risk. Foreign investments may be subject to lower liquidity, greater price volatility and risks related to adverse political, regulatory, market or economic developments. Foreign investments may involve exposure to changes in foreign currency exchange rates and may be subject to higher withholding and other taxes.
Futures Contracts Risk. A Fund that uses futures contracts, which are a type of derivative, is subject to the risk of loss caused by unanticipated market movements. In addition, there may at times be an imperfect correlation between the movement in the prices of futures contracts and the value of their underlying instruments or indexes and there may at times not be a liquid secondary market for certain futures contracts.
High Yield Securities Risk. High yield securities and unrated securities of similar credit quality (commonly known as "junk bonds") have a much greater risk of default or of not returning principal and their values tend to be more volatile than higher-rated securities with similar maturities.
Interest Rate Risk. When interest rates (which are currently near historic lows) rise, the value of debt securities tends to fall. When interest rates decline, interest that a Fund is able to earn on its investments in debt securities may also decline, but the value of those securities may increase.
Loan Risk. Loans may be unrated, less liquid and more difficult to value than traditional debt securities. The highly leveraged capital structure of the borrowers in such transactions may make such loans especially vulnerable to adverse changes in financial, economic or market conditions. A Fund may be unable to sell loans at a desired time or price. The Fund may also not be able to control amendments, waivers or the exercise of any remedies that a lender would have under a direct loan and may assume liability as a lender.
Management Risk. Investment decisions, techniques, analyses or models implemented by a Fund's manager or sub-adviser in seeking to achieve the Fund's investment objective may not produce the returns expected, may cause the Fund's shares to lose value or may cause the Fund to underperform other funds with similar investment objectives.
Market Risk. The values of, and/or the income generated by, securities held by a Fund may decline due to general market conditions or other factors, including those directly involving the issuers of such securities. Security markets are volatile and may decline significantly in response to adverse issuer, regulatory, political, or economic developments. Different sectors of the market and different security types may react differently to such developments.
Mortgage- and Asset-Backed Securities Risk. Mortgage- and asset-backed securities may decline in value and become less liquid when defaults on the underlying mortgages or assets occur and may exhibit additional volatility in periods of rising interest rates. Rising interest rates tend to extend the duration of these securities, making them more sensitive to changes in interest rates than instruments with fixed payment schedules. When interest rates decline or are low, the prepayment of mortgages or assets underlying such securities can reduce a Fund's returns.
U.S. Government Obligations Risk. U.S. Government obligations may be adversely impacted by changes in interest rates, and securities issued or guaranteed by U.S. Government agencies or government-sponsored entities may not be backed by the full faith and credit of the U.S. Government.
|
|
| Risk Lose Money [Text] |
rr_RiskLoseMoney |
An investment in the Fund may lose money
|
|
| Risk Not Insured Depository Institution [Text] |
rr_RiskNotInsuredDepositoryInstitution |
An investment in the Fund may lose money, is not a deposit of Wells Fargo Bank, N.A. or its affiliates, is not insured or guaranteed by the Federal Deposit Insurance Corporation or any other governmental agency
|
|
| Bar Chart and Performance Table [Heading] |
rr_BarChartAndPerformanceTableHeading |
Performance
|
|
| Performance Narrative [Text Block] |
rr_PerformanceNarrativeTextBlock |
The following information provides some indication of the risks of investing in the Fund by showing changes in the Fund's performance from year to year. The Fund's average annual total returns are compared to the performance of one or more indices. Past performance before and after taxes is no guarantee of future results. Current month-end performance is available on the Fund's website at wellsfargofunds.com.
|
|
| Bar Chart Closing [Text Block] |
rr_BarChartClosingTextBlock |
Highest Quarter: 3rd Quarter 2009 | +3.76% | | Lowest Quarter: 3rd Quarter 2008 | -1.03% | Year-to-date total return as of 9/30/2017 is +1.46% |
|
|
| Performance Table Heading |
rr_PerformanceTableHeading |
Average Annual Total Returns for the periods ended 12/31/2016
|
|
| Performance Table Closing [Text Block] |
rr_PerformanceTableClosingTextBlock |
After-tax returns are calculated using the historical highest individual federal marginal income tax rates and do not reflect the impact of state, local or foreign taxes. Actual after-tax returns depend on an investor's tax situation and may differ from those shown, and after-tax returns shown are not relevant to tax-exempt investors or investors who hold their Fund shares through tax-deferred arrangements, such as 401(k) Plans or Individual Retirement Accounts.
|
|
| Performance Table Uses Highest Federal Rate |
rr_PerformanceTableUsesHighestFederalRate |
After-tax returns are calculated using the historical highest individual federal marginal income tax rates and do not reflect the impact of state, local or foreign taxes.
|
|
| Performance Table Not Relevant to Tax Deferred |
rr_PerformanceTableNotRelevantToTaxDeferred |
Actual after-tax returns depend on an investor's tax situation and may differ from those shown, and after-tax returns shown are not relevant to tax-exempt investors or investors who hold their Fund shares through tax-deferred arrangements, such as 401(k) Plans or Individual Retirement Accounts.
|
|
| Performance Past Does Not Indicate Future [Text] |
rr_PerformancePastDoesNotIndicateFuture |
Past performance before and after taxes is no guarantee of future results.
|
|
| Performance Information Illustrates Variability of Returns [Text] |
rr_PerformanceInformationIllustratesVariabilityOfReturns |
The following information provides some indication of the risks of investing in the Fund by showing changes in the Fund's performance from year to year. The Fund's average annual total returns are compared to the performance of one or more indices. Past performance before and after taxes is no guarantee of future results.
|
|
| Performance Availability Website Address [Text] |
rr_PerformanceAvailabilityWebSiteAddress |
wellsfargofunds.com
|
|
| (WFA Income Funds - Institutional Class) | (Wells Fargo Short-Term Bond Fund) | Bloomberg Barclays U.S. 1-3 Year Government/Credit Bond Index (reflects no deduction for fees, expenses, or taxes) |
|
|
|
| Prospectus: |
rr_ProspectusTable |
|
|
| 1 Year |
rr_AverageAnnualReturnYear01 |
1.28%
|
|
| 5 Years |
rr_AverageAnnualReturnYear05 |
0.92%
|
|
| 10 Years |
rr_AverageAnnualReturnYear10 |
2.44%
|
|
| (WFA Income Funds - Institutional Class) | (Wells Fargo Short-Term Bond Fund) | Institutional Class |
|
|
|
| Prospectus: |
rr_ProspectusTable |
|
|
| Maximum sales charge (load) imposed on purchases (as a percentage of offering price) |
rr_MaximumSalesChargeImposedOnPurchasesOverOfferingPrice |
none
|
|
| Maximum deferred sales charge (load) (as a percentage of offering price) |
rr_MaximumDeferredSalesChargeOverOfferingPrice |
none
|
|
| Management Fees |
rr_ManagementFeesOverAssets |
0.35%
|
|
| Distribution (12b-1) Fees |
rr_DistributionAndService12b1FeesOverAssets |
none
|
|
| Other Expenses |
rr_OtherExpensesOverAssets |
0.13%
|
|
| Acquired Fund Fees and Expenses |
rr_AcquiredFundFeesAndExpensesOverAssets |
0.01%
|
|
| Total Annual Fund Operating Expenses |
rr_ExpensesOverAssets |
0.49%
|
|
| Fee Waivers |
rr_FeeWaiverOrReimbursementOverAssets |
(0.03%)
|
|
| Total Annual Fund Operating Expenses After Fee Waivers |
rr_NetExpensesOverAssets |
0.46%
|
[40] |
| Expense Example, with Redemption, 1 Year |
rr_ExpenseExampleYear01 |
$ 47
|
|
| Expense Example, with Redemption, 3 Years |
rr_ExpenseExampleYear03 |
154
|
|
| Expense Example, with Redemption, 5 Years |
rr_ExpenseExampleYear05 |
271
|
|
| Expense Example, with Redemption, 10 Years |
rr_ExpenseExampleYear10 |
$ 613
|
|
| Bar Chart [Heading] |
rr_BarChartHeading |
Calendar Year Total Returns for Institutional Class as of 12/31 each year
|
|
| Annual Return 2007 |
rr_AnnualReturn2007 |
4.92%
|
|
| Annual Return 2008 |
rr_AnnualReturn2008 |
(0.20%)
|
|
| Annual Return 2009 |
rr_AnnualReturn2009 |
9.85%
|
|
| Annual Return 2010 |
rr_AnnualReturn2010 |
4.66%
|
|
| Annual Return 2011 |
rr_AnnualReturn2011 |
2.03%
|
|
| Annual Return 2012 |
rr_AnnualReturn2012 |
3.19%
|
|
| Annual Return 2013 |
rr_AnnualReturn2013 |
1.13%
|
|
| Annual Return 2014 |
rr_AnnualReturn2014 |
1.23%
|
|
| Annual Return 2015 |
rr_AnnualReturn2015 |
0.89%
|
|
| Annual Return 2016 |
rr_AnnualReturn2016 |
2.17%
|
|
| Year to Date Return, Label |
rr_YearToDateReturnLabel |
Year-to-date total return as of 9/30/2017 is +1.46%
|
|
| Bar Chart, Year to Date Return |
rr_BarChartYearToDateReturn |
1.46%
|
|
| Bar Chart, Year to Date Return, Date |
rr_BarChartYearToDateReturnDate |
Sep. 30, 2017
|
|
| Highest Quarterly Return, Label |
rr_HighestQuarterlyReturnLabel |
Highest Quarter: 3rd Quarter 2009
|
|
| Highest Quarterly Return |
rr_BarChartHighestQuarterlyReturn |
3.76%
|
|
| Highest Quarterly Return, Date |
rr_BarChartHighestQuarterlyReturnDate |
Sep. 30, 2009
|
|
| Lowest Quarterly Return, Label |
rr_LowestQuarterlyReturnLabel |
Lowest Quarter: 3rd Quarter 2008
|
|
| Lowest Quarterly Return |
rr_BarChartLowestQuarterlyReturn |
(1.03%)
|
|
| Lowest Quarterly Return, Date |
rr_BarChartLowestQuarterlyReturnDate |
Sep. 30, 2008
|
|
| 1 Year |
rr_AverageAnnualReturnYear01 |
2.17%
|
|
| 5 Years |
rr_AverageAnnualReturnYear05 |
1.72%
|
|
| 10 Years |
rr_AverageAnnualReturnYear10 |
2.95%
|
|
| Inception Date of Share Class |
rr_AverageAnnualReturnInceptionDate |
Aug. 31, 1999
|
|
| (WFA Income Funds - Institutional Class) | (Wells Fargo Short-Term Bond Fund) | Institutional Class | (after taxes on distributions) |
|
|
|
| Prospectus: |
rr_ProspectusTable |
|
|
| 1 Year |
rr_AverageAnnualReturnYear01 |
1.47%
|
|
| 5 Years |
rr_AverageAnnualReturnYear05 |
1.05%
|
|
| 10 Years |
rr_AverageAnnualReturnYear10 |
1.95%
|
|
| Inception Date of Share Class |
rr_AverageAnnualReturnInceptionDate |
Aug. 31, 1999
|
|
| (WFA Income Funds - Institutional Class) | (Wells Fargo Short-Term Bond Fund) | Institutional Class | (after taxes on distributions and the sale of Fund Shares) |
|
|
|
| Prospectus: |
rr_ProspectusTable |
|
|
| 1 Year |
rr_AverageAnnualReturnYear01 |
1.22%
|
|
| 5 Years |
rr_AverageAnnualReturnYear05 |
1.03%
|
|
| 10 Years |
rr_AverageAnnualReturnYear10 |
1.89%
|
|
| Inception Date of Share Class |
rr_AverageAnnualReturnInceptionDate |
Aug. 31, 1999
|
|
| (WFA Income Funds - Institutional Class) | (Wells Fargo Short-Term High Yield Bond Fund) |
|
|
|
| Prospectus: |
rr_ProspectusTable |
|
|
| Objective [Heading] |
rr_ObjectiveHeading |
Investment Objective
|
|
| Objective, Primary [Text Block] |
rr_ObjectivePrimaryTextBlock |
The Fund seeks total return, consisting of a high level of current income and capital appreciation.
|
|
| Expense [Heading] |
rr_ExpenseHeading |
Fees and Expenses
|
|
| Expense Narrative [Text Block] |
rr_ExpenseNarrativeTextBlock |
These tables are intended to help you understand the various costs and expenses you will pay if you buy and hold shares of the Fund.
|
|
| Shareholder Fees Caption [Text] |
rr_ShareholderFeesCaption |
Shareholder Fees (fees paid directly from your investment)
|
|
| Operating Expenses Caption [Text] |
rr_OperatingExpensesCaption |
Annual Fund Operating Expenses (expenses that you pay each year as a percentage of the value of your investment)
|
|
| Fee Waiver or Reimbursement over Assets, Date of Termination |
rr_FeeWaiverOrReimbursementOverAssetsDateOfTermination |
December 31, 2018
|
|
| Expense Example [Heading] |
rr_ExpenseExampleHeading |
Example of Expenses
|
|
| Expense Example Narrative [Text Block] |
rr_ExpenseExampleNarrativeTextBlock |
The example below is intended to help you compare the costs of investing in the Fund with the costs of investing in other mutual funds. The example assumes a $10,000 initial investment, 5% annual total return, and that fees and expenses remain the same as in the tables above. To the extent that the Manager is waiving fees or reimbursing expenses, the example assumes that such waiver or reimbursement will only be in place through the date noted above. Although your actual costs may be higher or lower, based on these assumptions your costs would be:
|
|
| Portfolio Turnover [Heading] |
rr_PortfolioTurnoverHeading |
Portfolio Turnover
|
|
| Portfolio Turnover [Text Block] |
rr_PortfolioTurnoverTextBlock |
The Fund pays transaction costs, such as commissions, when it buys and sells securities (or "turns over" its portfolio). A higher portfolio turnover rate may indicate higher transaction costs and may result in higher taxes when Fund shares are held in a taxable account. These costs, which are not reflected in annual fund operating expenses or in the example, affect the Fund's performance. During the most recent fiscal year, the Fund's portfolio turnover rate was 35% of the average value of its portfolio.
|
|
| Portfolio Turnover, Rate |
rr_PortfolioTurnoverRate |
35.00%
|
|
| Strategy [Heading] |
rr_StrategyHeading |
Principal Investment Strategies
|
|
| Strategy Narrative [Text Block] |
rr_StrategyNarrativeTextBlock |
Under normal circumstances, we invest:
We invest principally in below investment-grade debt securities (often called "high-yield" securities or "junk bonds") of corporate issuers. These include traditional corporate bonds as well as bank loans. These securities may have fixed, floating or variable rates. As part of our below investment-grade debt securities investment strategy, we will generally invest in securities that are rated BB through CCC by Standard & Poor's or Ba through Caa by Moody's, or an equivalent quality rating from another Nationally Recognized Statistical Ratings Organization, or are deemed by us to be of comparable quality. We may also use credit default swap agreements to reduce cash positions and to cost-effectively increase credit exposure, and futures to manage duration exposure. While we may purchase securities of any maturity, under normal circumstances, we expect the Fund's dollar-weighted average effective maturity to be three years or less. "Dollar-Weighted Average Effective Maturity" is a measure of the average time until the final payment of principal and interest is due on fixed income securities in the Fund's portfolio.
We start our investment process with a focus on bottom-up fundamental credit analysis to generate new ideas, to understand the potential risks, to select individual securities that may potentially add value from income and/or capital appreciation. Our credit research may include an assessment of an issuer's general financial condition, its competitive positioning and management strength, as well as industry characteristics and other factors. We may sell a security due to changes in credit characteristics or outlook, as well as changes in portfolio strategy or cash flow needs. A security may also be sold and replaced with one that presents a better value or risk/reward profile.
|
|
| Risk [Heading] |
rr_RiskHeading |
Principal Investment Risks
|
|
| Risk Narrative [Text Block] |
rr_RiskNarrativeTextBlock |
An investment in the Fund may lose money, is not a deposit of Wells Fargo Bank, N.A. or its affiliates, is not insured or guaranteed by the Federal Deposit Insurance Corporation or any other governmental agency, and is primarily subject to the risks briefly summarized below.
Credit Risk. The issuer or guarantor of a debt security may be unable or perceived to be unable to pay interest or repay principal when they become due, which could cause the value of an investment to decline and a Fund to lose money.
Derivatives Risk. The use of derivatives, such as futures, options and swap agreements, can lead to losses, including those magnified by leverage, particularly when derivatives are used to enhance return rather than mitigate risk. Certain derivative instruments may be difficult to sell when the portfolio manager believes it would be appropriate to do so, or the other party to a derivative contract may be unwilling or unable to fulfill its contractual obligations.
Foreign Investment Risk. Foreign investments may be subject to lower liquidity, greater price volatility and risks related to adverse political, regulatory, market or economic developments. Foreign investments may involve exposure to changes in foreign currency exchange rates and may be subject to higher withholding and other taxes.
Futures Contracts Risk. A Fund that uses futures contracts, which are a type of derivative, is subject to the risk of loss caused by unanticipated market movements. In addition, there may at times be an imperfect correlation between the movement in the prices of futures contracts and the value of their underlying instruments or indexes and there may at times not be a liquid secondary market for certain futures contracts.
High Yield Securities Risk. High yield securities and unrated securities of similar credit quality (commonly known as "junk bonds") have a much greater risk of default or of not returning principal and their values tend to be more volatile than higher-rated securities with similar maturities.
Interest Rate Risk. When interest rates (which are currently near historic lows) rise, the value of debt securities tends to fall. When interest rates decline, interest that a Fund is able to earn on its investments in debt securities may also decline, but the value of those securities may increase.
Loan Risk. Loans may be unrated, less liquid and more difficult to value than traditional debt securities. The highly leveraged capital structure of the borrowers in such transactions may make such loans especially vulnerable to adverse changes in financial, economic or market conditions. A Fund may be unable to sell loans at a desired time or price. The Fund may also not be able to control amendments, waivers or the exercise of any remedies that a lender would have under a direct loan and may assume liability as a lender.
Management Risk. Investment decisions, techniques, analyses or models implemented by a Fund's manager or sub-adviser in seeking to achieve the Fund's investment objective may not produce the returns expected, may cause the Fund's shares to lose value or may cause the Fund to underperform other funds with similar investment objectives.
Market Risk. The values of, and/or the income generated by, securities held by a Fund may decline due to general market conditions or other factors, including those directly involving the issuers of such securities. Security markets are volatile and may decline significantly in response to adverse issuer, regulatory, political, or economic developments. Different sectors of the market and different security types may react differently to such developments.
Swaps Risk. Depending on their structure, swap agreements and options to enter into swap agreements ("swaptions"), both of which are types of derivatives, may increase or decrease a Fund's exposure to long- or short-term interest rates, foreign currency values, mortgage-backed securities, corporate borrowing rates, or credit events or other reference points such as security prices or inflation rates.
|
|
| Risk Lose Money [Text] |
rr_RiskLoseMoney |
An investment in the Fund may lose money
|
|
| Risk Not Insured Depository Institution [Text] |
rr_RiskNotInsuredDepositoryInstitution |
An investment in the Fund may lose money, is not a deposit of Wells Fargo Bank, N.A. or its affiliates, is not insured or guaranteed by the Federal Deposit Insurance Corporation or any other governmental agency
|
|
| Bar Chart and Performance Table [Heading] |
rr_BarChartAndPerformanceTableHeading |
Performance
|
|
| Performance Narrative [Text Block] |
rr_PerformanceNarrativeTextBlock |
The following information provides some indication of the risks of investing in the Fund by showing changes in the Fund's performance from year to year. The Fund's average annual total returns are compared to the performance of one or more indices. Past performance before and after taxes is no guarantee of future results. Current month-end performance is available on the Fund's website at wellsfargofunds.com.
|
|
| Bar Chart Closing [Text Block] |
rr_BarChartClosingTextBlock |
Highest Quarter: 1st Quarter 2009 | +4.75% | | Lowest Quarter: 4th Quarter 2008 | -5.69% | Year-to-date total return as of 9/30/2017 is +2.11% |
|
|
| Performance Table Heading |
rr_PerformanceTableHeading |
Average Annual Total Returns for the periods ended 12/31/2016
|
[41] |
| Performance Table Closing [Text Block] |
rr_PerformanceTableClosingTextBlock |
After-tax returns are calculated using the historical highest individual federal marginal income tax rates and do not reflect the impact of state, local or foreign taxes. Actual after-tax returns depend on an investor's tax situation and may differ from those shown, and after-tax returns shown are not relevant to tax-exempt investors or investors who hold their Fund shares through tax-deferred arrangements, such as 401(k) Plans or Individual Retirement Accounts.
|
|
| Performance Table Uses Highest Federal Rate |
rr_PerformanceTableUsesHighestFederalRate |
After-tax returns are calculated using the historical highest individual federal marginal income tax rates and do not reflect the impact of state, local or foreign taxes.
|
|
| Performance Table Not Relevant to Tax Deferred |
rr_PerformanceTableNotRelevantToTaxDeferred |
Actual after-tax returns depend on an investor's tax situation and may differ from those shown, and after-tax returns shown are not relevant to tax-exempt investors or investors who hold their Fund shares through tax-deferred arrangements, such as 401(k) Plans or Individual Retirement Accounts.
|
|
| Performance Past Does Not Indicate Future [Text] |
rr_PerformancePastDoesNotIndicateFuture |
Past performance before and after taxes is no guarantee of future results.
|
|
| Performance Information Illustrates Variability of Returns [Text] |
rr_PerformanceInformationIllustratesVariabilityOfReturns |
The following information provides some indication of the risks of investing in the Fund by showing changes in the Fund's performance from year to year. The Fund's average annual total returns are compared to the performance of one or more indices. Past performance before and after taxes is no guarantee of future results.
|
|
| Performance Availability Website Address [Text] |
rr_PerformanceAvailabilityWebSiteAddress |
wellsfargofunds.com
|
|
| (WFA Income Funds - Institutional Class) | (Wells Fargo Short-Term High Yield Bond Fund) | ICE BofA Merrill Lynch High Yield U.S. Corporates, Cash Pay, BB Rated, 1-5 Year Index (reflects no deduction for fees, expenses, or taxes) |
|
|
|
| Prospectus: |
rr_ProspectusTable |
|
|
| 1 Year |
rr_AverageAnnualReturnYear01 |
10.39%
|
|
| 5 Years |
rr_AverageAnnualReturnYear05 |
6.37%
|
|
| 10 Years |
rr_AverageAnnualReturnYear10 |
6.59%
|
|
| (WFA Income Funds - Institutional Class) | (Wells Fargo Short-Term High Yield Bond Fund) | Institutional Class |
|
|
|
| Prospectus: |
rr_ProspectusTable |
|
|
| Maximum sales charge (load) imposed on purchases (as a percentage of offering price) |
rr_MaximumSalesChargeImposedOnPurchasesOverOfferingPrice |
none
|
|
| Maximum deferred sales charge (load) (as a percentage of offering price) |
rr_MaximumDeferredSalesChargeOverOfferingPrice |
none
|
|
| Management Fees |
rr_ManagementFeesOverAssets |
0.48%
|
|
| Distribution (12b-1) Fees |
rr_DistributionAndService12b1FeesOverAssets |
none
|
|
| Other Expenses |
rr_OtherExpensesOverAssets |
0.11%
|
|
| Acquired Fund Fees and Expenses |
rr_AcquiredFundFeesAndExpensesOverAssets |
0.01%
|
|
| Total Annual Fund Operating Expenses |
rr_ExpensesOverAssets |
0.60%
|
|
| Fee Waivers |
rr_FeeWaiverOrReimbursementOverAssets |
(0.09%)
|
|
| Total Annual Fund Operating Expenses After Fee Waivers |
rr_NetExpensesOverAssets |
0.51%
|
[42] |
| Expense Example, with Redemption, 1 Year |
rr_ExpenseExampleYear01 |
$ 52
|
|
| Expense Example, with Redemption, 3 Years |
rr_ExpenseExampleYear03 |
183
|
|
| Expense Example, with Redemption, 5 Years |
rr_ExpenseExampleYear05 |
326
|
|
| Expense Example, with Redemption, 10 Years |
rr_ExpenseExampleYear10 |
$ 741
|
|
| Bar Chart [Heading] |
rr_BarChartHeading |
Calendar Year Total Returns for Institutional Class as of 12/31 each year
|
[41] |
| Annual Return 2007 |
rr_AnnualReturn2007 |
3.24%
|
|
| Annual Return 2008 |
rr_AnnualReturn2008 |
(5.82%)
|
|
| Annual Return 2009 |
rr_AnnualReturn2009 |
15.34%
|
|
| Annual Return 2010 |
rr_AnnualReturn2010 |
6.98%
|
|
| Annual Return 2011 |
rr_AnnualReturn2011 |
3.64%
|
|
| Annual Return 2012 |
rr_AnnualReturn2012 |
6.39%
|
|
| Annual Return 2013 |
rr_AnnualReturn2013 |
3.90%
|
|
| Annual Return 2014 |
rr_AnnualReturn2014 |
0.82%
|
|
| Annual Return 2015 |
rr_AnnualReturn2015 |
2.32%
|
|
| Annual Return 2016 |
rr_AnnualReturn2016 |
4.86%
|
|
| Year to Date Return, Label |
rr_YearToDateReturnLabel |
Year-to-date total return as of 9/30/2017 is +2.11%
|
|
| Bar Chart, Year to Date Return |
rr_BarChartYearToDateReturn |
2.11%
|
|
| Bar Chart, Year to Date Return, Date |
rr_BarChartYearToDateReturnDate |
Sep. 30, 2017
|
|
| Highest Quarterly Return, Label |
rr_HighestQuarterlyReturnLabel |
Highest Quarter: 1st Quarter 2009
|
|
| Highest Quarterly Return |
rr_BarChartHighestQuarterlyReturn |
4.75%
|
|
| Highest Quarterly Return, Date |
rr_BarChartHighestQuarterlyReturnDate |
Mar. 31, 2009
|
|
| Lowest Quarterly Return, Label |
rr_LowestQuarterlyReturnLabel |
Lowest Quarter: 4th Quarter 2008
|
|
| Lowest Quarterly Return |
rr_BarChartLowestQuarterlyReturn |
(5.69%)
|
|
| Lowest Quarterly Return, Date |
rr_BarChartLowestQuarterlyReturnDate |
Dec. 31, 2008
|
|
| 1 Year |
rr_AverageAnnualReturnYear01 |
4.86%
|
|
| 5 Years |
rr_AverageAnnualReturnYear05 |
3.64%
|
|
| 10 Years |
rr_AverageAnnualReturnYear10 |
4.05%
|
|
| Inception Date of Share Class |
rr_AverageAnnualReturnInceptionDate |
Nov. 30, 2012
|
|
| (WFA Income Funds - Institutional Class) | (Wells Fargo Short-Term High Yield Bond Fund) | Institutional Class | (after taxes on distributions) |
|
|
|
| Prospectus: |
rr_ProspectusTable |
|
|
| 1 Year |
rr_AverageAnnualReturnYear01 |
3.39%
|
|
| 5 Years |
rr_AverageAnnualReturnYear05 |
2.08%
|
|
| 10 Years |
rr_AverageAnnualReturnYear10 |
2.30%
|
|
| Inception Date of Share Class |
rr_AverageAnnualReturnInceptionDate |
Nov. 30, 2012
|
|
| (WFA Income Funds - Institutional Class) | (Wells Fargo Short-Term High Yield Bond Fund) | Institutional Class | (after taxes on distributions and the sale of Fund Shares) |
|
|
|
| Prospectus: |
rr_ProspectusTable |
|
|
| 1 Year |
rr_AverageAnnualReturnYear01 |
2.73%
|
|
| 5 Years |
rr_AverageAnnualReturnYear05 |
2.11%
|
|
| 10 Years |
rr_AverageAnnualReturnYear10 |
2.41%
|
|
| Inception Date of Share Class |
rr_AverageAnnualReturnInceptionDate |
Nov. 30, 2012
|
|
| (WFA Income Funds - Institutional Class) | (Wells Fargo Ultra Short-Term Income Fund) |
|
|
|
| Prospectus: |
rr_ProspectusTable |
|
|
| Objective [Heading] |
rr_ObjectiveHeading |
Investment Objective
|
|
| Objective, Primary [Text Block] |
rr_ObjectivePrimaryTextBlock |
The Fund seeks current income consistent with capital preservation.
|
|
| Expense [Heading] |
rr_ExpenseHeading |
Fees and Expenses
|
|
| Expense Narrative [Text Block] |
rr_ExpenseNarrativeTextBlock |
These tables are intended to help you understand the various costs and expenses you will pay if you buy and hold shares of the Fund.
|
|
| Shareholder Fees Caption [Text] |
rr_ShareholderFeesCaption |
Shareholder Fees (fees paid directly from your investment)
|
|
| Operating Expenses Caption [Text] |
rr_OperatingExpensesCaption |
Annual Fund Operating Expenses (expenses that you pay each year as a percentage of the value of your investment)
|
|
| Fee Waiver or Reimbursement over Assets, Date of Termination |
rr_FeeWaiverOrReimbursementOverAssetsDateOfTermination |
December 31, 2018
|
|
| Expense Example [Heading] |
rr_ExpenseExampleHeading |
Example of Expenses
|
|
| Expense Example Narrative [Text Block] |
rr_ExpenseExampleNarrativeTextBlock |
The example below is intended to help you compare the costs of investing in the Fund with the costs of investing in other mutual funds. The example assumes a $10,000 initial investment, 5% annual total return, and that fees and expenses remain the same as in the tables above. To the extent that the Manager is waiving fees or reimbursing expenses, the example assumes that such waiver or reimbursement will only be in place through the date noted above. Although your actual costs may be higher or lower, based on these assumptions your costs would be:
|
|
| Portfolio Turnover [Heading] |
rr_PortfolioTurnoverHeading |
Portfolio Turnover
|
|
| Portfolio Turnover [Text Block] |
rr_PortfolioTurnoverTextBlock |
The Fund pays transaction costs, such as commissions, when it buys and sells securities (or "turns over" its portfolio). A higher portfolio turnover rate may indicate higher transaction costs and may result in higher taxes when Fund shares are held in a taxable account. These costs, which are not reflected in annual fund operating expenses or in the example, affect the Fund's performance. During the most recent fiscal year, the Fund's portfolio turnover rate was 56% of the average value of its portfolio.
|
|
| Portfolio Turnover, Rate |
rr_PortfolioTurnoverRate |
56.00%
|
|
| Strategy [Heading] |
rr_StrategyHeading |
Principal Investment Strategies
|
|
| Strategy Narrative [Text Block] |
rr_StrategyNarrativeTextBlock |
Under normal circumstances, we invest:
-
at least 80% of the Fund's net assets in income-producing debt securities;
-
up to 25% of the Fund's total assets in U.S. dollar-denominated debt securities of foreign issuers; and
-
up to 15% of the Fund's total assets in below investment-grade debt securities.
We invest principally in income-producing debt securities. Our portfolio holdings may include U.S. Government obligations, corporate debt securities, bank loans and mortgage- and asset-backed debt securities. These securities may have fixed, floating or variable rates. We may invest in investment-grade and below investment-grade debt securities (often called "high-yield" securities or "junk bonds"), as well as in debt securities of both domestic and foreign issuers. As part of our below investment-grade debt securities investment strategy, we will generally invest in securities that are rated at least BB by Standard & Poor's or Ba by Moody's, or an equivalent quality rating from another Nationally Recognized Statistical Ratings Organization, or are deemed by us to be of comparable quality. We may also use futures for duration and yield curve management. While we may purchase securities of any maturity, under normal circumstances, we expect the Fund's dollar-weighted average effective maturity to be one year or less. "Dollar-Weighted Average Effective Maturity" is a measure of the average time until the final payment of principal and interest is due on fixed income securities in the Fund's portfolio.
We employ a top-down, macroeconomic outlook to determine the portfolio's duration, yield curve positioning, credit quality and sector allocation. Macroeconomic factors considered may include, among others, the pace of economic growth, employment conditions, corporate profits, inflation, monetary and fiscal policy, as well as the influence of international economic and financial conditions. In combination with our top-down, macroeconomic approach, we employ a bottom-up process of fundamental securities analysis to select the specific securities for investment. Elements of this evaluation may include credit research, duration measurements, historical yield spread relationships, volatility trends, mortgage refinance rates, as well as other factors. Our credit analysis may consider an issuer's general financial condition, its competitive position and its management strategies, as well as industry characteristics and other factors. We may sell a security due to changes in credit characteristics or outlook, as well as changes in portfolio strategy or cash flow needs. A security may also be sold and replaced with one that presents a better value or risk/reward profile.
|
|
| Risk [Heading] |
rr_RiskHeading |
Principal Investment Risks
|
|
| Risk Narrative [Text Block] |
rr_RiskNarrativeTextBlock |
An investment in the Fund may lose money, is not a deposit of Wells Fargo Bank, N.A. or its affiliates, is not insured or guaranteed by the Federal Deposit Insurance Corporation or any other governmental agency, and is primarily subject to the risks briefly summarized below.
Credit Risk. The issuer or guarantor of a debt security may be unable or perceived to be unable to pay interest or repay principal when they become due, which could cause the value of an investment to decline and a Fund to lose money.
Derivatives Risk. The use of derivatives, such as futures, options and swap agreements, can lead to losses, including those magnified by leverage, particularly when derivatives are used to enhance return rather than mitigate risk. Certain derivative instruments may be difficult to sell when the portfolio manager believes it would be appropriate to do so, or the other party to a derivative contract may be unwilling or unable to fulfill its contractual obligations.
Foreign Investment Risk. Foreign investments may be subject to lower liquidity, greater price volatility and risks related to adverse political, regulatory, market or economic developments. Foreign investments may involve exposure to changes in foreign currency exchange rates and may be subject to higher withholding and other taxes.
Futures Contracts Risk. A Fund that uses futures contracts, which are a type of derivative, is subject to the risk of loss caused by unanticipated market movements. In addition, there may at times be an imperfect correlation between the movement in the prices of futures contracts and the value of their underlying instruments or indexes and there may at times not be a liquid secondary market for certain futures contracts.
High Yield Securities Risk. High yield securities and unrated securities of similar credit quality (commonly known as "junk bonds") have a much greater risk of default or of not returning principal and their values tend to be more volatile than higher-rated securities with similar maturities.
Interest Rate Risk. When interest rates (which are currently near historic lows) rise, the value of debt securities tends to fall. When interest rates decline, interest that a Fund is able to earn on its investments in debt securities may also decline, but the value of those securities may increase.
Loan Risk. Loans may be unrated, less liquid and more difficult to value than traditional debt securities. The highly leveraged capital structure of the borrowers in such transactions may make such loans especially vulnerable to adverse changes in financial, economic or market conditions. A Fund may be unable to sell loans at a desired time or price. The Fund may also not be able to control amendments, waivers or the exercise of any remedies that a lender would have under a direct loan and may assume liability as a lender.
Management Risk. Investment decisions, techniques, analyses or models implemented by a Fund's manager or sub-adviser in seeking to achieve the Fund's investment objective may not produce the returns expected, may cause the Fund's shares to lose value or may cause the Fund to underperform other funds with similar investment objectives.
Market Risk. The values of, and/or the income generated by, securities held by a Fund may decline due to general market conditions or other factors, including those directly involving the issuers of such securities. Security markets are volatile and may decline significantly in response to adverse issuer, regulatory, political, or economic developments. Different sectors of the market and different security types may react differently to such developments.
Mortgage- and Asset-Backed Securities Risk. Mortgage- and asset-backed securities may decline in value and become less liquid when defaults on the underlying mortgages or assets occur and may exhibit additional volatility in periods of rising interest rates. Rising interest rates tend to extend the duration of these securities, making them more sensitive to changes in interest rates than instruments with fixed payment schedules. When interest rates decline or are low, the prepayment of mortgages or assets underlying such securities can reduce a Fund's returns.
U.S. Government Obligations Risk. U.S. Government obligations may be adversely impacted by changes in interest rates, and securities issued or guaranteed by U.S. Government agencies or government-sponsored entities may not be backed by the full faith and credit of the U.S. Government.
|
|
| Risk Lose Money [Text] |
rr_RiskLoseMoney |
An investment in the Fund may lose money
|
|
| Risk Not Insured Depository Institution [Text] |
rr_RiskNotInsuredDepositoryInstitution |
An investment in the Fund may lose money, is not a deposit of Wells Fargo Bank, N.A. or its affiliates, is not insured or guaranteed by the Federal Deposit Insurance Corporation or any other governmental agency
|
|
| Bar Chart and Performance Table [Heading] |
rr_BarChartAndPerformanceTableHeading |
Performance
|
|
| Performance Narrative [Text Block] |
rr_PerformanceNarrativeTextBlock |
The following information provides some indication of the risks of investing in the Fund by showing changes in the Fund's performance from year to year. The Fund's average annual total returns are compared to the performance of one or more indices. Past performance before and after taxes is no guarantee of future results. Current month-end performance is available on the Fund's website at wellsfargofunds.com.
|
|
| Bar Chart Closing [Text Block] |
rr_BarChartClosingTextBlock |
Highest Quarter: 3rd Quarter 2009 | +3.93% | | Lowest Quarter: 4th Quarter 2008 | -4.66% | Year-to-date total return as of 9/30/2017 is +1.23% |
|
|
| Performance Table Heading |
rr_PerformanceTableHeading |
Average Annual Total Returns for the periods ended 12/31/2016
|
|
| Performance Table Closing [Text Block] |
rr_PerformanceTableClosingTextBlock |
After-tax returns are calculated using the historical highest individual federal marginal income tax rates and do not reflect the impact of state, local or foreign taxes. Actual after-tax returns depend on an investor's tax situation and may differ from those shown, and after-tax returns shown are not relevant to tax-exempt investors or investors who hold their Fund shares through tax-deferred arrangements, such as 401(k) Plans or Individual Retirement Accounts.
|
|
| Performance Table Uses Highest Federal Rate |
rr_PerformanceTableUsesHighestFederalRate |
After-tax returns are calculated using the historical highest individual federal marginal income tax rates and do not reflect the impact of state, local or foreign taxes.
|
|
| Performance Table Not Relevant to Tax Deferred |
rr_PerformanceTableNotRelevantToTaxDeferred |
Actual after-tax returns depend on an investor's tax situation and may differ from those shown, and after-tax returns shown are not relevant to tax-exempt investors or investors who hold their Fund shares through tax-deferred arrangements, such as 401(k) Plans or Individual Retirement Accounts.
|
|
| Performance Past Does Not Indicate Future [Text] |
rr_PerformancePastDoesNotIndicateFuture |
Past performance before and after taxes is no guarantee of future results.
|
|
| Performance Information Illustrates Variability of Returns [Text] |
rr_PerformanceInformationIllustratesVariabilityOfReturns |
The following information provides some indication of the risks of investing in the Fund by showing changes in the Fund's performance from year to year. The Fund's average annual total returns are compared to the performance of one or more indices. Past performance before and after taxes is no guarantee of future results.
|
|
| Performance Availability Website Address [Text] |
rr_PerformanceAvailabilityWebSiteAddress |
wellsfargofunds.com
|
|
| (WFA Income Funds - Institutional Class) | (Wells Fargo Ultra Short-Term Income Fund) | Bloomberg Barclays Short-Term U.S. Government/Credit Bond Index (reflects no deduction for fees, expenses, or taxes) |
|
|
|
| Prospectus: |
rr_ProspectusTable |
|
|
| 1 Year |
rr_AverageAnnualReturnYear01 |
0.80%
|
|
| 5 Years |
rr_AverageAnnualReturnYear05 |
0.37%
|
|
| 10 Years |
rr_AverageAnnualReturnYear10 |
1.34%
|
|
| (WFA Income Funds - Institutional Class) | (Wells Fargo Ultra Short-Term Income Fund) | Institutional Class |
|
|
|
| Prospectus: |
rr_ProspectusTable |
|
|
| Maximum sales charge (load) imposed on purchases (as a percentage of offering price) |
rr_MaximumSalesChargeImposedOnPurchasesOverOfferingPrice |
none
|
|
| Maximum deferred sales charge (load) (as a percentage of offering price) |
rr_MaximumDeferredSalesChargeOverOfferingPrice |
none
|
|
| Management Fees |
rr_ManagementFeesOverAssets |
0.34%
|
|
| Distribution (12b-1) Fees |
rr_DistributionAndService12b1FeesOverAssets |
none
|
|
| Other Expenses |
rr_OtherExpensesOverAssets |
0.12%
|
|
| Acquired Fund Fees and Expenses |
rr_AcquiredFundFeesAndExpensesOverAssets |
0.01%
|
|
| Total Annual Fund Operating Expenses |
rr_ExpensesOverAssets |
0.47%
|
|
| Fee Waivers |
rr_FeeWaiverOrReimbursementOverAssets |
(0.11%)
|
|
| Total Annual Fund Operating Expenses After Fee Waivers |
rr_NetExpensesOverAssets |
0.36%
|
[43] |
| Expense Example, with Redemption, 1 Year |
rr_ExpenseExampleYear01 |
$ 37
|
|
| Expense Example, with Redemption, 3 Years |
rr_ExpenseExampleYear03 |
140
|
|
| Expense Example, with Redemption, 5 Years |
rr_ExpenseExampleYear05 |
252
|
|
| Expense Example, with Redemption, 10 Years |
rr_ExpenseExampleYear10 |
$ 581
|
|
| Bar Chart [Heading] |
rr_BarChartHeading |
Calendar Year Total Returns for Institutional Class as of 12/31 each year
|
|
| Annual Return 2007 |
rr_AnnualReturn2007 |
3.65%
|
|
| Annual Return 2008 |
rr_AnnualReturn2008 |
(6.52%)
|
|
| Annual Return 2009 |
rr_AnnualReturn2009 |
9.05%
|
|
| Annual Return 2010 |
rr_AnnualReturn2010 |
4.10%
|
|
| Annual Return 2011 |
rr_AnnualReturn2011 |
0.74%
|
|
| Annual Return 2012 |
rr_AnnualReturn2012 |
2.27%
|
|
| Annual Return 2013 |
rr_AnnualReturn2013 |
0.82%
|
|
| Annual Return 2014 |
rr_AnnualReturn2014 |
0.51%
|
|
| Annual Return 2015 |
rr_AnnualReturn2015 |
0.52%
|
|
| Annual Return 2016 |
rr_AnnualReturn2016 |
1.73%
|
|
| Year to Date Return, Label |
rr_YearToDateReturnLabel |
Year-to-date total return as of 9/30/2017 is +1.23%
|
|
| Bar Chart, Year to Date Return |
rr_BarChartYearToDateReturn |
1.23%
|
|
| Bar Chart, Year to Date Return, Date |
rr_BarChartYearToDateReturnDate |
Sep. 30, 2017
|
|
| Highest Quarterly Return, Label |
rr_HighestQuarterlyReturnLabel |
Highest Quarter: 3rd Quarter 2009
|
|
| Highest Quarterly Return |
rr_BarChartHighestQuarterlyReturn |
3.93%
|
|
| Highest Quarterly Return, Date |
rr_BarChartHighestQuarterlyReturnDate |
Sep. 30, 2009
|
|
| Lowest Quarterly Return, Label |
rr_LowestQuarterlyReturnLabel |
Lowest Quarter: 4th Quarter 2008
|
|
| Lowest Quarterly Return |
rr_BarChartLowestQuarterlyReturn |
(4.66%)
|
|
| Lowest Quarterly Return, Date |
rr_BarChartLowestQuarterlyReturnDate |
Dec. 31, 2008
|
|
| 1 Year |
rr_AverageAnnualReturnYear01 |
1.73%
|
|
| 5 Years |
rr_AverageAnnualReturnYear05 |
1.17%
|
|
| 10 Years |
rr_AverageAnnualReturnYear10 |
1.62%
|
|
| Inception Date of Share Class |
rr_AverageAnnualReturnInceptionDate |
Aug. 31, 1999
|
|
| (WFA Income Funds - Institutional Class) | (Wells Fargo Ultra Short-Term Income Fund) | Institutional Class | (after taxes on distributions) |
|
|
|
| Prospectus: |
rr_ProspectusTable |
|
|
| 1 Year |
rr_AverageAnnualReturnYear01 |
1.13%
|
|
| 5 Years |
rr_AverageAnnualReturnYear05 |
0.68%
|
|
| 10 Years |
rr_AverageAnnualReturnYear10 |
0.76%
|
|
| Inception Date of Share Class |
rr_AverageAnnualReturnInceptionDate |
Aug. 31, 1999
|
|
| (WFA Income Funds - Institutional Class) | (Wells Fargo Ultra Short-Term Income Fund) | Institutional Class | (after taxes on distributions and the sale of Fund Shares) |
|
|
|
| Prospectus: |
rr_ProspectusTable |
|
|
| 1 Year |
rr_AverageAnnualReturnYear01 |
0.98%
|
|
| 5 Years |
rr_AverageAnnualReturnYear05 |
0.68%
|
|
| 10 Years |
rr_AverageAnnualReturnYear10 |
0.92%
|
|
| Inception Date of Share Class |
rr_AverageAnnualReturnInceptionDate |
Aug. 31, 1999
|
|
| (WFA Income Funds - Class R6) | (Wells Fargo Core Plus Bond Fund) |
|
|
|
| Prospectus: |
rr_ProspectusTable |
|
|
| Objective [Heading] |
rr_ObjectiveHeading |
Investment Objective
|
|
| Objective, Primary [Text Block] |
rr_ObjectivePrimaryTextBlock |
The Fund seeks total return, consisting of current income and capital appreciation.
|
|
| Expense [Heading] |
rr_ExpenseHeading |
Fees and Expenses
|
|
| Expense Narrative [Text Block] |
rr_ExpenseNarrativeTextBlock |
These tables are intended to help you understand the various costs and expenses you will pay if you buy and hold shares of the Fund.
|
|
| Shareholder Fees Caption [Text] |
rr_ShareholderFeesCaption |
Shareholder Fees (fees paid directly from your investment)
|
|
| Operating Expenses Caption [Text] |
rr_OperatingExpensesCaption |
Annual Fund Operating Expenses (expenses that you pay each year as a percentage of the value of your investment)
|
|
| Fee Waiver or Reimbursement over Assets, Date of Termination |
rr_FeeWaiverOrReimbursementOverAssetsDateOfTermination |
December 31, 2018
|
|
| Expense Example [Heading] |
rr_ExpenseExampleHeading |
Example of Expenses
|
|
| Expense Example Narrative [Text Block] |
rr_ExpenseExampleNarrativeTextBlock |
The example below is intended to help you compare the costs of investing in the Fund with the costs of investing in other mutual funds. The example assumes a $10,000 initial investment, 5% annual total return, and that fees and expenses remain the same as in the tables above. To the extent that the Manager is waiving fees or reimbursing expenses, the example assumes that such waiver or reimbursement will only be in place through the date noted above. Although your actual costs may be higher or lower, based on these assumptions your costs would be:
|
|
| Portfolio Turnover [Heading] |
rr_PortfolioTurnoverHeading |
Portfolio Turnover
|
|
| Portfolio Turnover [Text Block] |
rr_PortfolioTurnoverTextBlock |
The Fund pays transaction costs, such as commissions, when it buys and sells securities (or "turns over" its portfolio). A higher portfolio turnover rate may indicate higher transaction costs and may result in higher taxes when Fund shares are held in a taxable account. These costs, which are not reflected in annual fund operating expenses or in the example, affect the Fund's performance. During the most recent fiscal year, the Fund's portfolio turnover rate was 199% of the average value of its portfolio.
|
|
| Portfolio Turnover, Rate |
rr_PortfolioTurnoverRate |
199.00%
|
|
| Strategy [Heading] |
rr_StrategyHeading |
Principal Investment Strategies
|
|
| Strategy Narrative [Text Block] |
rr_StrategyNarrativeTextBlock |
Under normal circumstances, we invest:
-
at least 80% of the Fund's net assets in debt securities;
-
up to 35% of the Fund's total assets in debt securities that are below investment-grade; and
-
up to 25% of the Fund's total assets in debt securities of foreign issuers, including emerging markets issuers and debt securities denominated in foreign currencies.
We invest principally in debt securities, including corporate, mortgage- and asset-backed securities, bank loans, foreign sovereign debt, supranational agencies, and U.S. Government obligations. These securities may have fixed, floating or variable rates and may include debt securities of both domestic and foreign issuers. We invest in both investment-grade and below investment-grade debt securities (often called "high yield" securities or "junk bonds"), including unrated securities, as well as securities that are in default at the time of purchase.
We may invest in debt securities of foreign issuers, including emerging markets issuers, denominated in any currency. We may seek to add yield by having exposures to a variety of credits, mortgages, and higher yielding countries and currencies. We may also use futures and swap agreements to manage risk or to enhance return. We may enter into currency-related transactions through derivative instruments, including currency and cross currency forwards. The use of derivative currency transactions is intended to allow the Fund to manage, hedge or reduce a foreign currency-specific risk exposure of a portfolio security or its denominated currency or to obtain net long exposure to selected currencies for the purpose of generating income or additional returns.
While we may purchase securities of any maturity or duration, under normal circumstances, we expect to maintain an overall portfolio dollar-weighted average effective duration that is within 1 year of that of the Fund's benchmark. The Fund's benchmark, the Bloomberg Barclays U.S. Aggregate Bond Index, had a duration of 5.90 years, as of November 30, 2017. "Dollar-Weighted Average Effective Duration" is an aggregate measure of the sensitivity of a fund's fixed income portfolio securities to changes in interest rates. As a general matter, the price of a fixed income security with a longer effective duration will fluctuate more in response to changes in interest rates than the price of a fixed income security with a shorter effective duration.
|
|
| Risk [Heading] |
rr_RiskHeading |
Principal Investment Risks
|
|
| Risk Narrative [Text Block] |
rr_RiskNarrativeTextBlock |
An investment in the Fund may lose money, is not a deposit of Wells Fargo Bank, N.A. or its affiliates, is not insured or guaranteed by the Federal Deposit Insurance Corporation or any other governmental agency, and is primarily subject to the risks briefly summarized below.
Credit Risk. The issuer or guarantor of a debt security may be unable or perceived to be unable to pay interest or repay principal when they become due, which could cause the value of an investment to decline and a Fund to lose money.
Derivatives Risk. The use of derivatives, such as futures, options and swap agreements, can lead to losses, including those magnified by leverage, particularly when derivatives are used to enhance return rather than mitigate risk. Certain derivative instruments may be difficult to sell when the portfolio manager believes it would be appropriate to do so, or the other party to a derivative contract may be unwilling or unable to fulfill its contractual obligations.
Emerging Markets Risk. Emerging market securities typically present even greater exposure to the risks described under "Foreign Investment Risk" and may be particularly sensitive to global economic conditions. Emerging market securities are also typically less liquid than securities of developed countries and could be difficult to sell, particularly during a market downturn.
Foreign Currency Contracts Risk. A Fund that enters into forwards or other foreign currency contracts, which are a type of derivative, is subject to the risk that the portfolio manager may be incorrect in his or her judgment of future exchange rate changes.
Foreign Investment Risk. Foreign investments may be subject to lower liquidity, greater price volatility and risks related to adverse political, regulatory, market or economic developments. Foreign investments may involve exposure to changes in foreign currency exchange rates and may be subject to higher withholding and other taxes.
Futures Contracts Risk. A Fund that uses futures contracts, which are a type of derivative, is subject to the risk of loss caused by unanticipated market movements. In addition, there may at times be an imperfect correlation between the movement in the prices of futures contracts and the value of their underlying instruments or indexes and there may at times not be a liquid secondary market for certain futures contracts.
High Yield Securities Risk. High yield securities and unrated securities of similar credit quality (commonly known as "junk bonds") have a much greater risk of default or of not returning principal and their values tend to be more volatile than higher-rated securities with similar maturities.
Interest Rate Risk. When interest rates (which are currently near historic lows) rise, the value of debt securities tends to fall. When interest rates decline, interest that a Fund is able to earn on its investments in debt securities may also decline, but the value of those securities may increase.
Loan Risk. Loans may be unrated, less liquid and more difficult to value than traditional debt securities. The highly leveraged capital structure of the borrowers in such transactions may make such loans especially vulnerable to adverse changes in financial, economic or market conditions. A Fund may be unable to sell loans at a desired time or price. The Fund may also not be able to control amendments, waivers or the exercise of any remedies that a lender would have under a direct loan and may assume liability as a lender.
Management Risk. Investment decisions, techniques, analyses or models implemented by a Fund's manager or sub-adviser in seeking to achieve the Fund's investment objective may not produce the returns expected, may cause the Fund's shares to lose value or may cause the Fund to underperform other funds with similar investment objectives.
Market Risk. The values of, and/or the income generated by, securities held by a Fund may decline due to general market conditions or other factors, including those directly involving the issuers of such securities. Security markets are volatile and may decline significantly in response to adverse issuer, regulatory, political, or economic developments. Different sectors of the market and different security types may react differently to such developments.
Mortgage- and Asset-Backed Securities Risk. Mortgage- and asset-backed securities may decline in value and become less liquid when defaults on the underlying mortgages or assets occur and may exhibit additional volatility in periods of rising interest rates. Rising interest rates tend to extend the duration of these securities, making them more sensitive to changes in interest rates than instruments with fixed payment schedules. When interest rates decline or are low, the prepayment of mortgages or assets underlying such securities can reduce a Fund's returns.
Swaps Risk. Depending on their structure, swap agreements and options to enter into swap agreements ("swaptions"), both of which are types of derivatives, may increase or decrease a Fund's exposure to long- or short-term interest rates, foreign currency values, mortgage-backed securities, corporate borrowing rates, or credit events or other reference points such as security prices or inflation rates.
U.S. Government Obligations Risk. U.S. Government obligations may be adversely impacted by changes in interest rates, and securities issued or guaranteed by U.S. Government agencies or government-sponsored entities may not be backed by the full faith and credit of the U.S. Government.
|
|
| Risk Lose Money [Text] |
rr_RiskLoseMoney |
An investment in the Fund may lose money
|
|
| Risk Not Insured Depository Institution [Text] |
rr_RiskNotInsuredDepositoryInstitution |
An investment in the Fund may lose money, is not a deposit of Wells Fargo Bank, N.A. or its affiliates, is not insured or guaranteed by the Federal Deposit Insurance Corporation or any other governmental agency
|
|
| Bar Chart and Performance Table [Heading] |
rr_BarChartAndPerformanceTableHeading |
Performance
|
|
| Performance Narrative [Text Block] |
rr_PerformanceNarrativeTextBlock |
The following information provides some indication of the risks of investing in the Fund by showing changes in the Fund's performance from year to year. The Fund's average annual total returns are compared to the performance of one or more indices. Past performance before and after taxes is no guarantee of future results. Current month-end performance is available on the Fund's website at wellsfargofunds.com.
|
|
| Bar Chart Closing [Text Block] |
rr_BarChartClosingTextBlock |
Highest Quarter: 3rd Quarter 2009 | +5.61% | | Lowest Quarter: 2nd Quarter 2013 | -2.66% | Year-to-date total return as of 9/30/2017 is +5.04% |
|
|
| Performance Table Heading |
rr_PerformanceTableHeading |
Average Annual Total Returns for the periods ended 12/31/2016
|
[44] |
| Performance Past Does Not Indicate Future [Text] |
rr_PerformancePastDoesNotIndicateFuture |
Past performance before and after taxes is no guarantee of future results.
|
|
| Performance Information Illustrates Variability of Returns [Text] |
rr_PerformanceInformationIllustratesVariabilityOfReturns |
The following information provides some indication of the risks of investing in the Fund by showing changes in the Fund's performance from year to year. The Fund's average annual total returns are compared to the performance of one or more indices. Past performance before and after taxes is no guarantee of future results.
|
|
| Performance Availability Website Address [Text] |
rr_PerformanceAvailabilityWebSiteAddress |
wellsfargofunds.com
|
|
| (WFA Income Funds - Class R6) | (Wells Fargo Core Plus Bond Fund) | Bloomberg Barclays U.S. Aggregate Bond Index (reflects no deduction for fees, expenses, or taxes) |
|
|
|
| Prospectus: |
rr_ProspectusTable |
|
|
| 1 Year |
rr_AverageAnnualReturnYear01 |
2.65%
|
|
| 5 Years |
rr_AverageAnnualReturnYear05 |
2.23%
|
|
| 10 Years |
rr_AverageAnnualReturnYear10 |
4.34%
|
|
| (WFA Income Funds - Class R6) | (Wells Fargo Core Plus Bond Fund) | Class R6 |
|
|
|
| Prospectus: |
rr_ProspectusTable |
|
|
| Maximum sales charge (load) imposed on purchases (as a percentage of offering price) |
rr_MaximumSalesChargeImposedOnPurchasesOverOfferingPrice |
none
|
|
| Maximum deferred sales charge (load) (as a percentage of offering price) |
rr_MaximumDeferredSalesChargeOverOfferingPrice |
none
|
|
| Management Fees |
rr_ManagementFeesOverAssets |
0.45%
|
|
| Distribution (12b-1) Fees |
rr_DistributionAndService12b1FeesOverAssets |
none
|
|
| Other Expenses |
rr_OtherExpensesOverAssets |
0.10%
|
|
| Acquired Fund Fees and Expenses |
rr_AcquiredFundFeesAndExpensesOverAssets |
0.01%
|
|
| Total Annual Fund Operating Expenses |
rr_ExpensesOverAssets |
0.56%
|
|
| Fee Waivers |
rr_FeeWaiverOrReimbursementOverAssets |
(0.20%)
|
|
| Total Annual Fund Operating Expenses After Fee Waivers |
rr_NetExpensesOverAssets |
0.36%
|
[45] |
| Expense Example, with Redemption, 1 Year |
rr_ExpenseExampleYear01 |
$ 37
|
|
| Expense Example, with Redemption, 3 Years |
rr_ExpenseExampleYear03 |
159
|
|
| Expense Example, with Redemption, 5 Years |
rr_ExpenseExampleYear05 |
293
|
|
| Expense Example, with Redemption, 10 Years |
rr_ExpenseExampleYear10 |
$ 682
|
|
| Bar Chart [Heading] |
rr_BarChartHeading |
Calendar Year Total Returns for Class R6 as of 12/31 each year
|
[44] |
| Annual Return 2007 |
rr_AnnualReturn2007 |
6.24%
|
|
| Annual Return 2008 |
rr_AnnualReturn2008 |
2.44%
|
|
| Annual Return 2009 |
rr_AnnualReturn2009 |
12.19%
|
|
| Annual Return 2010 |
rr_AnnualReturn2010 |
8.31%
|
|
| Annual Return 2011 |
rr_AnnualReturn2011 |
8.14%
|
|
| Annual Return 2012 |
rr_AnnualReturn2012 |
5.98%
|
|
| Annual Return 2013 |
rr_AnnualReturn2013 |
(1.22%)
|
|
| Annual Return 2014 |
rr_AnnualReturn2014 |
6.73%
|
|
| Annual Return 2015 |
rr_AnnualReturn2015 |
0.29%
|
|
| Annual Return 2016 |
rr_AnnualReturn2016 |
5.97%
|
|
| Year to Date Return, Label |
rr_YearToDateReturnLabel |
Year-to-date total return as of 9/30/2017 is +5.04%
|
|
| Bar Chart, Year to Date Return |
rr_BarChartYearToDateReturn |
5.04%
|
|
| Bar Chart, Year to Date Return, Date |
rr_BarChartYearToDateReturnDate |
Sep. 30, 2017
|
|
| Highest Quarterly Return, Label |
rr_HighestQuarterlyReturnLabel |
Highest Quarter: 3rd Quarter 2009
|
|
| Highest Quarterly Return |
rr_BarChartHighestQuarterlyReturn |
5.61%
|
|
| Highest Quarterly Return, Date |
rr_BarChartHighestQuarterlyReturnDate |
Sep. 30, 2009
|
|
| Lowest Quarterly Return, Label |
rr_LowestQuarterlyReturnLabel |
Lowest Quarter: 2nd Quarter 2013
|
|
| Lowest Quarterly Return |
rr_BarChartLowestQuarterlyReturn |
(2.66%)
|
|
| Lowest Quarterly Return, Date |
rr_BarChartLowestQuarterlyReturnDate |
Jun. 30, 2013
|
|
| 1 Year |
rr_AverageAnnualReturnYear01 |
5.97%
|
|
| 5 Years |
rr_AverageAnnualReturnYear05 |
3.50%
|
|
| 10 Years |
rr_AverageAnnualReturnYear10 |
5.44%
|
|
| Inception Date of Share Class |
rr_AverageAnnualReturnInceptionDate |
Oct. 31, 2016
|
|
| (WFA Income Funds - Class R6) | (Wells Fargo Core Plus Bond Fund) | Class R6 | (after taxes on distributions) |
|
|
|
| Prospectus: |
rr_ProspectusTable |
|
|
| 1 Year |
rr_AverageAnnualReturnYear01 |
4.57%
|
|
| 5 Years |
rr_AverageAnnualReturnYear05 |
2.28%
|
|
| 10 Years |
rr_AverageAnnualReturnYear10 |
3.99%
|
|
| Inception Date of Share Class |
rr_AverageAnnualReturnInceptionDate |
Oct. 31, 2016
|
|
| (WFA Income Funds - Class R6) | (Wells Fargo Core Plus Bond Fund) | Class R6 | (after taxes on distributions and the sale of Fund Shares) |
|
|
|
| Prospectus: |
rr_ProspectusTable |
|
|
| 1 Year |
rr_AverageAnnualReturnYear01 |
3.38%
|
|
| 5 Years |
rr_AverageAnnualReturnYear05 |
2.21%
|
|
| 10 Years |
rr_AverageAnnualReturnYear10 |
3.70%
|
|
| Inception Date of Share Class |
rr_AverageAnnualReturnInceptionDate |
Oct. 31, 2016
|
|
| (WFA Income Funds - Class R6) | (Wells Fargo Short Duration Government Bond Fund) |
|
|
|
| Prospectus: |
rr_ProspectusTable |
|
|
| Objective [Heading] |
rr_ObjectiveHeading |
Investment Objective
|
|
| Objective, Primary [Text Block] |
rr_ObjectivePrimaryTextBlock |
The Fund seeks to provide current income consistent with capital preservation.
|
|
| Expense [Heading] |
rr_ExpenseHeading |
Fees and Expenses
|
|
| Expense Narrative [Text Block] |
rr_ExpenseNarrativeTextBlock |
These tables are intended to help you understand the various costs and expenses you will pay if you buy and hold shares of the Fund.
|
|
| Shareholder Fees Caption [Text] |
rr_ShareholderFeesCaption |
Shareholder Fees (fees paid directly from your investment)
|
|
| Operating Expenses Caption [Text] |
rr_OperatingExpensesCaption |
Annual Fund Operating Expenses (expenses that you pay each year as a percentage of the value of your investment)
|
|
| Fee Waiver or Reimbursement over Assets, Date of Termination |
rr_FeeWaiverOrReimbursementOverAssetsDateOfTermination |
December 31, 2018
|
|
| Expense Example [Heading] |
rr_ExpenseExampleHeading |
Example of Expenses
|
|
| Expense Example Narrative [Text Block] |
rr_ExpenseExampleNarrativeTextBlock |
The example below is intended to help you compare the costs of investing in the Fund with the costs of investing in other mutual funds. The example assumes a $10,000 initial investment, 5% annual total return, and that fees and expenses remain the same as in the tables above. To the extent that the Manager is waiving fees or reimbursing expenses, the example assumes that such waiver or reimbursement will only be in place through the date noted above. Although your actual costs may be higher or lower, based on these assumptions your costs would be:
|
|
| Portfolio Turnover [Heading] |
rr_PortfolioTurnoverHeading |
Portfolio Turnover
|
|
| Portfolio Turnover [Text Block] |
rr_PortfolioTurnoverTextBlock |
The Fund pays transaction costs, such as commissions, when it buys and sells securities (or "turns over" its portfolio). A higher portfolio turnover rate may indicate higher transaction costs and may result in higher taxes when Fund shares are held in a taxable account. These costs, which are not reflected in annual fund operating expenses or in the example, affect the Fund's performance. During the most recent fiscal year, the Fund's portfolio turnover rate was 348% of the average value of its portfolio.
|
|
| Portfolio Turnover, Rate |
rr_PortfolioTurnoverRate |
348.00%
|
|
| Strategy [Heading] |
rr_StrategyHeading |
Principal Investment Strategies
|
|
| Strategy Narrative [Text Block] |
rr_StrategyNarrativeTextBlock |
Under normal circumstances, we invest:
We invest principally in U.S. Government obligations, including debt securities issued or guaranteed by the U.S. Treasury, U.S. Government agencies or government-sponsored entities. We will purchase only securities that are rated, at the time of purchase, within the two highest rating categories assigned by a Nationally Recognized Statistical Ratings Organization, or are deemed by us to be of comparable quality. As part of our investment strategy, we may enter into mortgage dollar rolls. While we may purchase securities of any maturity or duration, under normal circumstances, we expect the portfolio's overall dollar-weighted average effective duration to be less than that of a 3-year U.S. Treasury note. "Dollar-Weighted Average Effective Duration" is an aggregate measure of the sensitivity of a fund's fixed income portfolio securities to changes in interest rates. As a general matter, the price of a fixed income security with a longer effective duration will fluctuate more in response to changes in interest rates than the price of a fixed income security with a shorter effective duration.
We invest in debt securities that we believe offer competitive returns and are undervalued, offering additional income and/or price appreciation potential, relative to other debt securities of similar credit quality and interest rate sensitivity. As part of our investment strategy, we invest in mortgage-backed securities guaranteed by U.S. Government agencies that we believe will sufficiently outperform U.S. Treasuries. We may sell a security that has achieved its desired return or if we believe the security or its sector has become overvalued. We may also sell a security if a more attractive opportunity becomes available or if the security is no longer attractive due to its risk profile or as a result of changes in the overall market environment.
|
|
| Risk [Heading] |
rr_RiskHeading |
Principal Investment Risks
|
|
| Risk Narrative [Text Block] |
rr_RiskNarrativeTextBlock |
An investment in the Fund may lose money, is not a deposit of Wells Fargo Bank, N.A. or its affiliates, is not insured or guaranteed by the Federal Deposit Insurance Corporation or any other governmental agency, and is primarily subject to the risks briefly summarized below.
Credit Risk. The issuer or guarantor of a debt security may be unable or perceived to be unable to pay interest or repay principal when they become due, which could cause the value of an investment to decline and a Fund to lose money.
Interest Rate Risk. When interest rates (which are currently near historic lows) rise, the value of debt securities tends to fall. When interest rates decline, interest that a Fund is able to earn on its investments in debt securities may also decline, but the value of those securities may increase.
Management Risk. Investment decisions, techniques, analyses or models implemented by a Fund's manager or sub-adviser in seeking to achieve the Fund's investment objective may not produce the returns expected, may cause the Fund's shares to lose value or may cause the Fund to underperform other funds with similar investment objectives.
Market Risk. The values of, and/or the income generated by, securities held by a Fund may decline due to general market conditions or other factors, including those directly involving the issuers of such securities. Security markets are volatile and may decline significantly in response to adverse issuer, regulatory, political, or economic developments. Different sectors of the market and different security types may react differently to such developments.
Mortgage- and Asset-Backed Securities Risk. Mortgage- and asset-backed securities may decline in value and become less liquid when defaults on the underlying mortgages or assets occur and may exhibit additional volatility in periods of rising interest rates. Rising interest rates tend to extend the duration of these securities, making them more sensitive to changes in interest rates than instruments with fixed payment schedules. When interest rates decline or are low, the prepayment of mortgages or assets underlying such securities can reduce a Fund's returns.
U.S. Government Obligations Risk. U.S. Government obligations may be adversely impacted by changes in interest rates, and securities issued or guaranteed by U.S. Government agencies or government-sponsored entities may not be backed by the full faith and credit of the U.S. Government.
|
|
| Risk Lose Money [Text] |
rr_RiskLoseMoney |
An investment in the Fund may lose money
|
|
| Risk Not Insured Depository Institution [Text] |
rr_RiskNotInsuredDepositoryInstitution |
An investment in the Fund may lose money, is not a deposit of Wells Fargo Bank, N.A. or its affiliates, is not insured or guaranteed by the Federal Deposit Insurance Corporation or any other governmental agency
|
|
| Bar Chart and Performance Table [Heading] |
rr_BarChartAndPerformanceTableHeading |
Performance
|
|
| Performance Narrative [Text Block] |
rr_PerformanceNarrativeTextBlock |
The following information provides some indication of the risks of investing in the Fund by showing changes in the Fund's performance from year to year. The Fund's average annual total returns are compared to the performance of one or more indices. Past performance is no guarantee of future results. Current month-end performance is available on the Fund's website at wellsfargofunds.com.
|
|
| Bar Chart Closing [Text Block] |
rr_BarChartClosingTextBlock |
Highest Quarter: 1st Quarter 2009 | +3.54% | | Lowest Quarter: 2nd Quarter 2013 | -0.45% | Year-to-date total return as of 9/30/2017 is +1.07% |
|
|
| Performance Table Heading |
rr_PerformanceTableHeading |
Average Annual Total Returns for the periods ended 12/31/2016
|
[46] |
| Performance Past Does Not Indicate Future [Text] |
rr_PerformancePastDoesNotIndicateFuture |
Past performance is no guarantee of future results.
|
|
| Performance Information Illustrates Variability of Returns [Text] |
rr_PerformanceInformationIllustratesVariabilityOfReturns |
The following information provides some indication of the risks of investing in the Fund by showing changes in the Fund's performance from year to year. The Fund's average annual total returns are compared to the performance of one or more indices. Past performance is no guarantee of future results.
|
|
| Performance Availability Website Address [Text] |
rr_PerformanceAvailabilityWebSiteAddress |
wellsfargofunds.com
|
|
| (WFA Income Funds - Class R6) | (Wells Fargo Short Duration Government Bond Fund) | Bloomberg Barclays U.S. 1-3 Year Government Bond Index (reflects no deduction for fees, expenses, or taxes) |
|
|
|
| Prospectus: |
rr_ProspectusTable |
|
|
| 1 Year |
rr_AverageAnnualReturnYear01 |
0.87%
|
|
| 5 Years |
rr_AverageAnnualReturnYear05 |
0.59%
|
|
| 10 Years |
rr_AverageAnnualReturnYear10 |
2.18%
|
|
| (WFA Income Funds - Class R6) | (Wells Fargo Short Duration Government Bond Fund) | Class R6 |
|
|
|
| Prospectus: |
rr_ProspectusTable |
|
|
| Maximum sales charge (load) imposed on purchases (as a percentage of offering price) |
rr_MaximumSalesChargeImposedOnPurchasesOverOfferingPrice |
none
|
|
| Maximum deferred sales charge (load) (as a percentage of offering price) |
rr_MaximumDeferredSalesChargeOverOfferingPrice |
none
|
|
| Management Fees |
rr_ManagementFeesOverAssets |
0.35%
|
|
| Distribution (12b-1) Fees |
rr_DistributionAndService12b1FeesOverAssets |
none
|
|
| Other Expenses |
rr_OtherExpensesOverAssets |
0.06%
|
|
| Total Annual Fund Operating Expenses |
rr_ExpensesOverAssets |
0.41%
|
|
| Fee Waivers |
rr_FeeWaiverOrReimbursementOverAssets |
(0.04%)
|
|
| Total Annual Fund Operating Expenses After Fee Waivers |
rr_NetExpensesOverAssets |
0.37%
|
[47] |
| Expense Example, with Redemption, 1 Year |
rr_ExpenseExampleYear01 |
$ 38
|
|
| Expense Example, with Redemption, 3 Years |
rr_ExpenseExampleYear03 |
128
|
|
| Expense Example, with Redemption, 5 Years |
rr_ExpenseExampleYear05 |
226
|
|
| Expense Example, with Redemption, 10 Years |
rr_ExpenseExampleYear10 |
$ 514
|
|
| Bar Chart [Heading] |
rr_BarChartHeading |
Calendar Year Total Returns for Class R6 as of 12/31 each year
|
[46] |
| Annual Return 2007 |
rr_AnnualReturn2007 |
6.25%
|
|
| Annual Return 2008 |
rr_AnnualReturn2008 |
4.39%
|
|
| Annual Return 2009 |
rr_AnnualReturn2009 |
7.28%
|
|
| Annual Return 2010 |
rr_AnnualReturn2010 |
3.94%
|
|
| Annual Return 2011 |
rr_AnnualReturn2011 |
2.46%
|
|
| Annual Return 2012 |
rr_AnnualReturn2012 |
2.48%
|
|
| Annual Return 2013 |
rr_AnnualReturn2013 |
0.06%
|
|
| Annual Return 2014 |
rr_AnnualReturn2014 |
1.01%
|
|
| Annual Return 2015 |
rr_AnnualReturn2015 |
0.60%
|
|
| Annual Return 2016 |
rr_AnnualReturn2016 |
1.27%
|
|
| Year to Date Return, Label |
rr_YearToDateReturnLabel |
Year-to-date total return as of 9/30/2017 is +1.07%
|
|
| Bar Chart, Year to Date Return |
rr_BarChartYearToDateReturn |
1.07%
|
|
| Bar Chart, Year to Date Return, Date |
rr_BarChartYearToDateReturnDate |
Sep. 30, 2017
|
|
| Highest Quarterly Return, Label |
rr_HighestQuarterlyReturnLabel |
Highest Quarter: 1st Quarter 2009
|
|
| Highest Quarterly Return |
rr_BarChartHighestQuarterlyReturn |
3.54%
|
|
| Highest Quarterly Return, Date |
rr_BarChartHighestQuarterlyReturnDate |
Mar. 31, 2009
|
|
| Lowest Quarterly Return, Label |
rr_LowestQuarterlyReturnLabel |
Lowest Quarter: 2nd Quarter 2013
|
|
| Lowest Quarterly Return |
rr_BarChartLowestQuarterlyReturn |
(0.45%)
|
|
| Lowest Quarterly Return, Date |
rr_BarChartLowestQuarterlyReturnDate |
Jun. 30, 2013
|
|
| 1 Year |
rr_AverageAnnualReturnYear01 |
1.27%
|
|
| 5 Years |
rr_AverageAnnualReturnYear05 |
1.08%
|
|
| 10 Years |
rr_AverageAnnualReturnYear10 |
2.95%
|
|
| Inception Date of Share Class |
rr_AverageAnnualReturnInceptionDate |
Nov. 30, 2012
|
|
| (WFA Income Funds - Class R6) | (Wells Fargo Short Duration Government Bond Fund) | Class R6 | (after taxes on distributions) |
|
|
|
| Prospectus: |
rr_ProspectusTable |
|
|
| 1 Year |
rr_AverageAnnualReturnYear01 |
0.41%
|
|
| 5 Years |
rr_AverageAnnualReturnYear05 |
0.28%
|
|
| 10 Years |
rr_AverageAnnualReturnYear10 |
1.86%
|
|
| Inception Date of Share Class |
rr_AverageAnnualReturnInceptionDate |
Nov. 30, 2012
|
|
| (WFA Income Funds - Class R6) | (Wells Fargo Short Duration Government Bond Fund) | Class R6 | (after taxes on distributions and the sale of Fund Shares) |
|
|
|
| Prospectus: |
rr_ProspectusTable |
|
|
| 1 Year |
rr_AverageAnnualReturnYear01 |
0.72%
|
|
| 5 Years |
rr_AverageAnnualReturnYear05 |
0.48%
|
|
| 10 Years |
rr_AverageAnnualReturnYear10 |
1.87%
|
|
| Inception Date of Share Class |
rr_AverageAnnualReturnInceptionDate |
Nov. 30, 2012
|
|
|
|