| ING MidCap Opportunities Fund | ||||||||||||||||||||||||||||||||||||||
| ING MidCap Opportunities Fund | ||||||||||||||||||||||||||||||||||||||
| INVESTMENT OBJECTIVE | ||||||||||||||||||||||||||||||||||||||
| The Fund seeks long-term capital appreciation. | ||||||||||||||||||||||||||||||||||||||
| FEES AND EXPENSES OF THE FUND | ||||||||||||||||||||||||||||||||||||||
| These tables describe the fees and expenses that you may pay if you buy and hold shares of the Fund. | ||||||||||||||||||||||||||||||||||||||
| Shareholder Fees Fees paid directly from your investment |
||||||||||||||||||||||||||||||||||||||
|
||||||||||||||||||||||||||||||||||||||
| Annual Fund Operating Expenses Expenses you pay each year as a % of the value of your investment |
||||||||||||||||||||||||||||||||||||||
|
||||||||||||||||||||||||||||||||||||||
| Expense Example $ | ||||||||||||||||||||||||||||||||||||||
| The Example is intended to help you compare the cost of investing in shares of the Fund with the costs of investing in other mutual funds. The Example assumes that you invest $10,000 in the Fund for the time periods indicated. The Example show costs if you sold (redeemed) your shares at the end of the period or continued to hold them. The Example also assumes that your investment had a 5% return each year and that the Fund’s operating expenses remain the same. Although your actual costs may be higher or lower, based on these assumptions your costs would be: | ||||||||||||||||||||||||||||||||||||||
|
||||||||||||||||||||||||||||||||||||||
|
||||||||||||||||||||||||||||||||||||||
| The Examples reflect applicable expense limitation agreements and/or waivers in effect, if any, for the one-year period and the first year of the three-, five-, and ten-year periods. | ||||||||||||||||||||||||||||||||||||||
| Portfolio Turnover % of average value of portfolio | ||||||||||||||||||||||||||||||||||||||
| The Fund pays transaction costs, such as commissions, when it buys and sells securities (or “turns over” its portfolio). A higher portfolio turnover rate may indicate higher transactions costs and may mean higher taxes if you are investing in a taxable account. These costs, which are not reflected in Annual Fund Operating Expenses or in the Expense Example, affect the Fund’s performance. During the most recent fiscal year, the Fund’s portfolio turnover rate was 89% of the average value of its portfolio. |
||||||||||||||||||||||||||||||||||||||
| PRINCIPAL INVESTMENT STRATEGIES | ||||||||||||||||||||||||||||||||||||||
| Under normal market conditions, the Fund invests at least 80% of its net assets (plus borrowings for investment purposes) in common stocks of mid-sized U.S. companies. The Fund will provide shareholders with at least 60 days’ prior notice of any change in this investment policy. The Fund normally invests in companies that the sub-adviser (“Sub-Adviser”) believes have above average prospects for growth. For this Fund, mid-sized companies are those companies with market capitalizations that fall within the range of companies in the Russell Midcap® Growth Index at the time of purchase. Capitalization of companies in the Russell Midcap® Growth Index will change with market conditions. The market capitalization of companies in the Russell Midcap® Growth Index as of June 29, 2012, ranged from $1.1 billion to $19.1 billion. The Fund may also invest in derivative instruments including futures or index futures that have a similar profile to the benchmark of the Fund. The Fund typically uses derivatives for the purpose of maintaining equity market exposure on its cash balance. The Fund may also invest in foreign securities. The Fund may invest in other investment companies, including exchange-traded funds, to the extent permitted under the Investment Company Act of 1940, as amended, and the rules, regulations, and exemptive orders thereunder (“1940 Act”). In managing the Fund, the Sub-Adviser uses a stock selection process that combines the discipline of quantitative screens with rigorous fundamental security analysis. The quantitative screens focus the fundamental analysis by identifying the stocks of companies with strong business momentum that demonstrate relative price strength, and have a perceived value not reflected in the current price. The objective of the fundamental analysis is to confirm the persistence of the company’s revenue and earnings growth and validate the Sub-Adviser’s expectations for earnings estimate revisions, particularly relative to consensus. A determination of reasonable valuation for individual securities is based on the judgment of the Sub-Adviser. The Sub-Adviser may sell securities for a variety of reasons, such as to secure gains, limit losses, or redeploy assets into opportunities believed to be more promising, among others. The Fund may lend portfolio securities on a short-term or long-term basis, up to 331 / 3 % of its total assets. |
||||||||||||||||||||||||||||||||||||||
| PRINCIPAL RISKS | ||||||||||||||||||||||||||||||||||||||
| You could lose money on an investment in the Fund. Any of the following risks, among others, could affect Fund performance or cause the Fund to lose money or to underperform market averages of other funds. Company The price of a given company’s stock could decline or underperform for many reasons including, among others, poor management, financial problems, or business challenges. If a company declares bankruptcy or becomes insolvent, its stock could become worthless. Currency To the extent that the Fund invests directly in foreign (non-U.S.) currencies or in securities denominated in, or that trade in, foreign (non-U.S.) currencies, it is subject to the risk that those foreign (non-U.S.) currencies will decline in value relative to the U.S. dollar or, in the case of hedging positions, that the U.S. dollar will decline in value relative to the currency being hedged. Derivative Instruments Derivative instruments are subject to a number of risks, including the risk of changes in the market price of the underlying securities, credit risk with respect to the counterparty, risk of loss due to changes in interest rates and liquidity risk. The use of certain derivatives may also have a leveraging effect which may increase the volatility of the Fund and reduce its returns. Derivatives may not perform as expected, so the Fund may not realize the intended benefits. When used for hedging, the change in value of a derivative may not correlate as expected with the currency, security or other risk being hedged. In addition, given their complexity, derivatives expose the Fund to the risk of improper valuation. Foreign Investments Investing in foreign (non-U.S.) securities may result in the Fund experiencing more rapid and extreme changes in value than a fund that invests exclusively in securities of U.S. companies due to: smaller markets; differing reporting, accounting, and auditing standards; nationalization, expropriation, or confiscatory taxation; foreign currency fluctuations, currency blockage, or replacement; potential for default on sovereign debt; or political changes or diplomatic developments. Markets and economies throughout the world are becoming increasingly interconnected, and conditions or events in one market, country or region may adversely impact investments or issuers in another market, country or region. Investment Model The manager’s proprietary model may not adequately allow for existing or unforeseen market factors or the interplay between such factors. Liquidity If a security is illiquid, the Fund might be unable to sell the security at a time when the Fund’s manager might wish to sell, and the security could have the effect of decreasing the overall level of the Fund’s liquidity. Further, the lack of an established secondary market may make it more difficult to value illiquid securities, which could vary from the amount the Fund could realize upon disposition. The Fund may make investments that become less liquid in response to market developments or adverse investor perception. The Fund could lose money if it cannot sell a security at the time and price that would be most beneficial to the Fund. Market Stock prices may be volatile and are affected by the real or perceived impacts of such factors as economic conditions and political events. Stock markets tend to be cyclical, with periods when stock prices generally rise and periods when stock prices generally decline. Any given stock market segment may remain out of favor with investors for a short or long period of time, and stocks as an asset class may underperform bonds or other asset classes during some periods. From time to time, the stock market may not favor the growth-oriented securities in which the Fund invests. Rather, the market could favor value-oriented securities or may not favor equities at all. Additionally, legislative, regulatory or tax policies or developments in these areas may adversely impact the investment techniques available to a manager, add to Fund costs and impair the ability of the Fund to achieve its investment objectives. Mid-Capitalization Company Investments in mid-capitalization companies may involve greater risk than is customarily associated with larger, more established companies due to the greater business risks of smaller size, limited markets and financial resources, narrow product lines and the frequent lack of depth of management. Consequently, the securities of smaller companies may have limited market stability and may be subject to more abrupt or erratic market movements than securities of larger, more established growth companies or the market averages in general. Other Investment Companies The main risk of investing in other investment companies, including exchange-traded funds, is the risk that the value of the securities underlying an investment company might decrease. Because the Fund may invest in other investment companies, you will pay a proportionate share of the expenses of those other investment companies (including management fees, administration fees, and custodial fees) in addition to the expenses of the Fund. Securities Lending Securities lending involves two primary risks: “investment risk” and “borrower default risk.” Investment risk is the risk that the Fund will lose money from the investment of the cash collateral received from the borrower. Borrower default risk is the risk that the Fund will lose money due to the failure of a borrower to return a borrowed security in a timely manner. An investment in the Fund is not a bank deposit and is not insured or guaranteed by the Federal Deposit Insurance Corporation, the Federal Reserve Board or any other government agency. |
||||||||||||||||||||||||||||||||||||||
| PERFORMANCE INFORMATION | ||||||||||||||||||||||||||||||||||||||
| The following information is intended to help you understand the risks of investing in the Fund. Because Class R6 shares of the Fund had not commenced operations as of the calendar year ended December 31, 2012, the following bar chart shows the changes in the Fund’s Class A shares’ performance from year to year, and the table compares the Fund’s Class A shares’ performance to the performance of a broad-based securities market index/indices for the same period. Class R6 shares and Class A shares of the Fund would have substantially similar performance because they invest in the same portfolio of securities. However, Class R6 shares’ performance would be higher than Class A shares’ performance because of the higher expenses paid by Class A shares. The Fund’s performance information reflects applicable fee waivers and/or expense limitations in effect during the period presented. Absent such fee waivers/expense limitations, if any, performance would have been lower. The bar chart shows the performance of the Fund’s Class A shares, but does not reflect the impact of contingent deferred sales charges. If it did, returns would be lower than those shown. The Fund’s past performance (before and after taxes) is no guarantee of future results. For the most recent performance figures, go to www.INGFunds.com/literature or call 1-800-992-0180. | ||||||||||||||||||||||||||||||||||||||
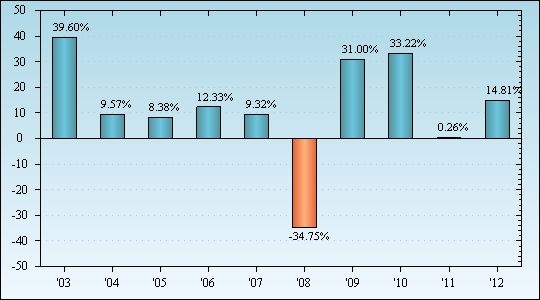
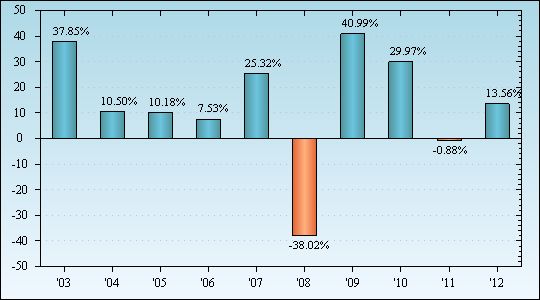
| Calendar Year Total Returns Class A (as of December 31 of each year) |
||||||||||||||||||||||||||||||||||||||
 |
||||||||||||||||||||||||||||||||||||||
| Best quarter: 2nd, 2003, 17.67% and Worst quarter: 4th, 2008, (23.42)% The Fund’s Class A shares’ year-to-date total return as of March 31, 2013: 10.62% |
||||||||||||||||||||||||||||||||||||||
| Average Annual Total Returns% (for the periods ended December 31, 2012) |
||||||||||||||||||||||||||||||||||||||
|
||||||||||||||||||||||||||||||||||||||
| After-tax returns are calculated using the historical highest individual federal marginal income tax rates and do not reflect the impact of state and local taxes. Actual after-tax returns depend on an investor’s tax situation and may differ from those shown, and the after-tax returns shown are not relevant to investors who hold their Fund shares through tax-deferred arrangements such as 401(k) plans or individual retirement accounts. In some cases the after-tax returns may exceed the return before taxes due to an assumed tax benefit from any losses on a sale of Fund shares at the end of the measurement period. | ||||||||||||||||||||||||||||||||||||||