| ULTRAJAPAN PROFUND | ||||||||||||||||||||||||||||||||||||||||||||
Important Information About the Fund The UltraJapan ProFund (the “Fund”) seeks investment results for a single day only, not for longer periods. The return of the Fund for periods longer than a single day will be the result of each day’s returns compounded over the period, which will very likely differ from two times (2x) the return of the Nikkei 225 Stock Average (the “Index”) for that period. For periods longer than a single day, the Fund will lose money when the level of the Index is flat over time, and it is possible that the Fund will lose money over time even if the level of the Index rises. Longer holding periods, higher index volatility and greater leverage each exacerbate the impact of compounding on a fund’s returns. During periods of higher Index volatility, the volatility of the Index may affect the Fund’s return as much as or more than the return of the Index. The percentage change of the Fund’s NAV per share each day may differ, perhaps significantly, from two times (2x) the percentage change of the Index on such day. This is due primarily to the time difference in determining the level of the Index (2:10 a.m., Eastern Time) and valuation of the Fund (4:00 p.m., Eastern Time). Because the level of the Index is not determined at the same time the Fund’s NAV is calculated, correlation to the Index will be measured by comparing the daily total return of the Fund’s NAV per share to the daily total return of one or more U.S. exchange-traded securities or instruments that reflect the values of the securities underlying the Index as of the Fund’s NAV calculation time. The Fund is different from most funds in that it seeks leveraged returns relative to the Index and only on a daily basis. The Fund also is riskier than similarly benchmarked funds that do not use leverage. Accordingly, the Fund may not be suitable for all investors and should be used only by knowledgeable investors who understand the potential consequences of seeking daily leveraged investment results. Shareholders should actively manage and monitor their investments, as frequently as daily. |
||||||||||||||||||||||||||||||||||||||||||||
| Investment Objective | ||||||||||||||||||||||||||||||||||||||||||||
| The Fund seeks daily investment results, before fees and expenses, that correspond to two times (2x) the daily performance of the Index. The Fund does not seek to achieve its stated investment objective over a period of time greater than a single day. The Fund seeks to provide a return consistent with two times (2x) an investment in the component equities in the Index hedged to U.S. dollars. The Fund determines its success in meeting this investment objective by comparing its daily return on a given day with two times (2x) the daily performance of the dollar-denominated Nikkei 225 futures contracts traded in the United States. |
||||||||||||||||||||||||||||||||||||||||||||
| Fees and Expenses of the Fund | ||||||||||||||||||||||||||||||||||||||||||||
| The table below describes the fees and expenses that you may pay if you buy or hold shares of the Fund. | ||||||||||||||||||||||||||||||||||||||||||||
| Shareholder Fees (fees paid directly from your investment) |
||||||||||||||||||||||||||||||||||||||||||||
|
||||||||||||||||||||||||||||||||||||||||||||
| Annual Fund Operating Expenses (expenses that you pay each year as a percentage of the value of your investment) |
||||||||||||||||||||||||||||||||||||||||||||
|
||||||||||||||||||||||||||||||||||||||||||||
| Example: | ||||||||||||||||||||||||||||||||||||||||||||
| This example is intended to help you compare the cost of investing in the Fund with the cost of investing in other mutual funds. The example assumes that you invest $10,000 in the Fund for the time periods indicated and then redeem all of your shares at the end of each period. The example also assumes that your investment has a 5% return each year and that the Fund’s operating expenses remain the same, except that the fee waiver/expense reimbursement is assumed only to pertain to the first year. Although your actual cost may be higher or lower, based on these assumptions your approximate costs would be: |
||||||||||||||||||||||||||||||||||||||||||||
|
||||||||||||||||||||||||||||||||||||||||||||
| The Fund pays transaction and financing costs associated with transacting in securities and derivatives. These costs are not reflected in the example or the table above. | ||||||||||||||||||||||||||||||||||||||||||||
| Portfolio Turnover | ||||||||||||||||||||||||||||||||||||||||||||
| The Fund pays transaction costs, such as commissions, when it buys and sells securities (or “turns over” its portfolio). A higher portfolio turnover may indicate higher transaction costs and may result in higher taxes when the Fund’s shares are held in a taxable account. These costs, which are not reflected in Annual Fund Operating Expenses or in the example above, affect the Fund’s performance. During the most recent fiscal year, the Fund’s annual portfolio turnover rate was 0% of the average value of its entire portfolio. This portfolio turnover rate is calculated without regard to cash instrument or derivatives transactions. If such transactions were included, the Fund’s portfolio turnover rate would be significantly higher. | ||||||||||||||||||||||||||||||||||||||||||||
| Principal Investment Strategies | ||||||||||||||||||||||||||||||||||||||||||||
| The Fund invests in derivatives that ProFund Advisors believes, in combination, should have similar daily return characteristics as two times (2x) the daily return of the Index. The Index is a modified price-weighted index of the 225 most actively traded and liquid Japanese companies listed in the First Section of the Tokyo Stock Exchange (“TSE”). The Index is calculated from the prices of the 225 TSE First Section stocks selected to represent a broad cross-section of Japanese industries and the overall performance of the Japanese equity market. Nihon Keizai Shimbun, Inc. is the sponsor of the Index. Companies in the Index are reviewed annually. Emphasis is placed on maintaining the Index’s historical continuity while keeping the Index composed of stocks with high market liquidity. The sponsor consults with various market experts, considers company-specific information and the overall composition of the Index. As of September 30, 2012, the Index included companies with capitalizations between $281.5 million and $134.4 billion. The average capitalization of the companies comprising the Index was approximately $9.6 billion. The Index is published under the Bloomberg ticker symbol “NKY.” The types of derivatives that the Fund will principally invest in are set forth below. Cash balances arising from the use of derivatives will typically be held in money market instruments.
The Fund may gain exposure to only a representative sample of the securities in the Index, which exposure is intended to have aggregate characteristics similar to those of the Index, and may invest in securities or financial instruments not contained in the Index. ProFund Advisors does not invest the assets of the Fund in securities or financial instruments based on ProFund Advisors’ view of the investment merit of a particular security, instrument, or company, other than for cash management purposes, nor does it conduct conventional research or analysis (other than in determining counterparty creditworthiness), or forecast market movement or trends, in managing the assets of the Fund. The Fund seeks to remain fully invested at all times in securities and/or financial instruments that, in combination, provide exposure to the Index without regard to market conditions, trends or direction. At the close of the U.S. securities markets each trading day, the Fund will seek to position its portfolio so that its exposure to the Index is consistent with the Fund’s investment objective. The Index’s movements during the day will affect whether the Fund’s portfolio needs to be repositioned. For example, if the Index has risen on a given day, net assets of the Fund should rise. As a result, the Fund’s exposure will need to be increased. Conversely, if the Index has fallen on a given day, net assets of the Fund should fall. As a result, the Fund’s exposure will need to be decreased. Because of daily rebalancing and the compounding of each day’s return over time, the return of the Fund for periods longer than a single day will be the result of each day’s returns compounded over the period, which will very likely differ from two times (2x) the return of the Index over the same period. The Fund will lose money when the level of the Index is flat over time, and it is possible that the Fund will lose money over time even if the level of the Index rises, as a result of daily rebalancing, the Index’s volatility and the effects of compounding. See “Principal Risks”, below. The Fund will concentrate its investments in a particular industry or group of industries to approximately the same extent as the Index is so concentrated. As of the close of business on September 30, 2012, the Index was concentrated in the consumer, cyclical industry and industrial industry groups, which comprised approximately 26% and 26%, respectively, of the market capitalization of the Index. Please see “Investment Objectives, Principal Investment Strategies and Related Risks” in the Fund’s full Prospectus for additional details. |
||||||||||||||||||||||||||||||||||||||||||||
| Principal Risks | ||||||||||||||||||||||||||||||||||||||||||||
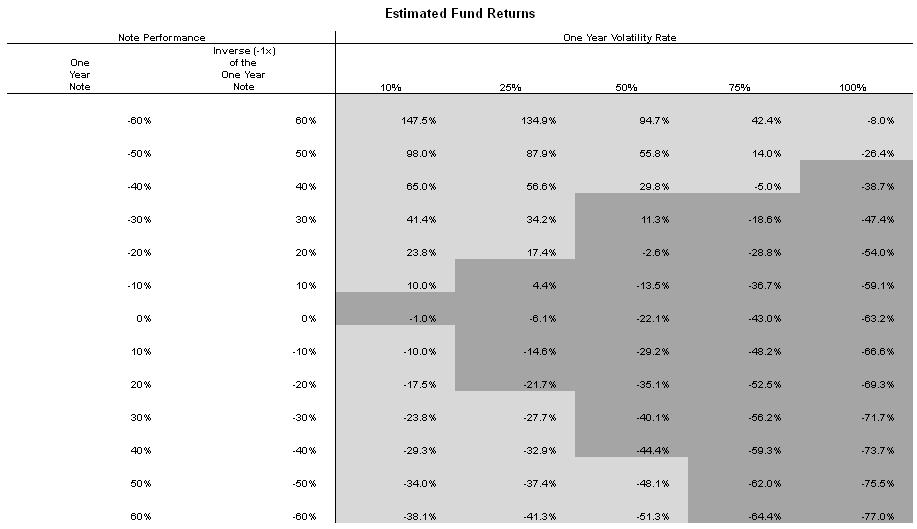
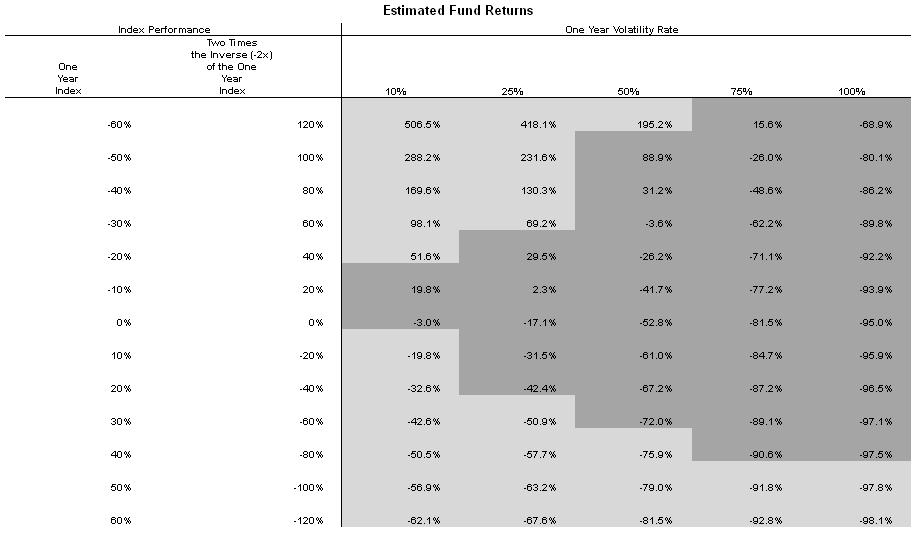
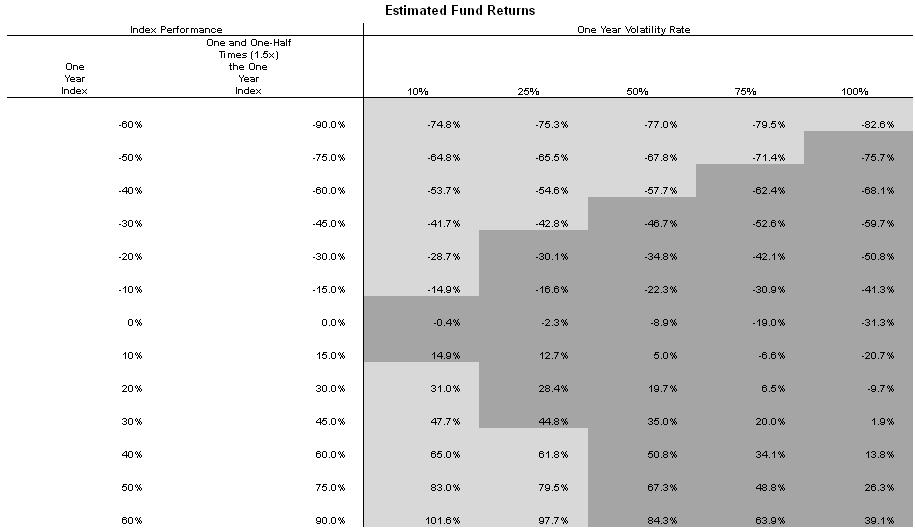
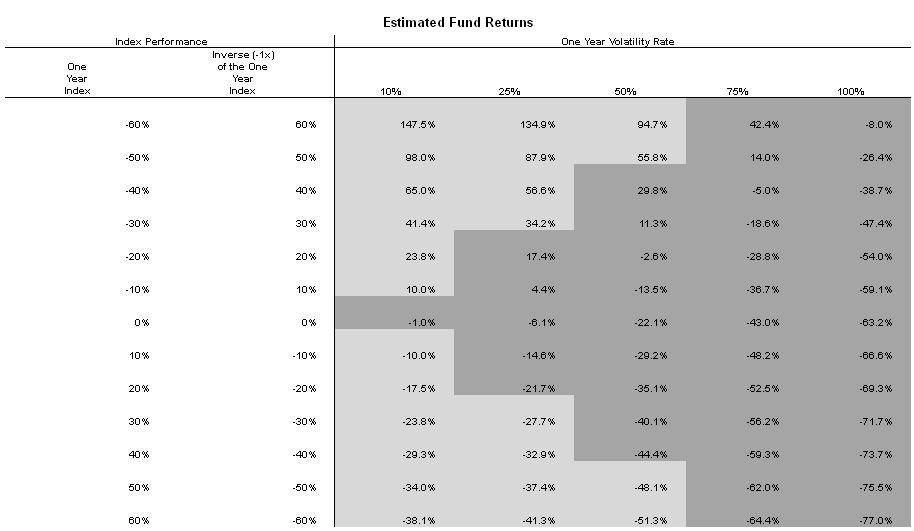
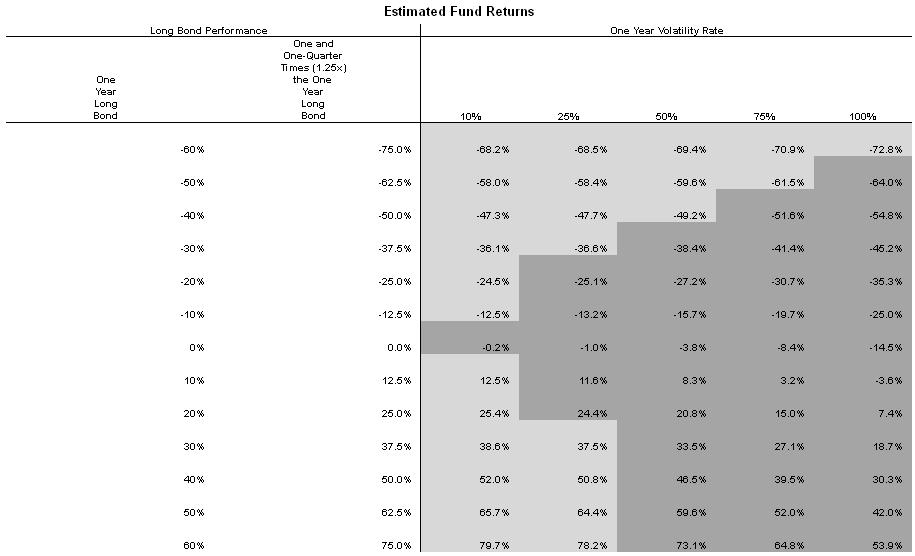
| You could lose money by investing in the Fund. Risks Associated with the Use of Derivatives - The Fund uses investment techniques, such as investing in derivatives, that may be considered aggressive. Investing in derivatives may expose the Fund to greater risks than investing directly in the reference asset(s) underlying those derivatives, such as counterparty risk, liquidity risk and increased correlation risk (each as discussed below). When the Fund uses derivatives, there may be imperfect correlation between the value of the reference asset(s) and the derivative, which may prevent the Fund from achieving its investment objective. Moreover, with respect to the use of swap agreements, if the Index has a dramatic intraday move that causes a material decline in the Fund's net assets, the terms of a swap agreement between the Fund and its counterparty may permit the counterparty to immediately close out the transaction with the Fund. In that event, the Fund may be unable to enter into another swap agreement or invest in other derivatives to achieve the desired exposure consistent with the Fund's investment objective. This, in turn, may prevent the Fund from achieving its investment objective, even if the Index reverses all or a portion of its intraday move by the end of the day. Any financing, borrowing and other costs associated with using derivatives may also have the effect of lowering the Fund's return. Leverage Risk - The Fund obtains investment exposure in excess of its assets in seeking to achieve its investment objective - a form of leverage - and will lose more money in market environments adverse to its daily objective than a similar fund that does not employ such leverage. The use of such leverage could result in the total loss of an investor's investment. For example, because the Fund includes a multiplier of two times (2x) the Index, a single day movement in the Index approaching 50% at any point in the day could result in the total loss of a shareholder's investment if that movement is contrary to the investment objective of the Fund, even if the Index subsequently moves in an opposite direction, eliminating all or a portion of the earlier movement. This would be the case with any such single day movements in the Index, even if the Index maintains a level greater than zero at all times. Compounding Risk - As a result of compounding and because the Fund has a single day investment objective, the Fund's performance for periods greater than a single day is likely to be either greater than or less than the Index performance times the stated multiple in the Fund's investment objective, before accounting for fees and fund expenses. Compounding affects all investments, but has a more significant impact on a leveraged fund. Particularly during periods of higher Index volatility, compounding will cause results for periods longer than a single day to vary from two times (2x) the return of the Index. This effect becomes more pronounced as volatility increases. Fund performance for periods greater than a single day can be estimated given any set of assumptions for the following factors: a) Index volatility; b) Index performance; c) period of time; d) financing rates associated with leveraged exposure; e) other Fund expenses; and f) dividends or interest paid with respect to securities in the Index. The chart below illustrates the impact of two principal factors - Index volatility and Index performance - on Fund performance. The chart shows estimated Fund returns for a number of combinations of Index volatility and Index performance over a one-year period. Performance shown in the chart assumes: (a) no dividends paid with respect to securities included in the Index; (b) no Fund expenses; and (c) borrowing/lending rates (to obtain leveraged exposure) of zero percent. If Fund expenses and/or actual borrowing/lending rates were reflected, the Fund's performance would be different than shown. Areas shaded darker represent those scenarios where the Fund can be expected to return less than two times (2x) the performance of the Index. For periods longer than a single day, the Fund will lose money when the level of the Index is flat and can even lose money when the level of the Index rises. 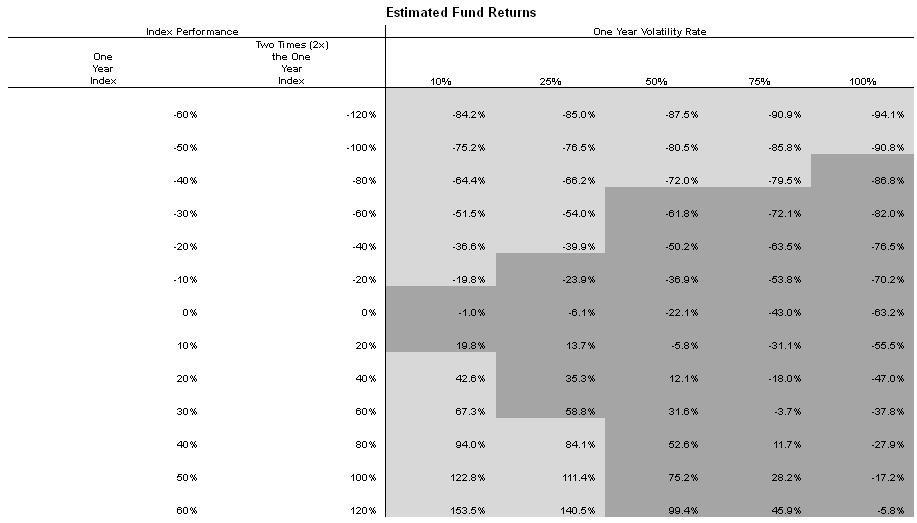 The foregoing table is intended to isolate the effect of Index volatility and Index performance on the return of the Fund. For example, the Fund may incorrectly be expected to achieve a -40% return on a yearly basis if the Index return were -20%, absent the effects of compounding. However, as the table shows, with Index volatility of 50%, the Fund could be expected to return -50.2% under such a scenario. The Fund's actual returns may be significantly greater or less than the returns shown above as a result of any of the factors discussed above or in "Principal Risks - Correlation Risk" below. The Index's annualized historical volatility rate for the five-year period ended September 30, 2012 was 29.11%. The Index's highest September to September volatility rate during the five-year period was 46.74% (September 30, 2009). The Index's annualized performance for the five-year period ended September 30, 2012 was -3.11%. Historical Index volatility and performance are not indications of what the Index volatility and performance will be in the future. The volatility of U.S. exchange-traded securities or instruments that reflect the value of the underlying Index may differ from the volatility of the Index. For additional graphs and charts demonstrating the effects of Index volatility and Index performance on the long-term performance of the Fund, see "Principal Risks Specific to ProFunds - Compounding Risk" in the Fund's full Prospectus and "Special Note Regarding the Correlation Risks of Geared Funds" in the Fund's Statement of Additional Information. Active Investor Risk - The Fund permits short-term trading of its securities. A significant portion of assets invested in the Fund come from professional money managers and investors who use the Fund as part of active trading or tactical asset allocation strategies. These strategies often call for frequent trading to take advantage of anticipated changes in market conditions, which could increase portfolio turnover and may result in additional costs for the Fund. In addition, large movements of assets into and out of the Fund may have a negative impact on the Fund's ability to achieve its investment objective or maintain a consistent level of operating expenses. In certain circumstances, the Fund's expense ratio may vary from current estimates or the historical ratio disclosed in this Prospectus. Correlation Risk - A number of factors may affect the Fund's ability to achieve a high degree of correlation with the Index, and there can be no guarantee that the Fund will achieve a high degree of correlation. Failure to achieve a high degree of correlation may prevent the Fund from achieving its investment objective. In order to achieve a high degree of correlation with the Index, the Fund seeks to rebalance its portfolio daily to keep exposure consistent with its investment objective. Being materially over-or under-exposed to the Index may prevent the Fund from achieving a high degree of correlation with the Index. Market disruptions or closure, regulatory restrictions or extreme market volatility will adversely affect the Fund's ability to adjust exposure to requisite levels. The target amount of portfolio exposure is impacted dynamically by the Index's movements. Because of this, it is unlikely that the Fund will have perfect exposure (i.e., 2x) to the Index at the end of each day and the likelihood of being materially over- or under-exposed is higher on days when the Index level is volatile near the close of the trading day. A number of other factors may also adversely affect the Fund's correlation with the Index, including fees, expenses, transaction costs, financing costs associated with the use of derivatives, income items, valuation methodology, accounting standards and disruptions or illiquidity in the markets for the securities or financial instruments in which the Fund invests. The Fund may not have investment exposure to all securities in the Index, or its weighting of investment exposure to such securities may be different from that of the Index. In addition, the Fund may invest in securities or financial instruments not included in the Index. The Fund may also be subject to large movements of assets into and out of the Fund, potentially resulting in the Fund being over- or under-exposed to the Index. Activities surrounding Index reconstitutions or other Index rebalancing events may hinder the Fund's ability to meet its daily investment objective on or around that day. Consumer Services Industry Risk - The Fund is subject to risks faced by companies in the consumer services industry to the same extent as the Index is so concentrated, including: the fact that securities prices and profitability may be tied closely to the performance of the domestic and international economy, interest rates, competition and consumer confidence; heavy dependence on disposable household income and consumer spending; severe competition; and changes in demographics and consumer tastes, which can affect the success of consumer products. Further, such stocks in the Index may underperform fixed income investments and stock market indexes that track other markets, segments and sectors. Counterparty Risk - The Fund will be subject to credit risk (i.e., the risk that a counterparty is unwilling or unable to make timely payments to meet its contractual obligations) with respect to the amount it expects to receive from counterparties to derivatives and repurchase agreements entered into by the Fund. If a counterparty becomes bankrupt or fails to perform its obligations, the value of your investment in the Fund may decline. Early Close/Late Close/Trading Halt Risk - An exchange or market may close early, close late or issue trading halts on specific securities, or the ability to buy or sell certain securities or financial instruments may be restricted, which may result in the Fund being unable to buy or sell certain securities or derivatives. In such circumstances, the Fund may be unable to rebalance its portfolio, may be unable to accurately price its investments and/or may incur substantial trading losses. Equity and Market Risk - The equity markets are volatile, and the value of securities, swaps, futures, options contracts and other instruments correlated with the equity markets may fluctuate dramatically from day-to-day. Equity markets are subject to political, regulatory, market and economic developments, as well as developments that impact specific economic sectors, industries or segments of the market. Volatility in the markets and/or market developments may cause the value of an investment in the Fund to decrease. Exposure to Foreign Currency Risk - Investments denominated in foreign currencies are exposed to risk factors in addition to investments denominated in U.S. dollars. The value of an investment denominated in a foreign currency could change significantly as foreign currencies strengthen or weaken relative to the U.S. dollar. Risks related to foreign currencies also include those related to economic or political developments, market inefficiencies or a higher risk that essential investment information may be incomplete, unavailable, or inaccurate. Exposure to Foreign Investments Risk - Exposure to securities of foreign issuers may subject the Fund to increased risk. Various factors related to foreign investments may negatively impact the Index's performance, such as: i) fluctuations in the value of the applicable foreign currency; ii) differences in securities settlement practices; iii) uncertainty associated with evidence of ownership of investments in countries that lack centralized custodial services; iv) possible regulation of, or other limitations on, investments by U.S. investors in foreign investments; v) potentially higher brokerage commissions; vi) the possibility that a foreign government may withhold portions of interest and dividends at the source; vii) taxation of income earned in foreign countries or other foreign taxes imposed; viii) foreign exchange controls, which may include suspension of the ability to transfer currency from a foreign country; ix) less publicly available information about foreign issuers; x) changes in the denomination currency of a foreign investment; and xi) less certain legal systems in which the Fund might encounter difficulties or be unable to pursue legal remedies. Foreign investments also may be more susceptible to political, social, economic and regional factors than might be the case with U.S. securities. Exposure to Japanese Investments Risk - The Fund is generally exposed, to a greater extent than more geographically diversified funds, to risks associated with investments in Japan. Such risks include, but are not limited to (i) political, economic, or social instability in Japan; (ii) risks associated with Japan's large government deficit; (iii) natural disasters particularly likely to occur in Japan; and (iv) risks associated with an increasingly aging population that is likely to strain Japan's social welfare and pension systems. Geographic Concentration Risk - Because the Fund focuses its investments only in Japan, it may be more volatile than a more geographically diversified fund. The performance of the Fund will be affected by the political, social and economic conditions in Japan and subject to the related risks. Industrial Industry Risk - The Fund is subject to risks faced by companies in the industrial economic sector to the same extent as the Index is so concentrated, including: effects on stock prices by supply and demand both for their specific product or service and for industrial sector products in general; decline in demand for products due to rapid technological developments and frequent new product introduction; effects on securities prices and profitability from government regulation, world events and economic conditions; and risks for environmental damage and product liability claims. Further, stocks in the Index may underperform fixed income investments and stock market indexes that track other markets, segments and sectors. Liquidity Risk - In certain circumstances, such as the disruption of the orderly markets for the securities or financial instruments in which the Fund invests, the Fund might not be able to acquire or dispose of certain holdings quickly or at prices that represent true market value in the judgment of ProFund Advisors. Markets for the securities in which the Fund invests may be disrupted by a number of events, including but not limited to economic crises, natural disasters, new legislation, or regulatory changes inside or outside of the U.S. For example, regulation limiting the ability of certain financial institutions to invest in certain securities would likely reduce the liquidity of those securities. Such situations may prevent the Fund from limiting losses, realizing gains or achieving a high correlation with the Index. Non-Diversification Risk - The Fund is classified as "non-diversified" under the Investment Company Act of 1940, and has the ability to invest a relatively high percentage of its assets in the securities of a small number of issuers susceptible to a single economic, political or regulatory event, or in financial instruments with a single counterparty if ProFund Advisors determines that doing so is the most efficient means of meeting the Fund's investment objective. This makes the performance of the Fund more susceptible to adverse impact to an issuer or counterparty than a diversified fund might be. This risk may be particularly acute when the Index is comprised of a small number of securities. Portfolio Turnover Risk - Daily rebalancing of Fund holdings, which is required to keep leverage consistent with a single day investment objective, will cause a higher level of portfolio transactions than compared to most funds. Additionally, active trading of the Fund's shares may cause more frequent purchase and sales activities that could, in certain circumstances, increase the number of portfolio transactions. High levels of transactions increase brokerage costs and may result in increased taxable capital gains. Valuation Time Risk - The Fund typically values its portfolio at 4:00 p.m. (Eastern Time). In certain cases, foreign securities markets close before such time or may not be open for business on the same calendar days as the Fund. As a result, the daily performance of the Fund may vary, perhaps significantly, from the daily performance, or a multiple thereof, of the Index. Please see "Investment Objectives, Principal Investment Strategies and Related Risks" in the Fund's full Prospectus for additional details. |
||||||||||||||||||||||||||||||||||||||||||||
| Investment Results | ||||||||||||||||||||||||||||||||||||||||||||
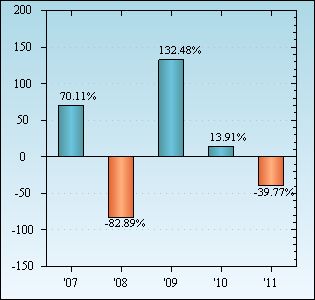
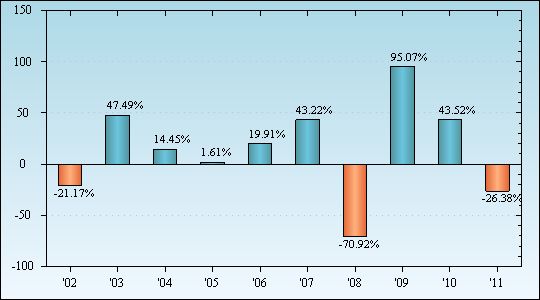
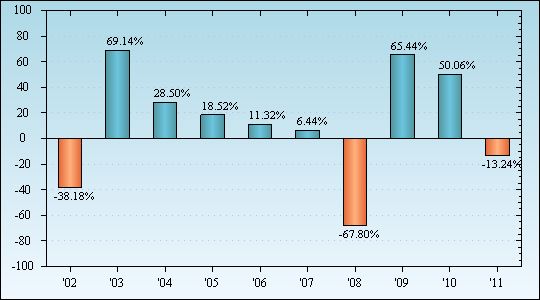
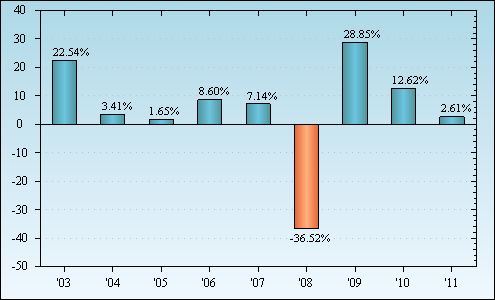
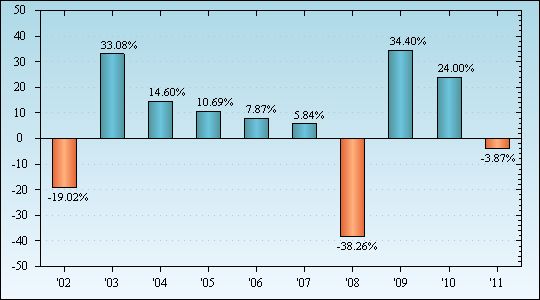
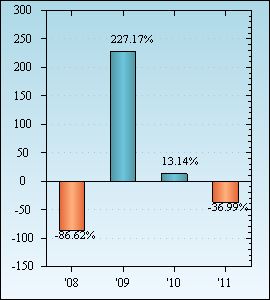
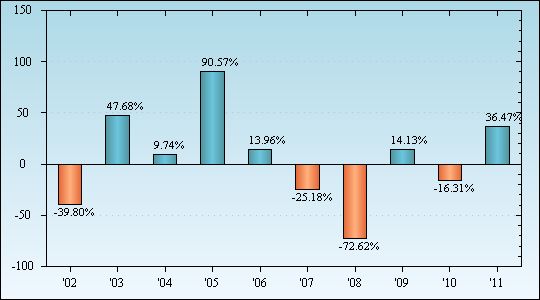
| The bar chart below shows how the Fund’s investment results for Investor Class shares have varied from year to year, and the table shows how the Fund’s average annual total returns for various periods compare with different broad measures of market performance. This information provides some indication of the risks of investing in the Fund. Past results (before and after taxes) are not predictive of future results. Updated information on the Fund’s results can be obtained by visiting ProFunds.com. | ||||||||||||||||||||||||||||||||||||||||||||
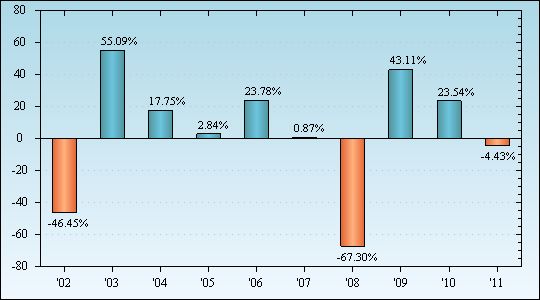
| Annual Returns of Investor Class Shares as of December 31 each year | ||||||||||||||||||||||||||||||||||||||||||||
 |
||||||||||||||||||||||||||||||||||||||||||||
| Best Quarter (ended 9/30/2005): 40.58%; Worst Quarter (ended 12/31/2008): -49.60%. The year-to-date return as of the most recent quarter, which ended September 30, 2012, was 7.76%. |
||||||||||||||||||||||||||||||||||||||||||||
| Average Annual Total Returns as of December 31, 2011 |
||||||||||||||||||||||||||||||||||||||||||||
|
||||||||||||||||||||||||||||||||||||||||||||
| Average annual total returns are shown on a before- and after-tax basis for Investor Class shares only. After-tax returns for Service Class shares will vary. After-tax returns are calculated using the historical highest individual federal marginal income tax rates and do not reflect the impact of state and local taxes. Actual after-tax returns depend on an investor’s tax situation and may differ from those shown. After-tax returns shown are not relevant to investors who hold the Fund’s shares through tax-deferred arrangements, such as a retirement account. After-tax returns may exceed the return before taxes due to a tax benefit from realizing a capital loss on a sale of shares. Annual returns are required to be shown and should not be interpreted as suggesting that the Fund should or should not be held for longer periods of time. The Fund may not be suitable for all investors and should only be used by knowledgeable investors who understand the potential consequences of seeking daily leveraged results (i.e., 2x). Shareholders should actively manage and monitor their investments, as frequently as daily. |
||||||||||||||||||||||||||||||||||||||||||||