| Select Appreciation Fund | |||||||||||||||||||||||||||||
| Select Appreciation Fund | |||||||||||||||||||||||||||||
| Investment Objective: | |||||||||||||||||||||||||||||
The investment objective is long-term growth. |
|||||||||||||||||||||||||||||
| Fees and Expenses of the Fund: | |||||||||||||||||||||||||||||
This table describes the fees and expenses that you may pay if you buy and hold shares of the Fund. |
|||||||||||||||||||||||||||||
| Annual Fund Operating Expenses (expenses that you pay each year as a percentage of the value of your investment) | |||||||||||||||||||||||||||||
|
|||||||||||||||||||||||||||||
| Example: | |||||||||||||||||||||||||||||
This Example is intended to help you compare the cost of investing in the Fund with the cost of investing in other mutual funds. |
|||||||||||||||||||||||||||||
| The Example assumes that you invest $10,000 in the Fund for the time periods indicated and then redeem all of your shares at the end of those periods. The Example also assumes that your investment has a 5% return each year and that the Fund's operating expenses remain the same. Although your actual costs may be higher or lower, based upon these assumptions your costs would be: | |||||||||||||||||||||||||||||
|
|||||||||||||||||||||||||||||
| Portfolio Turnover: | |||||||||||||||||||||||||||||
The Fund pays transaction costs, such as commissions, when it buys and sells securities (or "turns over" its portfolio). A higher portfolio turnover rate may indicate higher transaction costs and may result in higher taxes when Fund shares are held in a taxable account. These costs, which are not reflected in annual fund operating expenses or in the Example, affect the Fund's performance. During the most recent fiscal year, the Fund’s portfolio turnover rate was 49% of the average value of the portfolio. |
|||||||||||||||||||||||||||||
| Principal Investment Strategies of the Fund: | |||||||||||||||||||||||||||||
The Fund invests primarily in exchange traded funds (“ETFs”), other open-end mutual funds, and closed-end funds. This group of investments is referred to as "Underlying Funds." The Fund’s investment adviser, CLS Investments, LLC (“CLS”), seeks to achieve the Fund’s investment objective by using the following investment strategies: · Investing in (i) Underlying Funds that seek capital growth by investing in common stock or securities convertible into or exchangeable for common stock (such as convertible preferred stock, convertible debentures or warrants), including the stock of foreign issuers, or (ii) individual securities that may provide capital growth or appreciation. The Underlying Funds used by the Fund in its allocations consist primarily of ETFs. The Underlying Funds are selected based on their security selection methodology, asset class trend, asset class fundamentals, diversification impact, cost and liquidity. These investments may include smaller and medium capitalization companies. · Investing up to 50% of its total assets in Underlying Funds that invest in commodities. · Using options and futures to obtain additional exposure to the market when CLS believes that a particular asset class, sector, region or country offers superior opportunities for return relative to the risk. · Although the Fund does not seek current income, it may invest up to 40% of its total assets in long, medium, and short-term bonds and other fixed income securities of varying credit quality, or Underlying Funds that invest in these securities, when CLS believes these investments offer potential for capital appreciation. CLS selects bond funds and bonds based on an analysis of credit qualities, maturities, and coupon or dividend rates, while seeking to take advantage of yield differentials between securities. CLS may sell an investment if it determines that the asset class, sector, region or country is no longer desirable or if CLS believes that another Underlying Fund or security within the category offers a better opportunity to achieve the Fund’s objective. CLS actively manages the Fund's investments by increasing or decreasing the Fund’s investment in particular asset classes, sectors, regions and countries, or in a particular security, based on its assessment of the opportunities for return relative to the risk using fundamental and technical analysis. Because of the varying levels of risk among equity and bond asset classes, the percent allocated to equities and bonds will vary depending on which asset classes are selected for the portfolio. |
|||||||||||||||||||||||||||||
| Principal Risks of the Fund: | |||||||||||||||||||||||||||||
Many factors affect the Fund’s performance. The Fund's share price changes daily based on changes in market conditions in response to economic, political and financial developments. The direction and extent of those price changes will be affected by the financial condition, industry and economic sector, and geographic location of the securities in which the Fund and the Underlying Funds invest. The Fund is not federally insured or guaranteed by any government agency. YOU MAY LOSE MONEY BY INVESTING IN THE FUND. Commodity Risk: The Fund’s exposure to the commodities markets may subject the Fund to greater volatility than investments in traditional securities. The value of commodity-linked Underlying Funds may be affected by changes in overall market movements, commodity index volatility, changes in interest rates, or sectors affecting a particular industry or commodity, such as drought, floods, weather, livestock disease, embargoes, tariffs and international economic, political and regulatory developments. Debt Securities Risk: When the Fund invests in bonds or in Underlying Funds that own bonds, the value of your investment in the Fund will fluctuate with changes in interest rates. Long-term bonds are generally more sensitive to interest rate changes than short-term bonds. Issuers of fixed-income securities may default on interest and principal payments. Generally, securities with lower debt ratings (“junk bonds”) have greater credit risk. Foreign Securities Risk: Foreign securities may be riskier than U.S. investments because of factors such as unstable international political and economic conditions, currency fluctuations, foreign controls on investment and currency exchange, withholding taxes, a lack of adequate company information, less liquid and more volatile markets, and a lack of governmental regulation. Foreign companies generally are not subject to accounting, auditing, and financial reporting standards comparable to those applicable to U.S. companies. Transaction costs and costs associated with custody services are generally higher for foreign securities than they are for U.S. securities. Leverage Risk: The Fund’s use of options and futures is a form of leverage. Leveraging may cause the Fund to be more volatile than if the Fund had not been leveraged. This is because leveraging tends to exaggerate the effect of any increase or decrease in the value of the Fund’s portfolio securities. Management Risk: The ability of the Fund to meet its investment objective is directly related to the allocation of the Fund’s assets. CLS may allocate the Fund's investments so as to under-emphasize or over-emphasize investments under the wrong market conditions, in which case the Fund’s value may be adversely affected. The Fund’s use of leverage may amplify this risk. Market Risk: Investments in securities, and derivatives such as options and futures, in general are subject to market risks that may cause their prices to fluctuate over time. The Fund’s investments may decline in value due to factors affecting securities markets generally, or particular countries, segments, economic sectors, industries or companies within those markets. The value of a security may decline due to general economic and market conditions that are not specifically related to a particular issuer. Smaller and Medium Issuer Risk: Investments in Underlying Funds that own small and medium capitalization companies and direct investments in individual small and medium capitalization companies may be more vulnerable to adverse business or economic developments than investments in larger, more established organizations. Underlying Funds Risk: You will indirectly pay fees and expenses charged by the Underlying Funds in addition to the Fund’s direct fees and expenses. As a result, the cost of investing in the Fund will be higher than the cost of investing directly in Underlying Fund shares and may be higher than other mutual funds that invest directly in stocks and bonds. Each Underlying Fund is subject to specific risks, depending on the nature of the Underlying Fund. These risks could include sector risk (increased risk from a focus on one or more sectors of the market), as well as risks associated with fixed income securities, real estate investments, and commodities. |
|||||||||||||||||||||||||||||
| Performance: | |||||||||||||||||||||||||||||
The following bar chart and table below provide some indication of the risks of investing in the Fund by showing changes in the performance of Class N Shares of the Fund from year to year and by showing how the Fund’s average annual returns for one, five and ten years compare with those of a broad measure of market performance. Past performance (before and after taxes) does not necessarily indicate how the Fund will perform in the future. Updated performance information is available at no cost by visiting www.advisoronefunds.com or by calling 1-866-811-0225. |
|||||||||||||||||||||||||||||
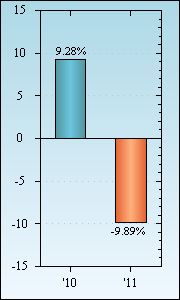
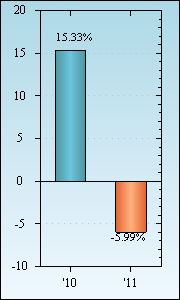
| Class N Shares Total Return for Years Ended December 31, | |||||||||||||||||||||||||||||
 |
|||||||||||||||||||||||||||||
The year-to-date return of Class N Shares for the nine-month period ended September 30, 2012 was 14.58%. During the period shown in the bar chart, the highest return for a quarter was 13.89% (quarter ended September 30, 2010) and the lowest return for a quarter was (20.44)% (quarter ended September 30, 2011). |
|||||||||||||||||||||||||||||
| AVERAGE ANNUAL TOTAL RETURN (for the periods ended December 31, 2011) | |||||||||||||||||||||||||||||
|
|||||||||||||||||||||||||||||