UNITED STATES
SECURITIES AND EXCHANGE COMMISSION
Washington, DC 20549
FORM 6-K
Report of Foreign Private Issuer
Pursuant to Rule 13a-16 or 15d-16
Under the Securities Exchange Act of 1934
For the month of July, 2015
Cameco Corporation
(Commission file No. 1-14228)
2121-11th Street West
Saskatoon, Saskatchewan, Canada S7M 1J3
(Address of Principal Executive Offices)
Indicate by check mark whether the registrant files or will file annual reports under cover Form 20-F or Form 40-F.
Form 20-F ¨ Form 40-F x
Indicate by check mark whether the registrant by furnishing the information contained in this Form is also thereby furnishing the information to the Commission pursuant to Rule 12g3-2(b) under the Securities Exchange Act of 1934.
Yes ¨ No x
If Yes is marked, indicate below the file number assigned to the registrant in connection with Rule 12g3-2(b):
Exhibit Index
Exhibit No. |
Description |
Page No. | ||
99.1 | Press Release dated July 30, 2015 | |||
99.2 | Managements Discussion & Analysis for the second quarter ending June 30, 2015 | |||
99.3 | Condensed Consolidated Interim Unaudited Financial Statements for the second quarter ending June 30, 2015 | |||
99.4 | Certification of Chief Executive Officer pursuant to Section 302 of the Sarbanes-Oxley Act of 2002 dated July 30, 2015 | |||
99.5 | Certification of Chief Financial Officer pursuant to Section 302 of the Sarbanes-Oxley Act of 2002 dated July 30, 2015 |
SIGNATURE
Pursuant to the requirements of the Securities Exchange Act of 1934, the registrant has duly caused this report to be signed on its behalf by the undersigned, thereunto duly authorized.
Date: July 30, 2015 | Cameco Corporation | |||||
By: | ||||||
Sean A. Quinn | ||||||
Senior Vice-President, Chief Legal Officer and Corporate Secretary |
Exhibit 99.1
TSX: CCO NYSE: CCJ |
website: cameco.com currency: Cdn (unless noted) |
2121 11th Street West, Saskatoon, Saskatchewan, S7M 1J3 Canada
Tel: (306) 956-6200 Fax: (306) 956-6201
Cameco reports second quarter financial results
| higher revenue and gross profit for the quarter and first six months |
| average realized uranium price outperforming spot and long-term market prices |
| strong uranium production for the quarter, maintaining annual production and sales targets |
Saskatoon, Saskatchewan, Canada, July 30, 2015
Cameco (TSX: CCO; NYSE: CCJ) today reported its consolidated financial and operating results for the second quarter ended June 30, 2015 in accordance with International Financial Reporting Standards (IFRS).
The company continues to perform well, said Tim Gitzel, president and CEO, despite the tough market conditions.
Despite some supply disruptions in the first half of the year, prices and demand remained flat due to the current oversupply in the market. However, the long-term outlook for nuclear energy, underpinned by strong fundamentals, remains positive. With the long-term view in mind, we remain focused on keeping costs down and running our operations safely and efficiently to ensure we maintain the flexibility to respond to market conditions as they evolve.
HIGHLIGHTS | THREE MONTHS ENDED JUNE 30 |
SIX MONTHS ENDED JUNE 30 |
||||||||||||||||||||||
($ MILLIONS EXCEPT WHERE INDICATED) |
2015 | 2014 | CHANGE | 2015 | 2014 | CHANGE | ||||||||||||||||||
Revenue |
565 | 502 | 13 | % | 1,130 | 921 | 23 | % | ||||||||||||||||
Gross profit |
153 | 136 | 13 | % | 282 | 243 | 16 | % | ||||||||||||||||
Net earnings attributable to equity holders |
88 | 127 | (31 | )% | 79 | 259 | (69 | )% | ||||||||||||||||
$ per common share (diluted) |
0.22 | 0.32 | (31 | )% | 0.20 | 0.65 | (69 | )% | ||||||||||||||||
Adjusted net earnings (non-IFRS, see page 4) |
46 | 79 | (42 | )% | 115 | 115 | | |||||||||||||||||
$ per common share (adjusted and diluted) |
0.12 | 0.20 | (40 | )% | 0.29 | 0.29 | | |||||||||||||||||
Cash provided by (used in) operations (after working capital changes) |
(65 | ) | (25 | ) | (160 | )% | 68 | (18 | ) | 478 | % |
SECOND QUARTER
Net earnings attributed to equity holders this quarter were $88 million ($0.22 per share diluted) compared to net earnings of $127 million ($0.32 per share diluted) in the second quarter of 2014. In addition to the items noted below, our net earnings were affected by mark-to-market gains on foreign exchange derivatives.
On an adjusted basis, our earnings this quarter were $46 million ($0.12 per share diluted) compared to $79 million ($0.20 per share diluted) (non-IFRS measure, see page 4) in the second quarter of 2014. The change was mainly due to:
| higher administrative costs |
| a favourable settlement of $28 million with respect to a dispute regarding a long-term supply contract with a utility customer recorded in the second quarter of 2014 |
partially offset by:
| higher gross profit from uranium and fuel services segments |
| settlement costs of $12 million with respect to the early redemption our Series C debentures recorded during the second quarter of 2014 |
See Financial results by segment on page 5 for more detailed discussion.
- 1 -
FIRST SIX MONTHS
Net earnings in the first six months of the year were $79 million ($0.20 per share diluted) compared to $259 million ($0.65 per share diluted) in the first six months of 2014. In addition to the items noted below, our net earnings were affected by mark-to-market losses on foreign exchange derivatives. Our 2014 earnings also included a gain on the sale of our interest in BPLP of $127 million.
On an adjusted basis, our earnings for the first six months of this year were $115 million ($0.29 per share diluted) (non-IFRS measure, see page 4) unchanged from the first six months of 2014. Key variances include:
| higher administration costs |
| a favourable settlement of $28 million with respect to a dispute regarding a long-term supply contract with a utility customer recorded in the second quarter of 2014 |
| lower tax recovery |
partially offset by:
| higher gross profit from our uranium, fuel services and NUKEM segments |
| lower losses from equity accounted investments |
Our 2014 adjusted net earnings were also impacted by:
| an early termination fee of $18 million incurred in 2014 as a result of the cancellation of our toll conversion agreement with Springfields Fuels Ltd. (SFL), which was to expire in 2016 |
| settlement costs of $12 million with respect to the early redemption our Series C debentures recorded in 2014 |
See Financial results by segment on page 5 for more detailed discussion.
Also of note:
Ken Seitz, our senior vice-president and chief commercial officer is resigning effective August 15, 2015, to take a chief executive officer position with a company outside the nuclear industry. Mr. Seitz had oversight for our marketing, corporate development, and exploration activities. At this time, the plan is to reallocate these activities, and his other responsibilities, among members of our officer team. This re-allocation will be finalized in September 2015.
Uranium market update
The market continued to be flat in the second quarter, with spot prices remaining in the mid-$30s (US). The quantity transacted in the spot market was at normal levels, though no significant price trends emerged. We believe this flat environment is simply a function of the currently over-supplied market, where we believe participants uncovered requirements start to open up in the next two to three years. There were supply disruptions in the first half of 2015 that reduced the over-supply situation, but the reductions did not result in any notable change in spot or term demand from utilities.
Japan restarts remain the most important driver of market sentiment in the short term. While the market has been disappointed with ongoing delays, the first reactor restarts appear to be imminent with Kyushu having loaded fuel into Sendai unit 1 for anticipated restart in August, while preparing Sendai unit 2 for restart this fall. We remain confident that a significant number of units will be restarted in Japan over time, though the regulatory approval process and restart schedules are clearly hard to predict.
Beyond these short-term challenges in the market, longer term, strong fundamentals underpin a positive outlook for the industry. Globally, there are 64 reactors currently under construction, with a net increase of 82 reactors expected over the next 10 years. China continues to execute on its remarkable nuclear growth plan, with 26 reactors operating and 24 under construction. India continues to demonstrate confidence in its nuclear growth strategy, evidenced by the signing of new long-term uranium supply agreements with major producers, including Cameco.
On the supply side, we continue to see depressed market conditions having a negative impact on future supply potential, as suppliers struggle to justify the underlying economics. The cancellation of a planned mine expansion in Australia further supports our view that current price levels do not justify the development of new uranium supply projects. Demand growth combined with the timing, development and execution of new supply projects and the continued performance of existing supply, will determine the pace of market recovery.
Caution about forward-looking information relating to our uranium market update
This discussion of our expectations for the nuclear industry, including its growth profile, future global uranium supply and demand, and net increase in reactors, is forward-looking information that is based upon the assumptions and subject to the material risks discussed under the heading Caution about forward-looking information beginning on page 10.
- 2 -
Outlook for 2015
Our strategy is to profitably produce at a pace aligned with market signals, while maintaining the ability to respond to conditions as they evolve.
Our outlook for 2015 reflects the expenditures necessary to help us achieve our strategy. Our outlook for NUKEM revenue and unit cost, as well as consolidated revenue, administration costs and tax rate has changed. To provide additional insight following our acquisition of NUKEM in 2013, we provided an outlook for NUKEMs direct administration costs and tax rate. However, NUKEMs direct administration costs and tax rate are immaterial in the context of our consolidated results. We provide outlook for consolidated direct administration costs and for our consolidated tax rate based on taxes incurred in Canada and in foreign jurisdictions; we do not provide any further breakdown for our other segments. As a result, we will no longer provide an outlook for direct administration costs or tax rate specific to the NUKEM segment. We do not provide an outlook for the items in the table that are marked with a dash.
See 2015 Financial results by segment on page 5 for details.
2015 FINANCIAL OUTLOOK
CONSOLIDATED |
URANIUM |
FUEL SERVICES |
NUKEM | |||||
Production |
| 25.3 to 26.3 million lbs |
9 to 10 million kgU |
| ||||
Sales volume1 |
| 31 to 33 million lbs |
Decrease 5% to 10% |
7 to 8 million lbs U3O8 | ||||
Revenue compared to 20142 |
Increase 5% to 10% |
Increase up to 5%3 |
Increase up to 5% |
Increase 20% to 25% | ||||
Average unit cost of sales (including D&A) |
| Increase 5% to 10%4 |
Increase 5% to 10% |
Increase 5% to 10% | ||||
Direct administration costs compared to 20145 |
Increase 5% to 10% |
| | | ||||
Exploration costs compared to 2014 |
| Decrease 5% to 10% |
| | ||||
Tax rate |
Recovery of 40% to 45% |
| | | ||||
Capital expenditures |
$405 million | | | |
1 | Our 2015 outlook for sales volume does not include sales between our uranium, fuel services and NUKEM segments. |
2 | For comparison of our 2015 outlook and 2014 results for revenue, we do not include sales between our uranium, fuel services and NUKEM segments. |
3 | Based on a uranium spot price of $36.00 (US) per pound (the Ux spot price as of July 27, 2015), a long-term price indicator of $44.00 (US) per pound (the Ux long-term indicator on July 27, 2015) and an exchange rate of $1.00 (US) for $1.22 (Cdn). |
4 | This increase is based on the unit cost of sale for produced material and committed long-term purchases. If we make discretionary purchases in 2015, then we expect the overall unit cost of sales to increase further. |
5 | Direct administration costs do not include stock-based compensation expenses. |
Our outlook for NUKEM revenue has changed to an increase of 20% to 25% (previously increase of 5% to 10%) due to our expectation that NUKEM sales volumes will be higher in the range, and the effect of foreign exchange. Consolidated revenue is now expected to increase by 5% to 10% (previously an increase of up to 5%) due to our expectation that sales volumes for the uranium and NUKEM segments will be higher in the range.
We have also adjusted our outlook for NUKEM cost of sales. Unit cost of sales is now expected to increase 5% to 10% (previously increase up to 5%) due to the effect of foreign exchange.
Consolidated administration costs are now expected to increase 5% to 10% (previously an increase of up to 5%) due to increased costs under our collaboration agreements and the effect of foreign exchange.
We have adjusted our outlook for the consolidated tax rate to a recovery of 40% to 45% (previously 45% to 50%) due to the expected impact of the changes to the consolidated outlook noted above, and a change in the distribution of earnings between jurisdictions.
- 3 -
In our uranium and fuel services segments, our customers choose when in the year to receive deliveries, so our quarterly delivery patterns, sales volumes and revenue can vary significantly however, the majority of delivery notices have been received for 2015, reducing variability for the remainder of the year. We expect uranium deliveries in the third quarter to be similar to the first two quarters, and fourth quarter deliveries to be higher.
REVENUE AND EARNINGS SENSITIVITY ANALYSIS
For the rest of 2015:
| an increase of $5 (US) per pound in both the Ux spot price ($36.00 (US) per pound on July 27, 2015) and the Ux long-term price indicator ($44.00 (US) per pound on July 27, 2015) would increase revenue by $48 million and net earnings by $27 million. Conversely, a decrease of $5 (US) per pound would decrease revenue by $45 million and net earnings by $24 million. |
| a one-cent change in the value of the Canadian dollar versus the US dollar would change adjusted net earnings by $5 million, with a decrease in the value of the Canadian dollar versus the US dollar having a positive impact |
ADJUSTED NET EARNINGS (NON-IFRS MEASURE)
Adjusted net earnings is a measure that does not have a standardized meaning or a consistent basis of calculation under IFRS (non-IFRS measure). We use this measure as a more meaningful way to compare our financial performance from period to period. We believe that, in addition to conventional measures prepared in accordance with IFRS, certain investors use this information to evaluate our performance. Adjusted net earnings is our net earnings attributable to equity holders, adjusted to better reflect the underlying financial performance for the reporting period. The adjusted earnings measure reflects the matching of the net benefits of our hedging program with the inflows of foreign currencies in the applicable reporting period, and has also been adjusted for NUKEM purchase price inventory write-downs and recoveries, income taxes on adjustments, impairment charges on non-producing property, and the after tax gain on the sale of our interest in BPLP.
Adjusted net earnings is non-standard supplemental information and should not be considered in isolation or as a substitute for financial information prepared according to accounting standards. Other companies may calculate this measure differently, so you may not be able to make a direct comparison to similar measures presented by other companies.
The following table reconciles adjusted net earnings with our net earnings.
THREE MONTHS ENDED JUNE 30 |
SIX MONTHS ENDED JUNE 30 |
|||||||||||||||
($ MILLIONS) |
2015 | 2014 | 2015 | 2014 | ||||||||||||
Net earnings attributable to equity holders |
88 | 127 | 79 | 259 | ||||||||||||
|
|
|
|
|
|
|
|
|||||||||
Adjustments |
||||||||||||||||
Adjustments on derivatives (pre-tax) |
(57 | ) | (66 | ) | 44 | (23 | ) | |||||||||
NUKEM purchase price inventory recovery |
| | (3 | ) | | |||||||||||
Impairment charge |
| | 6 | | ||||||||||||
Income taxes on adjustments |
15 | 18 | (11 | ) | 6 | |||||||||||
Gain on interest in BPLP (after tax) |
| | | (127 | ) | |||||||||||
|
|
|
|
|
|
|
|
|||||||||
Adjusted net earnings |
46 | 79 | 115 | 115 | ||||||||||||
|
|
|
|
|
|
|
|
Discontinued operation
On March 27, 2014, we completed the sale of our 31.6% limited partnership interest in BPLP, which was accounted for effective January 1, 2014. The aggregate sale price for our interest in BPLP and certain related entities was $450 million. We realized an after tax gain of $127 million on this divestiture. As a result of the transaction, we presented the results of BPLP as a discontinued operation and we revised our statement of earnings, statement of comprehensive income and statement of cash flows to reflect the change in presentation. See note 4 to the interim financial statements for more information.
- 4 -
Financial results by segment
Uranium
THREE MONTHS ENDED JUNE 30 |
SIX MONTHS ENDED JUNE 30 |
|||||||||||||||||||||||||||
HIGHLIGHTS |
2015 | 2014 | CHANGE | 2015 | 2014 | CHANGE | ||||||||||||||||||||||
Production volume (million lbs) |
5.4 | 4.0 | 35 | % | 10.5 | 9.7 | 8 | % | ||||||||||||||||||||
Sales volume (million lbs)1 |
7.3 | 7.4 | (1 | )% | 14.3 | 14.3 | | |||||||||||||||||||||
Average spot price |
($ | US/lb | ) | 36.17 | 28.97 | 25 | % | 37.26 | 31.95 | 17 | % | |||||||||||||||||
Average long-term price |
($ | US/lb | ) | 47.50 | 44.83 | 6 | % | 48.50 | 46.75 | 4 | % | |||||||||||||||||
Average realized price |
($ | US/lb | ) | 46.57 | 45.93 | 1 | % | 45.03 | 46.26 | (3 | )% | |||||||||||||||||
($ | Cdn/lb | ) | 58.04 | 50.76 | 14 | % | 55.45 | 50.67 | 9 | % | ||||||||||||||||||
Average unit cost of sales (including D&A) |
($ | Cdn/lb | ) | 40.71 | 35.86 | 14 | % | 38.64 | 34.63 | 12 | % | |||||||||||||||||
Revenue ($ millions)1 |
424 | 376 | 13 | % | 791 | 724 | 9 | % | ||||||||||||||||||||
Gross profit ($ millions) |
127 | 110 | 15 | % | 240 | 229 | 5 | % | ||||||||||||||||||||
Gross profit (%) |
30 | 29 | 3 | % | 30 | 32 | (6 | )% |
1 | Includes sales and revenue between our uranium, fuel services and NUKEM segments (nil pounds in sales and nil revenue in Q2, 2015; 165,000 pounds and revenue of $5.0 million in Q2, 2014; 15,000 pounds in sales and revenue of $0.5 million in the first six months of 2015; 165,000 pounds and revenue of $5.0 million in the first six months of 2014). |
SECOND QUARTER
Production volumes this quarter were 35% higher compared to the second quarter of 2014, mainly due to production from Cigar Lake and higher production from McArthur River/Key Lake, which was partially offset by lower production at Rabbit Lake, Inkai and our US operations. See Uranium 2015 Q2 updates starting on page 8 for more information.
The 13% increase in uranium revenues was a result of a 14% increase in the Canadian dollar average realized price, partially offset by a 1% decrease in sales volume.
The US dollar average realized price increased by 1% compared to 2014 mainly due to higher prices on fixed price contracts, while the higher Canadian dollar realized prices this quarter were a result of the weakening of the Canadian dollar compared to 2014. This quarter the exchange rate on the average realized price was $1.00 (US) for $1.25 (Cdn) compared to $1.00 (US) for $1.11 (Cdn) in the second quarter of 2014.
Total cost of sales (including D&A) increased by 12% ($297 million compared to $266 million in 2014) due to a 14% increase in the unit cost of sales, partially offset by a 1% decrease in sales volume. The increase in the unit cost of sales was mainly the result of an increase in the volume of material purchased in the quarter at prices higher than our average cost of inventory.
The net effect was a $17 million increase in gross profit for the quarter.
FIRST SIX MONTHS
Production volumes for the first six months of the year were 8% higher than in the previous year due to the addition of production from Cigar Lake, partially offset by lower production at McArthur/Key Lake, our US operations and Inkai. See Uranium 2015 Q2 updates starting on page 8 for more information.
Uranium revenues increased 9% compared to the first six months of 2014 due to a 9% increase in the Canadian dollar average realized price. Sales volumes in the first six months were the same as in 2014.
Our Canadian dollar realized prices for the first six months of 2015 were higher than 2014, primarily as a result of the weakening of the Canadian dollar compared to 2014. For the first six months of 2015, the exchange rate on the average realized price was $1.00 (US) for $1.23 (Cdn) compared to $1.00 (US) for $1.10 (Cdn) for the same period in 2014.
Total cost of sales (including D&A) increased by 12% ($552 million compared to $495 million in 2014) mainly due to a 12% increase in the unit cost of sales. The increase was mainly the result of an increase in the volume of material purchased in the first six months at prices higher than our average cost of inventory, and an increase in unit production costs.
The net effect was an $11 million increase in gross profit for the first six months.
We are active in the uranium market, buying and selling uranium on the spot market and under long-term contracts when we expect it will be beneficial for us. Purchases are impacted by foreign exchange rates, and may, in some cases, require we pay prices higher or lower than current spot prices. Depending on the volume and unit cost of purchases in a quarter, our average cost of inventory can be impacted, which flows through to our cost of sales.
- 5 -
The table below shows the costs of produced and purchased uranium incurred in the reporting periods (which are non-IFRS measures, see the paragraphs below the table). These costs do not include selling costs such as royalties, transportation and commissions, nor do they reflect the impact of opening inventories on our reported cost of sales.
THREE MONTHS ENDED JUNE 30 |
SIX MONTHS ENDED JUNE 30 |
|||||||||||||||||||||||
($CDN/LB) |
2015 | 2014 | CHANGE | 2015 | 2014 | CHANGE | ||||||||||||||||||
Produced |
||||||||||||||||||||||||
Cash cost |
26.53 | 26.24 | 1 | % | 27.28 | 23.03 | 18 | % | ||||||||||||||||
Non-cash cost |
14.64 | 14.72 | (1 | )% | 13.59 | 12.25 | 11 | % | ||||||||||||||||
|
|
|
|
|
|
|
|
|
|
|
|
|||||||||||||
Total production cost |
41.17 | 40.96 | 1 | % | 40.87 | 35.28 | 16 | % | ||||||||||||||||
|
|
|
|
|
|
|
|
|
|
|
|
|||||||||||||
Quantity produced (million lbs) |
5.4 | 4.0 | 35 | % | 10.5 | 9.7 | 8 | % | ||||||||||||||||
|
|
|
|
|
|
|
|
|
|
|
|
|||||||||||||
Purchased |
||||||||||||||||||||||||
Cash cost |
45.68 | 58.15 | (21 | )% | 46.69 | 44.76 | 4 | % | ||||||||||||||||
|
|
|
|
|
|
|
|
|
|
|
|
|||||||||||||
Quantity purchased (million lbs) |
4.0 | 0.3 | 1233 | % | 6.6 | 1.6 | 313 | % | ||||||||||||||||
|
|
|
|
|
|
|
|
|
|
|
|
|||||||||||||
Totals |
||||||||||||||||||||||||
Produced and purchased costs |
43.09 | 42.16 | 2 | % | 43.12 | 36.62 | 18 | % | ||||||||||||||||
|
|
|
|
|
|
|
|
|
|
|
|
|||||||||||||
Quantities produced and purchased (million lbs) |
9.4 | 4.3 | 119 | % | 17.1 | 11.3 | 51 | % | ||||||||||||||||
|
|
|
|
|
|
|
|
|
|
|
|
Cash cost per pound, non-cash cost per pound and total cost per pound for produced and purchased uranium presented in the above table are non-IFRS measures. These measures do not have a standardized meaning or a consistent basis of calculation under IFRS. We use these measures in our assessment of the performance of our uranium business. We believe that, in addition to conventional measures prepared in accordance with IFRS, certain investors use this information to evaluate our performance and ability to generate cash flow.
These measures are non-standard supplemental information and should not be considered in isolation or as a substitute for measures of performance prepared according to accounting standards. These measures are not necessarily indicative of operating profit or cash flow from operations as determined under IFRS. Other companies may calculate these measures differently, so you may not be able to make a direct comparison to similar measures presented by other companies.
To facilitate a better understanding of these measures, the following table presents a reconciliation of these measures to our unit cost of sales for the second quarter and the first six months of 2015 and 2014.
Cash and total cost per pound reconciliation
THREE MONTHS ENDED JUNE 30 |
SIX MONTHS ENDED JUNE 30 |
|||||||||||||||
($ MILLIONS) |
2015 | 2014 | 2015 | 2014 | ||||||||||||
Cost of product sold |
251.2 | 204.6 | 455.4 | 385.6 | ||||||||||||
Add / (subtract) |
||||||||||||||||
Royalties |
(21.9 | ) | (21.0 | ) | (35.7 | ) | (35.2 | ) | ||||||||
Standby charges |
| (9.7 | ) | | (19.0 | ) | ||||||||||
Other selling costs |
(3.7 | ) | (3.2 | ) | (5.3 | ) | (5.5 | ) | ||||||||
Change in inventories |
100.4 | (48.3 | ) | 180.2 | (30.9 | ) | ||||||||||
|
|
|
|
|
|
|
|
|||||||||
Cash operating costs (a) |
326.0 | 122.4 | 594.6 | 295.0 | ||||||||||||
Add / (subtract) |
||||||||||||||||
Depreciation and amortization |
45.9 | 60.9 | 96.1 | 109.2 | ||||||||||||
Change in inventories |
33.2 | (2.0 | ) | 46.7 | 9.6 | |||||||||||
|
|
|
|
|
|
|
|
|||||||||
Total operating costs (b) |
405.1 | 181.3 | 737.4 | 413.8 | ||||||||||||
|
|
|
|
|
|
|
|
|||||||||
Uranium produced & purchased (million lbs) (c) |
9.4 | 4.3 | 17.1 | 11.3 | ||||||||||||
|
|
|
|
|
|
|
|
|||||||||
Cash costs per pound (a ÷ c) |
34.68 | 28.47 | 34.77 | 26.11 | ||||||||||||
Total costs per pound (b ÷ c) |
43.09 | 42.16 | 43.12 | 36.62 | ||||||||||||
|
|
|
|
|
|
|
|
- 6 -
Fuel services
(includes results for UF6, UO2 and fuel fabrication)
THREE MONTHS ENDED JUNE 30 |
SIX MONTHS ENDED JUNE 30 |
|||||||||||||||||||||||||
HIGHLIGHTS |
2015 | 2014 | CHANGE | 2015 | 2014 | CHANGE | ||||||||||||||||||||
Production volume (million kgU) |
3.1 | 3.8 | (18 | )% | 5.7 | 7.8 | (27 | )% | ||||||||||||||||||
Sales volume (million kgU) |
2.4 | 3.3 | (27 | )% | 5.4 | 5.1 | 6 | % | ||||||||||||||||||
Average realized price |
($Cdn/kgU) | 29.70 | 21.28 | 40 | % | 25.45 | 21.68 | 17 | % | |||||||||||||||||
Average unit cost of sales (including D&A) |
($Cdn/kgU) | 21.44 | 16.46 | 30 | % | 20.39 | 18.19 | 12 | % | |||||||||||||||||
Revenue ($ millions) |
70 | 70 | | 136 | 110 | 24 | % | |||||||||||||||||||
Gross profit ($ millions) |
19 | 16 | 19 | % | 27 | 18 | 50 | % | ||||||||||||||||||
Gross profit (%) |
27 | 23 | 17 | % | 20 | 16 | 25 | % |
SECOND QUARTER
Total revenue for the second quarter of 2015 remained the same as the prior year at $70 million. A 27% decrease in sales volumes was offset by a 40% increase in average realized price, primarily due to the mix of products sold.
The total cost of products and services sold (including D&A) decreased by 7% ($50 million compared to $54 million in the second quarter of 2014) due to the decrease in sales volumes, partially offset by an increase in the average unit cost of sales. When compared to 2014, the average unit cost of sales was 30% higher due to the mix of fuel services products sold.
The net effect was a $3 million increase in gross profit.
FIRST SIX MONTHS
In the first six months of the year, total revenue increased by 24% due to a 6% increase in sales volumes and a 17% increase in realized price that was the result of increased realized prices for UF6 and the mix of products sold.
The total cost of sales (including D&A) increased 17% ($109 million compared to $93 million in 2014) due to an increase in sales volume and a 12% increase in the average unit cost of sales, which resulted from the mix of fuel services products sold.
The net effect was a $9 million increase in gross profit.
NUKEM
THREE MONTHS ENDED JUNE 30 |
SIX MONTHS ENDED JUNE 30 |
|||||||||||||||||||||||||
HIGHLIGHTS |
2015 | 2014 | CHANGE | 2015 | 2014 | CHANGE | ||||||||||||||||||||
Uranium sales (million lbs)1 |
1.5 | 1.5 | | 4.0 | 2.2 | 82 | % | |||||||||||||||||||
Average realized price |
($Cdn/lb) | 50.47 | 41.63 | 21 | % | 42.80 | 41.01 | 4 | % | |||||||||||||||||
Cost of product sold (including D&A) |
70 | 49 | 43 | % | 156 | 84 | 86 | % | ||||||||||||||||||
Revenue ($ millions)1 |
81 | 62 | 31 | % | 178 | 94 | 89 | % | ||||||||||||||||||
Gross profit ($ millions) |
11 | 13 | (15 | )% | 22 | 10 | 120 | % | ||||||||||||||||||
Gross profit (%) |
14 | 21 | (33 | )% | 12 | 11 | 9 | % |
1 | Includes sales and revenue between our uranium, fuel services and NUKEM segments (200,000 pounds in sales and revenue of $10.8 million in Q2, 2015, nil in Q2, 2014; 743,0000 pounds in sales and revenue of $13.3 million in the first six of 2015, nil in the first six of 2014). |
SECOND QUARTER
During the second quarter of 2015, NUKEM delivered 1.5 million pounds of uranium, unchanged from the same period last year. Total revenues increased by 31% as a result of average realized prices which were 21% higher than those realized in the second quarter of 2014.
Gross margin percentage was 14% in the second quarter of 2015, a 33% decrease compared to the second quarter of 2014. The allocation of the historic purchase price to the sale of inventory on hand at the time of acquisition of NUKEM, impacted margins for the quarter.
The net effect was a $2 million decrease in gross profit.
- 7 -
FIRST SIX MONTHS
During the six months ended June 30, 2015, NUKEM delivered 4.0 million pounds of uranium, an increase of 82%, due to timing of customer requirements and generally lower activity in the market during 2014. Total revenues increased 89% due to an 82% increase in sales volumes and a 4% increase in average realized price.
Gross margin percentage was 12% for the first six months of 2015 as compared to 11% for the same period in 2014. Included in the 2014 margin was a $6 million write-down of inventory compared to a $3 million recovery in 2015. The write-down in 2014 was a result of a decline in the spot price during the period.
The net effect was a $12 million increase in gross profit.
Uranium 2015 Q2 updates
URANIUM PRODUCTION
THREE MONTHS ENDED JUNE 30 |
SIX MONTHS ENDED JUNE 30 |
|||||||||||||||||||||||||||
OUR SHARE (MILLION LBS) |
2015 | 2014 | CHANGE | 2015 | 2014 | CHANGE | 2015 PLAN | |||||||||||||||||||||
McArthur River/Key Lake |
2.9 | 2.1 | 38 | % | 5.5 | 5.9 | (7 | )% | 13.7 | |||||||||||||||||||
Cigar Lake1 |
1.2 | | | 1.6 | | | 3.0 4.0 | |||||||||||||||||||||
Inkai |
0.6 | 0.7 | (14 | )% | 1.2 | 1.4 | (14 | )% | 3.0 | |||||||||||||||||||
Rabbit Lake |
0.2 | 0.6 | (67 | )% | 1.1 | 1.1 | | 3.9 | ||||||||||||||||||||
Smith Ranch-Highland |
0.4 | 0.5 | (20 | )% | 0.9 | 1.0 | (10 | )% | 1.4 | |||||||||||||||||||
Crow Butte |
0.1 | 0.1 | | 0.2 | 0.3 | (33 | )% | 0.3 | ||||||||||||||||||||
Total |
5.4 | 4.0 | 35 | % | 10.5 | 9.7 | 8 | % | 25.3 26.3 |
1 | Commercial production achieved on May 1, 2015 see Cigar Lake update below. |
UPDATE TO FOREST FIRE SITUATION IN NORTHERN SASKATCHEWAN
The forest fire situation in northern Saskatchewan has been improving over the last few weeks and all evacuees have now been allowed to return home. Air and road access to our operations has improved and we have resumed normal shipping of packaged product from our operations. We still expect to meet our 2015 production target of 25.3 million to 26.3 million pounds, and our sales target of 31 million to 33 million pounds.
The fire risk across northern Saskatchewan has diminished, although we continue to monitor the situation closely and support our employees, their families and communities impacted by the situation.
MCARTHUR RIVER/KEY LAKE
Production for the quarter was 38% higher compared to the same period last year but 7% lower for the first half of the year due to the timing of mill maintenance, including an unplanned mill maintenance outage during the first quarter. The operation remains on track to achieve our planned 2015 production.
We now have a licence production limit of 25 million pounds per year (100% basis) at both McArthur River and Key Lake. The increased production limit aligns with our strategy to maintain the flexibility to adjust to market conditions.
CIGAR LAKE
The jet boring system at the Cigar Lake mine continued to perform as expected, and during the first half of 2015, we successfully mined 4.8 million pounds of uranium for shipment to the McClean Lake mill. We are continuing to ramp up mine production, and now have three jet boring machines (JBS) commissioned for use underground.
The mined ore is routinely transported to the McClean Lake mill, which, during the second quarter, packaged approximately 2.4 million pounds (100% basis, 1.2 million pounds our share), for total production of 3.1 million pounds during the first half of 2015. Cigar Lake remains on track to achieve the annual production target of 6 million to 8 million packaged pounds (100% basis).
Commercial production signals a transition in the accounting treatment for costs incurred at the mine. Cigar Lake met all of the criteria for commercial production, including cycle time and process specifications, in the second quarter. Therefore, effective May 1, 2015, we began charging all production costs, including depreciation, to inventory and subsequently recognizing them in cost of sales as the product is sold.
- 8 -
We expect Cigar Lake to produce between 6 million and 8 million packaged pounds in 2015; our share is 3 million to 4 million pounds. As we ramp up production to 18 million pounds (100% basis) by 2018, volumes may not be linear year-to-year, but will vary based on our operational experience. To ensure the most efficient operation of the mine and mill throughout the year, we expect to continually manage ore supply and, therefore, may halt and resume mining several times during a quarter without impacting planned annual production.
Caution about forward-looking information relating to Cigar Lake
This discussion of our expectations for Cigar Lake, including our plan for 6 million to 8 million packaged pounds (100%) in 2015, is forward-looking information that is based upon the assumptions and subject to the material risks discussed under the heading Caution about forward-looking information beginning on page 10.
INKAI
Production was 14% lower for both the second quarter and the first six months of the year compared to the same periods in 2014 due to the timing of new wellfield development. The operation remains on track to achieve our planned 2015 production.
The block 3 test leach facility is now operational and state commissioning of the test wellfields was accomplished during the second quarter. Our application for an extension of the block 3 deposit evaluation period is still pending final approval from the Ministry of Energy of the Republic of Kazakhstan. Inkai continues working on the final appraisal of the mineral potential of block 3 according to Kazakhstan standards.
Qualified persons
The technical and scientific information discussed in this document for our material properties (McArthur River/Key Lake, Inkai and Cigar Lake) was approved by the following individuals who are qualified persons for the purposes of NI 43-101:
CIGAR LAKE
| Les Yesnik, general manager, Cigar Lake, Cameco |
- 9 -
Caution about forward-looking information
This document includes statements and information about our expectations for the future. When we discuss our strategy, plans, future financial and operating performance, or other things that have not yet taken place, we are making statements considered to be forward-looking information or forward-looking statements under Canadian and United States securities laws. We refer to them in this document as forward-looking information.
Key things to understand about the forward-looking information in this document:
| It typically includes words and phrases about the future, such as: anticipate, believe, estimate, expect, plan, will, intend, goal, target, forecast, project, strategy and outlook (see examples below). |
| It represents our current views, and can change significantly. |
| It is based on a number of material assumptions, including those we have listed on pages 11, which may prove to be incorrect. |
| Actual results and events may be significantly different from what we currently expect, due to the risks associated with our business. We list a number of these material risks below. We recommend you also review our annual information form, first quarter and second quarter MD&A, and annual MD&A, which includes a discussion of other material risks that could cause actual results to differ significantly from our current expectations. |
| Forward-looking information is designed to help you understand managements current views of our near and longer term prospects, and it may not be appropriate for other purposes. We will not necessarily update this information unless we are required to by securities laws. |
Examples of forward-looking information in this document
Material risks
- 10 -
Material assumptions
Quarterly dividend notice
We announced today that our board of directors approved a quarterly dividend of $0.10 per share on the outstanding common shares of the corporation that is payable on October 15, 2015, to shareholders of record at the close of business on September 30, 2015.
Conference call
We invite you to join our second quarter conference call on Thursday, July 30, 2015 at 1:00 p.m. Eastern.
The call will be open to all investors and the media. To join the call, please dial (800) 769-8320 (Canada and US) or (416) 340-8530. An operator will put your call through. A live audio feed of the conference call will be available from a link at cameco.com. See the link on our home page on the day of the call.
A recorded version of the proceedings will be available:
| on our website, cameco.com, shortly after the call |
| on post view until midnight, Eastern, September 2, 2015, by calling (800) 408-3053 (Canada and US) or (905) 694-9451 (Passcode 5846753#) |
Additional information
You can find a copy of our second quarter MD&A and interim financial statements on our website at cameco.com, on SEDAR at sedar.com and on EDGAR at sec.gov/edgar.shtml.
Additional information, including our 2014 annual managements discussion and analysis, annual audited financial statements and annual information form, is available on SEDAR at sedar.com, on EDGAR at sec.gov/edgar.shtml and on our website at cameco.com.
- 11 -
Profile
We are one of the worlds largest uranium producers, a significant supplier of conversion services and one of two CANDU fuel manufacturers in Canada. Our competitive position is based on our controlling ownership of the worlds largest high-grade reserves and low-cost operations. Our uranium products are used to generate clean electricity in nuclear power plants around the world. We also explore for uranium in the Americas, Australia and Asia. Our shares trade on the Toronto and New York stock exchanges. Our head office is in Saskatoon, Saskatchewan.
As used in this news release, the terms we, us, our, the Company and Cameco mean Cameco Corporation and its subsidiaries; including NUKEM Energy GmbH, unless otherwise indicated.
- End -
Investor inquiries: | Rachelle Girard | (306) 956-6403 | ||
Media inquiries: | Gord Struthers | (306) 956-6593 |
- 12 -
Exhibit 99.2
Managements discussion and analysis
for the quarter ended June 30, 2015
SECOND QUARTER UPDATE |
4 | |||
CONSOLIDATED FINANCIAL RESULTS |
8 | |||
OUTLOOK FOR 2015 |
15 | |||
LIQUIDITY AND CAPITAL RESOURCES |
17 | |||
FINANCIAL RESULTS BY SEGMENT |
||||
URANIUM |
19 | |||
FUEL SERVICES |
21 | |||
NUKEM |
21 | |||
OUR OPERATIONS |
||||
URANIUM 2015 Q2 UPDATES |
22 | |||
FUEL SERVICES 2015 Q2 UPDATES |
24 | |||
QUALIFIED PERSONS |
24 | |||
ADDITIONAL INFORMATION |
25 |
This managements discussion and analysis (MD&A) includes information that will help you understand managements perspective of our unaudited condensed consolidated interim financial statements and notes for the quarter ended June 30, 2015 (interim financial statements). The information is based on what we knew as of July 29, 2015 and updates our first quarter and annual MD&A included in our 2014 annual report.
As you review this MD&A, we encourage you to read our interim financial statements as well as our audited consolidated financial statements and notes for the year ended December 31, 2014 and annual MD&A. You can find more information about Cameco, including our audited consolidated financial statements and our most recent annual information form, on our website at cameco.com, on SEDAR at sedar.com or on EDGAR at sec.gov. You should also read our annual information form before making an investment decision about our securities.
The financial information in this MD&A and in our financial statements and notes are prepared according to International Financial Reporting Standards (IFRS), unless otherwise indicated.
Unless we have specified otherwise, all dollar amounts are in Canadian dollars.
Throughout this document, the terms we, us, our and Cameco mean Cameco Corporation and its subsidiaries, including NUKEM Energy Gmbh (NUKEM), unless otherwise indicated.
Caution about forward-looking information
Our MD&A includes statements and information about our expectations for the future. When we discuss our strategy, plans, future financial and operating performance, or other things that have not yet taken place, we are making statements considered to be forward-looking information or forward-looking statements under Canadian and United States securities laws. We refer to them in this MD&A as forward-looking information.
Key things to understand about the forward-looking information in this MD&A:
| It typically includes words and phrases about the future, such as: anticipate, believe, estimate, expect, plan, will, intend, goal, target, forecast, project, strategy and outlook (see examples below). |
| It represents our current views, and can change significantly. |
| It is based on a number of material assumptions, including those we have listed on page 3, which may prove to be incorrect. |
| Actual results and events may be significantly different from what we currently expect, due to the risks associated with our business. We list a number of these material risks on pages 2 and 3. We recommend you also review our annual information form, first quarter MD&A, and annual MD&A, which includes a discussion of other material risks that could cause actual results to differ significantly from our current expectations. |
| Forward-looking information is designed to help you understand managements current views of our near and longer term prospects, and it may not be appropriate for other purposes. We will not necessarily update this information unless we are required to by securities laws. |
Examples of forward-looking information in this MD&A
Material risks
2 CAMECO CORPORATION
Material assumptions
2015 SECOND QUARTER REPORT 3
Our strategy
We are a pure-play nuclear fuel supplier, focused on taking advantage of the long-term growth we see coming in our industry, while maintaining the ability to respond to market conditions as they evolve. Our strategy is to profitably produce at a pace aligned with market signals in order to increase long-term shareholder value, and to do that with a focus on safety, people and the environment.
We plan to:
| ensure continued reliable, low-cost production from our flagship operation, McArthur River/Key Lake, and seek to expand that production |
| ensure continued reliable, low-cost production at Inkai |
| successfully ramp up production at Cigar Lake |
| manage the rest of our production facilities and other sources of supply in a manner that retains the flexibility to respond to market signals and take advantage of value adding opportunities within our own portfolio and the uranium market |
| maintain our low-cost advantage by focusing on execution and operational excellence |
You can read more about our strategy in our 2014 annual MD&A.
Second quarter update
On January 31, 2014, we announced the sale of our 31.6% limited partnership interest in Bruce Power Limited Partnership (BPLP) and related entities for $450 million. The sale closed on March 27, 2014 and was accounted for as being completed effective January 1, 2014.
Under IFRS, we are required to report the results from discontinued operations separately from continuing operations. We have included the financial impact of the sale of BPLP in discontinued operations.
Throughout this document, for comparison purposes, all results for earnings from continuing operations and cash from continuing operations have been revised to exclude BPLP. The impact of BPLP is shown separately as a discontinued operation.
Our performance
HIGHLIGHTS | THREE MONTHS ENDED JUNE 30 |
SIX MONTHS ENDED JUNE 30 |
||||||||||||||||||||||
($ MILLIONS EXCEPT WHERE INDICATED) |
2015 | 2014 | CHANGE | 2015 | 2014 | CHANGE | ||||||||||||||||||
Revenue |
565 | 502 | 13 | % | 1,130 | 921 | 23 | % | ||||||||||||||||
Gross profit |
153 | 136 | 13 | % | 282 | 243 | 16 | % | ||||||||||||||||
Net earnings attributable to equity holders |
88 | 127 | (31 | )% | 79 | 259 | (69 | )% | ||||||||||||||||
$ per common share (diluted) |
0.22 | 0.32 | (31 | )% | 0.20 | 0.65 | (69 | )% | ||||||||||||||||
Adjusted net earnings (non-IFRS, see page 9) |
46 | 79 | (42 | )% | 115 | 115 | | |||||||||||||||||
$ per common share (adjusted and diluted) |
0.12 | 0.20 | (40 | )% | 0.29 | 0.29 | | |||||||||||||||||
Cash provided by (used in) operations (after working capital changes) |
(65 | ) | (25 | ) | (160 | )% | 68 | (18 | ) | 478 | % |
SECOND QUARTER
Net earnings attributed to equity holders this quarter were $88 million ($0.22 per share diluted) compared to net earnings of $127 million ($0.32 per share diluted) in the second quarter of 2014. In addition to the items noted below, our net earnings were affected by mark-to-market gains on foreign exchange derivatives.
On an adjusted basis, our earnings this quarter were $46 million ($0.12 per share diluted) compared to $79 million ($0.20 per share diluted) (non-IFRS measure, see page 9) in the second quarter of 2014. The change was mainly due to:
| higher administrative costs |
| a favourable settlement of $28 million with respect to a dispute regarding a long-term supply contract with a utility customer recorded in the second quarter of 2014 |
4 CAMECO CORPORATION
partially offset by:
| higher gross profit from uranium and fuel services segments |
| settlement costs of $12 million with respect to the early redemption our Series C debentures recorded during the second quarter of 2014 |
See Financial results by segment on page 19 for more detailed discussion.
FIRST SIX MONTHS
Net earnings in the first six months of the year were $79 million ($0.20 per share diluted) compared to $259 million ($0.65 per share diluted) in the first six months of 2014. In addition to the items noted below, our net earnings were affected by mark-to-market losses on foreign exchange derivatives. Our 2014 earnings also included a gain on the sale of our interest in BPLP of $127 million.
On an adjusted basis, our earnings for the first six months of this year were $115 million ($0.29 per share diluted) (non-IFRS measure, see page 9) unchanged from the first six months of 2014. Key variances include:
| higher administration costs |
| a favourable settlement of $28 million with respect to a dispute regarding a long-term supply contract with a utility customer recorded in the second quarter of 2014 |
| lower tax recovery |
partially offset by:
| higher gross profit from our uranium, fuel services and NUKEM segments |
| lower losses from equity accounted investments |
Our 2014 adjusted net earnings were also impacted by:
| an early termination fee of $18 million incurred in 2014 as a result of the cancellation of our toll conversion agreement with Springfields Fuels Ltd. (SFL), which was to expire in 2016 |
| settlement costs of $12 million with respect to the early redemption our Series C debentures recorded in 2014 |
See Financial results by segment on page 19 for more detailed discussion.
Operations update
THREE MONTHS ENDED JUNE 30 |
SIX MONTHS ENDED JUNE 30 |
|||||||||||||||||||||||||||
HIGHLIGHTS |
2015 | 2014 | CHANGE | 2015 | 2014 | CHANGE | ||||||||||||||||||||||
Uranium |
Production volume (million lbs) | 5.4 | 4.0 | 35 | % | 10.5 | 9.7 | 8 | % | |||||||||||||||||||
Sales volume (million lbs)1 | 7.3 | 7.4 | (1 | )% | 14.3 | 14.3 | | |||||||||||||||||||||
Average realized price | ($US/lb) | 46.57 | 45.93 | 1 | % | 45.03 | 46.26 | (3 | )% | |||||||||||||||||||
($Cdn/lb) | 58.04 | 50.76 | 14 | % | 55.45 | 50.67 | 9 | % | ||||||||||||||||||||
Revenue ($millions)1 | 424 | 376 | 13 | % | 791 | 724 | 9 | % | ||||||||||||||||||||
Gross profit ($millions) | 127 | 110 | 15 | % | 240 | 229 | 5 | % | ||||||||||||||||||||
Fuel services |
Production volume (million kgU) | 3.1 | 3.8 | (18 | )% | 5.7 | 7.8 | (27 | )% | |||||||||||||||||||
Sales volume (million kgU) | 2.4 | 3.3 | (27 | )% | 5.4 | 5.1 | 6 | % | ||||||||||||||||||||
Average realized price | ($Cdn/kgU) | 29.70 | 21.28 | 40 | % | 25.45 | 21.68 | 17 | % | |||||||||||||||||||
Revenue ($millions) | 70 | 70 | | 136 | 110 | 24 | % | |||||||||||||||||||||
Gross profit ($millions) | 19 | 16 | 19 | % | 27 | 18 | 50 | % | ||||||||||||||||||||
NUKEM |
Uranium sales (million lbs)1 | 1.5 | 1.5 | | 4.0 | 2.2 | 82 | % | ||||||||||||||||||||
Average realized price | ($Cdn/lb) | 50.47 | 41.63 | 21 | % | 42.80 | 41.01 | 4 | % | |||||||||||||||||||
Revenue ($millions)1 | 81 | 62 | 31 | % | 178 | 94 | 89 | % | ||||||||||||||||||||
Gross profit ($millions) | 11 | 13 | (15 | )% | 22 | 10 | 120 | % |
1 | Includes sales and revenue between our uranium, fuel services and NUKEM segments. Please see Financial results by segment beginning on page 19. |
Production in our uranium segment this quarter was 35% higher compared to the second quarter of 2014, mainly due to production from Cigar Lake and higher production from McArthur River/Key Lake partially offset by lower production at Rabbit Lake, Inkai, and our US operations. See Uranium 2015 Q2 updates starting on page 22 for more information.
2015 SECOND QUARTER REPORT 5
Production in our fuel services segment was 18% lower this quarter than in the second quarter of 2014 due to lower planned annual production in 2015.
Key highlights:
| Forest fire risk across northern Saskatchewan has diminished and all evacuees have now been allowed to return home, although we continue to monitor the situation closely. Air and road access to our operations has improved and we have resumed normal shipping of packaged product from our operations. We still expect to meet our 2015 production and sales targets. |
| At Cigar Lake, the jet boring system (JBS) continued to perform as expected. During the first half of the year, we successfully mined 4.8 million pounds of uranium for shipment to the McClean Lake mill, which, during the second quarter, packaged approximately 2.4 million pounds (100% basis, 1.2 million pounds our share). |
| At McArthur River, the CNSC and the province of Saskatchewan have approved an increase of our licence production limit to 25 million pounds per year (100% basis), which matches the annual mill production licence limit at Key Lake. The increased production limit aligns with our strategy to maintain the flexibility to adjust to market conditions. |
Also of note:
Ken Seitz, our senior vice-president and chief commercial officer is resigning effective August 15, 2015, to take a chief executive officer position with a company outside the nuclear industry. Mr. Seitz had oversight for our marketing, corporate development, and exploration activities. At this time, the plan is to reallocate these activities, and his other responsibilities, among members of our officer team. This re-allocation will be finalized in September 2015.
Uranium market update
The market continued to be flat in the second quarter, with spot prices remaining in the mid-$30s (US). The quantity transacted in the spot market was at normal levels, though no significant price trends emerged. We believe this flat environment is simply a function of the currently over-supplied market, where we believe participants uncovered requirements start to open up in the next two to three years. There were supply disruptions in the first half of 2015 that reduced the over-supply situation, but the reductions did not result in any notable change in spot or term demand from utilities.
Japan restarts remain the most important driver of market sentiment in the short term. While the market has been disappointed with ongoing delays, the first reactor restarts appear to be imminent with Kyushu having loaded fuel into Sendai unit 1 for anticipated restart in August, while preparing Sendai unit 2 for restart this fall. We remain confident that a significant number of units will be restarted in Japan over time, though the regulatory approval process and restart schedules are clearly hard to predict.
Beyond these short-term challenges in the market, longer term, strong fundamentals underpin a positive outlook for the industry. Globally, there are 64 reactors currently under construction, with a net increase of 82 reactors expected over the next 10 years. China continues to execute on its remarkable nuclear growth plan, with 26 reactors operating and 24 under construction. India continues to demonstrate confidence in its nuclear growth strategy, evidenced by the signing of new long-term uranium supply agreements with major producers, including Cameco.
On the supply side, we continue to see depressed market conditions having a negative impact on future supply potential, as suppliers struggle to justify the underlying economics. The cancellation of a planned mine expansion in Australia further supports our view that current price levels do not justify the development of new uranium supply projects. Demand growth combined with the timing, development and execution of new supply projects and the continued performance of existing supply, will determine the pace of market recovery.
Caution about forward-looking information relating to our uranium market update
This discussion of our expectations for the nuclear industry, including its growth profile, future global uranium supply and demand, and net increase in reactors, is forward-looking information that is based upon the assumptions and subject to the material risks discussed under the heading Caution about forward-looking information beginning on page 2.
6 CAMECO CORPORATION
Industry prices
JUN 30 2015 |
MAR 31 2015 |
DEC 31 2014 |
SEP 30 2014 |
JUN 30 2014 |
MAR 31 2014 |
|||||||||||||||||||
Uranium ($US/lb U3O8)1 |
||||||||||||||||||||||||
Average spot market price |
36.38 | 39.45 | 35.50 | 35.40 | 28.23 | 34.00 | ||||||||||||||||||
Average long-term price |
46.00 | 49.50 | 49.50 | 45.00 | 44.50 | 46.00 | ||||||||||||||||||
|
|
|
|
|
|
|
|
|
|
|
|
|||||||||||||
Fuel services ($US/kgU as UF6)1 |
||||||||||||||||||||||||
Average spot market price |
||||||||||||||||||||||||
North America |
7.50 | 7.50 | 8.25 | 7.25 | 7.25 | 7.63 | ||||||||||||||||||
Europe |
8.00 | 8.00 | 8.63 | 7.50 | 7.50 | 8.00 | ||||||||||||||||||
Average long-term price |
||||||||||||||||||||||||
North America |
16.00 | 16.00 | 16.00 | 16.00 | 16.00 | 16.00 | ||||||||||||||||||
Europe |
17.00 | 17.00 | 17.00 | 17.00 | 17.00 | 17.00 | ||||||||||||||||||
Note: the industry does not publish UO2 prices. |
1 | Average of prices reported by TradeTech and Ux Consulting (Ux) |
On the spot market, where purchases call for delivery within one year, the volume reported for the second quarter of 2015 was approximately 11 million pounds. This compares to approximately 8 million pounds in the second quarter of 2014.
At the end of the quarter, the average reported spot price had declined by $3.07 (US) from the previous quarter to $36.38 (US) per pound. The average reported long-term price also declined to $46.00 (US) per pound, down $3.50 (US) from the previous quarter.
Long-term contracts usually call for deliveries to begin more than two years after the contract is finalized, and use a number of pricing formulas, including fixed prices escalated over the term of the contract, and market referenced prices (spot and long-term indicators quoted near the time of delivery).
Spot and long-term UF6 conversion prices held firm during the quarter.
2015 SECOND QUARTER REPORT 7
Financial results
This section of our MD&A discusses our performance, financial condition and outlook for the future.
Consolidated financial results
HIGHLIGHTS | THREE MONTHS ENDED JUNE 30 |
SIX MONTHS ENDED JUNE 30 |
||||||||||||||||||||||
($ MILLIONS EXCEPT WHERE INDICATED) |
2015 | 2014 | CHANGE | 2015 | 2014 | CHANGE | ||||||||||||||||||
Revenue |
565 | 502 | 13 | % | 1,130 | 921 | 23 | % | ||||||||||||||||
Gross profit |
153 | 136 | 13 | % | 282 | 243 | 16 | % | ||||||||||||||||
Net earnings attributable to equity holders |
88 | 127 | (31 | )% | 79 | 259 | (69 | )% | ||||||||||||||||
$ per common share (basic) |
0.22 | 0.32 | (31 | )% | 0.20 | 0.65 | (69 | )% | ||||||||||||||||
$ per common share (diluted) |
0.22 | 0.32 | (31 | )% | 0.20 | 0.65 | (69 | )% | ||||||||||||||||
Adjusted net earnings (non-IFRS, see page 9) |
46 | 79 | (42 | )% | 115 | 115 | | |||||||||||||||||
$ per common share (adjusted and diluted) |
0.12 | 0.20 | (40 | )% | 0.29 | 0.29 | | |||||||||||||||||
Cash provided by (used in) operations (after working capital changes) |
(65 | ) | (25 | ) | (160 | )% | 68 | (18 | ) | 478 | % |
NET EARNINGS
Net earnings attributed to equity holders this quarter were $88 million ($0.22 per share diluted) compared to net earnings of $127 million ($0.32 per share diluted) in the second quarter of 2014. In addition to the items noted below, our net earnings were affected by mark-to-market gains on foreign exchange derivatives.
On an adjusted basis, our earnings this quarter were $46 million ($0.12 per share diluted) compared to $79 million ($0.20 per share diluted) (non-IFRS measure, see page 9) in the second quarter of 2014. The change was mainly due to:
| higher administrative costs |
| a favourable settlement of $28 million with respect to a dispute regarding a long-term supply contract with a utility customer recorded in the second quarter of 2014 |
partially offset by:
| higher gross profit from uranium and fuel services segments |
| settlement costs of $12 million with respect to the early redemption our Series C debentures recorded during the second quarter of 2014 |
Net earnings in the first six months of the year were $79 million ($0.20 per share diluted) compared to $259 million ($0.65 per share diluted) in the first six months of 2014. In addition to the items noted below, our net earnings were affected by mark-to-market losses on foreign exchange derivatives. Our 2014 earnings also included a gain on the sale of our interest in BPLP of $127 million.
On an adjusted basis, our earnings for the first six months of this year were $115 million ($0.29 per share diluted) (non-IFRS measure, see page 9) unchanged from the first six months of 2014. Key variances include:
| higher administration costs |
| a favourable settlement of $28 million with respect to a dispute regarding a long-term supply contract with a utility customer recorded in the second quarter of 2014 |
| lower tax recovery |
partially offset by:
| higher gross profit from our uranium, fuel services and NUKEM segments |
| lower losses from equity accounted investments |
Our 2014 adjusted net earnings were also impacted by:
| an early termination fee of $18 million incurred in 2014 as a result of the cancellation of our toll conversion agreement with Springfields Fuels Ltd. (SFL), which was to expire in 2016 |
| settlement costs of $12 million with respect to the early redemption our Series C debentures recorded in 2014 |
See Financial results by segment on page 19 for more detailed discussion.
8 CAMECO CORPORATION
ADJUSTED NET EARNINGS (NON-IFRS MEASURE)
Adjusted net earnings is a measure that does not have a standardized meaning or a consistent basis of calculation under IFRS (non-IFRS measure). We use this measure as a more meaningful way to compare our financial performance from period to period. We believe that, in addition to conventional measures prepared in accordance with IFRS, certain investors use this information to evaluate our performance. Adjusted net earnings is our net earnings attributable to equity holders, adjusted to better reflect the underlying financial performance for the reporting period. The adjusted earnings measure reflects the matching of the net benefits of our hedging program with the inflows of foreign currencies in the applicable reporting period, and has also been adjusted for NUKEM purchase price inventory write-downs and recoveries, income taxes on adjustments, impairment charges on non-producing property, and the after tax gain on the sale of our interest in BPLP.
Adjusted net earnings is non-standard supplemental information and should not be considered in isolation or as a substitute for financial information prepared according to accounting standards. Other companies may calculate this measure differently, so you may not be able to make a direct comparison to similar measures presented by other companies.
The following table reconciles adjusted net earnings with our net earnings.
THREE MONTHS ENDED JUNE 30 |
SIX MONTHS ENDED JUNE 30 |
|||||||||||||||
($ MILLIONS) |
2015 | 2014 | 2015 | 2014 | ||||||||||||
Net earnings attributable to equity holders |
88 | 127 | 79 | 259 | ||||||||||||
|
|
|
|
|
|
|
|
|||||||||
Adjustments |
||||||||||||||||
Adjustments on derivatives (pre-tax) |
(57 | ) | (66 | ) | 44 | (23 | ) | |||||||||
NUKEM purchase price inventory recovery |
| | (3 | ) | | |||||||||||
Impairment charge |
| | 6 | | ||||||||||||
Income taxes on adjustments |
15 | 18 | (11 | ) | 6 | |||||||||||
Gain on interest in BPLP (after tax) |
| | | (127 | ) | |||||||||||
|
|
|
|
|
|
|
|
|||||||||
Adjusted net earnings |
46 | 79 | 115 | 115 | ||||||||||||
|
|
|
|
|
|
|
|
2015 SECOND QUARTER REPORT 9
The following table shows what contributed to the change in adjusted net earnings this quarter.
($ MILLIONS) |
THREE MONTHS ENDED JUNE 30 |
SIX MONTHS ENDED JUNE 30 |
||||||||
Adjusted net earnings 2014 |
79 | 115 | ||||||||
Change in gross profit by segment |
(We calculate gross profit by deducting from revenue the cost of products and services sold, and depreciation and amortization (D&A), net of hedging benefits) | |||||||||
Uranium |
Lower sales volume | (2 | ) | | ||||||
Higher (lower) realized prices ($US) | 5 | (17 | ) | |||||||
Foreign exchange impact on realized prices | 48 | 86 | ||||||||
Higher costs | (35 | ) | (57 | ) | ||||||
|
|
|
|
|||||||
change uranium | 16 | 12 | ||||||||
|
|
|
|
|||||||
Fuel services |
Higher (lower) sales volume | (5 | ) | 1 | ||||||
Higher realized prices ($Cdn) | 20 | 20 | ||||||||
Higher costs | (12 | ) | (12 | ) | ||||||
|
|
|
|
|||||||
change fuel services | 3 | 9 | ||||||||
|
|
|
|
|||||||
NUKEM |
Gross profit | (2 | ) | 9 | ||||||
|
|
|
|
|||||||
change NUKEM | (2 | ) | 9 | |||||||
|
|
|
|
|||||||
Other changes |
||||||||||
Higher administration expenditures |
(13 | ) | (10 | ) | ||||||
Higher exploration expenditures |
(2 | ) | | |||||||
Higher income taxes |
(3 | ) | (18 | ) | ||||||
Contract termination fee (SFL) |
| 18 | ||||||||
Partial arbitration award |
(28 | ) | (28 | ) | ||||||
Debenture redemption premium |
12 | 12 | ||||||||
Loss on disposal of assets |
6 | 5 | ||||||||
Loss on equity-accounted investments |
2 | 12 | ||||||||
Foreign exchange losses |
(18 | ) | (22 | ) | ||||||
Other |
(6 | ) | 1 | |||||||
|
|
|
|
|||||||
Adjusted net earnings 2015 |
46 | 115 | ||||||||
|
|
|
|
See Financial results by segment on page 19 for more detailed discussion.
Quarterly trends
HIGHLIGHTS | 2015 | 2014 | 2013 | |||||||||||||||||||||||||||||
($ MILLIONS EXCEPT PER SHARE AMOUNTS) |
Q2 | Q1 | Q4 | Q3 | Q2 | Q1 | Q4 | Q3 | ||||||||||||||||||||||||
Revenue |
565 | 566 | 889 | 587 | 502 | 419 | 977 | 597 | ||||||||||||||||||||||||
Net earnings (loss) attributable to equity holders |
88 | (9 | ) | 73 | (146 | ) | 127 | 131 | 64 | 211 | ||||||||||||||||||||||
$ per common share (basic) |
0.22 | (0.02 | ) | 0.18 | (0.37 | ) | 0.32 | 0.33 | 0.16 | 0.53 | ||||||||||||||||||||||
$ per common share (diluted) |
0.22 | (0.02 | ) | 0.18 | (0.37 | ) | 0.32 | 0.33 | 0.16 | 0.53 | ||||||||||||||||||||||
Adjusted net earnings (non-IFRS, see page 9) |
46 | 69 | 205 | 93 | 79 | 36 | 150 | 208 | ||||||||||||||||||||||||
$ per common share (adjusted and diluted) |
0.12 | 0.18 | 0.52 | 0.23 | 0.20 | 0.09 | 0.38 | 0.53 | ||||||||||||||||||||||||
Earnings (loss) from continuing operations |
88 | (10 | ) | 72 | (146 | ) | 127 | 4 | 28 | 163 | ||||||||||||||||||||||
$ per common share (basic) |
0.22 | (0.02 | ) | 0.18 | (0.37 | ) | 0.32 | 0.01 | 0.07 | 0.41 | ||||||||||||||||||||||
$ per common share (diluted) |
0.22 | (0.02 | ) | 0.18 | (0.37 | ) | 0.32 | 0.01 | 0.07 | 0.41 | ||||||||||||||||||||||
Cash provided by continuing operations |
(65 | ) | 134 | 236 | 263 | (25 | ) | 7 | 163 | 154 |
Key things to note:
| our financial results are strongly influenced by the performance of our uranium segment, which accounted for 75% of consolidated revenues in the second quarter of 2015 |
10 CAMECO CORPORATION
| the timing of customer requirements, which tend to vary from quarter to quarter, drives revenue in the uranium and fuel services segments, meaning quarterly results are not necessarily a good indication of annual results due to seasonal variability |
| net earnings do not trend directly with revenue due to unusual items and transactions that occur from time to time. We use adjusted net earnings, a non-IFRS measure, as a more meaningful way to compare our results from period to period (see page 9 for more information). |
| cash from operations tends to fluctuate as a result of the timing of deliveries and product purchases in our uranium and fuel services segments |
The table that follows presents the differences between net earnings and adjusted net earnings for the previous seven quarters.
HIGHLIGHTS |
2015 | 2014 | 2013 | |||||||||||||||||||||||||||||
($ MILLIONS EXCEPT PER SHARE AMOUNTS) |
Q2 | Q1 | Q4 | Q3 | Q2 | Q1 | Q4 | Q3 | ||||||||||||||||||||||||
Net earnings (loss) attributable to equity holders |
88 | (9 | ) | 73 | (146 | ) | 127 | 131 | 64 | 211 | ||||||||||||||||||||||
|
|
|
|
|
|
|
|
|
|
|
|
|
|
|
|
|||||||||||||||||
Adjustments |
||||||||||||||||||||||||||||||||
Adjustments on derivatives (pre-tax) |
(57 | ) | 101 | 10 | 60 | (66 | ) | 44 | 36 | (41 | ) | |||||||||||||||||||||
NUKEM purchase price inventory write-down (recovery) |
| (3 | ) | (4 | ) | (2 | ) | | | (3 | ) | 17 | ||||||||||||||||||||
Impairment charges |
| 6 | 172 | 196 | | | 70 | 15 | ||||||||||||||||||||||||
Income taxes on adjustments |
15 | (26 | ) | (46 | ) | (15 | ) | 18 | (12 | ) | (17 | ) | 6 | |||||||||||||||||||
Gain on sale of BPLP (after tax) |
| | | | | (127 | ) | | | |||||||||||||||||||||||
|
|
|
|
|
|
|
|
|
|
|
|
|
|
|
|
|||||||||||||||||
Adjusted net earnings (non-IFRS, see page 9) |
46 | 69 | 205 | 93 | 79 | 36 | 150 | 208 | ||||||||||||||||||||||||
|
|
|
|
|
|
|
|
|
|
|
|
|
|
|
|
Discontinued operation
On March 27, 2014, we completed the sale of our 31.6% limited partnership interest in BPLP, which was accounted for effective January 1, 2014. The aggregate sale price for our interest in BPLP and certain related entities was $450 million. We realized an after tax gain of $127 million on this divestiture. As a result of the transaction, we presented the results of BPLP as a discontinued operation and we revised our statement of earnings, statement of comprehensive income and statement of cash flows to reflect the change in presentation. See note 4 to the interim financial statements for more information.
Corporate expenses
ADMINISTRATION
THREE MONTHS ENDED JUNE 30 |
SIX MONTHS ENDED JUNE 30 |
|||||||||||||||||||||||
($ MILLIONS) |
2015 | 2014 | CHANGE | 2015 | 2014 | CHANGE | ||||||||||||||||||
Direct administration |
45 | 35 | 29 | % | 84 | 74 | 14 | % | ||||||||||||||||
|
|
|
|
|
|
|
|
|
|
|
|
|||||||||||||
Stock-based compensation |
4 | 1 | 300 | % | 8 | 8 | | |||||||||||||||||
|
|
|
|
|
|
|
|
|
|
|
|
|||||||||||||
Total administration |
49 | 36 | 36 | % | 92 | 82 | 12 | % | ||||||||||||||||
|
|
|
|
|
|
|
|
|
|
|
|
Direct administration costs were $10 million higher for the second quarter compared to the same period last year, and $10 million higher for the first six months due to slightly higher planned expenditures related to the timing of project work and other costs, as well as costs related to our collaboration agreements.
Stock based compensation in the first six months was unchanged from 2014.
EXPLORATION
In the second quarter, uranium exploration expenses were $11 million, an increase of $2 million compared to the second quarter of 2014. Exploration expenses for the first six months of the year decreased by $1 million compared to 2014, to $23 million, due to a planned reduction in expenditures.
INCOME TAXES
We recorded an income tax recovery of $5 million in the second quarter of 2015, compared to a recovery of $6 million in the second quarter of 2014.
2015 SECOND QUARTER REPORT 11
On an adjusted basis, we recorded an income tax recovery of $20 million this quarter compared to recovery of $23 million in the second quarter of 2014. In 2015, we recorded losses of $164 million in Canada compared to $116 million in 2014, while earnings in foreign jurisdictions increased to $190 million from $171 million. The resulting increase in income tax recovery in Canada is more than offset by increased tax expense in the foreign jurisdictions.
In the first six months of 2015, we recorded an income tax recovery of $50 million compared to a recovery of $51 million in 2014.
On an adjusted basis, we recorded an income tax recovery of $39 million for the first six months compared to a recovery of $57 million in 2014 due to higher pre-tax adjusted earnings and increased tax expense in foreign jurisdictions in 2015.
THREE MONTHS ENDED JUNE 30 |
SIX MONTHS ENDED JUNE 30 |
|||||||||||||||
($ MILLIONS) |
2015 | 2014 | 2015 | 2014 | ||||||||||||
Pre-tax adjusted earnings1 |
||||||||||||||||
Canada2 |
(164 | ) | (116 | ) | (267 | ) | (266 | ) | ||||||||
Foreign |
190 | 171 | 342 | 323 | ||||||||||||
|
|
|
|
|
|
|
|
|||||||||
Total pre-tax adjusted earnings |
26 | 55 | 75 | 57 | ||||||||||||
|
|
|
|
|
|
|
|
|||||||||
Adjusted income taxes1 |
||||||||||||||||
Canada2 |
(33 | ) | (29 | ) | (59 | ) | (66 | ) | ||||||||
Foreign |
13 | 6 | 20 | 9 | ||||||||||||
|
|
|
|
|
|
|
|
|||||||||
Adjusted income tax expense (recovery) |
(20 | ) | (23 | ) | (39 | ) | (57 | ) | ||||||||
|
|
|
|
|
|
|
|
1 | Pre-tax adjusted earnings and adjusted income taxes are non-IFRS measures. |
2 | Our IFRS-based measures have been adjusted by the amounts reflected in the table in adjusted net earnings (non-IFRS measure on page 9). |
TRANSFER PRICING DISPUTES
We have been reporting on our transfer pricing disputes with Canada Revenue Agency (CRA) since 2008, when it originated, and with the United States Internal Revenue Service (IRS) since the first quarter of 2015. Below, we discuss the general nature of transfer pricing disputes and, more specifically, the ongoing disputes we have.
Transfer pricing is a complex area of tax law, and it is difficult to predict the outcome of cases like ours. However, tax authorities generally test two things:
| the governance (structure) of the corporate entities involved in the transactions |
| the price at which goods and services are sold by one member of a corporate group to another |
We have a global customer base and we established a marketing and trading structure involving foreign subsidiaries, including Cameco Europe Limited (CEL), which entered into various intercompany arrangements, including purchase and sale agreements, as well as uranium purchase and sale agreements with third parties. Cameco and its subsidiaries made reasonable efforts to put arms length transfer pricing arrangements in place, and these arrangements expose the parties to the risks and rewards accruing to them under these contracts. The intercompany contract prices are generally comparable to those established in comparable contracts between arms-length parties entered into at that time.
For the years 2003 to 2009, CRA has shifted CELs income (as re-calculated by CRA) back to Canada and applied statutory tax rates, interest and instalment penalties, and, from 2007 to 2009, transfer pricing penalties. The IRS also allocated a portion of CELs income for 2009 to the US, resulting in such income being taxed in multiple jurisdictions. Taxes of approximately $290 million for the 2003 2014 years have already been paid in a jurisdiction outside Canada and the US. Bilateral international tax treaties contain provisions that generally seek to prevent taxation of the same income in both countries. As such, in connection with these disputes, we are considering our options including remedies under international tax treaties that would limit double taxation; however, there is a risk that we will not be successful in eliminating all potential double taxation. The expected income adjustments under our tax disputes are represented by the amounts claimed by CRA and IRS and are described below.
CRA dispute
Since 2008, CRA has disputed our corporate structure and the related transfer pricing methodology we used for certain intercompany uranium sale and purchase agreements, and issued notices of reassessment for our 2003 through 2009 tax returns. We have recorded a cumulative tax provision of $89 million, where an argument could be made that our transfer price may have fallen outside of an appropriate range of pricing in uranium contracts for the period from 2003 through June 30, 2015. We are confident that we will be successful in our case and continue to believe the ultimate resolution of this matter will not be material to our financial position, results of operations and cash flows in the year(s) of resolution.
12 CAMECO CORPORATION
For the years 2003 through 2009, CRA issued notices of reassessment for approximately $2.8 billion of additional income for Canadian tax purposes, which would result in a related tax expense of about $820 million. CRA has also issued notices of reassessment for transfer pricing penalties for the years 2007 through 2009 in the amount of $229 million. The Canadian income tax rules include provisions that require larger companies like us to remit 50% of the cash tax plus related interest and penalties at the time of reassessment. To date, under these provisions, after applying elective deductions and tax loss carryovers, we have paid a net amount of $230 million cash to the Government of Canada, which includes the amounts shown in the table below. As an alternative to paying cash, we are exploring the possibility of providing security in the form of letters of credit to satisfy our requirements under these provisions.
YEAR PAID ($ MILLIONS) |
CASH TAXES |
INTEREST AND INSTALMENT PENALTIES |
TRANSFER PRICING PENALTIES |
TOTAL | ||||||||||||
Prior to 2013 |
| 13 | | 13 | ||||||||||||
2013 |
1 | 9 | 36 | 46 | ||||||||||||
2014 |
106 | 47 | | 153 | ||||||||||||
2015 |
(62 | ) | 1 | 79 | 18 | |||||||||||
Total |
45 | 70 | 115 | 230 |
Using the methodology we believe CRA will continue to apply, and including the $2.8 billion already reassessed, we expect to receive notices of reassessment for a total of approximately $6.6 billion of additional income taxable in Canada for the years 2003 through 2014, which would result in a related tax expense of approximately $1.9 billion. As well, CRA may continue to apply transfer pricing penalties to taxation years subsequent to 2009. As a result, we estimate that cash taxes and transfer pricing penalties for these years would be between $1.45 billion and $1.5 billion. In addition, we estimate there would be interest and instalment penalties applied that would be material to us. While in dispute, we would be responsible for remitting or otherwise providing security for 50% of the cash taxes and transfer pricing penalties (between $725 million and $750 million), plus related interest and instalment penalties assessed, which would be material to us.
Under the Canadian federal and provincial tax rules, the amount required to be paid or secured each year will depend on the amount of income reassessed in that year and the availability of elective deductions and tax loss carryovers. The estimated amounts summarized in the table below reflect actual amounts paid and estimated future amounts owing based on the actual and expected reassessments for the years 2003 through 2014. We will update this table annually to include the estimated impact of reassessments expected for completed years subsequent to 2014.
$ MILLIONS |
2003 - 2014 | 2015 | 2016 - 2017 | 2018 - 2023 | TOTAL | |||||||||||||||
50% of cash taxes and transfer pricing penalties paid or owing in the period1 |
143 | 165 - 190 | 320 - 345 | 80 - 105 | 725 - 750 |
1 | These amounts do not include interest and instalment penalties, which totalled approximately $70 million to June 30, 2015. |
In light of our view of the likely outcome of the case as described above, we expect to recover the amounts remitted to the Government of Canada, including the $230 million already paid to date.
Due to the time it is taking to work through the pre-trial process, we now expect our appeal of the 2003 reassessment to be heard in the Tax Court of Canada in 2016. If this timing is adhered to, we expect to have a Tax Court decision within six to 18 months after the trial is complete.
IRS dispute
In the first quarter, we received a Revenue Agents Report (RAR) from the IRS challenging the transfer pricing used under certain intercompany transactions pertaining to the 2009 tax year for certain of our US subsidiaries. The RAR lists the adjustments proposed by the IRS and calculates the tax and any penalties owing based on the proposed adjustments.
The current position of the IRS is that a portion of the non-US income reported under our corporate structure and taxed in non-US jurisdictions should be recognized and taxed in the US on the basis that:
| the prices received by our US mining subsidiaries for the sale of uranium to CEL are too low |
| the compensation being earned by Cameco Inc., one of our US subsidiaries, is inadequate |
2015 SECOND QUARTER REPORT 13
The proposed adjustments result in an increase in taxable income in the US of approximately $108 million (US) and a corresponding increased income tax expense of approximately $32 million (US) for the 2009 taxation year, with interest being charged thereon. In addition, the IRS proposed penalties of approximately $7 million (US) in respect of the adjustment.
At present, the RAR pertains only to the 2009 tax year: however, the IRS is also auditing our tax returns for 2010 through 2012 on a similar basis and we expect adjustments in these years to be similar to those made for 2009. If the IRS audits years subsequent to 2012 on a similar basis, we expect these proposed adjustments would also be similar to those made for 2009.
We believe that the conclusions of the IRS in the RAR are incorrect and we are contesting them in an administrative appeal, during which we are not required to make any cash payments. At present, this matter is still at an early stage and, until this matter progresses further, we cannot provide an estimation of the likely timeline for a resolution of the dispute.
We believe that the ultimate resolution of this matter will not be material to our financial position, results of operations and cash flows in the year(s) of resolution.
Caution about forward-looking information relating to our CRA and IRS tax disputes
This discussion of our expectations relating to our tax disputes with CRA and IRS and future tax reassessments by CRA and IRS is forward-looking information that is based upon the assumptions and subject to the material risks discussed under the heading Caution about forward-looking information beginning on page 2 and also on the more specific assumptions and risks listed below. Actual outcomes may vary significantly.
FOREIGN EXCHANGE
At June 30, 2015:
| The value of the US dollar relative to the Canadian dollar was $1.00 (US) for $1.25 (Cdn), down from $1.00 (US) for $1.27 (Cdn) at March 31, 2015. The exchange rate averaged $1.00 (US) for $1.23 (Cdn) over the quarter. |
| We had foreign currency forward contracts of $1.3 billion (US), 15 million (EUR), and foreign currency options of $130 million (US). The US currency forward contracts had an average exchange rate of $1.00 (US) for $1.16 (Cdn), US currency option contracts had an average exchange rate range of $1.00 (US) for $1.22 to $1.28 (Cdn), and 1.00 for $1.12 (US) for EUR currency contracts. |
| The mark-to-market loss on all foreign exchange contracts was $120 million at June 30, 2015 compared to a $184 million loss at March 31, 2015. |
14 CAMECO CORPORATION
Outlook for 2015
Our strategy is to profitably produce at a pace aligned with market signals, while maintaining the ability to respond to conditions as they evolve.
Our outlook for 2015 reflects the expenditures necessary to help us achieve our strategy. Our outlook for NUKEM revenue and unit cost, as well as consolidated revenue, administration costs and tax rate has changed. To provide additional insight following our acquisition of NUKEM in 2013, we provided an outlook for NUKEMs direct administration costs and tax rate. However, NUKEMs direct administration costs and tax rate are immaterial in the context of our consolidated results. We provide outlook for consolidated direct administration costs and for our consolidated tax rate based on taxes incurred in Canada and in foreign jurisdictions; we do not provide any further breakdown for our other segments. As a result, we will no longer provide an outlook for direct administration costs or tax rate specific to the NUKEM segment. We do not provide an outlook for the items in the table that are marked with a dash.
See 2015 Financial results by segment on page 19 for details.
2015 FINANCIAL OUTLOOK
CONSOLIDATED |
URANIUM |
FUEL |
NUKEM | |||||
Production |
| 25.3 to 26.3 million lbs |
9 to 10 million kgU |
| ||||
Sales volume1 |
| 31 to 33 million lbs |
Decrease 5% to 10% |
7 to 8 million lbs U3O8 | ||||
Revenue compared to 20142 |
Increase 5% to 10% |
Increase up to 5%3 |
Increase up to 5% |
Increase 20% to 25% | ||||
Average unit cost of sales (including D&A) |
| Increase 5% to 10%4 |
Increase 5% to 10% |
Increase 5% to 10% | ||||
Direct administration costs compared to 20145 |
Increase 5% to 10% |
| | | ||||
Exploration costs compared to 2014 |
| Decrease 5% to 10% |
| | ||||
Tax rate |
Recovery of 40% to 45% |
| | | ||||
Capital expenditures |
$405 million | | | |
1 | Our 2015 outlook for sales volume does not include sales between our uranium, fuel services and NUKEM segments. |
2 | For comparison of our 2015 outlook and 2014 results for revenue, we do not include sales between our uranium, fuel services and NUKEM segments. |
3 | Based on a uranium spot price of $36.00 (US) per pound (the Ux spot price as of July 27, 2015), a long-term price indicator of $44.00 (US) per pound (the Ux long-term indicator on July 27, 2015) and an exchange rate of $1.00 (US) for $1.22 (Cdn). |
4 | This increase is based on the unit cost of sale for produced material and committed long-term purchases. If we make discretionary purchases in 2015, then we expect the overall unit cost of sales to increase further. |
5 | Direct administration costs do not include stock-based compensation expenses. See page 11 for more information. |
Our outlook for NUKEM revenue has changed to an increase of 20% to 25% (previously increase of 5% to 10%) due to our expectation that NUKEM sales volumes will be higher in the range, and the effect of foreign exchange. Consolidated revenue is now expected to increase by 5% to 10% (previously an increase of up to 5%) due to our expectation that sales volumes for the uranium and NUKEM segments will be higher in the range.
We have also adjusted our outlook for NUKEM cost of sales. Unit cost of sales is now expected to increase 5% to 10% (previously increase up to 5%) due to the effect of foreign exchange.
Consolidated administration costs are now expected to increase 5% to 10% (previously an increase of up to 5%) due to increased costs under our collaboration agreements and the effect of foreign exchange.
We have adjusted our outlook for the consolidated tax rate to a recovery of 40% to 45% (previously 45% to 50%) due to the expected impact of the changes to the consolidated outlook noted above, and a change in the distribution of earnings between jurisdictions.
2015 SECOND QUARTER REPORT 15
In our uranium and fuel services segments, our customers choose when in the year to receive deliveries, so our quarterly delivery patterns, sales volumes and revenue can vary significantly however, the majority of delivery notices have been received for 2015, reducing variability for the remainder of the year. We expect uranium deliveries in the third quarter to be similar to the first two quarters, and fourth quarter deliveries to be higher.
REVENUE AND EARNINGS SENSITIVITY ANALYSIS
For the rest of 2015:
| an increase of $5 (US) per pound in both the Ux spot price ($36.00 (US) per pound on July 27, 2015) and the Ux long-term price indicator ($44.00 (US) per pound on July 27, 2015) would increase revenue by $48 million and net earnings by $27 million. Conversely, a decrease of $5 (US) per pound would decrease revenue by $45 million and net earnings by $24 million. |
| a one-cent change in the value of the Canadian dollar versus the US dollar would change adjusted net earnings by $5 million, with a decrease in the value of the Canadian dollar versus the US dollar having a positive impact |
PRICE SENSITIVITY ANALYSIS: URANIUM SEGMENT
The following table and graph are not forecasts of prices we expect to receive. The prices we actually realize will be different from the prices shown in the table and graph. They are designed to indicate how the portfolio of long-term contracts we had in place on June 30, 2015 would respond to different spot prices. In other words, we would realize these prices only if the contract portfolio remained the same as it was on June 30, 2015 and none of the assumptions we list below change.
We intend to update this table and graph each quarter in our MD&A to reflect deliveries made and changes to our contract portfolio. As a result, we expect the table and graph to change from quarter to quarter.
Expected realized uranium price sensitivity under various spot price assumptions
(rounded to the nearest $1.00)
SPOT PRICES ($US/lb U3O8) |
$20 | $40 | $60 | $80 | $100 | $120 | $140 | |||||||||||||||||||||
2015 |
44 | 45 | 50 | 54 | 59 | 64 | 68 | |||||||||||||||||||||
2016 |
40 | 46 | 57 | 68 | 78 | 88 | 96 | |||||||||||||||||||||
2017 |
39 | 46 | 56 | 67 | 78 | 88 | 95 | |||||||||||||||||||||
2018 |
40 | 47 | 58 | 69 | 79 | 88 | 96 | |||||||||||||||||||||
2019 |
41 | 48 | 59 | 69 | 78 | 86 | 92 |
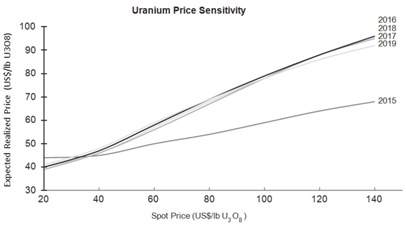
The table and graph illustrate the mix of long-term contracts in our June 30, 2015 portfolio, and are consistent with our marketing strategy. Both have been updated to reflect deliveries made and contracts entered into up to June 30, 2015.
Our portfolio includes a mix of fixed-price and market-related contracts, which we target at a 40:60 ratio. Those that are fixed at lower prices or have low ceiling prices will yield prices that are lower than current market prices.
16 CAMECO CORPORATION
Our portfolio is affected by more than just the spot price. We made the following assumptions (which are not forecasts) to create the table:
Liquidity and capital resources
Our financial objective is to make sure we have the cash and debt capacity to fund our operating activities, investments and growth.
We have large, creditworthy customers that continue to need uranium even during weak economic conditions, and we expect the uranium contract portfolio we have built to provide a solid revenue stream for years to come.
We expect to continue investing in maintaining and prudently expanding our production capacity over the next several years. We have a number of alternatives to fund future capital requirements, including using our current cash balances, drawing on our existing credit facilities, entering new credit facilities, using our operating cash flow, and raising additional capital through debt or equity financings. We are always considering our financing options so we can take advantage of favourable market conditions when they arise. However, we expect our cash balances and operating cash flows will meet our anticipated 2015 capital requirements without the need for significant additional funding.
We have an ongoing dispute with CRA regarding our offshore marketing company structure and related transfer pricing arrangements. See page 12 for more information. Until this dispute is settled, we expect to make cash payments to CRA for 50% of the cash taxes payable and the related interest and instalment penalties. We have provided an estimate of the amount and timing of the expected cash taxes payable in the table on page 13. As an alternative to paying cash, we are exploring the possibility of providing security in the form of letters of credit to satisfy our requirements under the tax provisions.
CASH FROM OPERATIONS
Cash from continuing operations was $40 million lower this quarter than in the second quarter of 2014. Contributing to this change was an increase in working capital requirements and a decrease in income taxes paid. Working capital required $78 million more in 2015, largely as a result of an increase in inventory, partially offset by changes in other working capital items during the quarter. Not including working capital requirements, our operating cash flows this quarter were higher by $38 million.
Cash from continuing operations was $86 million higher in the first six months of 2015 than for the same period in 2014 due largely to a decrease in income taxes paid. Working capital required $8 million more in 2015. Not including working capital requirements, our operating cash flows in the first six months were higher by $94 million.
FINANCING ACTIVITIES
We use debt to provide additional liquidity. We have sufficient borrowing capacity with unsecured lines of credit totalling about $2.4 billion at June 30, 2015, down $0.1 billion from March 31, 2015. At June 30, 2015, we had approximately $1.0 billion outstanding in letters of credit.
Debt covenants
We are bound by certain covenants in our unsecured revolving credit facility. The financially related covenants place restrictions on total debt, including guarantees. As at June 30, 2015, we met these financial covenants and do not expect our operating and investment activities for the remainder of 2015 to be constrained by them.
2015 SECOND QUARTER REPORT 17
Long-term contractual obligations
Since December 31, 2014, there have been no material changes to our long-term contractual obligations. Please see our annual MD&A for more information.
OFF-BALANCE SHEET ARRANGEMENTS
We had two kinds of off-balance sheet arrangements at June 30, 2015:
| purchase commitments |
| financial assurances |
Purchase commitments
The following table is based on our purchase commitments at June 30, 2015. These commitments include a mix of fixed price and market-related contracts. Actual payments will be different as a result of changes to our purchase commitments and, in the case of contracts with market-related pricing, the market prices in effect at the time of purchase. We will update this table as required in our MD&A to reflect changes to our purchase commitments and changes in the prices used to estimate our commitments under market-related contracts.
JUNE 30 ($ MILLIONS) |
2015 | 2016 AND 2017 |
2018 AND 2019 |
2020 AND BEYOND |
TOTAL | |||||||||||||||
Purchase commitments1 |
461 | 941 | 379 | 541 | 2,322 |
1 | Denominated in US dollars, converted to Canadian dollars as of June 30, 2015 at the rate of $1.25. |
During the second quarter, our purchase commitments increased due to the signing of new long-term purchase commitments, which we believe will be beneficial for us as they have been in the past.
As of June 30, 2015, we had commitments of about $2.3 billion for the following:
| approximately 33 million pounds of U3O8 equivalent from 2015 to 2028 |
| approximately 5 million kgU as UF6 in conversion services from 2015 to 2018 |
| about 0.7 million Separative Work Units (SWU) of enrichment services to meet existing forward sales commitments under agreements with a non-Western supplier |
The suppliers do not have the right to terminate agreements other than pursuant to customary events of default provisions.
Financial assurances
At June 30, 2015 our financial assurances totaled $1.0 billion compared to $1.1 billion at March 31, 2015. The decrease is mainly due to a reduction to reclamation letters of credit in Wyoming, as well as exchange rate fluctuations.
BALANCE SHEET
($ MILLIONS) |
JUN 30, 2015 | DEC 31, 2014 | CHANGE | |||||||||
Cash, short-term investments and bank overdraft |
331 | 567 | (42 | )% | ||||||||
Total debt |
1,492 | 1,491 | | |||||||||
Inventory |
1,255 | 902 | 39 | % |
Total cash and short-term investments at June 30, 2015 were $331 million, or 42% lower than at December 31, 2014, primarily due to capital expenditures of $195 million, dividend payments of $79 million, and interest payments of $35 million, partially offset by cash provided by operations of $68 million. Net debt at June 30, 2015 was $1,161 million.
Total debt remained largely unchanged from December 31, 2014. See notes 15 and 16 of our audited annual financial statements for more detail.
Total product inventories increased to $1,255 million, including NUKEMs inventories ($313 million). Uranium inventories increased as sales were lower than production and purchases in the first six months of the year.
Fuel services inventories increased as sales were also lower than production and purchases.
18 CAMECO CORPORATION
Financial results by segment
Uranium
THREE MONTHS ENDED JUNE 30 |
SIX MONTHS ENDED JUNE 30 |
|||||||||||||||||||||||||||
HIGHLIGHTS |
2015 | 2014 | CHANGE | 2015 | 2014 | CHANGE | ||||||||||||||||||||||
Production volume (million lbs) |
5.4 | 4.0 | 35 | % | 10.5 | 9.7 | 8 | % | ||||||||||||||||||||
|
|
|
|
|
|
|
|
|
|
|
|
|||||||||||||||||
Sales volume (million lbs)1 |
7.3 | 7.4 | (1 | )% | 14.3 | 14.3 | | |||||||||||||||||||||
|
|
|
|
|
|
|
|
|
|
|
|
|||||||||||||||||
Average spot price |
($ | US/lb) | 36.17 | 28.97 | 25 | % | 37.26 | 31.95 | 17 | % | ||||||||||||||||||
Average long-term price |
($ | US/lb) | 47.50 | 44.83 | 6 | % | 48.50 | 46.75 | 4 | % | ||||||||||||||||||
Average realized price |
($ | US/lb) | 46.57 | 45.93 | 1 | % | 45.03 | 46.26 | (3 | )% | ||||||||||||||||||
($ | Cdn/lb) | 58.04 | 50.76 | 14 | % | 55.45 | 50.67 | 9 | % | |||||||||||||||||||
|
|
|
|
|
|
|
|
|
|
|
|
|||||||||||||||||
Average unit cost of sales (including D&A) |
($ | Cdn/lb) | 40.71 | 35.86 | 14 | % | 38.64 | 34.63 | 12 | % | ||||||||||||||||||
|
|
|
|
|
|
|
|
|
|
|
|
|||||||||||||||||
Revenue ($ millions)1 |
424 | 376 | 13 | % | 791 | 724 | 9 | % | ||||||||||||||||||||
|
|
|
|
|
|
|
|
|
|
|
|
|||||||||||||||||
Gross profit ($ millions) |
127 | 110 | 15 | % | 240 | 229 | 5 | % | ||||||||||||||||||||
|
|
|
|
|
|
|
|
|
|
|
|
|||||||||||||||||
Gross profit (%) |
30 | 29 | 3 | % | 30 | 32 | (6 | )% | ||||||||||||||||||||
|
|
|
|
|
|
|
|
|
|
|
|
1 | Includes sales and revenue between our uranium, fuel services and NUKEM segments (nil pounds in sales and nil revenue in Q2, 2015; 165,000 pounds and revenue of $5.0 million in Q2, 2014; 15,000 pounds in sales and revenue of $0.5 million in the first six months of 2015; 165,000 pounds and revenue of $5.0 million in the first six months of 2014). |
SECOND QUARTER
Production volumes this quarter were 35% higher compared to the second quarter of 2014, mainly due to production from Cigar Lake and higher production from McArthur River/Key Lake, which was partially offset by lower production at Rabbit Lake, Inkai and our US operations. See Uranium 2015 Q2 updates starting on page 22 for more information.
The 13% increase in uranium revenues was a result of a 14% increase in the Canadian dollar average realized price, partially offset by a 1% decrease in sales volume.
The US dollar average realized price increased by 1% compared to 2014 mainly due to higher prices on fixed price contracts, while the higher Canadian dollar realized prices this quarter were a result of the weakening of the Canadian dollar compared to 2014. This quarter the exchange rate on the average realized price was $1.00 (US) for $1.25 (Cdn) compared to $1.00 (US) for $1.11 (Cdn) in the second quarter of 2014.
Total cost of sales (including D&A) increased by 12% ($297 million compared to $266 million in 2014) due to a 14% increase in the unit cost of sales, partially offset by a 1% decrease in sales volume. The increase in the unit cost of sales was mainly the result of an increase in the volume of material purchased in the quarter at prices higher than our average cost of inventory.
The net effect was a $17 million increase in gross profit for the quarter.
FIRST SIX MONTHS
Production volumes for the first six months of the year were 8% higher than in the previous year due to the addition of production from Cigar Lake, partially offset by lower production at McArthur/Key Lake, our US operations and Inkai. See Uranium 2015 Q2 updates starting on page 22 for more information.
Uranium revenues increased 9% compared to the first six months of 2014 due to a 9% increase in the Canadian dollar average realized price. Sales volumes in the first six months were the same as in 2014.
Our Canadian dollar realized prices for the first six months of 2015 were higher than 2014, primarily as a result of the weakening of the Canadian dollar compared to 2014. For the first six months of 2015, the exchange rate on the average realized price was $1.00 (US) for $1.23 (Cdn) compared to $1.00 (US) for $1.10 (Cdn) for the same period in 2014.
Total cost of sales (including D&A) increased by 12% ($552 million compared to $495 million in 2014) mainly due to a 12% increase in the unit cost of sales. The increase was mainly the result of an increase in the volume of material purchased in the first six months at prices higher than our average cost of inventory, and an increase in unit production costs.
The net effect was an $11 million increase in gross profit for the first six months.
We are active in the uranium market, buying and selling uranium on the spot market and under long-term contracts when we expect it will be beneficial for us. Purchases are impacted by foreign exchange rates, and may, in some cases, require we pay prices higher or lower than current spot prices. Depending on the volume and unit cost of purchases in a quarter, our average cost of inventory can be impacted, which flows through to our cost of sales.
2015 SECOND QUARTER REPORT 19
The table below shows the costs of produced and purchased uranium incurred in the reporting periods (which are non-IFRS measures, see the paragraphs below the table). These costs do not include selling costs such as royalties, transportation and commissions, nor do they reflect the impact of opening inventories on our reported cost of sales.
THREE MONTHS ENDED JUNE 30 |
SIX MONTHS ENDED JUNE 30 |
|||||||||||||||||||||||
($CDN/LB) |
2015 | 2014 | CHANGE | 2015 | 2014 | CHANGE | ||||||||||||||||||
Produced |
||||||||||||||||||||||||
Cash cost |
26.53 | 26.24 | 1 | % | 27.28 | 23.03 | 18 | % | ||||||||||||||||
Non-cash cost |
14.64 | 14.72 | (1 | )% | 13.59 | 12.25 | 11 | % | ||||||||||||||||
|
|
|
|
|
|
|
|
|
|
|
|
|||||||||||||
Total production cost |
41.17 | 40.96 | 1 | % | 40.87 | 35.28 | 16 | % | ||||||||||||||||
|
|
|
|
|
|
|
|
|
|
|
|
|||||||||||||
Quantity produced (million lbs) |
5.4 | 4.0 | 35 | % | 10.5 | 9.7 | 8 | % | ||||||||||||||||
|
|
|
|
|
|
|
|
|
|
|
|
|||||||||||||
Purchased |
||||||||||||||||||||||||
Cash cost |
45.68 | 58.15 | (21 | )% | 46.69 | 44.76 | 4 | % | ||||||||||||||||
|
|
|
|
|
|
|
|
|
|
|
|
|||||||||||||
Quantity purchased (million lbs) |
4.0 | 0.3 | 1233 | % | 6.6 | 1.6 | 313 | % | ||||||||||||||||
|
|
|
|
|
|
|
|
|
|
|
|
|||||||||||||
Totals |
||||||||||||||||||||||||
Produced and purchased costs |
43.09 | 42.16 | 2 | % | 43.12 | 36.62 | 18 | % | ||||||||||||||||
|
|
|
|
|
|
|
|
|
|
|
|
|||||||||||||
Quantities produced and purchased (million lbs) |
9.4 | 4.3 | 119 | % | 17.1 | 11.3 | 51 | % | ||||||||||||||||
|
|
|
|
|
|
|
|
|
|
|
|
Cash cost per pound, non-cash cost per pound and total cost per pound for produced and purchased uranium presented in the above table are non-IFRS measures. These measures do not have a standardized meaning or a consistent basis of calculation under IFRS. We use these measures in our assessment of the performance of our uranium business. We believe that, in addition to conventional measures prepared in accordance with IFRS, certain investors use this information to evaluate our performance and ability to generate cash flow.
These measures are non-standard supplemental information and should not be considered in isolation or as a substitute for measures of performance prepared according to accounting standards. These measures are not necessarily indicative of operating profit or cash flow from operations as determined under IFRS. Other companies may calculate these measures differently, so you may not be able to make a direct comparison to similar measures presented by other companies.
To facilitate a better understanding of these measures, the following table presents a reconciliation of these measures to our unit cost of sales for the second quarter and the first six months of 2015 and 2014.
Cash and total cost per pound reconciliation
THREE MONTHS ENDED JUNE 30 |
SIX MONTHS ENDED JUNE 30 |
|||||||||||||||
($ MILLIONS) |
2015 | 2014 | 2015 | 2014 | ||||||||||||
Cost of product sold |
251.2 | 204.6 | 455.4 | 385.6 | ||||||||||||
Add / (subtract) |
||||||||||||||||
Royalties |
(21.9 | ) | (21.0 | ) | (35.7 | ) | (35.2 | ) | ||||||||
Standby charges |
| (9.7 | ) | | (19.0 | ) | ||||||||||
Other selling costs |
(3.7 | ) | (3.2 | ) | (5.3 | ) | (5.5 | ) | ||||||||
Change in inventories |
100.4 | (48.3 | ) | 180.2 | (30.9 | ) | ||||||||||
|
|
|
|
|
|
|
|
|||||||||
Cash operating costs (a) |
326.0 | 122.4 | 594.6 | 295.0 | ||||||||||||
Add / (subtract) |
||||||||||||||||
Depreciation and amortization |
45.9 | 60.9 | 96.1 | 109.2 | ||||||||||||
Change in inventories |
33.2 | (2.0 | ) | 46.7 | 9.6 | |||||||||||
|
|
|
|
|
|
|
|
|||||||||
Total operating costs (b) |
405.1 | 181.3 | 737.4 | 413.8 | ||||||||||||
|
|
|
|
|
|
|
|
|||||||||
Uranium produced & purchased (million lbs) (c) |
9.4 | 4.3 | 17.1 | 11.3 | ||||||||||||
|
|
|
|
|
|
|
|
|||||||||
Cash costs per pound (a ÷ c) |
34.68 | 28.47 | 34.77 | 26.11 | ||||||||||||
Total costs per pound (b ÷ c) |
43.09 | 42.16 | 43.12 | 36.62 | ||||||||||||
|
|
|
|
|
|
|
|
20 CAMECO CORPORATION
Fuel services
(includes results for UF6, UO2 and fuel fabrication)
THREE MONTHS ENDED JUNE 30 |
SIX MONTHS ENDED JUNE 30 |
|||||||||||||||||||||||||||
HIGHLIGHTS |
2015 | 2014 | CHANGE | 2015 | 2014 | CHANGE | ||||||||||||||||||||||
Production volume (million kgU) |
3.1 | 3.8 | (18 | )% | 5.7 | 7.8 | (27 | )% | ||||||||||||||||||||
Sales volume (million kgU) |
2.4 | 3.3 | (27 | )% | 5.4 | 5.1 | 6 | % | ||||||||||||||||||||
Average realized price |
($ | Cdn/kgU | ) | 29.70 | 21.28 | 40 | % | 25.45 | 21.68 | 17 | % | |||||||||||||||||
Average unit cost of sales (including D&A) |
($ | Cdn/kgU | ) | 21.44 | 16.46 | 30 | % | 20.39 | 18.19 | 12 | % | |||||||||||||||||
Revenue ($ millions) |
70 | 70 | | 136 | 110 | 24 | % | |||||||||||||||||||||
Gross profit ($ millions) |
19 | 16 | 19 | % | 27 | 18 | 50 | % | ||||||||||||||||||||
Gross profit (%) |
27 | 23 | 17 | % | 20 | 16 | 25 | % |
SECOND QUARTER
Total revenue for the second quarter of 2015 remained the same as the prior year at $70 million. A 27% decrease in sales volumes was offset by a 40% increase in average realized price, primarily due to the mix of products sold.
The total cost of products and services sold (including D&A) decreased by 7% ($50 million compared to $54 million in the second quarter of 2014) due to the decrease in sales volumes, partially offset by an increase in the average unit cost of sales. When compared to 2014, the average unit cost of sales was 30% higher due to the mix of fuel services products sold.
The net effect was a $3 million increase in gross profit.
FIRST SIX MONTHS
In the first six months of the year, total revenue increased by 24% due to a 6% increase in sales volumes and a 17% increase in realized price that was the result of increased realized prices for UF6 and the mix of products sold.
The total cost of sales (including D&A) increased 17% ($109 million compared to $93 million in 2014) due to an increase in sales volume and a 12% increase in the average unit cost of sales, which resulted from the mix of fuel services products sold.
The net effect was a $9 million increase in gross profit.
NUKEM
THREE MONTHS ENDED JUNE 30 |
SIX MONTHS ENDED JUNE 30 |
|||||||||||||||||||||||||||
HIGHLIGHTS |
2015 | 2014 | CHANGE | 2015 | 2014 | CHANGE | ||||||||||||||||||||||
Uranium sales (million lbs)1 |
1.5 | 1.5 | | 4.0 | 2.2 | 82 | % | |||||||||||||||||||||
Average realized price |
($Cdn/lb) | 50.47 | 41.63 | 21 | % | 42.80 | 41.01 | 4 | % | |||||||||||||||||||
Cost of product sold (including D&A) |
70 | 49 | 43 | % | 156 | 84 | 86 | % | ||||||||||||||||||||
Revenue ($ millions)1 |
81 | 62 | 31 | % | 178 | 94 | 89 | % | ||||||||||||||||||||
Gross profit ($ millions) |
11 | 13 | (15 | )% | 22 | 10 | 120 | % | ||||||||||||||||||||
Gross profit (%) |
14 | 21 | (33 | )% | 12 | 11 | 9 | % |
1 | Includes sales and revenue between our uranium, fuel services and NUKEM segments (200,000 pounds in sales and revenue of $10.8 million in Q2, 2015, nil in Q2, 2014; 743,0000 pounds in sales and revenue of $13.3 million in the first six of 2015, nil in the first six of 2014). |
SECOND QUARTER
During the second quarter of 2015, NUKEM delivered 1.5 million pounds of uranium, unchanged from the same period last year. Total revenues increased by 31% as a result of average realized prices which were 21% higher than those realized in the second quarter of 2014.
Gross margin percentage was 14% in the second quarter of 2015, a 33% decrease compared to the second quarter of 2014. The allocation of the historic purchase price to the sale of inventory on hand at the time of acquisition of NUKEM, impacted margins for the quarter.
The net effect was a $2 million decrease in gross profit.
2015 SECOND QUARTER REPORT 21
FIRST SIX MONTHS
During the six months ended June 30, 2015, NUKEM delivered 4.0 million pounds of uranium, an increase of 82%, due to timing of customer requirements and generally lower activity in the market during 2014. Total revenues increased 89% due to an 82% increase in sales volumes and a 4% increase in average realized price.
Gross margin percentage was 12% for the first six months of 2015 as compared to 11% for the same period in 2014. Included in the 2014 margin was a $6 million write-down of inventory compared to a $3 million recovery in 2015. The write-down in 2014 was a result of a decline in the spot price during the period.
The net effect was a $12 million increase in gross profit.
Our operations
Uranium production overview
Production in our uranium segment this quarter was 35% higher than the second quarter of 2014, and 8% higher for the first six months. See below for more information.
URANIUM PRODUCTION
THREE MONTHS ENDED JUNE 30 |
SIX MONTHS ENDED JUNE 30 |
|||||||||||||||||||||||||||
OUR SHARE (MILLION LBS) |
2015 | 2014 | CHANGE | 2015 | 2014 | CHANGE | 2015 PLAN | |||||||||||||||||||||
McArthur River/Key Lake |
2.9 | 2.1 | 38 | % | 5.5 | 5.9 | (7 | )% | 13.7 | |||||||||||||||||||
Cigar Lake1 |
1.2 | | | 1.6 | | | 3.0 4.0 | |||||||||||||||||||||
Inkai |
0.6 | 0.7 | (14 | )% | 1.2 | 1.4 | (14 | )% | 3.0 | |||||||||||||||||||
Rabbit Lake |
0.2 | 0.6 | (67 | )% | 1.1 | 1.1 | | 3.9 | ||||||||||||||||||||
Smith Ranch-Highland |
0.4 | 0.5 | (20 | )% | 0.9 | 1.0 | (10 | )% | 1.4 | |||||||||||||||||||
Crow Butte |
0.1 | 0.1 | | 0.2 | 0.3 | (33 | )% | 0.3 | ||||||||||||||||||||
Total |
5.4 | 4.0 | 35 | % | 10.5 | 9.7 | 8 | % | 25.3 26.3 |
1 | Commercial production achieved on May 1, 2015 see Cigar Lake update below. |
Uranium 2015 Q2 updates
UPDATE TO FOREST FIRE SITUATION IN NORTHERN SASKATCHEWAN
The forest fire situation in northern Saskatchewan has been improving over the last few weeks and all evacuees have now been allowed to return home. Air and road access to our operations has improved and we have resumed normal shipping of packaged product from our operations. We still expect to meet our 2015 production target of 25.3 million to 26.3 million pounds, and our sales target of 31 million to 33 million pounds.
The fire risk across northern Saskatchewan has diminished, although we continue to monitor the situation closely and support our employees, their families and communities impacted by the situation.
MCARTHUR RIVER/KEY LAKE
Production update
Production for the quarter was 38% higher compared to the same period last year but 7% lower for the first half of the year due to the timing of mill maintenance, including an unplanned mill maintenance outage during the first quarter. The operation remains on track to achieve our planned 2015 production.
Licensing and production capacity update
We now have a licence production limit of 25 million pounds per year (100% basis) at both McArthur River and Key Lake. The increased production limit aligns with our strategy to maintain the flexibility to adjust to market conditions.
22 CAMECO CORPORATION
CIGAR LAKE
Production update
The jet boring system at the Cigar Lake mine continued to perform as expected, and during the first half of 2015, we successfully mined 4.8 million pounds of uranium for shipment to the McClean Lake mill. We are continuing to ramp up mine production, and now have three jet boring machines (JBS) commissioned for use underground.
The mined ore is routinely transported to the McClean Lake mill, which, during the second quarter, packaged approximately 2.4 million pounds (100% basis, 1.2 million pounds our share), for total production of 3.1 million pounds during the first half of 2015. Cigar Lake remains on track to achieve the annual production target of 6 million to 8 million packaged pounds (100% basis).
Commercial production
Commercial production signals a transition in the accounting treatment for costs incurred at the mine. Cigar Lake met all of the criteria for commercial production, including cycle time and process specifications, in the second quarter. Therefore, effective May 1, 2015, we began charging all production costs, including depreciation, to inventory and subsequently recognizing them in cost of sales as the product is sold.
Rampup schedule
We expect Cigar Lake to produce between 6 million and 8 million packaged pounds in 2015; our share is 3 million to 4 million pounds. As we ramp up production to 18 million pounds (100% basis) by 2018, volumes may not be linear year-to-year, but will vary based on our operational experience. To ensure the most efficient operation of the mine and mill throughout the year, we expect to continually manage ore supply and, therefore, may halt and resume mining several times during a quarter without impacting planned annual production.
Caution about forward-looking information relating to Cigar Lake
This discussion of our expectations for Cigar Lake, including our plan for 6 million to 8 million packaged pounds (100%) in 2015, is forward-looking information that is based upon the assumptions and subject to the material risks discussed under the heading Caution about forward-looking information beginning on page 2.
INKAI
Production update
Production was 14% lower for both the second quarter and the first six months of the year compared to the same periods in 2014 due to the timing of new wellfield development. The operation remains on track to achieve our planned 2015 production.
Block 3
The block 3 test leach facility is now operational and state commissioning of the test wellfields was accomplished during the second quarter. Our application for an extension of the block 3 deposit evaluation period is still pending final approval from the Ministry of Energy of the Republic of Kazakhstan. Inkai continues working on the final appraisal of the mineral potential of block 3 according to Kazakhstan standards.
RABBIT LAKE
Production update
Production for the quarter was 67% lower than the same period last year due to the timing of our planned mill maintenance outage. Production for the first six months was unchanged from 2014 and the operation remains on track to achieve our planned 2015 production.
Tailings capacity
Our plan for fully utilizing the currently available tailings capacity at Rabbit Lake requires regulatory approval in 2016 and the process to obtain that approval has begun. We expect to have sufficient tailings capacity to support milling of Eagle Point ore until about 2018 (based upon expected ore tonnage, milling rate and tailings performance), subject to obtaining regulatory approval.
2015 SECOND QUARTER REPORT 23
SMITH RANCH-HIGHLAND AND CROW BUTTE
Production update
At our US operations, as expected, total production was 17% lower for the quarter and 15% lower for the first six months compared to the same periods in 2014 primarily due to a declining head grade at Crow Butte, where there are no new wellfields being developed under the current mine plan.
Fuel services 2015 Q2 updates
PORT HOPE CONVERSION SERVICES
CAMECO FUEL MANUFACTURING INC. (CFM)
Production update
Fuel services produced 3.1 million kgU in the second quarter, 18% lower than the same period last year. Production for the first six months was 27% lower than last year, primarily due to the reduced volumes attributable to the early termination of the SFL contract in 2014. We decreased our production target in 2015 to between 9 million and 10 million kgU, so quarterly production is expected to be lower than comparable periods in 2014.
Labour relations
Approximately 100 unionized employees at Cameco Fuel Manufacturing Inc.s operations in Port Hope and Cobourg, Ontario accepted a new collective agreement.
The employees, represented by the United Steelworkers local 14193, agreed to a three-year contract that includes a 7% wage increase over the term of the agreement. The previous contract expired on June 1, 2015.
Qualified persons
The technical and scientific information discussed in this document for our material properties (McArthur River/Key Lake, Inkai and Cigar Lake) was approved by the following individuals who are qualified persons for the purposes of NI 43-101:
24 CAMECO CORPORATION
Additional information
Critical accounting estimates
Due to the nature of our business, we are required to make estimates that affect the amount of assets and liabilities, revenues and expenses, commitments and contingencies we report. We base our estimates on our experience, our best judgment, guidelines established by the Canadian Institute of Mining, Metallurgy and Petroleum and on assumptions we believe are reasonable.
Controls and procedures
As of June 30, 2015, we carried out an evaluation under the supervision and with the participation of our management, including our chief executive officer (CEO) and chief financial officer (CFO), of the effectiveness of our disclosure controls and procedures. There are inherent limitations to the effectiveness of any system of disclosure controls and procedures, including the possibility of human error and the circumvention or overriding of the controls and procedures. Accordingly, even effective disclosure controls and procedures can only provide reasonable assurance of achieving their control objectives.
Based upon that evaluation and as of June 30, 2015, the CEO and CFO concluded that:
| the disclosure controls and procedures were effective to provide reasonable assurance that information required to be disclosed in the reports we file and submit under applicable securities laws is recorded, processed, summarized and reported as and when required |
| such information is accumulated and communicated to our management, including our CEO and CFO, as appropriate to allow timely decisions regarding required disclosure |
There has been no change in our internal control over financial reporting during the quarter ended June 30, 2015 that has materially affected, or is reasonably likely to materially affect, our internal control over financial reporting.
2015 SECOND QUARTER REPORT 25
Exhibit 99.3
Cameco Corporation
2015 condensed consolidated interim financial statements
(unaudited)
July 29, 2015
Cameco Corporation
Consolidated statements of earnings
(Unaudited) | Note | Three months ended | Six months ended | |||||||||||||||||
($Cdn thousands, except per share amounts) |
Jun 30/15 | Jun 30/14 | Jun 30/15 | Jun 30/14 | ||||||||||||||||
Revenue from products and services |
$ | 564,521 | $ | 501,971 | $ | 1,130,288 | $ | 921,200 | ||||||||||||
Cost of products and services sold |
346,502 | 295,029 | 722,873 | 540,326 | ||||||||||||||||
Depreciation and amortization |
65,044 | 71,111 | 125,278 | 137,445 | ||||||||||||||||
|
|
|
|
|
|
|
|
|||||||||||||
Cost of sales |
411,546 | 366,140 | 848,151 | 677,771 | ||||||||||||||||
|
|
|
|
|
|
|
|
|||||||||||||
Gross profit |
152,975 | 135,831 | 282,137 | 243,429 | ||||||||||||||||
Administration |
49,441 | 36,436 | 91,672 | 81,649 | ||||||||||||||||
Impairment charge |
6 | | | 5,688 | | |||||||||||||||
Exploration |
11,494 | 9,318 | 23,272 | 23,738 | ||||||||||||||||
Research and development |
1,467 | 421 | 3,294 | 1,693 | ||||||||||||||||
Loss on sale of assets |
462 | 6,665 | 444 | 5,556 | ||||||||||||||||
|
|
|
|
|
|
|
|
|||||||||||||
Earnings from operations |
90,111 | 82,991 | 157,767 | 130,793 | ||||||||||||||||
Finance costs |
10 | (25,104 | ) | (35,771 | ) | (50,336 | ) | (59,239 | ) | |||||||||||
Gain (loss) on derivatives |
16 | 32,748 | 60,367 | (109,633 | ) | 1,479 | ||||||||||||||
Finance income |
1,567 | 2,094 | 3,770 | 3,239 | ||||||||||||||||
Share of loss from equity-accounted investees |
(1,386 | ) | (3,469 | ) | (1,368 | ) | (13,503 | ) | ||||||||||||
Other income (expense) |
11 | (14,424 | ) | 14,942 | 28,085 | 16,573 | ||||||||||||||
|
|
|
|
|
|
|
|
|||||||||||||
Earnings before income taxes |
83,512 | 121,154 | 28,285 | 79,342 | ||||||||||||||||
Income tax recovery |
12 | (4,524 | ) | (5,691 | ) | (49,911 | ) | (51,067 | ) | |||||||||||
|
|
|
|
|
|
|
|
|||||||||||||
Net earnings from continuing operations |
88,036 | 126,845 | 78,196 | 130,409 | ||||||||||||||||
Net earnings from discontinued operation |
4 | | | | 127,243 | |||||||||||||||
|
|
|
|
|
|
|
|
|||||||||||||
Net earnings |
$ | 88,036 | $ | 126,845 | $ | 78,196 | $ | 257,652 | ||||||||||||
|
|
|
|
|
|
|
|
|||||||||||||
Net earnings (loss) attributable to: |
||||||||||||||||||||
Equity holders |
$ | 88,037 | $ | 127,208 | $ | 79,134 | $ | 258,544 | ||||||||||||
Non-controlling interest |
(1 | ) | (363 | ) | (938 | ) | (892 | ) | ||||||||||||
|
|
|
|
|
|
|
|
|||||||||||||
Net earnings |
$ | 88,036 | $ | 126,845 | $ | 78,196 | $ | 257,652 | ||||||||||||
|
|
|
|
|
|
|
|
|||||||||||||
Earnings per common share attributable to equity holders |
||||||||||||||||||||
Continuing operations |
0.22 | 0.32 | 0.20 | 0.33 | ||||||||||||||||
Discontinued operation |
| | | 0.32 | ||||||||||||||||
|
|
|
|
|
|
|
|
|||||||||||||
Total basic earnings per share |
13 | $ | 0.22 | $ | 0.32 | $ | 0.20 | $ | 0.65 | |||||||||||
|
|
|
|
|
|
|
|
|||||||||||||
Continuing operations |
0.22 | 0.32 | 0.20 | 0.33 | ||||||||||||||||
Discontinued operation |
| | | 0.32 | ||||||||||||||||
|
|
|
|
|
|
|
|
|||||||||||||
Total diluted earnings per share |
13 | $ | 0.22 | $ | 0.32 | $ | 0.20 | $ | 0.65 | |||||||||||
|
|
|
|
|
|
|
|
See accompanying notes to condensed consolidated interim financial statements.
2 CAMECO CORPORATION
Cameco Corporation
Consolidated statements of comprehensive income
(Unaudited) | Note | Three months ended | Six months ended | |||||||||||||||||
($Cdn thousands) |
Jun 30/15 | Jun 30/14 | Jun 30/15 | Jun 30/14 | ||||||||||||||||
Net earnings |
|
$ | 88,036 | $ | 126,845 | $ | 78,196 | $ | 257,652 | |||||||||||
Other comprehensive income (loss), net of taxes |
12 | |||||||||||||||||||
Items that are or may be reclassified to net earnings: |
||||||||||||||||||||
Exchange differences on translation of foreign operations |
(15,501 | ) | (48,832 | ) | 50,538 | 31,704 | ||||||||||||||
Gains on derivatives designated as cash flow hedges transferred to net earningsdiscontinued operation |
| | | (300 | ) | |||||||||||||||
Unrealized gains (losses) on available-for-sale assets |
(22 | ) | (362 | ) | 22 | (442 | ) | |||||||||||||
|
|
|
|
|
|
|
|
|||||||||||||
Other comprehensive income (loss), net of taxes |
(15,523 | ) | (49,194 | ) | 50,560 | 30,962 | ||||||||||||||
|
|
|
|
|
|
|
|
|||||||||||||
Total comprehensive income |
$ | 72,513 | $ | 77,651 | $ | 128,756 | $ | 288,614 | ||||||||||||
|
|
|
|
|
|
|
|
|||||||||||||
Comprehensive income from continuing operations |
$ | 72,513 | $ | 77,651 | $ | 128,756 | $ | 161,671 | ||||||||||||
Comprehensive income from discontinued operation |
4 | | | | 126,943 | |||||||||||||||
|
|
|
|
|
|
|
|
|||||||||||||
Total comprehensive income |
$ | 72,513 | $ | 77,651 | $ | 128,756 | $ | 288,614 | ||||||||||||
|
|
|
|
|
|
|
|
|||||||||||||
Other comprehensive income (loss) attributable to: |
||||||||||||||||||||
Equity holders |
$ | (15,543 | ) | $ | (49,177 | ) | $ | 50,580 | $ | 30,936 | ||||||||||
Non-controlling interest |
20 | (17 | ) | (20 | ) | 26 | ||||||||||||||
|
|
|
|
|
|
|
|
|||||||||||||
Other comprehensive income (loss) for the period |
$ | (15,523 | ) | $ | (49,194 | ) | $ | 50,560 | $ | 30,962 | ||||||||||
|
|
|
|
|
|
|
|
|||||||||||||
Total comprehensive income (loss) attributable to: |
||||||||||||||||||||
Equity holders |
$ | 72,495 | $ | 78,031 | $ | 129,714 | $ | 289,480 | ||||||||||||
Non-controlling interest |
18 | (380 | ) | (958 | ) | (866 | ) | |||||||||||||
|
|
|
|
|
|
|
|
|||||||||||||
Total comprehensive income for the period |
$ | 72,513 | $ | 77,651 | $ | 128,756 | $ | 288,614 | ||||||||||||
|
|
|
|
|
|
|
|
See accompanying notes to condensed consolidated interim financial statements.
2015 SECOND QUARTER REPORT 3
Cameco Corporation
Consolidated statements of financial position
(Unaudited) | Note | As at | ||||||||||
($Cdn thousands) |
Jun 30/15 | Dec 31/14 | ||||||||||
Assets |
||||||||||||
Current assets |
||||||||||||
Cash and cash equivalents |
$ | 330,862 | $ | 566,583 | ||||||||
Accounts receivable |
153,751 | 455,002 | ||||||||||
Current tax assets |
5,931 | 3,096 | ||||||||||
Inventories |
5 | 1,255,144 | 902,278 | |||||||||
Supplies and prepaid expenses |
155,081 | 130,406 | ||||||||||
Current portion of long-term receivables, investments and other |
6 | 27,162 | 10,341 | |||||||||
|
|
|
|
|||||||||
Total current assets |
1,927,931 | 2,067,706 | ||||||||||
|
|
|
|
|||||||||
Property, plant and equipment |
5,360,421 | 5,291,021 | ||||||||||
Goodwill and intangible assets |
207,538 | 201,102 | ||||||||||
Long-term receivables, investments and other |
6 | 465,106 | 423,280 | |||||||||
Investment in equity-accounted investee |
1,862 | 3,230 | ||||||||||
Deferred tax assets |
559,945 | 486,328 | ||||||||||
|
|
|
|
|||||||||
Total non-current assets |
6,594,872 | 6,404,961 | ||||||||||
|
|
|
|
|||||||||
Total assets |
$ | 8,522,803 | $ | 8,472,667 | ||||||||
|
|
|
|
|||||||||
Liabilities and shareholders equity |
||||||||||||
Current liabilities |
||||||||||||
Accounts payable and accrued liabilities |
$ | 269,621 | $ | 316,258 | ||||||||
Current tax liabilities |
19,877 | 51,719 | ||||||||||
Dividends payable |
39,579 | 39,579 | ||||||||||
Current portion of other liabilities |
7 | 164,208 | 87,883 | |||||||||
Current portion of provisions |
8 | 22,861 | 20,375 | |||||||||
|
|
|
|
|||||||||
Total current liabilities |
516,146 | 515,814 | ||||||||||
|
|
|
|
|||||||||
Long-term debt |
1,491,703 | 1,491,198 | ||||||||||
Other liabilities |
7 | 155,924 | 172,034 | |||||||||
Provisions |
8 | 838,267 | 825,935 | |||||||||
Deferred tax liabilities |
22,770 | 23,882 | ||||||||||
|
|
|
|
|||||||||
Total non-current liabilities |
2,508,664 | 2,513,049 | ||||||||||
|
|
|
|
|||||||||
Shareholders equity |
||||||||||||
Share capital |
1,862,646 | 1,862,646 | ||||||||||
Contributed surplus |
201,403 | 196,815 | ||||||||||
Retained earnings |
3,333,078 | 3,333,099 | ||||||||||
Other components of equity |
101,664 | 51,084 | ||||||||||
|
|
|
|
|||||||||
Total shareholders equity attributable to equity holders |
5,498,791 | 5,443,644 | ||||||||||
Non-controlling interest |
(798 | ) | 160 | |||||||||
|
|
|
|
|||||||||
Total shareholders equity |
5,497,993 | 5,443,804 | ||||||||||
|
|
|
|
|||||||||
Total liabilities and shareholders equity |
$ | 8,522,803 | $ | 8,472,667 | ||||||||
|
|
|
|
Commitments and contingencies [notes 8, 12]
See accompanying notes to condensed consolidated interim financial statements.
4 CAMECO CORPORATION
Cameco Corporation
Consolidated statements of changes in equity
Attributable to equity holders | ||||||||||||||||||||||||||||||||||||
($Cdn thousands) |
Share capital |
Contributed surplus |
Retained earnings |
Foreign currency translation |
Cash flow hedges |
Available- for-sale assets |
Total | Non- controlling interest |
Total equity | |||||||||||||||||||||||||||
Balance at January 1, 2015 |
$ | 1,862,646 | $ | 196,815 | $ | 3,333,099 | $ | 51,667 | $ | | $ | (583 | ) | $ | 5,443,644 | $ | 160 | $ | 5,443,804 | |||||||||||||||||
Net earnings (loss) |
| | 79,134 | | | | 79,134 | (938 | ) | 78,196 | ||||||||||||||||||||||||||
Total comprehensive income (loss) for the period |
| | | 50,558 | | 22 | 50,580 | (20 | ) | 50,560 | ||||||||||||||||||||||||||
|
|
|
|
|
|
|
|
|
|
|
|
|
|
|
|
|
|
|||||||||||||||||||
Total comprehensive income (loss) for the period |
| | 79,134 | 50,558 | | 22 | 129,714 | (958 | ) | 128,756 | ||||||||||||||||||||||||||
|
|
|
|
|
|
|
|
|
|
|
|
|
|
|
|
|
|
|||||||||||||||||||
Share-based compensation |
| 9,141 | | | | | 9,141 | | 9,141 | |||||||||||||||||||||||||||
Share options exercised |
| (4,553 | ) | | | | | (4,553 | ) | | (4,553 | ) | ||||||||||||||||||||||||
Dividends |
| | (79,155 | ) | | | | (79,155 | ) | | (79,155 | ) | ||||||||||||||||||||||||
|
|
|
|
|
|
|
|
|
|
|
|
|
|
|
|
|
|
|||||||||||||||||||
Balance at June 30, 2015 |
$ | 1,862,646 | $ | 201,403 | $ | 3,333,078 | $ | 102,225 | $ | | $ | (561 | ) | $ | 5,498,791 | $ | (798 | ) | $ | 5,497,993 | ||||||||||||||||
|
|
|
|
|
|
|
|
|
|
|
|
|
|
|
|
|
|
|||||||||||||||||||
Balance at January 1, 2014 |
$ | 1,854,671 | $ | 186,382 | $ | 3,314,049 | $ | (7,165 | ) | $ | 300 | $ | 28 | $ | 5,348,265 | $ | 1,129 | $ | 5,349,394 | |||||||||||||||||
Net earnings (loss) |
| | 258,544 | | | | 258,544 | (892 | ) | 257,652 | ||||||||||||||||||||||||||
Total comprehensive income (loss) for the period |
| | | 31,678 | (300 | ) | (442 | ) | 30,936 | 26 | 30,962 | |||||||||||||||||||||||||
|
|
|
|
|
|
|
|
|
|
|
|
|
|
|
|
|
|
|||||||||||||||||||
Total comprehensive income (loss) for the period |
| | 258,544 | 31,678 | (300 | ) | (442 | ) | 289,480 | (866 | ) | 288,614 | ||||||||||||||||||||||||
|
|
|
|
|
|
|
|
|
|
|
|
|
|
|
|
|
|
|||||||||||||||||||
Share-based compensation |
| 8,838 | | | | | 8,838 | | 8,838 | |||||||||||||||||||||||||||
Share options exercised |
7,573 | (3,808 | ) | | | | | 3,765 | | 3,765 | ||||||||||||||||||||||||||
Dividends |
| | (79,074 | ) | | | | (79,074 | ) | | (79,074 | ) | ||||||||||||||||||||||||
|
|
|
|
|
|
|
|
|
|
|
|
|
|
|
|
|
|
|||||||||||||||||||
Balance at June 30, 2014 |
$ | 1,862,244 | $ | 191,412 | $ | 3,493,519 | $ | 24,513 | $ | | $ | (414 | ) | $ | 5,571,274 | $ | 263 | $ | 5,571,537 | |||||||||||||||||
|
|
|
|
|
|
|
|
|
|
|
|
|
|
|
|
|
|
See accompanying notes to condensed consolidated interim financial statements.
2015 SECOND QUARTER REPORT 5
Cameco Corporation
Consolidated statements of cash flows
(Unaudited) | Note | Three months ended | Six months ended | |||||||||||||||||
($Cdn thousands) |
Jun 30/15 | Jun 30/14 | Jun 30/15 | Jun 30/14 | ||||||||||||||||
Operating activities |
||||||||||||||||||||
Net earnings |
$ | 88,036 | $ | 126,845 | $ | 78,196 | $ | 257,652 | ||||||||||||
Adjustments for: |
||||||||||||||||||||
Depreciation and amortization |
65,044 | 71,111 | 125,278 | 137,445 | ||||||||||||||||
Deferred charges |
(20,321 | ) | (7,785 | ) | (18,931 | ) | (10,844 | ) | ||||||||||||
Unrealized loss (gain) on derivatives |
(62,550 | ) | (80,143 | ) | 46,260 | (49,344 | ) | |||||||||||||
Share-based compensation |
15 | 4,168 | 3,960 | 9,141 | 8,838 | |||||||||||||||
Loss on disposal of assets |
462 | 6,665 | 444 | 5,556 | ||||||||||||||||
Finance costs |
10 | 25,104 | 35,771 | 50,336 | 59,239 | |||||||||||||||
Finance income |
(1,567 | ) | (2,094 | ) | (3,770 | ) | (3,239 | ) | ||||||||||||
Share of loss in equity-accounted investees |
1,386 | 3,469 | 1,368 | 13,503 | ||||||||||||||||
Impairment charge |
6 | | | 5,688 | | |||||||||||||||
Other expense (income) |
11 | 14,437 | 13,808 | (27,774 | ) | (6,124 | ) | |||||||||||||
Discontinued operation |
4 | | | | (127,243 | ) | ||||||||||||||
Income tax recovery |
12 | (4,524 | ) | (5,691 | ) | (49,911 | ) | (51,067 | ) | |||||||||||
Interest received |
1,312 | 1,451 | 3,203 | 2,197 | ||||||||||||||||
Income taxes paid |
(4,054 | ) | (98,643 | ) | (96,199 | ) | (207,861 | ) | ||||||||||||
Other operating items |
14 | (172,061 | ) | (94,196 | ) | (54,900 | ) | (47,192 | ) | |||||||||||
|
|
|
|
|
|
|
|
|||||||||||||
Net cash provided by (used in) operations |
(65,128 | ) | (25,472 | ) | 68,429 | (18,484 | ) | |||||||||||||
|
|
|
|
|
|
|
|
|||||||||||||
Investing activities |
||||||||||||||||||||
Additions to property, plant and equipment |
(97,492 | ) | (111,221 | ) | (195,094 | ) | (223,130 | ) | ||||||||||||
Increase in short-term investments |
| (28,849 | ) | | (138,265 | ) | ||||||||||||||
Decrease (increase) in long-term receivables, investments and other |
(2,052 | ) | (2,093 | ) | 1,938 | (566 | ) | |||||||||||||
Proceeds from sale of property, plant and equipment |
14 | 698 | 96 | 676 | ||||||||||||||||
|
|
|
|
|
|
|
|
|||||||||||||
Net cash used in investing (continuing operations) |
(99,530 | ) | (141,465 | ) | (193,060 | ) | (361,285 | ) | ||||||||||||
Net cash provided by investing (discontinued operation) |
4 | | | | 447,096 | |||||||||||||||
|
|
|
|
|
|
|
|
|||||||||||||
Net cash provided by (used in) investing |
(99,530 | ) | (141,465 | ) | (193,060 | ) | 85,811 | |||||||||||||
|
|
|
|
|
|
|
|
|||||||||||||
Financing activities |
||||||||||||||||||||
Increase in debt |
| 496,357 | | 496,357 | ||||||||||||||||
Decrease in debt |
(5 | ) | (30,305 | ) | (5 | ) | (41,049 | ) | ||||||||||||
Interest paid |
(20,518 | ) | (10,045 | ) | (34,695 | ) | (31,314 | ) | ||||||||||||
Proceeds from issuance of shares, stock option plan |
| 522 | | 5,914 | ||||||||||||||||
Dividends paid |
(39,579 | ) | (39,540 | ) | (79,155 | ) | (79,044 | ) | ||||||||||||
|
|
|
|
|
|
|
|
|||||||||||||
Net cash provided by (used in) financing |
(60,102 | ) | 416,989 | (113,855 | ) | 350,864 | ||||||||||||||
|
|
|
|
|
|
|
|
|||||||||||||
Increase (decrease) in cash and cash equivalents net of bank overdraft, during the period |
(224,760 | ) | 250,052 | (238,486 | ) | 418,191 | ||||||||||||||
Exchange rate changes on foreign currency cash balances |
(2,265 | ) | (1,823 | ) | 2,765 | (549 | ) | |||||||||||||
Cash and cash equivalents, net of bank overdraft, beginning of year |
557,887 | 357,322 | 566,583 | 187,909 | ||||||||||||||||
|
|
|
|
|
|
|
|
|||||||||||||
Cash and cash equivalents, net of bank overdraft, end of period |
$ | 330,862 | $ | 605,551 | $ | 330,862 | $ | 605,551 | ||||||||||||
|
|
|
|
|
|
|
|
|||||||||||||
Cash and cash equivalents is comprised of: |
||||||||||||||||||||
Cash |
71,876 | 61,464 | ||||||||||||||||||
Cash equivalents |
258,986 | 628,784 | ||||||||||||||||||
|
|
|
|
|||||||||||||||||
Cash and cash equivalents |
$ | 330,862 | $ | 690,248 | ||||||||||||||||
Bank overdraft |
| (84,697 | ) | |||||||||||||||||
|
|
|
|
|||||||||||||||||
Cash and cash equivalents and bank overdraft |
$ | 330,862 | $ | 605,551 | ||||||||||||||||
|
|
|
|
See accompanying notes to condensed consolidated interim financial statements.
6 CAMECO CORPORATION
Cameco Corporation
Notes to condensed consolidated interim financial statements
(Unaudited)
(Cdn$ thousands, except per share amounts and as noted)
1. Cameco Corporation
Cameco Corporation is incorporated under the Canada Business Corporations Act. The address of its registered office is 2121 11th Street West, Saskatoon, Saskatchewan, S7M 1J3. The condensed consolidated interim financial statements as at and for the period ended June 30, 2015 comprise Cameco Corporation and its subsidiaries (collectively, the Company or Cameco) and the Companys interests in associates and joint arrangements. The Company is primarily engaged in the exploration for and the development, mining, refining, conversion, fabrication and trading of uranium for sale as fuel for generating electricity in nuclear power reactors in Canada and other countries.
2. Significant accounting policies
A. Statement of compliance
These condensed consolidated interim financial statements have been prepared in accordance with IAS 34 Interim Financial Reporting. The condensed consolidated interim financial statements do not include all of the information required for full annual financial statements and should be read in conjunction with Camecos annual consolidated financial statements as at and for the year ended December 31, 2014.
These condensed consolidated interim financial statements were authorized for issuance by the Companys board of directors on July 29, 2015.
B. Basis of presentation
These condensed consolidated interim financial statements are presented in Canadian dollars, which is the Companys functional currency. All financial information is presented in Canadian dollars, unless otherwise noted. Amounts presented in tabular format have been rounded to the nearest thousand except per share amounts and where otherwise noted.
The condensed consolidated interim financial statements have been prepared on the historical cost basis except for the following material items which are measured on an alternative basis at each reporting date:
Derivative financial instruments at fair value through profit and loss |
Fair value | |
Non-derivative financial instruments at fair value through profit and loss |
Fair value | |
Available-for-sale financial assets |
Fair value | |
Liabilities for cash-settled share-based payment arrangements |
Fair value | |
Net defined benefit liability |
Fair value of plan assets less the present value of the defined benefit obligation |
The preparation of the condensed consolidated interim financial statements in conformity with IFRS requires management to make judgments, estimates and assumptions that affect the application of accounting policies and the reported amounts of assets, liabilities, revenue and expenses. Actual results may vary from these estimates.
In preparing these condensed consolidated interim financial statements, the significant judgments made by management in applying the Companys accounting policies and key sources of estimation uncertainty were the same as those that applied to the consolidated financial statements as at and for the year ended December 31, 2014.
2015 SECOND QUARTER REPORT 7
Estimates and underlying assumptions are reviewed on an ongoing basis. Revisions to accounting estimates are recognized in the period in which the estimates are revised and in any future periods affected. The areas involving a higher degree of judgment or complexity, or areas where assumptions and estimates are significant to the consolidated financial statements are disclosed in note 5 of the December 31, 2014 consolidated financial statements.
3. Accounting standards
New standards and interpretations not yet adopted
A number of new standards and amendments to existing standards are not yet effective for the period ended June 30, 2015 and have not been applied in preparing these condensed consolidated interim financial statements. The following standards and amendments to existing standards have been published and are mandatory for Camecos accounting periods beginning on or after January 1, 2016, unless otherwise noted. Cameco does not intend to early adopt any of the following amendments to existing standards and does not expect the amendments to have a material impact on the financial statements, unless otherwise noted.
i. Property, plant and equipment and intangible assets
In May 2014, the IASB issued amendments to IAS 16, Property, Plant and Equipment and IAS 38, Intangible Assets. The amendments are to be applied prospectively. The amendments clarify the factors to be considered in assessing the technical or commercial obsolescence and the resulting depreciation period of an asset and state that a depreciation method based on revenue is not appropriate.
ii. Joint arrangements
In May 2014, the IASB issued amendments to IFRS 11, Joint Arrangements (IFRS 11). The amendments in IFRS 11 are to be applied prospectively. The amendments clarify the accounting for the acquisition of interests in joint operations and require the acquirer to apply the principles of business combinations accounting in IFRS 3, Business Combinations.
iii. Sale or contribution of assets
In September 2014, the IASB issued amendments to IFRS 10, Consolidated Financial Statements and IAS 28, Investments in Associates and Joint Ventures. The amendments provide clarification on the recognition of gains or losses upon the sale or contribution of assets between an investor and its associate or joint venture.
iv. Noncurrent assets held for sale and discontinued operations
In September 2014, the IASB issued amendments to IFRS 5, Non-Current Assets Held for Sale and Discontinued Operations (IFRS 5). The amendments are to be applied prospectively, with earlier application permitted. Assets are generally disposed of either through sale or through distribution to owners. The amendments to IFRS 5 clarify the application of IFRS 5 when changing from one of these disposal methods to the other.
v. Financial instruments disclosures
In September 2014, the IASB issued amendments to IFRS 7, Financial Instruments: Disclosures (IFRS 7). The amendments in IFRS 7 are to be applied retrospectively, with earlier application permitted. The amendments to IFRS 7 clarify the disclosure required for any continuing involvement in a transferred asset that has been derecognized. The amendments also provide guidance on disclosures regarding the offsetting of financial assets and financial liabilities in interim financial reports.
vi. Interim financial reporting
In September 2014, the IASB issued amendments to IAS 34, Interim Financial Reporting (IAS 34). The amendments to IAS 34 are to be applied retrospectively, with earlier application permitted. The amendments provide additional guidance on interim disclosures and whether they are provided in the interim financial statements or incorporated by cross-reference between the interim financial statements and other financial disclosures.
8 CAMECO CORPORATION
vii. Revenue
In May 2014, the IASB issued IFRS 15, Revenue from Contracts with Customers (IFRS 15). IFRS 15 is effective for periods beginning on or after January 1, 2018 and is to be applied retrospectively. IFRS 15 clarifies the principles for recognizing revenue from contracts with customers. The extent of the impact of adoption of IFRS 15 has not yet been determined.
viii. Financial instruments
In July 2014, the IASB issued IFRS 9, Financial Instruments (IFRS 9). IFRS 9 replaces the current multiple classification and measurement models for financial assets and liabilities with a single model that has only two classification categories: amortized cost and fair value. The basis of classification depends on the entitys business model and the contractual cash flow characteristics of the financial asset or liability. It also introduces additional changes relating to financial liabilities and aligns hedge accounting more closely with risk management.
IFRS 9 is effective for annual periods beginning on or after January 1, 2018, with early adoption of the new standard permitted. Cameco does not intend to early adopt IFRS 9. The extent of the impact of adoption of IFRS 9 has not yet been determined.
4. Discontinued operation
On March 27, 2014, Cameco completed the sale of its 31.6% limited partnership interest in Bruce Power L.P. (BPLP) which operates the four Bruce B nuclear reactors in Ontario. The aggregate sale price for Camecos interest in BPLP and certain related entities was $450,000,000. The sale was accounted for effective January 1, 2014. Cameco received net proceeds of approximately $447,096,000 and realized an after tax gain of $127,243,000 on this divestiture. As a result of the transaction, Cameco presented the results of BPLP as a discontinued operation and revised its statement of earnings, statement of comprehensive income and statement of cash flows to reflect this change in presentation.
5. Inventories
Jun 30/15 | Dec 31/14 | |||||||
Uranium |
||||||||
Concentrate |
$ | 703,282 | $ | 500,342 | ||||
Broken ore |
77,305 | 21,289 | ||||||
|
|
|
|
|||||
780,587 | 521,631 | |||||||
NUKEM |
312,723 | 251,942 | ||||||
Fuel services |
161,834 | 128,705 | ||||||
|
|
|
|
|||||
Total |
$ | 1,255,144 | $ | 902,278 | ||||
|
|
|
|
In the second quarter of 2015, commercial production was achieved at Camecos Cigar Lake operation. Effective May 1, 2015, we commenced charging all production costs, including depreciation, to inventory and subsequently recognizing in cost of sales as the product is sold.
Cameco expensed $395,500,000 of inventory as cost of sales during the second quarter of 2015 (2014$327,200,000). For the six months ended June 30, 2015, Cameco expensed $813,700,000 of inventory as cost of sales (2014$602,200,000).
NUKEM enters into financing arrangements where future receivables arising from certain sales contracts are sold to financial institutions in exchange for cash. These arrangements require NUKEM to satisfy its delivery obligations under the sales contracts, which are recognized as deferred sales (note 7). In some of the arrangements, NUKEM is also required to pledge the underlying inventory as security against these performance obligations. As of June 30, 2015, NUKEM had $54,099,000 (US) (December 31, 2014$64,687,000 (US)) of inventory pledged as security under financing arrangements.
2015 SECOND QUARTER REPORT 9
6. Long-term receivables, investments and other
Jun 30/15 | Dec 31/14 | |||||||
Investments in equity securities [note 16] |
$ | 938 | $ | 6,601 | ||||
Derivatives [note 16] |
14,321 | 3,889 | ||||||
Advances receivable from JV Inkai LLP [note 18] |
93,593 | 91,672 | ||||||
Investment tax credits |
93,155 | 90,658 | ||||||
Amounts receivable related to tax dispute [note 12] |
247,444 | 211,604 | ||||||
Other |
42,817 | 29,197 | ||||||
|
|
|
|
|||||
492,268 | 433,621 | |||||||
Less current portion |
(27,162 | ) | (10,341 | ) | ||||
|
|
|
|
|||||
Net |
$ | 465,106 | $ | 423,280 | ||||
|
|
|
|
In 2014, GoviEx Uranium (GoviEx) became listed on the Canadian Securities Exchange. With the availability of a quoted market price, Cameco determined that there was a significant decline in the fair value of its investment in GoviEx. As a result, an impairment charge of $5,688,000 was recorded during the first quarter of 2015 (2014nil).
7. Other liabilities
Jun 30/15 | Dec 31/14 | |||||||
Deferred sales |
$ | 121,377 | $ | 123,298 | ||||
Derivatives [note 16] |
125,551 | 67,916 | ||||||
Accrued pension and post-retirement benefit liability |
65,816 | 61,670 | ||||||
Other |
7,388 | 7,033 | ||||||
|
|
|
|
|||||
320,132 | 259,917 | |||||||
Less current portion |
(164,208 | ) | (87,883 | ) | ||||
|
|
|
|
|||||
Net |
$ | 155,924 | $ | 172,034 | ||||
|
|
|
|
Deferred sales includes $80,021,000 (US) (December 31, 2014$92,299,000 (US)) of performance obligations relating to financing arrangements entered into by NUKEM (note 5).
8. Provisions
Reclamation | Waste disposal | Total | ||||||||||
Beginning of year |
$ | 828,015 | $ | 18,295 | $ | 846,310 | ||||||
Changes in estimates and discount rates |
(13,657 | ) | 366 | (13,291 | ) | |||||||
Provisions used during the period |
(4,065 | ) | (13 | ) | (4,078 | ) | ||||||
Unwinding of discount |
9,935 | 164 | 10,099 | |||||||||
Impact of foreign exchange |
22,088 | | 22,088 | |||||||||
|
|
|
|
|
|
|||||||
End of period |
$ | 842,316 | $ | 18,812 | $ | 861,128 | ||||||
|
|
|
|
|
|
|||||||
Current |
20,246 | 2,615 | 22,861 | |||||||||
Non-current |
822,070 | 16,197 | 838,267 | |||||||||
|
|
|
|
|
|
|||||||
$ | 842,316 | $ | 18,812 | $ | 861,128 | |||||||
|
|
|
|
|
|
10 CAMECO CORPORATION
9. Share capital
At June 30, 2015, there were 395,792,522 common shares outstanding. Options in respect of 8,713,524 shares are outstanding under the stock option plan and are exercisable up to 2023. For the quarter ended June 30, 2015, there were no options that were exercised resulting in the issuance of shares (2014 - 25,957). For the six months ended June 30, 2015, there were no options exercised that that resulted in the issuance of shares (2014 - 299,592).
10. Finance costs
Three months ended | Six months ended | |||||||||||||||
Jun 30/15 | Jun 30/14 | Jun 30/15 | Jun 30/14 | |||||||||||||
Interest on long-term debt |
$ | 18,717 | $ | 16,205 | $ | 37,258 | $ | 31,856 | ||||||||
Unwinding of discount on provisions |
4,873 | 4,950 | 10,099 | 10,065 | ||||||||||||
Loss on redemption of Series C debentures |
| 12,135 | | 12,135 | ||||||||||||
Other charges |
1,514 | 1,538 | 2,961 | 2,955 | ||||||||||||
Interest on short-term debt |
| 943 | 18 | 2,228 | ||||||||||||
|
|
|
|
|
|
|
|
|||||||||
Total |
$ | 25,104 | $ | 35,771 | $ | 50,336 | $ | 59,239 | ||||||||
|
|
|
|
|
|
|
|
11. Other income (expense)
Three months ended | Six months ended | |||||||||||||||
Jun 30/15 | Jun 30/14 | Jun 30/15 | Jun 30/14 | |||||||||||||
Foreign exchange gains (losses) |
$ | (14,437 | ) | $ | (13,808 | ) | $ | 27,774 | $ | 5,644 | ||||||
Contract settlement |
| 28,481 | | 28,481 | ||||||||||||
Contract termination fee |
| | | (18,304 | ) | |||||||||||
Other |
13 | 269 | 311 | 752 | ||||||||||||
|
|
|
|
|
|
|
|
|||||||||
Total |
$ | (14,424 | ) | $ | 14,942 | $ | 28,085 | $ | 16,573 | |||||||
|
|
|
|
|
|
|
|
In the first quarter of 2014, Cameco recorded an early termination fee of $18,304,000, incurred as a result of the cancellation of our toll conversion agreement with Springfields Fuels Ltd., which was to expire in 2016.
During the second quarter of 2014, Cameco recorded a gain with respect to a long-term supply contract with one of its utility customers. The $28,481,000 reflected as income from contract settlement related to deliveries that the customer refused to take in 2012 and 2013.
2015 SECOND QUARTER REPORT 11
12. Income taxes
Three months ended | Six months ended | |||||||||||||||
Jun 30/15 | Jun 30/14 | Jun 30/15 | Jun 30/14 | |||||||||||||
Earnings (loss) from continuing operations before income taxes |
||||||||||||||||
Canada |
$ | (106,920 | ) | $ | (48,803 | ) | $ | (317,265 | ) | $ | (242,113 | ) | ||||
Foreign |
190,432 | 169,957 | 345,550 | 321,455 | ||||||||||||
|
|
|
|
|
|
|
|
|||||||||
$ | 83,512 | $ | 121,154 | $ | 28,285 | $ | 79,342 | |||||||||
|
|
|
|
|
|
|
|
|||||||||
Current income taxes (recovery) |
||||||||||||||||
Canada |
$ | 313 | $ | (1,338 | ) | $ | 1,222 | $ | (6,468 | ) | ||||||
Foreign |
12,564 | 11,219 | 21,266 | 19,388 | ||||||||||||
|
|
|
|
|
|
|
|
|||||||||
$ | 12,877 | $ | 9,881 | $ | 22,488 | $ | 12,920 | |||||||||
Deferred income taxes (recovery) |
||||||||||||||||
Canada |
$ | (17,858 | ) | $ | (10,748 | ) | $ | (72,345 | ) | $ | (54,186 | ) | ||||
Foreign |
457 | (4,824 | ) | (54 | ) | (9,801 | ) | |||||||||
|
|
|
|
|
|
|
|
|||||||||
$ | (17,401 | ) | $ | (15,572 | ) | $ | (72,399 | ) | $ | (63,987 | ) | |||||
|
|
|
|
|
|
|
|
|||||||||
Income tax recovery |
$ | (4,524 | ) | $ | (5,691 | ) | $ | (49,911 | ) | $ | (51,067 | ) | ||||
|
|
|
|
|
|
|
|
Cameco has recorded $559,945,000 of deferred tax assets (December 31, 2014 - 486,328,000). Based on projections of future income, realization of these deferred tax assets is probable and consequently a deferred tax asset has been recorded.
Canada
In 2008, as part of the ongoing annual audits of Camecos Canadian tax returns, Canada Revenue Agency (CRA) disputed the transfer pricing structure and methodology used by Cameco and its wholly owned Swiss subsidiary, Cameco Europe Ltd., in respect of sale and purchase agreements for uranium products. From December 2008 to date, CRA issued notices of reassessment for the taxation years 2003 through 2009, which in aggregate have increased Camecos income for Canadian tax purposes by approximately $2,795,000,000. CRA has also issued notices of reassessment for transfer pricing penalties for the years 2007 through 2009 in the amount of $229,300,000. Cameco believes it is likely that CRA will reassess Camecos tax returns for subsequent years on a similar basis and that these will require Cameco to make future remittances on receipt of the reassessments.
Using the methodology we believe that CRA will continue to apply and including the $2,795,000,000 already reassessed, we expect to receive notices of reassessment for a total of approximately $6,600,000,000 for the years 2003 through 2014, which would increase Camecos income for Canadian tax purposes and result in a related tax expense of approximately $1,900,000,000. In addition to penalties already imposed, CRA may continue to apply penalties to taxation years subsequent to 2009. As a result, we estimate that cash taxes and transfer pricing penalties would be between $1,450,000,000 and $1,500,000,000. In addition, we estimate there would be interest and instalment penalties applied that would be material to Cameco. While in dispute, we would be responsible for remitting 50% of the cash taxes and transfer pricing penalties (between $725,000,000 and $750,000,000), plus related interest and instalment penalties assessed, which would be material to Cameco. As an alternative to paying cash, we are exploring the possibility of providing security in the form of letters of credit to satisfy our requirements under these provisions.
Under Canadian federal and provincial tax rules, the amount required to be remitted each year will depend on the amount of income reassessed in that year and the availability of elective deductions and tax loss carryovers. In light of our view of the likely outcome of the case, we expect to recover the amounts remitted to CRA, including cash taxes, interest and penalties totalling $247,444,000 already paid as at June 30, 2015 (December 31, 2014 - $211,604,000) (note 6).
12 CAMECO CORPORATION
The case on the 2003 reassessment is expected to go to trial in 2016. If this timing is adhered to, we expect to have a Tax Court decision within six to 18 months after the trial is complete.
Having regard to advice from its external advisors, Camecos opinion is that CRAs position is incorrect and Cameco is contesting CRAs position and expects to recover any amounts remitted as a result of the reassessments. However, to reflect the uncertainties of CRAs appeals process and litigation, Cameco has recorded a cumulative tax provision related to this matter for the years 2003 through the current period in the amount of $89,000,000. While the resolution of this matter may result in liabilities that are higher or lower than the reserve, management believes that the ultimate resolution will not be material to Camecos financial position, results of operations or liquidity in the year(s) of resolution. Resolution of this matter as stipulated by CRA would be material to Camecos financial position, results of operations or liquidity in the year(s) of resolution and other unfavourable outcomes for the years 2003 to date could be material to Camecos financial position, results of operations and cash flows in the year(s) of resolution.
Further to Camecos decision to contest CRAs reassessments, Cameco is pursuing its appeal rights under Canadian federal and provincial tax rules.
United States
In February 2015, one of Camecos subsidiaries received a Revenue Agents Report (RAR) from the Internal Revenue Service (IRS) pertaining to the 2009 taxation year. The RAR lists the IRS proposed adjustments to taxable income and calculates tax and penalties owing based on the proposed adjustments.
The proposed adjustments reflected in the RAR are focused on transfer pricing in respect of certain intercompany transactions within our corporate structure. The IRS asserts that a portion of the non-US income reported under our corporate structure and taxed outside the US should be recognized and taxed in the US. Having regard to advice from its external advisors, management believes that the conclusions of the IRS in the RAR are incorrect and is contesting them in an administrative appeal of the proposed adjustments. No cash payments are required while pursuing an administrative appeal. Management believes that the ultimate resolution of this matter will not be material to our financial position, results of operations or liquidity in the year(s) of resolution.
Other comprehensive income (loss)
Other comprehensive income included on the consolidated statements of comprehensive income and the consolidated statements of changes in equity is presented net of income taxes. The following income tax amounts are included in each component of other comprehensive income:
For the three months ended June 30, 2015
Before tax | Income tax Recovery |
Net of tax | ||||||||||
Exchange differences on translation of foreign operations |
$ | (15,501 | ) | $ | | $ | (15,501 | ) | ||||
Unrealized losses on available-for-sale assets |
(25 | ) | 3 | (22 | ) | |||||||
|
|
|
|
|
|
|||||||
$ | (15,526 | ) | $ | 3 | $ | (15,523 | ) | |||||
|
|
|
|
|
|
2015 SECOND QUARTER REPORT 13
For the three months ended June 30, 2014
Before tax | Income tax recovery |
Net of tax | ||||||||||
Exchange differences on translation of foreign operations |
$ | (48,832 | ) | $ | | $ | (48,832 | ) | ||||
Unrealized losses on available-for-sale assets |
(418 | ) | 56 | (362 | ) | |||||||
|
|
|
|
|
|
|||||||
$ | (49,250 | ) | $ | 56 | $ | (49,194 | ) | |||||
|
|
|
|
|
|
For the six months ended June 30, 2015
Before tax | Income tax expense |
Net of tax | ||||||||||
Exchange differences on translation of foreign operations |
$ | 50,538 | $ | | $ | 50,538 | ||||||
Unrealized gains on available-for-sale assets |
25 | (3 | ) | 22 | ||||||||
|
|
|
|
|
|
|||||||
$ | 50,563 | $ | (3 | ) | $ | 50,560 | ||||||
|
|
|
|
|
|
For the six months ended June 30, 2014
Before tax | Income tax Recovery |
Net of tax | ||||||||||
Exchange differences on translation of foreign operations |
$ | 31,704 | $ | | $ | 31,704 | ||||||
Gains on derivatives designated as cash flow hedges transferred to net earningsdiscontinued operation |
(400 | ) | 100 | (300 | ) | |||||||
Unrealized losses on available-for-sale assets |
(511 | ) | 69 | (442 | ) | |||||||
|
|
|
|
|
|
|||||||
$ | 30,793 | $ | 169 | $ | 30,962 | |||||||
|
|
|
|
|
|
13. Per share amounts
Per share amounts have been calculated based on the weighted average number of common shares outstanding during the period. The weighted average number of paid shares outstanding in 2015 was 395,792,522 (2014395,689,970).
Three months ended | Six months ended | |||||||||||||||
Jun 30/15 | Jun 30/14 | Jun 30/15 | Jun 30/14 | |||||||||||||
Basic earnings per share computation |
|
|||||||||||||||
Net earnings attributable to equity holders |
$ | 88,037 | $ | 127,208 | $ | 79,134 | $ | 258,544 | ||||||||
Weighted average common shares outstanding |
395,793 | 395,764 | 395,793 | 395,690 | ||||||||||||
|
|
|
|
|
|
|
|
|||||||||
Basic earnings per common share |
$ | 0.22 | $ | 0.32 | $ | 0.20 | $ | 0.65 | ||||||||
|
|
|
|
|
|
|
|
|||||||||
Diluted earnings per share computation |
||||||||||||||||
Net earnings attributable to equity holders |
$ | 88,037 | $ | 127,208 | $ | 79,134 | $ | 258,544 | ||||||||
Weighted average common shares outstanding |
395,793 | 395,764 | 395,793 | 395,690 | ||||||||||||
Dilutive effect of stock options |
5 | 292 | | 495 | ||||||||||||
|
|
|
|
|
|
|
|
|||||||||
Weighted average common shares outstanding, assuming dilution |
395,798 | 396,056 | 395,793 | 396,185 | ||||||||||||
|
|
|
|
|
|
|
|
|||||||||
Diluted earnings per common share |
$ | 0.22 | $ | 0.32 | $ | 0.20 | $ | 0.65 | ||||||||
|
|
|
|
|
|
|
|
14 CAMECO CORPORATION
14. Statements of cash flows
Three months ended | Six months ended | |||||||||||||||
Jun 30/15 | Jun 30/14 | Jun 30/15 | Jun 30/14 | |||||||||||||
Changes in non-cash working capital: |
||||||||||||||||
Accounts receivable |
$ | 190,690 | $ | (4,115 | ) | $ | 297,772 | $ | 158,925 | |||||||
Inventories |
(199,201 | ) | 23,996 | (285,048 | ) | (68,136 | ) | |||||||||
Supplies and prepaid expenses |
(12,313 | ) | (5,775 | ) | (23,195 | ) | 50,176 | |||||||||
Accounts payable and accrued liabilities |
(150,404 | ) | (92,469 | ) | (50,180 | ) | (163,297 | ) | ||||||||
Reclamation payments |
(2,524 | ) | (2,612 | ) | (4,077 | ) | (4,198 | ) | ||||||||
Other |
1,691 | (13,221 | ) | 9,828 | (20,662 | ) | ||||||||||
|
|
|
|
|
|
|
|
|||||||||
Other operating items |
$ | (172,061 | ) | $ | (94,196 | ) | $ | (54,900 | ) | $ | (47,192 | ) | ||||
|
|
|
|
|
|
|
|
15. Share-based compensation plans
A. Stock option plan
The Company has established a stock option plan under which options to purchase common shares may be granted to employees of Cameco. Options granted under the stock option plan have an exercise price of not less than the closing price quoted on the Toronto Stock Exchange (TSX) for the common shares of Cameco on the trading day prior to the date on which the option is granted. The options carry vesting periods of one to three years, and expire eight years from the date granted.
The aggregate number of common shares that may be issued pursuant to the Cameco stock option plan shall not exceed 43,017,198 of which 27,870,079 shares have been issued.
B. Executive performance share unit (PSU)
The Company has established a PSU plan whereby it provides each plan participant an annual grant of PSUs in an amount determined by the board. Each PSU represents one phantom common share that entitles the participant to a payment of one Cameco common share purchased on the open market or cash, at the boards discretion, at the end of each three-year period if certain performance and vesting criteria have been met. The final value of the PSUs will be based on the value of Cameco common shares at the end of the three-year period and the number of PSUs that ultimately vest. Vesting of PSUs is based on Camecos performance for total shareholder return, average realized selling price and uranium production over the three year period and whether the participating executive remains employed by Cameco. As of June 30, 2015, the total number of PSUs held by the participants, after adjusting for forfeitures on retirement, was 791,071 (December 31, 2014620,654).
C. Restricted share unit (RSU)
The Company has established an RSU plan whereby it provides each plan participant an annual grant of RSUs in an amount determined by the board. Each RSU represents one phantom common share that entitles the participant to a payment of one Cameco common share purchased on the open market, or cash, at the boards discretion. The RSUs carry vesting periods of one to three years, and the final value of the units will be based on the value of Cameco common shares at the end of the vesting periods. As of June 30, 2015, the total number of RSUs held by the participants was 486,072 (December 31, 2014246,394).
2015 SECOND QUARTER REPORT 15
Cameco records compensation expense under its equity-settled plans with an offsetting credit to contributed surplus, to reflect the estimated fair value of units granted to employees. During the period, the Company recognized the following expenses under these plans:
Three months ended | Six months ended | |||||||||||||||
Jun 30/15 | Jun 30/14 | Jun 30/15 | Jun 30/14 | |||||||||||||
Stock option plan |
$ | 1,065 | $ | 1,628 | $ | 3,676 | $ | 5,160 | ||||||||
Performance share unit plan |
1,898 | 1,421 | 3,325 | 2,357 | ||||||||||||
Restricted share unit plan |
1,205 | 911 | 2,140 | 1,321 | ||||||||||||
|
|
|
|
|
|
|
|
|||||||||
$ | 4,168 | $ | 3,960 | $ | 9,141 | $ | 8,838 | |||||||||
|
|
|
|
|
|
|
|
Fair value measurement of equity-settled plans
The fair value of the units granted through the PSU plan was determined based on Monte Carlo simulation and the fair value of options granted under the stock option plan was measured based on the Black-Scholes option-pricing model. The fair value of RSUs granted was determined based on their intrinsic value on the date of grant. Expected volatility was estimated by considering historic average share price volatility.
The inputs used in the measurement of the fair values at grant date of the equity-settled share-based payment plans were as follows:
Stock option plan |
PSU | RSU | ||||||||||
Number of options granted |
965,823 | 336,602 | 298,662 | |||||||||
Average strike price |
$ | 19.30 | | $ | 18.89 | |||||||
Expected dividend |
$ | 0.40 | | | ||||||||
Expected volatility |
32 | % | 29 | % | | |||||||
Risk-free interest rate |
0.7 | % | 0.5 | % | | |||||||
Expected life of option |
4.5 years | 3 years | | |||||||||
Expected forfeitures |
7 | % | 5 | % | 5 | % | ||||||
Weighted average grant date fair values |
$ | 4.30 | $ | 18.88 | $ | 18.89 |
In addition to these inputs, other features of the PSU grant were incorporated into the measurement of fair value. The market condition based on total shareholder return was incorporated by utilizing a Monte Carlo simulation. The non-market criteria relating to realized selling prices, production targets and cost control have been incorporated into the valuation at grant date by reviewing prior history and corporate budgets.
16. Financial instruments and related risk management
A. Fair value hierarchy
The fair value of an asset or liability is generally estimated as the amount that would be received on sale of an asset, or paid to transfer a liability in an orderly transaction between market participants at the reporting date. Fair values of assets and liabilities traded in an active market are determined by reference to last quoted prices, in the principal market for the asset or liability. In the absence of an active market for an asset or liability, fair values are determined based on market quotes for assets or liabilities with similar characteristics and risk profiles, or through other valuation techniques. Fair values determined using valuation techniques require the use of inputs, which are obtained from external, readily observable market data when available. In some circumstances, inputs that are not based on observable data must be used. In these cases, the estimated fair values may be adjusted in order to account for valuation uncertainty, or to reflect the assumptions that market participants would use in pricing the asset or liability.
16 CAMECO CORPORATION
All fair value measurements are categorized into one of three hierarchy levels, described below, for disclosure purposes. Each level is based on the transparency of the inputs used to measure the fair values of assets and liabilities:
Level 1 Values based on unadjusted quoted prices in active markets that are accessible at the reporting date for identical assets or liabilities.
Level 2 Values based on quoted prices in markets that are not active or model inputs that are observable either directly or indirectly for substantially the full term of the asset or liability.
Level 3 Values based on prices or valuation techniques that require inputs that are both unobservable and significant to the overall fair value measurement.
When the inputs used to measure fair value fall within more than one level of the hierarchy, the level within which the fair value measurement is categorized is based on the lowest level input that is significant to the fair value measurement in its entirety.
The following tables summarize the carrying amounts and fair values of Camecos financial instruments that are measured at fair value, including their levels in the fair value hierarchy:
As at June 30, 2015
Fair value | ||||||||||||||||
Carrying value | Level 1 | Level 2 | Total | |||||||||||||
Derivative assets [note 6] |
||||||||||||||||
Foreign currency contracts |
$ | 4,943 | $ | | $ | 4,943 | $ | 4,943 | ||||||||
Interest rate contracts |
9,378 | | 9,378 | 9,378 | ||||||||||||
Investments in equity securities [note 6] |
938 | 938 | | 938 | ||||||||||||
Derivative liabilities [note 7] |
||||||||||||||||
Foreign currency contracts |
(125,203 | ) | | (125,203 | ) | (125,203 | ) | |||||||||
Other |
(348 | ) | | (348 | ) | (348 | ) | |||||||||
|
|
|
|
|
|
|
|
|||||||||
Net |
$ | (110,292 | ) | $ | 938 | $ | (111,230 | ) | $ | (110,292 | ) | |||||
|
|
|
|
|
|
|
|
As at December 31, 2014
Fair value | ||||||||||||||||
Carrying value | Level 1 | Level 2 | Total | |||||||||||||
Derivative assets [note 6] |
||||||||||||||||
Foreign currency contracts |
$ | 911 | $ | | $ | 911 | $ | 911 | ||||||||
Interest rate contracts |
2,978 | | 2,978 | 2,978 | ||||||||||||
Investments in equity securities [note 6] |
6,601 | 6,601 | | 6,601 | ||||||||||||
Derivative liabilities [note 7] |
||||||||||||||||
Foreign currency contracts |
(67,916 | ) | | (67,916 | ) | (67,916 | ) | |||||||||
|
|
|
|
|
|
|
|
|||||||||
Net |
$ | (57,426 | ) | $ | 6,601 | $ | (64,027 | ) | $ | (57,426 | ) | |||||
|
|
|
|
|
|
|
|
The preceding tables exclude fair value information for financial instruments whose carrying amounts are a reasonable approximation of fair value.
There were no transfers between level 1 and level 2 during the period. Cameco does not have any financial instruments that are classified as level 3 as of the reporting date.
B. Financial instruments measured at fair value
Cameco measures its short-term investments, derivative financial instruments and material investments in equity securities at fair value. Short-term investments and investments in publicly held equity securities are classified as a recurring level 1 fair value measurement and derivative financial instruments are classified as a recurring level 2 fair value measurement.
2015 SECOND QUARTER REPORT 17
Short-term investments represent available-for-sale money market instruments. The fair value of these instruments is determined using quoted market yields as of the reporting date. The fair value of investments in equity securities is determined using quoted share prices observed in the principal market for the securities as of the reporting date.
Foreign currency derivatives consist of foreign currency forward contracts, options and swaps. The fair value of foreign currency options is measured based on the Black Scholes option-pricing model. The fair value of foreign currency forward contracts and swaps is measured using a market approach, based on the difference between contracted foreign exchange rates and quoted forward exchange rates as of the reporting date.
Interest rate derivatives consist of interest rate swap contracts and interest rate caps. The fair value of interest rate swaps is determined by discounting expected future cash flows from the contracts. The future cash flows are determined by measuring the difference between fixed interest payments to be received and floating interest payments to be made to the counterparty based on Canada Dealer Offer Rate forward interest rate curves. The fair value of interest rate caps is determined based on broker quotes observed in active markets at the reporting date.
Where applicable, the fair value of the derivatives reflects the credit risk of the instrument and includes adjustments to take into account the credit risk of the Company and counterparty. These adjustments are based on credit ratings and yield curves observed in active markets at the reporting date.
C. Financial instruments not measured at fair value
The carrying value of Camecos cash and cash equivalents, receivables, payables and accrued liabilities is assumed to approximate the fair value as a result of the short-term nature of the instruments. The carrying value of Camecos long-term debt (debentures) is assumed to approximate the fair value as a result of the variable interest rate associated with the instruments or the fixed interest rate of the instruments being similar to market rates.
18 CAMECO CORPORATION
D. Derivatives
The following table summarizes the fair value of derivatives and classification on the consolidated statements of financial position:
Jun 30/15 | Dec 31/14 | |||||||
Non-hedge derivatives: |
||||||||
Foreign currency contracts |
$ | (120,260 | ) | $ | (67,005 | ) | ||
Interest rate contracts |
9,378 | 2,978 | ||||||
Other |
(348 | ) | | |||||
|
|
|
|
|||||
Net |
$ | (111,230 | ) | $ | (64,027 | ) | ||
|
|
|
|
|||||
Classification: |
||||||||
Current portion of long-term receivables, investments and other [note 6] |
$ | 8,170 | $ | 500 | ||||
Long-term receivables, investments and other [note 6] |
6,151 | 3,389 | ||||||
Current portion of other liabilities [note 7] |
(22,191 | ) | (53,873 | ) | ||||
Other liabilities [note 7] |
(103,360 | ) | (14,043 | ) | ||||
|
|
|
|
|||||
Net |
$ | (111,230 | ) | $ | (64,027 | ) | ||
|
|
|
|
The following table summarizes the different components of the gain (loss) on derivatives included in net earnings:
Three months ended | Six months ended | |||||||||||||||
Jun 30/15 | Jun 30/14 | Jun 30/15 | Jun 30/14 | |||||||||||||
Non-hedge derivatives: |
||||||||||||||||
Foreign currency contracts |
$ | 33,744 | $ | 58,978 | $ | (117,934 | ) | $ | 14 | |||||||
Interest rate contracts |
(1,381 | ) | 1,389 | 7,715 | 1,449 | |||||||||||
Share purchase options |
| | | 16 | ||||||||||||
Other |
385 | | 586 | | ||||||||||||
|
|
|
|
|
|
|
|
|||||||||
Net |
$ | 32,748 | $ | 60,367 | $ | (109,633 | ) | $ | 1,479 | |||||||
|
|
|
|
|
|
|
|
17. Segmented information
Cameco has three reportable segments: uranium, fuel services and NUKEM. The uranium segment involves the exploration for, mining, milling, purchase and sale of uranium concentrate. The fuel services segment involves the refining, conversion and fabrication of uranium concentrate and the purchase and sale of conversion services. The NUKEM segment acts as a market intermediary between uranium producers and nuclear-electric utilities.
Camecos reportable segments are strategic business units with different products, processes and marketing strategies.
Accounting policies used in each segment are consistent with the policies outlined in the summary of significant accounting policies. Segment revenues, expenses and results include transactions between segments incurred in the ordinary course of business. These transactions are priced on an arms length basis, are eliminated on consolidation and are reflected in the other column.
2015 SECOND QUARTER REPORT 19
Business segments
For the three months ended June 30, 2015
Uranium | Fuel services | NUKEM | Other | Total | ||||||||||||||||
Revenue |
$ | 423,628 | $ | 69,860 | $ | 80,835 | $ | (9,802 | ) | $ | 564,521 | |||||||||
Expenses |
||||||||||||||||||||
Cost of products and services sold |
251,198 | 44,261 | 61,295 | (10,252 | ) | 346,502 | ||||||||||||||
Depreciation and amortization |
45,929 | 6,168 | 8,524 | 4,423 | 65,044 | |||||||||||||||
|
|
|
|
|
|
|
|
|
|
|||||||||||
Cost of sales |
297,127 | 50,429 | 69,819 | (5,829 | ) | 411,546 | ||||||||||||||
|
|
|
|
|
|
|
|
|
|
|||||||||||
Gross profit (loss) |
126,501 | 19,431 | 11,016 | (3,973 | ) | 152,975 | ||||||||||||||
Administration |
| | 3,621 | 45,820 | 49,441 | |||||||||||||||
Exploration |
11,494 | | | | 11,494 | |||||||||||||||
Research and development |
| | | 1,467 | 1,467 | |||||||||||||||
Loss on sale of assets |
419 | 40 | 3 | | 462 | |||||||||||||||
Finance costs |
| | 1,119 | 23,985 | 25,104 | |||||||||||||||
Gain on derivatives |
| | (487 | ) | (32,261 | ) | (32,748 | ) | ||||||||||||
Finance income |
| | (1 | ) | (1,566 | ) | (1,567 | ) | ||||||||||||
Share of loss from equity-accounted investees |
1,386 | | | | 1,386 | |||||||||||||||
Other expense (income) |
(12 | ) | | (340 | ) | 14,776 | 14,424 | |||||||||||||
|
|
|
|
|
|
|
|
|
|
|||||||||||
Earnings (loss) before income taxes |
113,214 | 19,391 | 7,101 | (56,194 | ) | 83,512 | ||||||||||||||
Income tax recovery |
(4,524 | ) | ||||||||||||||||||
|
|
|||||||||||||||||||
Net earnings |
$ | 88,036 | ||||||||||||||||||
|
|
For the three months ended June 30, 2014
Uranium | Fuel services | NUKEM | Other | Total | ||||||||||||||||
Revenue |
$ | 375,855 | $ | 70,169 | $ | 61,832 | $ | (5,885 | ) | $ | 501,971 | |||||||||
Expenses |
||||||||||||||||||||
Cost of products and services sold |
204,638 | 48,513 | 48,369 | (6,491 | ) | 295,029 | ||||||||||||||
Depreciation and amortization |
60,914 | 5,788 | 821 | 3,588 | 71,111 | |||||||||||||||
|
|
|
|
|
|
|
|
|
|
|||||||||||
Cost of sales |
265,552 | 54,301 | 49,190 | (2,903 | ) | 366,140 | ||||||||||||||
|
|
|
|
|
|
|
|
|
|
|||||||||||
Gross profit (loss) |
110,303 | 15,868 | 12,642 | (2,982 | ) | 135,831 | ||||||||||||||
Administration |
| | 2,959 | 33,477 | 36,436 | |||||||||||||||
Exploration |
9,318 | | | | 9,318 | |||||||||||||||
Research and development |
| | | 421 | 421 | |||||||||||||||
Loss on sale of assets |
6,665 | | | | 6,665 | |||||||||||||||
Finance costs |
| | 897 | 34,874 | 35,771 | |||||||||||||||
Loss (gain) on derivatives |
| | 739 | (61,106 | ) | (60,367 | ) | |||||||||||||
Finance income |
| | (2 | ) | (2,092 | ) | (2,094 | ) | ||||||||||||
Share of loss from equity-accounted investees |
162 | 3,307 | | | 3,469 | |||||||||||||||
Other expense (income) |
(28,481 | ) | (269 | ) | (292 | ) | 14,100 | (14,942 | ) | |||||||||||
|
|
|
|
|
|
|
|
|
|
|||||||||||
Earnings (loss) before income taxes |
122,639 | 12,830 | 8,341 | (22,656 | ) | 121,154 | ||||||||||||||
Income tax recovery |
(5,691 | ) | ||||||||||||||||||
|
|
|||||||||||||||||||
Net earnings from continuing operations |
$ | 126,845 | ||||||||||||||||||
|
|
20 CAMECO CORPORATION
For the six months ended June 30, 2015
Uranium | Fuel services | NUKEM | Other | Total | ||||||||||||||||
Revenue |
$ | 791,495 | $ | 136,232 | $ | 177,939 | $ | 24,622 | $ | 1,130,288 | ||||||||||
Expenses |
||||||||||||||||||||
Cost of products and services sold |
455,447 | 96,301 | 148,204 | 22,921 | 722,873 | |||||||||||||||
Depreciation and amortization |
96,054 | 12,847 | 8,023 | 8,354 | 125,278 | |||||||||||||||
|
|
|
|
|
|
|
|
|
|
|||||||||||
Cost of sales |
551,501 | 109,148 | 156,227 | 31,275 | 848,151 | |||||||||||||||
|
|
|
|
|
|
|
|
|
|
|||||||||||
Gross profit (loss) |
239,994 | 27,084 | 21,712 | (6,653 | ) | 282,137 | ||||||||||||||
Administration |
| | 7,085 | 84,587 | 91,672 | |||||||||||||||
Impairment charge |
5,688 | | | | 5,688 | |||||||||||||||
Exploration |
23,272 | | | | 23,272 | |||||||||||||||
Research and development |
| | | 3,294 | 3,294 | |||||||||||||||
Loss on sale of assets |
413 | 28 | 3 | | 444 | |||||||||||||||
Finance costs |
| | 2,303 | 48,033 | 50,336 | |||||||||||||||
Loss (gain) on derivatives |
| | (767 | ) | 110,400 | 109,633 | ||||||||||||||
Finance income |
| | (1 | ) | (3,769 | ) | (3,770 | ) | ||||||||||||
Share of loss from equity-accounted investees |
1,368 | | | | 1,368 | |||||||||||||||
Other expense (income) |
(312 | ) | | 258 | (28,031 | ) | (28,085 | ) | ||||||||||||
|
|
|
|
|
|
|
|
|
|
|||||||||||
Earnings (loss) before income taxes |
209,565 | 27,056 | 12,831 | (221,167 | ) | 28,285 | ||||||||||||||
Income tax recovery |
(49,911 | ) | ||||||||||||||||||
|
|
|||||||||||||||||||
Net earnings |
$ | 78,196 | ||||||||||||||||||
|
|
For the six months ended June 30, 2014
Uranium | Fuel services | NUKEM | Other | Total | ||||||||||||||||
Revenue |
$ | 723,981 | $ | 110,447 | $ | 93,622 | $ | (6,850 | ) | $ | 921,200 | |||||||||
Expenses |
||||||||||||||||||||
Cost of products and services sold |
385,560 | 82,172 | 80,573 | (7,979 | ) | 540,326 | ||||||||||||||
Depreciation and amortization |
109,238 | 10,514 | 3,515 | 14,178 | 137,445 | |||||||||||||||
|
|
|
|
|
|
|
|
|
|
|||||||||||
Cost of sales |
494,798 | 92,686 | 84,088 | 6,199 | 677,771 | |||||||||||||||
|
|
|
|
|
|
|
|
|
|
|||||||||||
Gross profit (loss) |
229,183 | 17,761 | 9,534 | (13,049 | ) | 243,429 | ||||||||||||||
Administration |
| | 6,414 | 75,235 | 81,649 | |||||||||||||||
Exploration |
23,738 | | | | 23,738 | |||||||||||||||
Research and development |
| | | 1,693 | 1,693 | |||||||||||||||
Loss on sale of assets |
5,556 | | | | 5,556 | |||||||||||||||
Finance costs |
| | 2,091 | 57,148 | 59,239 | |||||||||||||||
Loss (gain) on derivatives |
| | 1,694 | (3,173 | ) | (1,479 | ) | |||||||||||||
Finance income |
| | (2 | ) | (3,237 | ) | (3,239 | ) | ||||||||||||
Share of loss from equity-accounted investees |
236 | 13,267 | | | 13,503 | |||||||||||||||
Other expense (income) |
(28,964 | ) | 18,035 | (1,249 | ) | (4,395 | ) | (16,573 | ) | |||||||||||
|
|
|
|
|
|
|
|
|
|
|||||||||||
Earnings (loss) before income taxes |
228,617 | (13,541 | ) | 586 | (136,320 | ) | 79,342 | |||||||||||||
Income tax recovery |
(51,067 | ) | ||||||||||||||||||
|
|
|||||||||||||||||||
Net earnings from continuing operations |
|
$ | 130,409 | |||||||||||||||||
|
|
2015 SECOND QUARTER REPORT 21
18. Related parties
The shares of Cameco are widely held and no shareholder, resident in Canada, is allowed to own more than 25% of the Companys outstanding common shares, either individually or together with associates. A non-resident of Canada is not allowed to own more than 15%.
Related party transactions
Through unsecured shareholder loans, Cameco has agreed to fund Inkais project development costs as well as further evaluation on block 3. The limits of the loan facilities are $229,650,000 (US) and advances under these facilities bear interest at a rate of LIBOR plus 2%. At June 30, 2015, $187,576,000 (US) of principal and interest was outstanding (December 31, 2014$197,551,000 (US)).
Camecos share of the outstanding principal and interest was $93,593,000 at June 30, 2015 (December 31, 2014$91,672,000) (note 6). For the quarter ended June 30, 2015, Cameco recorded interest income of $500,000 relating to this balance (2014$519,000). For the six month period ended June 30, 2015, interest income was $982,000 (2014$1,049,000).
22 CAMECO CORPORATION
Exhibit 99.4
Certification Pursuant to Section 302 of the Sarbanes-Oxley Act of 2002
I, Tim Gitzel, president and chief executive officer of Cameco Corporation, certify that:
1. | I have reviewed this quarterly report on Form 6-K of Cameco Corporation; |
2. | Based on my knowledge, this report does not contain any untrue statement of a material fact or omit to state a material fact necessary to make the statements made, in light of the circumstances under which such statements were made, not misleading with respect to the period covered by this report; |
3. | Based on my knowledge, the financial statements, and other financial information included in this report, fairly present in all material respects the financial condition, results of operations and cash flows of the registrant as of, and for, the periods presented in this report; |
4. | The registrants other certifying officer and I are responsible for establishing and maintaining disclosure controls and procedures (as defined in Exchange Act Rules 13a-15(e) and 15d-15(e)) and internal control over financial reporting (as defined in Exchange Act Rules 13a-15(f) and 15d-15(f)) for the registrant and have: |
(a) | designed such disclosure controls and procedures, or caused such disclosure controls and procedures to be designed under our supervision, to ensure that material information relating to the registrant, including its consolidated subsidiaries, is made known to us by others within those entities, particularly during the period in which this report is being prepared; |
(b) | designed such internal control over financial reporting, or caused such internal control over financial reporting to be designed under our supervision, to provide reasonable assurance regarding the reliability of financial reporting and the preparation of financial statements for external purposes in accordance with generally accepted accounting principles; |
(c) | evaluated the effectiveness of the registrants disclosure controls and procedures and presented in this report our conclusions about the effectiveness of the disclosure controls and procedures, as of the end of the period covered by this report based on such evaluation; and |
(d) | disclosed in this report any change in the registrants internal control over financial reporting that occurred during the registrants most recent fiscal quarter (the registrants fourth fiscal quarter in the case of an annual report) that has materially affected, or is reasonably likely to materially affect, the registrants internal control over financial reporting; and |
Page 2
5. | The registrants other certifying officer and I have disclosed, based on our most recent evaluation of internal control over financial reporting, to the registrants auditors and the audit committee of the registrants board of directors (or persons performing the equivalent functions): |
(a) | all significant deficiencies and material weaknesses in the design or operation of internal control over financial reporting which are reasonably likely to adversely affect the registrants ability to record, process, summarize and report financial information; and |
(b) | any fraud, whether or not material, that involves management or other employees who have a significant role in the registrants internal control over financial reporting. |
Date: July 30, 2015
Tim Gitzel | ||
Tim Gitzel | ||
President and Chief Executive Officer |
Exhibit 99.5
Certification Pursuant to Section 302 of the Sarbanes-Oxley Act of 2002
I, Grant Isaac, senior vice-president and chief financial officer, of Cameco Corporation, certify that:
1. | I have reviewed this quarterly report on Form 6-K of Cameco Corporation; |
2. | Based on my knowledge, this report does not contain any untrue statement of a material fact or omit to state a material fact necessary to make the statements made, in light of the circumstances under which such statements were made, not misleading with respect to the period covered by this report; |
3. | Based on my knowledge, the financial statements, and other financial information included in this report, fairly present in all material respects the financial condition, results of operations and cash flows of the registrant as of, and for, the periods presented in this report; |
4. | The registrants other certifying officer and I are responsible for establishing and maintaining disclosure controls and procedures (as defined in Exchange Act Rules 13a-15(e) and 15d-15(e)) and internal control over financial reporting (as defined in Exchange Act Rules 13a-15(f) and 15d-15(f)) for the registrant and have: |
(a) | designed such disclosure controls and procedures, or caused such disclosure controls and procedures to be designed under our supervision, to ensure that material information relating to the registrant, including its consolidated subsidiaries, is made known to us by others within those entities, particularly during the period in which this report is being prepared; |
(b) | designed such internal control over financial reporting, or caused such internal control over financial reporting to be designed under our supervision, to provide reasonable assurance regarding the reliability of financial reporting and the preparation of financial statements for external purposes in accordance with generally accepted accounting principles; |
(c) | evaluated the effectiveness of the registrants disclosure controls and procedures and presented in this report our conclusions about the effectiveness of the disclosure controls and procedures, as of the end of the period covered by this report based on such evaluation; and |
(d) | disclosed in this report any change in the registrants internal control over financial reporting that occurred during the registrants most recent fiscal quarter (the registrants fourth fiscal quarter in the case of an annual report) that has materially affected, or is reasonably likely to materially affect, the registrants internal control over financial reporting; and |
Page 2
5. | The registrants other certifying officer and I have disclosed, based on our most recent evaluation of internal control over financial reporting, to the registrants auditors and the audit committee of the registrants board of directors (or persons performing the equivalent functions): |
(a) | all significant deficiencies and material weaknesses in the design or operation of internal control over financial reporting which are reasonably likely to adversely affect the registrants ability to record, process, summarize and report financial information; and |
(b) | any fraud, whether or not material, that involves management or other employees who have a significant role in the registrants internal control over financial reporting. |
Date: July 30, 2015
Grant Isaac | ||
Grant Isaac | ||
Senior Vice-President and Chief Financial Officer |
D!
M\@'Z`@,"#`(4`AT")@(O`C@"00)+`E0"70)G`G$">@*$`HX"F`*B`JP"M@+!
M`LL"U0+@`NL"]0,``PL#%@,A`RT#.`-#`T\#6@-F`W(#?@.*`Y8#H@.N`[H#
MQP/3`^`#[`/Y!`8$$P0@!"T$.P1(!%4$8P1Q!'X$C`2:!*@$M@3$!-,$X03P
M!/X%#044%]@8&!A8&)P8W!D@&
M609J!GL&C`:=!J\&P`;1!N,&]0<'!QD'*P<]!T\'80=T!X8'F0>L![\'T@?E
M!_@("P@?"#((1@A:"&X(@@B6"*H(O@C2".<(^PD0"24).@E/"60)>0F/":0)
MN@G/">4)^PH1"B<*/0I4"FH*@0J8"JX*Q0K<"O,+"PLB"SD+40MI"X`+F`NP
M"\@+X0OY#!(,*@Q##%P,=0R.#*<,P`S9#/,-#0TF#4`-6@UT#8X-J0W##=X-
M^`X3#BX.20YD#G\.FPZV#M(.[@\)#R4/00]>#WH/E@^S#\\/[!`)$"800Q!A
M$'X0FQ"Y$-<0]1$3$3$13Q%M$8P1JA')$>@2!Q(F$D429!*$$J,2PQ+C$P,3
M(Q-#$V,3@Q.D$\43Y10&%"<4211J%(L4K13.%/`5$A4T%585>!6;%;T5X!8#
M%B86219L%H\6LA;6%OH7'1=!%V47B1>N%](7]Q@;&$`891B*&*\8U1CZ&2`9
M11EK&9$9MQG=&@0:*AI1&G<:GAK%&NP;%!L[&V,;BANR&]H<`APJ'%(<>QRC
M',P<]1T>'4<=:AZ4'KX>Z1\3'SX?:1^4'[\?ZB`5($$@
M;""8(,0@\"$<(4@A=2&A( &YXS'DJ>8EYYWI&
M>J5[!'MC>\)\(7R!?.%]07VA?@%^8G["?R-_A'_E@$>`J($*@6N!S8(P@I*"
M](-7@[J$'82`A..%1X6KA@Z&
D!
M\@'Z`@,"#`(4`AT")@(O`C@"00)+`E0"70)G`G$">@*$`HX"F`*B`JP"M@+!
M`LL"U0+@`NL"]0,``PL#%@,A`RT#.`-#`T\#6@-F`W(#?@.*`Y8#H@.N`[H#
MQP/3`^`#[`/Y!`8$$P0@!"T$.P1(!%4$8P1Q!'X$C`2:!*@$M@3$!-,$X03P
M!/X%#044%]@8&!A8&)P8W!D@&
M609J!GL&C`:=!J\&P`;1!N,&]0<'!QD'*P<]!T\'80=T!X8'F0>L![\'T@?E
M!_@("P@?"#((1@A:"&X(@@B6"*H(O@C2".<(^PD0"24).@E/"60)>0F/":0)
MN@G/">4)^PH1"B<*/0I4"FH*@0J8"JX*Q0K<"O,+"PLB"SD+40MI"X`+F`NP
M"\@+X0OY#!(,*@Q##%P,=0R.#*<,P`S9#/,-#0TF#4`-6@UT#8X-J0W##=X-
M^`X3#BX.20YD#G\.FPZV#M(.[@\)#R4/00]>#WH/E@^S#\\/[!`)$"800Q!A
M$'X0FQ"Y$-<0]1$3$3$13Q%M$8P1JA')$>@2!Q(F$D429!*$$J,2PQ+C$P,3
M(Q-#$V,3@Q.D$\43Y10&%"<4211J%(L4K13.%/`5$A4T%585>!6;%;T5X!8#
M%B86219L%H\6LA;6%OH7'1=!%V47B1>N%](7]Q@;&$`891B*&*\8U1CZ&2`9
M11EK&9$9MQG=&@0:*AI1&G<:GAK%&NP;%!L[&V,;BANR&]H<`APJ'%(<>QRC
M',P<]1T>'4<=:AZ4'KX>Z1\3'SX?:1^4'[\?ZB`5($$@
M;""8(,0@\"$<(4@A=2&A( &YXS'DJ>8EYYWI&
M>J5[!'MC>\)\(7R!?.%]07VA?@%^8G["?R-_A'_E@$>`J($*@6N!S8(P@I*"
M](-7@[J$'82`A..%1X6KA@Z& 1=WX5F_'MO*'@Z75[/Q-JO@TSW,>HZ?X2UL:??3W)16MR<30R2QJJ7!
M9(Y`0=K$%5..O^";WTO[.^D7%S->S6$\T\NC#4M2COKM+!I6-LLL\;,KL(]O
M\;$#`+,P)H`]8HHKSP_%CX :`/+O`WPT^%_P[A8?#OXK&B?!SPCH/Q/C\76KWMSK(;S99;N5)6
MGG\@0&=Y"GF%S&`"-^SOM!H7F)D5G\7]&O\`4=5BMM,O)+:TT2]U>&YRFVZ@
MM9S`Q49R"SJVW.,@`\9KE8/VAM#N+S5$A\/WLGV#2S?SVJW4`ORGV1+K>EJ7
M$DD1614$J!EW>@YK=M_@MI":"-/DUG4+..&&]L(9=-D6%Y-.NIC,UI+N5@0I
M)`==K`=""35J^^"GA#4;VU-Q=:L+"RE:;2[&._*QZ;*T!@\RWD`\V+"DX02;
M,DG;4KFMK_7]?F6^6^G]?U^1SUC\?M)NOA3X>\42^'KGR]4/$5GJ%O=)&AF2
M%)/-1]K*S2>Q&U@0"*WK7XU^%+_X&R^.+"&]N(88[![G3I+=H+J$7C1K$2L@
M7*GS00XRK!3@G%9V@_`#P7HG@B]T=[G4M1DOKN"[O[V6=$EGEA?>K810J@G&
MX*HS@9YYK:TSX-^%M/\`AWJ_ANXO-5UFWU"SM;.6[U"]#W,<-JH%LJ.JJ%\L
MC>#@DL2235:V9.EUV.PT?Q5:ZS\0O%_AV&UFAN?#\]O%<2N1LF,T"S*4P<\!
M@#G'-#=7\.>,]#N?"UYKNI:IJFOQ7/B'4YYX3'/`B)&PG`51Q$@5`JX^
M\3\Q!JQKOPOM;'PYJE_X;N-3FOK-KS4]`T8W2?9+349DD_?1*RY#;I)"%9BB
MF1B`.,'G_73^D&C=D>C:MXBM=&\4^'=-O8I%36;E[6WN1CRTG6-I%C;OEE23
M!Z97'<5T%>/^%_#/B/7/`_P\NO&MS.E_HE]/?S6]R`TT\O[V*W+L#QMCD+$'
M))VY.0<^P4Q!1110`4444`%%%%`!1110`4444`%%%%`!1110`4444`%%%%`!
M1110`4444`%%%%`!1110`4444`%%%%`!1110`4444`%%%%`!1110`4444`%%
M%%`!1110`4444`%%%%`!1110`4444`%%%%`!1110`4444`%%%%`!1110`444
44`%%%%`!1110`4444`%%%%`'_]D_
`
end
D!
M\@'Z`@,"#`(4`AT")@(O`C@"00)+`E0"70)G`G$">@*$`HX"F`*B`JP"M@+!
M`LL"U0+@`NL"]0,``PL#%@,A`RT#.`-#`T\#6@-F`W(#?@.*`Y8#H@.N`[H#
MQP/3`^`#[`/Y!`8$$P0@!"T$.P1(!%4$8P1Q!'X$C`2:!*@$M@3$!-,$X03P
M!/X%#044%]@8&!A8&)P8W!D@&
M609J!GL&C`:=!J\&P`;1!N,&]0<'!QD'*P<]!T\'80=T!X8'F0>L![\'T@?E
M!_@("P@?"#((1@A:"&X(@@B6"*H(O@C2".<(^PD0"24).@E/"60)>0F/":0)
MN@G/">4)^PH1"B<*/0I4"FH*@0J8"JX*Q0K<"O,+"PLB"SD+40MI"X`+F`NP
M"\@+X0OY#!(,*@Q##%P,=0R.#*<,P`S9#/,-#0TF#4`-6@UT#8X-J0W##=X-
M^`X3#BX.20YD#G\.FPZV#M(.[@\)#R4/00]>#WH/E@^S#\\/[!`)$"800Q!A
M$'X0FQ"Y$-<0]1$3$3$13Q%M$8P1JA')$>@2!Q(F$D429!*$$J,2PQ+C$P,3
M(Q-#$V,3@Q.D$\43Y10&%"<4211J%(L4K13.%/`5$A4T%585>!6;%;T5X!8#
M%B86219L%H\6LA;6%OH7'1=!%V47B1>N%](7]Q@;&$`891B*&*\8U1CZ&2`9
M11EK&9$9MQG=&@0:*AI1&G<:GAK%&NP;%!L[&V,;BANR&]H<`APJ'%(<>QRC
M',P<]1T>'4<=:AZ4'KX>Z1\3'SX?:1^4'[\?ZB`5($$@
M;""8(,0@\"$<(4@A=2&A( &YXS'DJ>8EYYWI&
M>J5[!'MC>\)\(7R!?.%]07VA?@%^8G["?R-_A'_E@$>`J($*@6N!S8(P@I*"
M](-7@[J$'82`A..%1X6KA@Z& GVC)X5^+D(NC,
MB_)!J<**EQ&3V+J(Y1Z[G]*^_?V*/$'A/_@OC_P16F^%GB348(/'GA*RAT>\
MN'&Z;3-0ME_T'4`O4I(BC<>^95ZTBGT9RG_!IK\?M(^(W[&GC_X175Q&NK>&
M=8EU'[/NQ)-97L:J74=PLB.I/;']/6!"+73;*.TA!VCG9&H7]*B^+OPX\/?$[P?-I_B70=&\0V".DJVV
MIV45W"'!&&"2*1GWQ0"9^+W_``?MY>`/VN?V?/A%KOPT_MKQ+X"\*>-X9[
M_P`61:5/;:,LGDDK;0R2JAEDVJY.Q2J[0"
D!
M\@'Z`@,"#`(4`AT")@(O`C@"00)+`E0"70)G`G$">@*$`HX"F`*B`JP"M@+!
M`LL"U0+@`NL"]0,``PL#%@,A`RT#.`-#`T\#6@-F`W(#?@.*`Y8#H@.N`[H#
MQP/3`^`#[`/Y!`8$$P0@!"T$.P1(!%4$8P1Q!'X$C`2:!*@$M@3$!-,$X03P
M!/X%#044%]@8&!A8&)P8W!D@&
M609J!GL&C`:=!J\&P`;1!N,&]0<'!QD'*P<]!T\'80=T!X8'F0>L![\'T@?E
M!_@("P@?"#((1@A:"&X(@@B6"*H(O@C2".<(^PD0"24).@E/"60)>0F/":0)
MN@G/">4)^PH1"B<*/0I4"FH*@0J8"JX*Q0K<"O,+"PLB"SD+40MI"X`+F`NP
M"\@+X0OY#!(,*@Q##%P,=0R.#*<,P`S9#/,-#0TF#4`-6@UT#8X-J0W##=X-
M^`X3#BX.20YD#G\.FPZV#M(.[@\)#R4/00]>#WH/E@^S#\\/[!`)$"800Q!A
M$'X0FQ"Y$-<0]1$3$3$13Q%M$8P1JA')$>@2!Q(F$D429!*$$J,2PQ+C$P,3
M(Q-#$V,3@Q.D$\43Y10&%"<4211J%(L4K13.%/`5$A4T%585>!6;%;T5X!8#
M%B86219L%H\6LA;6%OH7'1=!%V47B1>N%](7]Q@;&$`891B*&*\8U1CZ&2`9
M11EK&9$9MQG=&@0:*AI1&G<:GAK%&NP;%!L[&V,;BANR&]H<`APJ'%(<>QRC
M',P<]1T>'4<=:AZ4'KX>Z1\3'SX?:1^4'[\?ZB`5($$@
M;""8(,0@\"$<(4@A=2&A( &YXS'DJ>8EYYWI&
M>J5[!'MC>\)\(7R!?.%]07VA?@%^8G["?R-_A'_E@$>`J($*@6N!S8(P@I*"
M](-7@[J$'82`A..%1X6KA@Z&