0000921082000094171312/3112/3120212021FYFYFALSEFALSE768,007736,900735,979323,310357,914141,683323,310357,914141,683310,791344,914134,4302.983.321.302.983.321.305,695,1385,209,4172,788,9152,470,021768,007736,900735,979323,310357,914141,683323,310357,914141,683319,112354,2522.993.331.302.993.331.302,788,9152,470,021P5YP3YP3YP1MP3Mhttp://fasb.org/us-gaap/2021-01-31#AccountsPayableAndAccruedLiabilitiesCurrentAndNoncurrenthttp://fasb.org/us-gaap/2021-01-31#PrepaidExpenseAndOtherAssetshttp://fasb.org/us-gaap/2021-01-31#AccountsPayableAndAccruedLiabilitiesCurrentAndNoncurrenthttp://fasb.org/us-gaap/2021-01-31#PrepaidExpenseAndOtherAssetshttp://fasb.org/us-gaap/2021-01-31#PrepaidExpenseAndOtherAssetsP6MP6MP6MP7YP1MP1MP3YP1YP3MP5D54054054054054054054054054054054054054054054054054054054054054054054054054054054054054054054054054054054054054054054054054054054054054054054054054054054054054054054054054054054054054054054054054054054054054054054054054054054054054054054054054054054054054054054054054054054054054054054054054054054054054054054054054054054054054054054054054054054054054054054054054054054054054054054054054054054054054054054054054054054054054054054054054054054054054054054054054054054054054054054054054054054054054054054054054054054054054054000009210822021-01-012021-12-310000921082srt:SubsidiariesMember2021-01-012021-12-3100009210822021-06-30iso4217:USD00009210822022-01-28xbrli:shares00009210822020-01-012020-12-3100009210822019-01-012019-12-310000921082srt:ParentCompanyMember2021-01-012021-12-310000921082srt:ParentCompanyMember2020-01-012020-12-310000921082srt:ParentCompanyMember2019-01-012019-12-31iso4217:USDxbrli:shares00009210822021-12-3100009210822020-12-310000921082srt:SubsidiariesMember2020-01-012020-12-310000921082srt:SubsidiariesMember2019-01-012019-12-310000921082srt:SubsidiariesMember2021-12-310000921082srt:SubsidiariesMember2020-12-310000921082us-gaap:CommonStockMember2018-12-310000921082hiw:SeriesCumulativeRedeemablePreferredSharesMember2018-12-310000921082us-gaap:AdditionalPaidInCapitalMember2018-12-310000921082us-gaap:AccumulatedOtherComprehensiveIncomeMember2018-12-310000921082us-gaap:NoncontrollingInterestMember2018-12-310000921082hiw:DistributionsInExcessOfNetIncomeAvailableForCommonStockholdersMember2018-12-3100009210822018-12-310000921082us-gaap:CommonStockMember2019-01-012019-12-310000921082hiw:SeriesCumulativeRedeemablePreferredSharesMember2019-01-012019-12-310000921082us-gaap:AdditionalPaidInCapitalMember2019-01-012019-12-310000921082us-gaap:AccumulatedOtherComprehensiveIncomeMember2019-01-012019-12-310000921082us-gaap:NoncontrollingInterestMember2019-01-012019-12-310000921082hiw:DistributionsInExcessOfNetIncomeAvailableForCommonStockholdersMember2019-01-012019-12-310000921082srt:ParentCompanyMemberhiw:SeriesCumulativeRedeemablePreferredSharesMember2019-01-012019-12-310000921082us-gaap:CommonStockMember2019-12-310000921082hiw:SeriesCumulativeRedeemablePreferredSharesMember2019-12-310000921082us-gaap:AdditionalPaidInCapitalMember2019-12-310000921082us-gaap:AccumulatedOtherComprehensiveIncomeMember2019-12-310000921082us-gaap:NoncontrollingInterestMember2019-12-310000921082hiw:DistributionsInExcessOfNetIncomeAvailableForCommonStockholdersMember2019-12-3100009210822019-12-310000921082us-gaap:CommonStockMember2020-01-012020-12-310000921082hiw:SeriesCumulativeRedeemablePreferredSharesMember2020-01-012020-12-310000921082us-gaap:AdditionalPaidInCapitalMember2020-01-012020-12-310000921082us-gaap:AccumulatedOtherComprehensiveIncomeMember2020-01-012020-12-310000921082us-gaap:NoncontrollingInterestMember2020-01-012020-12-310000921082hiw:DistributionsInExcessOfNetIncomeAvailableForCommonStockholdersMember2020-01-012020-12-310000921082srt:ParentCompanyMemberhiw:SeriesCumulativeRedeemablePreferredSharesMember2020-01-012020-12-310000921082us-gaap:CommonStockMember2020-12-310000921082hiw:SeriesCumulativeRedeemablePreferredSharesMember2020-12-310000921082us-gaap:AdditionalPaidInCapitalMember2020-12-310000921082us-gaap:AccumulatedOtherComprehensiveIncomeMember2020-12-310000921082us-gaap:NoncontrollingInterestMember2020-12-310000921082hiw:DistributionsInExcessOfNetIncomeAvailableForCommonStockholdersMember2020-12-310000921082us-gaap:CommonStockMember2021-01-012021-12-310000921082hiw:SeriesCumulativeRedeemablePreferredSharesMember2021-01-012021-12-310000921082us-gaap:AdditionalPaidInCapitalMember2021-01-012021-12-310000921082us-gaap:AccumulatedOtherComprehensiveIncomeMember2021-01-012021-12-310000921082us-gaap:NoncontrollingInterestMember2021-01-012021-12-310000921082hiw:DistributionsInExcessOfNetIncomeAvailableForCommonStockholdersMember2021-01-012021-12-310000921082srt:ParentCompanyMemberhiw:SeriesCumulativeRedeemablePreferredSharesMember2021-01-012021-12-310000921082us-gaap:CommonStockMember2021-12-310000921082hiw:SeriesCumulativeRedeemablePreferredSharesMember2021-12-310000921082us-gaap:AdditionalPaidInCapitalMember2021-12-310000921082us-gaap:AccumulatedOtherComprehensiveIncomeMember2021-12-310000921082us-gaap:NoncontrollingInterestMember2021-12-310000921082hiw:DistributionsInExcessOfNetIncomeAvailableForCommonStockholdersMember2021-12-310000921082hiw:GeneralPartnerCommonUnitsMembersrt:SubsidiariesMember2018-12-310000921082hiw:LimitedPartnerCommonUnitsMembersrt:SubsidiariesMember2018-12-310000921082srt:SubsidiariesMemberus-gaap:AccumulatedOtherComprehensiveIncomeMember2018-12-310000921082srt:SubsidiariesMemberus-gaap:NoncontrollingInterestMember2018-12-310000921082srt:SubsidiariesMember2018-12-310000921082hiw:GeneralPartnerCommonUnitsMembersrt:SubsidiariesMember2019-01-012019-12-310000921082hiw:LimitedPartnerCommonUnitsMembersrt:SubsidiariesMember2019-01-012019-12-310000921082srt:SubsidiariesMemberus-gaap:AccumulatedOtherComprehensiveIncomeMember2019-01-012019-12-310000921082srt:SubsidiariesMemberus-gaap:NoncontrollingInterestMember2019-01-012019-12-310000921082hiw:SeriesCumulativeRedeemablePreferredSharesMembersrt:SubsidiariesMember2019-01-012019-12-310000921082hiw:GeneralPartnerCommonUnitsMembersrt:SubsidiariesMember2019-12-310000921082hiw:LimitedPartnerCommonUnitsMembersrt:SubsidiariesMember2019-12-310000921082srt:SubsidiariesMemberus-gaap:AccumulatedOtherComprehensiveIncomeMember2019-12-310000921082srt:SubsidiariesMemberus-gaap:NoncontrollingInterestMember2019-12-310000921082srt:SubsidiariesMember2019-12-310000921082hiw:GeneralPartnerCommonUnitsMembersrt:SubsidiariesMember2020-01-012020-12-310000921082hiw:LimitedPartnerCommonUnitsMembersrt:SubsidiariesMember2020-01-012020-12-310000921082srt:SubsidiariesMemberus-gaap:AccumulatedOtherComprehensiveIncomeMember2020-01-012020-12-310000921082srt:SubsidiariesMemberus-gaap:NoncontrollingInterestMember2020-01-012020-12-310000921082hiw:SeriesCumulativeRedeemablePreferredSharesMembersrt:SubsidiariesMember2020-01-012020-12-310000921082hiw:GeneralPartnerCommonUnitsMembersrt:SubsidiariesMember2020-12-310000921082hiw:LimitedPartnerCommonUnitsMembersrt:SubsidiariesMember2020-12-310000921082srt:SubsidiariesMemberus-gaap:AccumulatedOtherComprehensiveIncomeMember2020-12-310000921082srt:SubsidiariesMemberus-gaap:NoncontrollingInterestMember2020-12-310000921082hiw:GeneralPartnerCommonUnitsMembersrt:SubsidiariesMember2021-01-012021-12-310000921082hiw:LimitedPartnerCommonUnitsMembersrt:SubsidiariesMember2021-01-012021-12-310000921082srt:SubsidiariesMemberus-gaap:AccumulatedOtherComprehensiveIncomeMember2021-01-012021-12-310000921082srt:SubsidiariesMemberus-gaap:NoncontrollingInterestMember2021-01-012021-12-310000921082hiw:SeriesCumulativeRedeemablePreferredSharesMembersrt:SubsidiariesMember2021-01-012021-12-310000921082hiw:GeneralPartnerCommonUnitsMembersrt:SubsidiariesMember2021-12-310000921082hiw:LimitedPartnerCommonUnitsMembersrt:SubsidiariesMember2021-12-310000921082srt:SubsidiariesMemberus-gaap:AccumulatedOtherComprehensiveIncomeMember2021-12-310000921082srt:SubsidiariesMemberus-gaap:NoncontrollingInterestMember2021-12-31utr:sqft0000921082srt:ParentCompanyMember2021-12-31xbrli:purehiw:numberOfBuildings0000921082us-gaap:BuildingMember2021-01-012021-12-310000921082us-gaap:BuildingImprovementsMember2021-01-012021-12-310000921082us-gaap:FurnitureAndFixturesMembersrt:MinimumMember2021-01-012021-12-310000921082srt:MaximumMemberus-gaap:FurnitureAndFixturesMember2021-01-012021-12-310000921082us-gaap:LeaseholdsAndLeaseholdImprovementsMembersrt:MinimumMember2021-01-012021-12-310000921082srt:MaximumMemberus-gaap:LeaseholdsAndLeaseholdImprovementsMember2021-01-012021-12-310000921082srt:MinimumMember2021-12-310000921082srt:MaximumMember2021-12-31hiw:customers0000921082srt:MinimumMember2021-01-012021-12-310000921082srt:MaximumMember2021-01-012021-12-310000921082hiw:A150FayettevilleAssetMember2021-12-310000921082hiw:CAPTRUSTTowersAssetMember2021-12-310000921082hiw:CapitolTowersAssetMember2021-12-310000921082hiw:MorrocroftCentreAssetMember2021-12-310000921082hiw:PACPortfolioAcquisitionMember2021-01-012021-12-310000921082hiw:PACPortfolioAcquisitionMember2021-12-31hiw:numberOfLoans0000921082hiw:PACPortfolioAcquisitionMember2021-12-310000921082hiw:NashvilleTNLandAcquisitionsMember2021-01-012021-12-310000921082hiw:NashvilleTNLandAcquisitionsMember2021-04-012021-06-300000921082hiw:NashvilleTNLandAcquisitionsMember2021-06-30hiw:parcel0000921082hiw:ForumBuildingsAcquisitionMember2021-12-31hiw:numberOfOfficeBuildings0000921082hiw:ForumBuildingsAcquisitionMember2021-01-012021-12-310000921082hiw:A2020LandAcquisitionsMember2020-12-31utr:acre0000921082hiw:A2020LandAcquisitionsMember2020-01-012020-12-310000921082hiw:SubmarketAcquisitionMember2019-12-310000921082hiw:SubmarketAcquisitionMember2019-01-012019-12-310000921082hiw:A2019LandAcquisitionsMember2019-12-310000921082hiw:A2019LandAcquisitionsMember2019-01-012019-12-310000921082hiw:A2021DispositionsMember2021-12-310000921082hiw:A2021DispositionsMember2021-01-012021-12-310000921082hiw:A2020DispositionsMember2020-12-310000921082hiw:A2020DispositionsMember2020-01-012020-12-310000921082hiw:A2016LandDispositionMember2020-01-012020-12-310000921082hiw:A2019DispositionsMember2019-12-310000921082hiw:A2019DispositionsMember2019-01-012019-12-310000921082hiw:A2020ImpairmentsMember2020-01-012020-12-310000921082hiw:A2019ImpairmentsMember2019-01-012019-12-310000921082hiw:PlazaColonnadeTenantinCommonMember2021-12-310000921082hiw:BrandHRLP2827PeachtreeLLCMember2021-12-310000921082hiw:KessingerHunterCompanyLCMember2021-12-310000921082hiw:BrandHRLP2827PeachtreeLLCMember2021-01-012021-12-310000921082us-gaap:LondonInterbankOfferedRateLIBORMemberhiw:BrandHRLP2827PeachtreeLLCMember2021-01-012021-12-310000921082us-gaap:VariableInterestEntityPrimaryBeneficiaryMember2019-12-310000921082hiw:OwnershipPercentageMemberus-gaap:VariableInterestEntityPrimaryBeneficiaryMember2019-12-310000921082us-gaap:LondonInterbankOfferedRateLIBORMemberus-gaap:VariableInterestEntityPrimaryBeneficiaryMember2019-01-012019-12-310000921082us-gaap:VariableInterestEntityPrimaryBeneficiaryMember2019-01-012019-12-310000921082us-gaap:VariableInterestEntityPrimaryBeneficiaryMember2021-12-310000921082us-gaap:VariableInterestEntityPrimaryBeneficiaryMember2020-12-310000921082hiw:HighwoodsMarkelAssociatesLlcJointVentureMember2021-12-310000921082hiw:HighwoodsMarkelAssociatesLlcJointVentureMember2021-01-012021-12-310000921082hiw:DeferredLeasingCostsAndAcquisitionRelatedIntangibleAssetsMember2021-01-012021-12-310000921082hiw:DeferredLeasingCostsAndAcquisitionRelatedIntangibleAssetsMember2020-01-012020-12-310000921082hiw:DeferredLeasingCostsAndAcquisitionRelatedIntangibleAssetsMember2019-01-012019-12-310000921082hiw:LeaseIncentivesMember2021-01-012021-12-310000921082hiw:LeaseIncentivesMember2020-01-012020-12-310000921082hiw:LeaseIncentivesMember2019-01-012019-12-310000921082us-gaap:AboveMarketLeasesMember2021-01-012021-12-310000921082us-gaap:AboveMarketLeasesMember2020-01-012020-12-310000921082us-gaap:AboveMarketLeasesMember2019-01-012019-12-310000921082hiw:TaxAbatementAssetsMember2021-01-012021-12-310000921082hiw:TaxAbatementAssetsMember2020-01-012020-12-310000921082hiw:TaxAbatementAssetsMember2019-01-012019-12-310000921082hiw:BelowMarketLeaseMember2021-01-012021-12-310000921082hiw:BelowMarketLeaseMember2020-01-012020-12-310000921082hiw:BelowMarketLeaseMember2019-01-012019-12-310000921082hiw:DeferredLeasingCostsAndAcquisitionRelatedIntangibleAssetsMember2021-12-310000921082hiw:LeaseIncentivesMember2021-12-310000921082us-gaap:AboveMarketLeasesMember2021-12-310000921082hiw:BelowMarketLeaseMember2021-12-310000921082us-gaap:SecuredDebtMemberhiw:A427361EffectiveRateMortgageLoanDue2028Member2021-12-310000921082us-gaap:SecuredDebtMemberhiw:A427361EffectiveRateMortgageLoanDue2028Member2020-12-310000921082us-gaap:SecuredDebtMemberhiw:A4.0MortgageLoanDue2029Member2021-12-310000921082us-gaap:SecuredDebtMemberhiw:A4.0MortgageLoanDue2029Member2020-12-310000921082us-gaap:SecuredDebtMemberhiw:A361319EffectiveRateMortgageLoanDue2029Member2021-12-310000921082us-gaap:SecuredDebtMemberhiw:A361319EffectiveRateMortgageLoanDue2029Member2020-12-310000921082us-gaap:SecuredDebtMemberhiw:A340350EffectiveRateMortgageLoanDue2033Member2021-12-310000921082us-gaap:SecuredDebtMemberhiw:A340350EffectiveRateMortgageLoanDue2033Member2020-12-310000921082us-gaap:SecuredDebtMemberhiw:A460373EffectiveRateMortgageLoanDue2037Member2021-12-310000921082us-gaap:SecuredDebtMemberhiw:A460373EffectiveRateMortgageLoanDue2037Member2020-12-310000921082us-gaap:SecuredDebtMember2021-12-310000921082us-gaap:SecuredDebtMember2020-12-310000921082us-gaap:UnsecuredDebtMemberhiw:A3.203.363effectiverateNotesdue2021Member2021-12-310000921082us-gaap:UnsecuredDebtMemberhiw:A3.203.363effectiverateNotesdue2021Member2020-12-310000921082hiw:A36253752EffectiveRateNotesDue2023Memberus-gaap:UnsecuredDebtMember2021-12-310000921082hiw:A36253752EffectiveRateNotesDue2023Memberus-gaap:UnsecuredDebtMember2020-12-310000921082hiw:A3.8754.038effectiverateNotesdue2027Memberus-gaap:UnsecuredDebtMember2021-12-310000921082hiw:A3.8754.038effectiverateNotesdue2027Memberus-gaap:UnsecuredDebtMember2020-12-310000921082hiw:A4.1254.271effectiverateNotesdue2028Memberus-gaap:UnsecuredDebtMember2021-12-310000921082hiw:A4.1254.271effectiverateNotesdue2028Memberus-gaap:UnsecuredDebtMember2020-12-310000921082hiw:A4.204.234effectiverateNotesdue2029Memberus-gaap:UnsecuredDebtMember2021-12-310000921082hiw:A4.204.234effectiverateNotesdue2029Memberus-gaap:UnsecuredDebtMember2020-12-310000921082us-gaap:UnsecuredDebtMemberhiw:A3.0503.079effectiverateNotesdue2030Member2021-12-310000921082us-gaap:UnsecuredDebtMemberhiw:A3.0503.079effectiverateNotesdue2030Member2020-12-310000921082hiw:A26002645EffectiveRateNotesDue2031Memberus-gaap:UnsecuredDebtMember2021-12-310000921082hiw:A26002645EffectiveRateNotesDue2031Memberus-gaap:UnsecuredDebtMember2020-12-310000921082hiw:VariableRateTermLoan2due2022Memberus-gaap:UnsecuredDebtMember2021-12-310000921082hiw:VariableRateTermLoan2due2022Memberus-gaap:UnsecuredDebtMember2020-12-310000921082us-gaap:LineOfCreditMemberus-gaap:UnsecuredDebtMember2021-12-310000921082us-gaap:LineOfCreditMemberus-gaap:UnsecuredDebtMember2020-12-310000921082us-gaap:UnsecuredDebtMember2021-12-310000921082us-gaap:UnsecuredDebtMember2020-12-310000921082us-gaap:LineOfCreditMember2021-12-310000921082us-gaap:LineOfCreditMember2020-12-310000921082us-gaap:LineOfCreditMember2021-01-012021-12-31hiw:extension0000921082us-gaap:LineOfCreditMemberus-gaap:LondonInterbankOfferedRateLIBORMember2021-01-012021-12-310000921082us-gaap:LineOfCreditMemberus-gaap:SubsequentEventMember2022-01-280000921082hiw:PACPortfolioAcquisitionMember2021-12-310000921082hiw:PACPortfolioAcquisitionMember2020-12-310000921082hiw:PACPortfolioAcquisitionMember2021-01-012021-12-310000921082hiw:UnsecuredBridgeFacilityDue2022Member2021-12-310000921082hiw:UnsecuredBridgeFacilityDue2022Member2021-01-012021-12-310000921082us-gaap:LondonInterbankOfferedRateLIBORMemberhiw:UnsecuredBridgeFacilityDue2022Member2021-01-012021-12-310000921082hiw:A3.203.363effectiverateNotesdue2021Member2021-12-310000921082hiw:A3.203.363effectiverateNotesdue2021Member2020-12-310000921082hiw:A3.203.363effectiverateNotesdue2021Member2021-01-012021-12-310000921082hiw:A26002645EffectiveRateNotesDue2031Member2020-12-310000921082hiw:A3.203.363effectiverateNotesdue2021Member2020-01-012020-12-310000921082hiw:VariableRateTermLoandue2022Member2020-01-012020-12-310000921082hiw:VariableRateTermLoandue2022Memberus-gaap:LondonInterbankOfferedRateLIBORMember2020-01-012020-12-310000921082hiw:A3.0503.079effectiverateNotesdue2030Member2019-12-310000921082hiw:A4.204.234effectiverateNotesdue2029Member2019-12-310000921082hiw:VariableRateTermLoandue2020Member2019-01-012019-12-310000921082us-gaap:LondonInterbankOfferedRateLIBORMemberhiw:VariableRateTermLoandue2020Member2019-01-012019-12-310000921082hiw:VariableRateTermLoandue2022Member2019-01-012019-12-310000921082hiw:VariableRateTermLoandue2022Member2019-12-310000921082hiw:A36253752EffectiveRateNotesDue2023Member2021-12-310000921082hiw:ForwardStartingSwapsMember2019-12-310000921082hiw:ForwardStartingSwapsMember2019-01-012019-12-310000921082hiw:ForwardStartingSwapsMember2019-07-012019-09-300000921082hiw:ForwardStartingSwapsMember2018-12-310000921082hiw:ForwardStartingSwapsMember2018-01-012018-12-310000921082hiw:ForwardStartingSwapsMember2019-01-012019-03-310000921082hiw:FloatingtoFixedInterestRateSwaps2017Member2017-12-310000921082hiw:FloatingtoFixedInterestRateSwaps2017Member2017-01-012017-12-310000921082hiw:FloatingtoFixedInterestRateSwapsMember2019-12-310000921082hiw:FloatingtoFixedInterestRateSwapsMember2019-01-012019-12-310000921082hiw:AssetAcquisitionContingentConsiderationMember2020-12-310000921082hiw:AssetAcquisitionContingentConsiderationMember2021-12-310000921082hiw:OwnershipPercentageMember2021-12-310000921082hiw:OwnershipPercentageMemberus-gaap:VariableInterestEntityPrimaryBeneficiaryMember2021-12-310000921082srt:ParentCompanyMember2020-12-310000921082srt:ParentCompanyMember2019-12-310000921082us-gaap:FairValueInputsLevel1Member2021-12-310000921082us-gaap:FairValueInputsLevel2Member2021-12-310000921082us-gaap:FairValueInputsLevel1Membersrt:ParentCompanyMember2021-12-310000921082us-gaap:FairValueInputsLevel2Membersrt:ParentCompanyMember2021-12-310000921082us-gaap:FairValueInputsLevel1Member2020-12-310000921082us-gaap:FairValueInputsLevel2Member2020-12-310000921082us-gaap:FairValueInputsLevel1Membersrt:ParentCompanyMember2020-12-310000921082us-gaap:FairValueInputsLevel2Membersrt:ParentCompanyMember2020-12-310000921082us-gaap:FairValueInputsLevel3Member2020-06-300000921082srt:MaximumMembersrt:ParentCompanyMemberhiw:ATMEquityOfferingMember2020-01-012020-12-310000921082srt:MaximumMembersrt:ParentCompanyMemberhiw:ATMEquityOfferingMember2021-01-012021-12-310000921082srt:ParentCompanyMemberhiw:ATMEquityOfferingMember2021-01-012021-12-310000921082us-gaap:CommonStockMember2021-01-012021-12-310000921082hiw:SeriesCumulativeRedeemablePreferredSharesMember2021-01-012021-12-310000921082hiw:SeriesCumulativeRedeemablePreferredSharesMember2021-12-310000921082hiw:SeriesCumulativeRedeemablePreferredSharesMember2020-01-012020-12-310000921082hiw:SeriesCumulativeRedeemablePreferredSharesMember2020-12-310000921082us-gaap:PreferredStockMember2021-01-012021-12-310000921082hiw:SeriesCumulativeRedeemablePreferredSharesMember2019-01-012019-12-310000921082hiw:SeriesCumulativeRedeemablePreferredSharesMembersrt:SubsidiariesMember2021-12-310000921082hiw:SeriesCumulativeRedeemablePreferredSharesMembersrt:SubsidiariesMember2020-12-310000921082hiw:A2014to2017StockOptionsMember2021-01-012021-12-310000921082us-gaap:EmployeeStockOptionMember2018-12-310000921082us-gaap:EmployeeStockOptionMember2019-01-012019-12-310000921082us-gaap:EmployeeStockOptionMember2019-12-310000921082us-gaap:EmployeeStockOptionMember2020-01-012020-12-310000921082us-gaap:EmployeeStockOptionMember2020-12-310000921082us-gaap:EmployeeStockOptionMember2021-01-012021-12-310000921082us-gaap:EmployeeStockOptionMember2021-12-310000921082hiw:TimeBasedRestrictedStockMember2021-01-012021-12-310000921082hiw:TimeBasedRestrictedStockMember2018-12-310000921082hiw:TimeBasedRestrictedStockMember2019-01-012019-12-310000921082hiw:TimeBasedRestrictedStockMember2019-12-310000921082hiw:TimeBasedRestrictedStockMember2020-01-012020-12-310000921082hiw:TimeBasedRestrictedStockMember2020-12-310000921082hiw:TimeBasedRestrictedStockMember2021-12-310000921082hiw:TotalReturnBasedAndPerformanceBasedRestrictedStockMember2021-01-012021-12-310000921082hiw:TotalReturnBasedAndPerformanceBasedRestrictedStockMembersrt:MinimumMember2021-12-310000921082hiw:TotalReturnBasedAndPerformanceBasedRestrictedStockMembersrt:MaximumMember2021-12-310000921082hiw:TotalReturnBasedAndPerformanceBasedRestrictedStockMember2021-12-310000921082hiw:TotalReturnBasedAndPerformanceBasedRestrictedStockMember2020-12-310000921082hiw:TotalReturnBasedRestrictedStockCurrentYearIssuanceMember2021-01-012021-12-310000921082hiw:TotalReturnBasedRestrictedStockCurrentYearIssuanceMember2020-01-012020-12-310000921082hiw:TotalReturnBasedRestrictedStockCurrentYearIssuanceMember2019-01-012019-12-310000921082hiw:TotalReturnBasedAndPerformanceBasedRestrictedStockMember2020-01-012020-12-310000921082hiw:TotalReturnBasedAndPerformanceBasedRestrictedStockMember2019-01-012019-12-310000921082hiw:TotalReturnBasedAndPerformanceBasedRestrictedStockMember2018-12-310000921082hiw:TotalReturnBasedAndPerformanceBasedRestrictedStockMember2019-12-310000921082hiw:A2017PlanMember2021-01-012021-12-310000921082hiw:A2016PlanMember2020-01-012020-12-310000921082hiw:A2015PlanMember2019-01-012019-12-310000921082us-gaap:AccumulatedNetGainLossFromDesignatedOrQualifyingCashFlowHedgesMember2020-12-310000921082us-gaap:AccumulatedNetGainLossFromDesignatedOrQualifyingCashFlowHedgesMember2019-12-310000921082us-gaap:AccumulatedNetGainLossFromDesignatedOrQualifyingCashFlowHedgesMember2021-01-012021-12-310000921082us-gaap:AccumulatedNetGainLossFromDesignatedOrQualifyingCashFlowHedgesMember2020-01-012020-12-310000921082hiw:OfficeAtlantaGaMember2021-01-012021-12-310000921082hiw:OfficeAtlantaGaMember2020-01-012020-12-310000921082hiw:OfficeAtlantaGaMember2019-01-012019-12-310000921082hiw:OfficeCharlotteNCMember2021-01-012021-12-310000921082hiw:OfficeCharlotteNCMember2020-01-012020-12-310000921082hiw:OfficeCharlotteNCMember2019-01-012019-12-310000921082hiw:OfficeNashvilleTnMember2021-01-012021-12-310000921082hiw:OfficeNashvilleTnMember2020-01-012020-12-310000921082hiw:OfficeNashvilleTnMember2019-01-012019-12-310000921082hiw:OfficeOrlandoFlMember2021-01-012021-12-310000921082hiw:OfficeOrlandoFlMember2020-01-012020-12-310000921082hiw:OfficeOrlandoFlMember2019-01-012019-12-310000921082hiw:OfficePittsburghPaMember2021-01-012021-12-310000921082hiw:OfficePittsburghPaMember2020-01-012020-12-310000921082hiw:OfficePittsburghPaMember2019-01-012019-12-310000921082hiw:OfficeRaleighNcMember2021-01-012021-12-310000921082hiw:OfficeRaleighNcMember2020-01-012020-12-310000921082hiw:OfficeRaleighNcMember2019-01-012019-12-310000921082hiw:OfficeRichmondVaMember2021-01-012021-12-310000921082hiw:OfficeRichmondVaMember2020-01-012020-12-310000921082hiw:OfficeRichmondVaMember2019-01-012019-12-310000921082hiw:OfficeTampaFlMember2021-01-012021-12-310000921082hiw:OfficeTampaFlMember2020-01-012020-12-310000921082hiw:OfficeTampaFlMember2019-01-012019-12-310000921082hiw:OfficeTotalSegmentMember2021-01-012021-12-310000921082hiw:OfficeTotalSegmentMember2020-01-012020-12-310000921082hiw:OfficeTotalSegmentMember2019-01-012019-12-310000921082hiw:TotalCorporateSegmentMember2021-01-012021-12-310000921082hiw:TotalCorporateSegmentMember2020-01-012020-12-310000921082hiw:TotalCorporateSegmentMember2019-01-012019-12-310000921082hiw:OfficeAtlantaGaMember2021-12-310000921082hiw:OfficeAtlantaGaMember2020-12-310000921082hiw:OfficeCharlotteNCMember2021-12-310000921082hiw:OfficeCharlotteNCMember2020-12-310000921082hiw:OfficeNashvilleTnMember2021-12-310000921082hiw:OfficeNashvilleTnMember2020-12-310000921082hiw:OfficeOrlandoFlMember2021-12-310000921082hiw:OfficeOrlandoFlMember2020-12-310000921082hiw:OfficePittsburghPaMember2021-12-310000921082hiw:OfficePittsburghPaMember2020-12-310000921082hiw:OfficeRaleighNcMember2021-12-310000921082hiw:OfficeRaleighNcMember2020-12-310000921082hiw:OfficeRichmondVaMember2021-12-310000921082hiw:OfficeRichmondVaMember2020-12-310000921082hiw:OfficeTampaFlMember2021-12-310000921082hiw:OfficeTampaFlMember2020-12-310000921082hiw:OfficeTotalSegmentMember2021-12-310000921082hiw:OfficeTotalSegmentMember2020-12-310000921082hiw:TotalCorporateSegmentMember2021-12-310000921082hiw:TotalCorporateSegmentMember2020-12-310000921082srt:ParentCompanyMemberus-gaap:SubsequentEventMember2022-02-012022-02-020000921082hiw:AtlantaGa1700CenturyCircleMember2021-12-310000921082hiw:AtlantaGa1800CenturyBoulevardMember2021-12-310000921082hiw:AtlantaGa1825CenturyCenterMember2021-12-310000921082hiw:AtlantaGa1875CenturyBoulevardMember2021-12-310000921082hiw:AtlantaGa1900CenturyBoulevardMember2021-12-310000921082hiw:AtlantaGa2200CenturyParkwayMember2021-12-310000921082hiw:AtlantaGa2400CenturyCenterMember2021-12-310000921082hiw:AtlantaGa2500CenturyCenterMember2021-12-310000921082hiw:AtlantaGa25002635ParkingGarageMember2021-12-310000921082hiw:AtlantaGa2600CenturyParkwayMember2021-12-310000921082hiw:AtlantaGa2635CenturyParkwayMember2021-12-310000921082hiw:AtlantaGa2800CenturyParkwayMember2021-12-310000921082hiw:AtlantaGaCenturyPlazaIMember2021-12-310000921082hiw:AtlantaGaCenturyPlazaIiMember2021-12-310000921082hiw:AtlantaGaRiverPointLandMember2021-12-310000921082hiw:AtlantaGaRiverwood100Member2021-12-310000921082hiw:AtlantaGaTradeportLandMember2021-12-310000921082hiw:AtlantaGaTwoAllianceCenterMember2021-12-310000921082hiw:AtlantaGAOneAllianceCenterMember2021-12-310000921082hiw:AtlantaGA10GlenlakeNorthMember2021-12-310000921082hiw:AtlantaGA10GlenlakeSouthMember2021-12-310000921082hiw:AtlantaGARiverwood200Member2021-12-310000921082hiw:Riverwood300LandMember2021-12-310000921082hiw:AtlantaGAMonarchTowerMember2021-12-310000921082hiw:AtlantaGAMonarchPlazaMember2021-12-310000921082hiw:AtlantaGAGalleria75Member2021-12-310000921082hiw:CharlotteNCBankofAmericaTowerMember2021-12-310000921082hiw:CharlotteNCMorrocroftMember2021-12-310000921082hiw:CharlotteNCCapitolTowersMember2021-12-310000921082hiw:NashvilleTn3322WestEndMember2021-12-310000921082hiw:NashvilleTn3401WestEndMember2021-12-310000921082hiw:NashvilleTn5310MarylandWayMember2021-12-310000921082hiw:NashvilleTnCoolSprings12DeckMember2021-12-310000921082hiw:NashvilleTnCoolSprings34DeckMember2021-12-310000921082hiw:NashvilleTnCoolSpringsIMember2021-12-310000921082hiw:NashvilleTnCoolSpringsIiMember2021-12-310000921082hiw:NashvilleTnCoolSpringsIiiMember2021-12-310000921082hiw:NashvilleTnCoolSpringsIvMember2021-12-310000921082hiw:NashvilleTnCoolSpringsVMember2021-12-310000921082hiw:NashvilleTnHarpethOnGreenIiMember2021-12-310000921082hiw:NashvilleTnHarpethOnGreenIiiMember2021-12-310000921082hiw:NashvilleTnHarpethOnGreenIvMember2021-12-310000921082hiw:NashvilleTnHarpethOnGreenVMember2021-12-310000921082hiw:NashvilleTnHickoryTraceMember2021-12-310000921082hiw:NashvilleTnHighwoodsPlazaIMember2021-12-310000921082hiw:NashvilleTnHighwoodsPlazaIiMember2021-12-310000921082hiw:NashvilleTnSevenSpringsIMember2021-12-310000921082hiw:NashvilleTnSouthpointeMember2021-12-310000921082hiw:NashvilleTnRampartsAtBrentwoodMember2021-12-310000921082hiw:NashvilleTnWestwoodSouthMember2021-12-310000921082hiw:NashvilleTnWinnersCircleMember2021-12-310000921082hiw:NashvilleTNThePinnacleatSymphonyMember2021-12-310000921082hiw:NashvilleTNSevenSpringsEastMember2021-12-310000921082hiw:NashvilleTNShopsatSevenSpringsMember2021-12-310000921082hiw:NashvilleTNSevenSpringsWestMember2021-12-310000921082hiw:NashvilleTNSevenSpringsIIMember2021-12-310000921082hiw:NashvilleTNBridgestoneAmericasMember2021-12-310000921082hiw:NashvilleTNVirginiaSpringsIIMember2021-12-310000921082hiw:NashvilleTNMARSCampusMember2021-12-310000921082hiw:NashvilleTN5501VirginiaWayMember2021-12-310000921082hiw:NashvilleTN1100BroadwayLandMember2021-12-310000921082hiw:NashvilleTNAsurionMember2021-12-310000921082hiw:NashvilleTNOvationLandMember2021-12-310000921082hiw:NashvilleTNBroadwayStemLandMember2021-12-310000921082hiw:NashvilleTNYMCASiteLandMember2021-12-310000921082hiw:OrlandoFlCapitalPlazaIiiMember2021-12-310000921082hiw:SouthFlorida1800EllerDriveBuildingMember2021-12-310000921082hiw:SouthFloridaSeasidePlazaMember2021-12-310000921082hiw:SouthFloridaCapitalPlazaTwoMember2021-12-310000921082hiw:SouthFloridaCapitalPlazaOneMember2021-12-310000921082hiw:SouthFloridaLandmarkCenterTwoMember2021-12-310000921082hiw:SouthFloridaLandmarkCenterOneMember2021-12-310000921082hiw:SouthFloridaLincolnPlazaMember2021-12-310000921082hiw:OrlandoFLEolaMember2021-12-310000921082hiw:PittsburghPaPpgIMember2021-12-310000921082hiw:PittsburghPaPpgIiOfficeMember2021-12-310000921082hiw:PittsburghPaPpgIiiMember2021-12-310000921082hiw:PittsburghPaPpgIvMember2021-12-310000921082hiw:PittsburghPaPpgVMember2021-12-310000921082hiw:PittsburghPaPpgViMember2021-12-310000921082hiw:PittsburghPaEqtPlazaMember2021-12-310000921082hiw:PittsburghPAEastLibertyLandMember2021-12-310000921082hiw:RaleighNc3600GlenwoodAvenueMember2021-12-310000921082hiw:RaleighNc3737GlenwoodAvenueMember2021-12-310000921082hiw:RaleighNc4800NorthParkMember2021-12-310000921082hiw:RaleighNc5000NorthParkMember2021-12-310000921082hiw:RaleighNc801CorporateCenterMember2021-12-310000921082hiw:RaleighNcBlueRidgeIMember2021-12-310000921082hiw:RaleighNcBlueRidgeIiMember2021-12-310000921082hiw:RaleighNcCentregreenOneWestonMember2021-12-310000921082hiw:RaleighNcCentregreenTwoWestonMember2021-12-310000921082hiw:RaleighNCCentreGreenThreeMember2021-12-310000921082hiw:RaleighNcCentregreenFourMember2021-12-310000921082hiw:RaleighNcCentregreenFiveMember2021-12-310000921082hiw:RaleighNcGlenlakeLandMember2021-12-310000921082hiw:RaleighNcGlenlakeBldgIMember2021-12-310000921082hiw:RaleighNcGlenlakeFourMember2021-12-310000921082hiw:RaleighNcGlenlakeSixMember2021-12-310000921082hiw:RaleighNcHealthsourceMember2021-12-310000921082hiw:RaleighNcHighwoodsCentreWestonMember2021-12-310000921082hiw:RaleighNcInvereskLandParcel2Member2021-12-310000921082hiw:RaleighNcLakeBooneMedicalCenterMember2021-12-310000921082hiw:RaleighNcMaplewoodMember2021-12-310000921082hiw:RaleighNcOverlookMember2021-12-310000921082hiw:RaleighNC751CorporateCenterMember2021-12-310000921082hiw:RaleighNCPNCPlazaMember2021-12-310000921082hiw:RaleighNcRexwoodsCenterIMember2021-12-310000921082hiw:RaleighNcRexwoodsCenterIiMember2021-12-310000921082hiw:RaleighNcRexwoodsCenterIiiMember2021-12-310000921082hiw:RaleighNcRexwoodsCenterIvMember2021-12-310000921082hiw:RaleighNcRexwoodsCenterVMember2021-12-310000921082hiw:RaleighNcRiverbirchMember2021-12-310000921082hiw:RaleighNcSixForksCenterIMember2021-12-310000921082hiw:RaleighNcSixForksCenterIiMember2021-12-310000921082hiw:RaleighNcSixForksCenterIiiMember2021-12-310000921082hiw:RaleighNcSycamoreMember2021-12-310000921082hiw:RaleighNcWestonLandMember2021-12-310000921082hiw:RaleighNcWillowOakMember2021-12-310000921082hiw:RaleighNc11000WestonParkwayMember2021-12-310000921082hiw:RaleighNCGlenLakeFiveMember2021-12-310000921082hiw:RaleighNC11800WestonParkwayMember2021-12-310000921082hiw:RaleighNCCentreGreenCafeMember2021-12-310000921082hiw:RaleighNCCentreGreenFitnessCenterMember2021-12-310000921082hiw:RaleighNCOneCityPlazaMember2021-12-310000921082hiw:RaleighNCEdisonLandMember2021-12-310000921082hiw:RaleighNCCharterSquareMember2021-12-310000921082hiw:RaleighNCMetlifeGlobalTechnologyCampusMember2021-12-310000921082hiw:RaleighNCGlenLakeSevenMember2021-12-310000921082hiw:RaleighNCHargettLandMember2021-12-310000921082hiw:RaleighNCForumIMember2021-12-310000921082hiw:RaleighNCForumIIMember2021-12-310000921082hiw:RaleighNCForumIIIMember2021-12-310000921082hiw:RaleighNCForumIVMember2021-12-310000921082hiw:RaleighNCForumVMember2021-12-310000921082hiw:RaleighNCCaptrustTowerMember2021-12-310000921082hiw:RaleighNC150FayettevilleMember2021-12-310000921082hiw:RaleighNcOtherPropertyMember2021-12-310000921082hiw:RichmondVa4900CoxRoadMember2021-12-310000921082hiw:RichmondVaColonnadeBuildingMember2021-12-310000921082hiw:RichmondVaDominionPlacePittsParcelMember2021-12-310000921082hiw:RichmondVaEssexPlazaMember2021-12-310000921082hiw:RichmondVaHighwoodsCommonsMember2021-12-310000921082hiw:RichmondVaHighwoodsOneMember2021-12-310000921082hiw:RichmondVaHighwoodsTwoMember2021-12-310000921082hiw:RichmondVaHighwoodsFiveMember2021-12-310000921082hiw:RichmondVaHighwoodsPlazaMember2021-12-310000921082hiw:RichmondVaInnslakeCenterMember2021-12-310000921082hiw:RichmondVaLibertyMutualMember2021-12-310000921082hiw:RichmondVaMarkelAmericanMember2021-12-310000921082hiw:RichmondVaMarkelPlazaMember2021-12-310000921082hiw:RichmondVaNorthParkMember2021-12-310000921082hiw:RichmondVaNorthShoreCommonsMember2021-12-310000921082hiw:RichmondVaNorthShoreCommonsBLandMember2021-12-310000921082hiw:RichmondVaNorthShoreCommonsCLandMember2021-12-310000921082hiw:RichmondVaNorthShoreCommonsDLandMember2021-12-310000921082hiw:RichmondVaOneShockoePlazaMember2021-12-310000921082hiw:RichmondVaPavilionLandMember2021-12-310000921082hiw:RichmondVaRhodiaBuildingMember2021-12-310000921082hiw:RichmondVaSadlerCoxLandMember2021-12-310000921082hiw:RichmondVaSaxonCapitalBuildingMember2021-12-310000921082hiw:RichmondVaStonyPointIMember2021-12-310000921082hiw:RichmondVaStonyPointIiMember2021-12-310000921082hiw:RichmondVaStonyPointIiiMember2021-12-310000921082hiw:RichmondVaStonyPointIvMember2021-12-310000921082hiw:RichmondVaVirginiaMutualMember2021-12-310000921082hiw:RichmondVAInnsbrookCenterMember2021-12-310000921082hiw:RichmondVAElksPassLandMember2021-12-310000921082hiw:TampaFl4200CypressMember2021-12-310000921082hiw:TampaFlBayshoreMember2021-12-310000921082hiw:TampaFlGeneralServicesAdministrationMember2021-12-310000921082hiw:TampaFlHiwBayCenterIMember2021-12-310000921082hiw:TampaFlHorizonMember2021-12-310000921082hiw:TampaFlLakepointeIMember2021-12-310000921082hiw:TampaFlLakepointeIiMember2021-12-310000921082hiw:TampaFlLakesideMember2021-12-310000921082hiw:TampaFlLakesideParksideGarageMember2021-12-310000921082hiw:TampaFlOneHarbourPlaceMember2021-12-310000921082hiw:TampaFlParksideMember2021-12-310000921082hiw:TampaFlPavilionMember2021-12-310000921082hiw:TampaFlPavilionParkingGarageMember2021-12-310000921082hiw:TampaFlSpectrumMember2021-12-310000921082hiw:TampaFlTowerPlaceMember2021-12-310000921082hiw:TampaFlWestshoreSquareMember2021-12-310000921082hiw:TampaFlIndependenceParkLandMember2021-12-310000921082hiw:TampaFlIndependenceParkMember2021-12-310000921082hiw:TampaFLMeridianIMember2021-12-310000921082hiw:TampaFLMeridianIIMember2021-12-310000921082hiw:TampaFL5332AvionParkMember2021-12-310000921082hiw:TampaFLSuntrustFinancialCentreMember2021-12-310000921082hiw:TampaFLSuntrustFinancialLandMember2021-12-310000921082hiw:TampaFLMidtownMember2021-12-310000921082hiw:TotalRealEstateAndAccumulatedDepreciationMember2021-12-310000921082hiw:AtlantaGa1700CenturyCircleMembersrt:MinimumMember2021-01-012021-12-310000921082srt:MaximumMemberhiw:AtlantaGa1700CenturyCircleMember2021-01-012021-12-310000921082hiw:AtlantaGa1800CenturyBoulevardMembersrt:MinimumMember2021-01-012021-12-310000921082hiw:AtlantaGa1800CenturyBoulevardMembersrt:MaximumMember2021-01-012021-12-310000921082hiw:AtlantaGa1825CenturyCenterMembersrt:MinimumMember2021-01-012021-12-310000921082hiw:AtlantaGa1825CenturyCenterMembersrt:MaximumMember2021-01-012021-12-310000921082hiw:AtlantaGa1875CenturyBoulevardMembersrt:MinimumMember2021-01-012021-12-310000921082srt:MaximumMemberhiw:AtlantaGa1875CenturyBoulevardMember2021-01-012021-12-310000921082hiw:AtlantaGa1900CenturyBoulevardMembersrt:MinimumMember2021-01-012021-12-310000921082hiw:AtlantaGa1900CenturyBoulevardMembersrt:MaximumMember2021-01-012021-12-310000921082hiw:AtlantaGa2200CenturyParkwayMembersrt:MinimumMember2021-01-012021-12-310000921082srt:MaximumMemberhiw:AtlantaGa2200CenturyParkwayMember2021-01-012021-12-310000921082srt:MinimumMemberhiw:AtlantaGa2400CenturyCenterMember2021-01-012021-12-310000921082srt:MaximumMemberhiw:AtlantaGa2400CenturyCenterMember2021-01-012021-12-310000921082hiw:AtlantaGa2500CenturyCenterMembersrt:MinimumMember2021-01-012021-12-310000921082hiw:AtlantaGa2500CenturyCenterMembersrt:MaximumMember2021-01-012021-12-310000921082hiw:AtlantaGa25002635ParkingGarageMembersrt:MinimumMember2021-01-012021-12-310000921082srt:MaximumMemberhiw:AtlantaGa25002635ParkingGarageMember2021-01-012021-12-310000921082srt:MinimumMemberhiw:AtlantaGa2600CenturyParkwayMember2021-01-012021-12-310000921082srt:MaximumMemberhiw:AtlantaGa2600CenturyParkwayMember2021-01-012021-12-310000921082srt:MinimumMemberhiw:AtlantaGa2635CenturyParkwayMember2021-01-012021-12-310000921082srt:MaximumMemberhiw:AtlantaGa2635CenturyParkwayMember2021-01-012021-12-310000921082srt:MinimumMemberhiw:AtlantaGa2800CenturyParkwayMember2021-01-012021-12-310000921082srt:MaximumMemberhiw:AtlantaGa2800CenturyParkwayMember2021-01-012021-12-310000921082srt:MinimumMemberhiw:AtlantaGaCenturyPlazaIMember2021-01-012021-12-310000921082srt:MaximumMemberhiw:AtlantaGaCenturyPlazaIMember2021-01-012021-12-310000921082hiw:AtlantaGaCenturyPlazaIiMembersrt:MinimumMember2021-01-012021-12-310000921082srt:MaximumMemberhiw:AtlantaGaCenturyPlazaIiMember2021-01-012021-12-310000921082hiw:AtlantaGaRiverPointLandMembersrt:MinimumMember2021-01-012021-12-310000921082srt:MaximumMemberhiw:AtlantaGaRiverPointLandMember2021-01-012021-12-310000921082srt:MinimumMemberhiw:AtlantaGaRiverwood100Member2021-01-012021-12-310000921082srt:MaximumMemberhiw:AtlantaGaRiverwood100Member2021-01-012021-12-310000921082hiw:AtlantaGaTwoAllianceCenterMembersrt:MinimumMember2021-01-012021-12-310000921082srt:MaximumMemberhiw:AtlantaGaTwoAllianceCenterMember2021-01-012021-12-310000921082hiw:AtlantaGAOneAllianceCenterMembersrt:MinimumMember2021-01-012021-12-310000921082srt:MaximumMemberhiw:AtlantaGAOneAllianceCenterMember2021-01-012021-12-310000921082srt:MinimumMemberhiw:AtlantaGA10GlenlakeNorthMember2021-01-012021-12-310000921082srt:MaximumMemberhiw:AtlantaGA10GlenlakeNorthMember2021-01-012021-12-310000921082hiw:AtlantaGA10GlenlakeSouthMembersrt:MinimumMember2021-01-012021-12-310000921082srt:MaximumMemberhiw:AtlantaGA10GlenlakeSouthMember2021-01-012021-12-310000921082hiw:AtlantaGARiverwood200Membersrt:MinimumMember2021-01-012021-12-310000921082hiw:AtlantaGARiverwood200Membersrt:MaximumMember2021-01-012021-12-310000921082hiw:Riverwood300LandMembersrt:MinimumMember2021-01-012021-12-310000921082hiw:Riverwood300LandMembersrt:MaximumMember2021-01-012021-12-310000921082hiw:AtlantaGAMonarchTowerMembersrt:MinimumMember2021-01-012021-12-310000921082hiw:AtlantaGAMonarchTowerMembersrt:MaximumMember2021-01-012021-12-310000921082hiw:AtlantaGAMonarchPlazaMembersrt:MinimumMember2021-01-012021-12-310000921082hiw:AtlantaGAMonarchPlazaMembersrt:MaximumMember2021-01-012021-12-310000921082srt:MinimumMemberhiw:CharlotteNCBankofAmericaTowerMember2021-01-012021-12-310000921082srt:MaximumMemberhiw:CharlotteNCBankofAmericaTowerMember2021-01-012021-12-310000921082hiw:CharlotteNCMorrocroftMembersrt:MinimumMember2021-01-012021-12-310000921082srt:MaximumMemberhiw:CharlotteNCMorrocroftMember2021-01-012021-12-310000921082hiw:CharlotteNCCapitolTowersMembersrt:MinimumMember2021-01-012021-12-310000921082srt:MaximumMemberhiw:CharlotteNCCapitolTowersMember2021-01-012021-12-310000921082srt:MinimumMemberhiw:NashvilleTn3322WestEndMember2021-01-012021-12-310000921082srt:MaximumMemberhiw:NashvilleTn3322WestEndMember2021-01-012021-12-310000921082hiw:NashvilleTn3401WestEndMembersrt:MinimumMember2021-01-012021-12-310000921082srt:MaximumMemberhiw:NashvilleTn3401WestEndMember2021-01-012021-12-310000921082hiw:NashvilleTn5310MarylandWayMembersrt:MinimumMember2021-01-012021-12-310000921082srt:MaximumMemberhiw:NashvilleTn5310MarylandWayMember2021-01-012021-12-310000921082hiw:NashvilleTnCoolSprings12DeckMembersrt:MinimumMember2021-01-012021-12-310000921082srt:MaximumMemberhiw:NashvilleTnCoolSprings12DeckMember2021-01-012021-12-310000921082hiw:NashvilleTnCoolSprings34DeckMembersrt:MinimumMember2021-01-012021-12-310000921082srt:MaximumMemberhiw:NashvilleTnCoolSprings34DeckMember2021-01-012021-12-310000921082hiw:NashvilleTnCoolSpringsIMembersrt:MinimumMember2021-01-012021-12-310000921082hiw:NashvilleTnCoolSpringsIMembersrt:MaximumMember2021-01-012021-12-310000921082hiw:NashvilleTnCoolSpringsIiMembersrt:MinimumMember2021-01-012021-12-310000921082srt:MaximumMemberhiw:NashvilleTnCoolSpringsIiMember2021-01-012021-12-310000921082hiw:NashvilleTnCoolSpringsIiiMembersrt:MinimumMember2021-01-012021-12-310000921082hiw:NashvilleTnCoolSpringsIiiMembersrt:MaximumMember2021-01-012021-12-310000921082srt:MinimumMemberhiw:NashvilleTnCoolSpringsIvMember2021-01-012021-12-310000921082srt:MaximumMemberhiw:NashvilleTnCoolSpringsIvMember2021-01-012021-12-310000921082hiw:NashvilleTnCoolSpringsVMembersrt:MinimumMember2021-01-012021-12-310000921082srt:MaximumMemberhiw:NashvilleTnCoolSpringsVMember2021-01-012021-12-310000921082srt:MinimumMemberhiw:NashvilleTnHarpethOnGreenIiMember2021-01-012021-12-310000921082srt:MaximumMemberhiw:NashvilleTnHarpethOnGreenIiMember2021-01-012021-12-310000921082hiw:NashvilleTnHarpethOnGreenIiiMembersrt:MinimumMember2021-01-012021-12-310000921082hiw:NashvilleTnHarpethOnGreenIiiMembersrt:MaximumMember2021-01-012021-12-310000921082hiw:NashvilleTnHarpethOnGreenIvMembersrt:MinimumMember2021-01-012021-12-310000921082hiw:NashvilleTnHarpethOnGreenIvMembersrt:MaximumMember2021-01-012021-12-310000921082hiw:NashvilleTnHarpethOnGreenVMembersrt:MinimumMember2021-01-012021-12-310000921082hiw:NashvilleTnHarpethOnGreenVMembersrt:MaximumMember2021-01-012021-12-310000921082srt:MinimumMemberhiw:NashvilleTnHickoryTraceMember2021-01-012021-12-310000921082srt:MaximumMemberhiw:NashvilleTnHickoryTraceMember2021-01-012021-12-310000921082srt:MinimumMemberhiw:NashvilleTnHighwoodsPlazaIMember2021-01-012021-12-310000921082srt:MaximumMemberhiw:NashvilleTnHighwoodsPlazaIMember2021-01-012021-12-310000921082hiw:NashvilleTnHighwoodsPlazaIiMembersrt:MinimumMember2021-01-012021-12-310000921082srt:MaximumMemberhiw:NashvilleTnHighwoodsPlazaIiMember2021-01-012021-12-310000921082hiw:NashvilleTnSevenSpringsIMembersrt:MinimumMember2021-01-012021-12-310000921082srt:MaximumMemberhiw:NashvilleTnSevenSpringsIMember2021-01-012021-12-310000921082hiw:NashvilleTnSouthpointeMembersrt:MinimumMember2021-01-012021-12-310000921082srt:MaximumMemberhiw:NashvilleTnSouthpointeMember2021-01-012021-12-310000921082hiw:NashvilleTnRampartsAtBrentwoodMembersrt:MinimumMember2021-01-012021-12-310000921082srt:MaximumMemberhiw:NashvilleTnRampartsAtBrentwoodMember2021-01-012021-12-310000921082hiw:NashvilleTnWestwoodSouthMembersrt:MinimumMember2021-01-012021-12-310000921082srt:MaximumMemberhiw:NashvilleTnWestwoodSouthMember2021-01-012021-12-310000921082srt:MinimumMemberhiw:NashvilleTnWinnersCircleMember2021-01-012021-12-310000921082srt:MaximumMemberhiw:NashvilleTnWinnersCircleMember2021-01-012021-12-310000921082hiw:NashvilleTNThePinnacleatSymphonyMembersrt:MinimumMember2021-01-012021-12-310000921082srt:MaximumMemberhiw:NashvilleTNThePinnacleatSymphonyMember2021-01-012021-12-310000921082hiw:NashvilleTNSevenSpringsEastMembersrt:MinimumMember2021-01-012021-12-310000921082srt:MaximumMemberhiw:NashvilleTNSevenSpringsEastMember2021-01-012021-12-310000921082hiw:NashvilleTNShopsatSevenSpringsMembersrt:MinimumMember2021-01-012021-12-310000921082hiw:NashvilleTNShopsatSevenSpringsMembersrt:MaximumMember2021-01-012021-12-310000921082hiw:NashvilleTNSevenSpringsWestMembersrt:MinimumMember2021-01-012021-12-310000921082srt:MaximumMemberhiw:NashvilleTNSevenSpringsWestMember2021-01-012021-12-310000921082hiw:NashvilleTNSevenSpringsIIMembersrt:MinimumMember2021-01-012021-12-310000921082srt:MaximumMemberhiw:NashvilleTNSevenSpringsIIMember2021-01-012021-12-310000921082hiw:NashvilleTNBridgestoneAmericasMembersrt:MinimumMember2021-01-012021-12-310000921082srt:MaximumMemberhiw:NashvilleTNBridgestoneAmericasMember2021-01-012021-12-310000921082srt:MinimumMemberhiw:NashvilleTNVirginiaSpringsIIMember2021-01-012021-12-310000921082srt:MaximumMemberhiw:NashvilleTNVirginiaSpringsIIMember2021-01-012021-12-310000921082hiw:NashvilleTNMARSCampusMembersrt:MinimumMember2021-01-012021-12-310000921082srt:MaximumMemberhiw:NashvilleTNMARSCampusMember2021-01-012021-12-310000921082hiw:NashvilleTN5501VirginiaWayMembersrt:MinimumMember2021-01-012021-12-310000921082srt:MaximumMemberhiw:NashvilleTN5501VirginiaWayMember2021-01-012021-12-310000921082hiw:NashvilleTNAsurionMembersrt:MinimumMember2021-01-012021-12-310000921082hiw:NashvilleTNAsurionMembersrt:MaximumMember2021-01-012021-12-310000921082srt:MinimumMemberhiw:NashvilleTNBroadwayStemLandMember2021-01-012021-12-310000921082srt:MaximumMemberhiw:NashvilleTNBroadwayStemLandMember2021-01-012021-12-310000921082hiw:SouthFlorida1800EllerDriveBuildingMembersrt:MinimumMember2021-01-012021-12-310000921082hiw:SouthFlorida1800EllerDriveBuildingMembersrt:MaximumMember2021-01-012021-12-310000921082hiw:SouthFloridaSeasidePlazaMembersrt:MinimumMember2021-01-012021-12-310000921082srt:MaximumMemberhiw:SouthFloridaSeasidePlazaMember2021-01-012021-12-310000921082hiw:SouthFloridaCapitalPlazaTwoMembersrt:MinimumMember2021-01-012021-12-310000921082hiw:SouthFloridaCapitalPlazaTwoMembersrt:MaximumMember2021-01-012021-12-310000921082hiw:SouthFloridaCapitalPlazaOneMembersrt:MinimumMember2021-01-012021-12-310000921082hiw:SouthFloridaCapitalPlazaOneMembersrt:MaximumMember2021-01-012021-12-310000921082srt:MinimumMemberhiw:SouthFloridaLandmarkCenterTwoMember2021-01-012021-12-310000921082srt:MaximumMemberhiw:SouthFloridaLandmarkCenterTwoMember2021-01-012021-12-310000921082srt:MinimumMemberhiw:SouthFloridaLandmarkCenterOneMember2021-01-012021-12-310000921082srt:MaximumMemberhiw:SouthFloridaLandmarkCenterOneMember2021-01-012021-12-310000921082hiw:SouthFloridaLincolnPlazaMembersrt:MinimumMember2021-01-012021-12-310000921082srt:MaximumMemberhiw:SouthFloridaLincolnPlazaMember2021-01-012021-12-310000921082hiw:OrlandoFLEolaMembersrt:MinimumMember2021-01-012021-12-310000921082hiw:OrlandoFLEolaMembersrt:MaximumMember2021-01-012021-12-310000921082srt:MinimumMemberhiw:PittsburghPaPpgIMember2021-01-012021-12-310000921082srt:MaximumMemberhiw:PittsburghPaPpgIMember2021-01-012021-12-310000921082hiw:PittsburghPaPpgIiOfficeMembersrt:MinimumMember2021-01-012021-12-310000921082srt:MaximumMemberhiw:PittsburghPaPpgIiOfficeMember2021-01-012021-12-310000921082srt:MinimumMemberhiw:PittsburghPaPpgIiiMember2021-01-012021-12-310000921082srt:MaximumMemberhiw:PittsburghPaPpgIiiMember2021-01-012021-12-310000921082srt:MinimumMemberhiw:PittsburghPaPpgIvMember2021-01-012021-12-310000921082srt:MaximumMemberhiw:PittsburghPaPpgIvMember2021-01-012021-12-310000921082hiw:PittsburghPaPpgVMembersrt:MinimumMember2021-01-012021-12-310000921082srt:MaximumMemberhiw:PittsburghPaPpgVMember2021-01-012021-12-310000921082hiw:PittsburghPaPpgViMembersrt:MinimumMember2021-01-012021-12-310000921082srt:MaximumMemberhiw:PittsburghPaPpgViMember2021-01-012021-12-310000921082srt:MinimumMemberhiw:PittsburghPaEqtPlazaMember2021-01-012021-12-310000921082srt:MaximumMemberhiw:PittsburghPaEqtPlazaMember2021-01-012021-12-310000921082srt:MinimumMemberhiw:RaleighNc3600GlenwoodAvenueMember2021-01-012021-12-310000921082srt:MaximumMemberhiw:RaleighNc3600GlenwoodAvenueMember2021-01-012021-12-310000921082hiw:RaleighNc3737GlenwoodAvenueMembersrt:MinimumMember2021-01-012021-12-310000921082srt:MaximumMemberhiw:RaleighNc3737GlenwoodAvenueMember2021-01-012021-12-310000921082hiw:RaleighNc4800NorthParkMembersrt:MinimumMember2021-01-012021-12-310000921082srt:MaximumMemberhiw:RaleighNc4800NorthParkMember2021-01-012021-12-310000921082hiw:RaleighNc5000NorthParkMembersrt:MinimumMember2021-01-012021-12-310000921082srt:MaximumMemberhiw:RaleighNc5000NorthParkMember2021-01-012021-12-310000921082hiw:RaleighNc801CorporateCenterMembersrt:MinimumMember2021-01-012021-12-310000921082hiw:RaleighNc801CorporateCenterMembersrt:MaximumMember2021-01-012021-12-310000921082srt:MinimumMemberhiw:RaleighNcBlueRidgeIMember2021-01-012021-12-310000921082srt:MaximumMemberhiw:RaleighNcBlueRidgeIMember2021-01-012021-12-310000921082hiw:RaleighNcBlueRidgeIiMembersrt:MinimumMember2021-01-012021-12-310000921082srt:MaximumMemberhiw:RaleighNcBlueRidgeIiMember2021-01-012021-12-310000921082srt:MinimumMemberhiw:RaleighNcCentregreenOneWestonMember2021-01-012021-12-310000921082srt:MaximumMemberhiw:RaleighNcCentregreenOneWestonMember2021-01-012021-12-310000921082srt:MinimumMemberhiw:RaleighNcCentregreenTwoWestonMember2021-01-012021-12-310000921082srt:MaximumMemberhiw:RaleighNcCentregreenTwoWestonMember2021-01-012021-12-310000921082hiw:RaleighNCCentreGreenThreeMembersrt:MinimumMember2021-01-012021-12-310000921082hiw:RaleighNCCentreGreenThreeMembersrt:MaximumMember2021-01-012021-12-310000921082hiw:RaleighNcCentregreenFourMembersrt:MinimumMember2021-01-012021-12-310000921082hiw:RaleighNcCentregreenFourMembersrt:MaximumMember2021-01-012021-12-310000921082hiw:RaleighNcCentregreenFiveMembersrt:MinimumMember2021-01-012021-12-310000921082hiw:RaleighNcCentregreenFiveMembersrt:MaximumMember2021-01-012021-12-310000921082hiw:RaleighNcGlenlakeLandMembersrt:MinimumMember2021-01-012021-12-310000921082srt:MaximumMemberhiw:RaleighNcGlenlakeLandMember2021-01-012021-12-310000921082srt:MinimumMemberhiw:RaleighNcGlenlakeBldgIMember2021-01-012021-12-310000921082srt:MaximumMemberhiw:RaleighNcGlenlakeBldgIMember2021-01-012021-12-310000921082hiw:RaleighNcGlenlakeFourMembersrt:MinimumMember2021-01-012021-12-310000921082srt:MaximumMemberhiw:RaleighNcGlenlakeFourMember2021-01-012021-12-310000921082hiw:RaleighNcGlenlakeSixMembersrt:MinimumMember2021-01-012021-12-310000921082hiw:RaleighNcGlenlakeSixMembersrt:MaximumMember2021-01-012021-12-310000921082srt:MinimumMemberhiw:RaleighNcHealthsourceMember2021-01-012021-12-310000921082srt:MaximumMemberhiw:RaleighNcHealthsourceMember2021-01-012021-12-310000921082srt:MinimumMemberhiw:RaleighNcHighwoodsCentreWestonMember2021-01-012021-12-310000921082srt:MaximumMemberhiw:RaleighNcHighwoodsCentreWestonMember2021-01-012021-12-310000921082srt:MinimumMemberhiw:RaleighNcInvereskLandParcel2Member2021-01-012021-12-310000921082srt:MaximumMemberhiw:RaleighNcInvereskLandParcel2Member2021-01-012021-12-310000921082srt:MinimumMemberhiw:RaleighNcLakeBooneMedicalCenterMember2021-01-012021-12-310000921082srt:MaximumMemberhiw:RaleighNcLakeBooneMedicalCenterMember2021-01-012021-12-310000921082hiw:RaleighNcMaplewoodMembersrt:MinimumMember2021-01-012021-12-310000921082srt:MaximumMemberhiw:RaleighNcMaplewoodMember2021-01-012021-12-310000921082hiw:RaleighNcOverlookMembersrt:MinimumMember2021-01-012021-12-310000921082srt:MaximumMemberhiw:RaleighNcOverlookMember2021-01-012021-12-310000921082hiw:RaleighNC751CorporateCenterMembersrt:MinimumMember2021-01-012021-12-310000921082srt:MaximumMemberhiw:RaleighNC751CorporateCenterMember2021-01-012021-12-310000921082hiw:RaleighNCPNCPlazaMembersrt:MinimumMember2021-01-012021-12-310000921082srt:MaximumMemberhiw:RaleighNCPNCPlazaMember2021-01-012021-12-310000921082hiw:RaleighNcRexwoodsCenterIMembersrt:MinimumMember2021-01-012021-12-310000921082srt:MaximumMemberhiw:RaleighNcRexwoodsCenterIMember2021-01-012021-12-310000921082hiw:RaleighNcRexwoodsCenterIiMembersrt:MinimumMember2021-01-012021-12-310000921082srt:MaximumMemberhiw:RaleighNcRexwoodsCenterIiMember2021-01-012021-12-310000921082hiw:RaleighNcRexwoodsCenterIiiMembersrt:MinimumMember2021-01-012021-12-310000921082srt:MaximumMemberhiw:RaleighNcRexwoodsCenterIiiMember2021-01-012021-12-310000921082hiw:RaleighNcRexwoodsCenterIvMembersrt:MinimumMember2021-01-012021-12-310000921082srt:MaximumMemberhiw:RaleighNcRexwoodsCenterIvMember2021-01-012021-12-310000921082hiw:RaleighNcRexwoodsCenterVMembersrt:MinimumMember2021-01-012021-12-310000921082hiw:RaleighNcRexwoodsCenterVMembersrt:MaximumMember2021-01-012021-12-310000921082hiw:RaleighNcRiverbirchMembersrt:MinimumMember2021-01-012021-12-310000921082srt:MaximumMemberhiw:RaleighNcRiverbirchMember2021-01-012021-12-310000921082srt:MinimumMemberhiw:RaleighNcSixForksCenterIMember2021-01-012021-12-310000921082srt:MaximumMemberhiw:RaleighNcSixForksCenterIMember2021-01-012021-12-310000921082srt:MinimumMemberhiw:RaleighNcSixForksCenterIiMember2021-01-012021-12-310000921082srt:MaximumMemberhiw:RaleighNcSixForksCenterIiMember2021-01-012021-12-310000921082srt:MinimumMemberhiw:RaleighNcSixForksCenterIiiMember2021-01-012021-12-310000921082srt:MaximumMemberhiw:RaleighNcSixForksCenterIiiMember2021-01-012021-12-310000921082srt:MinimumMemberhiw:RaleighNcSycamoreMember2021-01-012021-12-310000921082srt:MaximumMemberhiw:RaleighNcSycamoreMember2021-01-012021-12-310000921082hiw:RaleighNcWillowOakMembersrt:MinimumMember2021-01-012021-12-310000921082srt:MaximumMemberhiw:RaleighNcWillowOakMember2021-01-012021-12-310000921082hiw:RaleighNCGlenLakeFiveMembersrt:MinimumMember2021-01-012021-12-310000921082hiw:RaleighNCGlenLakeFiveMembersrt:MaximumMember2021-01-012021-12-310000921082hiw:RaleighNC11800WestonParkwayMembersrt:MinimumMember2021-01-012021-12-310000921082hiw:RaleighNC11800WestonParkwayMembersrt:MaximumMember2021-01-012021-12-310000921082hiw:RaleighNCCentreGreenCafeMembersrt:MinimumMember2021-01-012021-12-310000921082srt:MaximumMemberhiw:RaleighNCCentreGreenCafeMember2021-01-012021-12-310000921082hiw:RaleighNCCentreGreenFitnessCenterMembersrt:MinimumMember2021-01-012021-12-310000921082hiw:RaleighNCCentreGreenFitnessCenterMembersrt:MaximumMember2021-01-012021-12-310000921082srt:MinimumMemberhiw:RaleighNCOneCityPlazaMember2021-01-012021-12-310000921082srt:MaximumMemberhiw:RaleighNCOneCityPlazaMember2021-01-012021-12-310000921082srt:MinimumMemberhiw:RaleighNcOtherPropertyMember2021-01-012021-12-310000921082srt:MaximumMemberhiw:RaleighNcOtherPropertyMember2021-01-012021-12-310000921082srt:MinimumMemberhiw:RaleighNc11000WestonParkwayMember2021-01-012021-12-310000921082srt:MaximumMemberhiw:RaleighNc11000WestonParkwayMember2021-01-012021-12-310000921082srt:MinimumMemberhiw:RaleighNCCharterSquareMember2021-01-012021-12-310000921082srt:MaximumMemberhiw:RaleighNCCharterSquareMember2021-01-012021-12-310000921082hiw:RaleighNCMetlifeGlobalTechnologyCampusMembersrt:MinimumMember2021-01-012021-12-310000921082hiw:RaleighNCMetlifeGlobalTechnologyCampusMembersrt:MaximumMember2021-01-012021-12-310000921082srt:MinimumMemberhiw:RaleighNCGlenLakeSevenMember2021-01-012021-12-310000921082srt:MaximumMemberhiw:RaleighNCGlenLakeSevenMember2021-01-012021-12-310000921082srt:MinimumMemberhiw:RaleighNCForumIMember2021-01-012021-12-310000921082srt:MaximumMemberhiw:RaleighNCForumIMember2021-01-012021-12-310000921082hiw:RaleighNCForumIIMembersrt:MinimumMember2021-01-012021-12-310000921082srt:MaximumMemberhiw:RaleighNCForumIIMember2021-01-012021-12-310000921082hiw:RaleighNCForumIIIMembersrt:MinimumMember2021-01-012021-12-310000921082srt:MaximumMemberhiw:RaleighNCForumIIIMember2021-01-012021-12-310000921082srt:MinimumMemberhiw:RaleighNCForumIVMember2021-01-012021-12-310000921082srt:MaximumMemberhiw:RaleighNCForumIVMember2021-01-012021-12-310000921082hiw:RaleighNCForumVMembersrt:MinimumMember2021-01-012021-12-310000921082srt:MaximumMemberhiw:RaleighNCForumVMember2021-01-012021-12-310000921082hiw:RaleighNCCaptrustTowerMembersrt:MinimumMember2021-01-012021-12-310000921082hiw:RaleighNCCaptrustTowerMembersrt:MaximumMember2021-01-012021-12-310000921082srt:MinimumMemberhiw:RaleighNC150FayettevilleMember2021-01-012021-12-310000921082srt:MaximumMemberhiw:RaleighNC150FayettevilleMember2021-01-012021-12-310000921082hiw:RichmondVa4900CoxRoadMembersrt:MinimumMember2021-01-012021-12-310000921082hiw:RichmondVa4900CoxRoadMembersrt:MaximumMember2021-01-012021-12-310000921082hiw:RichmondVaColonnadeBuildingMembersrt:MinimumMember2021-01-012021-12-310000921082srt:MaximumMemberhiw:RichmondVaColonnadeBuildingMember2021-01-012021-12-310000921082hiw:RichmondVaEssexPlazaMembersrt:MinimumMember2021-01-012021-12-310000921082hiw:RichmondVaEssexPlazaMembersrt:MaximumMember2021-01-012021-12-310000921082hiw:RichmondVaHighwoodsCommonsMembersrt:MinimumMember2021-01-012021-12-310000921082hiw:RichmondVaHighwoodsCommonsMembersrt:MaximumMember2021-01-012021-12-310000921082srt:MinimumMemberhiw:RichmondVaHighwoodsOneMember2021-01-012021-12-310000921082srt:MaximumMemberhiw:RichmondVaHighwoodsOneMember2021-01-012021-12-310000921082hiw:RichmondVaHighwoodsTwoMembersrt:MinimumMember2021-01-012021-12-310000921082srt:MaximumMemberhiw:RichmondVaHighwoodsTwoMember2021-01-012021-12-310000921082srt:MinimumMemberhiw:RichmondVaHighwoodsFiveMember2021-01-012021-12-310000921082srt:MaximumMemberhiw:RichmondVaHighwoodsFiveMember2021-01-012021-12-310000921082hiw:RichmondVaHighwoodsPlazaMembersrt:MinimumMember2021-01-012021-12-310000921082srt:MaximumMemberhiw:RichmondVaHighwoodsPlazaMember2021-01-012021-12-310000921082hiw:RichmondVaInnslakeCenterMembersrt:MinimumMember2021-01-012021-12-310000921082hiw:RichmondVaInnslakeCenterMembersrt:MaximumMember2021-01-012021-12-310000921082srt:MinimumMemberhiw:RichmondVaLibertyMutualMember2021-01-012021-12-310000921082srt:MaximumMemberhiw:RichmondVaLibertyMutualMember2021-01-012021-12-310000921082srt:MinimumMemberhiw:RichmondVaMarkelAmericanMember2021-01-012021-12-310000921082srt:MaximumMemberhiw:RichmondVaMarkelAmericanMember2021-01-012021-12-310000921082hiw:RichmondVaMarkelPlazaMembersrt:MinimumMember2021-01-012021-12-310000921082hiw:RichmondVaMarkelPlazaMembersrt:MaximumMember2021-01-012021-12-310000921082hiw:RichmondVaNorthParkMembersrt:MinimumMember2021-01-012021-12-310000921082srt:MaximumMemberhiw:RichmondVaNorthParkMember2021-01-012021-12-310000921082srt:MinimumMemberhiw:RichmondVaNorthShoreCommonsMember2021-01-012021-12-310000921082srt:MaximumMemberhiw:RichmondVaNorthShoreCommonsMember2021-01-012021-12-310000921082srt:MinimumMemberhiw:RichmondVaNorthShoreCommonsBLandMember2021-01-012021-12-310000921082srt:MaximumMemberhiw:RichmondVaNorthShoreCommonsBLandMember2021-01-012021-12-310000921082srt:MinimumMemberhiw:RichmondVaOneShockoePlazaMember2021-01-012021-12-310000921082srt:MaximumMemberhiw:RichmondVaOneShockoePlazaMember2021-01-012021-12-310000921082srt:MinimumMemberhiw:RichmondVaRhodiaBuildingMember2021-01-012021-12-310000921082srt:MaximumMemberhiw:RichmondVaRhodiaBuildingMember2021-01-012021-12-310000921082srt:MinimumMemberhiw:RichmondVaSaxonCapitalBuildingMember2021-01-012021-12-310000921082srt:MaximumMemberhiw:RichmondVaSaxonCapitalBuildingMember2021-01-012021-12-310000921082srt:MinimumMemberhiw:RichmondVaStonyPointIMember2021-01-012021-12-310000921082srt:MaximumMemberhiw:RichmondVaStonyPointIMember2021-01-012021-12-310000921082srt:MinimumMemberhiw:RichmondVaStonyPointIiMember2021-01-012021-12-310000921082srt:MaximumMemberhiw:RichmondVaStonyPointIiMember2021-01-012021-12-310000921082hiw:RichmondVaStonyPointIiiMembersrt:MinimumMember2021-01-012021-12-310000921082hiw:RichmondVaStonyPointIiiMembersrt:MaximumMember2021-01-012021-12-310000921082hiw:RichmondVaStonyPointIvMembersrt:MinimumMember2021-01-012021-12-310000921082srt:MaximumMemberhiw:RichmondVaStonyPointIvMember2021-01-012021-12-310000921082srt:MinimumMemberhiw:RichmondVaVirginiaMutualMember2021-01-012021-12-310000921082srt:MaximumMemberhiw:RichmondVaVirginiaMutualMember2021-01-012021-12-310000921082srt:MinimumMemberhiw:RichmondVAInnsbrookCenterMember2021-01-012021-12-310000921082srt:MaximumMemberhiw:RichmondVAInnsbrookCenterMember2021-01-012021-12-310000921082hiw:TampaFl4200CypressMembersrt:MinimumMember2021-01-012021-12-310000921082srt:MaximumMemberhiw:TampaFl4200CypressMember2021-01-012021-12-310000921082hiw:TampaFlBayshoreMembersrt:MinimumMember2021-01-012021-12-310000921082srt:MaximumMemberhiw:TampaFlBayshoreMember2021-01-012021-12-310000921082hiw:TampaFlGeneralServicesAdministrationMembersrt:MinimumMember2021-01-012021-12-310000921082hiw:TampaFlGeneralServicesAdministrationMembersrt:MaximumMember2021-01-012021-12-310000921082srt:MinimumMemberhiw:TampaFlHiwBayCenterIMember2021-01-012021-12-310000921082srt:MaximumMemberhiw:TampaFlHiwBayCenterIMember2021-01-012021-12-310000921082srt:MinimumMemberhiw:TampaFlHorizonMember2021-01-012021-12-310000921082srt:MaximumMemberhiw:TampaFlHorizonMember2021-01-012021-12-310000921082hiw:TampaFlLakepointeIMembersrt:MinimumMember2021-01-012021-12-310000921082srt:MaximumMemberhiw:TampaFlLakepointeIMember2021-01-012021-12-310000921082hiw:TampaFlLakepointeIiMembersrt:MinimumMember2021-01-012021-12-310000921082hiw:TampaFlLakepointeIiMembersrt:MaximumMember2021-01-012021-12-310000921082hiw:TampaFlLakesideMembersrt:MinimumMember2021-01-012021-12-310000921082srt:MaximumMemberhiw:TampaFlLakesideMember2021-01-012021-12-310000921082srt:MinimumMemberhiw:TampaFlLakesideParksideGarageMember2021-01-012021-12-310000921082srt:MaximumMemberhiw:TampaFlLakesideParksideGarageMember2021-01-012021-12-310000921082srt:MinimumMemberhiw:TampaFlOneHarbourPlaceMember2021-01-012021-12-310000921082srt:MaximumMemberhiw:TampaFlOneHarbourPlaceMember2021-01-012021-12-310000921082hiw:TampaFlParksideMembersrt:MinimumMember2021-01-012021-12-310000921082hiw:TampaFlParksideMembersrt:MaximumMember2021-01-012021-12-310000921082srt:MinimumMemberhiw:TampaFlPavilionMember2021-01-012021-12-310000921082srt:MaximumMemberhiw:TampaFlPavilionMember2021-01-012021-12-310000921082hiw:TampaFlPavilionParkingGarageMembersrt:MinimumMember2021-01-012021-12-310000921082hiw:TampaFlPavilionParkingGarageMembersrt:MaximumMember2021-01-012021-12-310000921082hiw:TampaFlSpectrumMembersrt:MinimumMember2021-01-012021-12-310000921082srt:MaximumMemberhiw:TampaFlSpectrumMember2021-01-012021-12-310000921082srt:MinimumMemberhiw:TampaFlTowerPlaceMember2021-01-012021-12-310000921082srt:MaximumMemberhiw:TampaFlTowerPlaceMember2021-01-012021-12-310000921082hiw:TampaFlWestshoreSquareMembersrt:MinimumMember2021-01-012021-12-310000921082srt:MaximumMemberhiw:TampaFlWestshoreSquareMember2021-01-012021-12-310000921082hiw:TampaFlIndependenceParkLandMembersrt:MinimumMember2021-01-012021-12-310000921082srt:MaximumMemberhiw:TampaFlIndependenceParkLandMember2021-01-012021-12-310000921082hiw:TampaFlIndependenceParkMembersrt:MinimumMember2021-01-012021-12-310000921082srt:MaximumMemberhiw:TampaFlIndependenceParkMember2021-01-012021-12-310000921082hiw:TampaFLMeridianIMembersrt:MinimumMember2021-01-012021-12-310000921082srt:MaximumMemberhiw:TampaFLMeridianIMember2021-01-012021-12-310000921082hiw:TampaFLMeridianIIMembersrt:MinimumMember2021-01-012021-12-310000921082hiw:TampaFLMeridianIIMembersrt:MaximumMember2021-01-012021-12-310000921082hiw:TampaFL5332AvionParkMembersrt:MinimumMember2021-01-012021-12-310000921082srt:MaximumMemberhiw:TampaFL5332AvionParkMember2021-01-012021-12-310000921082srt:MinimumMemberhiw:TampaFLSuntrustFinancialCentreMember2021-01-012021-12-310000921082srt:MaximumMemberhiw:TampaFLSuntrustFinancialCentreMember2021-01-012021-12-310000921082hiw:TampaFLMidtownMembersrt:MinimumMember2021-01-012021-12-310000921082srt:MaximumMemberhiw:TampaFLMidtownMember2021-01-012021-12-31
UNITED STATES
SECURITIES AND EXCHANGE COMMISSION
Washington, D.C. 20549
FORM 10-K
☒ ANNUAL REPORT PURSUANT TO SECTION 13 OR 15(d) OF THE SECURITIES EXCHANGE ACT OF 1934
For the fiscal year ended December 31, 2021
or
☐ TRANSITION REPORT PURSUANT TO SECTION 13 OR 15(d) OF THE SECURITIES EXCHANGE ACT OF 1934
For the transition period from [ ] to [ ]
HIGHWOODS PROPERTIES, INC.
(Exact name of registrant as specified in its charter)
| | | | | | | | |
| Maryland | 001-13100 | 56-1871668 |
| (State or other jurisdiction of incorporation or organization) | (Commission File Number) | (I.R.S. Employer Identification Number) |
HIGHWOODS REALTY LIMITED PARTNERSHIP
(Exact name of registrant as specified in its charter)
| | | | | | | | |
| North Carolina | 000-21731 | 56-1869557 |
| (State or other jurisdiction of incorporation or organization) | (Commission File Number) | (I.R.S. Employer Identification Number) |
3100 Smoketree Court, Suite 600
Raleigh, NC 27604
(Address of principal executive offices) (Zip Code)
919-872-4924
(Registrants’ telephone number, including area code)
___________________
Securities registered pursuant to Section 12(b) of the Act:
| | | | | | | | |
| Title of Each Class | Trading Symbol(s) | Name of Each Exchange on Which Registered |
| Common Stock, $.01 par value, of Highwoods Properties, Inc. | HIW | New York Stock Exchange |
Securities registered pursuant to Section 12(g) of the Act:
NONE
Indicate by check mark if the registrant is a well-known seasoned issuer, as defined in Rule 405 of the Securities Act.
Highwoods Properties, Inc. Yes ☒ No ☐ Highwoods Realty Limited Partnership Yes ☒ No ☐
Indicate by check mark if the registrant is not required to file reports pursuant to Section 13 or Section 15(d) of the Act.
Highwoods Properties, Inc. Yes ☐ No ☒ Highwoods Realty Limited Partnership Yes ☐ No ☒
Indicate by check mark whether the registrant (1) has filed all reports required to be filed by Section 13 or 15(d) of the Securities Exchange Act of 1934 during the preceding 12 months (or for such shorter period that the registrant was required to file such reports), and (2) has been subject to such filing requirements for the past 90 days.
Highwoods Properties, Inc. Yes ☒ No ☐ Highwoods Realty Limited Partnership Yes ☒ No ☐
Indicate by check mark whether the registrant has submitted electronically every Interactive Data File required to be submitted pursuant to Rule 405 of Regulation S-T (§232.405 of this chapter) during the preceding 12 months (or for such shorter period that the registrant was required to submit such files).
Highwoods Properties, Inc. Yes ☒ No ☐ Highwoods Realty Limited Partnership Yes ☒ No ☐
Indicate by check mark whether the registrant is a large accelerated filer, an accelerated filer, a non-accelerated filer, a smaller reporting company, or an emerging growth company. See the definitions of “large accelerated filer,” “accelerated filer,” “smaller reporting company,” and “emerging growth company” in Rule 12b-2 of the Exchange Act.
Highwoods Properties, Inc.
Large accelerated filer ☒ Accelerated filer ☐ Non-accelerated filer ☐ Smaller reporting company ☐ Emerging growth company ☐
Highwoods Realty Limited Partnership
Large accelerated filer ☐ Accelerated filer ☐ Non-accelerated filer ☒ Smaller reporting company ☐ Emerging growth company ☐
If an emerging growth company, indicate by check mark if the registrant has elected not to use the extended transition period for complying with any new or revised financial accounting standards provided pursuant to Section 13(a) of the Exchange Act.
Highwoods Properties, Inc. ☐ Highwoods Realty Limited Partnership ☐
Indicate by check mark whether the registrant has filed a report on and attestation to its management’s assessment of the effectiveness of its internal control over financial reporting under Section 404(b) of the Sarbanes-Oxley Act (15 U.S.C. 7262(b)) by the registered public accounting firm that prepared or issued its audit report.
Highwoods Properties, Inc. ☒ Highwoods Realty Limited Partnership ☐
Indicate by check mark whether the registrant is a shell company (as defined in Rule 12b-2 of the Act).
Highwoods Properties, Inc. Yes ☐ No ☒ Highwoods Realty Limited Partnership Yes ☐ No ☒
The aggregate market value of shares of Common Stock of Highwoods Properties, Inc. held by non-affiliates (based upon the closing sale price on the New York Stock Exchange) on June 30, 2021 was approximately $4.6 billion. At January 28, 2022, there were 104,892,780 shares of Common Stock outstanding.
There is no public trading market for the Common Units of Highwoods Realty Limited Partnership. As a result, an aggregate market value of the Common Units of Highwoods Realty Limited Partnership cannot be determined.
DOCUMENTS INCORPORATED BY REFERENCE
Portions of the Proxy Statement of Highwoods Properties, Inc. to be filed in connection with its Annual Meeting of Stockholders to be held May 10, 2022 are incorporated by reference in Part II, Item 5 and Part III, Items 10, 11, 12, 13 and 14.
EXPLANATORY NOTE
We refer to Highwoods Properties, Inc. as the “Company,” Highwoods Realty Limited Partnership as the “Operating Partnership,” the Company’s common stock as “Common Stock” or “Common Shares,” the Company’s preferred stock as “Preferred Stock” or “Preferred Shares,” the Operating Partnership’s common partnership interests as “Common Units” and the Operating Partnership’s preferred partnership interests as “Preferred Units.” References to “we” and “our” mean the Company and the Operating Partnership, collectively, unless the context indicates otherwise.
The Company conducts its activities through the Operating Partnership and is its sole general partner. The partnership agreement provides that the Operating Partnership will assume and pay when due, or reimburse the Company for payment of, all costs and expenses relating to the ownership and operations of, or for the benefit of, the Operating Partnership. The partnership agreement further provides that all expenses of the Company are deemed to be incurred for the benefit of the Operating Partnership.
Certain information contained herein is presented as of January 28, 2022, the latest practicable date for financial information prior to the filing of this Annual Report.
This report combines the Annual Reports on Form 10-K for the period ended December 31, 2021 of the Company and the Operating Partnership. We believe combining the annual reports into this single report results in the following benefits:
•combined reports better reflect how management and investors view the business as a single operating unit;
•combined reports enhance investors’ understanding of the Company and the Operating Partnership by enabling them to view the business as a whole and in the same manner as management;
•combined reports are more efficient for the Company and the Operating Partnership and result in savings in time, effort and expense; and
•combined reports are more efficient for investors by reducing duplicative disclosure and providing a single document for their review.
To help investors understand the significant differences between the Company and the Operating Partnership, this report presents the following separate sections for each of the Company and the Operating Partnership:
•Item 9A - Controls and Procedures;
•Item 15 - Certifications of CEO and CFO Pursuant to Sections 302 and 906 of the Sarbanes-Oxley Act;
•Consolidated Financial Statements; and
•the following Notes to Consolidated Financial Statements:
•Note 11 - Equity; and
•Note 15 - Earnings Per Share and Per Unit.
HIGHWOODS PROPERTIES, INC.
HIGHWOODS REALTY LIMITED PARTNERSHIP
TABLE OF CONTENTS
| | | | | | | | |
| Item No. | | Page |
| PART I | |
| 1. | | |
| 1A. | | |
| 1B. | | |
| 2. | | |
| 3. | | |
| 4. | | |
| X. | | |
| | |
| PART II | |
| 5. | | |
| 7. | | |
| 7A. | | |
| 8. | | |
| 9. | | |
| 9A. | | |
| 9B. | | |
| 9C. | | |
| | |
| PART III | |
| 10. | | |
| 11. | | |
| 12. | | |
| 13. | | |
| 14. | | |
| | |
| PART IV | |
| 15. | | |
PART I
ITEM 1. BUSINESS
General
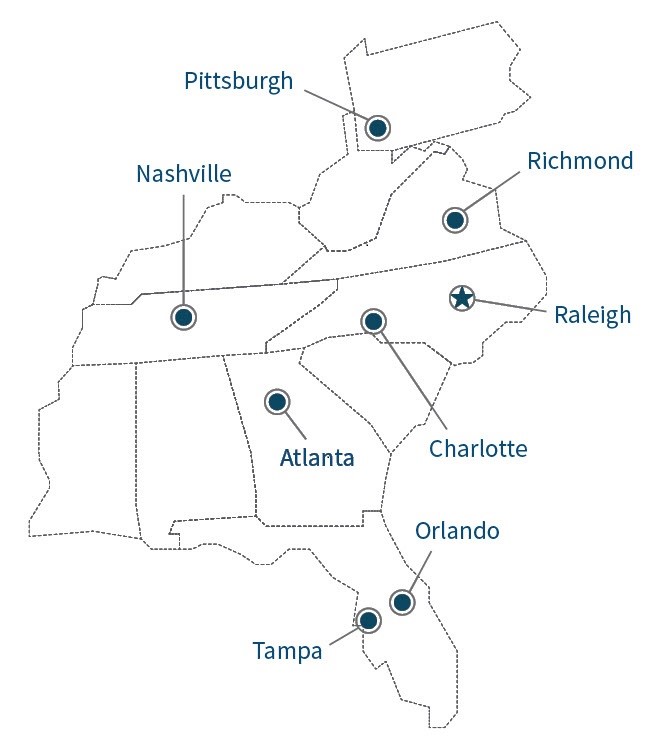
Highwoods Properties, Inc., headquartered in Raleigh, is a publicly-traded real estate investment trust (“REIT”). The Company is a fully integrated office REIT that owns, develops, acquires, leases and manages properties primarily in the best business districts (BBDs) of Atlanta, Charlotte, Nashville, Orlando, Pittsburgh, Raleigh, Richmond and Tampa. Our Common Stock is traded on the New York Stock Exchange (“NYSE”) under the symbol “HIW.”
At December 31, 2021, the Company owned all of the Preferred Units and 104.5 million, or 97.7%, of the Common Units in the Operating Partnership. Limited partners owned the remaining 2.5 million Common Units. Generally, the Operating Partnership is obligated to redeem each Common Unit at the request of the holder thereof for cash equal to the value of one share of Common Stock based on the average of the market price for the 10 trading days immediately preceding the notice date of such redemption, provided that the Company, at its option, may elect to acquire any such Common Units presented for redemption for cash or one share of Common Stock. The Common Units owned by the Company are not redeemable.
The Company was incorporated in Maryland in 1994. The Operating Partnership was formed in North Carolina in 1994. Our executive offices are located at 3100 Smoketree Court, Suite 600, Raleigh, NC 27604, and our telephone number is (919) 872-4924.
Our primary business is the operation, acquisition and development of office properties. There are no material inter-segment transactions. See Note 17 to our Consolidated Financial Statements for a summary of the rental and other revenues, net operating income and assets for each reportable segment.
Our website is www.highwoods.com. In addition to this Annual Report, all quarterly and current reports, proxy statements, interactive data and other information are made available, without charge, on our website as soon as reasonably practicable after they are filed or furnished with the Securities and Exchange Commission (“SEC”). Information on our website is not considered part of this Annual Report.
During 2021, the Company filed unqualified Section 303A certifications with the NYSE. The Company and the Operating Partnership have also filed the CEO and CFO certifications required by Sections 302 and 906 of the Sarbanes-Oxley Act of 2002 as exhibits to this Annual Report.
Our Strategy
We are in the work-placemaking business. We believe that in creating environments and experiences where the best and brightest can achieve together what they cannot apart, we can deliver greater value to our customers, their teammates and, in turn, our stockholders. Our simple strategy is to own and manage high-quality workplaces in the BBDs within our footprint, maintain a strong balance sheet to be opportunistic throughout economic cycles, employ a talented and dedicated team and communicate transparently with all stakeholders. We focus on owning and managing buildings in the most dynamic and vibrant BBDs. BBDs are highly-energized and amenitized workplace locations that enhance our customers’ ability to attract and retain talent. They are both urban and suburban. Providing the most talent-supportive workplace options in these environments is core to our work-placemaking strategy.
Our investment strategy is to generate attractive and sustainable returns over the long term for our stockholders by developing, acquiring and owning a portfolio of high-quality, differentiated office buildings in the BBDs of our core markets. A core component of this strategy is to continuously strengthen the financial and operational performance, resiliency and long-term growth prospects of our existing in-service portfolio and recycle out of those properties that no longer meet our criteria.
Since the beginning of 2019, we have acquired 3.1 million square feet of trophy office assets for a total investment of $1.3 billion, placed in service 1.8 million square feet of highly pre-leased new office development for a total investment of $691 million and sold 6.7 million square feet of non-core office and industrial assets for $992 million. This series of transactions included our exit from Greensboro and Memphis and entry into Charlotte, a higher-growth market with greater future upside opportunities.
Geographic Diversification. Our core portfolio consists primarily of office properties in Atlanta, Charlotte, Nashville, Orlando, Pittsburgh, Raleigh, Richmond and Tampa. We do not believe that our operations are significantly dependent upon any particular geographic market.
Conservative and Flexible Balance Sheet. We are committed to maintaining a conservative and flexible balance sheet with access to ample liquidity, multiple sources of debt and equity capital and sufficient availability under our revolving credit facility to fund our short and long-term liquidity requirements. Our balance sheet also allows us to proactively assure our existing and prospective customers that we are able to fund tenant improvements and maintain our properties in good condition while retaining the flexibility to capitalize on favorable development and acquisition opportunities as they arise.
Competition
Our properties compete for customers with similar properties located in our markets primarily on the basis of location, rent, services provided and the design, quality and condition of the facilities. We also compete with other domestic and foreign REITs, financial institutions, pension funds, partnerships, individual investors and others when attempting to acquire, develop and operate properties.
Environmental
We are firmly committed to our intrinsic and societal responsibility to routinely minimize all environmental impacts resulting from the development and operation of our properties. Our plan is to continue minimizing our energy intensity, carbon emissions and water consumption and strive to mitigate pollution, ensure environmental compliance and create healthy and productive workspaces for our customers and communities. To support and advance the environmental component of our ESG initiatives, we have formed a management-level corporate responsibility team that is overseen by the investment committee of the Company’s board of directors. The corporate responsibility team, comprised of a diverse group of disciplines including executive leadership, is charged with refining our ESG strategy, driving performance improvements across our portfolio and establishing and tracking progress towards goals. More information regarding our sustainability strategy and progress towards reaching our target goals is available in the Company’s Proxy Statement filed in connection with our annual meeting of stockholders and in our annual corporate responsibility report that can be found under the “Service Not Space/Sustainability” section of our website. Information on our website is not considered part of this Annual Report.
Government Regulation
We are subject to laws, rules and regulations of the United States and the states and local municipalities in which we operate, including laws and regulations relating to environmental protection and human health and safety. Compliance with these laws, rules and regulations has not had, and is not expected to have, a material effect on our capital expenditures, results of operations and competitive position as compared to prior periods. For more information about environmental laws and regulations, see “Item 1A. Risk Factors - Risks Related to our Operations - Costs of complying with governmental laws and regulations may adversely affect our results of operations.”
Information Security
We face risks associated with security breaches through cyber attacks, cyber intrusions or otherwise, as well as other significant disruptions of our information technology networks and related systems. The audit committee of the Company’s Board of Directors is responsible for overseeing management’s risk assessment and risk management processes designed to monitor and control information security risk. Management, including the Company’s chief information officer, regularly briefs the audit committee on information security matters. These briefings occur as often as needed, but in no event less than once a year. The Company’s chief information officer also regularly briefs management’s information technology steering committee, which includes the CEO and CFO.
We have adopted and implemented an approach to identify and mitigate information security risks that we believe is commercially reasonable for real estate companies, including some of the best practices of the National Institute of Standards and Technology cyber security framework. Since January 1, 2018, we have not experienced any information security breaches that resulted in any financial loss. We have a cyber risk insurance policy designed to help us mitigate risk exposure by offsetting costs involved with recovery and remediation after an information security breach or similar event. We regularly engage independent third parties to test our information security processes and systems as part of our overall enterprise risk management. We regularly conduct information security training to ensure all employees are aware of information security risks and to enable them to take steps to mitigate such risks. As part of this program, we also take reasonable steps to ensure any employee who may come into possession of confidential financial or health information has received appropriate information security awareness training.
Human Capital Resources
We focus our real estate activities in markets where we have extensive local knowledge and own a significant amount of assets. As a result, we operate division offices in Atlanta, Nashville, Orlando, Pittsburgh, Raleigh, Richmond and Tampa, which are led by seasoned real estate professionals with significant commercial real estate experience managing across multiple economic cycles. Shared corporate services, such as accounting, technology, development, asset management, marketing, human resources, legal and tax, are primarily based in Raleigh. Our senior leadership team, led by our CEO, is based in Raleigh and oversees all of the Company’s operations.
Fully-Integrated. Unlike some other REITs, which outsource the leasing, management, maintenance and/or customer service of their properties to third parties, we are a fully-integrated REIT that generally staffs the leasing, management, maintenance and customer service of our own portfolio. We believe being a fully-integrated REIT is in the best long-term interests of our stockholders for a number of reasons:
•in-house services generally allow us to better anticipate and respond to the many real-time demands of our existing and potential customer base;
•we are able to provide our customers with more cost-effective services such as build-to-suit construction and space modification, including tenant improvements and expansions;
•the depth and breadth of our capabilities and resources provide us with market information not generally available;
•operating efficiencies achieved through our fully-integrated organization provide a competitive advantage in servicing our properties, retaining existing customers and attracting new customers;
•we can ensure the consistent deployment of a comprehensive preventative maintenance program;
•our established detailed service request process creates chain of custody for a customer request and tracks status and response time, which enables proactive identification of any underperforming equipment and vital reconnaissance for process improvement and leverage when specifying all aspects of any new construction; and
•our first-hand relationships with our customers lead to better customer service and often result in customers seeking renewals and additional space.
Above all, being a fully-integrated REIT across these diverse functional areas gives us the benefit of engaging and responding to our customers’ needs as an owner versus a vendor. We believe this distinction, a core component of our Company’s value proposition, translates into improved customer service and higher customer retention.
We had 348 full-time employees as of December 31, 2021, 11 fewer than we had as of December 31, 2020. Over the past three years, our average annual turnover rate was 11%, substantially lower than the average national industry turnover rate of 24% as reported by the Bureau of Labor Statistics. Our turnover rate was 16% for 2021 largely due to the volatility in the job markets created by the ongoing COVID-19 pandemic. However, this was lower than the average national industry turnover rate of 26% and we have generally backfilled most of these positions. Moreover, through our efforts in providing internship and cooperative education opportunities for future real estate professionals, we have identified a pool of talented professionals capable of filling future hiring needs. As of December 31, 2021, the average tenure of our employees was 10.5 years and the average age was 49.8 years.
Approximately 71% of our employees work in one of our division offices, most of which are directly involved in the management and maintenance of our portfolio. These include property managers, maintenance engineers and technicians, HVAC technicians and project managers. Personnel salaries and related costs of employees directly involved in the management and maintenance of our portfolio are allocated to our portfolio and recorded as rental property and other expenses. Approximately 2% of our employees work in our corporate development department and are directly involved in our development pipeline. When applicable, personnel salaries and related costs of such development employees are capitalized as a development expenditure. Approximately 5% of our employees are leasing professionals principally responsible for leasing our portfolio. When applicable, commissions and related costs of such leasing employees are capitalized as a leasing expenditure. Generally, all other employee costs are recorded as general and administrative expenses. In 2021, the total cost of our workforce, including salaries, commissions, bonuses, equity and non-equity incentive compensation and employee benefits was approximately $59.6 million.
We continually conduct risk assessments of our human capital needs. Additionally, we prioritize succession planning across various levels of our Company to ensure seamless transitions as employees are promoted, retire or otherwise depart from their current positions. One of our most significant human capital risks, which has been identified by many employers in our markets and throughout the country, concerns an increasing shortage of trade professionals in the future, as there are fewer younger trade professionals entering the workforce to replace retiring workers. Approximately 32% of our employees are highly specialized and skilled trade professionals, such as maintenance engineers and technicians and HVAC technicians. The average age of our trade professionals is 52 years, which is approximately three years older than the average age of the remainder of our employee base. To proactively combat the potential future shortage of skilled trade professionals, we have partnered with local trade schools in some of our markets to implement an apprenticeship program to encourage and incentivize younger workers to obtain the technical skills necessary to become a trade professional. In turn, we hope this program will create a pipeline of future maintenance engineers and technicians and HVAC technicians to join our Company.
Total Rewards. We strive to provide career opportunities in an energized, inclusive and collaborative environment tailored to retain, attract and reward highly performing employees. We do so in a culture built on the foundations of collegiality, teamwork, hard work, humility, creativity, humor, respect, acceptance, expertise and dedication to each other, our stockholders and our customers.
Our total rewards program, which includes compensation and comprehensive benefits, is crafted to provide fair and competitive pay, insurance plans and other programs to facilitate an overall work-life balance. The program is designed to incentivize and reward employees and emphasize our commitment to exemplary work.
Our total rewards program is constructed to meet certain objectives, such as:
•Competitiveness: Compensate with fair pay for comparable jobs within the current labor market in which we compete for talent (none of our full-time employees earns less than $15.00 per hour);
•Fairness: Reward positive and successful achievements through a consistent pay-for-performance approach administered throughout our Company, including fair and equitable pay for all employees;
•Career: Communicate performance expectations and provide career enrichment and/or advancement opportunities to promote our long-term commitment to employees;
•Respect: Support a diverse and accepting team striving to maintain balance between career and personal life; and
•Culture: Create and preserve an environment where employees are acknowledged, honored and rewarded for hard work, creativity, energy, collegiality, teamwork, initiative and a measured drive to achieve all in an honest and respectful manner.
In addition to offering competitive salaries and wages, we offer comprehensive, locally relevant and innovative benefits to all eligible employees. These include, among other benefits:
•Comprehensive health insurance coverage;
•Attractive paid time off, including up to 25 vacation days (depending on tenure), two personal holidays, nine company-wide holidays, one volunteer day, sick leave and parental leave for all new caregivers;
•Competitive match on contributions to our 401(k) retirement savings plan, in which over 90% of our employees participate; and
•15% discount on purchasing Common Stock through our employee stock purchase plan, in which nearly 30% of our employees participate.
All employees are paid a base salary. Nearly 50% of employees are eligible to receive an annual bonus, which usually ranges from 5% to 30% of the employee’s base salary. All employees are also eligible to receive a discretionary bonus from time to time to incentivize and reward excellent performance. Approximately 15% to 20% of employees typically receive a discretionary bonus each year, which usually ranges from $200 to $2,000.
Approximately 8% of our employees, including officers, are also eligible to receive long-term equity incentive compensation. Equity incentive awards provide such employees with an ownership interest in our company and a direct and demonstrable stake in our success. Equity incentive awards for non-officer employees are comprised of time-based restricted stock, which serves as a retention tool to deter participants from seeking other employment opportunities. Time-based restricted stock vests ratably on an annual basis, generally over a four-year term, and if an employee receiving such stock leaves, unvested shares are immediately forfeited except in the event of death, disability or as otherwise provided in our retirement plan.
Other than as described below, we have no compensation policies or programs that reward employees solely on a transaction-specific basis.
We have a development cash incentive plan pursuant to which all employees, excluding executive officers, can receive a cash payout from a development incentive pool. The amount of funds available to be earned under the plan depends upon the timing and cash yields of a qualifying development project and is included in the pro forma budget for the project. Payouts under the plan have generally ranged from $1,000 to $10,000 but could be higher under certain circumstances.
We also pay our in-house leasing professionals commissions for signed leases. We believe such commissions, which are paid in cash, are comparable to what we would pay in commission fees to outside brokers.
We do not believe that we have compensation policies or practices that create risks that are reasonably likely to have a material adverse effect on our Company. For example, the development cash incentive program does not create an inappropriate risk because all development projects (inclusive of any such incentive compensation) must be approved in advance by our executive officers and, in most cases, the full board or the investment committee of our board, none of whom are eligible to receive such incentives. Likewise, the payment of leasing commissions does not create an inappropriate risk because amounts payable are derived from net effective cash rents (which deducts leasing capital expenditures and operating expenses) and leases must be executed by an officer of our Company, none of whom is eligible to receive such commissions. Generally, lease transactions of a particular size or that contain terms or conditions that exceed certain guidelines also must be approved in advance by our senior leadership team. Additionally, we have an internal guideline whereby customers that account for more than 3% of our annualized revenues are periodically reviewed with the board. As of December 31, 2021, only the Federal Government (4.0%) and Bank of America (3.7%) accounted for more than 3% of our annualized cash revenues.
Health and Safety. Primarily because many of our employees are involved with the management and maintenance of our own portfolio, we have robust health and safety processes and training protocols designed to mitigate workplace incidents, risks and hazards. Among other things, we routinely conduct:
•regulatory-required training of affected employees regarding OSHA compliance;
•training on fire and life safety systems affecting our buildings and building systems;
•training on emergency response procedures affecting our people, our buildings and our customers;
•simulations and table-top exercises to ensure our crisis management and business continuity plans are effective; and
•training on pandemic safety affecting our people, our buildings and our customers.
Employee Well-being. We believe a resilient portfolio starts with having resilient employees. Our well-being initiatives focus on the “whole person,” as we are concerned not only for the on-the-job health and safety of our employees, but also for their ability to lead healthy and productive personal lives. To that end, we have established wellness committees in each of our divisions and have a “HIW Well-being” program to promote holistic well-being. Our health benefit plans are designed to improve the overall health of our employees by decreasing costs and improving access to quality healthcare.
Employee Empowerment. While we own and operate a collection of high-quality office assets, we believe our team of dedicated real estate professionals is also critically important to our success. Over the past five years, by simplifying and streamlining our operations, we have reduced our overall headcount by nearly 100. This right-sizing of our employee base has created, and will continue to create, opportunities for individual career growth. The Company has long demonstrated a commitment to individual career growth. For example, nearly one-third of our current employees have had significant career advancement during their tenure with us. Through periodic career conversations that are held at least once a year with our employees, we create an environment that fosters and encourages an “ownership” mentality throughout our Company and empowers our employees to continuously seek new and better ways of doing business, particularly in light of the disruptions created by the COVID-19 pandemic.
In addition to supporting the career growth of our employees, we also seek to grow as an employer. We periodically solicit feedback from our employees through the use of employee engagement surveys to monitor and improve employee satisfaction in order to retain and recruit a talented workforce. During 2021, we surveyed all of our employees with respect to diversity and inclusion and many of our employees with respect to work environment satisfaction. During 2022, we plan to conduct an engagement survey.
Diversity and Inclusion. Diversity and inclusion is a core value for our Company. We strive to create a diverse and inclusive environment in an authentic and meaningful way. We are an equal opportunity employer, with all qualified applicants receiving consideration for employment without regard to race, color, religion, sex, sexual orientation, gender identity, national origin, disability or protected veteran status. As of December 31, 2021, 36% of our employees were female and 21% of our employees were persons of color. Of the new employees hired during 2021, 42% were female and 26% were persons of color.
We have a robust diversity and inclusion program, called the “Heart of Highwoods,” with the overall goal of creating opportunities for all people in the commercial real estate industry, in the local communities in which we operate and among our own teammates at the Company. First, like all federal government contractors, we have established goals and methods to be sure we are providing opportunities to small and minority vendors to compete for work with our Company. Second, we are providing opportunities for our employees to volunteer within their communities through the recently added paid volunteer time off benefit and an additional paid holiday on Martin Luther King, Jr. Day, a national day of service. Third, in response to listening sessions held with our employees, we formed a diversity and inclusion group, called the “DIG.” The DIG is made up of employees selected through an application process who advocate for diversity and inclusion throughout our Company. In 2021, the DIG focused on creating relationships with local schools that support disadvantaged and minority students, anonymously surveying our employees on diversity and inclusion topics, and creating clear Company-wide communication.
ITEM 1A. RISK FACTORS
An investment in our securities involves various risks. Investors should carefully consider the following risk factors in conjunction with the other information contained in this Annual Report before trading in our securities. If any of these risks actually occur, our business, results of operations, prospects and financial condition could be adversely affected.
Risks Related to the COVID-19 Pandemic
The COVID-19 pandemic and its ongoing impact on the U.S. economy could materially and adversely impact or disrupt our financial condition, results of operations, cash flows and performance. The COVID-19 pandemic has had, and another pandemic in the future could have, repercussions across regional and global economies and financial markets. The spread of COVID-19 in many countries, including the United States, has significantly adversely impacted global economic activity and has contributed to significant volatility in financial markets. The global impact of the pandemic has been rapidly evolving and many countries, including the United States, continue to react by restricting many business and travel activities,
mandating the partial or complete closures of certain business and schools and taking other actions to mitigate the spread of the virus, most of which have a disruptive effect on economic activity, including the use of and demand for office space. Many private businesses, including some of our customers, continue to recommend or mandate some or all of their employees work from home or are rotating employees in and out of the office to encourage social distancing in the workplace. Due to these events, during 2021, the usage of our assets and parking and parking-related revenues remained lower than pre-pandemic levels.
We cannot predict when, if and to what extent these restrictions and other actions will end and when, if and to what extent economic activity, including the use of and demand for office space, will return to pre-pandemic levels. The COVID-19 pandemic is negatively impacting almost every industry directly or indirectly, including industries in which we and our customers operate.
The COVID-19 pandemic, or a future pandemic, could also have material and adverse effects on our ability to successfully operate and on our financial condition, results of operations and cash flows due to, among other factors:
•the reduced economic activity, from circumstances such as a complete or partial closure of one or more of our properties, could severely impact our customers’ businesses, financial condition and liquidity and may cause one or more of our customers to be unable to meet their obligations to us in full, or at all, or to otherwise seek modifications of such obligations;
•the reduced economic activity could negatively impact our prospects for leasing additional space and/or renewing leases with existing customers;
•severe disruption and instability in the global financial markets, negative impacts to our credit ratings and deteriorations in credit and financing conditions may affect our ability to access debt and equity capital on attractive terms, or at all, resulting in an inability to fund our business operations, including funding our development pipeline or addressing maturing liabilities on a timely basis, and such an environment may affect our customers’ ability to fund their business operations and meet their obligations to us;
•the financial impact of the COVID-19 pandemic could negatively impact our future compliance with financial covenants of our revolving credit facility and other debt agreements and result in a default and potentially an acceleration of repayment of indebtedness, which in turn could negatively impact our ability to make additional borrowings under our revolving credit facility and pay dividends, among other things;
•weaker economic conditions due to the pandemic could require us to recognize future impairment losses;
•a deterioration in our or our customers’ ability to operate in affected areas or delays in the supply of products or services to us or our customers from vendors that are needed for our or our customers’ operations could adversely affect our operations and those of our customers;
•potential changes in customer behavior, such as the continued social acceptance, desirability and perceived economic benefits of work-from-home arrangements, could materially and negatively impact the future demand for office space over the long-term even after the pandemic subsides; and
•the potential negative impact on the health of our employees, particularly if a significant number of them are impacted, could result in a deterioration in our ability to ensure business continuity during this disruption.
The extent to which the COVID-19 pandemic impacts our operations and those of our customers will depend on future circumstances, which are highly uncertain and cannot be predicted with confidence, including the scope, severity and duration of the pandemic and its resulting impact on economic activity, the actions taken to contain the pandemic or mitigate its impact, and the direct and indirect economic, social and behavioral effects of the pandemic and containment measures, among others. Financial difficulties experienced by our customers, including the potential for bankruptcies or other early terminations of their leases, could reduce our cash flows, which could impact our ability to continue paying dividends to our stockholders at expected levels or at all. Moreover, many of the other risk factors set forth in this Annual Report should be interpreted as heightened risks as a result of the impact of the COVID-19 pandemic.
Risks Related to our Operations
Adverse economic conditions in our markets that negatively impact the demand for office space, such as high unemployment, may result in lower occupancy and rental rates for our portfolio, which would adversely affect our results of operations. Our operating results depend heavily on successfully leasing and operating the office space in our portfolio. Economic growth and office employment levels in our core markets are important factors, among others, in predicting our future operating results.
The key components affecting our rental and other revenues are average occupancy, rental rates, cost recovery income, new developments placed in service, acquisitions and dispositions. Average occupancy generally increases during times of improving economic growth, as our ability to lease space outpaces vacancies that occur upon the expirations of existing leases. Average occupancy generally declines during times of slower or negative economic growth, when new vacancies tend to outpace our ability to lease space. In addition, the timing of changes in occupancy levels tends to lag the timing of changes in overall economic activity and employment levels. Occupancy in our office portfolio increased from 90.3% at December 31, 2020 to 91.2% at December 31, 2021. Average occupancy in future periods will be lower, perhaps significantly lower, if the COVID-19 pandemic causes vacancies and move-outs due to potential changes in customer behavior, such as the continued social acceptance, desirability and perceived economic benefits of work-from-home arrangements, which could materially and negatively impact the future demand for office space over the long-term. For additional information regarding our average occupancy and rental rate trends over the past five years, see “Item 2. Properties.” Lower rental revenues that result from lower average occupancy or lower rental rates with respect to our same property portfolio will adversely affect our results of operations unless offset by the impact of any newly acquired or developed properties or lower variable operating expenses, general and administrative expenses and/or interest expense.
We face considerable competition in the leasing market and may be unable to renew existing leases or re-let space on terms similar to the existing leases, or we may spend significant capital in our efforts to renew and re-let space, which may adversely affect our results of operations. In addition to seeking to increase our average occupancy by leasing current vacant space, we also concentrate our leasing efforts on renewing existing leases. Because we compete with a number of other developers, owners and operators of office and office-oriented, mixed-use properties, we may be unable to renew leases with our existing customers and, if our current customers do not renew their leases, we may be unable to re-let the space to new customers. To the extent that we are able to renew existing leases or re-let such space to new customers, heightened competition resulting from adverse market conditions may require us to utilize rent concessions and tenant improvements to a greater extent than we anticipate or have historically. Further, changes in space utilization by our customers due to technology, economic conditions, business culture and/or a need for less space due to the increasing prevalence of work-from-home arrangements by certain employers also affect the occupancy of our properties. As a result, customers may seek to downsize by leasing less space from us upon any renewal.
If our competitors offer space at rental rates below current market rates or below the rental rates we currently charge our customers, we may lose existing and potential customers, and we may be pressured to reduce our rental rates below those we currently charge in order to retain customers upon expiration of their existing leases. Even if our customers renew their leases or we are able to re-let the space, the terms and other costs of renewal or re-letting, including the cost of required renovations, increased tenant improvement allowances, leasing commissions, reduced rental rates and other potential concessions, may be less favorable than the terms of our current leases and could require significant capital expenditures. From time to time, we may also agree to modify the terms of existing leases to incentivize customers to renew their leases. If we are unable to renew leases or re-let space in a reasonable time, or if our rental rates decline or our tenant improvement costs, leasing commissions or other costs increase, our financial condition and results of operations would be adversely affected.
Difficulties or delays in renewing leases with large customers or re-leasing space vacated by large customers could materially impact our results of operations. Our 20 largest customers account for a meaningful portion of our revenues. See “Item 2. Properties - Customers” and “Item 2. Properties - Lease Expirations.” There are no assurances that these customers, or any of our other large customers, will renew all or any of their space upon expiration of their current leases.
Some of our leases provide customers with the right to terminate their leases early, which could have an adverse effect on our financial condition and results of operations. Certain of our leases permit our customers to terminate their leases as to all or a portion of the leased premises prior to their stated lease expiration dates under certain circumstances, such as providing notice by a certain date and, in many cases, paying a termination fee. To the extent that our customers exercise early termination rights, our results of operations will be adversely affected, and we can provide no assurances that we will be able to generate an equivalent amount of net effective rent by leasing the vacated space to others.
Our results of operations and financial condition could be adversely affected by financial difficulties experienced by a major customer, or by a number of smaller customers, including bankruptcies, insolvencies or general downturns in business. Our operations depend on the financial stability of our customers. A default by a significant customer on its lease payments would cause us to lose the revenue and any other amounts due under such lease. In the event of a customer default or bankruptcy (including as a result of the COVID-19 pandemic), we may experience delays in enforcing our rights as landlord and may incur substantial costs re-leasing the property. We cannot evict a customer solely because of its bankruptcy. On the other hand, a court might authorize the customer to reject and terminate its lease. In such case, our claim against the bankrupt customer for unpaid, future rent would be subject to a statutory cap that might be substantially less than the remaining rent actually owed under the lease. As a result, our claim for unpaid rent would likely not be paid in full and we may be required to write-off deferred leasing costs and recognize credit losses on accrued straight-line rents receivable. These events could adversely impact our financial condition and results of operations.
An oversupply of space in our markets often causes rental rates and occupancies to decline, making it more difficult for us to lease space at attractive rental rates, if at all. Undeveloped land in many of the markets in which we operate is generally more readily available and less expensive than in higher barrier-to-entry markets such as New York and San Francisco. As a result, even during times of positive economic growth, we and/or our competitors could construct new buildings that would compete with our existing properties. Any such oversupply could result in lower occupancy and rental rates in our portfolio, which would have a negative impact on our results of operations.
In order to maintain and/or increase the quality of our properties and successfully compete against other properties, we regularly must spend money to maintain, repair, renovate and improve our properties, which could negatively impact our financial condition and results of operations. If our properties are not as attractive to customers as properties owned by our competitors due to physical condition, lack of suitable nearby amenities or other similar factors, we could lose customers or suffer lower rental rates. As a result, we may from time to time make significant capital expenditures to maintain or enhance the competitiveness of our properties. There can be no assurances that any such expenditures would result in higher occupancy or higher rental rates or deter existing customers from relocating to properties owned by our competitors.
Costs of complying with governmental laws and regulations may adversely affect our results of operations. All real property and the operations conducted on real property are subject to federal, state and local laws and regulations relating to environmental protection and human health and safety. Some of these laws and regulations may impose joint and several liability on customers, owners or operators for the costs to investigate or remediate contaminated properties, regardless of fault or whether the acts causing the contamination were legal. In addition, the presence of hazardous substances, or the failure to properly remediate these substances, may hinder our ability to sell, rent or pledge such property as collateral for future borrowings.
Compliance with new laws or regulations or stricter interpretation of existing laws may require us to incur significant expenditures. Future laws or regulations may impose significant environmental liability. Additionally, our customers’ operations, operations in the vicinity of our properties, such as the presence of underground storage tanks, or activities of unrelated third parties may affect our properties. In addition, there are various local, state and federal fire, health, life-safety and similar regulations with which we may be required to comply and that may subject us to liability in the form of fines or damages for noncompliance. Any expenditures, fines or damages we must pay would adversely affect our results of operations. Proposed legislation to address climate change could increase utility and other costs of operating our properties.
Discovery of previously undetected environmentally hazardous conditions may adversely affect our financial condition and results of operations. Under various federal, state and local environmental laws and regulations, a current or previous property owner or operator may be liable for the cost to remove or remediate hazardous or toxic substances on such property. These costs could be significant. Such laws often impose liability whether or not the owner or operator knew of, or was responsible for, the presence of such hazardous or toxic substances. Environmental laws also may impose restrictions on the manner in which property may be used or businesses may be operated, and these restrictions may require significant expenditures or prevent us from entering into leases with prospective customers that may be impacted by such laws. Environmental laws provide for sanctions for noncompliance and may be enforced by governmental agencies or private parties. Certain environmental laws and common law principles could be used to impose liability for release of and exposure to hazardous substances, including asbestos-containing materials. Third parties may seek recovery from real property owners or operators for personal injury or property damage associated with exposure to released hazardous substances. The cost of defending against claims of liability, of complying with environmental regulatory requirements, of remediating any contaminated property, or of paying personal injury claims could adversely affect our financial condition and results of operations.
Our same property results of operations would suffer if costs of operating our properties, such as real estate taxes, utilities, insurance, maintenance and other costs, rise faster than our ability to increase rental revenues and/or cost
recovery income. While we receive additional rent from our customers that is based on recovering a portion of operating expenses, increased operating expenses will negatively impact our results of operations. Our revenues, including cost recovery income, are subject to longer-term leases and may not be quickly increased sufficient to recover an increase in operating costs and expenses. Furthermore, the costs associated with owning and operating a property are not necessarily reduced when circumstances such as market factors and competition cause a reduction in rental revenues from the property. Increases in same property operating expenses would adversely affect our results of operations unless offset by higher rental rates, higher cost recovery income, the impact of any newly acquired or developed properties, lower general and administrative expenses and/or lower interest expense.
Natural disasters and climate change could have an adverse impact on our cash flow and operating results. Climate change may add to the unpredictability and frequency of natural disasters and severe weather conditions and create additional uncertainty as to future trends and exposures. Many of our buildings are located in areas that are subject to natural disasters and severe weather conditions such as hurricanes, earthquakes, droughts, snow storms, floods and fires. The impact of climate change or the occurrence of natural disasters can delay new development projects, increase investment costs to repair or replace damaged properties, increase operating costs, create additional investment costs to make improvements to existing properties to comply with climate change regulations or otherwise reduce the carbon footprint of our portfolio, increase future property insurance costs and negatively impact the demand for office space.
Our insurance coverage on our properties may be inadequate. We carry insurance on all of our properties, including insurance for liability, fire, windstorms, floods, earthquakes, environmental concerns and business interruption. Insurance companies, however, limit or exclude coverage against certain types of losses, such as losses due to terrorist acts, named windstorms, earthquakes and toxic mold. Thus, we may not have insurance coverage, or sufficient insurance coverage, against certain types of losses and/or there may be decreases in the insurance coverage available. Should an uninsured loss or a loss in excess of our insured limits occur, we could lose all or a portion of the capital we have invested in a property or properties, as well as the anticipated future operating income from the property or properties. If any of our properties were to experience a catastrophic loss, it could disrupt our operations, delay revenue, result in large expenses to repair or rebuild the property and/or damage our reputation among our customers and investors generally. Further, if any of our insurance carriers were to become insolvent, we would be forced to replace the existing insurance coverage with another suitable carrier, and any outstanding claims would be at risk for collection. In such an event, we cannot be certain that we would be able to replace the coverage at similar or otherwise favorable terms. Such events could adversely affect our results of operations and financial condition.
We have obtained title insurance policies for each of our properties, typically in an amount equal to its original purchase price. However, these policies may be for amounts less than the current or future values of our properties, particularly for land parcels on which we subsequently construct a building. In such event, if there is a title defect relating to any of our properties, we could lose some of the capital invested in and anticipated profits from such properties.
Failure to comply with Federal government contractor requirements could result in substantial costs and loss of substantial revenue. We are subject to compliance with a wide variety of complex legal requirements because we are a Federal government contractor. These laws regulate how we conduct business, require us to administer various compliance programs and require us to impose compliance responsibilities on some of our contractors. Our failure to comply with these laws could subject us to fines and penalties, cause us to be in default of our leases and other contracts with the Federal government and bar us from entering into future leases and other contracts with the Federal government.
We face risks associated with security breaches through cyber attacks, cyber intrusions or otherwise, as well as other significant disruptions of our information technology (“IT”) networks and related systems. We face risks associated with security breaches, whether through cyber attacks or cyber intrusions over the Internet, malware, computer viruses, attachments to e-mails, persons inside our organization or persons with access to systems inside our organization, and other significant disruptions of our IT networks and related systems. The risk of a security breach or disruption, particularly through cyber attack or cyber intrusion, including by computer hackers, foreign governments and cyber terrorists, has generally increased as the number, intensity and sophistication of attempted attacks and intrusions from around the world have increased. Our IT networks and related systems are essential to the operation of our business and our ability to perform day-to-day operations (including managing our building systems) and, in some cases, may be critical to the operations of certain of our customers. Although we make efforts to maintain the security and integrity of these types of IT networks and related systems, and we have implemented various measures to manage the risk of a security breach or disruption, there can be no assurance that our security efforts and measures will be effective or that attempted security breaches or disruptions would not be successful or damaging. Even the most well protected information, networks, systems and facilities remain potentially vulnerable because the techniques used in such attempted security breaches evolve and generally are not recognized until launched against a target, and in some cases are designed not to be detected and, in fact, may not be detected. Accordingly, we may be unable to anticipate
these techniques or to implement adequate security barriers or other preventative measures, and thus it is impossible for us to entirely mitigate this risk.
A security breach or other significant disruption involving our IT networks and related systems could:
•disrupt the proper functioning of our networks and systems and therefore our operations and/or those of certain of our customers;
•result in misstated financial reports, violations of loan covenants, missed reporting deadlines and/or missed permitting deadlines;
•result in our inability to properly monitor our compliance with the rules and regulations regarding our qualification as a REIT;
•result in the unauthorized access to, and destruction, loss, theft, misappropriation or release of, proprietary, confidential, sensitive or otherwise valuable information of ours or others, which others could use to compete against us or which could expose us to damage claims by third-parties for disruptive, destructive or otherwise harmful purposes and outcomes;
•result in our inability to maintain the building systems relied upon by our customers for the efficient use of their leased space;
•require significant management attention and resources to remedy any damages that result;
•subject us to claims for breach of contract, damages, credits, penalties or termination of leases or other agreements; or
•damage our reputation among our customers and investors generally.
Additionally, we face potential heightened cybersecurity risks during the COVID-19 pandemic as our level of dependence on our IT networks and related systems increases, stemming from employees working remotely, and the number of malware campaigns and phishing attacks preying on the uncertainties surrounding the COVID-19 pandemic increases. These heightened cybersecurity risks may increase our vulnerability to cyber attacks and cause disruptions to our internal control procedures.
Any or all of the foregoing could have a material adverse effect on our results of operations, financial condition and cash flows.
Risks Related to our Capital Recycling Activity
Recent and future acquisitions and development properties may fail to perform in accordance with our expectations and may require renovation and development costs exceeding our estimates. In the normal course of business, we typically evaluate potential acquisitions, enter into non-binding letters of intent, and may, at any time, enter into contracts to acquire additional properties. Acquired properties may fail to perform in accordance with our expectations due to lease-up risk, renovation cost risks and other factors. In addition, the renovation and improvement costs we incur in bringing an acquired property up to our standards may exceed our original estimates. We may not have the financial resources to make suitable acquisitions or renovations on favorable terms or at all.
Further, we face significant competition for attractive investment opportunities from an indeterminate number of other real estate investors, including investors with significantly greater capital resources and access to capital than we have, such as domestic and foreign corporations and financial institutions, publicly-traded and privately-held REITs, private institutional investment funds, investment banking firms, life insurance companies and pension funds. Moreover, owners of office properties may be reluctant to sell, resulting in fewer acquisition opportunities. As a result of such increased competition and limited opportunities, we may be unable to acquire additional properties or the purchase price of such properties may be significantly elevated, which would reduce our expected return from making any such acquisitions.
In addition to acquisitions, we periodically consider developing or re-developing properties. Risks associated with development and re-development activities include:
•the unavailability of favorable financing;
•construction costs exceeding original estimates;
•construction and lease-up delays resulting in increased debt service expense and construction costs; and
•lower than anticipated occupancy rates and rents causing a property to be unprofitable or less profitable than originally estimated.
Development and re-development activities are also subject to risks relating to our ability to obtain, or delays in obtaining, any necessary zoning, land-use, building, occupancy and other required governmental and utility company authorizations. Further, we hold and expect to continue to acquire non-income producing land for future development. See “Item 2. Properties - Land Held for Development.” No assurances can be provided as to when, if ever, we will commence development projects on such land or if any such development projects would be on favorable terms. The fixed costs of acquiring and owning development land, such as the ongoing payment of property taxes, adversely affects our results of operations until such land is either placed in service or sold.
Illiquidity of real estate investments and the tax effect of dispositions could significantly impede our ability to sell assets or respond to favorable or adverse changes in the performance of our properties. Because real estate investments are relatively illiquid, our ability to promptly sell one or more properties in our portfolio in response to changing economic, financial and investment conditions is limited. We intend to continue to sell some of our properties in the future as part of our investment strategy and activities. However, we cannot predict whether we will be able to sell any property for the price or on the terms set by us, or whether the price or other terms offered by a prospective purchaser would be acceptable to us. We also cannot predict the length of time needed to find a willing purchaser and close the sale of a property.
Certain of our properties have low tax bases relative to their estimated current market values, and accordingly, the sale of such assets would generate significant taxable gains unless we sold such properties in a tax-deferred exchange under Section 1031 of the Internal Revenue Code or another tax-free or tax-deferred transaction. For an exchange to qualify for tax-deferred treatment under Section 1031, the net proceeds from the sale of a property must be held by an escrow agent until applied toward the purchase of real estate qualifying for gain deferral. Given the competition for properties meeting our investment criteria, there could be a delay in reinvesting such proceeds or we may be unable to reinvest such proceeds at all. Any delay or limitation in using the reinvestment proceeds to acquire additional income producing assets could adversely affect our near-term results of operations. Additionally, in connection with tax-deferred 1031 transactions, our restricted cash balances may be commingled with other funds being held by any such escrow agent, which subjects our balance to the credit risk of the institution. If we sell properties outright in taxable transactions, we may elect to distribute some or all of the taxable gain to our stockholders under the requirements of the Internal Revenue Code for REITs, which in turn could negatively affect our future results of operations and may increase our leverage. If a transaction’s gain that is intended to qualify as a Section 1031 deferral is later determined to be taxable, we may face adverse consequences, and if the laws applicable to such transactions are amended or repealed, we may not be able to dispose of properties on a tax-deferred basis.
Our use of joint ventures may limit our flexibility with jointly owned investments. From time to time, we own, develop and acquire properties in joint ventures with other persons or entities when circumstances warrant the use of these structures. Types of joint venture investments include noncontrolling ownership interests in entities such as partnerships and limited liability companies and tenant-in-common interests in which we own less than 100% of the undivided interests in a real estate asset. Our participation in joint ventures is subject to the risks that:
•we could become engaged in a dispute with any of our joint venture partners that might affect our ability to develop or operate a property;
•our joint ventures are subject to debt and the refinancing of such debt may require equity capital calls;
•our joint venture partners may default on their obligations necessitating that we fulfill their obligation ourselves;
•our joint venture partners may have different objectives than we have regarding the appropriate timing and terms of any renovation, sale or refinancing of properties;
•our joint venture partners may be structured differently than us for tax purposes, which could create conflicts of interest; and
•we or our joint venture partners may have competing interests in our markets that could create conflicts of interest.
Risks Related to our Financing Activities
Our use of debt could have a material adverse effect on our financial condition and results of operations. We are subject to risks associated with debt financing, such as the sufficiency of cash flow to meet required payment obligations, ability to comply with financial ratios and other covenants and the availability of capital to refinance existing indebtedness or fund important business initiatives. If we breach covenants in our debt agreements, the lenders can declare a default and, if the debt is secured, can take possession of the property securing the defaulted loan. In addition, certain of our unsecured debt agreements contain cross-default provisions giving the unsecured lenders the right to declare a default if we are in default under more than $35.0 million with respect to other loans in some circumstances. Unwaived defaults under our debt agreements could materially and adversely affect our financial condition and results of operations.
Further, we obtain credit ratings from Moody’s Investors Service and Standard and Poor’s Rating Services based on their evaluation of our creditworthiness. These agencies’ ratings are based on a number of factors, some of which are not within our control. In addition to factors specific to our financial strength and performance, the rating agencies also consider conditions affecting REITs generally. We cannot assure you that our credit ratings will not be downgraded. If our credit ratings are downgraded or other negative action is taken, we could be required, among other things, to pay additional interest and fees on outstanding borrowings under our revolving credit facility and bank term loans.
We generally do not intend to reserve funds to retire existing debt upon maturity. We may not be able to repay, refinance or extend any or all of our debt at maturity or upon any acceleration. If any refinancing is done at higher interest rates, the increased interest expense would adversely affect our cash flow and ability to pay distributions. Any such refinancing could also impose tighter financial ratios and other covenants that restrict our ability to take actions that could otherwise be in our best interest, such as funding new development activity, making opportunistic acquisitions, repurchasing our securities or paying distributions. If we do not meet our mortgage financing obligations, any properties securing such indebtedness could be foreclosed on.
We depend on our revolving credit facility for working capital purposes and for the short-term funding of our development and acquisition activity and, in certain instances, the repayment of other debt upon maturity. Our ability to borrow under the revolving credit facility also allows us to quickly capitalize on opportunities at short-term interest rates. If our lenders default under their obligations under the revolving credit facility or we become unable to borrow additional funds under the facility for any reason, we would be required to seek alternative equity or debt capital, which could be more costly and adversely impact our financial condition. If such alternative capital were unavailable, we may not be able to make new investments and could have difficulty repaying other debt.
Increases in interest rates would increase our interest expense. At December 31, 2021, we had $220.0 million of variable rate debt outstanding not protected by interest rate hedge contracts. We may incur additional variable rate debt in the future. If interest rates increase, then so would the interest expense on our unhedged variable rate debt, which would adversely affect our financial condition and results of operations. From time to time, we manage our exposure to interest rate risk with interest rate hedge contracts that effectively fix or cap a portion of our variable rate debt. In addition, we utilize fixed rate debt at market rates. If interest rates decrease, the fair market value of any existing interest rate hedge contracts or outstanding fixed-rate debt would decline.
Our efforts to manage these exposures may not be successful. Our use of interest rate hedge contracts to manage risk associated with interest rate volatility may expose us to additional risks, including a risk that a counterparty to a hedge contract may fail to honor its obligations. Developing an effective interest rate risk strategy is complex and no strategy can completely insulate us from risks associated with interest rate fluctuations. There can be no assurance that our hedging activities will have the desired beneficial impact on our results of operations or financial condition. Termination of interest rate hedge contracts typically involves costs, such as transaction fees or breakage costs.
Our revolving credit facility and bank term loans currently bear interest at a spread above LIBOR. The Financial Conduct Authority (“FCA”) that regulates LIBOR intends to stop compelling banks to submit rates for the calculation of LIBOR at some point in the future. As a result, a committee formed by the Federal Reserve Board and the Federal Reserve Bank of New York identified the Secured Overnight Financing Rate (“SOFR”) as its preferred alternative to LIBOR in financial contracts. We are not able to predict when LIBOR will cease to be available or when there will be sufficient liquidity in the SOFR markets. If and when LIBOR is discontinued, our revolving credit facility and term loans will transition the reference rate under our variable rate debt from LIBOR to SOFR, which could be challenging and adversely affect our interest expense.
Risks Related to our Status as a REIT
The Company may be subject to taxation as a regular corporation if it fails to maintain its REIT status, which could have a material adverse effect on the Company’s stockholders and on the Operating Partnership. We may be subject to adverse consequences if the Company fails to continue to qualify as a REIT for federal income tax purposes. While we intend to operate in a manner that will allow the Company to continue to qualify as a REIT, we cannot provide any assurances that the Company will remain qualified as such in the future, which could have particularly adverse consequences to the Company’s stockholders. Many of the requirements for taxation as a REIT are highly technical and complex and depend upon various factual matters and circumstances that may not be entirely within our control. The fact that the Company holds its assets through the Operating Partnership and its subsidiaries further complicates the application of the REIT requirements. Even a technical or inadvertent mistake could jeopardize our REIT status. Furthermore, Congress and the Internal Revenue Service might change the tax laws and regulations and the courts might issue new rulings that make it more difficult, or impossible, for the Company to remain qualified as a REIT. If the Company fails to qualify as a REIT, it would (a) not be allowed a deduction for dividends paid to stockholders in computing its taxable income, (b) be subject to federal income tax at regular corporate rates (and state and local taxes) and (c) unless entitled to relief under the tax laws, not be able to re-elect REIT status until the fifth calendar year after it failed to qualify as a REIT. Additionally, the Company would no longer be required to make distributions. As a result of these factors, the Company’s failure to qualify as a REIT could impair our ability to expand our business and adversely affect the price of our Common Stock.
Even if we remain qualified as a REIT, we may face other tax liabilities that adversely affect our financial condition and results of operations. Even if we remain qualified for taxation as a REIT, we may be subject to certain federal, state and local taxes on our income and assets, including taxes on any undistributed income, tax on income from some activities conducted as a result of a foreclosure, and state or local income, property and transfer taxes. In addition, our taxable REIT subsidiary is subject to regular corporate federal, state and local taxes. Any of these taxes would adversely affect our financial condition and results of operations.
Complying with REIT requirements may cause us to forego otherwise attractive opportunities or liquidate otherwise attractive investments. To remain qualified as a REIT for federal income tax purposes, we must continually satisfy tests concerning, among other things, the sources of our income, the nature and diversification of our assets, the amounts we distribute to our stockholders and the ownership of our capital stock. In order to meet these tests, we may be required to forego investments we might otherwise make. Compliance with the REIT requirements may limit our growth prospects.
In particular, we must ensure that at the end of each calendar quarter, at least 75% of the value of our assets consists of cash, cash items, government securities and qualified real estate assets. The remainder of our investment in securities (other than government securities, securities of taxable REIT subsidiaries and qualified real estate assets) generally cannot include more than 10% of the outstanding voting securities of any one issuer or more than 10% of the total value of the outstanding securities of any one issuer. In addition, in general, no more than 5% of the value of our assets (other than government securities, securities of taxable REIT subsidiaries and qualified real estate assets) can consist of the securities of any one issuer, and no more than 25% of the value of our total assets can be represented by the securities of one or more taxable REIT subsidiaries. If we fail to comply with these requirements at the end of any calendar quarter, we must correct the failure within 30 days after the end of the calendar quarter or qualify for certain statutory relief provisions to avoid losing our REIT qualification and suffering adverse tax consequences. As a result, we may be required to liquidate otherwise attractive investments, which could adversely affect our financial condition and results of operations.
The prohibited transactions tax may limit our ability to sell properties. A REIT’s net income from prohibited transactions is subject to a 100% tax. In general, prohibited transactions are sales or other dispositions of property held primarily for sale to customers in the ordinary course of business. We may be subject to the prohibited transaction tax equal to 100% of net gain upon a disposition of real property. Although a safe harbor to the characterization of the sale of real property by a REIT as a prohibited transaction is available, we cannot assure you that we can in all cases comply with the safe harbor or that we will avoid owning property that may be characterized as held primarily for sale to customers in the ordinary course of business. Consequently, we may choose not to engage in certain sales of our properties or may conduct such sales through our taxable REIT subsidiary, which would be subject to federal and state income taxation.
Dividends payable by REITs do not qualify for the reduced tax rates available for some dividends. Dividends payable by REITs to U.S. stockholders are taxed at a maximum individual rate of 33.4% (including the 3.8% net investment income tax and after factoring in a 20% deduction for pass-through income). The more favorable rates applicable to regular corporate qualified dividends could cause investors who are taxed at individual rates to perceive investments in REITs to be relatively less attractive than investments in the stocks of non-REIT corporations that pay dividends, which could adversely affect the value of the shares of REITs, including our stock.
We face possible tax audits. Because we are organized and qualify as a REIT, we are generally not subject to federal income taxes. We are, however, subject to federal, state and local taxes in certain instances. In the normal course of business, certain entities through which we own real estate have undergone tax audits. While tax deficiency notices from the jurisdictions conducting previous audits have not been material, there can be no assurance that future audits will not occur with increased frequency or that the ultimate result of such audits will not have a material adverse effect on our results of operations.
Risks Related to an Investment in our Securities
The price of our Common Stock is volatile and may decline. A number of factors may adversely influence the public market price of our Common Stock. These factors include:
•the level of institutional interest in us;
•the perceived attractiveness of investment in us, in comparison to other REITs;
•the attractiveness of securities of REITs in comparison to other asset classes;
•our financial condition and performance;
•the market’s perception of our growth prospects and potential future cash dividends;
•government action or regulation, including changes in tax laws;
•increases in market interest rates, which may lead investors to expect a higher annual yield from our distributions in relation to the price of our Common Stock;
•changes in our credit ratings;
•the issuance of additional shares of Common Stock, or the perception that such issuances might occur, including under our equity distribution agreements; and
•any negative change in the level or stability of our dividend.
Tax elections regarding distributions may impact the future liquidity of the Company or our stockholders. Under certain circumstances, we may consider making a tax election to treat future distributions to stockholders as distributions in the current year. This election, which is provided for in the Internal Revenue Code, may allow us to avoid increasing our dividends or paying additional income taxes in the current year. However, this could result in a constraint on our ability to decrease our dividends in future years without creating risk of either violating the REIT distribution requirements or generating additional income tax liability.
Tax legislative or regulatory action could adversely affect us or our stockholders. In recent years, numerous legislative, judicial and administrative changes have been made to the U.S. federal income tax laws applicable to investments similar to an investment in our Common Stock. Additional changes to tax laws are likely to continue in the future, and we cannot assure you that any such changes will not adversely affect the taxation of us or our stockholders. Any such changes could have an adverse effect on an investment in our Common Stock, on the market value of our properties or the attractiveness of securities of REITs generally in comparison to other asset classes.
We cannot assure you that we will continue to pay dividends at historical rates. We generally expect to use cash flows from operating activities to fund dividends. For information regarding our dividend payment history as well as a discussion of the factors that influence the decisions of the Company’s Board of Directors regarding dividends and distributions, see “Item 7. Management’s Discussion and Analysis of Financial Condition and Results of Operations - Liquidity and Capital Resources - Dividends and Distributions.” Changes in our future dividend payout level could have a material effect on the market price of our Common Stock.
Cash distributions reduce the amount of cash that would otherwise be available for other business purposes, including paying off debt, reinvesting in our existing portfolio or funding future growth initiatives. For the Company to maintain its qualification as a REIT, it must annually distribute to its stockholders at least 90% of REIT taxable income, excluding net capital gains. In addition, although capital gains are not required to be distributed to maintain REIT status, taxable
capital gains, if any, that are generated as part of our capital recycling program are subject to federal and state income tax unless such gains are distributed to our stockholders. Cash distributions made to stockholders to maintain REIT status or to distribute otherwise taxable capital gains limit our ability to accumulate capital for other business purposes, including paying off debt, reinvesting in our existing portfolio or funding future growth initiatives.
Further issuances of equity securities may adversely affect the market price of our Common Stock and may be dilutive to current stockholders. The sales of a substantial number of Common Shares, or the perception that such sales could occur, could adversely affect the market price of our Common Stock. We have filed a registration statement with the SEC allowing us to offer, from time to time, an indeterminate amount of equity securities (including Common Stock and Preferred Stock) on an as-needed basis and subject to our ability to effect offerings on satisfactory terms based on prevailing conditions. In addition, the Company’s board of directors has, from time to time, authorized the Company to issue shares of Common Stock pursuant to the Company’s equity sales agreements. The interests of our existing stockholders could be diluted if additional equity securities are issued to finance future developments and acquisitions or repay indebtedness. Our ability to execute our business strategy depends on our access to an appropriate blend of debt financing, including unsecured lines of credit and other forms of secured and unsecured debt, and equity financing, including common equity.
We may change our policies without obtaining the approval of our stockholders. Our operating and financial policies, including our policies with respect to acquisitions of real estate, growth, operations, indebtedness, capitalization and dividends, are exclusively determined by the Company’s Board of Directors. Accordingly, our stockholders do not control these policies.
Limits on changes in control may discourage takeover attempts beneficial to stockholders. Provisions in the Company’s charter and bylaws as well as Maryland general corporation law may have anti-takeover effects that delay, defer or prevent a takeover attempt. For example, these provisions may defer or prevent tender offers for our Common Stock or purchases of large blocks of our Common Stock, thus limiting the opportunities for the Company’s stockholders to receive a premium for their shares of Common Stock over then-prevailing market prices. These provisions include the following:
•Ownership limit. The Company’s charter prohibits direct, indirect or constructive ownership by any person or entity of more than 9.8% of the Company’s outstanding capital stock. Any attempt to own or transfer shares of capital stock in excess of the ownership limit without the consent of the Company’s board of directors will be void.
•Preferred Stock. The Company’s charter authorizes the board of directors to issue preferred stock in one or more classes and establish the preferences and rights of any class of preferred stock issued. These actions can be taken without stockholder approval. The issuance of preferred stock could have the effect of delaying or preventing someone from taking control of the Company, even if a change in control were in our best interest.
•Business combinations. Pursuant to the Company’s charter and Maryland law, the Company cannot merge into or consolidate with another corporation or enter into a statutory share exchange transaction in which the Company is not the surviving entity or sell all or substantially all of its assets unless the board of directors adopts a resolution declaring the proposed transaction advisable and a majority of the stockholders voting together as a single class approve the transaction. Maryland law prohibits stockholders from taking action by written consent unless all stockholders consent in writing. The practical effect of this limitation is that any action required or permitted to be taken by the Company’s stockholders may only be taken if it is properly brought before an annual or special meeting of stockholders. The Company’s bylaws further provide that in order for a stockholder to properly bring any matter before a meeting, the stockholder must comply with requirements regarding advance notice. The foregoing provisions could have the effect of delaying until the next annual meeting stockholder actions that the holders of a majority of the Company’s outstanding voting securities favor. These provisions may also discourage another person from making a tender offer for the Company’s common stock, because such person or entity, even if it acquired a majority of the Company’s outstanding voting securities, would likely be able to take action as a stockholder, such as electing new directors or approving a merger, only at a duly called stockholders meeting. Maryland law also establishes special requirements with respect to business combinations between Maryland corporations and interested stockholders unless exemptions apply. Among other things, the law prohibits for five years a merger and other similar transactions between a corporation and an interested stockholder and requires a supermajority vote for such transactions after the end of the five-year period. The Company’s charter contains a provision exempting the Company from the Maryland business combination statute. However, we cannot assure you that this charter provision will not be amended or repealed at any point in the future.
•Control share acquisitions. Maryland general corporation law also provides that control shares of a Maryland corporation acquired in a control share acquisition have no voting rights except to the extent approved by a vote of two-thirds of the votes entitled to be cast on the matter, excluding shares owned by the acquirer or by officers or
employee directors. The control share acquisition statute does not apply to shares acquired in a merger, consolidation or share exchange if the corporation is a party to the transaction, or to acquisitions approved or exempted by the corporation’s charter or bylaws. The Company’s bylaws contain a provision exempting from the control share acquisition statute any stock acquired by any person. However, we cannot assure you that this bylaw provision will not be amended or repealed at any point in the future.
•Maryland unsolicited takeover statute. Under Maryland law, the Company’s board of directors could adopt various anti-takeover provisions without the consent of stockholders. The adoption of such measures could discourage offers for the Company or make an acquisition of the Company more difficult, even when an acquisition would be in the best interest of the Company’s stockholders.
•Anti‑takeover protections of operating partnership agreement. Upon a change in control of the Company, the partnership agreement of the Operating Partnership requires certain acquirers to maintain an umbrella partnership real estate investment trust structure with terms at least as favorable to the limited partners as are currently in place. For instance, the acquirer would be required to preserve the limited partner’s right to continue to hold tax-deferred partnership interests that are redeemable for capital stock of the acquirer. Exceptions would require the approval of two-thirds of the limited partners of our Operating Partnership (other than the Company). These provisions may make a change of control transaction involving the Company more complicated and therefore might decrease the likelihood of such a transaction occurring, even if such a transaction would be in the best interest of the Company’s stockholders.
ITEM 1B. UNRESOLVED STAFF COMMENTS
None.
ITEM 2. PROPERTIES
Properties
The following table sets forth information about in-service office properties that we wholly own by geographic location at December 31, 2021:
| | | | | | | | | | | | | | | | | | | | |
| Market | | Rentable
Square Feet | | Occupancy | | Percentage of Annualized Cash Rental Revenue (1) |
| Raleigh | | 6,335,000 | | | 92.8 | % | | 22.9 | % |
| Nashville | | 5,118,000 | | | 94.8 | | | 21.5 | |
| Atlanta | | 4,925,000 | | | 87.6 | | | 17.2 | |
| Tampa | | 3,328,000 | | | 88.7 | | | 12.0 | |
| Charlotte | | 1,611,000 | | | 94.2 | | | 7.7 | |
| Pittsburgh | | 2,152,000 | | | 92.6 | | | 7.5 | |
| Orlando | | 1,789,000 | | | 89.8 | | | 6.1 | |
| Richmond | | 1,851,000 | | | 87.2 | | | 4.5 | |
| Other | | 299,000 | | | 87.8 | | | 0.6 | |
| | | | | | |
| Total | | 27,408,000 | | | 91.2 | % | | 100.0 | % |
__________
(1)Annualized Cash Rental Revenue is cash rental revenue (base rent plus cost recovery income, excluding straight-line rent) from our office properties for the month of December 2021 multiplied by 12.
The following table sets forth the net changes in rentable square footage of in-service properties that we wholly own:
| | | | | | | | | | | | | | | | | |
| Year Ended December 31, |
| 2021 | | 2020 | | 2019 |
| (in thousands) |
| | | | | |
| Acquisitions | 2,266 | | | — | | | 841 | |
| Developments Placed In-Service | 897 | | | — | | | 898 | |
| Redevelopment/Other | (3) | | | (40) | | | (6) | |
| Dispositions | (1,661) | | | (4,489) | | | (557) | |
| Net Change in Rentable Square Footage | 1,499 | | | (4,529) | | | 1,176 | |
The following table sets forth operating information about in-service properties that we wholly own:
| | | | | | | | | | | | | | | | | |
| Average
Occupancy | | Annualized GAAP Rent
Per Square
Foot (1) | | Annualized Cash Rent
Per Square
Foot (2) |
| 2017 | 92.5 | % | | $ | 24.05 | | | $ | 23.46 | |
| 2018 | 91.7 | % | | $ | 24.68 | | | $ | 24.06 | |
| 2019 | 91.4 | % | | $ | 26.46 | | | $ | 25.06 | |
| 2020 | 90.7 | % | | $ | 29.23 | | | $ | 28.21 | |
| 2021 | 90.0 | % | | $ | 30.75 | | | $ | 29.63 | |
__________
(1)Annualized GAAP Rent Per Square Foot is rental revenue (base rent plus cost recovery income, including straight-line rent) for the month of December of the respective year multiplied by 12, divided by total occupied rentable square footage.
(2)Annualized Cash Rent Per Square Foot is cash rental revenue (base rent plus cost recovery income, excluding straight-line rent) for the month of December of the respective year multiplied by 12, divided by total occupied rentable square footage.
Customers
The following table sets forth information concerning the 20 largest customers of properties that we wholly own at December 31, 2021:
| | | | | | | | | | | | | | | | | | | | | | | | | | |
| Customer | | Rentable Square
Feet | | Annualized Cash Rental Revenue (1) | | Percent of Total Annualized Cash Rental Revenue (1) | | Weighted
Average
Remaining
Lease Term in
Years |
| | | | (in thousands) | | | | |
| Federal Government | | 1,058,933 | | | $ | 29,571 | | | 3.97 | % | | 7.4 | |
| Bank of America | | 652,313 | | | 27,286 | | | 3.67 | | | 12.2 | |
| Asurion, LLC | | 543,794 | | | 21,010 | | | 2.82 | | | 14.8 | |
| Metropolitan Life Insurance | | 667,228 | | | 19,275 | | | 2.59 | | | 9.1 | |
| Bridgestone Americas | | 506,128 | | | 18,104 | | | 2.43 | | | 15.7 | |
| PPG Industries | | 360,364 | | | 10,262 | | | 1.38 | | | 9.5 | |
| Mars Petcare | | 223,700 | | | 9,438 | | | 1.27 | | | 9.4 | |
| Vanderbilt University | | 294,389 | | | 9,337 | | | 1.25 | | | 4.4 | |
| EQT Corporation | | 317,052 | | | 8,138 | | | 1.09 | | | 2.8 | |
| Bass, Berry & Sims | | 213,951 | | | 8,052 | | | 1.08 | | | 3.1 | |
| Tivity | | 263,598 | | | 7,803 | | | 1.05 | | | 1.2 | |
| American General Life | | 173,834 | | | 6,666 | | | 0.90 | | | 5.1 | |
| Novelis | | 168,949 | | | 6,308 | | | 0.85 | | | 2.7 | |
| Albemarle Corporation | | 162,368 | | | 5,967 | | | 0.80 | | | 12.1 | |
| State of Georgia | | 288,443 | | | 5,813 | | | 0.78 | | | 3.0 | |
| Lifepoint Corporate Services | | 202,991 | | | 5,696 | | | 0.77 | | | 7.3 | |
| PNC Bank | | 162,223 | | | 5,389 | | | 0.72 | | | 5.9 | |
| Marsh USA, Inc. | | 136,246 | | | 5,137 | | | 0.69 | | | 5.7 | |
| Cigna | | 180,728 | | | 5,026 | | | 0.68 | | | 6.0 | |
| Regus PLC | | 169,833 | | | 4,999 | | | 0.67 | | | 6.2 | |
| Total | | 6,747,065 | | | $ | 219,277 | | | 29.46 | % | | 8.7 | |
__________
(1)Annualized Cash Rental Revenue is cash rental revenue (base rent plus cost recovery income, excluding straight-line rent) for the month of December 2021 multiplied by 12.
Lease Expirations
The following tables set forth scheduled lease expirations for existing leases at office properties that we wholly owned at December 31, 2021:
| | | | | | | | | | | | | | | | | | | | | | | | | | | | | | | | | | | | | | |
Lease Expiring (1) | | Number of Leases Expiring | | Rentable
Square Feet
Subject to
Expiring
Leases | | Percentage of
Leased Square
Footage
Represented
by Expiring
Leases | | Annualized Cash Rental Revenue Under Expiring Leases (2) | | Average
Annual Cash
Rental Rate
Per Square
Foot for
Expirations | | Percent of Annualized Cash Rental Revenue Represented by Expiring Leases (2) |
| | | | | | | (in thousands) | | | |
2022 (3) | | 427 | | | 1,847,106 | | | 7.4 | % | | $ | 54,277 | | | $ | 29.38 | | | 7.3 | % |
| 2023 | | 315 | | | 2,317,237 | | | 9.3 | | | 67,112 | | | 28.96 | | | 9.1 | |
| 2024 | | 327 | | | 2,755,874 | | | 11.0 | | | 85,219 | | | 30.92 | | | 11.5 | |
| 2025 | | 288 | | | 3,294,592 | | | 13.2 | | | 97,515 | | | 29.60 | | | 13.2 | |
| 2026 | | 241 | | | 2,330,660 | | | 9.3 | | | 67,967 | | | 29.16 | | | 9.2 | |
| 2027 | | 150 | | | 2,291,942 | | | 9.2 | | | 62,758 | | | 27.38 | | | 8.5 | |
| 2028 | | 91 | | | 1,814,047 | | | 7.3 | | | 55,402 | | | 30.54 | | | 7.5 | |
| 2029 | | 85 | | | 1,266,975 | | | 5.1 | | | 33,692 | | | 26.59 | | | 4.5 | |
| 2030 | | 107 | | | 1,404,233 | | | 5.5 | | | 40,244 | | | 28.66 | | | 5.4 | |
| 2031 | | 47 | | | 1,912,612 | | | 7.7 | | | 57,341 | | | 29.98 | | | 7.7 | |
| Thereafter | | 101 | | | 3,757,864 | | | 15.0 | | | 118,973 | | | 31.66 | | | 16.1 | |
| | 2,179 | | | 24,993,142 | | | 100.0 | % | | $ | 740,500 | | | $ | 29.63 | | | 100.0 | % |
__________
(1)Expirations that have been renewed are reflected above based on the renewal expiration date. Expirations include leases related to completed not stabilized development properties but exclude leases related to developments in-process.
(2)Annualized Cash Rental Revenue is cash rental revenue (base rent plus cost recovery income, excluding straight-line rent) for the month of December 2021 multiplied by 12.
(3)Includes 51,831 rentable square feet of leases that are on a month-to-month basis, which represent 0.2% of total annualized cash rental revenue.
In-Process Development
As of December 31, 2021, we were developing 0.4 million rentable square feet of office properties. The following table summarizes these announced and in-process office developments:
| | | | | | | | | | | | | | | | | | | | | | | | | | | | | | | | | | | | | | | | | | | | | | |
| Property | | Market | | | | Rentable Square Feet | | Anticipated Total Investment (1) | | Investment As Of December 31, 2021 (1) | | Pre Leased % | | Estimated Completion | | Estimated Stabilization |
| | | | | | | | ($ in thousands) | | | | | | |
GlenLake III Office & Retail (2) | | Raleigh | | | | 218,250 | | | $ | 94,600 | | | $ | 7,329 | | | 14.6 | % | | 3Q 23 | | 1Q 26 |
2827 Peachtree (3) | | Atlanta | | | | 135,300 | | | 79,000 | | | 12,158 | | | 62.4 | | | 3Q 23 | | 1Q 25 |
| | | | | | | | | | | | | | | | |
| | | | | | | | | | | | | | | | |
| | | | | | | | | | | | | | | | |
| | | | | | | | | | | | | | | | |
| | | | | | | | | | | | | | | | |
| | | | | | | | | | | | | | | | |
| | | | | | | | | | | | | | | | |
| | | | | | | | | | | | | | | | |
| | | | | | 353,550 | | | $ | 173,600 | | | $ | 19,487 | | | 32.9 | % | | | | |
| | | | | | | | | | | | | | | | |
| | | | | | | | | | | | | | |
__________
(1)Includes deferred lease commissions which are classified in deferred leasing costs on our Consolidated Balance Sheet.
(2)Retail portion recorded on our Consolidated Balance Sheet as land held for development, not development in-process.
(3)We own a 50% interest in this unconsolidated joint venture.
Land Held for Development
At December 31, 2021, we estimate that we can develop approximately 4.7 million rentable square feet of office space on the wholly-owned development land that we consider core assets for our future development needs. Our core office development land is zoned and available for development, and nearly all of the land has utility infrastructure in place. We believe that our commercially zoned and unencumbered land gives us a development advantage over other commercial office development companies in many of our markets. We also own additional development land on which we or third parties can develop approximately 4.3 million square feet of mixed-use real estate projects, including retail and multi-family.
Joint Venture Investments
The following table sets forth information about our joint venture investments by geographic location at December 31, 2021:
| | | | | | | | | | | | | | | | | | | | | | |
| | Rentable
Square Feet | | Weighted Average Ownership Interest (1) | | Occupancy | | |
| Market | |
Kansas City (2) | | 291,504 | | | 50.0 | % | | 87.2 | % | | |
Richmond (3) | | 345,344 | | | 50.0 | | | 99.2 | | | |
Tampa (3) | | 150,000 | | | 80.0 | | | 10.7 | | | |
| Total | | 786,848 | | | 55.7 | % | | 77.9 | % | | |
__________
(1)Weighted Average Ownership Interest is calculated using Rentable Square Feet.
(2)Excluding our 26.5% ownership interest in a real estate brokerage services company.
(3)This joint venture, which is consolidated, owns a newly completed, but not yet stabilized office property.
In addition, we own a 50.0% interest in 2827 Peachtree, an unconsolidated joint venture. See “Item 2. Properties - In-Process Development.”
ITEM 3. LEGAL PROCEEDINGS
We are from time to time a party to a variety of legal proceedings, claims and assessments arising in the ordinary course of our business. We regularly assess the liabilities and contingencies in connection with these matters based on the latest information available. For those matters where it is probable that we have incurred or will incur a loss and the loss or range of loss can be reasonably estimated, the estimated loss is accrued and charged to income in our Consolidated Financial Statements. In other instances, because of the uncertainties related to both the probable outcome and amount or range of loss, a reasonable estimate of liability, if any, cannot be made. Based on the current expected outcome of such matters, none of these proceedings, claims or assessments is expected to have a material adverse effect on our business, financial condition, results of operations or cash flows.
ITEM 4. MINE SAFETY DISCLOSURES
Not applicable.
ITEM X. INFORMATION ABOUT OUR EXECUTIVE OFFICERS
The Company is the sole general partner of the Operating Partnership. The following table sets forth information with respect to the Company’s executive officers:
| | | | | | | | | | | | | | |
| Name | | Age | | Position and Background |
| Theodore J. Klinck | | 56 | | Director, President and Chief Executive Officer. Mr. Klinck became a director and our chief executive officer in September 2019. Prior to that, Mr. Klinck was our president and chief operating officer since November 2018, our executive vice president and chief operating and investment officer from September 2015 to November 2018 and was senior vice president and chief investment officer from March 2012 to August 2015. Before joining us, Mr. Klinck served as principal and chief investment officer with Goddard Investment Group, a privately owned real estate investment firm. Previously, Mr. Klinck had been a managing director at Morgan Stanley Real Estate.
|
| | | | |
| Brian M. Leary | | 47 | | Executive Vice President and Chief Operating Officer. Mr. Leary became chief operating officer in July 2019. Previously, Mr. Leary served as president of the commercial and mixed-use business unit of Crescent Communities since 2014. Prior to joining Crescent, Mr. Leary held senior management positions with Jacoby Development, Inc., Atlanta Beltline, Inc., AIG Global Real Estate, Atlantic Station, LLC and Central Atlanta Progress.
|
| Brendan C. Maiorana | | 46 | | Executive Vice President and Chief Financial Officer.
Mr. Maiorana became executive vice president of finance in July 2019 and assumed the roles of treasurer in January 2021 and chief financial officer in January 2022. Prior to that, Mr. Maiorana was our senior vice president of finance and investor relations since May 2016. Prior to joining Highwoods, Mr. Maiorana spent 11 years in equity research at Wells Fargo Securities, starting as an associate equity research analyst. Prior to that, Mr. Maiorana worked four years at Ernst & Young LLP.
|
| Jeffrey D. Miller | | 51 | | Executive Vice President, General Counsel and Secretary. Prior to joining us in March 2007, Mr. Miller was a partner with DLA Piper US, LLP, where he practiced since 2005. Previously, Mr. Miller had been a partner with Alston & Bird LLP. Mr. Miller is admitted to practice in North Carolina. Mr. Miller served as lead independent director of Hatteras Financial Corp., a publicly-traded mortgage REIT (NYSE:HTS), prior to its merger with Annaly Capital Management, Inc. (NYSE:NLY) in July 2016.
|
| | | | |
| | | | |
PART II
ITEM 5. MARKET FOR REGISTRANT’S COMMON EQUITY, RELATED STOCKHOLDER MATTERS AND ISSUER PURCHASES OF EQUITY SECURITIES
Our Common Stock is traded on the NYSE under the symbol “HIW.” On December 31, 2021, the Company had 643 common stockholders of record. There is no public trading market for the Common Units. On December 31, 2021, the Operating Partnership had 103 holders of record of Common Units (other than the Company). At December 31, 2021, there were 104.9 million shares of Common Stock outstanding and 2.5 million Common Units outstanding not owned by the Company.
For information regarding our dividend payment history as well as a discussion of the factors that influence the decisions of the Company’s Board of Directors regarding dividends and distributions, see “Item 7. Management’s Discussion and Analysis of Financial Condition and Results of Operations - Liquidity and Capital Resources - Dividends and Distributions.”
The following total return performance graph compares the performance of our Common Stock to the S&P 500 Index and the FTSE NAREIT All Equity REITs Index. The total return performance graph assumes an investment of $100 in our Common Stock and the two indices on December 31, 2016 and further assumes the reinvestment of all dividends. The FTSE NAREIT All Equity REITs Index is a free-float adjusted, market capitalization-weighted index of U.S. equity REITs. Constituents of the Index include all tax-qualified REITs with more than 50% of total assets in qualifying real estate assets other than mortgages secured by real property. Total return performance is not necessarily indicative of future results.
| | | | | | | | | | | | | | | | | | | | | | | | | | | | | | | | |
| | For the Period from December 31, 2016 to December 31, |
| Index | | 2017 | | 2018 | | 2019 | | 2020 | | 2021 |
| Highwoods Properties, Inc. | | 103.36 | | | 81.83 | | | 107.86 | | | 91.94 | | | 108.15 | |
| S&P 500 Index | | 121.83 | | | 116.49 | | | 153.17 | | | 181.35 | | | 233.41 | |
| | | | | | | | | | |
| FTSE NAREIT All Equity REITs Index | | 108.67 | | | 104.28 | | | 134.17 | | | 127.30 | | | 179.87 | |
The performance graph above is being furnished as part of this Annual Report solely in accordance with the requirement under Rule 14a-3(b)(9) to furnish the Company’s stockholders with such information and, therefore, is not deemed to be filed, or incorporated by reference in any filing, by the Company or the Operating Partnership under the Securities Act of 1933 or the Securities Exchange Act of 1934.
During the fourth quarter of 2021, the Company issued an aggregate of 327,682 shares of Common Stock to holders of Common Units in the Operating Partnership upon the redemption of a like number of Common Units in private offerings exempt from the registration requirements pursuant to Section 4(2) of the Securities Act. Each of the holders of Common Units was an accredited investor under Rule 501 of the Securities Act. The resale of such shares was registered by the Company under the Securities Act.
The Company has a Dividend Reinvestment and Stock Purchase Plan (“DRIP”) under which holders of Common Stock may elect to automatically reinvest their dividends in additional shares of Common Stock and make optional cash payments for additional shares of Common Stock. The Company satisfies its DRIP obligations by instructing the DRIP administrator to purchase Common Stock in the open market.
The Company has an Employee Stock Purchase Plan (“ESPP”) pursuant to which employees may contribute up to 25% of their cash compensation for the purchase of Common Stock. At the end of each quarter, each participant’s account balance, which includes accumulated dividends, is applied to acquire shares of Common Stock at a cost that is calculated at 85% of the average closing price on the NYSE on the five consecutive days preceding the last day of the quarter. Generally, shares purchased under the ESPP must be held at least one year. The Company satisfies its ESPP obligations by issuing additional shares of Common Stock.
Information about the Company’s equity compensation plans and other related stockholder matters is incorporated herein by reference to the Company’s Proxy Statement to be filed in connection with its annual meeting of stockholders to be held on May 10, 2022.
ITEM 7. MANAGEMENT’S DISCUSSION AND ANALYSIS OF FINANCIAL CONDITION AND RESULTS OF OPERATIONS
You should read the following discussion and analysis in conjunction with the accompanying Consolidated Financial Statements and related notes contained elsewhere herein.
Disclosure Regarding Forward-Looking Statements
Some of the information in this Annual Report may contain forward-looking statements. Such statements include, in particular, statements about our plans, strategies and prospects under this section and under the heading “Item 1. Business.” You can identify forward-looking statements by our use of forward-looking terminology such as “may,” “will,” “expect,” “anticipate,” “estimate,” “continue” or other similar words. Although we believe that our plans, intentions and expectations reflected in or suggested by such forward-looking statements are reasonable, we cannot assure you that our plans, intentions or expectations will be achieved. When considering such forward-looking statements, you should keep in mind important factors that could cause our actual results to differ materially from those contained in any forward-looking statement, including the following:
•buyers may not be available and pricing may not be adequate with respect to planned dispositions of non-core assets;
•comparable sales data on which we based our expectations with respect to the sales price of non-core assets may not reflect current market trends;
•the extent to which the ongoing COVID-19 pandemic impacts our financial condition, results of operations and cash flows depends on future developments, which are highly uncertain and cannot be predicted with confidence, including the scope, severity and duration of the pandemic and its impact on the U.S. economy and potential changes in customer behavior that could adversely affect the use of and demand for office space;
•the financial condition of our customers could deteriorate or further worsen, which could be further exacerbated by the COVID-19 pandemic;
•our assumptions regarding potential losses related to customer financial difficulties due to the COVID-19 pandemic could prove incorrect;
•counterparties under our debt instruments, particularly our revolving credit facility, may attempt to avoid their obligations thereunder, which, if successful, would reduce our available liquidity;
•we may not be able to lease or re-lease second generation space, defined as previously occupied space that becomes available for lease, quickly or on as favorable terms as old leases;
•we may not be able to lease newly constructed buildings as quickly or on as favorable terms as originally anticipated;
•we may not be able to complete development, acquisition, reinvestment, disposition or joint venture projects as quickly or on as favorable terms as anticipated;
•development activity in our existing markets could result in an excessive supply relative to customer demand;
•our markets may suffer declines in economic and/or office employment growth;
•unanticipated increases in interest rates could increase our debt service costs;
•unanticipated increases in operating expenses could negatively impact our operating results;
•natural disasters and climate change could have an adverse impact on our cash flow and operating results;
•we may not be able to meet our liquidity requirements or obtain capital on favorable terms to fund our working capital needs and growth initiatives or repay or refinance outstanding debt upon maturity; and
•the Company could lose key executive officers.
This list of risks and uncertainties, however, is not intended to be exhaustive. You should also review the other cautionary statements we make in “Item 1A. Risk Factors” set forth in this Annual Report. Given these uncertainties, you should not place undue reliance on forward-looking statements. We undertake no obligation to publicly release the results of any revisions to these forward-looking statements to reflect any future events or circumstances or to reflect the occurrence of unanticipated events.
Executive Summary
We are in the work-placemaking business. We believe that in creating environments and experiences where the best and brightest can achieve together what they cannot apart, we can deliver greater value to our customers, their teammates and, in turn, our stockholders. Our simple strategy is to own and manage high-quality workplaces in the BBDs within our footprint, maintain a strong balance sheet to be opportunistic throughout economic cycles, employ a talented and dedicated team and communicate transparently with all stakeholders. We focus on owning and managing buildings in the most dynamic and vibrant BBDs. BBDs are highly-energized and amenitized workplace locations that enhance our customers’ ability to attract and retain talent. They are both urban and suburban. Providing the most talent-supportive workplace options in these environments is core to our work-placemaking strategy.
Our investment strategy is to generate attractive and sustainable returns over the long term for our stockholders by developing, acquiring and owning a portfolio of high-quality, differentiated office buildings in the BBDs of our core markets. A core component of this strategy is to continuously strengthen the financial and operational performance, resiliency and long-term growth prospects of our existing in-service portfolio and recycle those properties that no longer meet our criteria.
Since the beginning of 2019, we have acquired 3.1 million square feet of trophy office assets for a total investment of $1.3 billion, placed in service 1.8 million square feet of highly pre-leased new office development for a total investment of $691 million and sold 6.7 million square feet of non-core office and industrial assets for $992 million. This series of transactions included our exit from Greensboro and Memphis and entry into Charlotte, a higher-growth market with greater future upside opportunities.
Our operating results depend heavily on successfully leasing and operating the office space in our portfolio. Economic growth and office employment levels in our core markets are important factors, among others, in predicting our future operating results. Since March 2020, the COVID-19 pandemic has also had a significant impact on the U.S. economy. It is very difficult to predict when, if and to what extent economic activity will return to pre-COVID-19 levels. The COVID-19 pandemic did impact our 2021 financial results. While all buildings and parking facilities have remained open for business, the usage of our assets has continued to remain significantly lower than pre-pandemic levels. As a result, compared to pre-pandemic levels, parking and parking-related revenues have continued to be low, largely offsetting reduced operating expenses, net of expense recoveries. Until usage increases, which will depend on the duration of the COVID-19 pandemic, which is difficult to estimate, we expect that reduced usage will continue to result in reduced parking revenues, which will be partially offset by reduced operating expenses. We currently expect usage will gradually increase throughout 2022. Factors that could cause actual results to differ materially from our current expectations are set forth under “Disclosure Regarding Forward-Looking Statements.”
Revenues
The key components affecting our rental and other revenues are average occupancy, rental rates, cost recovery income, new developments placed in service, acquisitions and dispositions. Average occupancy generally increases during times of improving economic growth, as our ability to lease space outpaces vacancies that occur upon the expirations of existing leases. Average occupancy generally declines during times of slower or negative economic growth, when new vacancies tend to outpace our ability to lease space. Asset acquisitions, dispositions and new developments placed in service directly impact our rental revenues and could impact our average occupancy, depending upon the occupancy rate of the properties that are acquired, sold or placed in service. A further indicator of the predictability of future revenues is the expected lease expirations of our portfolio. As a result, in addition to seeking to increase our average occupancy by leasing current vacant space, we also concentrate our leasing efforts on renewing existing leases prior to expiration. For more information regarding our lease expirations, see “Item 2. Properties - Lease Expirations.” Occupancy in our office portfolio increased from 90.3% at December 31, 2020 to 91.2% at December 31, 2021. We expect average occupancy for our office portfolio to be approximately 90.5% to 91.5% for 2022. However, average occupancy in 2022 will be lower, perhaps significantly lower, if the COVID-19 pandemic causes vacancies and move-outs due to potential changes in customer behavior, such as the continued social acceptance, desirability and perceived economic benefits of work-from-home arrangements, which could materially and negatively impact the future demand for office space, resulting in slower overall leasing and negatively impacting our revenues.
Whether or not our rental revenue tracks average occupancy proportionally depends upon whether GAAP rents under signed new and renewal leases are higher or lower than the GAAP rents under expiring leases. Annualized rental revenues from second generation leases expiring during any particular year are typically less than 15% of our total annual rental revenues. The following table sets forth information regarding second generation office leases signed during the fourth quarter of 2021 (we define second generation office leases as leases with new customers and renewals of existing customers in office space that has been previously occupied under our ownership and leases with respect to vacant space in acquired buildings):
| | | | | | | | | | | | | | | | | |
| New | | Renewal | | All Office |
| Leased space (in rentable square feet) | 283,600 | | | 600,261 | | | 883,861 | |
| Average term (in years - rentable square foot weighted) | 6.5 | | | 3.1 | | | 4.2 | |
Base rents (per rentable square foot) (1) | $ | 31.40 | | | $ | 29.39 | | | $ | 30.04 | |
Rent concessions (per rentable square foot) (1) | (1.65) | | | (0.95) | | | (1.18) | |
GAAP rents (per rentable square foot) (1) | $ | 29.75 | | | $ | 28.44 | | | $ | 28.86 | |
Tenant improvements (per rentable square foot) (1) | $ | 5.59 | | | $ | 1.95 | | | $ | 3.12 | |
Leasing commissions (per rentable square foot) (1) | $ | 1.17 | | | $ | 0.74 | | | $ | 0.88 | |
__________
(1) Weighted average per rentable square foot on an annual basis over the lease term.
Annual combined GAAP rents for new and renewal leases signed in the fourth quarter were $28.86 per rentable square foot, 11.6% higher compared to previous leases in the same office spaces.
We strive to maintain a diverse, stable and creditworthy customer base. We have an internal guideline whereby customers that account for more than 3% of our revenues are periodically reviewed with the Company’s Board of Directors. As of December 31, 2021, the Federal Government (4.0%) and Bank of America (3.7%) accounted for more than 3% of our annualized cash revenues. See “Item 2. Properties - Customers.”
Expenses
Our expenses primarily consist of rental property expenses, depreciation and amortization, general and administrative expenses and interest expense. From time to time, expenses also include impairments of real estate assets. Rental property expenses are expenses associated with our ownership and operation of rental properties and include expenses that vary somewhat proportionately to occupancy and usage levels, such as janitorial services and utilities, and expenses that do not vary based on occupancy, such as property taxes and insurance. Depreciation and amortization is a non-cash expense associated with the ownership of real property and generally remains relatively consistent each year, unless we buy, place in service or sell assets, since our properties and related building and tenant improvement assets are depreciated on a straight-line basis over fixed lives. General and administrative expenses consist primarily of management and employee salaries and benefits, corporate overhead and short and long-term incentive compensation.
Net Operating Income
Whether or not we record increasing net operating income (“NOI”) in our same property portfolio typically depends upon our ability to garner higher rental revenues, whether from higher average occupancy, higher GAAP rents per rentable square foot or higher cost recovery income, that exceed any corresponding growth in operating expenses. Same property NOI was $5.4 million, or 1.2%, higher in 2021 as compared to 2020 due to an increase of $6.4 million in same property revenues offset by an increase of $1.0 million in same property expenses. We expect same property NOI to be lower in 2022 as compared to 2021 as an anticipated increase in same property expenses, mostly from the anticipated gradual increase in usage of our assets, is expected to more than offset higher anticipated same property revenues. We expect same property revenues to be higher due to higher average GAAP rents per rentable square foot and higher cost recovery and parking income.
In addition to the effect of same property NOI, whether or not NOI increases typically depends upon whether the NOI from our acquired properties and development properties placed in service exceeds the NOI from property dispositions. NOI was $26.5 million, or 5.2%, higher in 2021 as compared to 2020 primarily due to the acquisitions of real estate assets from Preferred Apartment Communities, Inc. (“PAC”) in the third quarter of 2021 and our joint venture partner’s 75.0% interest in our Highwoods DLF Forum, LLC joint venture (the “Forum”) in the first quarter of 2021, development properties placed in service and higher same property NOI, partially offset by NOI lost from property dispositions. We expect NOI to be higher in 2022 as
compared to 2021 due to the acquisition of real estate assets from PAC and development properties placed in service, partially offset by NOI lost from property dispositions and lower same property NOI.
Cash Flows
In calculating net cash related to operating activities, depreciation and amortization, which are non-cash expenses, are added back to net income. We have historically generated a positive amount of cash from operating activities. From period to period, cash flow from operations depends primarily upon changes in our net income, as discussed more fully below under “Results of Operations,” changes in receivables and payables and net additions or decreases in our overall portfolio.
Net cash related to investing activities generally relates to capitalized costs incurred for leasing and major building improvements and our acquisition, development, disposition and joint venture activity. During periods of significant net acquisition and/or development activity, our cash used in such investing activities will generally exceed cash provided by investing activities, which typically consists of cash received upon the sale of properties and distributions from our joint ventures.
Net cash related to financing activities generally relates to distributions, incurrence and repayment of debt, and issuances, repurchases or redemptions of Common Stock, Common Units and Preferred Stock. We use a significant amount of our cash to fund distributions. Whether or not we have increases in the outstanding balances of debt during a period depends generally upon the net effect of our acquisition, disposition, development and joint venture activity. We generally use our revolving credit facility for daily working capital purposes, which means that during any given period, in order to minimize interest expense, we may record significant repayments and borrowings under our revolving credit facility.
For a discussion regarding dividends and distributions, see “Liquidity and Capital Resources - Dividends and Distributions.”
Liquidity and Capital Resources
We continue to maintain a conservative and flexible balance sheet and believe we have ample liquidity to fund our operations and growth prospects. As of January 28, 2022, we had approximately $22 million of existing cash and $70.0 million drawn on our $750 million revolving credit facility, which is scheduled to mature in March 2025. Assuming we are in compliance with our covenants, we have an option to extend the maturity for two additional six-month periods. At December 31, 2021, our leverage ratio, as measured by the ratio of our mortgages and notes payable and outstanding preferred stock to the undepreciated book value of our assets, was 39.4% and there were 107.4 million diluted shares of Common Stock outstanding.
Rental and other revenues are our principal source of funds to meet our short-term liquidity requirements. Other sources of funds for short-term liquidity needs include available working capital and borrowings under our revolving credit facility, which had $679.9 million of availability at January 28, 2022. Our short-term liquidity requirements primarily consist of operating expenses, interest and principal amortization on our debt, distributions and capital expenditures, including building improvement costs, tenant improvement costs and lease commissions. Building improvements are capital costs to maintain or enhance existing buildings not typically related to a specific customer. Tenant improvements are the costs required to customize space for the specific needs of customers. We anticipate that our available cash and cash equivalents and cash provided by operating activities and planned financing activities, including borrowings under our revolving credit facility, will be adequate to meet our short-term liquidity requirements. We use our revolving credit facility for working capital purposes and for the short-term funding of our development and acquisition activity and, in certain instances, the repayment of other debt. Continued ability to borrow under the revolving credit facility allows us to quickly capitalize on strategic opportunities at short-term interest rates.
We generally believe existing cash and rental and other revenues will continue to be sufficient to fund short-term liquidity needs such as funding operating and general and administrative expenses, paying interest expense, maintaining our existing quarterly dividend and funding existing portfolio capital expenditures, including building improvement costs, tenant improvement costs and lease commissions.
Our long-term liquidity uses generally consist of the retirement or refinancing of debt upon maturity, funding of building improvements, new building developments and land infrastructure projects and funding acquisitions of buildings and development land. Our expected future capital expenditures for started and/or committed new consolidated and unconsolidated development projects were approximately $176 million at December 31, 2021. Additionally, we may, from time to time, retire
outstanding equity and/or debt securities through redemptions, open market repurchases, privately negotiated acquisitions or otherwise.
We expect to meet our long-term liquidity needs through a combination of:
•cash flow from operating activities;
•bank term loans and borrowings under our revolving credit facility;
•the issuance of unsecured debt;
•the issuance of secured debt;
•the issuance of equity securities by the Company or the Operating Partnership; and
•the disposition of non-core assets.
We have no debt scheduled to mature during 2022, except for our $200.0 million unsecured bank term loan that is scheduled to mature in November 2022. During 2022, we forecast funding approximately $93 million of our $283 million consolidated and unconsolidated development pipeline, which was over 37% funded as of December 31, 2021. We generally believe we will be able to satisfy these obligations with existing cash, borrowings under our revolving credit facility, new bank term loans, issuance of other unsecured debt, mortgage debt and/or proceeds from the sale of additional non-core assets.
Investment Activity
As noted above, a key tenet of our strategic plan is to continuously upgrade the quality of our office portfolio through acquisitions, dispositions and development. We generally seek to acquire and develop office buildings that improve the average quality of our overall portfolio and deliver consistent and sustainable value for our stockholders over the long-term. Whether or not an asset acquisition or new development results in higher per share net income or funds from operations (“FFO”) in any given period depends upon a number of factors, including whether the NOI for any such period exceeds the actual cost of capital used to finance the acquisition or development. Additionally, given the length of construction cycles, development projects are not placed in service until, in some cases, several years after commencement. Sales of non-core assets could result in lower per share net income or FFO in any given period in the event the return on the resulting use of proceeds does not exceed the capitalization rate on the sold properties.
Results of Operations
Comparison of 2021 to 2020
Rental and Other Revenues
Rental and other revenues were $31.1 million, or 4.2%, higher in 2021 as compared to 2020 primarily due to the acquisitions of real estate assets from PAC and our joint venture partner’s 75.0% interest in the Forum, development properties placed in service and higher same property revenues, which increased rental and other revenues by $43.0 million, $13.2 million and $6.4 million, respectively. Same property rental and other revenues were higher primarily due to higher average GAAP rents per rentable square foot, higher parking income and lower credit losses, partially offset by a decrease in average occupancy. These increases were partially offset by lost revenue of $31.7 million from property dispositions. We expect rental and other revenues to be higher in 2022 as compared to 2021 due to the acquisition of real estate assets from PAC, development properties placed in service and higher same property revenues, partially offset by lost revenue from property dispositions.
Operating Expenses
Rental property and other expenses were $4.6 million, or 2.0%, higher in 2021 as compared to 2020 primarily due to the acquisitions of real estate assets from PAC and our joint venture partner’s 75.0% interest in the Forum, development properties placed in service and higher same property operating expenses, which increased operating expenses by $11.4 million, $2.5 million and $1.0 million, respectively. Same property operating expenses were higher primarily due to higher contract services and utilities, partially offset by lower repairs and maintenance. These increases were partially offset by a $10.8 million decrease in operating expenses from property dispositions. We expect rental property and other expenses to be higher in 2022 as compared to 2021 due to the acquisition of real estate assets from PAC, development properties placed in service and higher
same property operating expenses due to the anticipated gradual increase in usage throughout 2022, partially offset by lower operating expenses from property dispositions.
Depreciation and amortization was $17.7 million, or 7.3%, higher in 2021 as compared to 2020 primarily due to the acquisitions of real estate assets from PAC and our joint venture partner’s 75.0% interest in the Forum, development properties placed in service and higher same property lease related depreciation and amortization, partially offset by fully amortized acquisition-related intangible assets and property dispositions. We expect depreciation and amortization to be higher in 2022 as compared to 2021 due to the acquisition of real estate assets from PAC and development properties placed in service, partially offset by property dispositions.
We recorded an impairment of real estate assets of $1.8 million in 2020, which resulted from a change in market-based inputs and our assumptions about the use of the assets. We recorded no impairments in 2021.
General and administrative expenses were $0.5 million, or 1.2%, lower in 2021 as compared to 2020 primarily due to lower salaries, benefits, severance and early retirement costs, partially offset by higher incentive compensation. We experienced lower salaries and benefits in 2021 as a result of the reduction in the number of employees throughout 2020 primarily due to our exiting of the Greensboro and Memphis markets and the subsequent closing of those division offices and the resulting synergies garnered from the ongoing simplification of our business. We expect general and administrative expenses to be higher in 2022 as compared to 2021 due to higher salaries and benefits and higher office rent, partially offset by lower incentive compensation.
Interest Expense
Interest expense was $4.9 million, or 6.0%, higher in 2021 as compared to 2020 primarily due to higher average debt balances, partially offset by higher capitalized interest and lower average interest rates. We expect interest expense to be higher in 2022 as compared to 2021 due to higher average debt balances and lower capitalized interest.
Other Income/(Loss)
Other income/(loss) was income of $1.4 million in 2021 as compared to a loss of $1.7 million in 2020 primarily due to losses on debt extinguishment in 2020.
Gains on Disposition of Property
Gains on disposition of property were $41.8 million lower in 2021 as compared to 2020 due to the net effect of the disposition activity in such periods.
Equity in Earnings of Unconsolidated Affiliates
Equity in earnings of unconsolidated affiliates was $2.1 million, or 51.4%, lower in 2021 as compared to 2020 primarily due to the acquisition of our joint venture partner’s 75.0% interest in the Forum.
Earnings Per Common Share - Diluted
Diluted earnings per common share was $0.34 lower in 2021 as compared to 2020 due to a decrease in net income for the reasons discussed above.
Comparison of 2020 to 2019
For a comparison of 2020 to 2019, see “Item 7. Management’s Discussion and Analysis of Financial Condition and Results of Operations - Results of Operations” in our 2020 Annual Report on Form 10-K.
Liquidity and Capital Resources
Statements of Cash Flows
We report and analyze our cash flows based on operating activities, investing activities and financing activities. The following table sets forth the changes in the Company’s cash flows (in thousands):
| | | | | | | | | | | | | | | | | | | | | | | | | | | | | |
| Year Ended December 31, | | | | |
| 2021 | | 2020 | | 2019 | | 2021-2020 Change | | 2020-2019 Change |
| Net Cash Provided By Operating Activities | $ | 414,558 | | | $ | 358,160 | | | $ | 365,797 | | | $ | 56,398 | | | $ | (7,637) | |
| Net Cash Provided By/(Used In) Investing Activities | (287,678) | | | 110,682 | | | (607,407) | | | (398,360) | | | 718,089 | |
| Net Cash Provided By/(Used In) Financing Activities | (284,926) | | | (294,340) | | | 246,209 | | | 9,414 | | | (540,549) | |
| Total Cash Flows | $ | (158,046) | | | $ | 174,502 | | | $ | 4,599 | | | $ | (332,548) | | | $ | 169,903 | |
Comparison of 2021 to 2020
The change in net cash provided by operating activities in 2021 as compared to 2020 was primarily due to higher net cash from the operations of acquired real estate assets from PAC and our joint venture partner’s 75.0% interest in the Forum, same properties and development properties placed in service and changes in operating assets, partially offset by property dispositions. We expect net cash related to operating activities to be higher in 2022 as compared to 2021 due to higher net cash from the operations of acquired real estate assets from PAC and development properties placed in service, partially offset by property dispositions.
The change in net cash provided by/(used in) investing activities in 2021 as compared to 2020 was primarily due to the acquisitions of real estate assets from PAC and our joint venture partner’s 75.0% interest in the Forum and net proceeds from disposition activity in 2020, partially offset by higher investments in development in-process, tenant improvements and building improvements in 2020. We expect uses of cash for investing activities in 2022 to be primarily driven by whether or not we acquire and commence development of additional office buildings in the BBDs of our markets. Additionally, as of December 31, 2021, we have approximately $176 million left to fund of our previously-announced consolidated and unconsolidated development activity in 2022 and future years. We expect these uses of cash for investing activities will be partly offset by proceeds from property dispositions in 2022.
The change in net cash used in financing activities in 2021 as compared to 2020 was primarily due to higher proceeds from the issuance of common stock in 2021, partially offset by higher net debt repayments in 2021. Assuming the net effect of our acquisition, disposition and development activity in 2022 results in an increase to our assets, we would expect outstanding debt and/or Common Stock balances to increase.
Comparison of 2020 to 2019
For a comparison of 2020 to 2019, see “Item 7. Management’s Discussion and Analysis of Financial Condition and Results of Operations - Liquidity and Capital Resources” in our 2020 Annual Report on Form 10-K.
Capitalization
The following table sets forth the Company’s capitalization (in thousands, except per share amounts):
| | | | | | | | | | | |
| December 31, |
| 2021 | | 2020 |
| | | |
| Mortgages and notes payable, net, at recorded book value | $ | 2,788,915 | | | $ | 2,470,021 | |
| | | |
| Preferred Stock, at liquidation value | $ | 28,821 | | | $ | 28,826 | |
| Common Stock outstanding | 104,893 | | | 103,922 | |
| Common Units outstanding (not owned by the Company) | 2,505 | | | 2,839 | |
| Per share stock price at year end | $ | 44.59 | | | $ | 39.63 | |
| Market value of Common Stock and Common Units | $ | 4,788,877 | | | $ | 4,230,938 | |
| Total capitalization | $ | 7,606,613 | | | $ | 6,729,785 | |
At December 31, 2021, our mortgages and notes payable and outstanding preferred stock represented 37.0% of our total capitalization and 39.4% of the undepreciated book value of our assets. See also “Executive Summary - Liquidity and Capital Resources.”
Our mortgages and notes payable as of December 31, 2021 consisted of $491.9 million of secured indebtedness with a weighted average interest rate of 3.63% and $2,312.2 million of unsecured indebtedness with a weighted average interest rate of 3.35%. The secured indebtedness, which includes four secured loans recorded at fair value of $403 million in the aggregate assumed as part of the acquisition of real estate assets from PAC, was collateralized by real estate assets with an undepreciated book value of $727.8 million. As of December 31, 2021, $220.0 million of our debt does not bear interest at fixed rates or is not protected by interest rate hedge contracts. On January 28, 2022, floating-to-fixed interest rate swaps with respect to an aggregate of $50.0 million of LIBOR-based borrowings expired. Subsequently, as of January 28, 2022, we had $270.0 million of variable rate debt outstanding not protected by interest rate hedge contracts.
Investment Activity
- Acquisitions
In the normal course of business, we regularly evaluate potential acquisitions. As a result, from time to time, we may have one or more potential acquisitions under consideration that are in varying stages of evaluation, negotiation or due diligence, including potential acquisitions that are subject to non-binding letters of intent or enforceable contracts. Consummation of any transaction is subject to a number of contingencies, including the satisfaction of customary closing conditions. No assurances can be provided that we will acquire any properties in the future. See “Item 1A. Risk Factors – Risks Related to our Capital Recycling Activity – Recent and future acquisitions and development properties may fail to perform in accordance with our expectations and may require renovation and development costs exceeding our estimates.”
During the fourth quarter of 2021, we acquired various development land parcels in Nashville for an aggregate purchase price, including capitalized acquisition costs, of $35.1 million.
During the third quarter of 2021, we acquired a portfolio of real estate assets from PAC. The portfolio consists of the following assets:
| | | | | | | | | | | | | | | | | | | | |
| Asset | | Market | | Submarket/BBD | | Square Footage |
| 150 Fayetteville | | Raleigh | | CBD | | 560,000 |
| CAPTRUST Towers | | Raleigh | | North Hills | | 300,000 |
| Capitol Towers | | Charlotte | | SouthPark | | 479,000 |
| Morrocroft Centre | | Charlotte | | SouthPark | | 291,000 |
| Galleria 75 Redevelopment Site | | Atlanta | | Cumberland/Galleria | | |
Our total purchase price, net of closing credits and cash acquired, was $653.6 million, including $4.5 million of capitalized acquisition costs. The acquisition included the assumption of four secured loans recorded at fair value of $403 million in the aggregate, with a weighted average effective interest rate of 3.54% and a weighted average maturity of 10.7 years. We incurred $3.5 million of debt issuance costs related to these assumptions.
During the third quarter of 2021, we also acquired development land in Nashville for a purchase price, including capitalized acquisition costs, of $22.9 million.
During the second quarter of 2021, we acquired development land in Nashville for a purchase price of $16.1 million, including capitalized acquisition costs, of which $16.0 million is expected to be paid within two years.
During the first quarter of 2021, we acquired our joint venture partner’s 75.0% interest in our Highwoods DLF Forum, LLC joint venture (the “Forum”), which owned five buildings in Raleigh encompassing 636,000 rentable square feet, for a purchase price of $131.3 million. We previously accounted for our 25.0% interest in this joint venture using the equity method of accounting. The assets and liabilities of the joint venture are now wholly owned and we have determined the acquisition constitutes an asset purchase. As such, because the Forum is not a variable interest entity, we allocated our previously held equity interest at historical cost along with the consideration paid and acquisition costs to the assets acquired and liabilities assumed. The assets acquired and liabilities assumed were recorded at relative fair value as determined by management, with the assistance of third party specialists, based on information available at the acquisition date and on current assumptions as to future operations.
- Dispositions
During the fourth quarter of 2021, we sold nine office buildings and various land parcels in Atlanta, Raleigh, Richmond and Tampa for an aggregate sale price of $191.2 million (before closing credits to buyer of $1.6 million) and recorded aggregate gains on disposition of property of $93.7 million, including land sale gains of $9.7 million.
During the third quarter of 2021, we sold two office buildings in Richmond and Memphis for an aggregate sale price of $119.7 million (before closing credits to buyer of $4.4 million) and recorded aggregate gains on disposition of property of $37.3 million.
We have a 50.0% ownership interest in Highwoods-Markel Associates, LLC (“Markel”), a consolidated joint venture. During the third quarter of 2021, Markel sold land in Richmond for a sale price of $3.0 million and recorded gain on disposition of property of $1.3 million.
During the second quarter of 2021, we sold an office building in Tampa for a sale price of $43.0 million (before closing credits to buyer of $0.9 million) and recorded a gain on disposition of property of $22.9 million.
During the first quarter of 2021, we sold an office building in Atlanta for a sale price of $30.7 million and recorded a gain on disposition of property of $18.9 million.
- New Joint Venture Investments
During the fourth quarter of 2021, we and Brand Properties, LLC (“Brand”) formed a joint venture (the “2827 Peachtree joint venture”) to construct 2827 Peachtree, a 135,000 square foot, multi-customer office building located in Atlanta’s Buckhead submarket. 2827 Peachtree has an anticipated total investment of $79.0 million. Construction of 2827 Peachtree began in the first quarter of 2022 with a scheduled completion date in the third quarter of 2023. At closing, we agreed to contribute cash of $13.3 million ($6.1 million of which was funded as of December 31, 2021) in exchange for a 50.0% interest in the 2827 Peachtree joint venture and Brand contributed land valued at $7.7 million and agreed to contribute cash of $5.6 million in exchange for the remaining 50.0% interest. We also committed to provide a $49.6 million interest-only secured construction loan to the 2827 Peachtree joint venture that is scheduled to mature in December 2024 with an option to extend for one year. The loan bears interest at LIBOR plus 300 basis points. As of December 31, 2021, no amounts under the loan have been funded.
- In-Process Development
As of December 31, 2021, we were developing 0.4 million rentable square feet of office properties. For a table summarizing our announced and in-process office developments, see “Item 2. Properties - In-Process Development.”
Financing Activity
During 2020, we entered into separate equity distribution agreements with each of Wells Fargo Securities, LLC, BofA Securities, Inc., BTIG, LLC, Capital One Securities, Inc., Fifth Third Securities, Inc., Jefferies LLC, J.P. Morgan Securities LLC, Regions Securities LLC and SunTrust Robinson Humphrey, Inc. Under the terms of the equity distribution agreements, the Company may offer and sell up to $300.0 million in aggregate gross sales price of shares of Common Stock from time to time through such firms, acting as agents of the Company or as principals. Sales of the shares, if any, may be made by means of ordinary brokers’ transactions on the NYSE or otherwise at market prices prevailing at the time of sale, at prices related to prevailing market prices or at negotiated prices or as otherwise agreed with any of such firms (which may include block trades). During the fourth quarter of 2021, the Company issued 156,913 shares of Common Stock at an average gross sales price of $46.75 per share and received net proceeds, after sales commissions, of $7.2 million. We paid an aggregate of $0.1 million in sales commissions to Jefferies, LLC during the fourth quarter of 2021.
During the first quarter of 2021, we entered into a new $750.0 million unsecured revolving credit facility, which replaced our previously existing $600.0 million revolving credit facility and includes an accordion feature that allows for an additional $550.0 million of borrowing capacity subject to additional lender commitments. Our new revolving credit facility is scheduled to mature in March 2025. Assuming no defaults have occurred, we have an option to extend the maturity for two additional six-month periods. The current interest rate on the new facility at our existing credit ratings is LIBOR plus 90 basis points and the annual facility fee is 20 basis points. The interest rate and facility fee are based on the higher of the publicly announced ratings from Moody’s Investors Service or Standard & Poor’s Ratings Services. The financial and other covenants under the new
facility are substantially similar to our previous credit facility. We incurred $4.8 million of debt issuance costs, which are being amortized along with certain existing unamortized debt issuance costs over the remaining term of our new revolving credit facility. We recorded $0.1 million of loss on debt extinguishment. There was $70.0 million outstanding under our new revolving credit facility at both December 31, 2021 and January 28, 2022. At both December 31, 2021 and January 28, 2022, we had $0.1 million of outstanding letters of credit, which reduces the availability on our revolving credit facility. As a result, the unused capacity of our revolving credit facility at both December 31, 2021 and January 28, 2022 was $679.9 million.
We previously entered into floating-to-fixed interest rate swaps through January 2022 with respect to an aggregate of $50.0 million LIBOR-based borrowings. These swaps effectively fix the underlying one-month LIBOR rate at a weighted average rate of 1.693%. As of January 28, 2022, these interest rate swaps have expired.
During the third quarter of 2021, in conjunction with the acquisition of real estate assets from PAC, we assumed four secured mortgage loans recorded at fair value of $403 million in the aggregate, with a weighted average effective interest rate of 3.54% and a weighted average maturity of 10.7 years. We incurred $3.5 million of debt issuance costs related to these assumptions, which will be amortized over the remaining terms of the loans.
During the third quarter of 2021, we also obtained a $200.0 million, six-month unsecured bridge facility. The bridge facility was originally scheduled to mature in January 2022. The bridge facility bore interest at LIBOR plus 85 basis points, had a commitment fee of 20 basis points and contained financial and other covenants that are similar to the covenants under our $750 million unsecured revolving credit facility. We incurred $1.0 million of debt issuance costs related to this bridge facility which were being amortized over the six-month term. As of December 31, 2021, this bridge facility was prepaid in full without penalty. We recorded $0.2 million of loss on debt extinguishment related to this prepayment.
During the second quarter of 2021, we prepaid without penalty the remaining $150.0 million principal amount of 3.20% unsecured notes that was scheduled to mature in June 2021. We recorded $0.1 million of loss on debt extinguishment related to this prepayment.
We regularly evaluate the financial condition of the financial institutions that participate in our credit facilities and as counterparties under interest rate swap agreements using publicly available information. Based on this review, we currently expect these financial institutions to perform their obligations under our existing facilities and swap agreements.
For information regarding our interest hedging activities and other market risks associated with our debt financing activities, see “Item 7A. Quantitative and Qualitative Disclosures About Market Risk.”
Covenant Compliance
We are currently in compliance with financial covenants and other requirements with respect to our consolidated debt. Although we expect to remain in compliance with these covenants and ratios for at least the next year, depending upon our future operating performance, property and financing transactions and general economic conditions, we cannot provide any assurances that we will continue to be in compliance.
Our revolving credit facility and bank term loans require us to comply with customary operating covenants and various financial requirements. Upon an event of default on our revolving credit facility, the lenders having at least 51.0% of the total commitments under our revolving credit facility can accelerate all borrowings then outstanding, and we could be prohibited from borrowing any further amounts under our revolving credit facility, which would adversely affect our ability to fund our operations. In addition, certain of our unsecured debt agreements contain cross-default provisions giving the unsecured lenders the right to declare a default if we are in default under more than $35.0 million with respect to other loans in some circumstances.
As of December 31, 2021, the Operating Partnership had the following unsecured notes outstanding ($ in thousands):
| | | | | | | | | | | | | | | | | | | | | | | |
| Face Amount | | Carrying Amount | | Stated Interest Rate | | Effective Interest Rate |
| Notes due January 2023 | $ | 250,000 | | | $ | 249,726 | | | 3.625 | % | | 3.752 | % |
| Notes due March 2027 | $ | 300,000 | | | $ | 297,934 | | | 3.875 | % | | 4.038 | % |
| Notes due March 2028 | $ | 350,000 | | | $ | 347,449 | | | 4.125 | % | | 4.271 | % |
| Notes due April 2029 | $ | 350,000 | | | $ | 349,288 | | | 4.200 | % | | 4.234 | % |
| Notes due February 2030 | $ | 400,000 | | | $ | 399,204 | | | 3.050 | % | | 3.079 | % |
| Notes due February 2031 | $ | 400,000 | | | $ | 398,579 | | | 2.600 | % | | 2.645 | % |
The indenture that governs these outstanding notes requires us to comply with customary operating covenants and various financial ratios. The trustee or the holders of at least 25.0% in principal amount of any series of notes can accelerate the principal amount of such series upon written notice of a default that remains uncured after 60 days.
We may not be able to repay, refinance or extend any or all of our debt at maturity or upon any acceleration. If any refinancing is done at higher interest rates, the increased interest expense could adversely affect our cash flow and ability to pay distributions. Any such refinancing could also impose tighter financial ratios and other covenants that restrict our ability to take actions that could otherwise be in our best interest, such as funding new development activity, making opportunistic acquisitions, repurchasing our securities or paying distributions.
Off-Balance Sheet Arrangements
During the fourth quarter of 2022, we and Brand formed the 2827 Peachtree joint venture. We own a 50% interest in this unconsolidated joint venture. For additional information, see “Investment Activity – New Joint Venture Investments.”
Contractual Obligations
The following table sets forth a summary regarding our known material contractual obligations on a cash basis, including required interest payments for those items that are interest bearing, at December 31, 2021 (in thousands):
| | | | | | | | | | | | | | | | | | | | | | | | | | | | | | | | | | | | | | | | | |
| | | Amounts due during the years ending December 31, | | |
| Total | | 2022 | | 2023 | | 2024 | | 2025 | | 2026 | | Thereafter |
| Mortgages and Notes Payable: | | | | | | | | | | | | | |
Principal payments (1) | $ | 2,796,316 | | | $ | 206,444 | | | $ | 256,726 | | | $ | 7,021 | | | $ | 76,833 | | | $ | 6,568 | | | $ | 2,242,724 | |
| Interest payments | 636,243 | | | 94,615 | | | 83,370 | | | 82,697 | | | 81,840 | | | 81,414 | | | 212,307 | |
| | | | | | | | | | | | | |
| | | | | | | | | | | | | |
| | | | | | | | | | | | | |
| | | | | | | | | | | | | |
| Purchase Obligations: | | | | | | | | | | | | | |
Lease and contractual commitments and contingent consideration (2) | 241,852 | | | 183,040 | | | 51,142 | | | 5,312 | | | — | | | — | | | 2,358 | |
| Other Commitments: | | | | | | | | | | | | | |
| Advances to unconsolidated affiliates | 49,562 | | | 20,405 | | | 26,801 | | | 2,356 | | | — | | | — | | | — | |
| Operating and Finance Lease Obligations: | | | | | | | | | | | | | |
| Ground leases | 95,156 | | | 2,169 | | | 2,167 | | | 2,123 | | | 2,170 | | | 2,220 | | | 84,307 | |
| | | | | | | | | | | | | |
| | | | | | | | | | | | | |
| | | | | | | | | | | | | |
| Total | $ | 3,819,129 | | | $ | 506,673 | | | $ | 420,206 | | | $ | 99,509 | | | $ | 160,843 | | | $ | 90,202 | | | $ | 2,541,696 | |
__________
(1)Excludes amortization of premiums, discounts, debt issuance costs and/or purchase accounting adjustments.
(2)Consists primarily of commitments under signed leases and contracts for operating properties, excluding tenant-funded tenant improvements, and contracts for development/redevelopment projects. This includes $134.1 million of contractual commitments related to our consolidated development pipeline activity, newly acquired properties and future consideration for a parcel of development land, of which $80.1 million is scheduled to be funded in 2022. 2022 includes future spend for tenant improvements that can be used at the option of the customer during the remaining lease term. The timing of these lease and contractual commitments may fluctuate.
The interest payments due on mortgages and notes payable are based on the stated rates for the fixed rate debt and on the rates in effect at December 31, 2021 for the variable rate debt. The weighted average interest rate on our fixed (including debt with a variable rate that is effectively fixed by related interest rate swaps) and variable rate debt was 3.59% and 1.14%,
respectively, at December 31, 2021. For additional information about our operating and finance lease obligations, mortgages and notes payable and purchase obligations, see Notes 2, 6 and 8, respectively, to our Consolidated Financial Statements.
Dividends and Distributions
To maintain its qualification as a REIT, the Company must pay dividends to stockholders that are at least 90.0% of its annual REIT taxable income, excluding net capital gains. The partnership agreement requires the Operating Partnership to distribute at least enough cash for the Company to be able to pay such dividends. The Company’s REIT taxable income, as determined by the federal tax laws, does not equal its net income under accounting principles generally accepted in the United States of America (“GAAP”). In addition, although capital gains are not required to be distributed to maintain REIT status, capital gains, if any, are subject to federal and state income tax unless such gains are distributed to stockholders. See “Item 1A. Risk Factors – Risks Related to an Investment in our Securities – Cash distributions reduce the amount of cash that would otherwise be available for other business purposes, including funding debt maturities, reducing debt or future growth initiatives.”
The amount of future distributions that will be made is at the discretion of the Company’s Board of Directors. The following factors will affect such cash flows and, accordingly, influence the decisions of the Company’s Board of Directors regarding dividends and distributions:
•projections with respect to future REIT taxable income expected to be generated by the Company;
•debt service requirements after taking into account debt covenants and the repayment and restructuring of certain indebtedness and the availability of alternative sources of debt and equity capital and their impact on our ability to refinance existing debt and grow our business;
•scheduled increases in base rents of existing leases;
•changes in rents attributable to the renewal of existing leases or replacement leases;
•changes in occupancy rates at existing properties and execution of leases for newly acquired or developed properties;
•changes in operating expenses;
•anticipated leasing capital expenditures attributable to the renewal of existing leases or new leases;
•anticipated building improvements; and
•expected cash flows from financing and investing activities, including from the sales of assets generating taxable gains to the extent such assets are not sold in a tax-deferred exchange under Section 1031 of the Internal Revenue Code or another tax-free or tax-deferred transaction.
The Company declared and paid a cash dividend of $0.48 per share of Common Stock in the first and second quarter of 2021, respectively, and $0.50 per share of Common Stock in the third and fourth quarter of 2021, respectively.
On February 1, 2022, the Company declared a cash dividend of $0.50 per share of Common Stock, which is payable on March 15, 2022 to stockholders of record as of February 21, 2022.
Current and Future Cash Needs
We anticipate that our available cash and cash equivalents, cash flows from operating activities and other available financing sources, including the issuance of debt securities by the Operating Partnership, the issuance of secured debt, bank term loans, borrowings under our revolving credit facility, the issuance of equity securities by the Company or the Operating Partnership and the disposition of non-core assets, will be adequate to meet our short-term liquidity requirements, including the $200.0 million unsecured bank term loan that is scheduled to mature in November 2022 and the $250.0 million principal amount of unsecured notes that are scheduled to mature in January 2023. We generally believe existing cash and rental and other revenues will continue to be sufficient to fund operating and general and administrative expenses, interest expense, our existing quarterly dividend and existing portfolio capital expenditures, including building improvement costs, tenant improvement costs and lease commissions.
We had $23.2 million of cash and cash equivalents as of December 31, 2021. The unused capacity of our revolving credit facility at both December 31, 2021 and January 28, 2022 was $679.9 million, excluding an accordion feature that allows for an additional $550.0 million of borrowing capacity subject to additional lender commitments.
We have a currently effective automatic shelf registration statement on Form S-3 with the SEC pursuant to which, at any time and from time to time, in one or more offerings on an as-needed basis, the Company may sell an indefinite amount of common stock, preferred stock and depositary shares and the Operating Partnership may sell an indefinite amount of debt securities, subject to our ability to effect offerings on satisfactory terms based on prevailing market conditions.
The Company from time to time enters into equity distribution agreements with a variety of firms pursuant to which the Company may offer and sell shares of common stock from time to time through such firms, acting as agents of the Company or as principals. Sales of the shares, if any, may be made by means of ordinary brokers’ transactions on the NYSE or otherwise at market prices prevailing at the time of sale, at prices related to prevailing market prices or at negotiated prices or as otherwise agreed with any of such firms (which may include block trades).
In April 2021, we announced a plan to fund the acquisition of real estate assets from PAC by selling $500 million to $600 million of non-core assets by mid-2022. From the date of that announcement through December 31, 2021, we sold $353 million of properties no longer considered to be core assets due to location, age, quality and/or overall strategic fit. We can make no assurance, however, that we will sell any additional non-core assets or, if we do, what the timing or terms of any such sale will be.
See also “Executive Summary - Liquidity and Capital Resources.”
Critical Accounting Estimates
The preparation of financial statements in conformity with GAAP requires us to make estimates and assumptions that affect the reported amounts of assets and liabilities and the disclosure of contingent liabilities at the date of the financial statements and the reported amounts of revenues and expenses for the reporting period. Actual results could differ from our estimates.
The policies used in the preparation of our Consolidated Financial Statements are described in Note 1 to our Consolidated Financial Statements. However, certain of our significant accounting policies contain an increased level of assumptions used or estimates made in determining their impact in our Consolidated Financial Statements. Management has reviewed and determined the appropriateness of our critical accounting policies and estimates with the audit committee of the Company’s Board of Directors.
We consider our critical accounting estimates to be those used in the determination of the reported amounts and disclosure related to the following:
•Acquisition of real estate assets and liabilities;
•Impairments of real estate assets; and
•Credit losses on lease related receivables.
Acquisition of Real Estate Assets and Liabilities
Primarily all of our acquisitions of real estate assets and liabilities are accounted for as asset acquisitions. As such, the purchase prices of acquired tangible and intangible assets and liabilities are recorded and allocated at fair value on a relative basis. The recorded allocations are based on estimated cash flow projections of the properties acquired which incorporates discount, capitalization and interest rates as well as available comparable market information. See Note 1 to our Consolidated Financial Statements for additional details regarding our specific procedures for purchase price allocation.
We use considerable judgement in our estimates of cash flow projections, discount, capitalization and interest rates, fair market lease rates, carrying costs during hypothetical expected lease-up periods and costs to execute similar leases. While our methodology for purchase price allocation did not change during the year ended December 31, 2021, the real estate market is fluid and our assumptions are based on information currently available in the market at the time of acquisition. Significant increases or decreases in these key estimates, particularly with regards to cash flow projections and discount and capitalization rates, would result in a significantly lower or higher fair value measurement of the real estate assets being acquired.
Impairments of Real Estate Assets
We record impairments of our real estate assets classified as held for use when the carrying amount of the asset exceeds the sum of its undiscounted future operating and residual cash flows at the difference between estimated fair value of the asset and the carrying amount. We record impairments of our real estate assets classified as held for sale at the lower of the carrying amount or estimated fair value using the estimated or contracted sales price less costs to sell. See Note 1 to our Consolidated Financial Statements for additional details regarding our specific procedures with respect to impairments of our real estate assets classified as held for use and held for sale.
Any real estate assets recorded at fair value on a non-recurring basis as a result of our impairment analysis are valued using unobservable local and national industry market data such as comparable sales, appraisals, brokers’ opinions of value and/or terms of definitive sales contracts. Additionally, the analysis includes considerable judgement in our estimates of hold periods, projected cash flows and discount and capitalization rates. Significant increases or decreases in any of these inputs, particularly with regards to cash flow projections and discount and capitalization rates, would result in a significantly lower or higher fair value measurement of the real estate assets being assessed.
Credit Losses on Lease Related Receivables
Credit losses on lease related receivables, which include accounts receivable and accrued straight-line rents receivable, are recorded as a reduction to rental and other revenues when the amount recorded is determined, in management’s judgement, to not be probable of collection. Management’s evaluation of collectability requires the exercise of considerable judgement in assessing the current credit quality of our customers using payment history and other available information about the financial condition of the customers. During the year ended December 31, 2021, we have not experienced significant credit losses based on management’s evaluation of collectability of our lease receivables. If management’s assumptions regarding the collectability of lease related receivables prove incorrect, we could experience credit losses in excess of what was recognized in rental and other revenues.
Non-GAAP Information
The Company believes that FFO, FFO available for common stockholders and FFO available for common stockholders per share are beneficial to management and investors and are important indicators of the performance of any equity REIT. Because these FFO calculations exclude such factors as depreciation, amortization and impairments of real estate assets and gains or losses from sales of operating real estate assets, which can vary among owners of identical assets in similar conditions based on historical cost accounting and useful life estimates, they facilitate comparisons of operating performance between periods and between other REITs. Management believes that historical cost accounting for real estate assets in accordance with GAAP implicitly assumes that the value of real estate assets diminishes predictably over time. Since real estate values have historically risen or fallen with market conditions, management believes the use of FFO, FFO available for common stockholders and FFO available for common stockholders per share, together with the required GAAP presentations, provides a more complete understanding of the Company’s performance relative to its competitors and a more informed and appropriate basis on which to make decisions involving operating, financing and investing activities.
FFO, FFO available for common stockholders and FFO available for common stockholders per share are non-GAAP financial measures and therefore do not represent net income or net income per share as defined by GAAP. Net income and net income per share as defined by GAAP are the most relevant measures in determining the Company’s operating performance because these FFO measures include adjustments that investors may deem subjective, such as adding back expenses such as depreciation, amortization and impairments. Furthermore, FFO available for common stockholders per share does not depict the amount that accrues directly to the stockholders’ benefit. Accordingly, FFO, FFO available for common stockholders and FFO available for common stockholders per share should never be considered as alternatives to net income, net income available for common stockholders, or net income available for common stockholders per share as indicators of the Company’s operating performance.
The Company’s presentation of FFO is consistent with FFO as defined by the National Association of Real Estate Investment Trusts (“NAREIT”), which is calculated as follows:
•Net income/(loss) computed in accordance with GAAP;
•Less net income attributable to noncontrolling interests in consolidated affiliates;
•Plus depreciation and amortization of depreciable operating properties;
•Less gains, or plus losses, from sales of depreciable operating properties, plus impairments on depreciable operating properties and excluding items that are classified as extraordinary items under GAAP;
•Plus or minus our share of adjustments, including depreciation and amortization of depreciable operating properties, for unconsolidated joint venture investments (to reflect funds from operations on the same basis); and
•Plus or minus adjustments for depreciation and amortization and gains/(losses) on sales of depreciable operating properties, plus impairments on depreciable operating properties, and noncontrolling interests in consolidated affiliates related to discontinued operations.
In calculating FFO, the Company includes net income attributable to noncontrolling interests in the Operating Partnership, which the Company believes is consistent with standard industry practice for REITs that operate through an UPREIT structure. The Company believes that it is important to present FFO on an as-converted basis since all of the Common Units not owned by the Company are redeemable on a one-for-one basis for shares of its Common Stock.
The following table sets forth the Company’s FFO, FFO available for common stockholders and FFO available for common stockholders per share (in thousands, except per share amounts):
| | | | | | | | | | | | | | | | | |
| Year Ended December 31, |
| 2021 | | 2020 | | 2019 |
| Funds from operations: | | | | | |
| Net income | $ | 323,310 | | | $ | 357,914 | | | $ | 141,683 | |
| Net (income) attributable to noncontrolling interests in consolidated affiliates | (1,712) | | | (1,174) | | | (1,214) | |
| Depreciation and amortization of real estate assets | 256,488 | | | 238,816 | | | 251,545 | |
| Impairments of depreciable properties | — | | | 1,778 | | | 1,400 | |
| (Gains) on disposition of depreciable properties | (163,065) | | | (215,173) | | | (38,582) | |
| | | | | |
| | | | | |
| Unconsolidated affiliates: | | | | | |
| Depreciation and amortization of real estate assets | 778 | | | 2,395 | | | 2,425 | |
| | | | | |
| | | | | |
| | | | | |
| | | | | |
| | | | | |
| | | | | |
| | | | | |
| Funds from operations | 415,799 | | | 384,556 | | | 357,257 | |
| Dividends on Preferred Stock | (2,486) | | | (2,488) | | | (2,488) | |
| | | | | |
| Funds from operations available for common stockholders | $ | 413,313 | | | $ | 382,068 | | | $ | 354,769 | |
| Funds from operations available for common stockholders per share | $ | 3.86 | | | $ | 3.58 | | | $ | 3.33 | |
Weighted average shares outstanding (1) | 107,061 | | | 106,714 | | | 106,445 | |
__________
(1)Includes assumed conversion of all potentially dilutive Common Stock equivalents.
In addition, the Company believes NOI and same property NOI are useful supplemental measures of the Company’s property operating performance because such metrics provide a performance measure of the revenues and expenses directly involved in owning real estate assets and a perspective not immediately apparent from net income or FFO. The Company defines NOI as rental and other revenues less rental property and other expenses. The Company defines cash NOI as NOI less lease termination fees, straight-line rent, amortization of lease incentives and amortization of acquired above and below market leases. Other REITs may use different methodologies to calculate NOI, same property NOI and cash NOI.
As of December 31, 2021, our same property portfolio consisted of 148 in-service properties encompassing 24.2 million rentable square feet that were wholly owned during the entirety of the periods presented (from January 1, 2020 to December 31, 2021). As of December 31, 2020, our same property portfolio consisted of 159 in-service properties encompassing 24.4 million rentable square feet that were wholly owned during the entirety of the periods presented (from January 1, 2019 to December 31, 2020). The change in our same property portfolio was due to the addition of one property encompassing 0.8 million rentable square feet acquired during 2019 and three newly developed properties encompassing 0.7 million rentable square feet placed in service during 2019. These additions were offset by the removal of 15 properties (13 office properties and two amenity retail properties) encompassing 1.7 million rentable square feet that were sold during 2021.
Rental and other revenues related to properties not in our same property portfolio were $90.4 million and $65.8 million for the years ended December 31, 2021 and 2020, respectively. Rental property and other expenses related to properties not in our same property portfolio were $26.3 million and $22.7 million for the years ended December 31, 2021 and 2020, respectively.
The following table sets forth the Company’s NOI, same property NOI and same property cash NOI (in thousands):
| | | | | | | | | | | | | | |
| | Year Ended December 31, |
| | 2021 | | 2020 |
Net income | | $ | 323,310 | | | $ | 357,914 | |
| Equity in earnings of unconsolidated affiliates | | (1,947) | | | (4,005) | |
| Gains on disposition of property | | (174,059) | | | (215,897) | |
| Other loss | | (1,394) | | | 1,707 | |
| Interest expense | | 85,853 | | | 80,962 | |
| General and administrative expenses | | 40,553 | | | 41,031 | |
| Impairments of real estate assets | | — | | | 1,778 | |
| Depreciation and amortization | | 259,255 | | | 241,585 | |
| Net operating income | | 531,571 | | | 505,075 | |
| Non same property and other net operating income | | (64,185) | | | (43,099) | |
| Same property net operating income | | $ | 467,386 | | | $ | 461,976 | |
| | | | |
| | | | |
| | | | |
| | | | |
| | | | |
| | | | |
| | | | |
| | | | |
| | | | |
| Same property net operating income | | $ | 467,386 | | | $ | 461,976 | |
Lease termination fees, straight-line rent and other non-cash adjustments (1) | | (13,666) | | | (38,146) | |
| Same property cash net operating income | | $ | 453,720 | | | $ | 423,830 | |
| | | | |
| | | | |
| | | | |
__________
(1) Includes $2.9 million of repayments of temporary rent deferrals, net of additional temporary rent deferrals granted by the Company during the year ended December 31, 2021, and $3.6 million of temporary rent deferrals, net of repayments, granted by the Company during the year ended December 31, 2020.
ITEM 7A. QUANTITATIVE AND QUALITATIVE DISCLOSURES ABOUT MARKET RISK
The effects of potential changes in interest rates are discussed below. Our market risk discussion includes “forward-looking statements” and represents an estimate of possible changes in fair value or future earnings that would occur assuming hypothetical future movements in interest rates. Actual future results may differ materially from those presented. See “Item 7. Management’s Discussion and Analysis of Financial Condition and Results of Operations - Liquidity and Capital Resources” and the Notes to Consolidated Financial Statements for a description of our accounting policies and other information related to these financial instruments.
We borrow funds at a combination of fixed and variable rates. Borrowings under our revolving credit facility and bank term loans bear interest at variable rates. Our long-term debt, which consists of secured and unsecured long-term financings, typically bears interest at fixed rates. Our interest rate risk management objectives are to limit generally the impact of interest rate changes on earnings and cash flows and lower our overall borrowing costs. To achieve these objectives, from time to time we enter into interest rate hedge contracts such as collars, swaps, caps and treasury lock agreements in order to mitigate our interest rate risk with respect to existing and prospective debt instruments. We generally do not hold or issue these derivative contracts for trading or speculative purposes.
At December 31, 2021, we had $2,534.1 million principal amount of fixed rate debt outstanding, a $250.1 million increase as compared to December 31, 2020, excluding debt with a variable rate that is effectively fixed by related interest rate hedge contracts. The estimated aggregate fair market value of this debt was $2,652.2 million. If interest rates had been 100 basis points higher, the aggregate fair market value of our fixed rate debt would have been $160.5 million lower. If interest rates had been 100 basis points lower, the aggregate fair market value of our fixed rate debt would have been $174.0 million higher.
At December 31, 2021, we had $220.0 million of variable rate debt outstanding not protected by interest rate hedge contracts, a $70.0 million increase as compared to December 31, 2020. If the weighted average interest rate on this variable rate debt had been 100 basis points higher or lower, the annual interest expense at December 31, 2021 would increase or decrease by $2.2 million.
See “Item 1A. Risk Factors – Risks Related to our Financing Activities – Increases in interest rates would increase our interest expense.”
At December 31, 2021, we had $50.0 million of variable rate debt outstanding with $50.0 million of related floating-to-fixed interest rate swaps. These swaps effectively fix the underlying one-month LIBOR rate at a weighted average rate of 1.693%. If the underlying LIBOR interest rates increase or decrease by 100 basis points, the aggregate fair market value of the swaps at December 31, 2021 would increase or decrease by less than $0.1 million. As of January 28, 2022, these interest rate swaps have expired.
We are exposed to certain losses in the event of nonperformance by the counterparties, which are major financial institutions, under the swaps. We regularly evaluate the financial condition of our counterparties using publicly available information. Based on this review, we currently expect the counterparties to perform fully under the swaps. However, if a counterparty defaults on its obligations under a swap, we could be required to pay the full rates on the applicable debt, even if such rates were in excess of the rate in the contract.
ITEM 8. FINANCIAL STATEMENTS AND SUPPLEMENTARY DATA
| | |
See page 52 for Index to Consolidated Financial Statements of Highwoods Properties, Inc. and Highwoods Realty Limited Partnership. |
ITEM 9. CHANGES IN AND DISAGREEMENTS WITH ACCOUNTANTS ON ACCOUNTING AND FINANCIAL DISCLOSURE
None.
ITEM 9A. CONTROLS AND PROCEDURES
General
The purpose of this section is to discuss our controls and procedures. The statements in this section represent the conclusions of Theodore J. Klinck, the Company’s President and Chief Executive Officer (“CEO”), and Brendan C. Maiorana, the Company’s Executive Vice President and Chief Financial Officer (“CFO”).
The CEO and CFO evaluations of our controls and procedures include a review of the controls’ objectives and design, the controls’ implementation by us and the effect of the controls on the information generated for use in this Annual Report. We seek to identify data errors, control problems or acts of fraud and confirm that appropriate corrective action, including process improvements, is undertaken. Our controls and procedures are also evaluated on an ongoing basis by or through the following:
•activities undertaken and reports issued by employees responsible for testing our internal control over financial reporting;
•quarterly sub-certifications by representatives from appropriate business and accounting functions to support the CEO’s and CFO’s evaluations of our controls and procedures;
•other personnel in our finance and accounting organization;
•members of our internal disclosure committee; and
•members of the audit committee of the Company’s Board of Directors.
We do not expect that our controls and procedures will prevent all errors and all fraud. A control system, no matter how well conceived and operated, can provide only reasonable, not absolute, assurance that the objectives of the control system are met. Further, the design of controls and procedures must reflect the fact that there are resource constraints, and the benefits of controls must be considered relative to their costs. Because of the inherent limitations in all control systems, no evaluation of controls can provide absolute assurance that all control issues and instances of fraud, if any, have been detected. These inherent limitations include the realities that judgments in decision-making can be faulty and that breakdowns can occur because of a simple error or mistake. Additionally, controls can be circumvented by the individual acts of some persons, by collusion of two or more people, or by management override of the control. The design of any system of controls also is based in part upon certain assumptions about the likelihood of future events, and there can be no assurance that any design will succeed in achieving its stated goals under all potential future conditions.
Management’s Annual Report on the Company’s Internal Control Over Financial Reporting
The Company’s management is required to establish and maintain internal control over financial reporting designed to provide reasonable assurance regarding the reliability of financial reporting and the preparation of financial statements for external purposes in accordance with GAAP. Internal control over financial reporting includes those policies and procedures that:
•pertain to the maintenance of records that in reasonable detail accurately and fairly reflect transactions and dispositions of assets;
•provide reasonable assurance that transactions are recorded as necessary to permit preparation of financial statements in accordance with GAAP, and that receipts and expenditures are being made only in accordance with authorizations of management and directors; and
•provide reasonable assurance regarding prevention or timely detection of unauthorized acquisition, use or disposition of assets that could have a material effect on the financial statements.
Under the supervision of the Company’s CEO and CFO, we conducted an evaluation of the effectiveness of the Company’s internal control over financial reporting at December 31, 2021 based on the criteria established in Internal Control - Integrated Framework (2013) issued by the Committee of Sponsoring Organizations of the Treadway Commission.
We have concluded that, at December 31, 2021, the Company’s internal control over financial reporting was effective. Deloitte & Touche LLP, our independent registered public accounting firm, has issued their attestation report, which is included below, on the effectiveness of the Company’s internal control over financial reporting as of December 31, 2021.
Management’s Annual Report on the Operating Partnership’s Internal Control Over Financial Reporting
The Operating Partnership is also required to establish and maintain internal control over financial reporting designed to provide reasonable assurance regarding the reliability of financial reporting and the preparation of financial statements for external purposes in accordance with GAAP.
Under the supervision of the Company’s CEO and CFO, we conducted an evaluation of the effectiveness of the Operating Partnership’s internal control over financial reporting at December 31, 2021 based on the criteria established in Internal Control - Integrated Framework (2013) issued by the Committee of Sponsoring Organizations of the Treadway Commission.
We have concluded that, as of December 31, 2021, the Operating Partnership’s internal control over financial reporting was effective. SEC rules do not require us to obtain an attestation report of Deloitte & Touche LLP on the effectiveness of the Operating Partnership’s internal control over financial reporting.
REPORT OF INDEPENDENT REGISTERED PUBLIC ACCOUNTING FIRM
To the Stockholders and the Board of Directors of Highwoods Properties, Inc.:
Opinion on Internal Control over Financial Reporting
We have audited the internal control over financial reporting of Highwoods Properties, Inc. and subsidiaries (the “Company”) as of December 31, 2021, based on criteria established in Internal Control-Integrated Framework (2013) issued by the Committee of Sponsoring Organizations of the Treadway Commission (COSO). In our opinion, the Company maintained, in all material respects, effective internal control over financial reporting as of December 31, 2021, based on criteria established in Internal Control-Integrated Framework (2013) issued by COSO.
We have also audited, in accordance with the standards of the Public Company Accounting Oversight Board (United States) (PCAOB), the consolidated financial statements as of and for the year ended December 31, 2021 of the Company and our report dated February 8, 2022 expressed an unqualified opinion on those financial statements.
Basis for Opinion
The Company’s management is responsible for maintaining effective internal control over financial reporting and for its assessment of the effectiveness of internal control over financial reporting, included in the accompanying Management’s Annual Report on the Company’s Internal Control Over Financial Reporting. Our responsibility is to express an opinion on the Company’s internal control over financial reporting based on our audit. We are a public accounting firm registered with the PCAOB and are required to be independent with respect to the Company in accordance with the US federal securities laws and the applicable rules and regulations of the Securities and Exchange Commission and the PCAOB.
We conducted our audit in accordance with the standards of the PCAOB. Those standards require that we plan and perform the audit to obtain reasonable assurance about whether effective internal control over financial reporting was maintained in all material respects. Our audit included obtaining an understanding of internal control over financial reporting, assessing the risk that a material weakness exists, testing and evaluating the design and operating effectiveness of internal control based on the assessed risk, and performing such other procedures as we considered necessary in the circumstances. We believe that our audit provides a reasonable basis for our opinion.
Definition and Limitations of Internal Control Over Financial Reporting
A company’s internal control over financial reporting is a process designed to provide reasonable assurance regarding the reliability of financial reporting and the preparation of financial statements for external purposes in accordance with accounting principles generally accepted in the United States of America (“generally accepted accounting principles”). A company’s internal control over financial reporting includes those policies and procedures that (1) pertain to the maintenance of records that, in reasonable detail, accurately and fairly reflect the transactions and dispositions of the assets of the company; (2) provide reasonable assurance that transactions are recorded as necessary to permit preparation of financial statements in accordance with generally accepted accounting principles, and that receipts and expenditures of the company are being made only in accordance with authorizations of management and directors of the company; and (3) provide reasonable assurance regarding prevention or timely detection of unauthorized acquisition, use, or disposition of the company’s assets that could have a material effect on the financial statements.
Because of its inherent limitations, internal control over financial reporting may not prevent or detect misstatements. Also, projections of any evaluation of effectiveness to future periods are subject to the risk that controls may become inadequate because of changes in conditions, or that the degree of compliance with the policies or procedures may deteriorate.
/s/ Deloitte & Touche LLP
Raleigh, North Carolina
February 8, 2022
Changes in Internal Control Over Financial Reporting
There were no changes in the Company’s internal control over financial reporting during the fourth quarter of 2021 that materially affected, or are reasonably likely to materially affect, the Company’s internal control over financial reporting. There were also no changes in the Operating Partnership’s internal control over financial reporting during the fourth quarter of 2021 that materially affected, or are reasonably likely to materially affect, the Operating Partnership’s internal control over financial reporting.
Disclosure Controls and Procedures
SEC rules require us to maintain disclosure controls and procedures that are designed to ensure that information required to be disclosed in our annual and periodic reports filed with the SEC is recorded, processed, summarized and reported within the time periods specified in the SEC’s rules and forms. As defined in Rule 13a-15(e) under the Exchange Act, disclosure controls and procedures include, without limitation, controls and procedures designed to ensure that information required to be disclosed by us is accumulated and communicated to our management, including the Company’s CEO and CFO, to allow for timely decisions regarding required disclosure. The Company’s CEO and CFO concluded that the Company’s disclosure controls and procedures were effective at the end of the period covered by this Annual Report. The Company’s CEO and CFO also concluded that the Operating Partnership’s disclosure controls and procedures were effective at the end of the period covered by this Annual Report.
ITEM 9B. OTHER INFORMATION
None.
ITEM 9C. DISCLOSURE REGARDING FOREIGN JURISDICTIONS THAT PREVENT INSPECTIONS
Not applicable.
PART III
ITEM 10. DIRECTORS, EXECUTIVE OFFICERS AND CORPORATE GOVERNANCE
Information about the Company’s executive officers and directors, the code of ethics that applies to the Company’s chief executive officer and senior financial officers, which is posted on our website, and certain corporate governance matters is incorporated herein by reference to the Company’s Proxy Statement to be filed in connection with its annual meeting of stockholders to be held on May 10, 2022. No changes have been made to the procedures by which stockholders may recommend nominees to the Company’s board of directors since the 2021 annual meeting, which was held on May 11, 2021. See Item X in Part I of this Annual Report for biographical information regarding the Company’s executive officers. The Company is the sole general partner of the Operating Partnership.
ITEM 11. EXECUTIVE COMPENSATION
Information about the compensation of the Company’s directors and executive officers is incorporated herein by reference to the Company’s Proxy Statement to be filed in connection with its annual meeting of stockholders to be held on May 10, 2022.
ITEM 12. SECURITY OWNERSHIP OF CERTAIN BENEFICIAL OWNERS AND MANAGEMENT AND RELATED STOCKHOLDER MATTERS
Information about the beneficial ownership of Common Stock and the Company’s equity compensation plans is incorporated herein by reference to the Company’s Proxy Statement to be filed in connection with its annual meeting of stockholders to be held on May 10, 2022.
ITEM 13. CERTAIN RELATIONSHIPS AND RELATED TRANSACTIONS AND DIRECTOR INDEPENDENCE
Information about certain relationships and related transactions, if any, and the independence of the Company’s directors is incorporated herein by reference to the Company’s Proxy Statement to be filed in connection with its annual meeting of stockholders to be held on May 10, 2022.
ITEM 14. PRINCIPAL ACCOUNTANT FEES AND SERVICES
Information about fees paid to and services provided by our independent registered public accounting firm is incorporated herein by reference to the Company’s Proxy Statement to be filed in connection with its annual meeting of stockholders to be held on May 10, 2022.
PART IV
ITEM 15. EXHIBITS AND FINANCIAL STATEMENT SCHEDULES
| | |
Reference is made to the Index to Consolidated Financial Statements on page 52 for a list of the Consolidated Financial Statements of Highwoods Properties, Inc. and Highwoods Realty Limited Partnership included in this report. |
Exhibits
| | | | | | | | |
Exhibit
Number | | Description |
| 1 | | |
| 3.1 | | |
| 3.2 | | |
| 4.1 | | |
| 4.2 | | |
| 4.3 | | |
| 4.4 | | |
| 4.5 | | |
| 4.6 | | |
| 4.7 | | |
| 4.8 | | |
| 4.9 | | |
| 4.10 | | |
| 4.11 | | |
| 4.12 | | |
| 4.13 | | |
| 4.14 | | |
| 10.1 | | |
| 10.2 | | |
| 10.3 | | |
| 10.4 | * | |
| | | | | | | | |
Exhibit
Number | | Description |
| 10.5 | | |
| 10.6 | * | |
| 10.7 | * | |
| 10.8 | * | |
| 10.9 | * | |
| 10.10 | * | |
| 10.11 | * | |
| 10.12 | | Sixth Amended and Restated Credit Agreement, dated as of March 18, 2021, by and among the Company, the Operating Partnership, Bank of America, N.A., as Administrative Agent, Wells Fargo Bank, National Association and PNC Bank, National Association, as Co-Syndication Agents, and the Other Lenders named therein (filed as part of the Company’s Current Report on Form 8-K dated March 19, 2021) |
| 10.13 | * | |
| 21 | | |
| 23.1 | | |
| 23.2 | | |
| 31.1 | | |
| 31.2 | | |
| 31.3 | | |
| 31.4 | | |
| 32.1 | | |
| 32.2 | | |
| 32.3 | | |
| 32.4 | | |
| 101.INS | | Inline XBRL Instance Document (the instance document does not appear in the interactive data file because its XBRL tags are embedded within the Inline XBRL document) |
| 101.SCH | | Inline XBRL Taxonomy Extension Schema Document |
| 101.CAL | | Inline XBRL Taxonomy Extension Calculation Linkbase Document |
| 101.DEF | | Inline XBRL Taxonomy Extension Definition Linkbase Document |
| 101.LAB | | Inline XBRL Taxonomy Extension Labels Linkbase Document |
| 101.PRE | | Inline XBRL Taxonomy Extension Presentation Linkbase Document |
| 104 | | Cover Page Interactive Data File (formatted as Inline XBRL and contained in Exhibit 101) |
__________
* Represents management contract or compensatory plan.
INDEX TO CONSOLIDATED FINANCIAL STATEMENTS
| | | | | |
| Page |
| |
| Highwoods Properties, Inc. | |
| |
| |
| |
| |
| |
| |
| |
| |
| Highwoods Realty Limited Partnership: | |
| |
| |
| |
| |
| |
| |
| |
| |
| |
| |
| |
__________
All other schedules are omitted because they are not applicable or because the required information is included in our Consolidated Financial Statements or notes thereto.
REPORT OF INDEPENDENT REGISTERED PUBLIC ACCOUNTING FIRM
To the Stockholders and the Board of Directors of Highwoods Properties, Inc.:
Opinion on the Financial Statements
We have audited the accompanying consolidated balance sheets of Highwoods Properties, Inc. and subsidiaries (the “Company”) as of December 31, 2021 and 2020, the related consolidated statements of income, comprehensive income, equity, and cash flows for each of the three years in the period ended December 31, 2021, and the related notes and the schedule listed in the Index at Item 15 (collectively, the “financial statements”). In our opinion, the financial statements present fairly, in all material respects, the financial position of the Company as of December 31, 2021 and 2020, and the results of its operations and its cash flows for each of the three years in the period ended December 31, 2021, in conformity with accounting principles generally accepted in the United States of America.
We have also audited, in accordance with the standards of the Public Company Accounting Oversight Board (United States) (PCAOB), the Company’s internal control over financial reporting as of December 31, 2021, based on criteria established in Internal Control-Integrated Framework (2013) issued by the Committee of Sponsoring Organizations of the Treadway Commission and our report dated February 8, 2022, expressed an unqualified opinion on the Company’s internal control over financial reporting.
Basis for Opinion
These financial statements are the responsibility of the Company’s management. Our responsibility is to express an opinion on the Company’s financial statements based on our audits. We are a public accounting firm registered with the PCAOB and are required to be independent with respect to the Company in accordance with the U.S. federal securities laws and the applicable rules and regulations of the Securities and Exchange Commission and the PCAOB.
We conducted our audits in accordance with the standards of the PCAOB. Those standards require that we plan and perform the audit to obtain reasonable assurance about whether the financial statements are free of material misstatement, whether due to error or fraud. Our audits included performing procedures to assess the risks of material misstatement of the financial statements, whether due to error or fraud, and performing procedures that respond to those risks. Such procedures included examining, on a test basis, evidence regarding the amounts and disclosures in the financial statements. Our audits also included evaluating the accounting principles used and significant estimates made by management, as well as evaluating the overall presentation of the financial statements. We believe that our audits provide a reasonable basis for our opinion.
Critical Audit Matters
The critical audit matters communicated below are matters arising from the current-period audit of the financial statements that were communicated or required to be communicated to the audit committee and that (1) relate to accounts or disclosures that are material to the financial statements and (2) involved our especially challenging, subjective, or complex judgments. The communication of critical audit matters does not alter in any way our opinion on the financial statements, taken as a whole, and we are not, by communicating the critical audit matters below, providing separate opinions on the critical audit matters or on the accounts or disclosures to which they relate.
Impairment of Real Estate Assets - Refer to Note 1 to the financial statements
Critical Audit Matter Description
The Company performs an impairment analysis of properties which begins with an evaluation of events or changes in circumstances that may indicate that the carrying value may not be recoverable, such as a significant decline in occupancy, identification of materially adverse legal or environmental factors, a change in the designation of an asset from core to non-core, which may impact the anticipated holding period, or a decline in market value to an amount less than cost.
The Company makes judgments that determine whether specific real estate assets possess indicators of impairment. Changes in those judgments could have a material impact on the real estate assets that are identified for further analysis.
Given the Company’s evaluation of possible indications of impairment of real estate assets requires management to make judgments, performing audit procedures to evaluate whether management appropriately identified events or changes in
circumstances indicating that the carrying amounts of real estate assets may not be recoverable required a high degree of auditor judgment.
How the Critical Audit Matter Was Addressed in the Audit
Our audit procedures related to the evaluation of real estate assets for possible indications of impairment included the following, among others:
•We tested the effectiveness of controls over management’s identification of possible circumstances that may indicate that the carrying amounts of real estate assets are no longer recoverable, including controls over management’s designation of an asset as core or non-core, occupancy and management’s estimates of fair values.
•We evaluated management’s identification of impairment indicators by developing an independent determination if properties exhibit an indicator of impairment by:
–Inquiring of management and reading investment committee and board minutes to identify properties that should be evaluated as non-core and therefore may impact the anticipated holding period.
–Testing real estate assets for possible indications of impairment, including searching for adverse asset-specific circumstances and/or market conditions by reading questionnaires to regional property managers and using reputable market surveys.
–With the assistance of our fair value specialists, developing an independent expectation of impairment indicators and comparing such expectation to management’s analysis.
Real Estate and Related Assets—Acquisitions—Refer to Note 1, 3 and 6 to the financial statements
Critical Audit Matter Description
During 2021, the Company acquired a portfolio of real estate assets in Charlotte, Raleigh, and Atlanta for a net purchase price of $653.5 million and acquired its joint venture partner’s 75.0% interest in a portfolio of assets in Raleigh for a net purchase price of $131.3 million. The Company accounted for these transactions as asset acquisitions.
The purchase prices paid for the assets acquired and liabilities assumed was allocated, based on relative fair values as determined by management, with the assistance of third-party specialists, to land, buildings, tenant improvements and intangible assets and liabilities such as above and below market leases and acquired in-place leases. Management assessed the relative fair value based on estimated cash flow projections that utilized discount and capitalization rates as well as available market information.
Above and below market secured loans assumed in the transactions were assessed based on the present value of the difference between the property specific mortgage interest rate and the market interest rate over the years to maturity of the loan.
Given the allocation of relative fair value to the assets acquired and liabilities assumed and the determination of the above and below market debt value required management to make significant estimates related to assumptions such as discount rates, capitalization rates, market rental rates, land values and market interest rates, performing audit procedures to evaluate the reasonableness of these assumptions required a high degree of auditor judgment and an increased extent of effort, including the need to involve our fair value specialists.
How the Critical Audit Matter Was Addressed in the Audit
Our audit procedures related to the relative fair value of assets acquired and liabilities assumed included the following, among others:
•We tested the effectiveness of controls over the purchase price allocations, including management’s controls over the review of the third-party appraisals, the identification of real estate assets, intangible assets and liabilities and the valuation methodology for estimating the relative fair value of assets acquired and liabilities assumed.
•With the assistance of our fair value specialists, we evaluated the reasonableness of the valuation methodology, discount rates, capitalization rates, market rental rates, land values and market interest rates by developing a range of independent estimates and comparing our estimates to those used by management.
•We tested the mathematical accuracy of the valuation models and the source information underlying the determination of the intangible assets and liabilities fair value.
/s/ Deloitte & Touche LLP
Raleigh, North Carolina
February 8, 2022
We have served as the Company’s auditor since 2006.
HIGHWOODS PROPERTIES, INC.
Consolidated Balance Sheets
(in thousands, except share and per share data)
| | | | | | | | | | | |
| December 31, |
| 2021 | | 2020 |
| | | |
| Assets: | | | |
| Real estate assets, at cost: | | | |
| Land | $ | 549,228 | | | $ | 466,872 | |
| Buildings and tenant improvements | 5,718,169 | | | 4,981,637 | |
| Development in-process | 6,890 | | | 259,681 | |
| Land held for development | 215,257 | | | 131,474 | |
| 6,489,544 | | | 5,839,664 | |
| Less-accumulated depreciation | (1,457,511) | | | (1,418,379) | |
| Net real estate assets | 5,032,033 | | | 4,421,285 | |
| | | |
| Real estate and other assets, net, held for sale | 3,518 | | | 11,360 | |
| Cash and cash equivalents | 23,152 | | | 109,322 | |
| Restricted cash | 8,046 | | | 79,922 | |
| Accounts receivable | 14,002 | | | 27,488 | |
| Mortgages and notes receivable | 1,227 | | | 1,341 | |
| Accrued straight-line rents receivable | 268,324 | | | 259,381 | |
| Investments in and advances to unconsolidated affiliates | 7,383 | | | 27,104 | |
Deferred leasing costs, net of accumulated amortization of $143,111 and $151,698, respectively | 258,902 | | | 209,329 | |
Prepaid expenses and other assets, net of accumulated depreciation of $21,408 and $21,154, respectively | 78,551 | | | 62,885 | |
| Total Assets | $ | 5,695,138 | | | $ | 5,209,417 | |
| Liabilities, Noncontrolling Interests in the Operating Partnership and Equity: | | | |
| Mortgages and notes payable, net | $ | 2,788,915 | | | $ | 2,470,021 | |
| Accounts payable, accrued expenses and other liabilities | 294,976 | | | 268,727 | |
| | | |
| | | |
| Total Liabilities | 3,083,891 | | | 2,738,748 | |
| Commitments and contingencies | | | |
| Noncontrolling interests in the Operating Partnership | 111,689 | | | 112,499 | |
| Equity: | | | |
Preferred Stock, $0.01 par value, 50,000,000 authorized shares; | | | |
8.625% Series A Cumulative Redeemable Preferred Shares (liquidation preference $1,000 per share), 28,821 and 28,826 shares issued and outstanding, respectively | 28,821 | | | 28,826 | |
Common Stock, $0.01 par value, 200,000,000 authorized shares; | | | |
104,892,780 and 103,921,546 shares issued and outstanding, respectively | 1,049 | | | 1,039 | |
| Additional paid-in capital | 3,027,861 | | | 2,993,946 | |
| Distributions in excess of net income available for common stockholders | (579,616) | | | (686,225) | |
| Accumulated other comprehensive loss | (973) | | | (1,462) | |
| Total Stockholders’ Equity | 2,477,142 | | | 2,336,124 | |
| Noncontrolling interests in consolidated affiliates | 22,416 | | | 22,046 | |
| Total Equity | 2,499,558 | | | 2,358,170 | |
| Total Liabilities, Noncontrolling Interests in the Operating Partnership and Equity | $ | 5,695,138 | | | $ | 5,209,417 | |
See accompanying notes to consolidated financial statements.
HIGHWOODS PROPERTIES, INC.
Consolidated Statements of Income
(in thousands, except per share amounts)
| | | | | | | | | | | | | | | | | |
| Year Ended December 31, |
| 2021 | | 2020 | | 2019 |
| Rental and other revenues | $ | 768,007 | | | $ | 736,900 | | | $ | 735,979 | |
| Operating expenses: | | | | | |
| Rental property and other expenses | 236,436 | | | 231,825 | | | 248,511 | |
| Depreciation and amortization | 259,255 | | | 241,585 | | | 254,504 | |
| Impairments of real estate assets | — | | | 1,778 | | | 5,849 | |
| General and administrative | 40,553 | | | 41,031 | | | 44,067 | |
| Total operating expenses | 536,244 | | | 516,219 | | | 552,931 | |
| | | | | |
| | | | | |
| | | | | |
| | | | | |
| Interest expense | 85,853 | | | 80,962 | | | 81,648 | |
| | | | | |
| | | | | |
| | | | | |
| Other income/(loss) | 1,394 | | | (1,707) | | | (2,510) | |
| | | | | |
| Gains on disposition of property | 174,059 | | | 215,897 | | | 39,517 | |
| | | | | |
| | | | | |
| | | | | |
| Equity in earnings of unconsolidated affiliates | 1,947 | | | 4,005 | | | 3,276 | |
| | | | | |
| | | | | |
| | | | | |
| | | | | |
| | | | | |
| | | | | |
| Net income | 323,310 | | | 357,914 | | | 141,683 | |
| Net (income) attributable to noncontrolling interests in the Operating Partnership | (8,321) | | | (9,338) | | | (3,551) | |
| Net (income) attributable to noncontrolling interests in consolidated affiliates | (1,712) | | | (1,174) | | | (1,214) | |
| Dividends on Preferred Stock | (2,486) | | | (2,488) | | | (2,488) | |
| | | | | |
| Net income available for common stockholders | $ | 310,791 | | | $ | 344,914 | | | $ | 134,430 | |
| Earnings per Common Share – basic: | | | | | |
| | | | | |
| | | | | |
| Net income available for common stockholders | $ | 2.98 | | | $ | 3.32 | | | $ | 1.30 | |
| Weighted average Common Shares outstanding – basic | 104,232 | | | 103,876 | | | 103,692 | |
| Earnings per Common Share – diluted: | | | | | |
| | | | | |
| | | | | |
| Net income available for common stockholders | $ | 2.98 | | | $ | 3.32 | | | $ | 1.30 | |
| Weighted average Common Shares outstanding – diluted | 107,061 | | | 106,714 | | | 106,445 | |
| | | | | |
| | | | | |
| | | | | |
| | | | | |
See accompanying notes to consolidated financial statements.
HIGHWOODS PROPERTIES, INC.
Consolidated Statements of Comprehensive Income
(in thousands)
| | | | | | | | | | | | | | | | | |
| Year Ended December 31, |
| 2021 | | 2020 | | 2019 |
| Comprehensive income: | | | | | |
| Net income | $ | 323,310 | | | $ | 357,914 | | | $ | 141,683 | |
| Other comprehensive income/(loss): | | | | | |
| | | | | |
| Unrealized losses on cash flow hedges | (19) | | | (1,238) | | | (9,134) | |
| Amortization of cash flow hedges | 508 | | | 247 | | | (1,250) | |
| | | | | |
| Total other comprehensive income/(loss) | 489 | | | (991) | | | (10,384) | |
| Total comprehensive income | 323,799 | | | 356,923 | | | 131,299 | |
| Less-comprehensive (income) attributable to noncontrolling interests | (10,033) | | | (10,512) | | | (4,765) | |
| Comprehensive income attributable to common stockholders | $ | 313,766 | | | $ | 346,411 | | | $ | 126,534 | |
See accompanying notes to consolidated financial statements.
HIGHWOODS PROPERTIES, INC.
Consolidated Statements of Equity
(in thousands, except share amounts)
| | | | | | | | | | | | | | | | | | | | | | | | | | | | | | | | | | | | | | | | | | | | | | | |
| Number of Common Shares | | Common Stock | | Series A Cumulative Redeemable Preferred Shares | | Additional Paid-In Capital | | Accumulated Other Compre-hensive Income/(Loss) | | Non-controlling Interests in Consolidated Affiliates | | Distributions in Excess of Net Income Available for Common Stockholders | | Total |
| Balance at December 31, 2018 | 103,557,065 | | | $ | 1,036 | | | $ | 28,877 | | | $ | 2,976,197 | | | $ | 9,913 | | | $ | 17,576 | | | $ | (769,303) | | | $ | 2,264,296 | |
| Issuances of Common Stock, net of issuance costs and tax withholdings | (143) | | | — | | | — | | | 298 | | | — | | | — | | | — | | | 298 | |
| Conversions of Common Units to Common Stock | 15,000 | | | — | | | — | | | 663 | | | — | | | — | | | — | | | 663 | |
Dividends on Common Stock ($1.90 per share) | | | — | | | — | | | — | | | — | | | — | | | (196,935) | | | (196,935) | |
| | | | | | | | | | | | | | | |
Dividends on Preferred Stock ($86.25 per share) | | | — | | | — | | | — | | | — | | | — | | | (2,488) | | | (2,488) | |
| Adjustment of noncontrolling interests in the Operating Partnership to fair value | | | — | | | — | | | (29,557) | | | — | | | — | | | — | | | (29,557) | |
| | | | | | | | | | | | | | | |
| Distributions to noncontrolling interests in consolidated affiliates | | | — | | | — | | | — | | | — | | | (1,767) | | | — | | | (1,767) | |
| Contributions from noncontrolling interests in consolidated affiliates | | | — | | | — | | | — | | | — | | | 4,987 | | | — | | | 4,987 | |
| Issuances of restricted stock | 190,934 | | | — | | | — | | | — | | | — | | | — | | | — | | | — | |
| Redemptions/repurchases of Preferred Stock | | | — | | | (18) | | | — | | | — | | | — | | | — | | | (18) | |
| Share-based compensation expense, net of forfeitures | (6,810) | | | 2 | | | — | | | 7,178 | | | — | | | — | | | — | | | 7,180 | |
| Net (income) attributable to noncontrolling interests in the Operating Partnership | | | — | | | — | | | — | | | — | | | — | | | (3,551) | | | (3,551) | |
| Net (income) attributable to noncontrolling interests in consolidated affiliates | | | — | | | — | | | — | | | — | | | 1,214 | | | (1,214) | | | — | |
| Comprehensive income: | | | | | | | | | | | | | | | |
| Net income | | | — | | | — | | | — | | | — | | | — | | | 141,683 | | | 141,683 | |
| Other comprehensive loss | | | — | | | — | | | — | | | (10,384) | | | — | | | — | | | (10,384) | |
| Total comprehensive income | | | | | | | | | | | | | | | 131,299 | |
| Balance at December 31, 2019 | 103,756,046 | | | 1,038 | | | 28,859 | | | 2,954,779 | | | (471) | | | 22,010 | | | (831,808) | | | 2,174,407 | |
| Issuances of Common Stock, net of issuance costs and tax withholdings | 19,377 | | | — | | | — | | | 2,196 | | | — | | | — | | | — | | | 2,196 | |
| Conversions of Common Units to Common Stock | 3,570 | | | — | | | — | | | 145 | | | — | | | — | | | — | | | 145 | |
Dividends on Common Stock ($1.92 per share) | | | — | | | — | | | — | | | — | | | — | | | (199,331) | | | (199,331) | |
| | | | | | | | | | | | | | | |
Dividends on Preferred Stock ($86.25 per share) | | | — | | | — | | | — | | | — | | | — | | | (2,488) | | | (2,488) | |
| Adjustment of noncontrolling interests in the Operating Partnership to fair value | | | — | | | — | | | 30,617 | | | — | | | — | | | — | | | 30,617 | |
| | | | | | | | | | | | | | | |
| Distributions to noncontrolling interests in consolidated affiliates | | | — | | | — | | | — | | | — | | | (1,138) | | | — | | | (1,138) | |
| | | | | | | | | | | | | | | |
| Issuances of restricted stock | 149,304 | | | — | | | — | | | — | | | — | | | — | | | — | | | — | |
Redemptions/repurchases of Preferred Stock | | | — | | | (33) | | | — | | | — | | | — | | | — | | | (33) | |
Share-based compensation expense, net of forfeitures | (6,751) | | | 1 | | | — | | | 6,209 | | | — | | | — | | | — | | | 6,210 | |
Net (income) attributable to noncontrolling interests in the Operating Partnership | | | — | | | — | | | — | | | — | | | — | | | (9,338) | | | (9,338) | |
Net (income) attributable to noncontrolling interests in consolidated affiliates | | | — | | | — | | | — | | | — | | | 1,174 | | | (1,174) | | | — | |
| Comprehensive income: | | | | | | | | | | | | | | | |
| Net income | | | — | | | — | | | — | | | — | | | — | | | 357,914 | | | 357,914 | |
| Other comprehensive loss | | | — | | | — | | | — | | | (991) | | | — | | | — | | | (991) | |
| Total comprehensive income | | | | | | | | | | | | | | | 356,923 | |
| Balance at December 31, 2020 | 103,921,546 | | | $ | 1,039 | | | $ | 28,826 | | | $ | 2,993,946 | | | $ | (1,462) | | | $ | 22,046 | | | $ | (686,225) | | | $ | 2,358,170 | |
| | | | | | | | | | | | | | | |
HIGHWOODS PROPERTIES, INC.
Consolidated Statements of Equity - Continued
(in thousands, except share amounts)
| | | | | | | | | | | | | | | | | | | | | | | | | | | | | | | | | | | | | | | | | | | | | | | |
| Number of Common Shares | | Common Stock | | Series A Cumulative Redeemable Preferred Shares | | Additional Paid-In Capital | | Accumulated Other Compre-hensive Income/(Loss) | | Non-controlling Interests in Consolidated Affiliates | | Distributions in Excess of Net Income Available for Common Stockholders | | Total |
| | | | | | | | | | | | | | | |
| | | | | | | | | | | | | | | |
| Balance at December 31, 2020 | 103,921,546 | | | $ | 1,039 | | | $ | 28,826 | | | $ | 2,993,946 | | | $ | (1,462) | | | $ | 22,046 | | | $ | (686,225) | | | $ | 2,358,170 | |
Issuances of Common Stock, net of issuance costs and tax withholdings | 459,477 | | | 8 | | | — | | | 21,656 | | | — | | | — | | | — | | | 21,664 | |
Conversions of Common Units to Common Stock | 333,920 | | | — | | | — | | | 15,076 | | | — | | | — | | | — | | | 15,076 | |
Dividends on Common Stock ($1.96 per share) | | | — | | | — | | | — | | | — | | | — | | | (204,182) | | | (204,182) | |
| | | | | | | | | | | | | | | |
Dividends on Preferred Stock ($86.25 per share) | | | — | | | — | | | — | | | — | | | — | | | (2,486) | | | (2,486) | |
Adjustment of noncontrolling interests in the Operating Partnership to fair value | | | — | | | — | | | (11,461) | | | — | | | — | | | — | | | (11,461) | |
| | | | | | | | | | | | | | | |
Distributions to noncontrolling interests in consolidated affiliates | | | — | | | — | | | — | | | — | | | (1,342) | | | — | | | (1,342) | |
| | | | | | | | | | | | | | | |
Issuances of restricted stock | 184,584 | | | — | | | — | | | — | | | — | | | — | | | — | | | — | |
Redemptions/repurchases of Preferred Stock | | | — | | | (5) | | | — | | | — | | | — | | | — | | | (5) | |
Share-based compensation expense, net of forfeitures | (6,747) | | | 2 | | | — | | | 8,644 | | | — | | | — | | | — | | | 8,646 | |
Net (income) attributable to noncontrolling interests in the Operating Partnership | | | — | | | — | | | — | | | — | | | — | | | (8,321) | | | (8,321) | |
Net (income) attributable to noncontrolling interests in consolidated affiliates | | | — | | | — | | | — | | | — | | | 1,712 | | | (1,712) | | | — | |
| Comprehensive income: | | | | | | | | | | | | | | | |
| Net income | | | — | | | — | | | — | | | — | | | — | | | 323,310 | | | 323,310 | |
| Other comprehensive income | | | — | | | — | | | — | | | 489 | | | — | | | — | | | 489 | |
Total comprehensive income | | | | | | | | | | | | | | | 323,799 | |
| Balance at December 31, 2021 | 104,892,780 | | | $ | 1,049 | | | $ | 28,821 | | | $ | 3,027,861 | | | $ | (973) | | | $ | 22,416 | | | $ | (579,616) | | | $ | 2,499,558 | |
See accompanying notes to consolidated financial statements.
HIGHWOODS PROPERTIES, INC.
Consolidated Statements of Cash Flows
(in thousands)
| | | | | | | | | | | | | | | | | |
| Year Ended December 31, |
| 2021 | | 2020 | | 2019 |
| Operating activities: | | | | | |
| Net income | $ | 323,310 | | | $ | 357,914 | | | $ | 141,683 | |
| Adjustments to reconcile net income to net cash provided by operating activities: | | | | | |
| Depreciation and amortization | 259,255 | | | 241,585 | | | 254,504 | |
| Amortization of lease incentives and acquisition-related intangible assets and liabilities | (1,903) | | | (2,537) | | | (505) | |
| Share-based compensation expense | 8,646 | | | 6,210 | | | 7,180 | |
| Net credit losses on operating lease receivables | 425 | | | 5,458 | | | 9,861 | |
| Write-off of mortgages and notes receivable | — | | | — | | | 4,087 | |
| Accrued interest on mortgages and notes receivable | (103) | | | (118) | | | (184) | |
| Amortization of debt issuance costs | 4,451 | | | 3,092 | | | 2,970 | |
| Amortization of cash flow hedges | 508 | | | 247 | | | (1,250) | |
| Amortization of mortgages and notes payable fair value adjustments | 862 | | | 1,681 | | | 1,619 | |
| Impairments of real estate assets | — | | | 1,778 | | | 5,849 | |
| Losses on debt extinguishment | 286 | | | 3,674 | | | 640 | |
| Net gains on disposition of property | (174,059) | | | (215,897) | | | (39,517) | |
| | | | | |
| | | | | |
| | | | | |
| Equity in earnings of unconsolidated affiliates | (1,947) | | | (4,005) | | | (3,276) | |
| | | | | |
| Distributions of earnings from unconsolidated affiliates | 1,417 | | | 1,533 | | | 1,149 | |
| Settlement of cash flow hedges | — | | | — | | | (11,749) | |
| Changes in operating assets and liabilities: | | | | | |
| Accounts receivable | 5,744 | | | 437 | | | (3,271) | |
| Prepaid expenses and other assets | 1,575 | | | (365) | | | 1,610 | |
| Accrued straight-line rents receivable | (22,100) | | | (36,576) | | | (29,828) | |
| Accounts payable, accrued expenses and other liabilities | 8,191 | | | (5,951) | | | 24,225 | |
| Net cash provided by operating activities | 414,558 | | | 358,160 | | | 365,797 | |
| Investing activities: | | | | | |
| Investments in acquired real estate and related intangible assets, net of cash acquired | (305,291) | | | (2,363) | | | (424,222) | |
| Investments in development in-process | (77,854) | | | (160,612) | | | (116,111) | |
| Investments in tenant improvements and deferred leasing costs | (93,654) | | | (137,997) | | | (138,754) | |
| Investments in building improvements | (48,405) | | | (62,154) | | | (53,826) | |
| | | | | |
| Investment in acquired controlling interest in unconsolidated affiliate | (127,339) | | | — | | | — | |
| Net proceeds from disposition of real estate assets | 374,016 | | | 484,311 | | | 133,326 | |
| | | | | |
| | | | | |
| Distributions of capital from unconsolidated affiliates | — | | | 72 | | | 7,833 | |
| Investments in mortgages and notes receivable | (84) | | | (32) | | | — | |
| Repayments of mortgages and notes receivable | 301 | | | 310 | | | 295 | |
| Investments in and advances to unconsolidated affiliates | (6,079) | | | — | | | (9,977) | |
| | | | | |
| | | | | |
| Changes in other investing activities | (3,289) | | | (10,853) | | | (5,971) | |
| Net cash provided by/(used in) investing activities | $ | (287,678) | | | $ | 110,682 | | | $ | (607,407) | |
HIGHWOODS PROPERTIES, INC.
Consolidated Statements of Cash Flows – Continued
(in thousands)
| | | | | | | | | | | | | | | | | |
| Year Ended December 31, |
| 2021 | | 2020 | | 2019 |
| Financing activities: | | | | | |
| Dividends on Common Stock | $ | (204,182) | | | $ | (199,331) | | | $ | (196,935) | |
| | | | | |
| Redemptions/repurchases of Preferred Stock | (5) | | | (33) | | | (18) | |
| | | | | |
| Dividends on Preferred Stock | (2,486) | | | (2,488) | | | (2,488) | |
| Distributions to noncontrolling interests in the Operating Partnership | (5,516) | | | (5,456) | | | (5,189) | |
| | | | | |
| Distributions to noncontrolling interests in consolidated affiliates | (1,342) | | | (1,138) | | | (1,767) | |
| | | | | |
| Proceeds from the issuance of Common Stock | 23,917 | | | 3,571 | | | 2,086 | |
| Costs paid for the issuance of Common Stock | (535) | | | (215) | | | — | |
| Repurchase of shares related to tax withholdings | (1,718) | | | (1,160) | | | (1,788) | |
| Borrowings on revolving credit facility | 380,000 | | | 129,000 | | | 604,600 | |
| Repayments of revolving credit facility | (310,000) | | | (350,000) | | | (565,600) | |
| Borrowings on mortgages and notes payable | 200,000 | | | 398,364 | | | 747,990 | |
| Repayments of mortgages and notes payable | (353,780) | | | (251,952) | | | (326,876) | |
| | | | | |
| | | | | |
| Payments of debt extinguishment costs | — | | | (3,193) | | | — | |
| | | | | |
| Changes in debt issuance costs and other financing activities | (9,279) | | | (10,309) | | | (7,806) | |
| Net cash provided by/(used in) financing activities | (284,926) | | | (294,340) | | | 246,209 | |
| Net increase/(decrease) in cash and cash equivalents and restricted cash | (158,046) | | | 174,502 | | | 4,599 | |
| Cash and cash equivalents and restricted cash at beginning of the period | 189,244 | | | 14,742 | | | 10,143 | |
| Cash and cash equivalents and restricted cash at end of the period | $ | 31,198 | | | $ | 189,244 | | | $ | 14,742 | |
Reconciliation of cash and cash equivalents and restricted cash:
| | | | | | | | | | | | | | | | | |
| Year Ended December 31, |
| 2021 | | 2020 | | 2019 |
| Cash and cash equivalents at end of the period | $ | 23,152 | | | $ | 109,322 | | | $ | 9,505 | |
| Restricted cash at end of the period | 8,046 | | | 79,922 | | | 5,237 | |
| Cash and cash equivalents and restricted cash at end of the period | $ | 31,198 | | | $ | 189,244 | | | $ | 14,742 | |
Supplemental disclosure of cash flow information:
| | | | | | | | | | | | | | | | | |
| Year Ended December 31, |
| 2021 | | 2020 | | 2019 |
| Cash paid for interest, net of amounts capitalized | $ | 79,474 | | | $ | 72,350 | | | $ | 72,014 | |
Supplemental disclosure of non-cash investing and financing activities:
| | | | | | | | | | | | | | | | | |
| Year Ended December 31, |
| 2021 | | 2020 | | 2019 |
| Unrealized losses on cash flow hedges | $ | (19) | | | $ | (1,238) | | | $ | (9,134) | |
| Conversions of Common Units to Common Stock | 15,076 | | | 145 | | | 663 | |
Changes in accrued capital expenditures (1) | (9,843) | | | (1,913) | | | 5,625 | |
| Write-off of fully depreciated real estate assets | 68,307 | | | 46,656 | | | 85,727 | |
| Write-off of fully amortized leasing costs | 43,648 | | | 25,618 | | | 45,042 | |
| Write-off of fully amortized debt issuance costs | 5,200 | | | 1,438 | | | 1,791 | |
| | | | | |
| | | | | |
| Adjustment of noncontrolling interests in the Operating Partnership to fair value | 11,461 | | | (30,617) | | | 29,557 | |
| | | | | |
| | | | | |
| Assumption of mortgages and notes payable related to acquisition activities | 403,000 | | | — | | | — | |
| | | | | |
| Issuances of Common Units to acquire real estate assets | — | | | 6,163 | | | — | |
| | | | | |
| | | | | |
| Contingent consideration in connection with the acquisition of land | — | | | — | | | 1,200 | |
| | | | | |
| | | | | |
| | | | | |
| Contributions from noncontrolling interests in consolidated affiliates | — | | | — | | | 4,987 | |
| Initial recognition of lease liabilities related to right of use assets | 5,310 | | | — | | | 35,349 | |
| Future consideration in connection with the acquisition of land | 16,000 | | | — | | | — | |
__________
(1)Accrued capital expenditures included in accounts payable, accrued expenses and other liabilities at December 31, 2021, 2020 and 2019 were $56.1 million, $66.0 million and $67.9 million, respectively.
See accompanying notes to consolidated financial statements.
REPORT OF INDEPENDENT REGISTERED PUBLIC ACCOUNTING FIRM
To the Board of Directors of the General Partner of Highwoods Realty Limited Partnership:
Opinion on the Financial Statements
We have audited the accompanying consolidated balance sheets of Highwoods Realty Limited Partnership and subsidiaries (the “Operating Partnership”) as of December 31, 2021 and 2020, the related consolidated statements of income, comprehensive income, capital, and cash flows for each of the three years in the period ended December 31, 2021, and the related notes and the schedule listed in the Index at Item 15 (collectively, the “financial statements”). In our opinion, the financial statements present fairly, in all material respects, the financial position of the Operating Partnership as of December 31, 2021 and 2020, and the results of its operations and its cash flows for each of the three years in the period ended December 31, 2021, in conformity with accounting principles generally accepted in the United States of America.
Basis for Opinion
These financial statements are the responsibility of the Operating Partnership’s management. Our responsibility is to express an opinion on the Operating Partnership’s financial statements based on our audits. We are a public accounting firm registered with the Public Company Accounting Oversight Board (United States) (PCAOB) and are required to be independent with respect to the Operating Partnership in accordance with the U.S. federal securities laws and the applicable rules and regulations of the Securities and Exchange Commission and the PCAOB.
We conducted our audits in accordance with the standards of the PCAOB. Those standards require that we plan and perform the audit to obtain reasonable assurance about whether the financial statements are free of material misstatement, whether due to error or fraud. The Operating Partnership is not required to have, nor were we engaged to perform, an audit of its internal control over financial reporting. As part of our audits, we are required to obtain an understanding of internal control over financial reporting, but not for the purpose of expressing an opinion on the effectiveness of the Operating Partnership’s internal control over financial reporting. Accordingly, we express no such opinion.
Our audits included performing procedures to assess the risks of material misstatement of the financial statements, whether due to error or fraud, and performing procedures that respond to those risks. Such procedures included examining, on a test basis, evidence regarding the amounts and disclosures in the financial statements. Our audits also included evaluating the accounting principles used and significant estimates made by management, as well as evaluating the overall presentation of the financial statements. We believe that our audits provide a reasonable basis for our opinion.
Critical Audit Matters
The critical audit matters communicated below are matters arising from the current-period audit of the financial statements that were communicated or required to be communicated to the audit committee and that (1) relate to accounts or disclosures that are material to the financial statements and (2) involved our especially challenging, subjective, or complex judgments. The communication of critical audit matters does not alter in any way our opinion on the financial statements, taken as a whole, and we are not, by communicating the critical audit matters below, providing separate opinions on the critical audit matters or on the accounts or disclosures to which they relate.
Impairment of Real Estate Assets - Refer to Note 1 to the financial statements
Critical Audit Matter Description
The Operating Partnership performs an impairment analysis of properties which begins with an evaluation of events or changes in circumstances that may indicate that the carrying value may not be recoverable, such as a significant decline in occupancy, identification of materially adverse legal or environmental factors, a change in the designation of an asset from core to non-core, which may impact the anticipated holding period, or a decline in market value to an amount less than cost.
The Operating Partnership makes judgments that determine whether specific real estate assets possess indicators of impairment. Changes in those judgments could have a material impact on the real estate assets that are identified for further analysis.
Given the Operating Partnership’s evaluation of possible indications of impairment of real estate assets requires management to make judgments, performing audit procedures to evaluate whether management appropriately identified events or changes in circumstances indicating that the carrying amounts of real estate assets may not be recoverable required a high degree of auditor judgment.
How the Critical Audit Matter Was Addressed in the Audit
Our audit procedures related to the evaluation of real estate assets for possible indications of impairment included the following, among others:
•We tested the effectiveness of controls over management’s identification of possible circumstances that may indicate that the carrying amounts of real estate assets are no longer recoverable, including controls over management’s designation of an asset as core or non-core, occupancy and management’s estimates of fair values.
•We evaluated management’s identification of impairment indicators by developing an independent determination if properties exhibit an indicator of impairment by:
–Inquiring of management and reading investment committee and board minutes to identify properties that should be evaluated as non-core and therefore may impact the anticipated holding period.
–Testing real estate assets for possible indications of impairment, including searching for adverse asset-specific circumstances and/or market conditions by reading questionnaires to regional property managers and using reputable market surveys.
–With the assistance of our fair value specialists, developing an independent expectation of impairment indicators and comparing such expectation to management’s analysis.
Real Estate and Related Assets—Acquisitions—Refer to Note 1, 3 and 6 to the financial statements
Critical Audit Matter Description
During 2021, the Operating Partnership acquired a portfolio of real estate assets in Charlotte, Raleigh, and Atlanta for a net purchase price of $653.5 million and acquired its joint venture partner’s 75.0% interest in a portfolio of assets in Raleigh for a net purchase price of $131.3 million. The Operating Partnership accounted for these transactions as asset acquisitions.
The purchase prices paid for the assets acquired and liabilities assumed was allocated, based on relative fair values as determined by management, with the assistance of third-party specialists, to land, buildings, tenant improvements and intangible assets and liabilities such as above and below market leases and acquired in-place leases. Management assessed the relative fair value based on estimated cash flow projections that utilized discount and capitalization rates as well as available market information.
Above and below market secured loans assumed in the transactions were assessed based on the present value of the difference between the property specific mortgage interest rate and the market interest rate over the years to maturity of the loan.
Given the allocation of relative fair value to the assets acquired and liabilities assumed and the determination of the above and below market debt value required management to make significant estimates related to assumptions such as discount rates, capitalization rates, market rental rates, land values and market interest rates, performing audit procedures to evaluate the reasonableness of these assumptions required a high degree of auditor judgment and an increased extent of effort, including the need to involve our fair value specialists.
How the Critical Audit Matter Was Addressed in the Audit
Our audit procedures related to the relative fair value of assets acquired and liabilities assumed included the following, among others:
•We tested the effectiveness of controls over the purchase price allocations, including management’s controls over the review of the third-party appraisals, the identification of real estate assets, intangible assets and liabilities and the valuation methodology for estimating the relative fair value of assets acquired and liabilities assumed.
•With the assistance of our fair value specialists, we evaluated the reasonableness of the valuation methodology, discount rates, capitalization rates, market rental rates, land values and market interest rates by developing a range of independent estimates and comparing our estimates to those used by management.
•We tested the mathematical accuracy of the valuation models and the source information underlying the determination of the intangible assets and liabilities fair value.
/s/ Deloitte & Touche LLP
Raleigh, North Carolina
February 8, 2022
We have served as the Operating Partnership’s auditor since 2006.
HIGHWOODS REALTY LIMITED PARTNERSHIP
Consolidated Balance Sheets
(in thousands, except unit and per unit data)
| | | | | | | | | | | |
| December 31, |
| 2021 | | 2020 |
| | | |
| Assets: | | | |
| Real estate assets, at cost: | | | |
| Land | $ | 549,228 | | | $ | 466,872 | |
| Buildings and tenant improvements | 5,718,169 | | | 4,981,637 | |
| Development in-process | 6,890 | | | 259,681 | |
| Land held for development | 215,257 | | | 131,474 | |
| 6,489,544 | | | 5,839,664 | |
| Less-accumulated depreciation | (1,457,511) | | | (1,418,379) | |
| Net real estate assets | 5,032,033 | | | 4,421,285 | |
| | | |
| Real estate and other assets, net, held for sale | 3,518 | | | 11,360 | |
| Cash and cash equivalents | 23,152 | | | 109,322 | |
| Restricted cash | 8,046 | | | 79,922 | |
| Accounts receivable | 14,002 | | | 27,488 | |
| Mortgages and notes receivable | 1,227 | | | 1,341 | |
| Accrued straight-line rents receivable | 268,324 | | | 259,381 | |
| Investments in and advances to unconsolidated affiliates | 7,383 | | | 27,104 | |
Deferred leasing costs, net of accumulated amortization of $143,111 and $151,698, respectively | 258,902 | | | 209,329 | |
Prepaid expenses and other assets, net of accumulated depreciation of $21,408 and $21,154, respectively | 78,551 | | | 62,885 | |
| Total Assets | $ | 5,695,138 | | | $ | 5,209,417 | |
| Liabilities, Redeemable Operating Partnership Units and Capital: | | | |
| Mortgages and notes payable, net | $ | 2,788,915 | | | $ | 2,470,021 | |
| Accounts payable, accrued expenses and other liabilities | 294,976 | | | 268,727 | |
| | | |
| | | |
| Total Liabilities | 3,083,891 | | | 2,738,748 | |
| Commitments and contingencies | | | |
| Redeemable Operating Partnership Units: | | | |
Common Units, 2,504,805 and 2,838,725 outstanding, respectively | 111,689 | | | 112,499 | |
Series A Preferred Units (liquidation preference $1,000 per unit), 28,821 and 28,826 units issued and outstanding, respectively | 28,821 | | | 28,826 | |
| Total Redeemable Operating Partnership Units | 140,510 | | | 141,325 | |
| Capital: | | | |
| Common Units: | | | |
General partner Common Units, 1,069,888 and 1,063,515 outstanding, respectively | 24,492 | | | 23,087 | |
Limited partner Common Units, 103,414,083 and 102,449,222 outstanding, respectively | 2,424,802 | | | 2,285,673 | |
| Accumulated other comprehensive loss | (973) | | | (1,462) | |
| Noncontrolling interests in consolidated affiliates | 22,416 | | | 22,046 | |
| Total Capital | 2,470,737 | | | 2,329,344 | |
| Total Liabilities, Redeemable Operating Partnership Units and Capital | $ | 5,695,138 | | | $ | 5,209,417 | |
See accompanying notes to consolidated financial statements.
HIGHWOODS REALTY LIMITED PARTNERSHIP
Consolidated Statements of Income
(in thousands, except per unit amounts)
| | | | | | | | | | | | | | | | | |
| Year Ended December 31, |
| 2021 | | 2020 | | 2019 |
| Rental and other revenues | $ | 768,007 | | | $ | 736,900 | | | $ | 735,979 | |
| Operating expenses: | | | | | |
| Rental property and other expenses | 236,436 | | | 231,825 | | | 248,511 | |
| Depreciation and amortization | 259,255 | | | 241,585 | | | 254,504 | |
| Impairments of real estate assets | — | | | 1,778 | | | 5,849 | |
| General and administrative | 40,553 | | | 41,031 | | | 44,067 | |
| Total operating expenses | 536,244 | | | 516,219 | | | 552,931 | |
| | | | | |
| | | | | |
| | | | | |
| | | | | |
| Interest expense | 85,853 | | | 80,962 | | | 81,648 | |
| | | | | |
| | | | | |
| | | | | |
| Other income/(loss) | 1,394 | | | (1,707) | | | (2,510) | |
| | | | | |
| Gains on disposition of property | 174,059 | | | 215,897 | | | 39,517 | |
| | | | | |
| | | | | |
| | | | | |
| Equity in earnings of unconsolidated affiliates | 1,947 | | | 4,005 | | | 3,276 | |
| | | | | |
| | | | | |
| | | | | |
| | | | | |
| | | | | |
| | | | | |
| Net income | 323,310 | | | 357,914 | | | 141,683 | |
| Net (income) attributable to noncontrolling interests in consolidated affiliates | (1,712) | | | (1,174) | | | (1,214) | |
| Distributions on Preferred Units | (2,486) | | | (2,488) | | | (2,488) | |
| | | | | |
| Net income available for common unitholders | $ | 319,112 | | | $ | 354,252 | | | $ | 137,981 | |
| Earnings per Common Unit – basic: | | | | | |
| | | | | |
| | | | | |
| Net income available for common unitholders | $ | 2.99 | | | $ | 3.33 | | | $ | 1.30 | |
| Weighted average Common Units outstanding – basic | 106,634 | | | 106,297 | | | 106,014 | |
| Earnings per Common Unit – diluted: | | | | | |
| | | | | |
| | | | | |
| Net income available for common unitholders | $ | 2.99 | | | $ | 3.33 | | | $ | 1.30 | |
| Weighted average Common Units outstanding – diluted | 106,652 | | | 106,305 | | | 106,036 | |
| | | | | |
| | | | | |
| | | | | |
| | | | | |
See accompanying notes to consolidated financial statements.
HIGHWOODS REALTY LIMITED PARTNERSHIP
Consolidated Statements of Comprehensive Income
(in thousands)
| | | | | | | | | | | | | | | | | |
| Year Ended December 31, |
| 2021 | | 2020 | | 2019 |
| Comprehensive income: | | | | | |
| Net income | $ | 323,310 | | | $ | 357,914 | | | $ | 141,683 | |
| Other comprehensive income/(loss): | | | | | |
| | | | | |
| Unrealized losses on cash flow hedges | (19) | | | (1,238) | | | (9,134) | |
| Amortization of cash flow hedges | 508 | | | 247 | | | (1,250) | |
| | | | | |
| Total other comprehensive income/(loss) | 489 | | | (991) | | | (10,384) | |
| Total comprehensive income | 323,799 | | | 356,923 | | | 131,299 | |
| Less-comprehensive (income) attributable to noncontrolling interests | (1,712) | | | (1,174) | | | (1,214) | |
| Comprehensive income attributable to common unitholders | $ | 322,087 | | | $ | 355,749 | | | $ | 130,085 | |
See accompanying notes to consolidated financial statements.
HIGHWOODS REALTY LIMITED PARTNERSHIP
Consolidated Statements of Capital
(in thousands)
| | | | | | | | | | | | | | | | | | | | | | | | | | | | | |
| Common Units | | Accumulated
Other
Comprehensive Income/(Loss) | | Noncontrolling
Interests in
Consolidated
Affiliates | | Total |
| General
Partners’
Capital | | Limited
Partners’
Capital | |
| | | | | | | | | |
| Balance at December 31, 2018 | $ | 22,078 | | | $ | 2,185,852 | | | $ | 9,913 | | | $ | 17,576 | | | $ | 2,235,419 | |
Issuances of Common Units, net of issuance costs and tax withholdings | 3 | | | 295 | | | — | | | — | | | 298 | |
| | | | | | | | | |
Distributions on Common Units ($1.90 per unit) | (2,013) | | | (199,334) | | | — | | | — | | | (201,347) | |
| | | | | | | | | |
Distributions on Preferred Units ($86.25 per unit) | (25) | | | (2,463) | | | — | | | — | | | (2,488) | |
| Share-based compensation expense, net of forfeitures | 72 | | | 7,108 | | | — | | | — | | | 7,180 | |
| | | | | | | | | |
Distributions to noncontrolling interests in consolidated affiliates | — | | | — | | | — | | | (1,767) | | | (1,767) | |
Contributions from noncontrolling interests in consolidated affiliates | — | | | — | | | — | | | 4,987 | | | 4,987 | |
Adjustment of Redeemable Common Units to fair value and contributions/distributions from/to the General Partner | (280) | | | (27,753) | | | — | | | — | | | (28,033) | |
Net (income) attributable to noncontrolling interests in consolidated affiliates | (12) | | | (1,202) | | | — | | | 1,214 | | | — | |
| Comprehensive income: | | | | | | | | | |
| Net income | 1,417 | | | 140,266 | | | — | | | — | | | 141,683 | |
| Other comprehensive loss | — | | | — | | | (10,384) | | | — | | | (10,384) | |
| Total comprehensive income | | | | | | | | | 131,299 | |
| Balance at December 31, 2019 | 21,240 | | | 2,102,769 | | | (471) | | | 22,010 | | | 2,145,548 | |
Issuances of Common Units, net of issuance costs and tax withholdings | 84 | | | 8,275 | | | — | | | — | | | 8,359 | |
| | | | | | | | | |
Distributions on Common Units ($1.92 per unit) | (2,040) | | | (201,962) | | | — | | | — | | | (204,002) | |
| | | | | | | | | |
Distributions on Preferred Units ($86.25 per unit) | (25) | | | (2,463) | | | — | | | — | | | (2,488) | |
| Share-based compensation expense, net of forfeitures | 62 | | | 6,148 | | | — | | | — | | | 6,210 | |
| | | | | | | | | |
Distributions to noncontrolling interests in consolidated affiliates | — | | | — | | | — | | | (1,138) | | | (1,138) | |
| | | | | | | | | |
Adjustment of Redeemable Common Units to fair value and contributions/distributions from/to the General Partner | 199 | | | 19,733 | | | — | | | — | | | 19,932 | |
Net (income) attributable to noncontrolling interests in consolidated affiliates | (12) | | | (1,162) | | | — | | | 1,174 | | | — | |
| Comprehensive income: | | | | | | | | | |
| Net income | 3,579 | | | 354,335 | | | — | | | — | | | 357,914 | |
| Other comprehensive loss | — | | | — | | | (991) | | | — | | | (991) | |
| Total comprehensive income | | | | | | | | | 356,923 | |
| Balance at December 31, 2020 | 23,087 | | | 2,285,673 | | | (1,462) | | | 22,046 | | | 2,329,344 | |
Issuances of Common Units, net of issuance costs and tax withholdings | 217 | | | 21,447 | | | — | | | — | | | 21,664 | |
| | | | | | | | | |
Distributions on Common Units ($1.96 per unit) | (2,089) | | | (206,807) | | | — | | | — | | | (208,896) | |
| | | | | | | | | |
Distributions on Preferred Units ($86.25 per unit) | (25) | | | (2,461) | | | — | | | — | | | (2,486) | |
| Share-based compensation expense, net of forfeitures | 86 | | | 8,560 | | | — | | | — | | | 8,646 | |
| | | | | | | | | |
Distributions to noncontrolling interests in consolidated affiliates | — | | | — | | | — | | | (1,342) | | | (1,342) | |
| | | | | | | | | |
Adjustment of Redeemable Common Units to fair value and contributions/distributions from/to the General Partner | — | | | 8 | | | — | | | — | | | 8 | |
Net (income) attributable to noncontrolling interests in consolidated affiliates | (17) | | | (1,695) | | | — | | | 1,712 | | | — | |
| Comprehensive income: | | | | | | | | | |
| Net income | 3,233 | | | 320,077 | | | — | | | — | | | 323,310 | |
| Other comprehensive income | — | | | — | | | 489 | | | — | | | 489 | |
| Total comprehensive income | | | | | | | | | 323,799 | |
| Balance at December 31, 2021 | $ | 24,492 | | | $ | 2,424,802 | | | $ | (973) | | | $ | 22,416 | | | $ | 2,470,737 | |
See accompanying notes to consolidated financial statements.
HIGHWOODS REALTY LIMITED PARTNERSHIP
Consolidated Statements of Cash Flows
(in thousands)
| | | | | | | | | | | | | | | | | |
| Year Ended December 31, |
| 2021 | | 2020 | | 2019 |
| Operating activities: | | | | | |
| Net income | $ | 323,310 | | | $ | 357,914 | | | $ | 141,683 | |
| Adjustments to reconcile net income to net cash provided by operating activities: | | | | | |
| Depreciation and amortization | 259,255 | | | 241,585 | | | 254,504 | |
| Amortization of lease incentives and acquisition-related intangible assets and liabilities | (1,903) | | | (2,537) | | | (505) | |
| Share-based compensation expense | 8,646 | | | 6,210 | | | 7,180 | |
| Net credit losses on operating lease receivables | 425 | | | 5,458 | | | 9,861 | |
| Write-off of mortgages and notes receivable | — | | | — | | | 4,087 | |
| Accrued interest on mortgages and notes receivable | (103) | | | (118) | | | (184) | |
| Amortization of debt issuance costs | 4,451 | | | 3,092 | | | 2,970 | |
| Amortization of cash flow hedges | 508 | | | 247 | | | (1,250) | |
| Amortization of mortgages and notes payable fair value adjustments | 862 | | | 1,681 | | | 1,619 | |
| Impairments of real estate assets | — | | | 1,778 | | | 5,849 | |
| Losses on debt extinguishment | 286 | | | 3,674 | | | 640 | |
| Net gains on disposition of property | (174,059) | | | (215,897) | | | (39,517) | |
| | | | | |
| | | | | |
| | | | | |
| Equity in earnings of unconsolidated affiliates | (1,947) | | | (4,005) | | | (3,276) | |
| | | | | |
| Distributions of earnings from unconsolidated affiliates | 1,417 | | | 1,533 | | | 1,149 | |
| Settlement of cash flow hedges | — | | | — | | | (11,749) | |
| Changes in operating assets and liabilities: | | | | | |
| Accounts receivable | 5,744 | | | 437 | | | (3,271) | |
| Prepaid expenses and other assets | 1,575 | | | (365) | | | 1,610 | |
| Accrued straight-line rents receivable | (22,100) | | | (36,576) | | | (29,828) | |
| Accounts payable, accrued expenses and other liabilities | 8,191 | | | (5,951) | | | 24,225 | |
| Net cash provided by operating activities | 414,558 | | | 358,160 | | | 365,797 | |
| Investing activities: | | | | | |
| Investments in acquired real estate and related intangible assets, net of cash acquired | (305,291) | | | (2,363) | | | (424,222) | |
| Investments in development in-process | (77,854) | | | (160,612) | | | (116,111) | |
| Investments in tenant improvements and deferred leasing costs | (93,654) | | | (137,997) | | | (138,754) | |
| Investments in building improvements | (48,405) | | | (62,154) | | | (53,826) | |
| | | | | |
| Investment in acquired controlling interest in unconsolidated affiliate | (127,339) | | | — | | | — | |
| Net proceeds from disposition of real estate assets | 374,016 | | | 484,311 | | | 133,326 | |
| | | | | |
| | | | | |
| Distributions of capital from unconsolidated affiliates | — | | | 72 | | | 7,833 | |
| Investments in mortgages and notes receivable | (84) | | | (32) | | | — | |
| Repayments of mortgages and notes receivable | 301 | | | 310 | | | 295 | |
| Investments in and advances to unconsolidated affiliates | (6,079) | | | — | | | (9,977) | |
| | | | | |
| | | | | |
| Changes in other investing activities | (3,289) | | | (10,853) | | | (5,971) | |
| Net cash provided by/(used in) investing activities | $ | (287,678) | | | $ | 110,682 | | | $ | (607,407) | |
HIGHWOODS REALTY LIMITED PARTNERSHIP
Consolidated Statements of Cash Flows - Continued
(in thousands)
| | | | | | | | | | | | | | | | | |
| Year Ended December 31, |
| 2021 | | 2020 | | 2019 |
| Financing activities: | | | | | |
| Distributions on Common Units | $ | (208,896) | | | $ | (204,002) | | | $ | (201,347) | |
| | | | | |
| Redemptions/repurchases of Preferred Units | (5) | | | (33) | | | (18) | |
| | | | | |
| Distributions on Preferred Units | (2,486) | | | (2,488) | | | (2,488) | |
| Distributions to noncontrolling interests in consolidated affiliates | (1,342) | | | (1,138) | | | (1,767) | |
| | | | | |
| Proceeds from the issuance of Common Units | 23,917 | | | 3,571 | | | 2,086 | |
| Costs paid for the issuance of Common Units | (535) | | | (215) | | | — | |
| Repurchase of units related to tax withholdings | (1,718) | | | (1,160) | | | (1,788) | |
| Borrowings on revolving credit facility | 380,000 | | | 129,000 | | | 604,600 | |
| Repayments of revolving credit facility | (310,000) | | | (350,000) | | | (565,600) | |
| Borrowings on mortgages and notes payable | 200,000 | | | 398,364 | | | 747,990 | |
| Repayments of mortgages and notes payable | (353,780) | | | (251,952) | | | (326,876) | |
| | | | | |
| | | | | |
| Payments of debt extinguishment costs | — | | | (3,193) | | | — | |
| | | | | |
| Changes in debt issuance costs and other financing activities | (10,081) | | | (11,094) | | | (8,583) | |
| Net cash provided by/(used in) financing activities | (284,926) | | | (294,340) | | | 246,209 | |
| Net increase/(decrease) in cash and cash equivalents and restricted cash | (158,046) | | | 174,502 | | | 4,599 | |
| Cash and cash equivalents and restricted cash at beginning of the period | 189,244 | | | 14,742 | | | 10,143 | |
| Cash and cash equivalents and restricted cash at end of the period | $ | 31,198 | | | $ | 189,244 | | | $ | 14,742 | |
Reconciliation of cash and cash equivalents and restricted cash:
| | | | | | | | | | | | | | | | | |
| Year Ended December 31, |
| 2021 | | 2020 | | 2019 |
| Cash and cash equivalents at end of the period | $ | 23,152 | | | $ | 109,322 | | | $ | 9,505 | |
| Restricted cash at end of the period | 8,046 | | | 79,922 | | | 5,237 | |
| Cash and cash equivalents and restricted cash at end of the period | $ | 31,198 | | | $ | 189,244 | | | $ | 14,742 | |
Supplemental disclosure of cash flow information:
| | | | | | | | | | | | | | | | | |
| Year Ended December 31, |
| 2021 | | 2020 | | 2019 |
| Cash paid for interest, net of amounts capitalized | $ | 79,474 | | | $ | 72,350 | | | $ | 72,014 | |
Supplemental disclosure of non-cash investing and financing activities:
| | | | | | | | | | | | | | | | | |
| Year Ended December 31, |
| 2021 | | 2020 | | 2019 |
| Unrealized losses on cash flow hedges | $ | (19) | | | $ | (1,238) | | | $ | (9,134) | |
Changes in accrued capital expenditures (1) | (9,843) | | | (1,913) | | | 5,625 | |
| Write-off of fully depreciated real estate assets | 68,307 | | | 46,656 | | | 85,727 | |
| Write-off of fully amortized leasing costs | 43,648 | | | 25,618 | | | 45,042 | |
| Write-off of fully amortized debt issuance costs | 5,200 | | | 1,438 | | | 1,791 | |
| | | | | |
| | | | | |
| Adjustment of Redeemable Common Units to fair value | (810) | | | (26,880) | | | 27,256 | |
| | | | | |
| | | | | |
| Assumption of mortgages and notes payable related to acquisition activities | 403,000 | | | — | | | — | |
| | | | | |
| Issuances of Common Units to acquire real estate assets | — | | | 6,163 | | | — | |
| | | | | |
| | | | | |
| Contingent consideration in connection with the acquisition of land | — | | | — | | | 1,200 | |
| | | | | |
| | | | | |
| Contributions from noncontrolling interests in consolidated affiliates | — | | | — | | | 4,987 | |
| Initial recognition of lease liabilities related to right of use assets | 5,310 | | | — | | | 35,349 | |
| Future consideration in connection with the acquisition of land | 16,000 | | | — | | | — | |
__________
(1)Accrued capital expenditures included in accounts payable, accrued expenses and other liabilities at December 31, 2021, 2020 and 2019 were $56.1 million, $66.0 million and $67.9 million, respectively.
See accompanying notes to consolidated financial statements.
HIGHWOODS PROPERTIES, INC.
HIGHWOODS REALTY LIMITED PARTNERSHIP
NOTES TO CONSOLIDATED FINANCIAL STATEMENTS
December 31, 2021
(tabular dollar amounts in thousands, except per share and per unit data)
1. Description of Business and Significant Accounting Policies
Description of Business
Highwoods Properties, Inc. (the “Company”) is a fully integrated real estate investment trust (“REIT”) that provides leasing, management, development, construction and other customer-related services for its properties and for third parties. The Company conducts its activities through Highwoods Realty Limited Partnership (the “Operating Partnership”). At December 31, 2021, we owned or had an interest in 28.0 million rentable square feet of in-service properties, 0.6 million rentable square feet of office properties under development and development land with approximately 5.0 million rentable square feet of potential office build out.
The Company is the sole general partner of the Operating Partnership. At December 31, 2021, the Company owned all of the Preferred Units and 104.5 million, or 97.7%, of the Common Units in the Operating Partnership. Limited partners owned the remaining 2.5 million Common Units. In the event the Company issues shares of Common Stock, the net proceeds of the issuance are contributed to the Operating Partnership in exchange for additional Common Units. Generally, the Operating Partnership is obligated to redeem each Common Unit at the request of the holder thereof for cash equal to the value of one share of Common Stock based on the average of the market price for the 10 trading days immediately preceding the notice date of such redemption, provided that the Company, at its option, may elect to acquire any such Common Units presented for redemption for cash or one share of Common Stock. The Common Units owned by the Company are not redeemable. During 2021, the Company redeemed 333,920 Common Units for a like number of shares of Common Stock.
Basis of Presentation
Our Consolidated Financial Statements are prepared in conformity with accounting principles generally accepted in the United States of America (“GAAP”).
The Company’s Consolidated Financial Statements include the Operating Partnership, wholly owned subsidiaries and those entities in which the Company has the controlling interest. The Operating Partnership’s Consolidated Financial Statements include wholly owned subsidiaries and those entities in which the Operating Partnership has the controlling interest. We consolidate joint venture investments, such as interests in partnerships and limited liability companies, when we control the major operating and financial policies of the investment through majority ownership, in our capacity as a general partner or managing member or through some other contractual right. At December 31, 2021, we had involvement with, and are the primary beneficiary in, an entity that we concluded to be a variable interest entity. As such, this entity is consolidated. Additionally, at December 31, 2021, we had involvement with, but are not the primary beneficiary in, an entity that we concluded to be a variable interest entity. As such, this entity is not consolidated. We also owned three properties through a joint venture investment at December 31, 2021 that were consolidated. (See Note 4).
All intercompany transactions and accounts have been eliminated.
Use of Estimates
The preparation of consolidated financial statements in accordance with GAAP requires us to make estimates and assumptions that affect the amounts reported in our Consolidated Financial Statements and accompanying notes. Actual results could differ from those estimates.
Insurance
We are primarily self-insured for health care claims for participating employees. We have stop-loss coverage to limit our exposure to significant claims on a per claim and annual aggregate basis. We determine our liabilities for claims, including incurred but not reported losses, based on all relevant information, including actuarial estimates of claim liabilities. At December 31, 2021, a reserve of $0.6 million was recorded to cover estimated reported and unreported claims.
Real Estate and Related Assets
Real estate and related assets are recorded at cost and stated at cost less accumulated depreciation. Renovations, replacements and other expenditures that improve or extend the life of assets are capitalized and depreciated over their estimated useful lives. Expenditures for ordinary maintenance and repairs are charged to expense as incurred. Depreciation is computed using the straight-line method over the estimated useful life of 40 years for buildings and depreciable land infrastructure costs, 15 years for building improvements and five to seven years for furniture, fixtures and equipment. Tenant improvements are amortized using the straight-line method over the initial fixed terms of the respective leases, which generally are from three to 10 years. Depreciation expense for real estate assets was $218.6 million, $204.6 million and $214.7 million for the years ended December 31, 2021, 2020 and 2019, respectively.
Expenditures directly related to the development and construction of real estate assets are included in net real estate assets and are stated at depreciated cost. Development expenditures include pre-construction costs essential to the development of properties, development and construction costs, interest costs on qualifying assets, real estate taxes, development personnel salaries and related costs and other costs incurred during the period of development. Interest and other carrying costs are capitalized until the building is ready for its intended use, but not later than a year from cessation of major construction activity. We consider a construction project as substantially completed and ready for its intended use upon the completion of tenant improvements. We cease capitalization on the portion that is substantially completed and occupied or held available for occupancy and capitalize only those costs associated with the portion under construction.
We record liabilities for the performance of asset retirement activities when the obligation to perform such activities is probable even when uncertainty exists about the timing and/or method of settlement.
Upon the acquisition of real estate assets accounted for as asset acquisitions, we assess the fair value of acquired tangible assets such as land, buildings and tenant improvements, intangible assets and liabilities such as above and below market leases, acquired in-place leases and other identifiable intangible assets and assumed liabilities. We allocate fair value on a relative basis based on estimated cash flow projections that utilize discount and/or capitalization rates as well as available market information. The fair value of the tangible assets of an acquired property considers the value of the property as if it were vacant.
The above and below market rate portions of leases acquired in connection with property acquisitions are recorded in deferred leasing costs and in accounts payable, accrued expenses and other liabilities, respectively, at fair value and amortized into rental revenue over the remaining term of the respective leases as described below. Fair value is calculated as the present value of the difference between (1) the contractual amounts to be paid pursuant to each in-place lease and (2) our estimate of fair market lease rates for each corresponding in-place lease, using a discount rate that reflects the risks associated with the leases acquired and measured over a period equal to the remaining initial term of the lease for above-market leases and the remaining initial term plus the term of any renewal option that the customer would be economically compelled to exercise for below-market leases.
In-place leases acquired are recorded at fair value in deferred leasing costs and amortized to depreciation and amortization expense over the remaining term of the respective lease. The value of in-place leases is based on our evaluation of the specific characteristics of each customer’s lease. Factors considered include estimates of carrying costs during hypothetical expected lease-up periods, current market conditions, the customer’s credit quality and costs to execute similar leases. In estimating carrying costs, we include real estate taxes, insurance and other operating expenses and estimates of lost rentals at market rates during the expected lease-up periods, depending on local market conditions. In estimating costs to execute similar leases, we consider tenant improvements, leasing commissions and legal and other related expenses.
Assumed debt, if any, is recorded at fair value based on the present value of the expected future payments.
Real estate and other assets are classified as long-lived assets held for use or as long-lived assets held for sale. Real estate is classified as held for sale when the sale of the asset is probable, has been duly approved by the Company, a legally enforceable contract has been executed and the buyer’s due diligence period, if any, has expired.
Impairments of Real Estate Assets and Investments in Unconsolidated Affiliates
With respect to assets classified as held for use, we perform an impairment analysis if our evaluation of events or changes in circumstances indicate that the carrying value may not be recoverable, such as a significant decline in occupancy, identification of materially adverse legal or environmental factors, change in our designation of an asset from core to non-core,
which may impact the anticipated holding period, or a decline in market value to an amount less than cost. This analysis is generally performed at the property level, except when an asset is part of an interdependent group such as an office park, and consists of determining whether the asset’s carrying amount will be recovered from its undiscounted estimated future operating and residual cash flows. These cash flows are estimated based on a number of assumptions that are subject to economic and market uncertainties including, among others, demand for space, competition for customers, changes in market rental rates, costs to operate each property and expected ownership periods. For properties under development, the cash flows are based on expected service potential of the asset or asset group when development is substantially complete.
If the carrying amount of a held for use asset exceeds the sum of its undiscounted future operating and residual cash flows, an impairment loss is recorded for the difference between estimated fair value of the asset and the carrying amount. We generally estimate the fair value of assets held for use by using discounted cash flow analyses. In some instances, appraisal information may be available and is used in addition to a discounted cash flow analysis. As the factors used in generating these cash flows are difficult to predict and are subject to future events that may alter our assumptions, the discounted and/or undiscounted future operating and residual cash flows estimated by us in our impairment analyses or those established by appraisal may not be achieved and we may be required to recognize future impairment losses on properties held for use.
We record assets held for sale at the lower of the carrying amount or estimated fair value. Fair value of assets held for sale is equal to the estimated or contracted sales price with a potential buyer, less costs to sell. The impairment loss is the amount by which the carrying amount exceeds the estimated fair value.
We also analyze our investments in unconsolidated affiliates for impairment. This analysis consists of determining whether an expected loss in market value of an investment is other than temporary by evaluating the length of time and the extent to which the market value has been less than cost, the financial condition and near-term prospects of the investment, and our intent and ability to retain our investment for a period of time sufficient to allow for any anticipated recovery in market value. As the factors used in this analysis are difficult to predict and are subject to future events that may alter our assumptions, we may be required to recognize future impairment losses on our investments in unconsolidated affiliates.
Sales of Real Estate
For sales of real estate where we have collected the consideration to which we are entitled in exchange for transferring the real estate, the related assets and liabilities are removed from the balance sheet and the resultant gain or loss is recorded in the period the transaction closes. Any post-sale involvement is accounted for as separate performance obligations and when the separate performance obligations are satisfied, the sales price allocated to each is recognized.
Leases
We generally lease our office properties to lessees in exchange for fixed monthly payments that cover rent, property taxes, insurance and certain cost recoveries, primarily common area maintenance (“CAM”). Office properties owned by us that are under lease are primarily located in Atlanta, Charlotte, Nashville, Orlando, Pittsburgh, Raleigh, Richmond and Tampa and are leased to a wide variety of lessees across many industries. Our leases are operating leases and mostly range from three to 10 years. Payments from customers for CAM are considered nonlease components that are separated from lease components and are generally accounted for in accordance with the revenue recognition standard. However, we qualified for and elected the practical expedient related to combining the components because the lease component is classified as an operating lease and the timing and pattern of transfer of CAM income, which is not the predominant component, is the same as the lease component. As such, consideration for CAM is accounted for as part of the overall consideration in the lease. Payments from customers for property taxes and insurance are considered noncomponents of the lease and therefore no consideration is allocated to them because they do not transfer a good or service to the customer. Fixed contractual payments from our leases are recognized on a straight-line basis over the terms of the respective leases. This means that, with respect to a particular lease, actual amounts billed in accordance with the lease during any given period may be higher or lower than the amount of rental revenue recognized for the period. Straight-line rental revenue is commenced when the customer assumes control of the leased premises. Accrued straight-line rents receivable represents the amount by which straight-line rental revenue exceeds rents currently billed in accordance with lease agreements.
Some of our leases are subject to annual changes in the Consumer Price Index (“CPI”). Although increases in the CPI are not estimated as part of our measurement of straight-line rental revenue, to the extent that actual CPI is greater or less than the CPI at lease commencement, the amount of rent recognized in a given year is affected accordingly.
Some of our leases have termination options and/or extension options. Termination options allow the customer to terminate the lease prior to the end of the lease term under certain circumstances. Termination options generally become effective half way or further into the original lease term and require advance notification from the customer and payment of a termination fee that reimburses us for a portion of the remaining rent under the original lease term and the undepreciated lease inception costs such as commissions, tenant improvements and lease incentives. Termination fee income is recognized on a straight-line basis from the date of the executed termination agreement through lease expiration when the amount of the fee is determinable and collectability of the fee is reasonably assured. Our extension options generally require a re-negotiation with the customer at market rates.
Initial direct costs, primarily commissions, related to the leasing of our office properties are included in deferred leasing costs and are stated at amortized cost. Such expenditures are part of the investment necessary to execute leases and, therefore, are classified as investment activities in the statement of cash flows. All leasing commissions paid to third parties and our in-house personnel for new leases or lease renewals are capitalized. Capitalized leasing costs are amortized on a straight-line basis over the initial fixed terms of the respective leases. All other costs to negotiate or arrange a lease are expensed as incurred.
Lease incentive costs, which are payments made to or on behalf of a customer as an incentive to sign a lease, are capitalized in deferred leasing costs and amortized on a straight-line basis over the respective lease terms as a reduction of rental revenues.
Lease related receivables, which include accounts receivable and accrued straight-line rents receivable, are reduced for credit losses. Such amounts are recognized as a reduction to rental and other revenues. We regularly evaluate the collectability of our lease related receivables. Our evaluation of collectability primarily consists of reviewing the credit quality of our customer, historical trends of the customer and changes in customer payment terms. We do not maintain a general reserve to estimate amounts that may not be collectible. If our assumptions regarding the collectability of lease related receivables prove incorrect, we could experience credit losses in excess of what was recognized in rental and other revenues.
Discontinued Operations
Properties that are sold or classified as held for sale are classified as discontinued operations provided that the disposal represents a strategic shift that has (or will have) a major effect on our operations and financial results. Interest expense is included in discontinued operations if a related loan securing the sold property is to be paid off or assumed by the buyer in connection with the sale.
Investments in Unconsolidated Affiliates
We account for our joint venture investments using the equity method of accounting when our interests represent a general partnership interest but substantive participating rights or substantive kick out rights have been granted to the limited partners or when our interests do not represent a general partnership interest and we do not control the major operating and financial policies of the investment. These investments are initially recorded at cost as investments in unconsolidated affiliates and are subsequently adjusted for our share of earnings and cash contributions and distributions. To the extent our cost basis at formation of the joint venture is different than the basis reflected at the joint venture level, the basis difference is amortized over the life of the related assets and included in our share of equity in earnings of unconsolidated affiliates.
Cash Equivalents
We consider highly liquid investments with an original maturity of three months or less when purchased to be cash equivalents.
Restricted Cash
Restricted cash represents cash deposits that are legally restricted or held by third parties on our behalf, such as construction-related escrows, property disposition proceeds set aside and designated or intended to fund future tax-deferred exchanges of qualifying real estate investments and escrows and reserves for debt service, real estate taxes and property insurance established pursuant to certain mortgage financing arrangements.
Redeemable Common Units and Preferred Units
Limited partners holding Common Units other than the Company (“Redeemable Common Units”) have the right to put any and all of the Common Units to the Operating Partnership and the Company has the right to put any and all of the Preferred
Units to the Operating Partnership in exchange for their liquidation preference plus accrued and unpaid distributions in the event of a corresponding redemption by the Company of the underlying Preferred Stock. Consequently, these Redeemable Common Units and Preferred Units are classified outside of permanent partners’ capital in the Operating Partnership’s accompanying balance sheets. The recorded value of the Redeemable Common Units is based on fair value at the balance sheet date as measured by the closing price of Common Stock on that date multiplied by the total number of Redeemable Common Units outstanding. The recorded value of the Preferred Units is based on their redemption value.
Income Taxes
The Company has elected and expects to continue to qualify as a REIT under Sections 856 through 860 of the Internal Revenue Code of 1986, as amended (the “Code”). A corporate REIT is a legal entity that holds real estate assets and, through the payment of dividends to stockholders, is generally permitted to reduce or avoid the payment of federal and state income taxes at the corporate level. To maintain qualification as a REIT, the Company is required to pay dividends to its stockholders equal to at least 90.0% of its annual REIT taxable income, excluding net capital gains. The partnership agreement requires the Operating Partnership to pay economically equivalent distributions on outstanding Common Units at the same time that the Company pays dividends on its outstanding Common Stock.
Other than income taxes related to its taxable REIT subsidiary, the Operating Partnership does not reflect any federal income taxes in its financial statements, since as a partnership the taxable effects of its operations are attributed to its partners. The Operating Partnership does record state income tax for states that tax partnership income directly.
We conduct certain business activities through a taxable REIT subsidiary, as permitted under the Code. The taxable REIT subsidiary is subject to federal, state and local income taxes on its taxable income. We record provisions for income taxes based on its income recognized for financial statement purposes, including the effects of differences between such income and the amount recognized for tax purposes.
Concentration of Credit Risk
At December 31, 2021, properties that we wholly own were leased to 1,468 customers. The geographic locations that comprise greater than 10.0% of our rental and other revenues are Atlanta, Nashville, Raleigh and Tampa. Our customers engage in a wide variety of businesses. No single customer generated more than 5% of our consolidated revenues during 2021.
We maintain our cash and cash equivalents and our restricted cash at financial or other intermediary institutions. The combined account balances at each institution may exceed FDIC insurance coverage and, as a result, there is a concentration of credit risk related to amounts on deposit in excess of FDIC insurance coverage. Additionally, from time to time in connection with tax-deferred 1031 transactions, our restricted cash balances may be commingled with other funds being held by any such intermediary institution, which would subject our balance to the credit risk of the institution.
Derivative Financial Instruments
We borrow funds at a combination of fixed and variable rates. Borrowings under our revolving credit facility and bank term loans bear interest at variable rates. Our long-term debt, which consists of secured and unsecured long-term financings, typically bears interest at fixed rates. Our interest rate risk management objectives are to limit generally the impact of interest rate changes on earnings and cash flows and lower our overall borrowing costs. To achieve these objectives, from time to time, we enter into interest rate hedge contracts such as collars, swaps, caps and treasury lock agreements in order to mitigate our interest rate risk with respect to existing and prospective debt instruments. We generally do not hold or issue these derivative contracts for trading or speculative purposes. The interest rate on all of our variable rate debt is generally adjusted at one or three month intervals, subject to settlements under these interest rate hedge contracts.
Interest rate swaps involve the receipt of variable rate amounts from a counterparty in exchange for making fixed-rate payments over the life of the agreements without exchange of the underlying notional amount. Changes in the fair value of derivatives designated and that qualify as cash flow hedges are recorded in accumulated other comprehensive income/(loss) and are subsequently reclassified into interest expense as interest payments are made on our debt.
We account for terminated derivative instruments by recognizing the related accumulated other comprehensive income/(loss) balance in current earnings, unless the hedged forecasted transaction continues as originally planned, in which case we continue to amortize the accumulated other comprehensive income/(loss) into earnings over the originally designated hedge period.
Earnings Per Share and Per Unit
Basic earnings per share of the Company is computed by dividing net income available for common stockholders by the weighted Common Shares outstanding - basic. Diluted earnings per share is computed by dividing net income available for common stockholders (inclusive of noncontrolling interests in the Operating Partnership) by the weighted Common Shares outstanding - basic plus the dilutive effect of options, warrants and convertible securities outstanding, including Common Units, using the treasury stock method. Weighted Common Shares outstanding - basic includes all unvested restricted stock where dividends received on such restricted stock are non-forfeitable.
Basic earnings per unit of the Operating Partnership is computed by dividing net income available for common unitholders by the weighted Common Units outstanding - basic. Diluted earnings per unit is computed by dividing net income available for common unitholders by the weighted Common Units outstanding - basic plus the dilutive effect of options and warrants, using the treasury stock method. Weighted Common Units outstanding - basic includes all of the Company’s unvested restricted stock where distributions received on such restricted stock are non-forfeitable.
Recently Issued Accounting Standards
The Financial Accounting Standards Board (“FASB”) issued an accounting standards update (“ASU”) that provides temporary optional expedients and exceptions to the guidance on contract modifications and hedge accounting to ease the financial reporting burdens related to the expected market transition from LIBOR and other interbank offered rates to alternative reference rates, such as the Secured Overnight Financing Rate (“SOFR”). Entities can elect not to apply certain modification accounting requirements to contracts affected by reference rate reform, if certain criteria are met. An entity that makes this election would not have to remeasure the contracts at the modification date or reassess a previous accounting determination. Entities can also elect various optional expedients that would allow them to continue applying hedge accounting for hedging relationships affected by reference rate reform, if certain criteria are met. The guidance in this ASU is optional and may be elected now through December 31, 2022 as reference rate reform activities occur. We will continue to evaluate the impact of this ASU; however, we currently expect to avail ourselves of such optional expedients and exceptions should our modified contracts meet the required criteria.
Due to the business disruptions and challenges severely affecting the global economy caused by the COVID-19 pandemic, lessors may provide rent deferrals and other lease concessions to lessees. In April 2020, the FASB staff issued a question and answer document (the “Lease Modification Q&A”) focused on the application of lease accounting guidance to lease concessions provided as a result of the COVID-19 pandemic. Under existing lease guidance, we would have to determine, on a lease by lease basis, if a lease concession was the result of a new arrangement reached with the tenant (treated within the lease modification accounting framework) or if a lease concession was under the enforceable rights and obligations within the existing lease agreement (precluded from applying the lease modification accounting framework). The Lease Modification Q&A allows us, if certain criteria have been met, to bypass the lease by lease analysis, and instead elect to either apply the lease modification accounting framework or not, with such election applied consistently to leases with similar characteristics and similar circumstances. We have elected the practical expedient and will not apply lease modification accounting on a lease by lease basis where applicable. As a result, $0.7 million and $3.7 million of deferred rent is included in accounts receivable on our Consolidated Balance Sheets at December 31, 2021 and 2020, respectively.
2. Leases
On January 1, 2019, we adopted Accounting Standards Codification Topic 842 “Leases” (“ASC 842”), which supersedes Accounting Standards Codification Topic 840 “Leases” (“ASC 840”). We adopted ASC 842 using the modified retrospective approach whereby the cumulative effect of adoption was recognized on the adoption date and prior periods were not restated. There was no net cumulative effect adjustment to retained earnings as of January 1, 2019 as a result of this adoption. ASC 842 sets out the principles for the recognition, measurement, presentation and disclosure of leases for both lessees and lessors. We operate as both a lessor and a lessee. As a lessor, we are required under ASC 842 to account for leases using an approach that is substantially equivalent to ASC 840’s guidance for operating leases and other leases such as sales-type leases and direct financing leases. In addition, ASC 842 requires lessors to capitalize and amortize only incremental direct leasing costs. As a lessee, we are required under the new standard to apply a dual approach, classifying leases, such as ground leases, as either finance or operating leases based on the principle of whether or not the lease is effectively a financed purchase. This classification determines whether lease expense is recognized based on an effective interest method or on a straight-line basis over the term of the lease. ASC 842 also requires lessees to record a right of use asset and a lease liability for all leases with a term of greater than a year regardless of their classification. We have also elected the practical expedient not to recognize right of use assets and lease liabilities for leases with a term of a year or less.
On adoption of the standard, we elected the package of practical expedients provided for in ASC 842, including:
•No reassessment of whether any expired or existing contracts were or contained leases;
•No reassessment of the lease classification for any expired or existing leases; and
•No reassessment of initial direct costs for any existing leases.
The package of practical expedients was made as a single election and was consistently applied to all existing leases as of January 1, 2019. We also elected the practical expedient provided to lessors in a subsequent amendment to ASC 842 that removed the requirement to separate lease and nonlease components, provided certain conditions were met.
Information as Lessor
We recognized rental and other revenues related to operating lease payments of $754.9 million, $726.0 million and $723.1 million, of which variable lease payments were $57.3 million, $56.0 million and $65.4 million, during the years ended December 31, 2021, 2020 and 2019, respectively. The following table sets forth the undiscounted cash flows for future minimum base rents to be received from customers for leases in effect at December 31, 2021 for our consolidated properties:
| | | | | | | | |
| 2022 | | $ | 695,896 | |
| 2023 | | 669,753 | |
| 2024 | | 619,033 | |
| 2025 | | 525,223 | |
| 2026 | | 461,045 | |
| Thereafter | | 1,967,017 | |
| | $ | 4,937,967 | |
Information as Lessee
We have office assets encompassing 2.8 million rentable square feet subject to operating ground leases in Atlanta, Nashville, Orlando, Raleigh and Tampa with a weighted average remaining term of 51 years. Rental payments on these leases are adjusted periodically based on either the CPI or on a pre-determined schedule. The monthly payments on a pre-determined schedule are recognized on a straight-line basis over the terms of the respective leases. Changes in the CPI are not estimated as part of our measurement of straight-line rental expense. Upon initial adoption of ASC 842, we recognized a lease liability of $35.3 million (in accounts payable, accrued expenses and other liabilities) and a related right of use asset of $29.7 million (in prepaid expenses and other assets) on our Consolidated Balance Sheets equal to the present value of the minimum lease payments required under each ground lease. The difference between the recorded lease liability and right of use asset represents the accrued straight-line rent liability previously recognized under ASC 840. We used a discount rate of approximately 4.5%, which was derived from our assessment of the credit quality of the Company and adjusted to reflect secured borrowing, estimated yield curves and long-term spread adjustments over appropriate tenors. Some of our ground leases contain extension options; however, these did not impact our calculation of the right of use asset and liability as they extend beyond the useful life of the properties subject to the operating ground leases. We recognized $2.6 million, $2.6 million and $2.5 million of ground lease expense during the years ended December 31, 2021, 2020 and 2019, respectively, and paid $2.3 million, $2.2 million and $2.2 million in cash during 2021, 2020 and 2019, respectively.
The following table sets forth the undiscounted cash flows of our scheduled obligations for future minimum payments on operating ground leases at December 31, 2021 and a reconciliation of those cash flows to the operating lease liability at December 31, 2021:
| | | | | | | | |
| 2022 | | $ | 2,169 | |
| 2023 | | 2,167 | |
| 2024 | | 2,123 | |
| 2025 | | 2,170 | |
| 2026 | | 2,220 | |
| Thereafter | | 79,307 | |
| | 90,156 | |
| Discount | | (56,337) | |
| Lease liability | | $ | 33,819 | |
Acquired Finance Lease
During 2021, we acquired a portfolio of real estate assets from Preferred Apartment Communities, Inc. (“PAC”) (see Note 3). In conjunction with the acquisition, we assumed the ground leasehold interest to land underneath a parking garage. Under the ground lease, we have an obligation to acquire fee simple title to the land at our discretion any time, but no later than October 31, 2029. We determined this lease to be a finance lease. As such, we recognized a lease liability (in accounts payable, accrued expenses and other liabilities) and a corresponding right of use asset (in prepaid expenses and other assets) of $5.3 million on our Consolidated Balance Sheet on the date of acquisition equal to the present value of the minimum lease payments required under the ground lease. Through October 31, 2029, the expected date at which we estimate we will satisfy the obligation and acquire fee simple title to the land, we will recognize interest expense equal to the lease liability times our incremental borrowing rate, which reflects the fixed rate at which we could borrow a similar amount for the same term and with similar collateral. We determined this rate to be approximately 2.6%. We also recorded an additional $3.1 million right of use asset (in prepaid expenses and other assets) to reflect favorable terms of the ground lease when compared with market terms. No amortization will be recorded for the right of use assets because they are comprised of land.
3. Real Estate Assets
Acquisitions
During 2021, we acquired a portfolio of real estate assets from PAC. The portfolio consists of the following assets:
| | | | | | | | | | | | | | | | | | | | |
| Asset | | Market | | Submarket/BBD | | Square Footage |
| 150 Fayetteville | | Raleigh | | CBD | | 560,000 |
| CAPTRUST Towers | | Raleigh | | North Hills | | 300,000 |
| Capitol Towers | | Charlotte | | SouthPark | | 479,000 |
| Morrocroft Centre | | Charlotte | | SouthPark | | 291,000 |
| Galleria 75 Redevelopment Site | | Atlanta | | Cumberland/Galleria | | |
Our total purchase price, net of closing credits and cash acquired, was $653.6 million, including $4.5 million of capitalized acquisition costs. The acquisition included the assumption of four secured loans (see Note 6). The assets acquired and liabilities assumed were recorded at relative fair value as determined by management, with the assistance of third party specialists, based on information available at the acquisition date and on current assumptions as to future operations.
The following table sets forth a summary of the relative fair value of the material assets acquired and liabilities assumed relating to this acquisition:
| | | | | | | | |
| | Amount Recorded at Acquisition |
Real estate assets (1) | | $ | 593,039 | |
Acquisition-related intangible assets (in deferred financing and leasing costs) (1) | | $ | 61,126 | |
Right of use asset (in prepaid expenses and other assets) (1) | | $ | 8,440 | |
| Mortgages and notes payable | | $ | (403,000) | |
Debt issuance costs (in mortgages and notes payable) (1) | | $ | 3,473 | |
Acquisition-related intangible liabilities (in accounts payable, accrued expenses and other liabilities) (1) | | $ | (7,174) | |
Lease liability (in accounts payable, accrued expenses and other liabilities) (1) | | $ | (5,310) | |
__________
(1)Included in purchase price.
During 2021, we also acquired various development land parcels in Nashville for an aggregate purchase price, including capitalized acquisition costs, of $74.1 million. The $16.0 million purchase price for one of the acquired parcels is expected to be paid in or prior to second quarter 2023.
During 2021, we also acquired our joint venture partner’s 75.0% interest in our Highwoods DLF Forum, LLC joint venture (the “Forum”), which owned five buildings in Raleigh encompassing 636,000 rentable square feet, for a purchase price of $131.3 million. We previously accounted for our 25.0% interest in this joint venture using the equity method of accounting. The assets and liabilities of the joint venture are now wholly owned and we have determined the acquisition constitutes an asset purchase. As such, because the Forum is not a variable interest entity, we allocated our previously held equity interest at historical cost along with the consideration paid and acquisition costs to the assets acquired and liabilities assumed. The assets acquired and liabilities assumed were recorded at relative fair value as determined by management, with the assistance of third party specialists, based on information available at the acquisition date and on current assumptions as to future operations.
During 2020, we acquired two development land parcels totaling less than one acre in Raleigh and Nashville for an aggregate purchase price of $8.5 million, including the issuance of 118,592 Common Units and capitalized acquisition costs.
During 2019, we acquired a building in the central business district of Charlotte, which delivered in 2019 and encompasses 841,000 rentable square feet, for a net purchase price of $399.1 million. The assets acquired and liabilities assumed were recorded at relative fair value as determined by management, with the assistance of third party specialists, based on information available at the acquisition date and on current assumptions as to future operations.
During 2019, we also acquired four development land parcels totaling approximately 10 acres in Raleigh, Richmond and Pittsburgh for an aggregate purchase price, including capitalized acquisition costs, of $12.4 million.
Dispositions
During 2021, we sold a total of 13 office buildings and various land parcels in Atlanta, Memphis, Raleigh, Richmond and Tampa for an aggregate sale price of $384.6 million (before closing credits to buyer of $6.9 million) and recorded aggregate gains on disposition of property of $172.8 million.
During 2020, we sold a total of 52 buildings in Greensboro and Memphis and various land parcels for an aggregate sale price of $494.2 million (before closing credits to buyer of $5.7 million) and recorded aggregate gains on disposition of property of $215.5 million. During 2020, we also recognized $0.4 million of gain related to the satisfaction of a performance obligation as part of a 2016 land sale.
During 2019, we sold a total of six buildings and various land parcels for an aggregate sale price of $136.4 million and recorded aggregate gains on disposition of property of $39.5 million.
Impairments
During 2020, we recorded an impairment of real estate assets of $1.8 million, which resulted from a change in market-based inputs and our assumptions about the use of the assets.
During 2019, we recorded aggregate impairments of real estate assets of $5.8 million as a result of shortened hold periods from classifying all of our assets in Greensboro and Memphis as non-core and changes in market-based inputs and our assumptions about the use of the assets.
4. Investments in and Advances to Affiliates
Unconsolidated Affiliates
We have equity interests of up to 50.0% in various joint ventures with unrelated third parties that are accounted for using the equity method of accounting because we have the ability to exercise significant influence over the operating and financial policies of the joint venture investment. The difference between the cost of these investments and the net book value of the underlying net assets was $0.6 million at both December 31, 2021 and 2020.
The following table sets forth our ownership in unconsolidated affiliates at December 31, 2021:
| | | | | | | | | | | | | | |
| Joint Venture | | Location | | Ownership
Interest |
| Plaza Colonnade, Tenant-in-Common | | Kansas City | | 50.0% |
| Brand/HRLP 2827 Peachtree LLC | | Atlanta | | 50.0% |
| Kessinger/Hunter & Company, LC | | Kansas City | | 26.5% |
- Brand/HRLP 2827 Peachtree LLC (“2827 Peachtree joint venture”)
During the fourth quarter of 2021, we and Brand Properties, LLC (“Brand”) formed the 2827 Peachtree joint venture to construct 2827 Peachtree, a 135,000 square foot, multi-customer office building located in Atlanta’s Buckhead submarket. 2827 Peachtree has an anticipated total investment of $79.0 million. Construction of 2827 Peachtree began in the first quarter of 2022 with a scheduled completion date in the third quarter of 2023. At closing, we agreed to contribute cash of $13.3 million ($6.1 million of which was funded as of December 31, 2021) in exchange for a 50.0% interest in the 2827 Peachtree joint venture and Brand contributed land valued at $7.7 million and agreed to contribute cash of $5.6 million in exchange for the remaining 50.0% interest. We also committed to provide a $49.6 million interest-only secured construction loan to the 2827 Peachtree joint venture that is scheduled to mature in December 2024 with an option to extend for one year. The loan bears interest at LIBOR plus 300 basis points. As of December 31, 2021, no amounts under the loan have been funded.
We determined that we have a variable interest in the 2827 Peachtree joint venture primarily because the entity was designed to pass along interest rate risk, equity price risk and operation risk to us as both a debt and equity holder and Brand as an equity holder. The 2827 Peachtree joint venture was further determined to be a variable interest entity as it requires additional subordinated financial support in the form of a loan because the initial equity investment provided by us and Brand is not sufficient to finance its planned investments and operations. However, since we are the not the managing member or lead developer, we concluded we do not have the power to direct matters that most significantly impact the activities of the entity and therefore, do not qualify as the primary beneficiary. Accordingly, the entity was not consolidated. At December 31, 2021, our risk of loss with respect to this arrangement was limited to the carrying value of the investment balance of $6.1 million as no amounts were outstanding under the loan. The assets of the 2827 Peachtree joint venture can be used only to settle obligations of the joint venture and its creditors have no recourse to our wholly owned assets.
- Other Activities
We receive development, management and leasing fees for services provided to certain of our joint ventures. These fees are recognized in income to the extent of our respective joint venture partner’s interest. During the years ended December 31, 2021, 2020 and 2019, we recognized $1.6 million, $1.0 million and $0.5 million, respectively, of development/construction, management and leasing fees from our unconsolidated joint ventures. At December 31, 2020, we had receivables of $0.2 million related to these fees in accounts receivable.
Consolidated Variable Interest Entities
In 2019, we and The Bromley Companies formed a joint venture (the “Midtown One joint venture”) to construct Midtown West, a 150,000 square foot, multi-customer office building located in the mixed-use Midtown Tampa project in Tampa’s Westshore submarket. Midtown West has an anticipated total investment of $71.3 million. Construction of Midtown West
began in the third quarter of 2019 and the building was placed in service in the second quarter of 2021. At closing, we agreed to contribute cash of $20.0 million, which has been fully funded, in exchange for an 80.0% interest in the Midtown One joint venture and The Bromley Companies contributed land valued at $5.0 million in exchange for the remaining 20.0% interest. We also committed to provide a $46.3 million interest-only secured construction loan to the Midtown One joint venture that is scheduled to mature on the second anniversary of completion. The loan bears interest at LIBOR plus 250 basis points. As of December 31, 2021, $28.5 million under the loan has been funded.
We determined that we have a variable interest in the Midtown One joint venture primarily because the entity was designed to pass along interest rate risk, equity price risk and operation risk to us as both a debt and an equity holder and The Bromley Companies as an equity holder. The Midtown One joint venture was further determined to be a variable interest entity as it requires additional subordinated financial support in the form of a loan because the initial equity investment provided by us and The Bromley Companies is not sufficient to finance its planned investments and operations. We, as majority owner and managing member and through our control rights as set forth in the joint venture’s governance documents, were determined to be the primary beneficiary as we have both the power to direct the activities that most significantly affect the entity (primarily lease rates, property operations and capital expenditures) and significant economic exposure through our equity investment and loan commitment. As such, the Midtown One joint venture is consolidated and all intercompany transactions and accounts are eliminated. The following table sets forth the assets and liabilities of the Midtown One joint venture included on our Consolidated Balance Sheets:
| | | | | | | | | | | |
| December 31, |
| 2021 | | 2020 |
| Net real estate assets | $ | 53,191 | | | $ | — | |
| | | |
| Development in-process | $ | — | | | $ | 46,873 | |
| Cash and cash equivalents | $ | 389 | | | $ | — | |
| Accrued straight-line rents receivable | $ | 121 | | | $ | — | |
| Deferred leasing costs, net | $ | 1,519 | | | $ | 196 | |
| Prepaid expenses and other assets | $ | 163 | | | $ | 75 | |
| Accounts payable, accrued expenses and other liabilities | $ | 646 | | | $ | 2,693 | |
The assets of the Midtown One joint venture can be used only to settle obligations of the joint venture and its creditors have no recourse to our wholly owned assets.
Other Consolidated Affiliate
We have a 50.0% ownership interest in Highwoods-Markel Associates, LLC (“Markel”), a consolidated joint venture. We are the manager and leasing agent for Markel’s properties, which are located in Richmond in exchange for customary management and leasing fees. We consolidate Markel since we are the managing member and control the major operating and financial policies of the entity. As controlling member, we have an obligation to cause this property-owning entity to distribute proceeds of liquidation to the noncontrolling interest member in these partially owned properties only if the net proceeds received by the entity from the sale of any of Markel’s assets warrant a distribution as determined by the agreement governing the joint venture. We estimate the value of such noncontrolling interest distributions would have been $31.1 million had the entity been liquidated at December 31, 2021. This estimated settlement value is based on the fair value of the underlying properties which is based on a number of assumptions that are subject to economic and market uncertainties including, among others, demand for space, competition for customers, changes in market rental rates and costs to operate each property. If the entity’s underlying assets are worth less than the underlying liabilities on the date of such liquidation, we would have no obligation to remit any consideration to the noncontrolling interest holder. The assets of Markel can be used only to settle obligations of the joint venture and its creditors have no recourse to our wholly owned assets.
During 2021, Markel sold land in Richmond for a sale price of $3.0 million and recorded gain on disposition of property of $1.3 million.
5. Intangible Assets and Below Market Lease Liabilities
The following table sets forth total intangible assets and acquisition-related below market lease liabilities, net of accumulated amortization:
| | | | | | | | | | | |
| December 31, |
| 2021 | | 2020 |
| Assets: | | | |
Deferred leasing costs (including lease incentives and above market lease and in-place lease acquisition-related intangible assets) | $ | 402,013 | | | $ | 361,027 | |
| Less accumulated amortization | (143,111) | | | (151,698) | |
| $ | 258,902 | | | $ | 209,329 | |
| Liabilities (in accounts payable, accrued expenses and other liabilities): | | | |
| Acquisition-related below market lease liabilities | $ | 57,703 | | | $ | 63,748 | |
| Less accumulated amortization | (28,978) | | | (37,838) | |
| $ | 28,725 | | | $ | 25,910 | |
The following table sets forth amortization of intangible assets and below market lease liabilities:
| | | | | | | | | | | | | | | | | |
| Year Ended December 31, |
| 2021 | | 2020 | | 2019 |
Amortization of deferred leasing costs and acquisition-related intangible assets (in depreciation and amortization) | $ | 38,173 | | | $ | 34,401 | | | $ | 37,386 | |
| Amortization of lease incentives (in rental and other revenues) | $ | 1,885 | | | $ | 1,847 | | | $ | 4,281 | |
Amortization of acquisition-related intangible assets (in rental and other revenues) | $ | 1,932 | | | $ | 1,137 | | | $ | 1,290 | |
Amortization of acquisition-related intangible assets (in rental property and other expenses) | $ | — | | | $ | 510 | | | $ | 557 | |
Amortization of acquisition-related below market lease liabilities (in rental and other revenues) | $ | (5,720) | | | $ | (6,031) | | | $ | (6,633) | |
The following table sets forth scheduled future amortization of intangible assets and below market lease liabilities:
| | | | | | | | | | | | | | | | | | | | | | | | | | | | |
| Years Ending December 31, | | Amortization
of Deferred Leasing Costs and Acquisition-Related Intangible Assets (in Depreciation and Amortization) | | Amortization
of Lease Incentives (in Rental and Other Revenues) | | Amortization
of Acquisition-Related Intangible Assets (in Rental and Other Revenues) | | | | Amortization
of Acquisition-Related Below Market Lease Liabilities (in Rental and Other Revenues) |
| 2022 | | $ | 41,823 | | | $ | 1,534 | | | $ | 2,986 | | | | | $ | (5,294) | |
| 2023 | | 36,891 | | | 1,428 | | | 2,829 | | | | | (4,824) | |
| 2024 | | 32,716 | | | 1,284 | | | 2,573 | | | | | (4,111) | |
| 2025 | | 25,856 | | | 1,209 | | | 1,667 | | | | | (2,594) | |
| 2026 | | 21,992 | | | 1,084 | | | 1,336 | | | | | (2,294) | |
| Thereafter | | 73,343 | | | 3,557 | | | 4,794 | | | | | (9,608) | |
| | $ | 232,621 | | | $ | 10,096 | | | $ | 16,185 | | | | | $ | (28,725) | |
| Weighted average remaining amortization periods as of December 31, 2021 (in years) | | 8.2 | | 8.5 | | 7.6 | | | | 8.3 |
The following table sets forth the intangible assets acquired and below market lease liabilities assumed as a result of the acquisition of real estate assets from PAC and our joint venture partner's 75.0% interest in the Forum:
| | | | | | | | | | | | | | | | | | | | | | |
| | | | Acquisition-Related Intangible Assets (amortized in Rental and Other Revenues) | | Acquisition-Related Intangible Assets (amortized in Depreciation and Amortization) | | Acquisition-Related Below Market Lease Liabilities (amortized in Rental and Other Revenues) |
| Amount recorded at acquisition | | | | $ | 13,824 | | | $ | 84,298 | | | $ | (8,535) | |
| Weighted average remaining amortization periods as of December 31, 2021 (in years) | | | | 7.1 | | 7.1 | | 8.1 |
6. Mortgages and Notes Payable
Our mortgages and notes payable consisted of the following:
| | | | | | | | | | | |
| December 31, |
| 2021 | | 2020 |
Secured indebtedness (1): | | | |
4.27% (3.61% effective rate) mortgage loan due 2028 (2) | $ | 115,731 | | | $ | — | |
| 4.00% mortgage loan due 2029 | 91,318 | | | 93,350 | |
3.61% (3.19% effective rate) mortgage loan due 2029 (3) | 84,973 | | | — | |
3.40% (3.50% effective rate) mortgage loan due 2033 (4) | 69,422 | | | — | |
4.60% (3.73% effective rate) mortgage loan due 2037 (5) | 130,498 | | | — | |
| 491,942 | | | 93,350 | |
| Unsecured indebtedness: | | | |
3.20% (3.363% effective rate) notes due 2021 (6) | — | | | 149,901 | |
3.625% (3.752% effective rate) notes due 2023 (7) | 249,726 | | | 249,464 | |
3.875% (4.038% effective rate) notes due 2027 (8) | 297,934 | | | 297,534 | |
4.125% (4.271% effective rate) notes due 2028 (9) | 347,449 | | | 347,035 | |
4.20% (4.234% effective rate) notes due 2029 (10) | 349,288 | | | 349,189 | |
3.050% (3.079% effective rate) notes due 2030 (11) | 399,204 | | | 399,106 | |
2.600% (2.645% effective rate) notes due 2031 (12) | 398,579 | | | 398,423 | |
Variable rate term loan due 2022 (13) | 200,000 | | | 200,000 | |
| | | |
Revolving credit facility due 2025 (14) | 70,000 | | | — | |
| 2,312,180 | | | 2,390,652 | |
| Less-unamortized debt issuance costs | (15,207) | | | (13,981) | |
| Total mortgages and notes payable, net | $ | 2,788,915 | | | $ | 2,470,021 | |
__________
(1)Our secured mortgage loans were collateralized by real estate assets with an undepreciated book value of $727.8 million at December 31, 2021. We paid down $3.8 million of secured loan balances through principal amortization during 2021.
(2)Net of unamortized fair market value premium of $3.9 million as of December 31, 2021.
(3)Net of unamortized fair market value premium of $2.3 million as of December 31, 2021.
(4)Net of unamortized fair market value discount of $0.6 million as of December 31, 2021.
(5)Net of unamortized fair market value premium of $10.0 million as of December 31, 2021.
(6)Net of unamortized original issuance discount of $0.1 million as of December 31, 2020. This debt was repaid in 2021.
(7)Net of unamortized original issuance discount of $0.3 million and $0.5 million as of December 31, 2021 and 2020, respectively.
(8)Net of unamortized original issuance discount of $2.1 million and $2.5 million as of December 31, 2021 and 2020, respectively.
(9)Net of unamortized original issuance discount of $2.6 million and $3.0 million as of December 31, 2021 and 2020, respectively.
(10)Net of unamortized original issuance discount of $0.7 million and $0.8 million as of December 31, 2021 and 2020, respectively.
(11)Net of unamortized original issuance discount of $0.8 million and $0.9 million as of December 31, 2021 and 2020, respectively.
(12)Net of unamortized original issuance discount of $1.4 million and $1.6 million as of December 31, 2021 and 2020, respectively.
(13)As more fully described in Note 7, we entered into floating-to-fixed interest rate swaps that effectively fix LIBOR for $50.0 million of this loan through January 2022. Accordingly, the equivalent fixed rate of this amount is 2.79%. The interest rate on the remaining $150.0 million was 1.20% at December 31, 2021.
(14)The interest rate was 1.00% at December 31, 2021.
The following table sets forth scheduled future principal payments, including amortization, due on our mortgages and notes payable at December 31, 2021:
| | | | | | | | |
| Years Ending December 31, | | Amount |
| 2022 | | $ | 206,524 | |
| 2023 | | 257,059 | |
| 2024 | | 7,365 | |
| 2025 | | 77,176 | |
| 2026 | | 6,911 | |
| Thereafter | | 2,249,087 | |
| Less-unamortized debt issuance costs | | (15,207) | |
| | $ | 2,788,915 | |
During 2021, we entered into a new $750.0 million unsecured revolving credit facility, which replaced our previously existing $600.0 million revolving credit facility and includes an accordion feature that allows for an additional $550.0 million of borrowing capacity subject to additional lender commitments. Our new revolving credit facility is scheduled to mature in March 2025. Assuming no defaults have occurred, we have an option to extend the maturity for two additional six-month periods. The current interest rate on the new facility at our existing credit ratings is LIBOR plus 90 basis points and the annual facility fee is 20 basis points. The interest rate and facility fee are based on the higher of the publicly announced ratings from Moody’s Investors Service or Standard & Poor’s Ratings Services. The financial and other covenants under the new facility are substantially similar to our previous credit facility. We incurred $4.8 million of debt issuance costs, which are being amortized along with certain existing unamortized debt issuance costs over the remaining term of our new revolving credit facility. We recorded $0.1 million of loss on debt extinguishment. There was $70.0 million outstanding under our new revolving credit facility at both December 31, 2021 and January 28, 2022. At both December 31, 2021 and January 28, 2022, we had $0.1 million of outstanding letters of credit, which reduces the availability on our revolving credit facility. As a result, the unused capacity of our revolving credit facility at both December 31, 2021 and January 28, 2022 was $679.9 million.
During 2021, in conjunction with the acquisition of real estate assets from PAC, we assumed four secured mortgage loans recorded at fair value of $403 million in the aggregate, with a weighted average effective interest rate of 3.54% and a weighted average maturity of 10.7 years. We incurred $3.5 million of debt issuance costs related to these assumptions, which will be amortized over the remaining terms of the loans.
During the third quarter of 2021, we also obtained a $200.0 million, six-month unsecured bridge facility. The bridge facility was originally scheduled to mature in January 2022. The bridge facility bore interest at LIBOR plus 85 basis points, had a commitment fee of 20 basis points and contained financial and other covenants that are similar to the covenants under our $750 million unsecured revolving credit facility. We incurred $1.0 million of debt issuance costs related to this bridge facility which were being amortized over the six-month term. As of December 31, 2021, this bridge facility was prepaid in full without penalty. We recorded $0.2 million of loss on debt extinguishment related to this prepayment.
During 2021, we prepaid without penalty the remaining $150.0 million principal amount of 3.20% unsecured notes that was scheduled to mature in June 2021. We recorded $0.1 million of loss on debt extinguishment related to this prepayment.
During 2020, the Operating Partnership issued $400.0 million aggregate principal amount of 2.600% notes due February 2031, less original issuance discount of $1.6 million. These notes were priced to yield 2.645%. Underwriting fees and other expenses were incurred that aggregated $3.4 million; these costs were deferred and will be amortized over the term of the notes. The net proceeds from the issuance were used: (1) to finance the Operating Partnership’s cash tender offer to purchase $150.0 million principal amount of its 3.20% notes due June 15, 2021 at a purchase price of 101.908% of the face amount of the notes, plus accrued and unpaid interest; (2) to prepay without penalty our $100.0 million unsecured bank term loan that was scheduled to mature in January 2022 and which bore interest at LIBOR plus 110 basis points; and (3) for general corporate
purposes. We recorded $3.7 million of aggregate losses on debt extinguishment related to the repurchase of the 3.20% notes and the term loan prepayment.
During 2019, the Operating Partnership issued $400.0 million aggregate principal amount of 3.050% notes due February 2030, less original issuance discount of $1.0 million. These notes were priced to yield 3.079%. Underwriting fees and other expenses were incurred that aggregated $3.4 million; these costs were deferred and will be amortized over the term of the notes.
During 2019, the Operating Partnership issued $350.0 million aggregate principal amount of 4.20% notes due April 2029, less original issuance discount of $1.0 million. These notes were priced to yield 4.234%. Underwriting fees and other expenses were incurred that aggregated $3.1 million; these costs were deferred and will be amortized over the term of the notes.
During 2019, we prepaid without penalty the remaining $225.0 million on our seven-year unsecured bank term loan, which was scheduled to mature in June 2020. The term loan bore interest at LIBOR plus 110 basis points. We recorded $0.4 million of loss on debt extinguishment related to this prepayment.
During 2019, we prepaid without penalty $100.0 million on our $200.0 million unsecured bank term loan and recorded $0.3 million of loss on debt extinguishment related to this prepayment. During 2020, we prepaid without penalty the remaining $100.0 million upon issuance of the $400.0 million aggregate principal amount of 2.600% notes due February 2031. The term loan was scheduled to mature in January 2022 and bore interest at LIBOR plus 110 basis points.
We are currently in compliance with financial covenants with respect to our consolidated debt.
Our revolving credit facility and bank term loans require us to comply with customary operating covenants and various financial requirements. Upon an event of default on the revolving credit facility, the lenders having at least 51.0% of the total commitments under the revolving credit facility can accelerate all borrowings then outstanding, and we could be prohibited from borrowing any further amounts under our revolving credit facility, which would adversely affect our ability to fund our operations. In addition, certain of our unsecured debt agreements contain cross-default provisions giving the unsecured lenders the right to declare a default if we are in default under more than $35.0 million with respect to other loans in some circumstances.
The Operating Partnership has $249.7 million carrying amount of 2023 notes outstanding, $297.9 million carrying amount of 2027 notes outstanding, $347.4 million carrying amount of 2028 notes outstanding, $349.3 million carrying amount of 2029 notes outstanding, $399.2 million carrying amount of 2030 notes outstanding and $398.6 million carrying amount of 2031 notes outstanding. The indenture that governs these outstanding notes requires us to comply with customary operating covenants and various financial ratios. The trustee or the holders of at least 25.0% in principal amount of any series of notes can accelerate the principal amount of such series upon written notice of a default that remains uncured after 60 days.
We have considered our short-term liquidity needs within one year from February 8, 2022 (the date of issuance of the annual financial statements) and the adequacy of our estimated cash flows from operating activities and other available financing sources to meet these needs. In particular, we have considered our scheduled debt maturities during such one-year period, including the $200.0 million unsecured bank term loan that is scheduled to mature in November 2022 and the $250.0 million principal amount of unsecured notes that are scheduled to mature in January 2023. We have concluded it is probable we will meet these short-term liquidity requirements through a combination of the following:
•available cash and cash equivalents;
•cash flows from operating activities;
•issuance of debt securities by the Operating Partnership;
•issuance of secured debt;
•bank term loans;
•borrowings under our revolving credit facility;
•issuance of equity securities by the Company or the Operating Partnership; and
•the disposition of non-core assets.
Capitalized Interest
Total interest capitalized to development and significant building and tenant improvement projects was $9.6 million, $8.3 million and $5.6 million for the years ended December 31, 2021, 2020 and 2019, respectively.
7. Derivative Financial Instruments
During 2019, we entered into $150.0 million notional amount of forward-starting swaps that effectively locked the underlying 10-year treasury rate at 1.87% with respect to a planned issuance of debt securities by the Operating Partnership. Upon the subsequent issuance of the $400.0 million aggregate principal amount of 3.050% notes due February 2030 during 2019, we terminated the forward-starting swaps and paid cash upon settlement. The unrealized loss of $6.6 million in accumulated other comprehensive income/(loss) will be reclassified to interest expense as interest payments are made on the debt.
During 2018, we entered into an aggregate of $225.0 million notional amount of forward-starting swaps that effectively locked the underlying 10-year treasury rate at a weighted average of 2.86% with respect to a planned issuance of debt securities by the Operating Partnership. Upon issuance of the $350.0 million aggregate principal amount of 4.20% notes due April 2029 during 2019, we terminated the forward-starting swaps and paid cash upon settlement. The unrealized loss of $5.1 million in accumulated other comprehensive income/(loss) will be reclassified to interest expense as interest payments are made on the debt.
We previously entered into floating-to-fixed interest rate swaps through January 2022 with respect to an aggregate of $50.0 million LIBOR-based borrowings. These swaps effectively fix the underlying one-month LIBOR rate at a weighted average rate of 1.693%. As of January 28, 2022, these interest rate swaps have expired.
We also had floating-to-fixed interest rate swaps with respect to an aggregate of $225.0 million LIBOR-based borrowings. These swaps effectively fixed the underlying one-month LIBOR rate at a weighted average rate of 1.678%. During 2019, these interest rate swaps expired.
The counterparties under our swaps are major financial institutions. The swap agreements contain a provision whereby if we default on certain of our indebtedness and which default results in repayment of such indebtedness being, or becoming capable of being, accelerated by the lender, then we could also be declared in default on our swaps.
Our interest rate swaps have been designated as and are being accounted for as cash flow hedges with changes in fair value recorded in other comprehensive income/(loss) each reporting period. We have no collateral requirements related to our interest rate swaps.
Amounts reported in accumulated other comprehensive income/(loss) related to derivatives will be reclassified to interest expense as interest payments are made on our debt. During 2022, we estimate that $0.2 million will be reclassified as a net decrease to interest expense.
The following table sets forth the fair value of our derivatives:
| | | | | | | | | | | |
| December 31, |
| 2021 | | 2020 |
| Derivatives: | | | |
| | | |
| | | |
Derivatives designated as cash flow hedges in accounts payable, accrued expenses and other liabilities: | | | |
| Interest rate swaps | $ | 60 | | | $ | 846 | |
The following table sets forth the effect of our cash flow hedges on accumulated other comprehensive income/(loss) and interest expense:
| | | | | | | | | | | | | | | | | |
| Year Ended December 31, |
| 2021 | | 2020 | | 2019 |
| Derivatives Designated as Cash Flow Hedges: | | | | | |
| Amount of unrealized losses recognized in accumulated other comprehensive income/(loss) on derivatives: | | | | | |
| Interest rate swaps | $ | (19) | | | $ | (1,238) | | | $ | (9,134) | |
Amount of (gains)/losses reclassified out of accumulated other comprehensive income/(loss) into interest expense: | | | | | |
| Interest rate swaps | $ | 508 | | | $ | 247 | | | $ | (1,250) | |
8. Commitments and Contingencies
Lease and Contractual Commitments
We have $241.9 million of lease and contractual commitments at December 31, 2021. Lease and contractual commitments represent commitments under signed leases and contracts for operating properties (excluding tenant-funded tenant improvements) and contracts for development/redevelopment projects, of which $55.5 million was recorded on our Consolidated Balance Sheets at December 31, 2021.
Contingent Consideration
We had $0.8 million of contingent consideration related to a parcel of acquired development land at both December 31, 2021 and 2020. The contingent consideration is payable in cash to a third party if and to the extent future development milestones as outlined in the purchase agreements are met.
Environmental Matters
Substantially all of our in-service and development properties have been subjected to Phase I environmental assessments and, in certain instances, Phase II environmental assessments. Such assessments and/or updates have not revealed, nor are we aware of, any environmental liability that we believe would have a material adverse effect in our Consolidated Financial Statements.
Litigation, Claims and Assessments
We are from time to time a party to a variety of legal proceedings, claims and assessments arising in the ordinary course of our business. We regularly assess the liabilities and contingencies in connection with these matters based on the latest information available. For those matters where it is probable that we have incurred or will incur a loss and the loss or range of loss can be reasonably estimated, the estimated loss is accrued and charged to income in our Consolidated Financial Statements. In other instances, because of the uncertainties related to both the probable outcome and amount or range of loss, a reasonable estimate of liability, if any, cannot be made. Based on the current expected outcome of such matters, none of these proceedings, claims or assessments is expected to have a material effect on our business, financial condition, results of operations or cash flows.
COVID-19
Since early March 2020, the COVID-19 pandemic had a significant impact on the U.S. economy. We continue to follow the policies described in Note 1, including those related to impairments of real estate assets and investments in unconsolidated affiliates, leases and estimates of credit losses on operating lease receivables. While the results of our current analyses did not result in any material adjustments to amounts as of and for the years ended December 31, 2021 and 2020, respectively, circumstances related to the COVID-19 pandemic may result in recording impairments, lease modifications and credit losses in future periods.
9. Noncontrolling Interests
Noncontrolling Interests in Consolidated Affiliates
At December 31, 2021, our noncontrolling interests in consolidated affiliates relate to our joint venture partners’ 50.0% interest in office properties in Richmond and 20.0% interest in the Midtown One joint venture. See Note 4. Our joint venture partners are unrelated third parties.
Noncontrolling Interests in the Operating Partnership
Noncontrolling interests in the Operating Partnership relate to the ownership of Redeemable Common Units. Net income attributable to noncontrolling interests in the Operating Partnership is computed by applying the weighted average percentage of Redeemable Common Units during the period, as a percent of the total number of outstanding Common Units, to the Operating Partnership’s net income for the period after deducting distributions on Preferred Units. When a noncontrolling unitholder redeems a Common Unit for a share of Common Stock or cash, the noncontrolling interests in the Operating Partnership are reduced and the Company’s share in the Operating Partnership is increased by the fair value of each security at the time of redemption.
The following table sets forth the Company’s noncontrolling interests in the Operating Partnership:
| | | | | | | | | | | |
| Year Ended December 31, |
| 2021 | | 2020 |
| Beginning noncontrolling interests in the Operating Partnership | $ | 112,499 | | | $ | 133,216 | |
| Adjustment of noncontrolling interests in the Operating Partnership to fair value | 11,461 | | | (30,617) | |
| Issuances of Common Units | — | | | 6,163 | |
| Conversions of Common Units to Common Stock | (15,076) | | | (145) | |
| | | |
| Net income attributable to noncontrolling interests in the Operating Partnership | 8,321 | | | 9,338 | |
| Distributions to noncontrolling interests in the Operating Partnership | (5,516) | | | (5,456) | |
| Total noncontrolling interests in the Operating Partnership | $ | 111,689 | | | $ | 112,499 | |
The following table sets forth net income available for common stockholders and transfers from the Company’s noncontrolling interests in the Operating Partnership:
| | | | | | | | | | | | | | | | | |
| Year Ended December 31, |
| 2021 | | 2020 | | 2019 |
| Net income available for common stockholders | $ | 310,791 | | | $ | 344,914 | | | $ | 134,430 | |
Increase in additional paid in capital from conversions of Common Units to Common Stock | 15,076 | | | 145 | | | 663 | |
Issuances of Common Units | — | | | (6,163) | | | — | |
| Change from net income available for common stockholders and transfers from noncontrolling interests | $ | 325,867 | | | $ | 338,896 | | | $ | 135,093 | |
10. Disclosure About Fair Value of Financial Instruments
The following summarizes the levels of inputs that we use to measure fair value.
Level 1. Quoted prices in active markets for identical assets or liabilities.
Our Level 1 asset is our investment in marketable securities that we use to pay benefits under our non-qualified deferred compensation plan. Our Level 1 liability is our non-qualified deferred compensation obligation. The Company’s Level 1 noncontrolling interests in the Operating Partnership relate to the ownership of Common Units by various individuals and entities other than the Company.
Level 2. Observable inputs other than Level 1 prices, such as quoted prices for similar assets or liabilities, quoted prices in markets that are not active or other inputs that are observable or can be corroborated by observable market data for substantially the full term of the related assets or liabilities.
Our Level 2 assets include the fair value of our mortgages and notes receivable. Our Level 2 liabilities include the fair value of our mortgages and notes payable and interest rate swaps.
The fair value of mortgages and notes receivable and mortgages and notes payable is estimated by the income approach utilizing contractual cash flows and market-based interest rates to approximate the price that would be paid in an orderly transaction between market participants. The fair value of interest rate swaps is determined using the market standard methodology of netting the discounted future fixed cash receipts and the discounted expected variable cash payments. The variable cash payments of interest rate swaps are based on the expectation of future interest rates (forward curves) derived from observed market interest rate curves. In addition, credit valuation adjustments are considered in the fair values to account for potential nonperformance risk, but were concluded to not be significant inputs to the calculation for the periods presented.
Level 3. Unobservable inputs that are supported by little or no market activity and that are significant to the fair value of the assets or liabilities.
Our Level 3 assets include any real estate assets recorded at fair value on a non-recurring basis as a result of our quarterly impairment analysis, which are valued using unobservable local and national industry market data such as comparable sales, appraisals, brokers’ opinions of value and/or the terms of definitive sales contracts. Significant increases or decreases in any valuation inputs in isolation would result in a significantly lower or higher fair value measurement.
The following table sets forth our assets and liabilities and the Company’s noncontrolling interests in the Operating Partnership that are measured or disclosed at fair value within the fair value hierarchy:
| | | | | | | | | | | | | | | | | | | |
| | | Level 1 | | Level 2 | | |
| Total | | Quoted Prices
in Active
Markets for Identical Assets or Liabilities | | Significant Observable Inputs | | |
| Fair Value at December 31, 2021: | | | | | | | |
| Assets: | | | | | | | |
Mortgages and notes receivable, at fair value (1) | $ | 1,227 | | | $ | — | | | $ | 1,227 | | | |
| | | | | | | |
Marketable securities of non-qualified deferred compensation plan (in prepaid expenses and other assets) | 2,866 | | | 2,866 | | | — | | | |
| | | | | | | |
| | | | | | | |
| Total Assets | $ | 4,093 | | | $ | 2,866 | | | $ | 1,227 | | | |
| Noncontrolling Interests in the Operating Partnership | $ | 111,689 | | | $ | 111,689 | | | $ | — | | | |
| Liabilities: | | | | | | | |
Mortgages and notes payable, net, at fair value (1) | $ | 2,907,492 | | | $ | — | | | $ | 2,907,492 | | | |
Interest rate swaps (in accounts payable, accrued expenses and other liabilities) | 60 | | | — | | | 60 | | | |
Non-qualified deferred compensation obligation (in accounts payable, accrued expenses and other liabilities) | 2,866 | | | 2,866 | | | — | | | |
| | | | | | | |
| | | | | | | |
| Total Liabilities | $ | 2,910,418 | | | $ | 2,866 | | | $ | 2,907,552 | | | |
| | | | | | | | | | | | | | | | | | | |
| Fair Value at December 31, 2020: | | | | | | | |
| Assets: | | | | | | | |
Mortgages and notes receivable, at fair value (1) | $ | 1,341 | | | $ | — | | | $ | 1,341 | | | |
| | | | | | | |
Marketable securities of non-qualified deferred compensation plan (in prepaid expenses and other assets) | 2,573 | | | 2,573 | | | — | | | |
| | | | | | | |
| | | | | | | |
| Total Assets | $ | 3,914 | | | $ | 2,573 | | | $ | 1,341 | | | |
| Noncontrolling Interests in the Operating Partnership | $ | 112,499 | | | $ | 112,499 | | | $ | — | | | |
| Liabilities: | | | | | | | |
Mortgages and notes payable, net, at fair value (1) | $ | 2,639,163 | | | $ | — | | | $ | 2,639,163 | | | |
Interest rate swaps (in accounts payable, accrued expenses and other liabilities) | 846 | | | — | | | 846 | | | |
Non-qualified deferred compensation obligation (in accounts payable, accrued expenses and other liabilities) | 2,573 | | | 2,573 | | | — | | | |
| | | | | | | |
| | | | | | | |
| Total Liabilities | $ | 2,642,582 | | | $ | 2,573 | | | $ | 2,640,009 | | | |
__________
(1) Amounts are not recorded at fair value on our Consolidated Balance Sheets at December 31, 2021 and 2020.
The Level 3 impaired real estate assets measured at a fair value of $2.1 million in the second quarter of 2020 included a non-core office building. The impairment resulted from a change in our assumptions about the use of the assets and was calculated using brokers’ opinions of value, letters of intent and comparable sales as observable inputs were not available.
11. Equity
Common Stock Issuances
During 2020, we entered into separate equity distribution agreements in which the Company may offer and sell up to $300.0 million in aggregate gross sales price of shares of Common Stock. During 2021, the Company issued 456,273 shares of Common Stock under its equity distribution agreements at an average gross sales price of $46.23 per share and received net proceeds, after sales commissions, of $20.8 million. At December 31, 2021, the Company had 95.1 million remaining shares of Common Stock authorized to be issued under its charter.
Common Stock Dividends
Dividends of the Company declared per share of Common Stock aggregated $1.96, $1.92 and $1.90 for the years ended December 31, 2021, 2020 and 2019, respectively.
The following table sets forth the Company’s estimated taxability to the common stockholders of dividends per share for federal income tax purposes:
| | | | | | | | | | | | | | | | | |
| Year Ended December 31, |
| 2021 | | 2020 | | 2019 |
| Ordinary dividend | $ | 1.87 | | | $ | 1.65 | | | $ | 1.64 | |
| Capital gains | 0.09 | | | 0.25 | | | 0.13 | |
| Return of capital | — | | | 0.02 | | | 0.13 | |
| Total | $ | 1.96 | | | $ | 1.92 | | | $ | 1.90 | |
The Company’s tax returns have not been examined by the Internal Revenue Service (“IRS”) and, therefore, the taxability of dividends is subject to change.
Preferred Stock
The following table sets forth the Company’s outstanding Preferred Stock:
| | | | | | | | | | | | | | | | | | | | | | | | | | | | | | | | | | | | | | |
| | Issue Date | | Number of Shares Outstanding | | Carrying Value | | Liquidation Preference Per Share | | Optional Redemption Date | | Annual Dividends Payable Per Share |
| | | | (in thousands) | | | | | | | | |
| December 31, 2021 | | | | | | | | | | | | |
| 8.625% Series A Cumulative Redeemable | | 2/12/1997 | | 29 | | | $ | 28,821 | | | $ | 1,000 | | | 2/12/2027 | | $ | 86.25 | |
| December 31, 2020 | | | | | | | | | | | | |
| 8.625% Series A Cumulative Redeemable | | 2/12/1997 | | 29 | | | $ | 28,826 | | | $ | 1,000 | | | 2/12/2027 | | $ | 86.25 | |
The following table sets forth the Company’s estimated taxability to the preferred stockholders of dividends per share for federal income tax purposes:
| | | | | | | | | | | | | | | | | |
| Year Ended December 31, |
| 2021 | | 2020 | | 2019 |
| 8.625% Series A Cumulative Redeemable: | | | | | |
| Ordinary dividend | $ | 82.38 | | | $ | 74.96 | | | $ | 79.90 | |
| Capital gains | 3.87 | | | 11.29 | | | 6.35 | |
| Total | $ | 86.25 | | | $ | 86.25 | | | $ | 86.25 | |
| | | | | |
| | | | | |
| | | | | |
| | | | | |
The Company’s tax returns have not been examined by the IRS and, therefore, the taxability of dividends is subject to change.
Warrants
At both December 31, 2021 and 2020, we had 15,000 warrants outstanding with an exercise price of $32.50 per share. Upon exercise of a warrant, the Company will contribute the exercise price to the Operating Partnership in exchange for Common Units. Therefore, the Operating Partnership accounts for such warrants as if issued by the Operating Partnership. These warrants have no expiration date.
Common Unit Distributions
Distributions of the Operating Partnership declared per Common Unit aggregated $1.96, $1.92 and $1.90 for the years ended December 31, 2021, 2020 and 2019, respectively.
Redeemable Common Units
Generally, the Operating Partnership is obligated to redeem each Redeemable Common Unit at the request of the holder thereof for cash equal to the value of one share of Common Stock based on the average of the market price for the 10 trading days immediately preceding the notice date of such redemption, provided that the Company, at its option, may elect to acquire any such Redeemable Common Unit presented for redemption for cash or one share of Common Stock. When a holder redeems a Redeemable Common Unit for a share of Common Stock or cash, the Company’s share in the Operating Partnership will be increased. The Common Units owned by the Company are not redeemable.
Preferred Units
The following table sets forth the Operating Partnership’s outstanding Preferred Units:
| | | | | | | | | | | | | | | | | | | | | | | | | | | | | | | | | | | | | | |
| | Issue Date | | Number of
Units
Outstanding | | Carrying
Value | | Liquidation Preference
Per Unit | | Optional Redemption
Date | | Annual
Distributions
Payable
Per Unit |
| | | | (in thousands) | | | | | | | | |
| December 31, 2021 | | | | | | | | | | | | |
| 8.625% Series A Cumulative Redeemable | | 2/12/1997 | | 29 | | | $ | 28,821 | | | $ | 1,000 | | | 2/12/2027 | | $ | 86.25 | |
| December 31, 2020 | | | | | | | | | | | | |
| 8.625% Series A Cumulative Redeemable | | 2/12/1997 | | 29 | | | $ | 28,826 | | | $ | 1,000 | | | 2/12/2027 | | $ | 86.25 | |
12. Employee Benefit Plans
Officer, Management and Director Compensation Programs
Officers of the Company participate in an annual non-equity incentive program pursuant to which they are eligible to earn cash payments based on a percentage of their annual base salary in effect for December of the applicable year. Under this component of our executive compensation program, officers are eligible to earn additional cash compensation generally to the extent specific performance-based metrics are achieved during the most recently completed year. The position held by each officer has a target annual incentive percentage that ranges from 25% to 130% of base salary. The more senior the position, the greater the portion of compensation that varies with performance. The percentage amount an officer may earn under the annual non-equity incentive plan is the product of the target annual incentive percentage times an “actual performance factor,” which can range from zero to 200%. Amounts under our annual non-equity incentive plan are accrued and expensed in the year earned, but are typically paid early in the following year.
Certain other employees participate in a similar annual non-equity incentive program. Incentive eligibility ranges from 5% to 30% of annual base salary. These amounts are also accrued and expensed in the year earned, but are typically paid early in the following year.
The Company’s officers are eligible to receive a mix of long-term equity incentive awards on or about March 1 of each year. Prior to 2018, the mix generally consisted of stock options, time-based restricted stock and total return-based restricted stock. Since 2018, the mix has consisted of time-based restricted stock and total return-based restricted stock. Time-based restricted stock grants are also made annually to directors and certain other employees. Dividends received on restricted stock are non-forfeitable and are paid at the same rate and on the same date as on shares of Common Stock, except that, with respect to shares of total return-based restricted stock issued to the Company’s chief executive officer, dividends accumulate and are payable only if and to the extent the shares vest. Dividends paid on subsequently forfeited shares are expensed. Additional shares of total return-based restricted stock may be issued at the end of the applicable measurement periods if and to the extent actual performance exceeds certain levels of performance. Such additional shares, if any, would be fully vested when issued. No expense is recorded for additional shares of total return-based restricted stock that may be issued at the end of the applicable measurement period since that possibility is reflected in the grant date fair value. The following table sets forth the number of shares of Common Stock reserved for future issuance under the Company’s long-term equity incentive plans:
| | | | | | | | | | | |
| December 31, |
| 2021 | | 2020 |
| Outstanding stock options and warrants | 527,067 | | | 552,373 | |
| Possible future issuance under equity incentive plans | 2,999,100 | | | 1,926,324 | |
| 3,526,167 | | | 2,478,697 | |
Of the possible future issuance under the Company’s long-term equity incentive plans at December 31, 2021, no more than an additional 1.0 million shares can be in the form of restricted stock.
During the years ended December 31, 2021, 2020 and 2019, we recognized $8.6 million, $6.2 million and $7.2 million, respectively, of share-based compensation expense. Because REITs generally do not pay income taxes, we do not realize tax benefits on share-based payments. At December 31, 2021, there was $3.4 million of total unrecognized share-based compensation costs, which will be recognized over a weighted average remaining contractual term of 1.9 years.
- Stock Options
Stock options issued from 2014 through 2017 vest ratably on an annual basis over four years and expire after 10 years. All stock options have an exercise price equal to the last reported stock price of our Common Stock on the New York Stock Exchange (“NYSE”) on the last trading day prior to grant. The value of all options as of the date of grant is calculated using the Black-Scholes option-pricing model and is amortized over the respective vesting period or the service period, if shorter, for employees who are or will become eligible under the Company’s retirement plan.
The following table sets forth stock option activity:
| | | | | | | | | | | |
| Options Outstanding |
| Number of Options | | Weighted Average Exercise Price |
| Stock options outstanding at December 31, 2018 | 596,518 | | | $ | 45.67 | |
| | | |
| | | |
| Exercised | (9,026) | | | 39.53 | |
| Forfeited | (2,590) | | | 48.79 | |
| Stock options outstanding at December 31, 2019 | 584,902 | | | 45.75 | |
| | | |
| | | |
| Exercised | (42,163) | | | 41.10 | |
| Forfeited | (5,366) | | | 50.82 | |
| Stock options outstanding at December 31, 2020 | 537,373 | | | 46.07 | |
| | | |
| | | |
| Exercised | (25,306) | | | 43.76 | |
| | | |
Stock options outstanding at December 31, 2021 (1) | 512,067 | | | $ | 46.18 | |
__________
(1)The Company had 512,067 options exercisable at December 31, 2021 with a weighted average exercise price of $46.18, weighted average remaining life of 4.0 years and intrinsic value of $0.6 million. Of these exercisable options, 279,549 had exercise prices higher than the market price of our Common Stock at December 31, 2021.
Cash received or receivable from options exercised was $1.1 million, $1.9 million and $0.4 million for the years ended December 31, 2021, 2020 and 2019, respectively. The total intrinsic value of options exercised during the years ended December 31, 2021, 2020 and 2019 was $0.1 million, $0.4 million and $0.1 million, respectively. The total intrinsic value of options outstanding at December 31, 2021, 2020 and 2019 was $0.6 million, $0.1 million and $2.4 million, respectively. The Company generally does not permit the net cash settlement of exercised stock options, but does permit net share settlement so long as the shares received are held for at least a year. The Company has a practice of issuing new shares to satisfy stock option exercises.
- Time-Based Restricted Stock
Shares of time-based restricted stock vest ratably on an annual basis generally over four years. Beginning in 2019, shares of time-based restricted stock granted to non-employee directors vest on the first anniversary of the grant date. The value of grants of time-based restricted stock is based on the market value of Common Stock as of the date of grant and is amortized to expense over the respective vesting period or the service period, if shorter, for employees who are or will become eligible under the Company’s retirement plan.
The following table sets forth time-based restricted stock activity:
| | | | | | | | | | | |
| Number of Shares | | Weighted Average Grant Date Fair Value |
| Restricted shares outstanding at December 31, 2018 | 191,239 | | | $ | 45.62 | |
Awarded and issued (1) | 103,590 | | | 45.98 | |
Vested (2) | (73,036) | | | 45.79 | |
| Forfeited | (3,642) | | | 46.07 | |
| Restricted shares outstanding at December 31, 2019 | 218,151 | | | 45.73 | |
Awarded and issued (1) | 83,116 | | | 44.88 | |
Vested (2) | (88,326) | | | 45.86 | |
| Forfeited | (3,751) | | | 45.78 | |
| Restricted shares outstanding at December 31, 2020 | 209,190 | | | 45.34 | |
Awarded and issued (1) | 103,120 | | | 39.99 | |
Vested (2) | (89,264) | | | 45.90 | |
| Forfeited | (3,327) | | | 43.13 | |
| Restricted shares outstanding at December 31, 2021 | 219,719 | | | $ | 42.63 | |
__________
(1)The weighted average fair value at grant date of time-based restricted stock issued during the years ended December 31, 2021, 2020 and 2019 was $4.1 million, $3.7 million and $4.8 million, respectively.
(2)The vesting date fair value of time-based restricted stock that vested during the years ended December 31, 2021, 2020 and 2019 was $3.6 million, $3.9 million and $3.3 million, respectively. Vested shares include those shares surrendered by employees to satisfy tax withholding obligations in connection with such vesting.
- Total Return-Based Restricted Stock
Shares of total return-based restricted stock vest to the extent the Company’s absolute total returns for certain pre-determined three-year periods exceed predetermined goals. The amount subject to vesting ranges from zero to 150%. For total return-based restricted stock issued prior to 2020, notwithstanding the Company’s absolute total return, if the Company’s total return exceeds 100% of the average peer group total return index, at least 75% of total return-based restricted stock issued will vest at the end of the applicable period. This amount was increased from 75% to 100% for total return-based restricted stock issued in 2021 and 2020. The weighted average grant date fair value of such shares of total return-based restricted stock issued in 2021, 2020 and 2019 was determined to be $36.41, $38.31 and $39.42, respectively, and is amortized over the respective three-year period or the service period, if shorter, for employees who are or will become eligible under the Company’s retirement plan. The fair values of the total return-based restricted stock granted were determined at the grant dates using a Monte Carlo simulation model and the following assumptions:
| | | | | | | | | | | | | | | | | |
| 2021 | | 2020 | | 2019 |
Risk free interest rate (1) | 0.3 | % | | 0.9 | % | | 2.4 | % |
Common stock dividend yield (2) | 4.8 | % | | 3.9 | % | | 4.4 | % |
Expected volatility (3) | 26.8 | % | | 20.4 | % | | 27.3 | % |
__________
(1)Represents the interest rate as of the grant date on US treasury bonds having the same life as the estimated life of the total return-based restricted stock grants.
(2)The dividend yield is calculated utilizing the then current regular dividend rate for a one-year period and the average per share price of Common Stock during the three-month period preceding the date of grant.
(3)Based on the historical volatility of Common Stock over a period relevant to the related total return-based restricted stock grant.
The following table sets forth total return-based restricted stock activity:
| | | | | | | | | | | |
| Number of Shares | | Weighted Average Grant Date Fair Value |
| Restricted shares outstanding at December 31, 2018 | 180,094 | | | $ | 43.34 | |
Awarded and issued (1) | 87,344 | | | 39.42 | |
Vested (2) | (45,901) | | | 43.68 | |
Forfeited (3) | (12,689) | | | 43.58 | |
| Restricted shares outstanding at December 31, 2019 | 208,848 | | | 42.22 | |
Awarded and issued (1) | 66,188 | | | 38.31 | |
| | | |
Forfeited (3) | (49,852) | | | 51.93 | |
| Restricted shares outstanding at December 31, 2020 | 225,184 | | | 39.53 | |
Awarded and issued (1) | 81,464 | | | 36.41 | |
Vested (2) | (55,452) | | | 43.01 | |
Forfeited (3) | (21,904) | | | 42.33 | |
| Restricted shares outstanding at December 31, 2021 | 229,292 | | | $ | 38.00 | |
__________
(1)The fair value at grant date of total return-based restricted stock issued during the years ended December 31, 2021, 2020 and 2019 was $2.9 million, $2.5 million and $3.4 million, respectively, at target.
(2)The vesting date fair value of total return-based restricted stock that vested during the years ended December 31, 2021 and 2019 was $2.2 million and $2.1 million, respectively, based on the performance of the specific plans. Vested shares include those shares surrendered by employees to satisfy tax withholding obligations in connection with such vesting. There were no vested shares of total return-based restricted stock during the year ended December 31, 2020.
(3)The 2021, 2020 and 2019 amounts include 18,484, 46,852 and 9,521 shares, respectively, that were forfeited at the end of the applicable measurement period because the applicable total return did not meet targeted levels.
401(k) Retirement Savings Plan
We have a 401(k) Retirement Savings Plan covering substantially all employees who meet certain age and employment criteria. We contribute amounts for each participant at a rate of 75% of the employee’s contribution (up to 6% of each employee’s bi-weekly salary and cash incentives, subject to statutory limits). During the years ended December 31, 2021, 2020 and 2019, we contributed $1.3 million, $1.4 million and $1.5 million, respectively, to the 401(k) savings plan. The assets of this qualified plan are not included in our Consolidated Financial Statements since the assets are not owned by us.
Retirement Plan
The Company has a retirement plan for employees with at least 30 years of continuous service or are at least 55 years old with at least 10 years of continuous service. Subject to advance written notice and a non-compete agreement, eligible retirees would be entitled to receive a pro rata amount of any annual non-equity incentive compensation earned during the year of retirement and stock options and time-based restricted stock would be non-forfeitable and vest according to the terms of their original grants. Eligible retirees would also be entitled to retain any total return-based restricted stock that subsequently vests after the retirement date according to the terms of their original grants. For employees who meet the age and service eligibility requirements, 100% of their annual grants are expensed at the grant date as if fully vested. For employees who will meet the age and service eligibility requirements within the normal vesting periods, the grants are amortized over the shorter service period.
Deferred Compensation
Prior to 2010, officers could elect to defer all or a portion of their cash compensation, which was then invested in unrelated mutual funds under a non-qualified deferred compensation plan. These investments are recorded at fair value, which aggregated $2.9 million and $2.6 million at December 31, 2021 and 2020, respectively, and are included in prepaid expenses and other assets, with an offsetting deferred compensation liability recorded in accounts payable, accrued expenses and other liabilities. Deferred amounts ultimately payable to the participants are based on the value of the related mutual fund investments. Accordingly, changes in the value of the unrelated mutual funds are recorded in interest and other income and the corresponding offsetting changes in the deferred compensation liability are recorded in general and administrative expense. As a result, there is no effect on our net income.
The following table sets forth our deferred compensation liability:
| | | | | | | | | | | | | | | | | |
| Year Ended December 31, |
| 2021 | | 2020 | | 2019 |
| Beginning deferred compensation liability | $ | 2,573 | | | $ | 2,345 | | | $ | 1,849 | |
| | | | | |
Mark-to-market adjustment to deferred compensation (in general and administrative expenses) | 293 | | | 228 | | | 496 | |
| | | | | |
| Total deferred compensation liability | $ | 2,866 | | | $ | 2,573 | | | $ | 2,345 | |
Employee Stock Purchase Plan
The Company has an Employee Stock Purchase Plan (“ESPP”) pursuant to which employees may contribute up to 25% of their cash compensation for the purchase of Common Stock. At the end of each quarter, each participant’s account balance, which includes accumulated dividends, is applied to acquire shares of Common Stock at a cost that is calculated at 85% of the average closing price on the NYSE on the five consecutive days preceding the last day of the quarter. In the years ended December 31, 2021, 2020 and 2019, the Company issued 38,460, 47,208 and 38,618 shares, respectively, of Common Stock under the ESPP. The 15% discount on newly issued shares, which is taxable income to the participants and is recorded by us as additional compensation expense, aggregated $0.2 million, $0.3 million and $0.3 million in the years ended December 31, 2021, 2020 and 2019, respectively. Generally, shares purchased under the ESPP must be held at least one year. The Company satisfies its ESPP obligations by issuing additional shares of Common Stock.
13. Accumulated Other Comprehensive Income/(Loss)
The following table sets forth the components of accumulated other comprehensive income/(loss):
| | | | | | | | | | | |
| December 31, |
| 2021 | | 2020 |
| | | |
| | | |
| | | |
| | | |
| Cash flow hedges: | | | |
| Beginning balance | $ | (1,462) | | | $ | (471) | |
| Unrealized losses on cash flow hedges | (19) | | | (1,238) | |
Amortization of cash flow hedges (1) | 508 | | | 247 | |
| | | |
| Total accumulated other comprehensive loss | $ | (973) | | | $ | (1,462) | |
__________
(1) Amounts reclassified out of accumulated other comprehensive income/(loss) into interest expense.
14. Real Estate and Other Assets Held For Sale
The following table sets forth the assets held for sale at December 31, 2021 and 2020, which are considered non-core:
| | | | | | | | | | | |
| December 31, |
| 2021 | | 2020 |
| Assets: | | | |
| Land | $ | — | | | $ | 2,612 | |
| Buildings and tenant improvements | — | | | 12,238 | |
| | | |
| Land held for development | 3,482 | | | — | |
| Less-accumulated depreciation | — | | | (3,577) | |
| Net real estate assets | 3,482 | | | 11,273 | |
| | | |
| Deferred leasing costs, net | — | | | 87 | |
| Prepaid expenses and other assets | 36 | | | — | |
| Real estate and other assets, net, held for sale | $ | 3,518 | | | $ | 11,360 | |
| | | |
| | | |
| | | |
| | | |
| | | |
15. Earnings Per Share and Per Unit
The following table sets forth the computation of basic and diluted earnings per share of the Company:
| | | | | | | | | | | | | | | | | |
| Year Ended December 31, |
| 2021 | | 2020 | | 2019 |
| Earnings per Common Share - basic: | | | | | |
| Numerator: | | | | | |
| Net income | $ | 323,310 | | | $ | 357,914 | | | $ | 141,683 | |
| Net (income) attributable to noncontrolling interests in the Operating Partnership | (8,321) | | | (9,338) | | | (3,551) | |
| Net (income) attributable to noncontrolling interests in consolidated affiliates | (1,712) | | | (1,174) | | | (1,214) | |
| Dividends on Preferred Stock | (2,486) | | | (2,488) | | | (2,488) | |
| | | | | |
| | | | | |
| | | | | |
| | | | | |
| | | | | |
| Net income available for common stockholders | $ | 310,791 | | | $ | 344,914 | | | $ | 134,430 | |
| Denominator: | | | | | |
Denominator for basic earnings per Common Share – weighted average shares (1) | 104,232 | | | 103,876 | | | 103,692 | |
| | | | | |
| | | | | |
| | | | | |
| Net income available for common stockholders | $ | 2.98 | | | $ | 3.32 | | | $ | 1.30 | |
| Earnings per Common Share - diluted: | | | | | |
| Numerator: | | | | | |
| Net income | $ | 323,310 | | | $ | 357,914 | | | $ | 141,683 | |
| Net (income) attributable to noncontrolling interests in consolidated affiliates | (1,712) | | | (1,174) | | | (1,214) | |
| Dividends on Preferred Stock | (2,486) | | | (2,488) | | | (2,488) | |
| | | | | |
| | | | | |
| | | | | |
| Net income available for common stockholders before net (income) attributable to noncontrolling interests in the Operating Partnership | $ | 319,112 | | | $ | 354,252 | | | $ | 137,981 | |
| Denominator: | | | | | |
Denominator for basic earnings per Common Share – weighted average shares (1) | 104,232 | | | 103,876 | | | 103,692 | |
| Add: | | | | | |
| Stock options using the treasury method | 18 | | | 8 | | | 22 | |
| Noncontrolling interests Common Units | 2,811 | | | 2,830 | | | 2,731 | |
| Denominator for diluted earnings per Common Share – adjusted weighted average shares and assumed conversions | 107,061 | | | 106,714 | | | 106,445 | |
| | | | | |
| | | | | |
| | | | | |
| Net income available for common stockholders | $ | 2.98 | | | $ | 3.32 | | | $ | 1.30 | |
__________
(1)Includes all unvested restricted stock where dividends on such restricted stock are non-forfeitable.
The following table sets forth the computation of basic and diluted earnings per unit of the Operating Partnership:
| | | | | | | | | | | | | | | | | |
| Year Ended December 31, |
| 2021 | | 2020 | | 2019 |
| Earnings per Common Unit - basic: | | | | | |
| Numerator: | | | | | |
| Net income | $ | 323,310 | | | $ | 357,914 | | | $ | 141,683 | |
| Net (income) attributable to noncontrolling interests in consolidated affiliates | (1,712) | | | (1,174) | | | (1,214) | |
| Distributions on Preferred Units | (2,486) | | | (2,488) | | | (2,488) | |
| | | | | |
| | | | | |
| | | | | |
| Net income available for common unitholders | $ | 319,112 | | | $ | 354,252 | | | $ | 137,981 | |
| Denominator: | | | | | |
Denominator for basic earnings per Common Unit – weighted average units (1) | 106,634 | | | 106,297 | | | 106,014 | |
| | | | | |
| | | | | |
| | | | | |
| Net income available for common unitholders | $ | 2.99 | | | $ | 3.33 | | | $ | 1.30 | |
| Earnings per Common Unit - diluted: | | | | | |
| Numerator: | | | | | |
| Net income | $ | 323,310 | | | $ | 357,914 | | | $ | 141,683 | |
| Net (income) attributable to noncontrolling interests in consolidated affiliates | (1,712) | | | (1,174) | | | (1,214) | |
| Distributions on Preferred Units | (2,486) | | | (2,488) | | | (2,488) | |
| | | | | |
| | | | | |
| | | | | |
| Net income available for common unitholders | $ | 319,112 | | | $ | 354,252 | | | $ | 137,981 | |
| Denominator: | | | | | |
Denominator for basic earnings per Common Unit – weighted average units (1) | 106,634 | | | 106,297 | | | 106,014 | |
| Add: | | | | | |
| Stock options using the treasury method | 18 | | | 8 | | | 22 | |
| Denominator for diluted earnings per Common Unit – adjusted weighted average units and assumed conversions | 106,652 | | | 106,305 | | | 106,036 | |
| | | | | |
| | | | | |
| | | | | |
| Net income available for common unitholders | $ | 2.99 | | | $ | 3.33 | | | $ | 1.30 | |
__________
(1)Includes all unvested restricted stock where distributions on such restricted stock are non-forfeitable.
16. Income Taxes
Our Consolidated Financial Statements include the operations of the Company’s taxable REIT subsidiary, which is not entitled to the dividends paid deduction and is subject to federal, state and local income taxes on its taxable income.
The minimum dividend per share of Common Stock required for the Company to maintain its REIT status was $1.61, $1.41 and $1.44 per share in 2021, 2020 and 2019, respectively. Continued qualification as a REIT depends on the Company’s ability to satisfy the dividend distribution tests, stock ownership requirements and various other qualification tests. The tax basis of the Company’s assets (net of accumulated tax depreciation and amortization) and liabilities was approximately $5.2 billion and $3.2 billion, respectively, at December 31, 2021 and $4.7 billion and $2.8 billion, respectively, at December 31, 2020. The tax basis of the Operating Partnership’s assets (net of accumulated tax depreciation and amortization) and liabilities was approximately $5.0 billion and $3.2 billion, respectively, at December 31, 2021 and $4.6 billion and $2.8 billion, respectively, at December 31, 2020.
During the years ended December 31, 2021, 2020 and 2019, the Company qualified as a REIT and incurred no federal income tax expense; accordingly, the only federal income taxes included in the accompanying Consolidated Financial Statements relate to activities of the Company’s taxable REIT subsidiary.
The following table sets forth the Company’s income tax expense:
| | | | | | | | | | | | | | | | | |
| Year Ended December 31, |
| 2021 | | 2020 | | 2019 |
| Current tax expense: | | | | | |
| Federal | $ | 40 | | | $ | 110 | | | $ | 202 | |
| State | 79 | | | 240 | | | 148 | |
| 119 | | | 350 | | | 350 | |
| Deferred tax expense/(benefit): | | | | | |
| Federal | (39) | | | (9) | | | 14 | |
| State | 58 | | | (4) | | | (120) | |
| 19 | | | (13) | | | (106) | |
| | | | | |
| | | | | |
| Total income tax expense | $ | 138 | | | $ | 337 | | | $ | 244 | |
The Company’s net deferred tax liability was $0.1 million at both December 31, 2021 and 2020. The net deferred tax liability is comprised primarily of tax versus book differences related to property (depreciation, amortization and basis differences).
For the years ended December 31, 2021 and 2020, there were no unrecognized tax benefits. The Company is subject to federal, state and local income tax examinations by taxing authorities for 2018 through 2021. The Company does not expect that the total amount of unrecognized benefits will materially change within the next year.
17. Segment Information
Our principal business is the operation, acquisition and development of rental real estate properties. We evaluate our business by geographic location. The operating results by geographic grouping are regularly reviewed by our chief operating decision maker for assessing performance and other purposes. There are no material inter-segment transactions.
Our accounting policies of the segments are the same as those used in our Consolidated Financial Statements. All operations are within the United States.
The following tables summarize the rental and other revenues and net operating income, the primary industry property-level performance metric used by our chief operating decision maker and which is defined as rental and other revenues less rental property and other expenses, for each of our reportable segments. Our segment information as of and for the year ended December 31, 2019 has been retrospectively revised from previously reported amounts to reflect a change in our reportable segments as a result of recent dispositions.
| | | | | | | | | | | | | | | | | |
| Year Ended December 31, |
| 2021 | | 2020 | | 2019 |
| Rental and Other Revenues: | | | | | |
| Office: | | | | | |
| Atlanta | $ | 143,612 | | | $ | 146,704 | | | $ | 151,279 | |
| Charlotte | 49,347 | | | 35,733 | | | 4,650 | |
| Nashville | 149,674 | | | 138,089 | | | 133,867 | |
| Orlando | 51,281 | | | 49,459 | | | 52,679 | |
| Pittsburgh | 57,371 | | | 58,518 | | | 60,755 | |
| Raleigh | 162,115 | | | 128,189 | | | 122,173 | |
| Richmond | 45,941 | | | 48,079 | | | 49,428 | |
| Tampa | 97,954 | | | 99,520 | | | 86,431 | |
| Total Office Segment | 757,295 | | | 704,291 | | | 661,262 | |
| | | | | |
| | | | | |
| | | | | |
| Other | 10,712 | | | 32,609 | | | 74,717 | |
| Total Rental and Other Revenues | $ | 768,007 | | | $ | 736,900 | | | $ | 735,979 | |
| | | | | | | | | | | | | | | | | |
| |
| | | | | |
| Net Operating Income: | | | | | |
| Office: | | | | | |
| Atlanta | $ | 94,122 | | | $ | 95,448 | | | $ | 97,019 | |
| Charlotte | 38,464 | | | 28,431 | | | 3,791 | |
| Nashville | 110,039 | | | 99,901 | | | 97,386 | |
| Orlando | 31,301 | | | 29,546 | | | 32,062 | |
| Pittsburgh | 34,248 | | | 35,631 | | | 36,249 | |
| Raleigh | 121,005 | | | 95,926 | | | 88,402 | |
| Richmond | 31,726 | | | 33,667 | | | 33,756 | |
| Tampa | 64,396 | | | 67,059 | | | 50,339 | |
| Total Office Segment | 525,301 | | | 485,609 | | | 439,004 | |
| | | | | |
| | | | | |
| | | | | |
| Other | 6,270 | | | 19,466 | | | 48,464 | |
| Total Net Operating Income | 531,571 | | | 505,075 | | | 487,468 | |
| Reconciliation to net income: | | | | | |
| Depreciation and amortization | (259,255) | | | (241,585) | | | (254,504) | |
| Impairments of real estate assets | — | | | (1,778) | | | (5,849) | |
| General and administrative expenses | (40,553) | | | (41,031) | | | (44,067) | |
| Interest expense | (85,853) | | | (80,962) | | | (81,648) | |
| Other income/(loss) | 1,394 | | | (1,707) | | | (2,510) | |
| Gains on disposition of property | 174,059 | | | 215,897 | | | 39,517 | |
| Equity in earnings of unconsolidated affiliates | 1,947 | | | 4,005 | | | 3,276 | |
| Net income | $ | 323,310 | | | $ | 357,914 | | | $ | 141,683 | |
| | | | | | | | | | | |
| December 31, |
| 2021 | | 2020 |
| | | |
| Total Assets: | | | |
| Office: | | | |
| Atlanta | $ | 947,877 | | | $ | 1,011,807 | |
| Charlotte | 771,121 | | | 443,051 | |
| Nashville | 1,294,178 | | | 1,191,219 | |
| Orlando | 285,781 | | | 289,129 | |
| Pittsburgh | 310,296 | | | 313,783 | |
| Raleigh | 1,269,200 | | | 839,831 | |
| Richmond | 202,488 | | | 240,976 | |
| Tampa | 514,303 | | | 556,951 | |
| Total Office Segment | 5,595,244 | | | 4,886,747 | |
| Other | 99,894 | | | 322,670 | |
| Total Assets | $ | 5,695,138 | | | $ | 5,209,417 | |
18. Subsequent Events
On February 1, 2022, the Company declared a cash dividend of $0.50 per share of Common Stock, which is payable on March 15, 2022 to stockholders of record as of February 21, 2022.
HIGHWOODS PROPERTIES, INC.
HIGHWOODS REALTY LIMITED PARTNERSHIP
NOTE TO SCHEDULE III
(in thousands)
The following table sets forth the activity of real estate assets and accumulated depreciation:
| | | | | | | | | | | | | | | | | |
| December 31, |
| 2021 | | 2020 | | 2019 |
| | | | | |
| Real estate assets: | | | | | |
| Beginning balance | $ | 5,594,833 | | | $ | 5,776,804 | | | $ | 5,296,551 | |
| | | | | |
| Acquisitions, development and improvements | 1,248,256 | | | 259,470 | | | 677,842 | |
| Cost of real estate sold and retired | (356,953) | | | (441,441) | | | (197,589) | |
| Ending balance (a) | $ | 6,486,136 | | | $ | 5,594,833 | | | $ | 5,776,804 | |
| Accumulated depreciation: | | | | | |
| Beginning balance | $ | 1,421,956 | | | $ | 1,405,341 | | | $ | 1,296,562 | |
| Depreciation expense | 218,628 | | | 204,585 | | | 214,682 | |
| Real estate sold and retired | (183,073) | | | (187,970) | | | (105,903) | |
| Ending balance (b) | $ | 1,457,511 | | | $ | 1,421,956 | | | $ | 1,405,341 | |
(a)Reconciliation of total real estate assets to balance sheet caption:
| | | | | | | | | | | | | | | | | |
| 2021 | | 2020 | | 2019 |
| | | | | |
| Total per Schedule III | $ | 6,486,136 | | | $ | 5,594,833 | | | $ | 5,776,804 | |
| Development in-process exclusive of land included in Schedule III | 6,890 | | | 259,681 | | | 172,706 | |
| Real estate assets, net, held for sale | (3,482) | | | (14,850) | | | (34,396) | |
| Total real estate assets | $ | 6,489,544 | | | $ | 5,839,664 | | | $ | 5,915,114 | |
(b)Reconciliation of total accumulated depreciation to balance sheet caption:
| | | | | | | | | | | | | | | | | |
| 2021 | | 2020 | | 2019 |
| | | | | |
| Total per Schedule III | $ | 1,457,511 | | | $ | 1,421,956 | | | $ | 1,405,341 | |
| Real estate assets, net, held for sale | — | | | (3,577) | | | (16,775) | |
| Total accumulated depreciation | $ | 1,457,511 | | | $ | 1,418,379 | | | $ | 1,388,566 | |
HIGHWOODS PROPERTIES, INC.
HIGHWOODS REALTY LIMITED PARTNERSHIP
SCHEDULE III - REAL ESTATE AND ACCUMULATED DEPRECIATION
(in thousands)
December 31, 2021
| | | | | | | | | | | | | | | | | | | | | | | | | | | | | | | | | | | | | | | | | | | | | | | | | | | | | | | | | | | | | | | | | | | | | | | | | | |
| | | | | | Initial Costs | | Costs Capitalized
Subsequent to
Acquisition | | Gross Value at Close of Period | | | | | | Life on
Which
Depreciation
is
Calculated |
| Description | | Property
Type | | 2021
Encumbrance | | Land | | Bldg &
Improv | | Land | | Bldg &
Improv | | Land | | Bldg &
Improv | | Total
Assets (1) | | Accumulated
Depreciation | | Date of
Construction | |
| Atlanta, GA | | | | | | | | | | | | | | | | | | | | | | | | |
| 1700 Century Circle | | Office | | | | $ | — | | | $ | 2,482 | | | $ | 2 | | | $ | 1,431 | | | $ | 2 | | | $ | 3,913 | | | $ | 3,915 | | | $ | 2,110 | | | 1983 | | 5-40 yrs. |
| 1800 Century Boulevard | | Office | | | | 1,444 | | | 29,081 | | | — | | | 6,935 | | | 1,444 | | | 36,016 | | | 37,460 | | | 20,861 | | | 1975 | | 5-40 yrs. |
| 1825 Century Boulevard | | Office | | | | 864 | | | — | | | 303 | | | 15,181 | | | 1,167 | | | 15,181 | | | 16,348 | | | 7,207 | | | 2002 | | 5-40 yrs. |
| 1875 Century Boulevard | | Office | | | | — | | | 8,924 | | | — | | | 8,820 | | | — | | | 17,744 | | | 17,744 | | | 9,491 | | | 1976 | | 5-40 yrs. |
| 1900 Century Boulevard | | Office | | | | — | | | 4,744 | | | — | | | 340 | | | — | | | 5,084 | | | 5,084 | | | 5,084 | | | 1971 | | 5-40 yrs. |
| 2200 Century Parkway | | Office | | | | — | | | 14,432 | | | — | | | 9,012 | | | — | | | 23,444 | | | 23,444 | | | 12,327 | | | 1971 | | 5-40 yrs. |
| 2400 Century Parkway | | Office | | | | — | | | — | | | 406 | | | 14,785 | | | 406 | | | 14,785 | | | 15,191 | | | 8,262 | | | 1998 | | 5-40 yrs. |
| 2500 Century Parkway | | Office | | | | — | | | — | | | 328 | | | 12,824 | | | 328 | | | 12,824 | | | 13,152 | | | 5,035 | | | 2005 | | 5-40 yrs. |
| 2500/2635 Parking Garage | | Office | | | | — | | | — | | | — | | | 6,447 | | | — | | | 6,447 | | | 6,447 | | | 2,594 | | | 2005 | | 5-40 yrs. |
| 2600 Century Parkway | | Office | | | | — | | | 10,679 | | | — | | | 5,694 | | | — | | | 16,373 | | | 16,373 | | | 8,514 | | | 1973 | | 5-40 yrs. |
| 2635 Century Parkway | | Office | | | | — | | | 21,643 | | | — | | | 20,711 | | | — | | | 42,354 | | | 42,354 | | | 20,219 | | | 1980 | | 5-40 yrs. |
| 2800 Century Parkway | | Office | | | | — | | | 20,449 | | | — | | | 11,852 | | | — | | | 32,301 | | | 32,301 | | | 19,130 | | | 1983 | | 5-40 yrs. |
| Century Plaza I | | Office | | | | 1,290 | | | 8,567 | | | — | | | 4,746 | | | 1,290 | | | 13,313 | | | 14,603 | | | 7,206 | | | 1981 | | 5-40 yrs. |
| Century Plaza II | | Office | | | | 1,380 | | | 7,733 | | | — | | | 4,119 | | | 1,380 | | | 11,852 | | | 13,232 | | | 5,904 | | | 1984 | | 5-40 yrs. |
| Riverpoint - Land | | Industrial | | | | 7,250 | | | — | | | (4,649) | | | 718 | | | 2,601 | | | 718 | | | 3,319 | | | 203 | | | N/A | | 5-40 yrs. |
| Riverwood 100 | | Office | | | | 5,785 | | | 64,913 | | | (29) | | | 25,295 | | | 5,756 | | | 90,208 | | | 95,964 | | | 26,300 | | | 1989 | | 5-40 yrs. |
| Tradeport - Land | | Industrial | | | | 5,243 | | | — | | | (4,733) | | | — | | | 510 | | | — | | | 510 | | | — | | | N/A | | N/A |
| Two Alliance Center | | Office | | | | 9,579 | | | 125,549 | | | — | | | 555 | | | 9,579 | | | 126,104 | | | 135,683 | | | 34,023 | | | 2009 | | 5-40 yrs. |
| One Alliance Center | | Office | | | | 14,775 | | | 123,071 | | | — | | | 21,171 | | | 14,775 | | | 144,242 | | | 159,017 | | | 35,121 | | | 2001 | | 5-40 yrs. |
| 10 Glenlake North | | Office | | | | 5,349 | | | 26,334 | | | — | | | 7,754 | | | 5,349 | | | 34,088 | | | 39,437 | | | 8,341 | | | 2000 | | 5-40 yrs. |
| 10 Glenlake South | | Office | | | | 5,103 | | | 22,811 | | | — | | | 5,234 | | | 5,103 | | | 28,045 | | | 33,148 | | | 8,177 | | | 1999 | | 5-40 yrs. |
| Riverwood 200 | | Office | | | | 4,777 | | | 89,708 | | | 450 | | | 2,995 | | | 5,227 | | | 92,703 | | | 97,930 | | | 14,342 | | | 2017 | | 5-40 yrs. |
| Riverwood 300 - Land | | Office | | | | 400 | | | — | | | — | | | 710 | | | 400 | | | 710 | | | 1,110 | | | 87 | | | N/A | | 5-40 yrs. |
| Monarch Tower | | Office | | | | 22,717 | | | 143,068 | | | — | | | 19,398 | | | 22,717 | | | 162,466 | | | 185,183 | | | 30,985 | | | 1997 | | 5-40 yrs. |
| Monarch Plaza | | Office | | | | 27,678 | | | 88,962 | | | — | | | 12,410 | | | 27,678 | | | 101,372 | | | 129,050 | | | 19,148 | | | 1983 | | 5-40 yrs. |
| Galleria 75 - Land | | Office | | | | — | | | — | | | 19,740 | | | — | | | 19,740 | | | — | | | 19,740 | | | — | | | N/A | | N/A |
| Charlotte, NC | | | | | | | | | | | | | | | | | | | | | | | | |
| Bank of America Tower | | Office | | | | 29,273 | | | 354,749 | | | — | | | 21,466 | | | 29,273 | | | 376,215 | | | 405,488 | | | 23,734 | | | 2019 | | 5-40 yrs. |
| Morrocroft | | Office | | 69,421 | | | — | | | — | | | 19,286 | | | 177,199 | | | 19,286 | | | 177,199 | | | 196,485 | | | 2,660 | | | 1992 | | 5-40 yrs. |
| Capitol Towers | | Office | | 130,498 | | | — | | | — | | | 9,202 | | | 102,179 | | | 9,202 | | | 102,179 | | | 111,381 | | | 1,351 | | | 2015 | | 5-40 yrs. |
HIGHWOODS PROPERTIES, INC.
HIGHWOODS REALTY LIMITED PARTNERSHIP
SCHEDULE III - REAL ESTATE AND ACCUMULATED DEPRECIATION (Continued)
| | | | | | | | | | | | | | | | | | | | | | | | | | | | | | | | | | | | | | | | | | | | | | | | | | | | | | | | | | | | | | | | | | | | | | | | | | |
| | | | | | Initial Costs | | Costs Capitalized
Subsequent to
Acquisition | | Gross Value at Close of Period | | | | | | Life on
Which
Depreciation
is
Calculated |
| Description | | Property
Type | | 2021
Encumbrance | | Land | | Bldg &
Improv | | Land | | Bldg &
Improv | | Land | | Bldg &
Improv | | Total
Assets (1) | | Accumulated
Depreciation | | Date of
Construction | |
| Nashville, TN | | | | | | | | | | | | | | | | | | | | | | | | |
| 3322 West End | | Office | | | | 3,025 | | | 27,490 | | | — | | | 12,054 | | | 3,025 | | | 39,544 | | | 42,569 | | | 20,091 | | | 1986 | | 5-40 yrs. |
| 3401 West End | | Office | | | | 5,862 | | | 22,917 | | | — | | | 6,755 | | | 5,862 | | | 29,672 | | | 35,534 | | | 16,937 | | | 1982 | | 5-40 yrs. |
| 5310 Maryland Way | | Office | | | | 1,863 | | | 7,201 | | | — | | | 3,796 | | | 1,863 | | | 10,997 | | | 12,860 | | | 7,051 | | | 1994 | | 5-40 yrs. |
| Cool Springs I & II Deck | | Office | | | | — | | | — | | | — | | | 3,994 | | | — | | | 3,994 | | | 3,994 | | | 1,415 | | | 2007 | | 5-40 yrs. |
| Cool Springs III & IV Deck | | Office | | | | — | | | — | | | — | | | 4,466 | | | — | | | 4,466 | | | 4,466 | | | 1,649 | | | 2007 | | 5-40 yrs. |
| Cool Springs I | | Office | | | | 1,583 | | | — | | | 15 | | | 18,202 | | | 1,598 | | | 18,202 | | | 19,800 | | | 8,279 | | | 1999 | | 5-40 yrs. |
| Cool Springs II | | Office | | | | 1,824 | | | — | | | 346 | | | 23,961 | | | 2,170 | | | 23,961 | | | 26,131 | | | 9,567 | | | 1999 | | 5-40 yrs. |
| Cool Springs III | | Office | | | | 1,631 | | | — | | | 804 | | | 17,091 | | | 2,435 | | | 17,091 | | | 19,526 | | | 6,329 | | | 2006 | | 5-40 yrs. |
| Cool Springs IV | | Office | | | | 1,715 | | | — | | | — | | | 20,234 | | | 1,715 | | | 20,234 | | | 21,949 | | | 6,701 | | | 2008 | | 5-40 yrs. |
| Cool Springs V (Healthways) | | Office | | | | 3,688 | | | — | | | 295 | | | 53,116 | | | 3,983 | | | 53,116 | | | 57,099 | | | 24,867 | | | 2007 | | 5-40 yrs. |
| Harpeth On The Green II | | Office | | | | 1,419 | | | 5,677 | | | — | | | 4,164 | | | 1,419 | | | 9,841 | | | 11,260 | | | 4,870 | | | 1984 | | 5-40 yrs. |
| Harpeth On The Green III | | Office | | | | 1,660 | | | 6,649 | | | — | | | 3,621 | | | 1,660 | | | 10,270 | | | 11,930 | | | 5,195 | | | 1987 | | 5-40 yrs. |
| Harpeth On The Green IV | | Office | | | | 1,713 | | | 6,842 | | | — | | | 3,553 | | | 1,713 | | | 10,395 | | | 12,108 | | | 5,439 | | | 1989 | | 5-40 yrs. |
| Harpeth On The Green V | | Office | | | | 662 | | | — | | | 197 | | | 6,187 | | | 859 | | | 6,187 | | | 7,046 | | | 3,007 | | | 1998 | | 5-40 yrs. |
| Hickory Trace | | Office | | | | 1,164 | | | — | | | 164 | | | 6,335 | | | 1,328 | | | 6,335 | | | 7,663 | | | 2,792 | | | 2001 | | 5-40 yrs. |
| Highwoods Plaza I | | Office | | | | 1,552 | | | — | | | 307 | | | 9,857 | | | 1,859 | | | 9,857 | | | 11,716 | | | 5,431 | | | 1996 | | 5-40 yrs. |
| Highwoods Plaza II | | Office | | | | 1,448 | | | — | | | 307 | | | 10,062 | | | 1,755 | | | 10,062 | | | 11,817 | | | 5,449 | | | 1997 | | 5-40 yrs. |
| Seven Springs I | | Office | | | | 2,076 | | | — | | | 592 | | | 13,612 | | | 2,668 | | | 13,612 | | | 16,280 | | | 6,419 | | | 2002 | | 5-40 yrs. |
| SouthPointe | | Office | | | | 1,655 | | | — | | | 310 | | | 9,410 | | | 1,965 | | | 9,410 | | | 11,375 | | | 4,582 | | | 1998 | | 5-40 yrs. |
| Ramparts | | Office | | | | 2,394 | | | 12,806 | | | — | | | 10,834 | | | 2,394 | | | 23,640 | | | 26,034 | | | 9,660 | | | 1986 | | 5-40 yrs. |
| Westwood South | | Office | | | | 2,106 | | | — | | | 382 | | | 12,337 | | | 2,488 | | | 12,337 | | | 14,825 | | | 6,893 | | | 1999 | | 5-40 yrs. |
| 100 Winners Circle | | Office | | | | 1,497 | | | 7,258 | | | — | | | 2,729 | | | 1,497 | | | 9,987 | | | 11,484 | | | 5,293 | | | 1987 | | 5-40 yrs. |
| The Pinnacle at Symphony Place | | Office | | 91,318 | | | — | | | 141,469 | | | — | | | 6,535 | | | — | | | 148,004 | | | 148,004 | | | 42,086 | | | 2010 | | 5-40 yrs. |
| Seven Springs East (LifePoint) | | Office | | | | 2,525 | | | 37,587 | | | — | | | 281 | | | 2,525 | | | 37,868 | | | 40,393 | | | 9,716 | | | 2013 | | 5-40 yrs. |
| The Shops at Seven Springs | | Office | | | | 803 | | | 8,223 | | | — | | | 404 | | | 803 | | | 8,627 | | | 9,430 | | | 2,855 | | | 2013 | | 5-40 yrs. |
| Seven Springs West | | Office | | | | 2,439 | | | 51,306 | | | — | | | 2,034 | | | 2,439 | | | 53,340 | | | 55,779 | | | 9,777 | | | 2016 | | 5-40 yrs. |
| Seven Springs II | | Office | | | | 2,356 | | | 30,048 | | | — | | | 3,033 | | | 2,356 | | | 33,081 | | | 35,437 | | | 5,376 | | | 2017 | | 5-40 yrs. |
| Bridgestone Tower | | Office | | | | 19,223 | | | 169,582 | | | — | | | 309 | | | 19,223 | | | 169,891 | | | 189,114 | | | 21,278 | | | 2017 | | 5-40 yrs. |
| Virginia Springs II | | Office | | | | 4,821 | | | 26,448 | | | — | | | — | | | 4,821 | | | 26,448 | | | 31,269 | | | 720 | | | 2020 | | 5-40 yrs. |
| MARS Campus | | Office | | | | 7,010 | | | 87,474 | | | — | | | 99 | | | 7,010 | | | 87,573 | | | 94,583 | | | 8,787 | | | 2019 | | 5-40 yrs. |
| 5501 Virginia Way | | Office | | | | 4,534 | | | 25,632 | | | — | | | 274 | | | 4,534 | | | 25,906 | | | 30,440 | | | 2,760 | | | 2018 | | 5-40 yrs. |
| 1100 Broadway - Land | | Office | | | | 29,845 | | | — | | | (200) | | | — | | | 29,645 | | | — | | | 29,645 | | | — | | | N/A | | N/A |
| Asurion | | Office | | | | — | | | — | | | 33,219 | | | 230,569 | | | 33,219 | | | 230,569 | | | 263,788 | | | 2,089 | | | 2021 | | 5-40 yrs. |
| Ovation - Land | | Office | | | | 31,063 | | | — | | | 58,168 | | | — | | | 89,231 | | | — | | | 89,231 | | | — | | | N/A | | N/A |
HIGHWOODS PROPERTIES, INC.
HIGHWOODS REALTY LIMITED PARTNERSHIP
SCHEDULE III - REAL ESTATE AND ACCUMULATED DEPRECIATION (Continued)
| | | | | | | | | | | | | | | | | | | | | | | | | | | | | | | | | | | | | | | | | | | | | | | | | | | | | | | | | | | | | | | | | | | | | | | | | | |
| | | | | | Initial Costs | | Costs Capitalized
Subsequent to
Acquisition | | Gross Value at Close of Period | | | | | | Life on
Which
Depreciation
is
Calculated |
| Description | | Property
Type | | 2021
Encumbrance | | Land | | Bldg &
Improv | | Land | | Bldg &
Improv | | Land | | Bldg &
Improv | | Total
Assets (1) | | Accumulated
Depreciation | | Date of
Construction | |
| Broadway Stem - Land | | Office | | | | 6,218 | | | — | | | — | | | 526 | | | 6,218 | | | 526 | | | 6,744 | | | 4 | | | N/A | | 5-40 yrs. |
| YMCA Site - land | | Office | | | | — | | | — | | | 16,121 | | | — | | | 16,121 | | | — | | | 16,121 | | | — | | | N/A | | N/A |
| Orlando, FL | | | | | | | | | | | | | | | | | | | | | | | | |
| Capital Plaza Three - Land | | Office | | | | 2,994 | | | — | | | 18 | | | — | | | 3,012 | | | — | | | 3,012 | | | — | | | N/A | | N/A |
| The 1800 Eller Drive Building | | Office | | | | — | | | 9,851 | | | — | | | 3,092 | | | — | | | 12,943 | | | 12,943 | | | 8,809 | | | 1983 | | 5-40 yrs. |
| Seaside Plaza | | Office | | | | 3,893 | | | 29,541 | | | — | | | 12,311 | | | 3,893 | | | 41,852 | | | 45,745 | | | 10,684 | | | 1982 | | 5-40 yrs. |
| Capital Plaza Two | | Office | | | | 4,346 | | | 43,394 | | | — | | | 8,482 | | | 4,346 | | | 51,876 | | | 56,222 | | | 12,421 | | | 1999 | | 5-40 yrs. |
| Capital Plaza One | | Office | | | | 3,482 | | | 27,321 | | | — | | | 8,988 | | | 3,482 | | | 36,309 | | | 39,791 | | | 8,932 | | | 1975 | | 5-40 yrs. |
| Landmark Center Two | | Office | | | | 4,743 | | | 22,031 | | | — | | | 9,656 | | | 4,743 | | | 31,687 | | | 36,430 | | | 9,074 | | | 1985 | | 5-40 yrs. |
| Landmark Center One | | Office | | | | 6,207 | | | 22,655 | | | — | | | 10,604 | | | 6,207 | | | 33,259 | | | 39,466 | | | 8,449 | | | 1983 | | 5-40 yrs. |
| 300 South Orange | | Office | | | | 3,490 | | | 56,079 | | | — | | | 7,980 | | | 3,490 | | | 64,059 | | | 67,549 | | | 12,732 | | | 2000 | | 5-40 yrs. |
| Eola Centre | | Office | | | | 5,785 | | | 11,160 | | | — | | | 14,473 | | | 5,785 | | | 25,633 | | | 31,418 | | | 4,301 | | | 1969 | | 5-40 yrs. |
| Pittsburgh, PA | | | | | | | | | | | | | | | | | | | | | | | | |
| One PPG Place | | Office | | | | 9,819 | | | 107,643 | | | — | | | 51,888 | | | 9,819 | | | 159,531 | | | 169,350 | | | 50,381 | | | 1983-1985 | | 5-40 yrs. |
| Two PPG Place | | Office | | | | 2,302 | | | 10,978 | | | — | | | 12,103 | | | 2,302 | | | 23,081 | | | 25,383 | | | 6,258 | | | 1983-1985 | | 5-40 yrs. |
| Three PPG Place | | Office | | | | 501 | | | 2,923 | | | — | | | 4,736 | | | 501 | | | 7,659 | | | 8,160 | | | 3,174 | | | 1983-1985 | | 5-40 yrs. |
| Four PPG Place | | Office | | | | 620 | | | 3,239 | | | — | | | 3,477 | | | 620 | | | 6,716 | | | 7,336 | | | 2,204 | | | 1983-1985 | | 5-40 yrs. |
| Five PPG Place | | Office | | | | 803 | | | 4,924 | | | — | | | 2,577 | | | 803 | | | 7,501 | | | 8,304 | | | 2,171 | | | 1983-1985 | | 5-40 yrs. |
| Six PPG Place | | Office | | | | 3,353 | | | 25,602 | | | — | | | 17,141 | | | 3,353 | | | 42,743 | | | 46,096 | | | 13,387 | | | 1983-1985 | | 5-40 yrs. |
| EQT Plaza | | Office | | | | 16,457 | | | 83,812 | | | — | | | 17,574 | | | 16,457 | | | 101,386 | | | 117,843 | | | 29,851 | | | 1987 | | 5-40 yrs. |
| East Liberty - Land | | Office | | | | 2,478 | | | — | | | — | | | — | | | 2,478 | | | — | | | 2,478 | | | — | | | N/A | | N/A |
| Raleigh, NC | | | | | | | | | | | | | | | | | | | | | | | | |
| 3600 Glenwood Avenue | | Office | | | | — | | | 10,994 | | | — | | | 6,121 | | | — | | | 17,115 | | | 17,115 | | | 9,386 | | | 1986 | | 5-40 yrs. |
| 3737 Glenwood Avenue | | Office | | | | — | | | — | | | 318 | | | 17,213 | | | 318 | | | 17,213 | | | 17,531 | | | 9,183 | | | 1999 | | 5-40 yrs. |
| 4800 North Park | | Office | | | | 2,678 | | | 17,630 | | | — | | | 7,396 | | | 2,678 | | | 25,026 | | | 27,704 | | | 14,800 | | | 1985 | | 5-40 yrs. |
| 5000 North Park | | Office | | | | 1,010 | | | 4,612 | | | (49) | | | 3,231 | | | 961 | | | 7,843 | | | 8,804 | | | 4,394 | | | 1980 | | 5-40 yrs. |
| 801 Raleigh Corporate Center | | Office | | | | 828 | | | — | | | 272 | | | 11,686 | | | 1,100 | | | 11,686 | | | 12,786 | | | 5,135 | | | 2002 | | 5-40 yrs. |
| 2500 Blue Ridge Road | | Office | | | | 722 | | | 4,606 | | | — | | | 1,428 | | | 722 | | | 6,034 | | | 6,756 | | | 4,013 | | | 1982 | | 5-40 yrs. |
| 2418 Blue Ridge Road | | Office | | | | 462 | | | 1,410 | | | — | | | 2,869 | | | 462 | | | 4,279 | | | 4,741 | | | 1,881 | | | 1988 | | 5-40 yrs. |
| 2000 CentreGreen | | Office | | | | 1,529 | | | — | | | (391) | | | 13,299 | | | 1,138 | | | 13,299 | | | 14,437 | | | 5,027 | | | 2000 | | 5-40 yrs. |
| 4000 CentreGreen | | Office | | | | 1,653 | | | — | | | (389) | | | 11,270 | | | 1,264 | | | 11,270 | | | 12,534 | | | 4,959 | | | 2001 | | 5-40 yrs. |
| 5000 CentreGreen | | Office | | | | 1,291 | | | 34,572 | | | — | | | 2,963 | | | 1,291 | | | 37,535 | | | 38,826 | | | 6,789 | | | 2017 | | 5-40 yrs. |
| 3000 CentreGreen | | Office | | | | 1,779 | | | — | | | (397) | | | 14,714 | | | 1,382 | | | 14,714 | | | 16,096 | | | 5,302 | | | 2002 | | 5-40 yrs. |
| 1000 CentreGreen | | Office | | | | 1,280 | | | — | | | 55 | | | 13,969 | | | 1,335 | | | 13,969 | | | 15,304 | | | 4,252 | | | 2008 | | 5-40 yrs. |
| GlenLake - Land | | Office | | | | 13,003 | | | — | | | (12,382) | | | 114 | | | 621 | | | 114 | | | 735 | | | 59 | | | N/A | | 5-40 yrs. |
HIGHWOODS PROPERTIES, INC.
HIGHWOODS REALTY LIMITED PARTNERSHIP
SCHEDULE III - REAL ESTATE AND ACCUMULATED DEPRECIATION (Continued)
| | | | | | | | | | | | | | | | | | | | | | | | | | | | | | | | | | | | | | | | | | | | | | | | | | | | | | | | | | | | | | | | | | | | | | | | | | |
| | | | | | Initial Costs | | Costs Capitalized
Subsequent to
Acquisition | | Gross Value at Close of Period | | | | | | Life on
Which
Depreciation
is
Calculated |
| Description | | Property
Type | | 2021
Encumbrance | | Land | | Bldg &
Improv | | Land | | Bldg &
Improv | | Land | | Bldg &
Improv | | Total
Assets (1) | | Accumulated
Depreciation | | Date of
Construction | |
| GlenLake One | | Office | | | | 924 | | | — | | | 1,324 | | | 23,185 | | | 2,248 | | | 23,185 | | | 25,433 | | | 10,795 | | | 2002 | | 5-40 yrs. |
| GlenLake Four | | Office | | | | 1,659 | | | — | | | 493 | | | 20,527 | | | 2,152 | | | 20,527 | | | 22,679 | | | 7,671 | | | 2006 | | 5-40 yrs. |
| GlenLake Six | | Office | | | | 941 | | | — | | | (365) | | | 20,058 | | | 576 | | | 20,058 | | | 20,634 | | | 6,887 | | | 2008 | | 5-40 yrs. |
| 701 Raleigh Corporate Center | | Office | | | | 1,304 | | | — | | | 540 | | | 18,440 | | | 1,844 | | | 18,440 | | | 20,284 | | | 9,149 | | | 1996 | | 5-40 yrs. |
| Highwoods Centre | | Office | | | | 531 | | | — | | | (267) | | | 8,028 | | | 264 | | | 8,028 | | | 8,292 | | | 4,555 | | | 1998 | | 5-40 yrs. |
| Inveresk Parcel 2 - Land | | Office | | | | 657 | | | — | | | 38 | | | 103 | | | 695 | | | 103 | | | 798 | | | 16 | | | N/A | | 5-40 yrs. |
| 4201 Lake Boone Trail | | Office | | | | 1,450 | | | 6,311 | | | — | | | 916 | | | 1,450 | | | 7,227 | | | 8,677 | | | 2,254 | | | 1998 | | 5-40 yrs. |
| 4620 Creekstone Drive | | Office | | | | 149 | | | — | | | 107 | | | 3,395 | | | 256 | | | 3,395 | | | 3,651 | | | 1,623 | | | 2001 | | 5-40 yrs. |
| 4825 Creekstone Drive | | Office | | | | 398 | | | — | | | 293 | | | 10,670 | | | 691 | | | 10,670 | | | 11,361 | | | 5,653 | | | 1999 | | 5-40 yrs. |
| 751 Corporate Center | | Office | | | | 2,665 | | | 16,939 | | | — | | | (50) | | | 2,665 | | | 16,889 | | | 19,554 | | | 2,564 | | | 2018 | | 5-40 yrs. |
| PNC Plaza | | Office | | | | 1,206 | | | — | | | — | | | 70,872 | | | 1,206 | | | 70,872 | | | 72,078 | | | 27,086 | | | 2008 | | 5-40 yrs. |
| 4301 Lake Boone Trail | | Office | | | | 878 | | | 3,730 | | | — | | | 2,524 | | | 878 | | | 6,254 | | | 7,132 | | | 4,220 | | | 1990 | | 5-40 yrs. |
| 4207 Lake Boone Trail | | Office | | | | 362 | | | 1,818 | | | — | | | 1,448 | | | 362 | | | 3,266 | | | 3,628 | | | 2,299 | | | 1993 | | 5-40 yrs. |
| 2301 Rexwoods Drive | | Office | | | | 919 | | | 2,816 | | | — | | | 1,633 | | | 919 | | | 4,449 | | | 5,368 | | | 2,964 | | | 1992 | | 5-40 yrs. |
| 4325 Lake Boone Trail | | Office | | | | 586 | | | — | | | — | | | 4,842 | | | 586 | | | 4,842 | | | 5,428 | | | 3,050 | | | 1995 | | 5-40 yrs. |
| 2300 Rexwoods Drive | | Office | | | | 1,301 | | | — | | | 184 | | | 8,863 | | | 1,485 | | | 8,863 | | | 10,348 | | | 3,405 | | | 1998 | | 5-40 yrs. |
| 4709 Creekstone Drive | | Office | | | | 469 | | | 4,038 | | | 23 | | | 5,434 | | | 492 | | | 9,472 | | | 9,964 | | | 3,415 | | | 1987 | | 5-40 yrs. |
| 4700 Six Forks Road | | Office | | | | 666 | | | 2,665 | | | — | | | 1,803 | | | 666 | | | 4,468 | | | 5,134 | | | 2,420 | | | 1982 | | 5-40 yrs. |
| 4700 Homewood Court | | Office | | | | 1,086 | | | 4,533 | | | — | | | 1,870 | | | 1,086 | | | 6,403 | | | 7,489 | | | 3,887 | | | 1983 | | 5-40 yrs. |
| 4800 Six Forks Road | | Office | | | | 862 | | | 4,411 | | | — | | | 3,338 | | | 862 | | | 7,749 | | | 8,611 | | | 4,703 | | | 1987 | | 5-40 yrs. |
| 4601 Creekstone Drive | | Office | | | | 255 | | | — | | | 217 | | | 5,771 | | | 472 | | | 5,771 | | | 6,243 | | | 3,334 | | | 1997 | | 5-40 yrs. |
| Weston - Land | | Office | | | | 22,771 | | | — | | | (19,894) | | | — | | | 2,877 | | | — | | | 2,877 | | | — | | | N/A | | N/A |
| 4625 Creekstone Drive | | Office | | | | 458 | | | — | | | 268 | | | 6,016 | | | 726 | | | 6,016 | | | 6,742 | | | 3,632 | | | 1995 | | 5-40 yrs. |
| 11000 Weston Parkway | | Office | | | | 2,651 | | | 18,850 | | | — | | | 14,540 | | | 2,651 | | | 33,390 | | | 36,041 | | | 7,842 | | | 1998 | | 5-40 yrs. |
| GlenLake Five | | Office | | | | 2,263 | | | 30,264 | | | — | | | 3,694 | | | 2,263 | | | 33,958 | | | 36,221 | | | 10,197 | | | 2014 | | 5-40 yrs. |
| 11800 Weston Parkway | | Office | | | | 826 | | | 13,188 | | | — | | | 18 | | | 826 | | | 13,206 | | | 14,032 | | | 3,345 | | | 2014 | | 5-40 yrs. |
| CentreGreen Café | | Office | | | | 41 | | | 3,509 | | | — | | | (2) | | | 41 | | | 3,507 | | | 3,548 | | | 621 | | | 2014 | | 5-40 yrs. |
| CentreGreen Fitness Center | | Office | | | | 27 | | | 2,322 | | | — | | | (1) | | | 27 | | | 2,321 | | | 2,348 | | | 411 | | | 2014 | | 5-40 yrs. |
| One City Plaza | | Office | | | | 11,288 | | | 68,375 | | | — | | | 26,283 | | | 11,288 | | | 94,658 | | | 105,946 | | | 24,562 | | | 1986 | | 5-40 yrs. |
| Edison - Land | | Office | | | | 5,984 | | | — | | | 2,031 | | | — | | | 8,015 | | | — | | | 8,015 | | | — | | | N/A | | N/A |
| Charter Square | | Office | | | | 7,267 | | | 65,881 | | | — | | | 4,464 | | | 7,267 | | | 70,345 | | | 77,612 | | | 11,979 | | | 2015 | | 5-40 yrs. |
| MetLife Global Technology Campus | | Office | | | | 21,580 | | | 149,889 | | | — | | | 41 | | | 21,580 | | | 149,930 | | | 171,510 | | | 24,164 | | | 2015 | | 5-40 yrs. |
| GlenLake Seven | | Office | | | | 1,662 | | | 37,332 | | | — | | | — | | | 1,662 | | | 37,332 | | | 38,994 | | | 1,624 | | | 2020 | | 5-40 yrs. |
| Hargett - Land | | Office | | | | 9,248 | | | — | | | — | | | — | | | 9,248 | | | — | | | 9,248 | | | — | | | N/A | | N/A |
| Forum I | | Office | | | | — | | | — | | | 1,278 | | | 27,809 | | | 1,278 | | | 27,809 | | | 29,087 | | | 1,197 | | | 1985 | | 5-40 yrs. |
HIGHWOODS PROPERTIES, INC.
HIGHWOODS REALTY LIMITED PARTNERSHIP
SCHEDULE III - REAL ESTATE AND ACCUMULATED DEPRECIATION (Continued)
| | | | | | | | | | | | | | | | | | | | | | | | | | | | | | | | | | | | | | | | | | | | | | | | | | | | | | | | | | | | | | | | | | | | | | | | | | |
| | | | | | Initial Costs | | Costs Capitalized
Subsequent to
Acquisition | | Gross Value at Close of Period | | | | | | Life on
Which
Depreciation
is
Calculated |
| Description | | Property
Type | | 2021
Encumbrance | | Land | | Bldg &
Improv | | Land | | Bldg &
Improv | | Land | | Bldg &
Improv | | Total
Assets (1) | | Accumulated
Depreciation | | Date of
Construction | |
| Forum II | | Office | | | | — | | | — | | | 1,327 | | | 18,088 | | | 1,327 | | | 18,088 | | | 19,415 | | | 758 | | | 1988 | | 5-40 yrs. |
| Forum III | | Office | | | | — | | | — | | | 994 | | | 23,931 | | | 994 | | | 23,931 | | | 24,925 | | | 1,001 | | | 1995 | | 5-40 yrs. |
| Forum IV | | Office | | | | — | | | — | | | 2,118 | | | 43,889 | | | 2,118 | | | 43,889 | | | 46,007 | | | 1,590 | | | 2000 | | 5-40 yrs. |
| Forum V | | Office | | | | — | | | — | | | 1,552 | | | 26,263 | | | 1,552 | | | 26,263 | | | 27,815 | | | 1,190 | | | 2007 | | 5-40 yrs. |
| Captrust Tower | | Office | | 84,972 | | | — | | | — | | | 9,670 | | | 124,530 | | | 9,670 | | | 124,530 | | | 134,200 | | | 1,673 | | | 2010 | | 5-40 yrs. |
| 150 Fayetteville | | Office | | 115,731 | | | — | | | — | | | 7,677 | | | 130,049 | | | 7,677 | | | 130,049 | | | 137,726 | | | 2,185 | | | 1991 | | 5-40 yrs. |
| Other Property | | Other | | | | 27,260 | | | 20,868 | | | (13,177) | | | 31,819 | | | 14,083 | | | 52,687 | | | 66,770 | | | 28,878 | | | N/A | | 5-40 yrs. |
| Richmond, VA | | | | | | | | | | | | | | | | | | | | | | | | |
| 4900 Cox Road | | Office | | | | 1,324 | | | 5,311 | | | 15 | | | 3,930 | | | 1,339 | | | 9,241 | | | 10,580 | | | 5,815 | | | 1991 | | 5-40 yrs. |
| Colonnade Building | | Office | | | | 1,364 | | | 6,105 | | | — | | | 2,479 | | | 1,364 | | | 8,584 | | | 9,948 | | | 3,997 | | | 2003 | | 5-40 yrs. |
| Dominion Place - Pitts Parcel - Land | | Office | | | | 1,101 | | | — | | | (465) | | | — | | | 636 | | | — | | | 636 | | | — | | | N/A | | N/A |
| Markel 4521 | | Office | | | | 1,581 | | | 13,299 | | | 168 | | | (397) | | | 1,749 | | | 12,902 | | | 14,651 | | | 6,641 | | | 1999 | | 5-40 yrs. |
| Highwoods Commons | | Office | | | | 521 | | | — | | | 458 | | | 4,581 | | | 979 | | | 4,581 | | | 5,560 | | | 2,342 | | | 1999 | | 5-40 yrs. |
| Highwoods One | | Office | | | | 1,688 | | | — | | | 22 | | | 14,252 | | | 1,710 | | | 14,252 | | | 15,962 | | | 7,762 | | | 1996 | | 5-40 yrs. |
| Highwoods Two | | Office | | | | 786 | | | — | | | 226 | | | 10,483 | | | 1,012 | | | 10,483 | | | 11,495 | | | 4,504 | | | 1997 | | 5-40 yrs. |
| Highwoods Five | | Office | | | | 783 | | | — | | | 11 | | | 8,177 | | | 794 | | | 8,177 | | | 8,971 | | | 4,130 | | | 1998 | | 5-40 yrs. |
| Highwoods Plaza | | Office | | | | 909 | | | — | | | 187 | | | 5,880 | | | 1,096 | | | 5,880 | | | 6,976 | | | 2,885 | | | 2000 | | 5-40 yrs. |
| Innslake Center | | Office | | | | 845 | | | — | | | 125 | | | 7,735 | | | 970 | | | 7,735 | | | 8,705 | | | 3,566 | | | 2001 | | 5-40 yrs. |
| Highwoods Centre | | Office | | | | 1,205 | | | 4,825 | | | — | | | 2,795 | | | 1,205 | | | 7,620 | | | 8,825 | | | 3,789 | | | 1990 | | 5-40 yrs. |
| Markel 4501 | | Office | | | | 1,300 | | | 13,259 | | | 213 | | | (3,295) | | | 1,513 | | | 9,964 | | | 11,477 | | | 4,389 | | | 1998 | | 5-40 yrs. |
| 4600 Cox Road | | Office | | | | 1,700 | | | 17,081 | | | 169 | | | (3,432) | | | 1,869 | | | 13,649 | | | 15,518 | | | 6,007 | | | 1989 | | 5-40 yrs. |
| North Park | | Office | | | | 2,163 | | | 8,659 | | | 6 | | | 3,436 | | | 2,169 | | | 12,095 | | | 14,264 | | | 6,708 | | | 1989 | | 5-40 yrs. |
| North Shore Commons I | | Office | | | | 951 | | | — | | | 137 | | | 12,972 | | | 1,088 | | | 12,972 | | | 14,060 | | | 6,435 | | | 2002 | | 5-40 yrs. |
| North Shore Commons II | | Office | | | | 2,067 | | | — | | | (89) | | | 11,526 | | | 1,978 | | | 11,526 | | | 13,504 | | | 4,036 | | | 2007 | | 5-40 yrs. |
| North Shore Commons C - Land | | Office | | | | 1,497 | | | — | | | 55 | | | 10 | | | 1,552 | | | 10 | | | 1,562 | | | 1 | | | N/A | | N/A |
| North Shore Commons D - Land | | Office | | | | 1,261 | | | — | | | — | | | — | | | 1,261 | | | — | | | 1,261 | | | — | | | N/A | | N/A |
| One Shockoe Plaza | | Office | | | | — | | | — | | | 356 | | | 21,632 | | | 356 | | | 21,632 | | | 21,988 | | | 11,239 | | | 1996 | | 5-40 yrs. |
| Pavilion - Land | | Office | | | | 181 | | | 46 | | | (181) | | | (46) | | | — | | | — | | | — | | | — | | | N/A | | N/A |
| Lake Brook Commons | | Office | | | | 1,600 | | | 8,864 | | | 21 | | | 3,018 | | | 1,621 | | | 11,882 | | | 13,503 | | | 6,082 | | | 1996 | | 5-40 yrs. |
| Sadler & Cox - Land | | Office | | | | 1,535 | | | — | | | 343 | | | — | | | 1,878 | | | — | | | 1,878 | | | — | | | N/A | | N/A |
| Highwoods Three | | Office | | | | 1,918 | | | — | | | 358 | | | 12,337 | | | 2,276 | | | 12,337 | | | 14,613 | | | 4,797 | | | 2005 | | 5-40 yrs. |
| Stony Point I | | Office | | | | 1,384 | | | 11,630 | | | (267) | | | 4,472 | | | 1,117 | | | 16,102 | | | 17,219 | | | 8,937 | | | 1990 | | 5-40 yrs. |
| Stony Point II | | Office | | | | 1,240 | | | — | | | 103 | | | 13,949 | | | 1,343 | | | 13,949 | | | 15,292 | | | 6,983 | | | 1999 | | 5-40 yrs. |
| Stony Point III | | Office | | | | 995 | | | — | | | — | | | 11,166 | | | 995 | | | 11,166 | | | 12,161 | | | 5,785 | | | 2002 | | 5-40 yrs. |
| Stony Point IV | | Office | | | | 955 | | | — | | | — | | | 11,955 | | | 955 | | | 11,955 | | | 12,910 | | | 4,860 | | | 2006 | | 5-40 yrs. |
HIGHWOODS PROPERTIES, INC.
HIGHWOODS REALTY LIMITED PARTNERSHIP
SCHEDULE III - REAL ESTATE AND ACCUMULATED DEPRECIATION (Continued)
| | | | | | | | | | | | | | | | | | | | | | | | | | | | | | | | | | | | | | | | | | | | | | | | | | | | | | | | | | | | | | | | | | | | | | | | | | |
| | | | | | Initial Costs | | Costs Capitalized
Subsequent to
Acquisition | | Gross Value at Close of Period | | | | | | Life on
Which
Depreciation
is
Calculated |
| Description | | Property
Type | | 2021
Encumbrance | | Land | | Bldg &
Improv | | Land | | Bldg &
Improv | | Land | | Bldg &
Improv | | Total
Assets (1) | | Accumulated
Depreciation | | Date of
Construction | |
| Virginia Mutual | | Office | | | | 1,301 | | | 6,036 | | | 15 | | | 2,598 | | | 1,316 | | | 8,634 | | | 9,950 | | | 3,865 | | | 1996 | | 5-40 yrs. |
| Innsbrook Centre | | Office | | | | 914 | | | 8,249 | | | — | | | 896 | | | 914 | | | 9,145 | | | 10,059 | | | 4,279 | | | 1987 | | 5-40 yrs. |
| Elks Pass Lane - Land | | Office | | | | 3,326 | | | — | | | 141 | | | — | | | 3,467 | | | — | | | 3,467 | | | — | | | N/A | | N/A |
| Tampa, FL | | | | | | | | | | | | | | | | | | | | | | | | |
| Meridian Three | | Office | | | | 2,673 | | | 16,470 | | | — | | | 6,510 | | | 2,673 | | | 22,980 | | | 25,653 | | | 8,097 | | | 1989 | | 5-40 yrs. |
| Bayshore Place | | Office | | | | 2,276 | | | 11,817 | | | — | | | 3,575 | | | 2,276 | | | 15,392 | | | 17,668 | | | 7,730 | | | 1990 | | 5-40 yrs. |
| 5525 Gray Street | | Office | | | | 4,054 | | | — | | | 406 | | | 25,163 | | | 4,460 | | | 25,163 | | | 29,623 | | | 9,273 | | | 2005 | | 5-40 yrs. |
| Highwoods Bay Center I | | Office | | | | 3,565 | | | — | | | (64) | | | 38,144 | | | 3,501 | | | 38,144 | | | 41,645 | | | 14,054 | | | 2007 | | 5-40 yrs. |
| Horizon | | Office | | | | — | | | 6,257 | | | — | | | 4,475 | | | — | | | 10,732 | | | 10,732 | | | 5,419 | | | 1980 | | 5-40 yrs. |
| LakePointe One | | Office | | | | 2,106 | | | 89 | | | — | | | 41,965 | | | 2,106 | | | 42,054 | | | 44,160 | | | 24,503 | | | 1986 | | 5-40 yrs. |
| LakePointe Two | | Office | | | | 2,000 | | | 15,848 | | | 672 | | | 15,394 | | | 2,672 | | | 31,242 | | | 33,914 | | | 17,421 | | | 1999 | | 5-40 yrs. |
| Lakeside | | Office | | | | — | | | 7,369 | | | — | | | 7,160 | | | — | | | 14,529 | | | 14,529 | | | 7,722 | | | 1978 | | 5-40 yrs. |
| Lakeside/Parkside Garage | | Office | | | | — | | | — | | | — | | | 5,731 | | | — | | | 5,731 | | | 5,731 | | | 2,702 | | | 2004 | | 5-40 yrs. |
| One Harbour Place | | Office | | | | 2,016 | | | 25,252 | | | — | | | 16,815 | | | 2,016 | | | 42,067 | | | 44,083 | | | 19,922 | | | 1985 | | 5-40 yrs. |
| Parkside | | Office | | | | — | | | 9,407 | | | — | | | 3,417 | | | — | | | 12,824 | | | 12,824 | | | 6,566 | | | 1979 | | 5-40 yrs. |
| Pavilion | | Office | | | | — | | | 16,394 | | | — | | | 5,793 | | | — | | | 22,187 | | | 22,187 | | | 13,108 | | | 1982 | | 5-40 yrs. |
| Pavilion Parking Garage | | Office | | | | — | | | — | | | — | | | 5,911 | | | — | | | 5,911 | | | 5,911 | | | 3,192 | | | 1999 | | 5-40 yrs. |
| Spectrum | | Office | | | | 1,454 | | | 14,502 | | | — | | | 5,112 | | | 1,454 | | | 19,614 | | | 21,068 | | | 10,788 | | | 1984 | | 5-40 yrs. |
| Tower Place | | Office | | | | 3,218 | | | 19,898 | | | — | | | 8,630 | | | 3,218 | | | 28,528 | | | 31,746 | | | 14,728 | | | 1988 | | 5-40 yrs. |
| Westshore Square | | Office | | | | 1,126 | | | 5,186 | | | — | | | 1,738 | | | 1,126 | | | 6,924 | | | 8,050 | | | 3,925 | | | 1976 | | 5-40 yrs. |
| Independence Park - Land | | Office | | | | 4,943 | | | — | | | 5,058 | | | 2,227 | | | 10,001 | | | 2,227 | | | 12,228 | | | 269 | | | N/A | | 5-40 yrs. |
| Independence One | | Office | | | | 2,531 | | | 4,526 | | | — | | | 5,813 | | | 2,531 | | | 10,339 | | | 12,870 | | | 5,718 | | | 1983 | | 5-40 yrs. |
| Meridian One | | Office | | | | 1,849 | | | 22,363 | | | — | | | 3,314 | | | 1,849 | | | 25,677 | | | 27,526 | | | 6,611 | | | 1984 | | 5-40 yrs. |
| Meridian Two | | Office | | | | 1,302 | | | 19,588 | | | — | | | 5,470 | | | 1,302 | | | 25,058 | | | 26,360 | | | 6,826 | | | 1986 | | 5-40 yrs. |
| 5332 Avion Park Drive | | Office | | | | — | | | — | | | 6,310 | | | 39,620 | | | 6,310 | | | 39,620 | | | 45,930 | | | 5,378 | | | 2016 | | 5-40 yrs. |
| Truist Place | | Office | | | | 1,980 | | | 102,138 | | | — | | | 25,702 | | | 1,980 | | | 127,840 | | | 129,820 | | | 24,605 | | | 1992 | | 5-40 yrs. |
| Truist Place - Land | | Office | | | | 2,225 | | | — | | | — | | | — | | | 2,225 | | | — | | | 2,225 | | | — | | | N/A | | N/A |
| Midtown | | Office | | | | — | | | — | | | 16,543 | | | 34,818 | | | 16,543 | | | 34,818 | | | 51,361 | | | 533 | | | 2021 | | 5-40 yrs. |
| | | | | | $ | 602,096 | | | $ | 3,235,692 | | | $ | 165,871 | | | $ | 2,482,477 | | | $ | 767,967 | | | $ | 5,718,169 | | | $ | 6,486,136 | | | $ | 1,457,511 | | | | | |
__________
(1)The cost basis for income tax purposes of aggregate land and buildings and tenant improvements as of December 31, 2021 is $6.0 billion.
SIGNATURES
Pursuant to the requirements of Section 13 or 15(d) of the Securities Exchange Act of 1934, the Registrant has duly caused this report to be signed on its behalf by the undersigned, thereunto duly authorized, in the City of Raleigh, State of North Carolina, on February 8, 2022.
| | | | | |
Highwoods Properties, Inc.
|
| By: | /s/ Theodore J. Klinck |
| | Theodore J. Klinck |
| | President and Chief Executive Officer |
Pursuant to the requirements of the Securities Exchange Act of 1934, this report has been signed below by the following persons on behalf of the Registrant and in the capacity and on the dates indicated.
| | | | | | | | | | | | | | |
| Signature | | Title | | Date |
| | | | | |
| /s/ Carlos E. Evans | | Chairman of the Board of Directors | | February 8, 2022 |
| Carlos E. Evans | | | | |
| | | | |
| /s/ Theodore J. Klinck | | President, Chief Executive Officer and Director | | February 8, 2022 |
| Theodore J. Klinck | | | | |
| | | | | |
| /s/ Charles A. Anderson | | Director | | February 8, 2022 |
| Charles A. Anderson | | | | |
| | | | | |
| /s/ Gene H. Anderson | | Director | | February 8, 2022 |
| Gene H. Anderson | | | | |
| | | | |
| /s/ Thomas P. Anderson | | Director | | February 8, 2022 |
| Thomas P. Anderson | | | | |
| | | | |
| /s/ David L. Gadis | | Director | | February 8, 2022 |
| David L. Gadis | | | | |
| | | | |
| /s/ David J. Hartzell | | Director | | February 8, 2022 |
| David J. Hartzell | | | | |
| | | | | |
| /s/ Sherry A. Kellett | | Director | | February 8, 2022 |
| Sherry A. Kellett | | | | |
| | | | |
| /s/ Anne H. Lloyd | | Director | | February 8, 2022 |
| Anne H. Lloyd | | | | |
| | | | | |
| /s/ Brendan C. Maiorana | | Executive Vice President and Chief Financial Officer | | February 8, 2022 |
| Brendan C. Maiorana | | | | |
| | | | | |
| /s/ Daniel L. Clemmens | | Vice President and Chief Accounting Officer | | February 8, 2022 |
| Daniel L. Clemmens | | | | |
SIGNATURES
Pursuant to the requirements of Section 13 or 15(d) of the Securities Exchange Act of 1934, the Registrant has duly caused this report to be signed on its behalf by the undersigned, thereunto duly authorized, in the City of Raleigh, State of North Carolina, on February 8, 2022.
| | | | | |
Highwoods Realty Limited Partnership
|
| By: | Highwoods Properties, Inc., its sole general partner |
| By: | /s/ Theodore J. Klinck |
| | Theodore J. Klinck
|
| | President and Chief Executive Officer |
Pursuant to the requirements of the Securities Exchange Act of 1934, this report has been signed below by the following persons on behalf of the Registrant and in the capacity and on the dates indicated.
| | | | | | | | | | | | | | |
| Signature | | Title | | Date |
| | | | | |
| /s/ Carlos E. Evans | | Chairman of the Board of Directors of the General Partner | | February 8, 2022 |
| Carlos E. Evans | | | | |
| | | | | |
| /s/ Theodore J. Klinck | | President, Chief Executive Officer and Director of the General Partner | | February 8, 2022 |
| Theodore J. Klinck | | | | |
| | | | |
| /s/ Charles A. Anderson | | Director of the General Partner | | February 8, 2022 |
| Charles A. Anderson | | | | |
| | | | | |
| /s/ Gene H. Anderson | | Director of the General Partner | | February 8, 2022 |
| Gene H. Anderson | | | | |
| | | | |
| /s/ Thomas P. Anderson | | Director of the General Partner | | February 8, 2022 |
| Thomas P. Anderson | | | | |
| | | | |
| /s/ David L. Gadis | | Director of the General Partner | | February 8, 2022 |
| David L. Gadis | | | | |
| | | | |
| /s/ David J. Hartzell | | Director of the General Partner | | February 8, 2022 |
| David J. Hartzell | | | | |
| | | | | |
| /s/ Sherry A. Kellett | | Director of the General Partner | | February 8, 2022 |
| Sherry A. Kellett | | | | |
| | | | | |
| /s/ Anne H. Lloyd | | Director of the General Partner | | February 8, 2022 |
| Anne H. Lloyd | | | | |
| | | | |
| /s/ Brendan C. Maiorana | | Executive Vice President and Chief Financial Officer of the General Partner | | February 8, 2022 |
| Brendan C. Maiorana | | | | |
| | | | | |
| /s/ Daniel L. Clemmens | | Vice President and Chief Accounting Officer of the General Partner | | February 8, 2022 |
| Daniel L. Clemmens | | | | |